miami downtown development authority residential closings and occupancy study march 2010
DESCRIPTION
Miami Downtown Development Authority Residential Closings and Occupancy Study March 2010TRANSCRIPT
Residential Closings and Occupancy Study:
March 2010 Update
Downtown Development Authority District and Adjacent Areas of Influence
Prepared for:
MARCH 2010
A Professional Strategic Alliance
Craig A. Werley, [email protected]
305.441-6438
Lewis M. Goodkin, CRE,FRICS,MIRM [email protected] 305.860.0771
Closings and Occupancy Study, March 2010 Update – Miami DDA
TABLE OF CONTENTS
I. EXECUTIVE SUMMARY ..................................................................................................................................... 2
SCOPE OF STUDY .................................................................................................................................................... 2 METHODOLOGY ..................................................................................................................................................... 2 MAJOR FINDINGS ................................................................................................................................................... 4
II. CLOSING DATA AND ANALYSIS ...................................................................................................................... 6
III. OCCUPANCY STATUS AND PROFILE ........................................................................................................... 11
IV. DOWNTOWN MIAMI AREA RESIDENTIAL MARKET TRENDS ............................................................. 13
RESIDENTIAL LEASING VELOCITY AND RENTAL RATE TRENDS ............................................................ 13 RESIDENTIAL SALES VELOCITY ....................................................................................................................... 13
V. CONCLUSIONS AND OUTLOOK ......................................................................................................................... 16
APPENDIX ...................................................................................................................................................................... 18
LIST OF EXHIBITS EXHIBIT I.1 STUDY AREA MAP ................................................................................................................................ 3 EXHIBIT I.2 NEW CONDOMINIUM SALES AND OCCUPANCY TREND ............................................................ 4 EXHIBIT II.1 PROJECT COMPOSITION – INVENTORY AND STUDY SCOPE .................................................... 6 EXHIBIT II.2 CLOSED (SOLD) VS. UNSOLD INVENTORY IN COMPLETED NEW BUILDINGS ..................... 7 EXHIBIT II.3 UNIT CLOSING STATUS BY YEAR OF BUILDING COMPLETION .............................................. 7 EXHIBIT II.4 COMPLETED NEW CONDOMINIUMS BY SUB-AREA ................................................................... 8 EXHIBIT II.5 TOTAL VS. CLOSED NEW CONDOMINIUMS BY SUBAREA ........................................................ 8 EXHIBIT II.6 DISTRIBUTION OF BUILT/UNSOLD INVENTORY ......................................................................... 9 EXHIBIT II.7 UNITS UNDER CONSTRUCTION BY SUBAREA-2009 COMPLETIONS ....................................... 9 EXHIBIT II.8 AVERAGE UNIT SALES PRICES – NEW CONDOMINIUMS ........................................................ 10 EXHIBIT II.9 AVERAGE SALES PRICE PER SQUARE FOOT – NEW CONDOMINIUMS ................................ 10 EXHIBIT III.1 OCCUPANCY STATUS – NEW CONDOMINIUMS AND RENTAL BUILDINGS ....................... 11 EXHIBIT III.2 OWNER-RENTER OCCUPANT MIX IN NEW CONDOMINIUM BUILDINGS ........................... 12 EXHIBIT III.3 OCCUPIED VS. UNITS SOLD (CLOSED) BY SUBAREA .............................................................. 12 EXHIBIT IV.1 CONDOMINIUM SALES AND LEASING TRENDS ....................................................................... 13 EXHIBIT IV.2 AVERAGE RENTAL RATE TRENDS .............................................................................................. 14 EXHIBIT IV.3 MONTHLY CONDOMINIUM SALES TREND ................................................................................ 14 EXHIBIT IV.4 MONTHLY CONDOMINIUM SALES PROFILE ............................................................................. 15 APPENDIX 1 – BUILDING LIST ................................................................................................................................ 19
Closings and Occupancy Study, March 2010 Update – Miami DDA 2
I. EXECUTIVE SUMMARY This report is an update of the Residential Closings and Occupancy Study published in June 2009, commissioned by the City of Miami Downtown Development Authority (DDA). The original study and this update present independent professional research and analysis prepared by the Goodkin Consulting - Focus Real Estate Advisors, LLC Strategic Alliance (Goodkin/Focus). This section presents a summary of key findings and trends supported by data and analyses presented in the report.
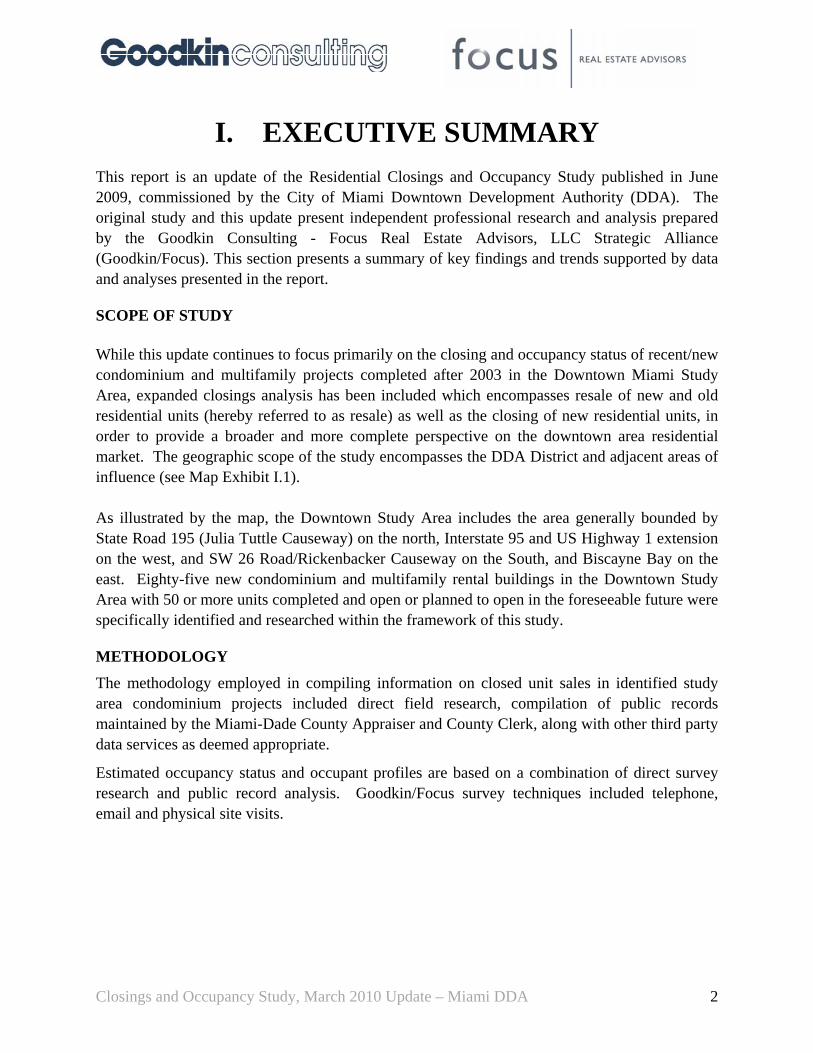
SCOPE OF STUDY While this update continues to focus primarily on the closing and occupancy status of recent/new condominium and multifamily projects completed after 2003 in the Downtown Miami Study Area, expanded closings analysis has been included which encompasses resale of new and old residential units (hereby referred to as resale) as well as the closing of new residential units, in order to provide a broader and more complete perspective on the downtown area residential market. The geographic scope of the study encompasses the DDA District and adjacent areas of influence (see Map Exhibit I.1). As illustrated by the map, the Downtown Study Area includes the area generally bounded by State Road 195 (Julia Tuttle Causeway) on the north, Interstate 95 and US Highway 1 extension on the west, and SW 26 Road/Rickenbacker Causeway on the South, and Biscayne Bay on the east. Eighty-five new condominium and multifamily rental buildings in the Downtown Study Area with 50 or more units completed and open or planned to open in the foreseeable future were specifically identified and researched within the framework of this study.
METHODOLOGY
The methodology employed in compiling information on closed unit sales in identified study area condominium projects included direct field research, compilation of public records maintained by the Miami-Dade County Appraiser and County Clerk, along with other third party data services as deemed appropriate.
Estimated occupancy status and occupant profiles are based on a combination of direct survey research and public record analysis. Goodkin/Focus survey techniques included telephone, email and physical site visits.
Closings and Occupancy Study, March 2010 Update – Miami DDA 3
STUDY AREA
EXHIBIT I.1 STUDY AREA MAP
Closings and Occupancy Study, March 2010 Update – Miami DDA 4
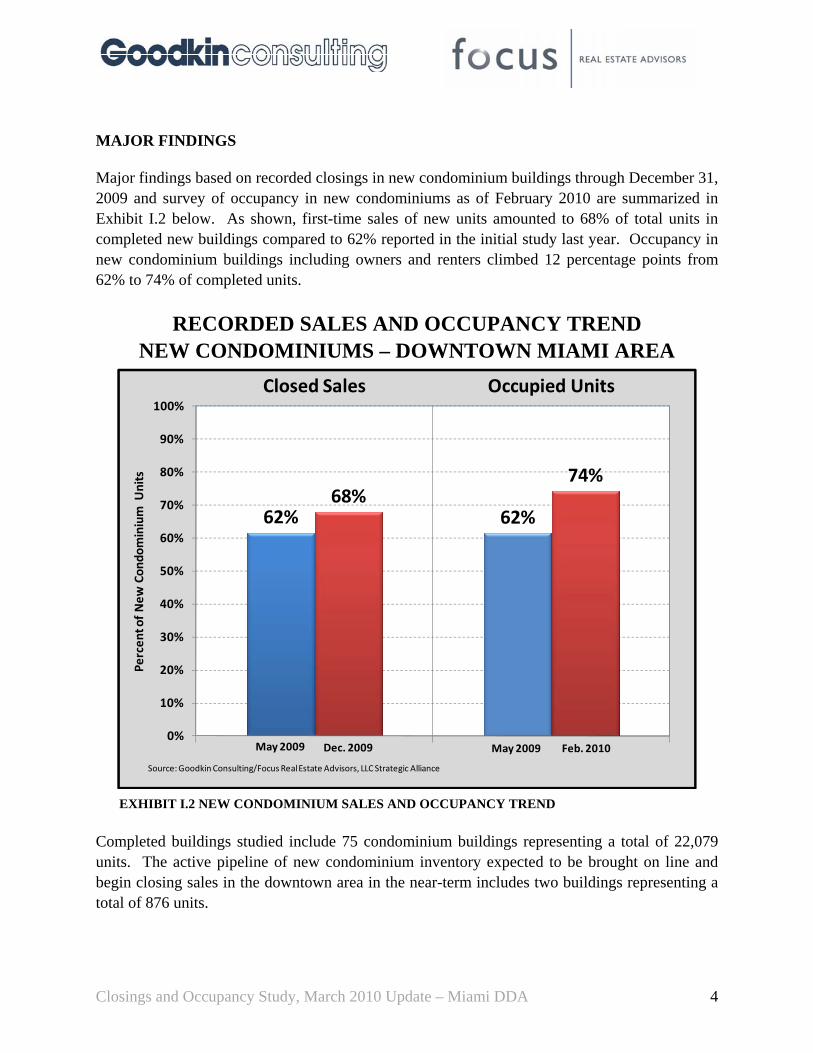
MAJOR FINDINGS Major findings based on recorded closings in new condominium buildings through December 31, 2009 and survey of occupancy in new condominiums as of February 2010 are summarized in Exhibit I.2 below. As shown, first-time sales of new units amounted to 68% of total units in completed new buildings compared to 62% reported in the initial study last year. Occupancy in new condominium buildings including owners and renters climbed 12 percentage points from 62% to 74% of completed units.
RECORDED SALES AND OCCUPANCY TREND NEW CONDOMINIUMS – DOWNTOWN MIAMI AREA
EXHIBIT I.2 NEW CONDOMINIUM SALES AND OCCUPANCY TREND Completed buildings studied include 75 condominium buildings representing a total of 22,079 units. The active pipeline of new condominium inventory expected to be brought on line and begin closing sales in the downtown area in the near-term includes two buildings representing a total of 876 units.
62% 62%68%
74%
0%
10%
20%
30%
40%
50%
60%
70%
80%
90%
100%Closed Sales Occupied Units
Percen
t of New
Con
dominium U
nits
Source: Goodkin Consulting/Focus Real Estate Advisors, LLC Strategic Alliance
May2009 May2009Dec. 2009 Feb. 2010
Closings and Occupancy Study, March 2010 Update – Miami DDA 5
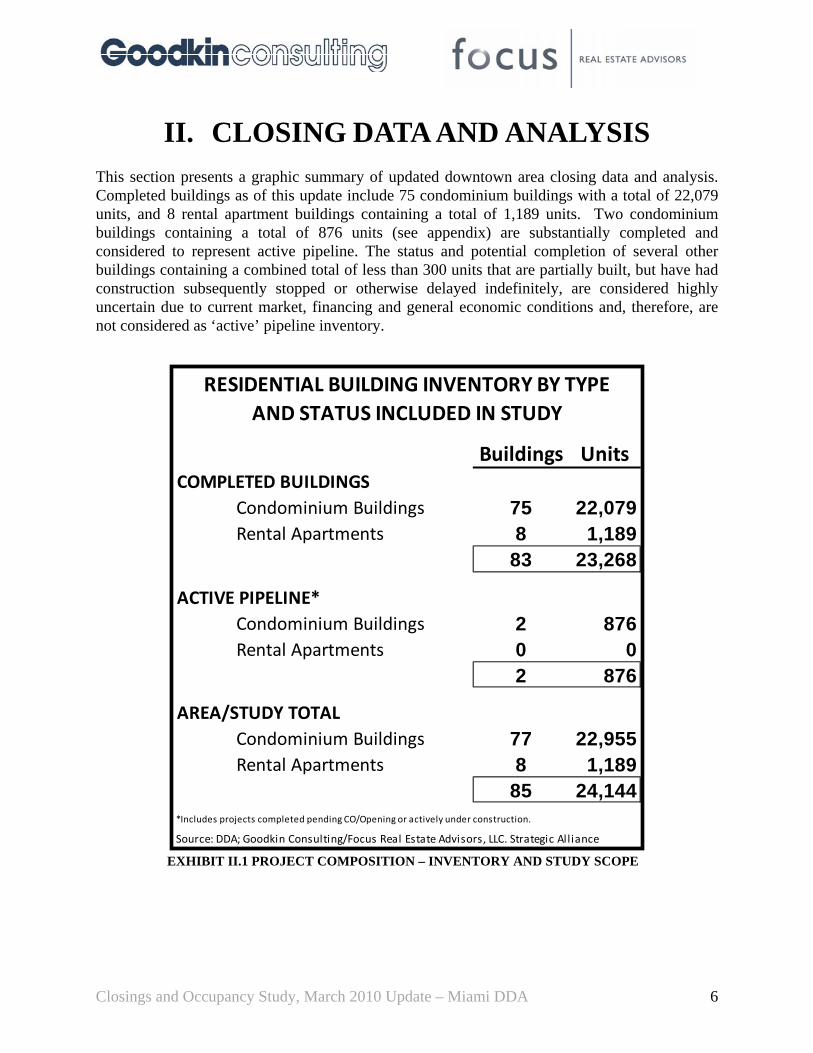
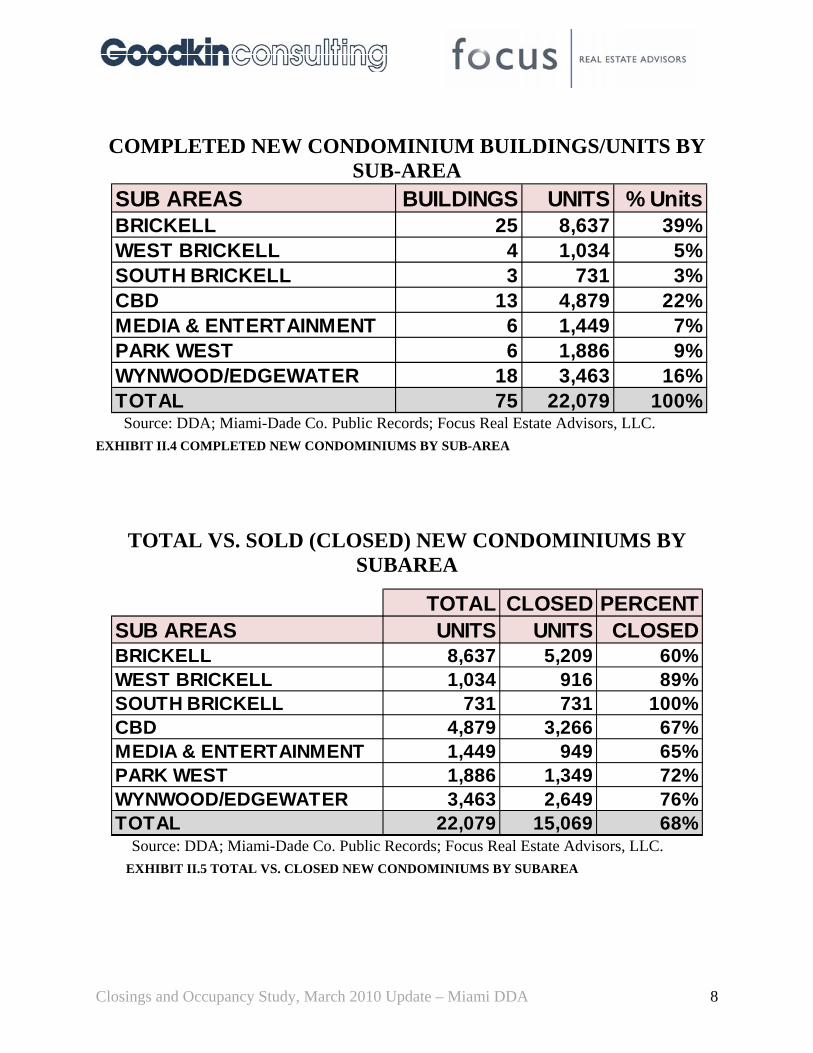
MAJOR FINDINGS (Continued) The Brickell area accounts for the largest concentration of new condominium buildings/units in the downtown study area, representing about 10,400 units and nearly 50% of all new residential condominium units in the study area. The next largest sub-markets within the downtown study area are the Central Business District (CBD) with 22% of the total completed inventory in the downtown study area and the Wynwood/Edgewater area representing 16% of the downtown total. Closed sales recorded in new downtown area condominiums through December 2009 were over 15,000 units or about 68% of the 22,079 total residential condominium units in the 75 completed condominium buildings included in this market update.
• Analysis of closed units by year of building completion shows that approximately 98% of units in buildings completed through 2006 have been sold. Approximately 81% of units completed in 2007 have been closed while about 43% of units completed in 2008 and 2009 have been closed to date.
• Approximately 64% of total sales or on average about 150 sales per month were in new buildings in 2009.
• Average monthly residential leasing velocity in the downtown area during the past twelve months averaged 345 units per month.
• Renters account for approximately 52% of occupied units in completed condominiums, down from 53% estimated in the May 2009 survey.
• Average monthly residential sales in the Downtown Miami Area during the fourth quarter of 2009 reached over 350 units, a 200%+ increase over total sales volume during the same period in 2008.
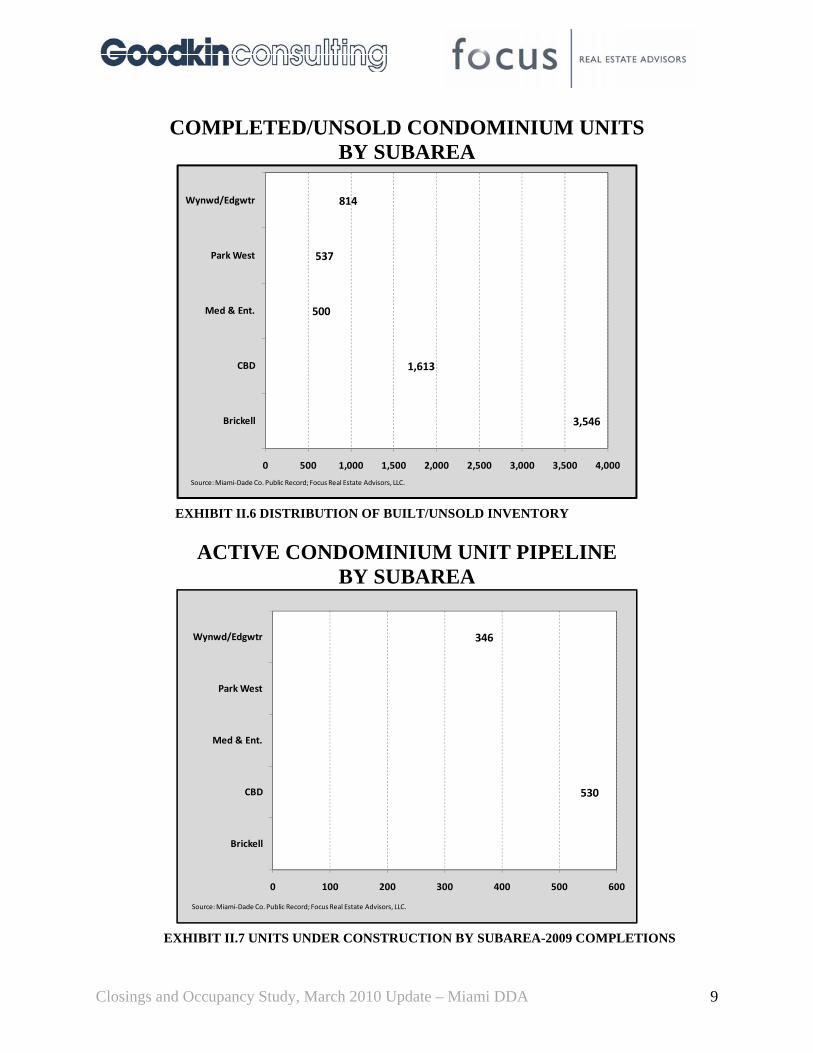
• A combined total of 876 units, located in two projects in the CBD and Wynwood/Edgewater areas, constitute the active pipeline of new condominiums expected to begin closing in the near future.
• The unsold inventory of units in new or recently completed condominium buildings in the downtown area amounts to just over 7,000 units down from over 8,000 seven months earlier.
• Of the 7,010 unsold units in new and recently completed condominiums included in this study, over 3,500 (51%) are located in the Brickell area, approximately 1,600 (23%) are in the CBD, with the balance of downtown area new condominium inventory being fairly evenly distributed among the remaining sub-areas.
Closings and Occupancy Study, March 2010 Update – Miami DDA 6
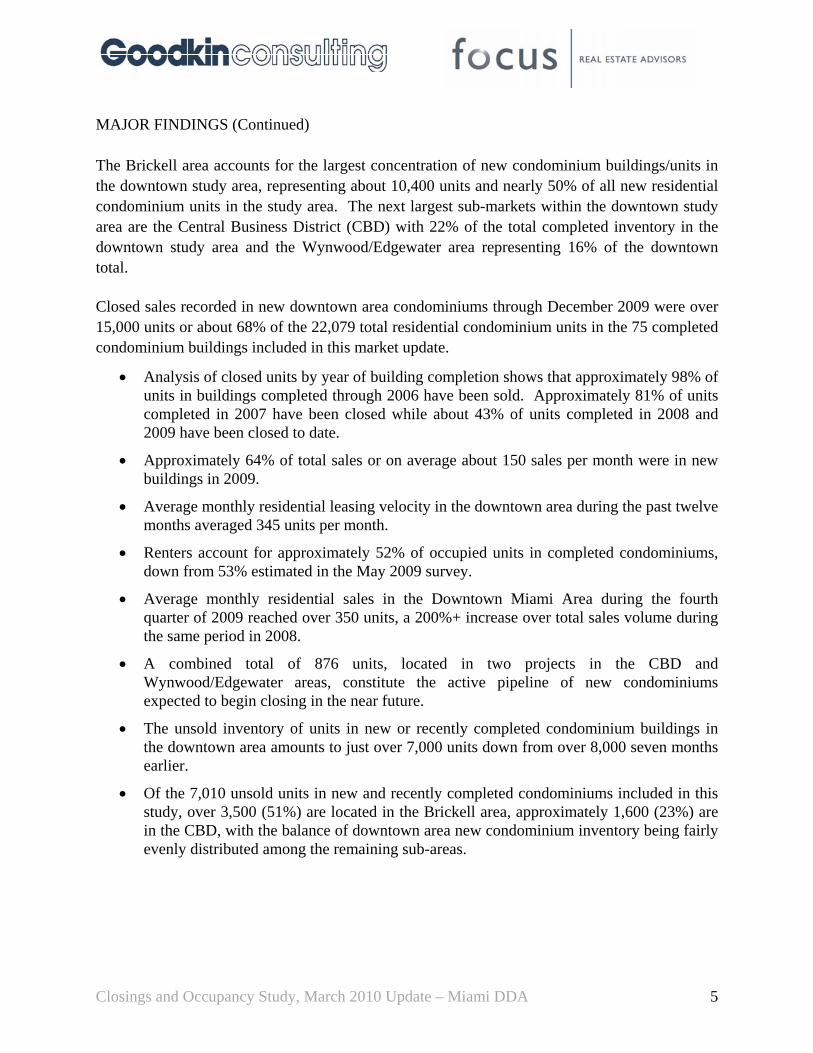
II. CLOSING DATA AND ANALYSIS This section presents a graphic summary of updated downtown area closing data and analysis. Completed buildings as of this update include 75 condominium buildings with a total of 22,079 units, and 8 rental apartment buildings containing a total of 1,189 units. Two condominium buildings containing a total of 876 units (see appendix) are substantially completed and considered to represent active pipeline. The status and potential completion of several other buildings containing a combined total of less than 300 units that are partially built, but have had construction subsequently stopped or otherwise delayed indefinitely, are considered highly uncertain due to current market, financing and general economic conditions and, therefore, are not considered as ‘active’ pipeline inventory.
EXHIBIT II.1 PROJECT COMPOSITION – INVENTORY AND STUDY SCOPE
Buildings UnitsCOMPLETED BUILDINGS
Condominium Buildings 75 22,079Rental Apartments 8 1,189
83 23,268
ACTIVE PIPELINE*Condominium Buildings 2 876Rental Apartments 0 0
2 876
AREA/STUDY TOTALCondominium Buildings 77 22,955Rental Apartments 8 1,189
85 24,144*Includes projects completed pending CO/Opening or actively under construction.
Source: DDA; Goodkin Consulting/Focus Real Estate Advisors, LLC. Strategic Alliance
RESIDENTIAL BUILDING INVENTORY BY TYPEAND STATUS INCLUDED IN STUDY
Closings and Occupancy Study, March 2010 Update – Miami DDA 7
CONDO UNIT SALES STATUS -SOLD (CLOSED)/UNSOLD COMPLETED NEW CONDOMINIUM BUILDINGS
CLOSED15,06968%
UNSOLD7,01032%
Source: Miami‐Dade Co. Public Record; Focus Real Estate Advisors, LLC.
EXHIBIT II.2 CLOSED (SOLD) VS. UNSOLD INVENTORY IN COMPLETED NEW BUILDINGS
TOTAL UNITS AND CLOSED UNIT SALES BY YEAR OF BUILDING COMPLETION
EXHIBIT II.3 UNIT CLOSING STATUS BY YEAR OF BUILDING COMPLETION NOTE: Opening dates for selected buildings were revised for consistency to reflect date of initial closing resulting in minor shifts in yearly totals from the original study.
554
2,2721,950
2,210
4,500
10,287
306551
2,2681,911 2,115
3,627
4,583
140
2,000
4,000
6,000
8,000
10,000
12,000
<2004 2004 2005 2006 2007 2008 2009
Units by Year of B
uilding Co
mpletion
New Units Completed
Units Closed to Date by Year Completed
Source: Miami‐Dade Co. Public Record; Goodkin Consulting/Focus Real Estate Advisors, LLC Strategic Alliance.
44.6%
81.1%
95.7%98.0%99.8%
4.6%
99.5%
TOTAL 22,079
Closings and Occupancy Study, March 2010 Update – Miami DDA 8
COMPLETED NEW CONDOMINIUM BUILDINGS/UNITS BY
SUB-AREA
Source: DDA; Miami-Dade Co. Public Records; Focus Real Estate Advisors, LLC. EXHIBIT II.4 COMPLETED NEW CONDOMINIUMS BY SUB-AREA
TOTAL VS. SOLD (CLOSED) NEW CONDOMINIUMS BY SUBAREA
Source: DDA; Miami-Dade Co. Public Records; Focus Real Estate Advisors, LLC. EXHIBIT II.5 TOTAL VS. CLOSED NEW CONDOMINIUMS BY SUBAREA
TOTAL CLOSED PERCENTSUB AREAS UNITS UNITS CLOSEDBRICKELL 8,637 5,209 60%WEST BRICKELL 1,034 916 89%SOUTH BRICKELL 731 731 100%CBD 4,879 3,266 67%MEDIA & ENTERTAINMENT 1,449 949 65%PARK WEST 1,886 1,349 72%WYNWOOD/EDGEWATER 3,463 2,649 76%TOTAL 22,079 15,069 68%
SUB AREAS BUILDINGS UNITS % UnitsBRICKELL 25 8,637 39%WEST BRICKELL 4 1,034 5%SOUTH BRICKELL 3 731 3%CBD 13 4,879 22%MEDIA & ENTERTAINMENT 6 1,449 7%PARK WEST 6 1,886 9%WYNWOOD/EDGEWATER 18 3,463 16%TOTAL 75 22,079 100%
Closings and Occupancy Study, March 2010 Update – Miami DDA 9
COMPLETED/UNSOLD CONDOMINIUM UNITS BY SUBAREA
EXHIBIT II.6 DISTRIBUTION OF BUILT/UNSOLD INVENTORY
ACTIVE CONDOMINIUM UNIT PIPELINE BY SUBAREA
EXHIBIT II.7 UNITS UNDER CONSTRUCTION BY SUBAREA-2009 COMPLETIONS
3,546
1,613
500
537
814
0 500 1,000 1,500 2,000 2,500 3,000 3,500 4,000
Brickell
CBD
Med & Ent.
Park West
Wynwd/Edgwtr
Source: Miami‐Dade Co. Public Record; Focus Real Estate Advisors, LLC.
530
346
0 100 200 300 400 500 600
Brickell
CBD
Med & Ent.
Park West
Wynwd/Edgwtr
Source: Miami‐Dade Co. Public Record; Focus Real Estate Advisors, LLC.

Closings and Occupancy Study, March 2010 Update – Miami DDA 10
AVERAGE UNIT PRICE BY SUBAREA – NEW CONDOMINIUM CLOSED SALES Q4-2009
EXHIBIT II.8 AVERAGE UNIT SALES PRICES – NEW CONDOMINIUMS
AVERAGE PRICE PER SQ.FT. BY SUBAREA – NEW CONDOMINIUM CLOSED SALES Q4-2009
EXHIBIT II.9 AVERAGE SALES PRICE PER SQUARE FOOT – NEW CONDOMINIUMS
$383,562
$269,793
$118,740
$260,784
$197,786
$300,306
$0
$50,000
$100,000
$150,000
$200,000
$250,000
$300,000
$350,000
$400,000
$450,000
BRICKELL CBD ME PW W/E ALL AREAS
Unit S
ales Price
Source:Miami‐Dade Co. Public Record; Focus Real estate Advisors, LLC.
$334
$264
$135
$247$233
$287
$0
$50
$100
$150
$200
$250
$300
$350
$400
BRICKELL CBD ME PW W/E ALL AREAS
Sales P
rice per Squ
are Foot
Source:Miami‐Dade Co. Public Record; Focus Real estate Advisors, LLC.
Closings and Occupancy Study, March 2010 Update – Miami DDA 11
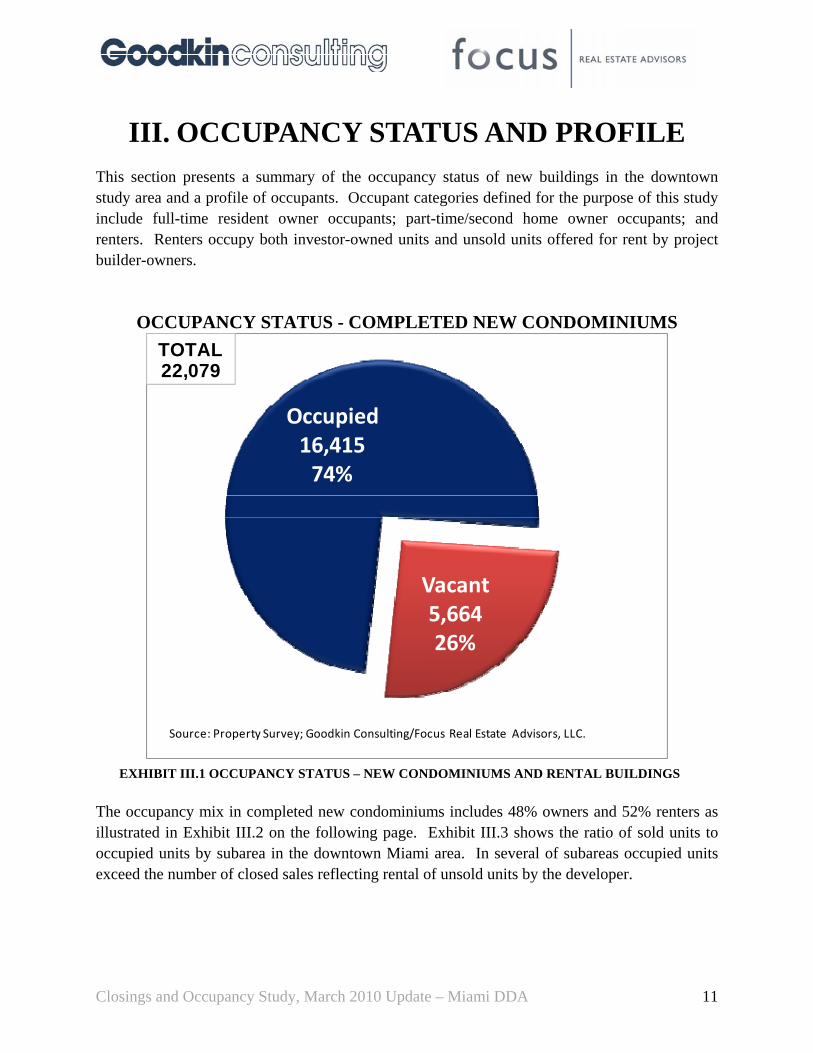
III. OCCUPANCY STATUS AND PROFILE This section presents a summary of the occupancy status of new buildings in the downtown study area and a profile of occupants. Occupant categories defined for the purpose of this study include full-time resident owner occupants; part-time/second home owner occupants; and renters. Renters occupy both investor-owned units and unsold units offered for rent by project builder-owners.
OCCUPANCY STATUS - COMPLETED NEW CONDOMINIUMS
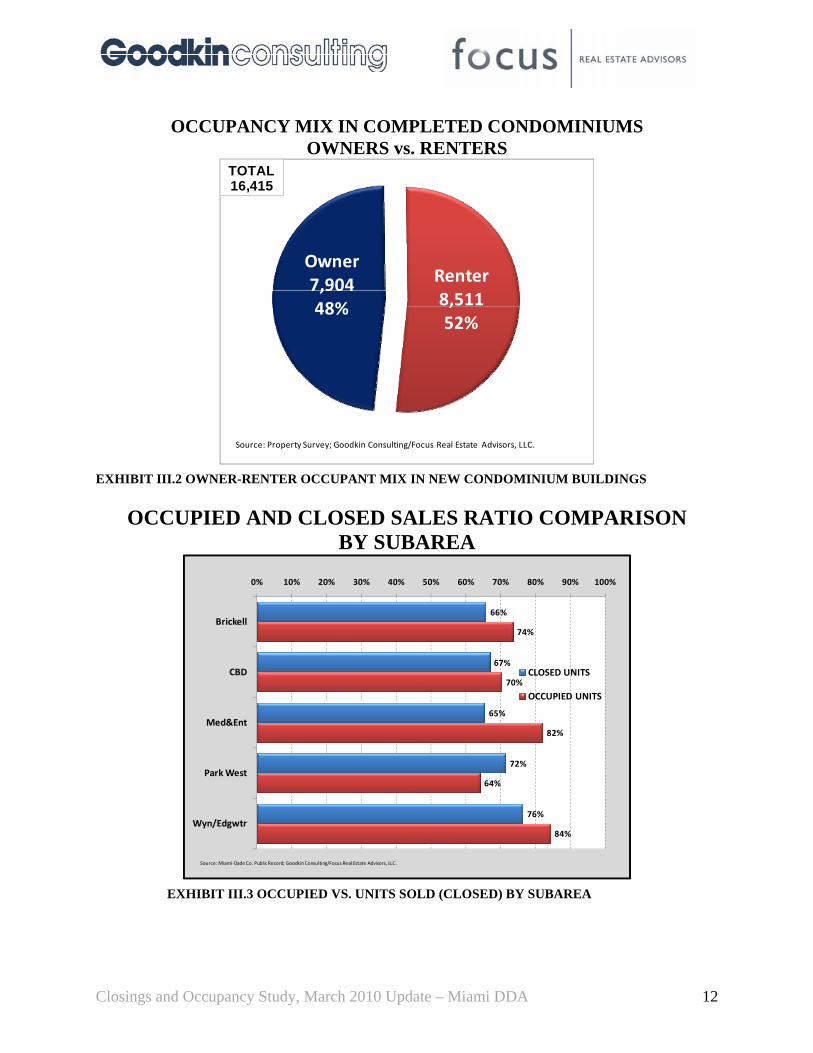
EXHIBIT III.1 OCCUPANCY STATUS – NEW CONDOMINIUMS AND RENTAL BUILDINGS The occupancy mix in completed new condominiums includes 48% owners and 52% renters as illustrated in Exhibit III.2 on the following page. Exhibit III.3 shows the ratio of sold units to occupied units by subarea in the downtown Miami area. In several of subareas occupied units exceed the number of closed sales reflecting rental of unsold units by the developer.
Occupied16,41574%
Vacant 5,664 26%
Source: Property Survey; Goodkin Consulting/Focus Real Estate Advisors, LLC.
TOTAL22,079
Closings and Occupancy Study, March 2010 Update – Miami DDA 12
OCCUPANCY MIX IN COMPLETED CONDOMINIUMS OWNERS vs. RENTERS
EXHIBIT III.2 OWNER-RENTER OCCUPANT MIX IN NEW CONDOMINIUM BUILDINGS
OCCUPIED AND CLOSED SALES RATIO COMPARISON BY SUBAREA
EXHIBIT III.3 OCCUPIED VS. UNITS SOLD (CLOSED) BY SUBAREA
Owner 7,904 48%
Renter 8,511 52%
Source: Property Survey; Goodkin Consulting/Focus Real Estate Advisors, LLC.
TOTAL16,415
66%
67%
65%
72%
76%
74%
70%
82%
64%
84%
0% 10% 20% 30% 40% 50% 60% 70% 80% 90% 100%
Brickell
CBD
Med&Ent
Park West
Wyn/Edgwtr
CLOSED UNITS
OCCUPIED UNITS
Source: Miami‐Dade Co. Public Record; Goodkin Consulting/Focus Real Estate Advisors, LLC.
Closings and Occupancy Study, March 2010 Update – Miami DDA 13
IV. DOWNTOWN MIAMI AREA RESIDENTIAL MARKET TRENDS
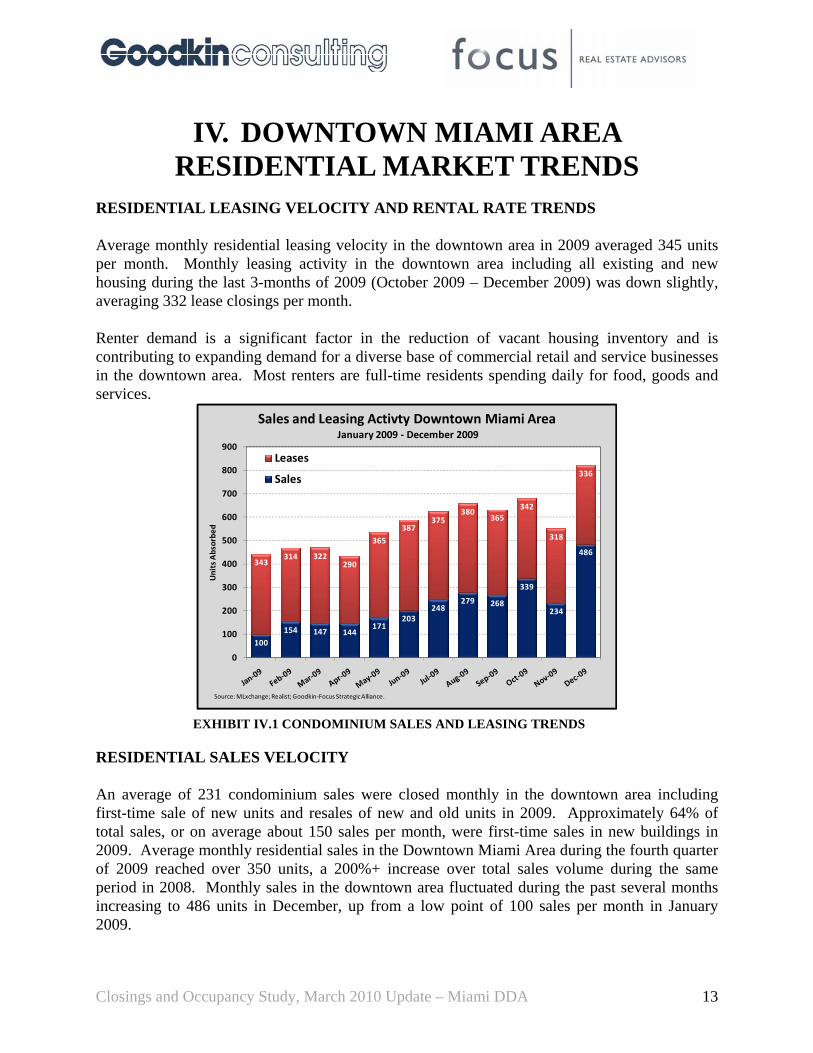
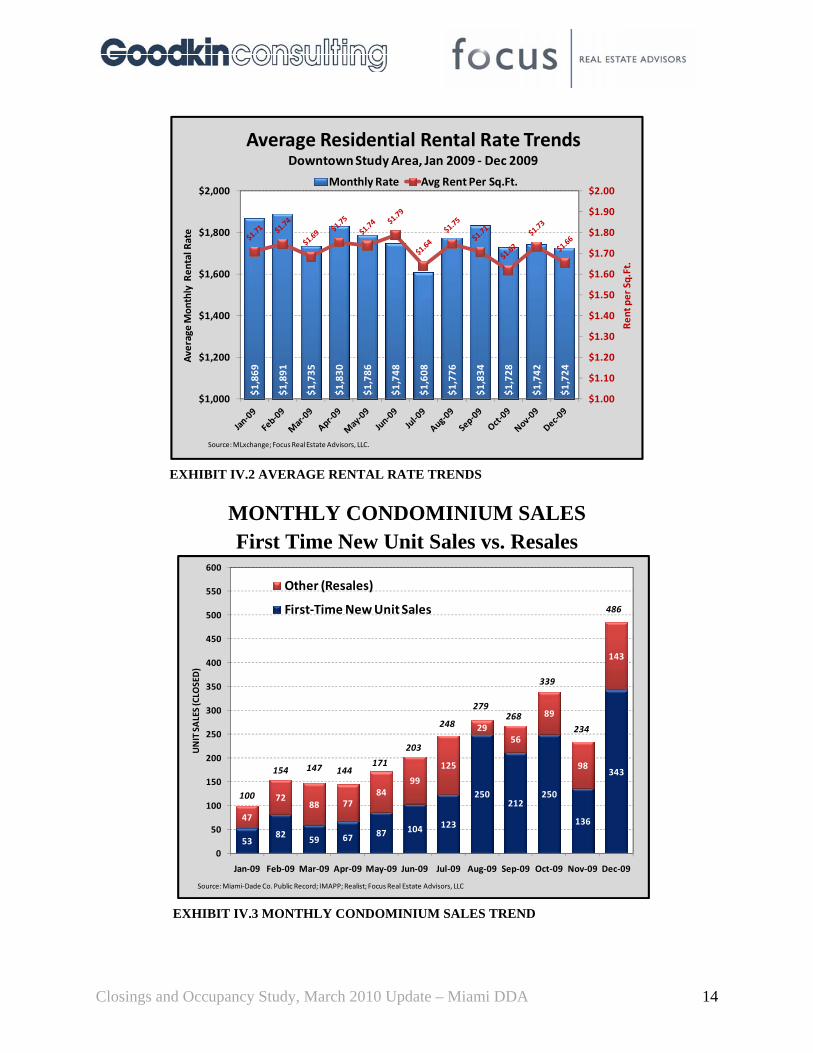
RESIDENTIAL LEASING VELOCITY AND RENTAL RATE TRENDS Average monthly residential leasing velocity in the downtown area in 2009 averaged 345 units per month. Monthly leasing activity in the downtown area including all existing and new housing during the last 3-months of 2009 (October 2009 – December 2009) was down slightly, averaging 332 lease closings per month. Renter demand is a significant factor in the reduction of vacant housing inventory and is contributing to expanding demand for a diverse base of commercial retail and service businesses in the downtown area. Most renters are full-time residents spending daily for food, goods and services.
EXHIBIT IV.1 CONDOMINIUM SALES AND LEASING TRENDS
RESIDENTIAL SALES VELOCITY An average of 231 condominium sales were closed monthly in the downtown area including first-time sale of new units and resales of new and old units in 2009. Approximately 64% of total sales, or on average about 150 sales per month, were first-time sales in new buildings in 2009. Average monthly residential sales in the Downtown Miami Area during the fourth quarter of 2009 reached over 350 units, a 200%+ increase over total sales volume during the same period in 2008. Monthly sales in the downtown area fluctuated during the past several months increasing to 486 units in December, up from a low point of 100 sales per month in January 2009.
100
154 147 144171
203248
279 268
339
234
486343
314 322290
365
387375
380365
342
318
336
0
100
200
300
400
500
600
700
800
900
Units Absorbe
d
Sales and Leasing Activty Downtown Miami AreaJanuary 2009 ‐ December 2009
Leases
Sales
Source: MLxchange;Realist; Goodkin‐Focus Strategic Alliance.
Closings and Occupancy Study, March 2010 Update – Miami DDA 14
EXHIBIT IV.2 AVERAGE RENTAL RATE TRENDS
MONTHLY CONDOMINIUM SALES
First Time New Unit Sales vs. Resales
EXHIBIT IV.3 MONTHLY CONDOMINIUM SALES TREND
5382 59 67 87 104 123
250212
250
136
343
47
7288 77
8499
125
2956
89
98
143
100
154 147 144171
203
248
279268
339
234
486
0
50
100
150
200
250
300
350
400
450
500
550
600
Jan‐09 Feb‐09 Mar‐09 Apr‐09 May‐09 Jun‐09 Jul‐09 Aug‐09 Sep‐09 Oct‐09 Nov‐09 Dec‐09
UNIT SALES (CLO
SED)
Other (Resales)
First‐Time New Unit Sales
Source:Miami‐Dade Co. Public Record; IMAPP; Realist; Focus Real Estate Advisors, LLC
$1,869
$1,891
$1,735
$1,830
$1,786
$1,748
$1,608
$1,776
$1,834
$1,728
$1,742
$1,724
$1.00
$1.10
$1.20
$1.30
$1.40
$1.50
$1.60
$1.70
$1.80
$1.90
$2.00
$1,000
$1,200
$1,400
$1,600
$1,800
$2,000
Rent per Sq.Ft.
Average Mon
thly Ren
tal R
ate
Average Residential Rental Rate TrendsDowntown Study Area, Jan 2009 ‐ Dec 2009
Monthly Rate Avg Rent Per Sq.Ft.
Source: MLxchange; Focus Real Estate Advisors, LLC.

Closings and Occupancy Study, March 2010 Update – Miami DDA 15
EXHIBIT IV.4 MONTHLY CONDOMINIUM SALES PROFILE
Monthly Sales ProfileUnits Total Sales TotalSold Volume ($) Sq.Ft. Unit Price $/SqFT
Jan‐09 100 $27,836,605 112,268 $278,366 $239
Feb‐09 154 $44,156,204 166,052 $286,729 $259
Mar‐09 147 $46,953,512 161,176 $319,412 $272
Apr‐09 144 $48,995,843 177,443 $340,249 $255
May‐09 171 $54,897,916 203,936 $331,139 $272
Jun‐09 203 $58,972,233 228,911 $290,504 $243
Jul‐09 248 $63,460,150 271,825 $255,888 $236
Aug‐09 279 $83,465,733 312,142 $299,160 $256
Sep‐09 268 $83,532,567 299,516 $311,689 $279
Oct‐09 339 $98,294,072 362,471 $289,953 $271
Nov‐09 234 $79,260,145 263,779 $338,719 $300
Dec‐09 486 $152,556,872 530,811 $313,903 $287
Total 2,773 $842,381,852 3,090,330 $303,780 $273
Downtown Study Area Residential Sales Update and Profile, Jan 2009 ‐ Dec 2009
Average
Closings and Occupancy Study, March 2010 Update – Miami DDA 16
V. CONCLUSIONS AND OUTLOOK
The number of unoccupied new condominiums in the downtown area has been reduced by over 2,600 units since the original study in 2009. Movement of new households to the downtown area is creating a younger, more diverse downtown population in addition to fueling demand for retail, services and restaurants that makes downtown Miami one of the few improving retail submarkets in the U.S. A number of factors continue to distinguish downtown Miami from most other U.S. urban centers and certain beneficial implications on the future viability and economic health of the downtown area such as:
o The City and downtown area’s established image and function as an international banking, business and commerce center.
o The City and downtown area’s major natural and proximate resort amenities attracting domestic and International visitors.
o Expanded housing capacity and affordability including owner as well as rental housing alternatives.
o Condominium inventory and discounted trading prices will continue to enhance the attractiveness and affordability of the urban lifestyle in the downtown area.
Inventory Absorption/Occupancy Outlook – If the absorption rate of vacant condominium units evidenced since the original study in 2009 continues, the vacant inventory would effectively be eliminated over the next 25-months. However, sustaining that rate of household movement into the downtown area will be subject to economic recovery and the prospects for a more stable employment situation and new job creation all of which remain highly uncertain at this time.
The recovery of the downtown residential market in terms of stabilization and condominium price appreciation will extend well beyond the period of time during which the vacant inventory is occupied. This assessment is based on two factors. First, a high percentage of sales are investment purchases as opposed to end-users, so the effective inventory of for-sale units will remain abnormally high and maintain downward pressure on prices beyond the first-time sales period. Second, current rental rates only marginally offset ownership expense in most new condominium buildings and thus occupancy does not translate into economic viability of these buildings or recovery of development, construction and operation costs. Based on the pace of first-time sales of new units, sales absorption of remaining unsold inventory could extend out about four years with potential for stabilization of prices sometime beyond that point. The substantial overhang in new condominium product is increasingly being brought to market as rental stock. The volume of this inventory is also generating a highly competitive rental market which translates into greater affordability for thousands of people employed in the downtown Miami area. This combination of greater choice and affordability will, in our opinion continue to generate substantial household growth as supported by the Goodkin/Focus Population & Demographics Report in November 2009. The fact that the DDA area now offers so many shopping, hotels, dining and entertainment/cultural venues that did not exist prior to the Miami condominium bubble , further
Closings and Occupancy Study, March 2010 Update – Miami DDA 17
enhances the strength of the primary market. A growing population in the downtown area also represents an expanding workforce for new and existing businesses occupying downtown area office space. Demand for office space from new residents includes-executive office space for affluent seasonal residents who wish to have an office with professional support services as well as increased demand for personal and professional services that will represent incremental demand for office space e.g. accounting, legal, medical, grooming ,home design. Additionally, new retailers and food and beverage operations often take office space in addition to the actual retail and restaurant space. Also, the DDA area receives strong support from off-shore demand for condominium product which supplements local primary demand more than any downtown area in the US. The expansion of the upper middle class throughout Latin America has contributed mightily to Miami housing demand and has been a key factor in demand for new and resale condominium product in the DDA area since the condominium bubble burst. This increase in high income foreign national households is also an important component of DDA area food and beverage sales; retail sales and personal services. The bottom line is that while the state of the Miami condominium market is causing hardship for many developers and lenders, the abundance of good rental and for-sale housing ‘values’ will continue to attract local, national and international demand to the downtown area and provide greater support to the business community for goods and services.

Closings and Occupancy Study, March 2010 Update – Miami DDA 18
APPENDIX

Closings and Occupancy Study, March 2010 Update – Miami DDA 19
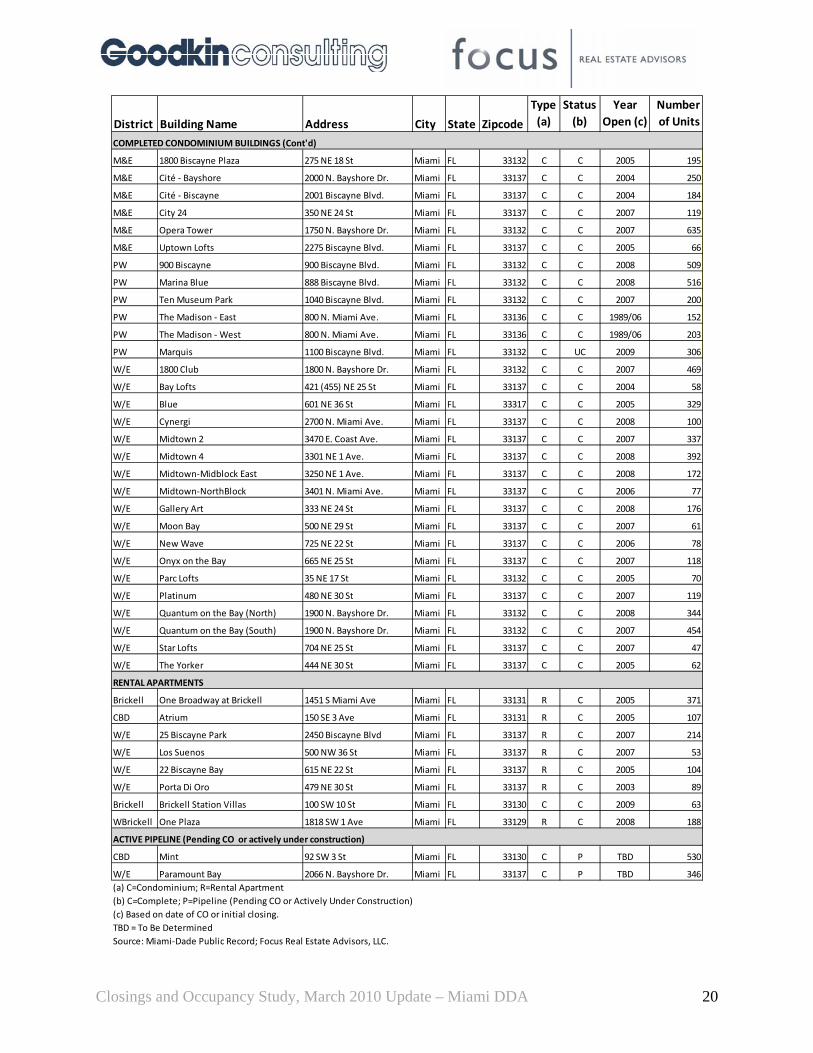
BUILDINGS INCLUDED IN STUDY APPENDIX 1 – BUILDING LIST
District Building Name Address City State Zipcode
Type (a)
Status (b)
Year Open (c)
Number of Units
COMPLETED CONDOMINIUM BUILDINGS
Brickell 1060 Brickell ‐ Twr 1 1060 Brickell Ave. Miami FL 33131 C C 2008 314
Brickell 1060 Brickell ‐ Twr 2 1050 Brickell Ave. Miami FL 33131 C C 2008 262
Brickell 500 Brickell‐East 500 Brickell Ave. Miami FL 33131 C C 2008 320
Brickell 500 Brickell‐West 500 Brickell Ave. Miami FL 33131 C C 2008 313
Brickell Asia 900 Brickell Key Blvd. Miami FL 33131 C C 2008 123
Brickell Axis at Brickell Village‐North 1101 SW 1 Ave. Miami FL 33130 C C 2008 366
Brickell Axis at Brickell Village‐South 79 SW 12 St. Miami FL 33130 C C 2008 352
Brickell Brickell on The River North 31 SE 5 St. Miami FL 33131 C C 2006 384
Brickell Brickell on The River South 41 SE 5 St. Miami FL 33131 C C 2007 327
Brickell Icon Brickell ‐ North 495 & 501 Brickell Ave. Miami FL 33131 C C 2008 714
Brickell Icon Brickell ‐ South 495 & 501 Brickell Ave. Miami FL 33131 C C 2008 561
Brickell Icon Brickell ‐ Viceroy 495 & 501 Brickell Ave. Miami FL 33131 C C 2008 522
Brickell Infinity at Brickell 60 SW 13 St. Miami FL 33130 C C 2008 459
Brickell Isola Island Residences 770 Claughton Island Dr. Miami FL 33131 C C 2005 300
Brickell Jade Residences 1331 Brickell Bay Dr. Miami FL 33131 C C 2004 338
Brickell Mayfield 1395 Brickell Ave. Miami FL 33131 C C 2004 116
Brickell Millenium Twr 1425 Brickell Ave. Miami FL 33131 C C 2003 183
Brickell Solaris Brickell Bay 186 SE 12 Ter. Miami FL 33131 C C 2006 137
Brickell The Carbonell 901 Brickell Key Blvd. Miami FL 33131 C C 2005 284
Brickell The Club at Brickell Bay Plaza 1200 Brickell Bay Dr. Miami FL 33131 C C 2004 643
Brickell The Emerald at Brickell 218 SE 14 St. Miami FL 33131 C C 2006 142
Brickell The Plaza on Brickell ‐ West 951 Brickell Ave. Miami FL 33131 C C 2008 440
Brickell The Plaza on Brickell ‐ North 950 Brickell Bay Dr. Miami FL 33131 C C 2008 560
Brickell The Sail 170 SE 14 St. Miami FL 33131 C C 2006 154
Brickell Vue at Brickell 1250 S. Miami Ave. Miami FL 33130 C C 2004 323
SBrickell Santa Maria Condo 1643 Brickell Ave Miami FL 33129 C C 1997 173
SBrickell Skyline on Brickell 2101 Brickell Ave Miami FL 33129 C C 2004 360
SBrickell The Metropolitan 2475 Brickell Ave Miami FL 33129 C C 2001 198
WBrickell Latitude on The River 615 SW 2 Ave. Miami FL 33130 C C 2007 452
WBrickell Neo Vertika 690 W 1 Ct. Miami FL 33130 C C 2006 443
WBrickell Park View Towers 115 SW 11 St Miami FL 33130 C C 2007 50
WBrickell Brickell View West 1723 SW 2 Ave Miami FL 33129 C C 2007 89
CBD 50 Biscayne 50 N. Biscayne Blvd. Miami FL 33132 C C 2007 528
CBD Capital Lofts at The Security Bldg 117 NE 1 Ave. Miami FL 33132 C C 2008 57
CBD Epic West 250 Biscayne Blvd. Way Miami FL 33131 C C 2008 342
CBD Everglades on The Bay ‐ North 244 Biscayne Blvd. Miami FL 33132 C C 2008 408
CBD Everglades on The Bay ‐ South 253 NE 2nd St. Miami FL 33132 C C 2008 440
CBD Flagler First Condominiums 101 E. Flagler St. Miami FL 33131 C C 2008 91
CBD MET Miami ‐ 1 200 SE 2 St Miami FL 33131 C C 2008 447
CBD One Miami‐East 335 S. Biscayne Blvd. Miami FL 33131 C C 2005 451
CBD One Miami‐West 325 S. Biscayne Blvd. Miami FL 33131 C C 2006 440
CBD The Ivy 93 SW 3 St Miami FL 33131 C C 2008 498
CBD The Loft 234 NE 3 St Miami FL 33132 C C 2005 193
CBD The Loft 2 133 NE 2 Ave Miami FL 33131 C C 2007 495
CBD Wind by Neo 350 S. Miami Ave. Miami FL 33130 C C 2008 489
Closings and Occupancy Study, March 2010 Update – Miami DDA 20
District Building Name Address City State Zipcode
Type (a)
Status (b)
Year Open (c)
Number of Units
COMPLETED CONDOMINIUM BUILDINGS (Cont'd)
M&E 1800 Biscayne Plaza 275 NE 18 St Miami FL 33132 C C 2005 195
M&E Cité ‐ Bayshore 2000 N. Bayshore Dr. Miami FL 33137 C C 2004 250
M&E Cité ‐ Biscayne 2001 Biscayne Blvd. Miami FL 33137 C C 2004 184
M&E City 24 350 NE 24 St Miami FL 33137 C C 2007 119
M&E Opera Tower 1750 N. Bayshore Dr. Miami FL 33132 C C 2007 635
M&E Uptown Lofts 2275 Biscayne Blvd. Miami FL 33137 C C 2005 66
PW 900 Biscayne 900 Biscayne Blvd. Miami FL 33132 C C 2008 509
PW Marina Blue 888 Biscayne Blvd. Miami FL 33132 C C 2008 516
PW Ten Museum Park 1040 Biscayne Blvd. Miami FL 33132 C C 2007 200
PW The Madison ‐ East 800 N. Miami Ave. Miami FL 33136 C C 1989/06 152
PW The Madison ‐ West 800 N. Miami Ave. Miami FL 33136 C C 1989/06 203
PW Marquis 1100 Biscayne Blvd. Miami FL 33132 C UC 2009 306
W/E 1800 Club 1800 N. Bayshore Dr. Miami FL 33132 C C 2007 469
W/E Bay Lofts 421 (455) NE 25 St Miami FL 33137 C C 2004 58
W/E Blue 601 NE 36 St Miami FL 33317 C C 2005 329
W/E Cynergi 2700 N. Miami Ave. Miami FL 33137 C C 2008 100
W/E Midtown 2 3470 E. Coast Ave. Miami FL 33137 C C 2007 337
W/E Midtown 4 3301 NE 1 Ave. Miami FL 33137 C C 2008 392
W/E Midtown‐Midblock East 3250 NE 1 Ave. Miami FL 33137 C C 2008 172
W/E Midtown‐NorthBlock 3401 N. Miami Ave. Miami FL 33137 C C 2006 77
W/E Gallery Art 333 NE 24 St Miami FL 33137 C C 2008 176
W/E Moon Bay 500 NE 29 St Miami FL 33137 C C 2007 61
W/E New Wave 725 NE 22 St Miami FL 33137 C C 2006 78
W/E Onyx on the Bay 665 NE 25 St Miami FL 33137 C C 2007 118
W/E Parc Lofts 35 NE 17 St Miami FL 33132 C C 2005 70
W/E Platinum 480 NE 30 St Miami FL 33137 C C 2007 119
W/E Quantum on the Bay (North) 1900 N. Bayshore Dr. Miami FL 33132 C C 2008 344
W/E Quantum on the Bay (South) 1900 N. Bayshore Dr. Miami FL 33132 C C 2007 454
W/E Star Lofts 704 NE 25 St Miami FL 33137 C C 2007 47
W/E The Yorker 444 NE 30 St Miami FL 33137 C C 2005 62
RENTAL APARTMENTS
Brickell One Broadway at Brickell 1451 S Miami Ave Miami FL 33131 R C 2005 371
CBD Atrium 150 SE 3 Ave Miami FL 33131 R C 2005 107
W/E 25 Biscayne Park 2450 Biscayne Blvd Miami FL 33137 R C 2007 214
W/E Los Suenos 500 NW 36 St Miami FL 33137 R C 2007 53
W/E 22 Biscayne Bay 615 NE 22 St Miami FL 33137 R C 2005 104
W/E Porta Di Oro 479 NE 30 St Miami FL 33137 R C 2003 89
Brickell Brickell Station Villas 100 SW 10 St Miami FL 33130 C C 2009 63
WBrickell One Plaza 1818 SW 1 Ave Miami FL 33129 R C 2008 188
ACTIVE PIPELINE (Pending CO or actively under construction)
CBD Mint 92 SW 3 St Miami FL 33130 C P TBD 530
W/E Paramount Bay 2066 N. Bayshore Dr. Miami FL 33137 C P TBD 346(a) C=Condominium; R=Rental Apartment(b) C=Complete; P=Pipeline (Pending CO or Actively Under Construction)(c) Based on date of CO or initial closing.TBD = To Be DeterminedSource: Miami‐Dade Public Record; Focus Real Estate Advisors, LLC.
Closings and Occupancy Study, March 2010 Update – Miami DDA 21
CONDITIONS FOR REAL ESTATE MARKET ANALYSIS STUDIES The following Standard Conditions apply to real estate consulting engagements performed by Goodkin/Focus Strategic Alliance (Goodkin/Focus). Reports may contain estimates of future sales/rental activity (e.g., absorption rates, sales values/rents, etc.) or other events that represent the consultant's view of reasonable expectations at a particular point in time, but such activities or events are not offered as predictions or as assurances that absorption levels will be achieved, that events will occur, or that indicated prices/rents will be offered or accepted. Actual results achieved during the period covered by our analyses will vary from those described in our report, and the variations may be material. Information furnished by others is presumed to be reliable, and unless specified in the report to the contrary, has not been verified; no responsibility, whether legal or otherwise, is assumed for its accuracy, and it cannot be guaranteed as being certain. No single item of information will be completely relied upon to the exclusion of other information. Goodkin/Focus does not, as part of its engagement, perform an audit, review, examination or appraisal (as defined by the AICPA) of any historical or prospective financial information used, and therefore does not express any opinion with regard to same. The report and conclusions included therein are intended for the information of the person or persons to whom they are addressed, solely for the purposes stated therein, and should not be relied upon for any other purpose. In the event that the report is distributed to third parties, Goodkin/Focus shall be held harmless relative to their use or reliance on the report for any purpose. Neither our report, nor its contents, nor any reference to the consultants of Goodkin/Focus, may be included or quoted in any offering circular or registration statement, prospectus, sales brochure, appraisal, loan or other agreement or document without our prior written permission. Consulting engagements are accepted with the understanding that there is no obligation to provide services after completion of the original assignment or beyond any updates or other supplemental services specifically defined in this agreement. If the need for subsequent services related to a consulting engagement (e.g., testimony, updates, conferences, or other services) is contemplated, special arrangements acceptable to Goodkin/Focus must be made in advance. Conclusions presented in our report assume market conditions as observed as of the current date of our market research (stated in the letter of transmittal.) Goodkin/Focus assumes no liability should market conditions materially change because of unusual or unforeseen circumstances.