mexican economy
TRANSCRIPT
Economic analysis
ofMexico
By:Shrey Patel
Section B 14bsp0963
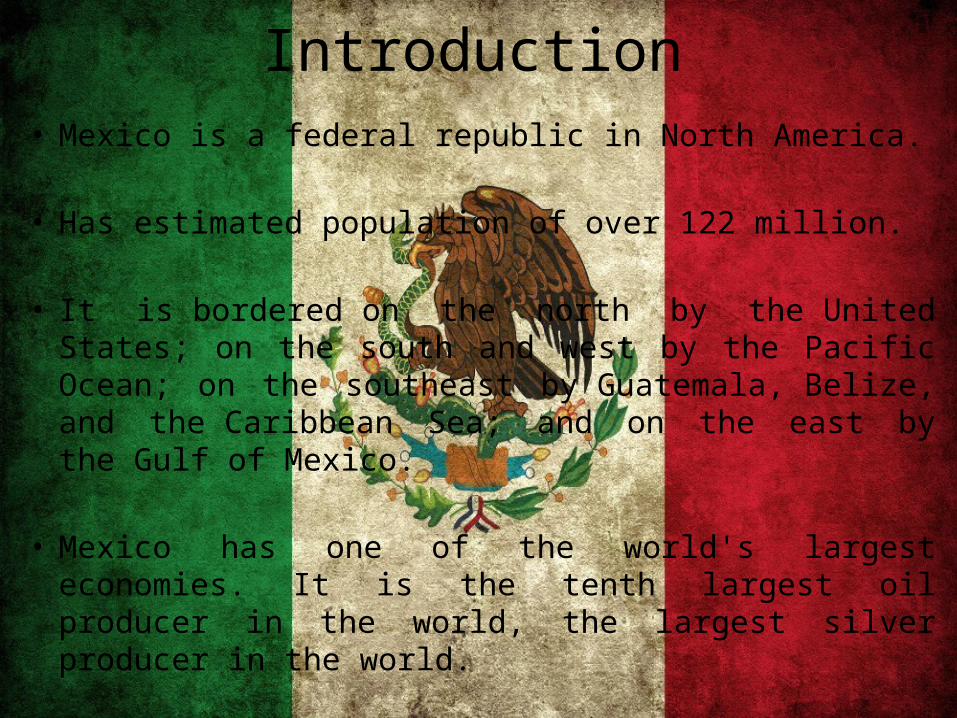
Introduction• Mexico is a federal republic in North America.
• Has estimated population of over 122 million.
• It is bordered on the north by the United States; on the south and west by the Pacific Ocean; on the southeast by Guatemala, Belize, and the Caribbean Sea; and on the east by the Gulf of Mexico.
• Mexico has one of the world's largest economies. It is the tenth largest oil producer in the world, the largest silver producer in the world.
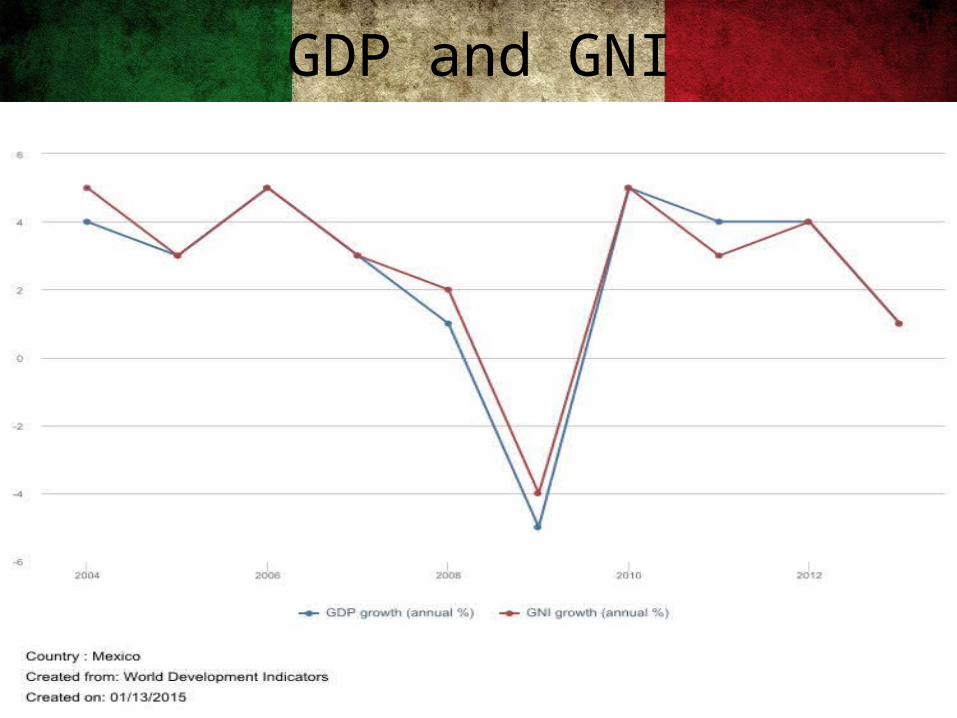
GDP and GNI
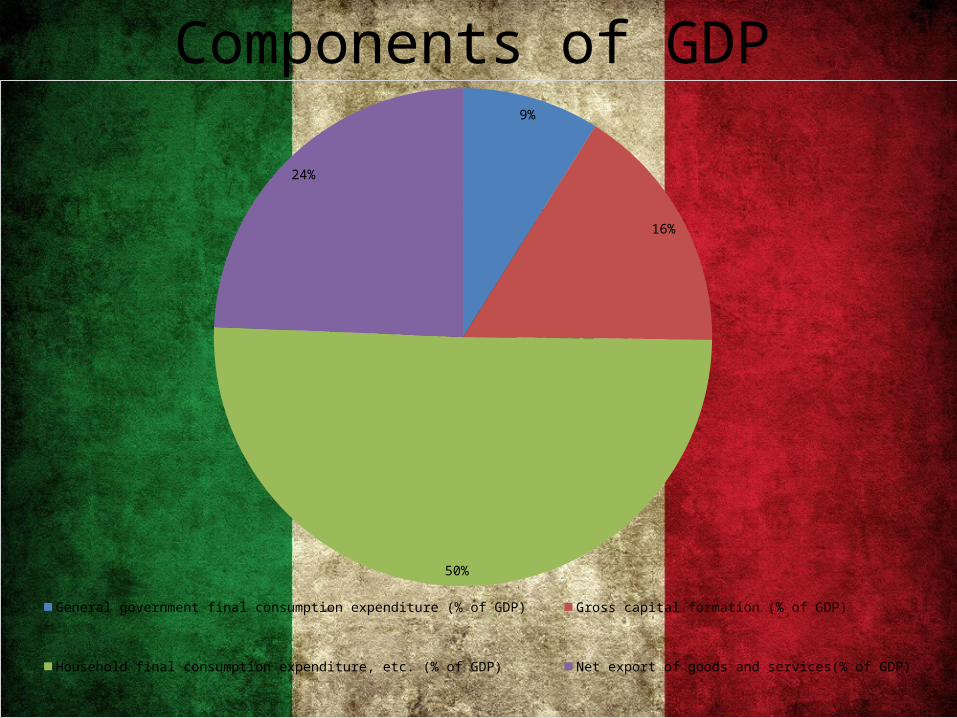
Components of GDP9%
16%
50%
24%
General government final consumption expenditure (% of GDP) Gross capital formation (% of GDP) Household final consumption expenditure, etc. (% of GDP)
Net export of goods and services(% of GDP)
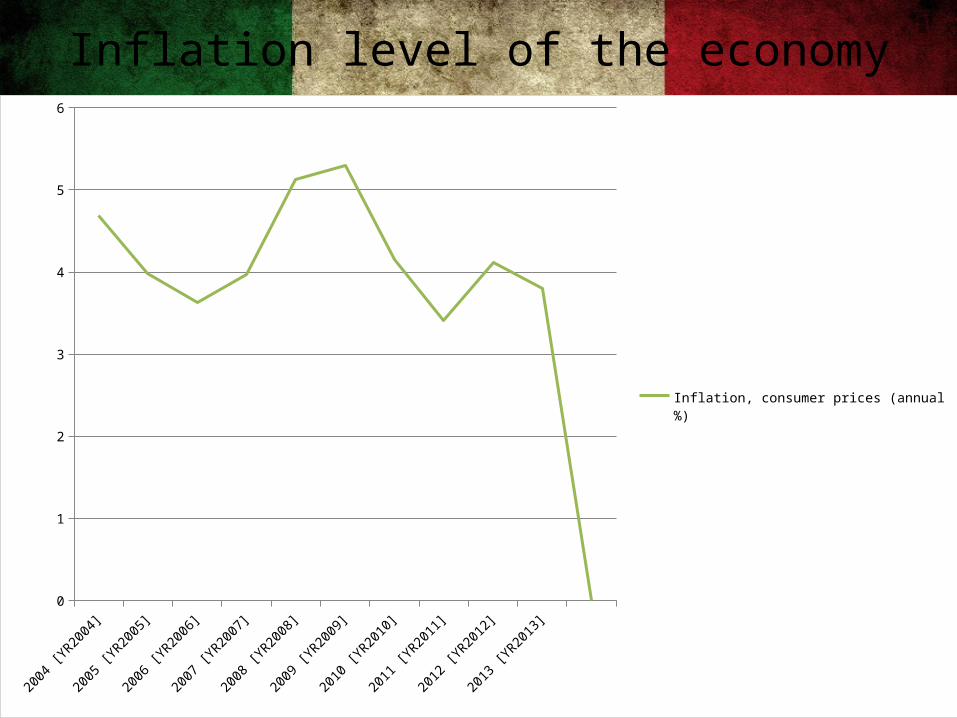
Inflation level of the economy
2004 [YR2004]
2005 [YR2005]
2006 [YR2006]
2007 [YR2007]
2008 [YR2008]
2009 [YR2009]
2010 [YR2010]
2011 [YR2011]
2012 [YR2012]
2013 [YR2013]
0
1
2
3
4
5
6
Inflation, consumer prices (annual %)
Ease of doing business
• Currently ranked 39th in ease of doing business index.
• According to data collected by Doing Business, starting a business there requires 6 procedures, takes 6.3 days.
• Corporate tax is 30%(‘10-’14)
Monetary and Fiscal policy
• It has 3% interest rate.
• With new reformed tax bill proposed in 2014 budget, policy makers aim to increase tax revenues by 1.4% of GDP next year and by 2.9% of GDP by the end of 2018.
• The government proposes to increase the fiscal deficit to 1.5% of GDP in 2014
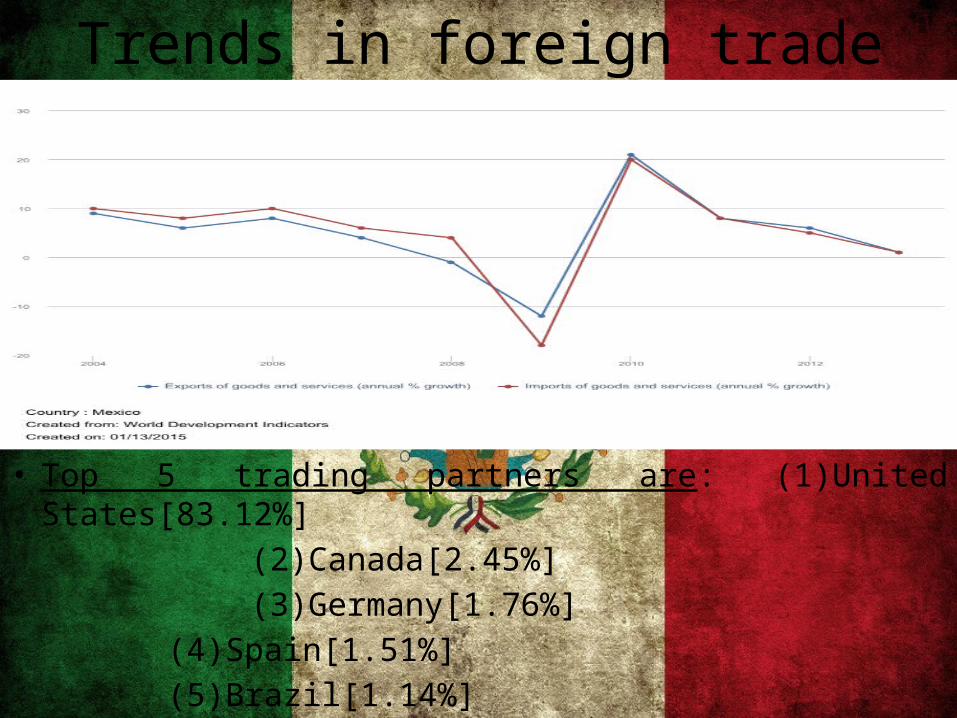
Trends in foreign trade
• Top 5 trading partners are: (1)United States[83.12%]
(2)Canada[2.45%]
(3)Germany[1.76%]
(4)Spain[1.51%]
(5)Brazil[1.14%]
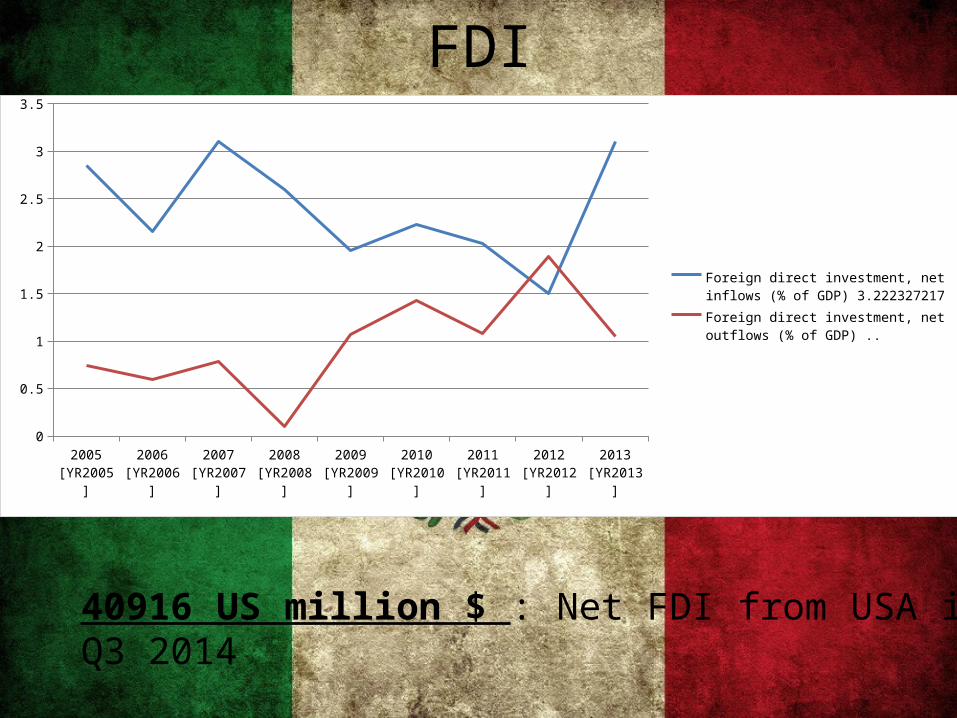
FDI
2005 [YR2005]
2006 [YR2006]
2007 [YR2007]
2008 [YR2008]
2009 [YR2009]
2010 [YR2010]
2011 [YR2011]
2012 [YR2012]
2013 [YR2013]
0
0.5
1
1.5
2
2.5
3
3.5
Foreign direct investment, net inflows (% of GDP) 3.222327217Foreign direct investment, net outflows (% of GDP) ..
40916 US million $ : Net FDI from USA in Q3 2014
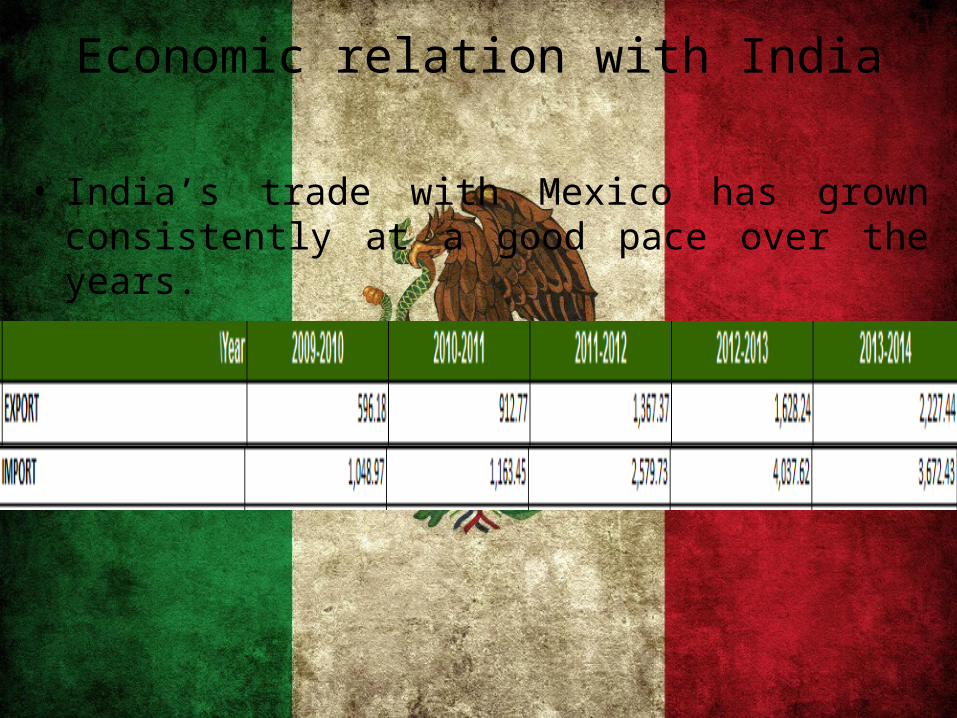
Economic relation with India
• India’s trade with Mexico has grown consistently at a good pace over the years.
• A Memorandum of Understanding (MOU) was signed between India and Mexico on 21st May, 2007 at New Delhi by Minister of Commerce and Industry and Minister of Economy, Mexico for the establishment of a Bilateral High Level Group on Trade , Investment and Economic Cooperation.
• The functions of the HLG mainly include promoting bilateral cooperation, maintaining liaison in the economic, commercial, technical and other related fields and information exchange.