mew kuwait
TRANSCRIPT
SUSTAINABLE ENERGY SUSTAINABLE ENERGY
POLICY FOR KUWAITPOLICY FOR KUWAIT
MEW - Kuwait
5th Annual Middle East District Cooling Summit November 2013
CONTENTSCONTENTS
Concerns
Power and water demands forecast
Savings Potential
Policy principals

CONCERNSCONCERNS
Major threats to National Sustainability which cannot be ignored:
Real economic diversification is small, the Economy is almost entirely dependant on oil revenue.
Fiscal price could reach real price by 2017.
Fiscal margins necessary to withstand price volatility and to develop the Future Generations income.
By 2030 about 700,000- 900,000 barrels of oil per day will burned to generate electricity and desalinate water.

KUWAIT FISCAL BREAK EVEN KUWAIT FISCAL BREAK EVEN
Break Even
OIL PRICEOIL PRICE
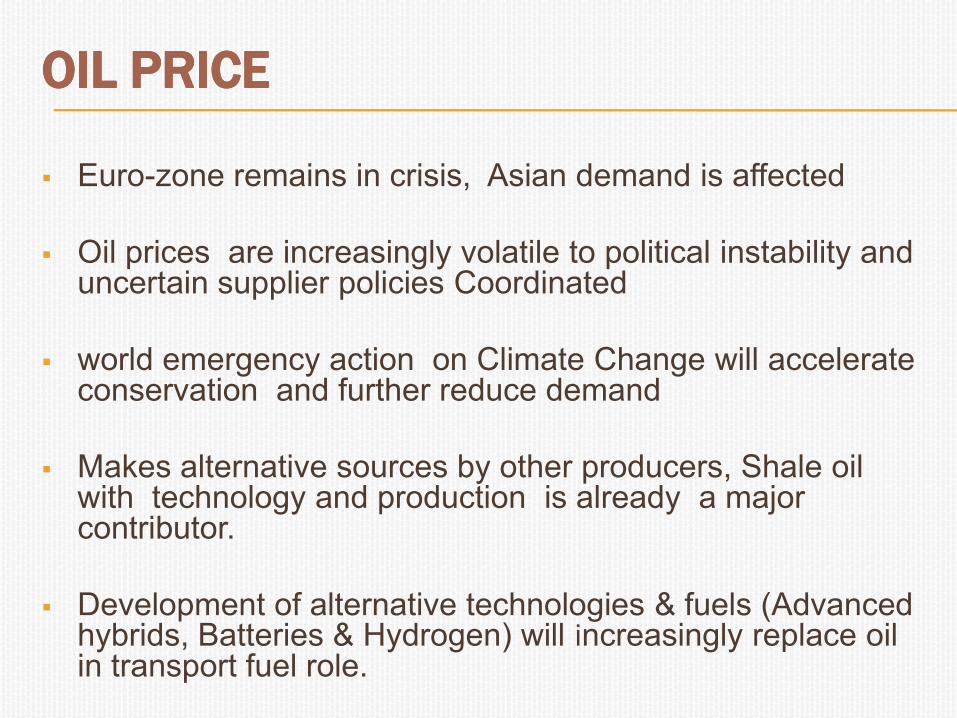
Euro-zone remains in crisis, Asian demand is affected
Oil prices are increasingly volatile to political instability and uncertain supplier policies Coordinated
world emergency action on Climate Change will accelerate conservation and further reduce demand
Makes alternative sources by other producers, Shale oil with technology and production is already a major contributor.
Development of alternative technologies & fuels (Advanced hybrids, Batteries & Hydrogen) will increasingly replace oil in transport fuel role.

SUMMARYSUMMARY
QUOTA (not Related to population)
Social Spending
OPEC forced to maintain High Prices
Accelerates conservation Reduces subsidies in consumer Nations
Makes Shale Oil, Arctic Deepwater Economic
Recovering Producers (Iraq, Libya)
National Development Plans
INCREASING FISCAL
OIL PRICES
WORLD DEMAND OECD stagnant, growing EU crisis ASIA – High Growth (BUT affected by world economy conservation )
QUOTA Reductions MEDIUM TERM PROBABLE LONG TERM CERTAIN LONG TERM
Decisive Climate Change action
Alternative Transport Fuels
Demand reduction
OIL MARKET
Competing Supply
Demand reduction
Competing Supply
Quota Reductions Probable in Medium Term , Certain in Long Term

POWER AND WATER POWER AND WATER
DEMANDDEMAND
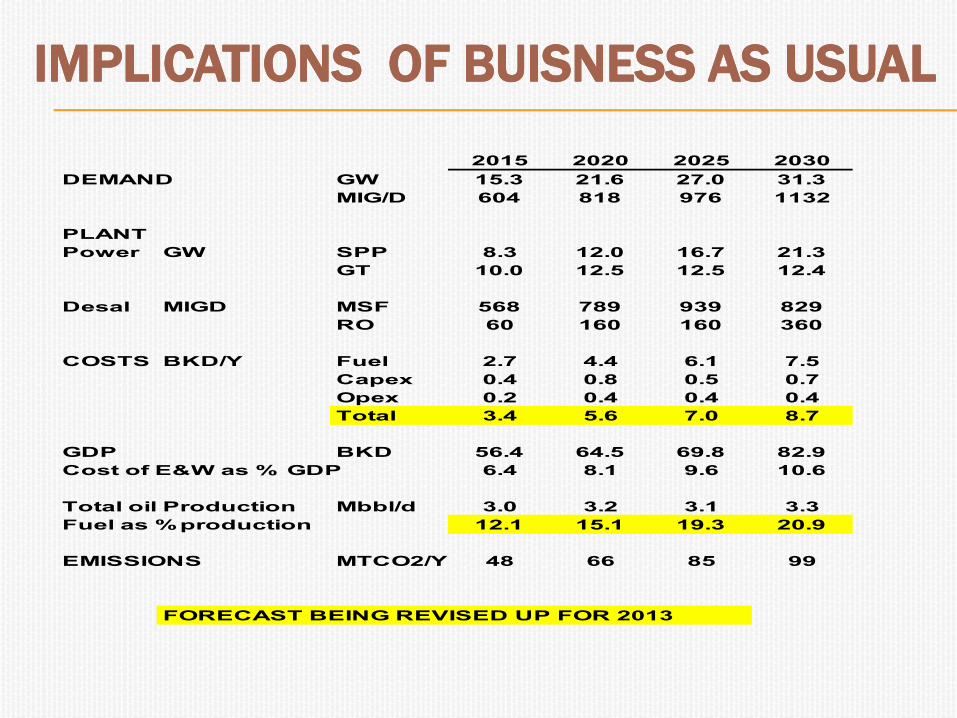
IMPLICATIONS OF BUISNESS AS USUALIMPLICATIONS OF BUISNESS AS USUALSUMMARY OF MEW 2012 FORECAST
2015 2020 2025 2030
DEMAND GW 15.3 21.6 27.0 31.3
MIG/D 604 818 976 1132
PLANT
Power GW SPP 8.3 12.0 16.7 21.3
GT 10.0 12.5 12.5 12.4
Desal MIGD MSF 568 789 939 829
RO 60 160 160 360
COSTS BKD/Y Fuel 2.7 4.4 6.1 7.5
Capex 0.4 0.8 0.5 0.7
Opex 0.2 0.4 0.4 0.4
Total 3.4 5.6 7.0 8.7
GDP BKD 56.4 64.5 69.8 82.9
Cost of E&W as % GDP 6.4 8.1 9.6 10.6
Total oil Production Mbbl/d 3.0 3.2 3.1 3.3
Fuel as %production 12.1 15.1 19.3 20.9
EMISSIONS MTCO2/Y 48 66 85 99
FORECAST BEING REVISED UP FOR 2013
FUEL SUPPLY & DEMAND
0
200
400
600
800
1000
1200
1400
1600
2013 2016 2019 2022 2025 2028
TBTU
HFO Domestic Gas
Total Fuel Demand

DOMESTIC DEMAND DOMESTIC DEMAND -- BUSINESS AS USUALBUSINESS AS USUAL-- DEMANDS
PER CAPITA
PEAK ELECTRICAL (GW)
0
5
10
15
20
25
30
35
1998 2002 2006 2010 2014 2018 2022 2026 2030
Actual
Const Per
Capita
Forecast
PEAK WATER (MIG/D)
0
250
500
750
1000
1250
1998 2002 2006 2010 2014 2018 2022 2026 2030
PEAK ELECTRICAL (KW)
0
1
2
3
4
5
6
1998 2002 2006 2010 2014 2018 2022 2026 2030
PEAK WATER (G/D)
0
50
100
150
200
1998 2002 2006 2010 2014 2018 2022 2026 2030
Efffect of National
Development Plans
Population 6.2 M in 2030

PLANT AND FUEL REQUIREMENTSPLANT AND FUEL REQUIREMENTS
FUEL SUPPLY & DEMAND
(MBoe)
Available
HFO
Avalable
Gas
Crude
LNG &
Gas Oil
0
50
100
150
200
250
300
2013 2017 2021 2025 2029
POWERPLANT REQUIRED
(GW)
0
5
10
15
20
25
30
35
2013 2017 2021 2025 2029
2012 Estimate
2013 Estimate
DESALINATION
(MIGD)
0
250
500
750
1000
1250
2013 2017 2021 2025 2029
2012 Estimate
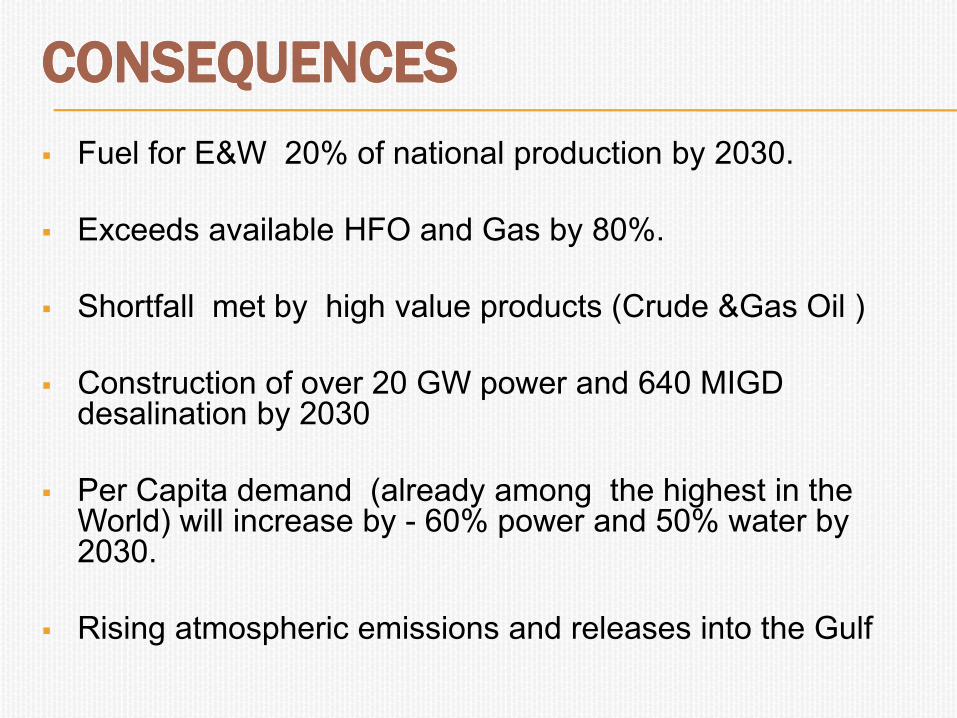
CONSEQUENCESCONSEQUENCES
Fuel for E&W 20% of national production by 2030.
Exceeds available HFO and Gas by 80%.
Shortfall met by high value products (Crude &Gas Oil )
Construction of over 20 GW power and 640 MIGD desalination by 2030
Per Capita demand (already among the highest in the World) will increase by - 60% power and 50% water by 2030.
Rising atmospheric emissions and releases into the Gulf
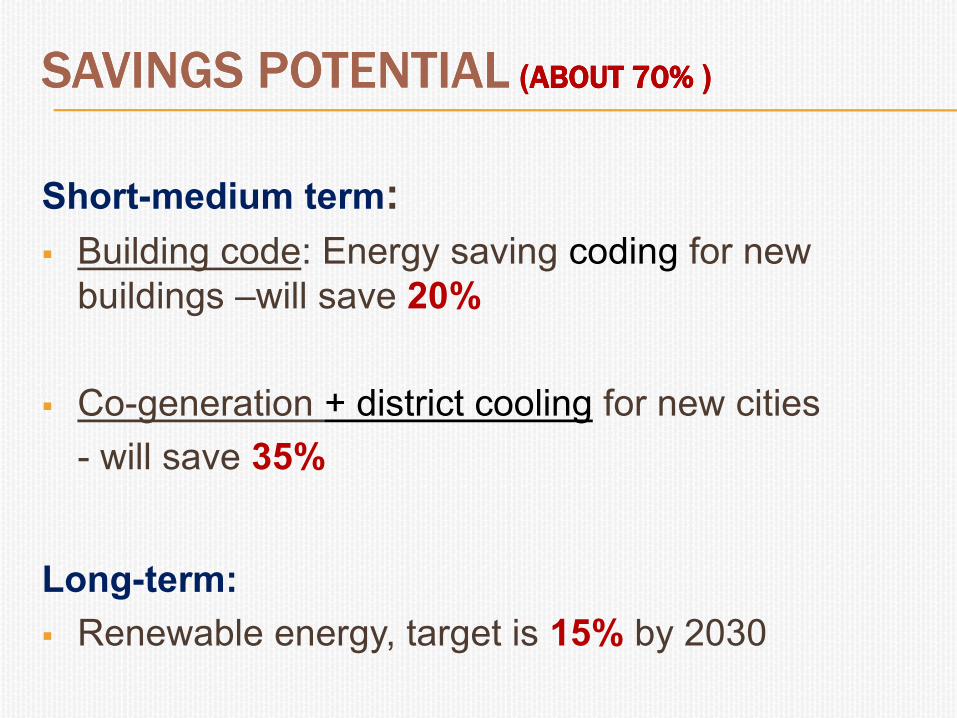
((ABOUT ABOUT 7070% % )) SAVINGS POTENTIALSAVINGS POTENTIAL
Short-medium term:
Building code: Energy saving coding for new
buildings –will save 20%
Co-generation + district cooling for new cities
- will save 35%
Long-term:
Renewable energy, target is 15% by 2030
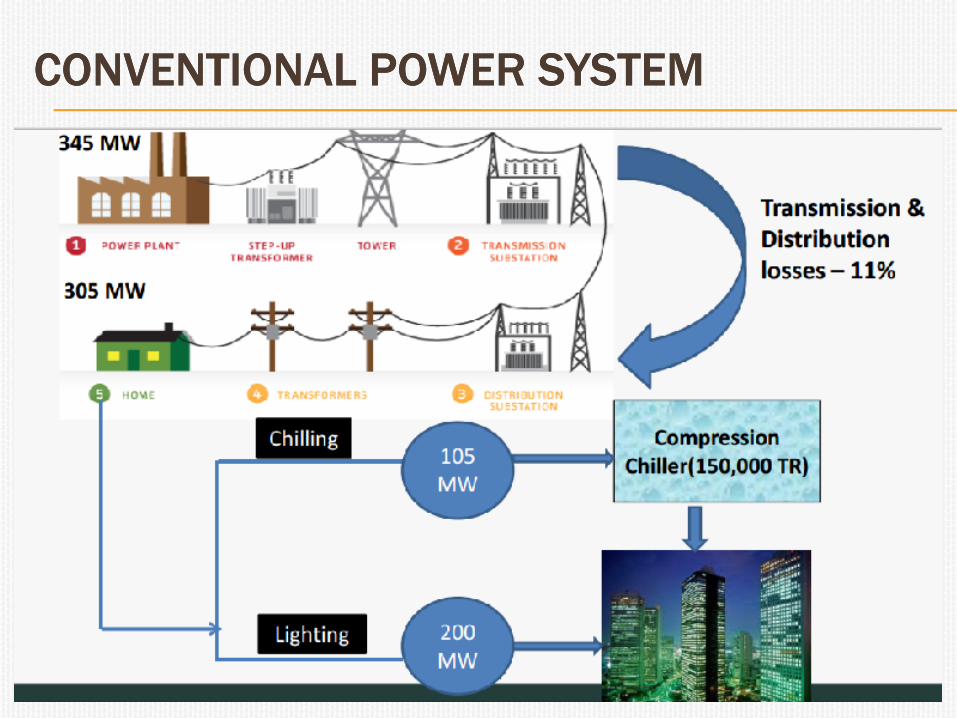
CONVENTIONAL POWER SYSTEMCONVENTIONAL POWER SYSTEM

COCO--GENERATION & DISTRICT COOLINGGENERATION & DISTRICT COOLING
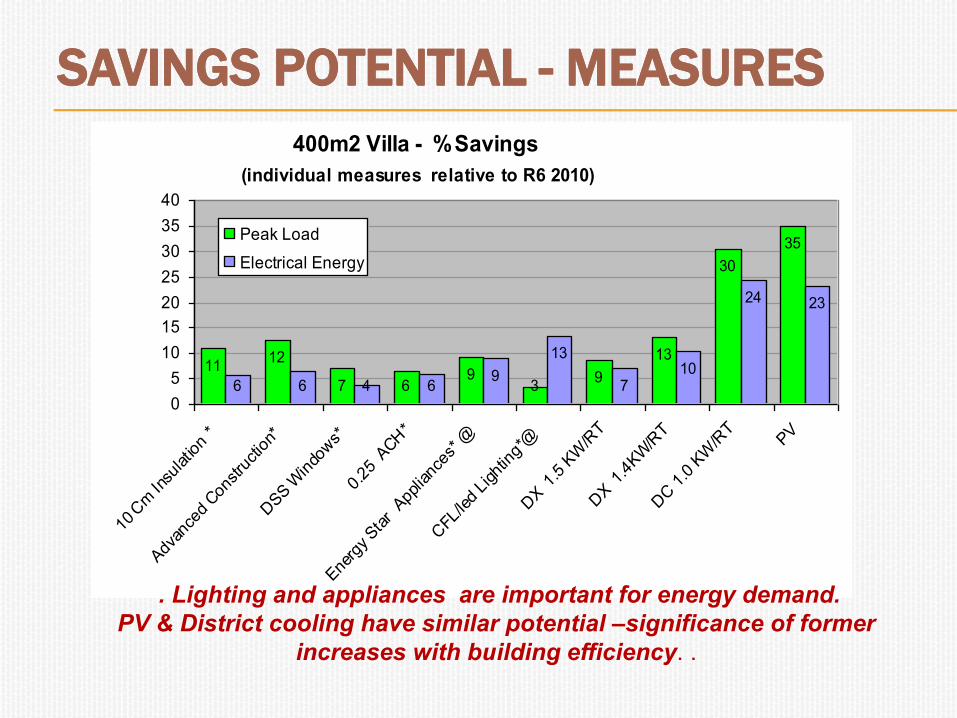
SAVINGS POTENTIAL SAVINGS POTENTIAL -- MEASURESMEASURES
400m2 Villa - %Savings
(individual measures relative to R6 2010)
12
7 69
39
13
30
35
6 6 4 69
13
710
24 23
11
0
5
10
15
20
25
30
35
40
10 C
m In
sulatio
n *
Adv
ance
d Con
stru
ctio
n*
DSS W
indo
ws*
0.25
ACH*
Ene
rgy Sta
r A
pplia
nces
* @
CFL
/led
Ligh
ting*
@
DX 1
.5 K
W/R
T
DX 1
.4KW
/RT
DC 1
.0 K
W/R
TPV
Peak Load
Electrical Energy
. Lighting and appliances are important for energy demand.
PV & District cooling have similar potential –significance of former
increases with building efficiency. .
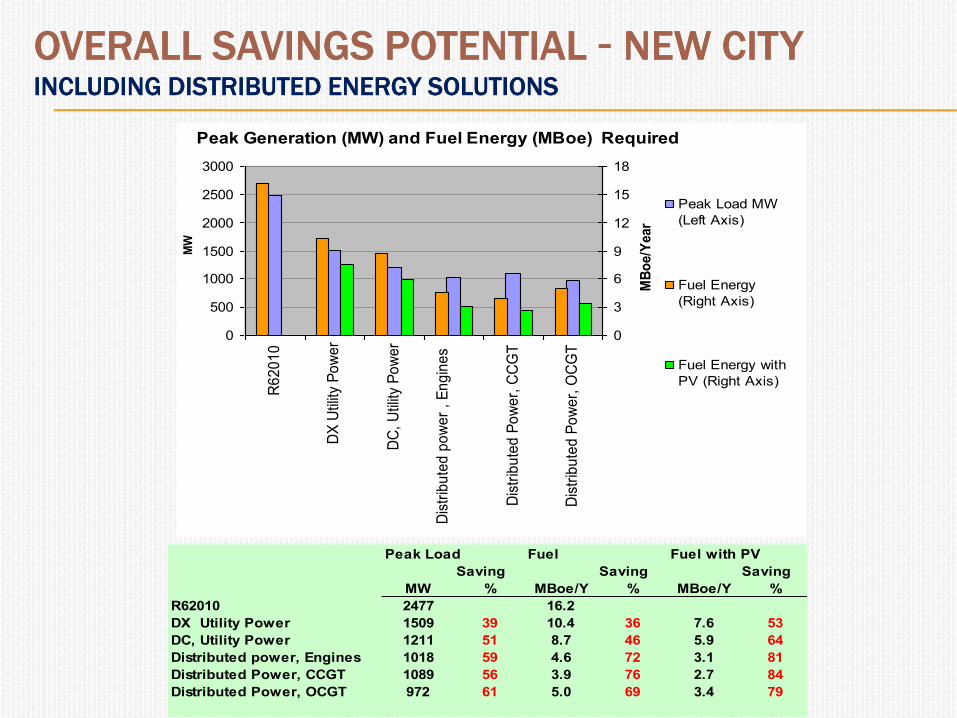
NEW CITYNEW CITY--OVERALL SAVINGS POTENTIAL OVERALL SAVINGS POTENTIAL INCLUDING DISTRIBUTED ENERGY SOLUTIONSINCLUDING DISTRIBUTED ENERGY SOLUTIONS
Peak Load Fuel Fuel with PV
Saving Saving Saving
MW % MBoe/Y % MBoe/Y %
R62010 2477 16.2
DX Utility Power 1509 39 10.4 36 7.6 53
DC, Utility Power 1211 51 8.7 46 5.9 64
Distributed power, Engines 1018 59 4.6 72 3.1 81
Distributed Power, CCGT 1089 56 3.9 76 2.7 84
Distributed Power, OCGT 972 61 5.0 69 3.4 79
Peak Generation (MW) and Fuel Energy (MBoe) Required
0
500
1000
1500
2000
2500
3000
R6
20
10
DX
Util
ity P
ow
er
DC
, U
tility
Po
we
r
Dis
trib
ute
d p
ow
er
, E
ng
ine
s
Dis
trib
ute
d P
ow
er,
CC
GT
Dis
trib
ute
d P
ow
er,
OC
GT
MW
0
3
6
9
12
15
18
MB
oe/Y
ear
Peak Load MW
(Left Axis)
Fuel Energy
(Right Axis)
Fuel Energy with
PV (Right Axis)

RENEWABLE ENERGY POTENTIAL RENEWABLE ENERGY POTENTIAL
17
PV costs reducing rapidly, dominated by Chinese manufacture
Wind and probably Rooftop and Utility PV competitive with RHSPP now
Depends on local conditions, and intermittency , now being confirmed
by pilot projects.
STEAM TURBINES AND GAS TURBINES
0
5
10
15
20
25
70 90 110 130
Crude Price $/Bbl
LC
OE
CK
Wh
r
RH SPP
" F" CCGT
SOLAR & WIND
0
5
10
15
20
25
2015 2020 2025 2030
Wind
CSP
UPV

ENERGY SAVINGS POTENTIAL ENERGY SAVINGS POTENTIAL
0
200
400
600
800
1000
1200
1400
1600
TB
TU
/Y
FUEL ENERGY SUPPLY & DEMAND - SAVINGS POTENTIAL
Building & AC Efficiency (including District Cooling )
Building applied PV
Resultant Demand
Domestic Gas
HFO
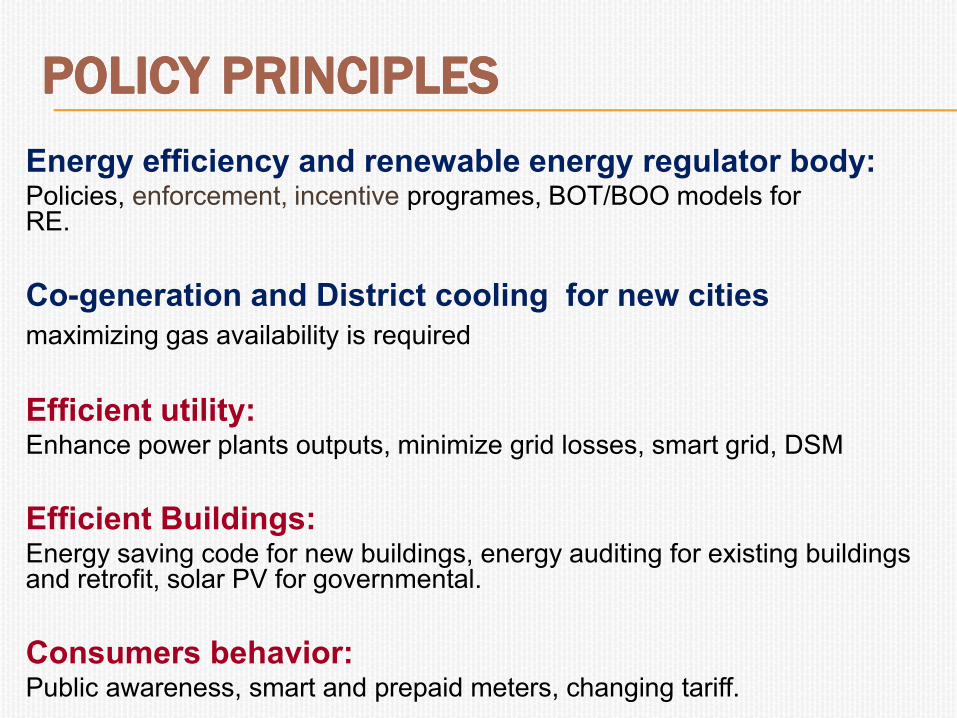
POLICY PRINCIPLESPOLICY PRINCIPLES
Energy efficiency and renewable energy regulator body: Policies, enforcement, incentive programes, BOT/BOO models for RE.
Co-generation and District cooling for new cities
maximizing gas availability is required
Efficient utility:Enhance power plants outputs, minimize grid losses, smart grid, DSM
Efficient Buildings:Energy saving code for new buildings, energy auditing for existing buildings and retrofit, solar PV for governmental.
Consumers behavior:.Public awareness, smart and prepaid meters, changing tariff

THANKSTHANKS

BACKUP BACKUP
FOR QUESTIONS
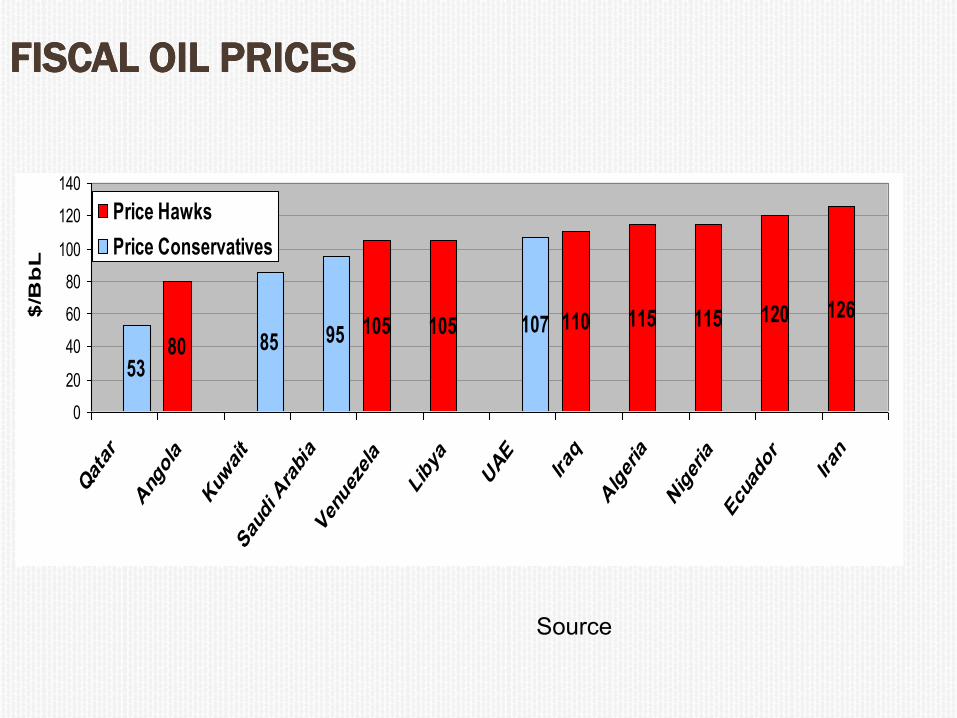
FISCAL OIL PRICESFISCAL OIL PRICES
Price HawksPrice Conservatives
Qatar 53
Angola 80
Kuwait 85
Saudi Arabia 95
Venuezela 105
Libya 105
UAE 107
Iraq 110
Algeria 115
Nigeria 115
Ecuador 120
Iran 126
Esimated Fiscal Oil Price
80105 105 110 115 115 120 126
5385
10795
0
20
40
60
80
100
120
140
Qatar
Ang
ola
Kuw
ait
Sau
di A
rabia
Ven
uez
ela
Libya
UAE
Iraq
Algeria
Nigeria
Ecu
ador
Iran
$/B
bL
Price Hawks
Price Conservatives
Source
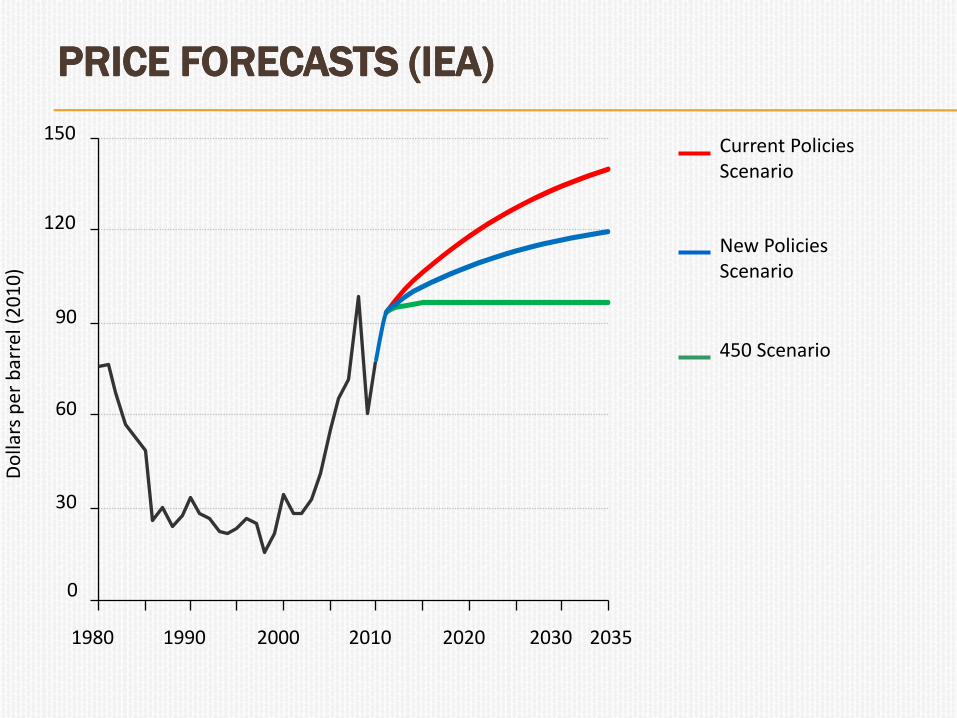
PRICE FORECASTS (IEA)PRICE FORECASTS (IEA)
Current PoliciesScenario
New Policies Scenario
450 Scenario
0
30
60
90
120
150
1980 1990 2000 2010 2020 2030 2035
Do
llars
per
bar
rel (
20
10
)
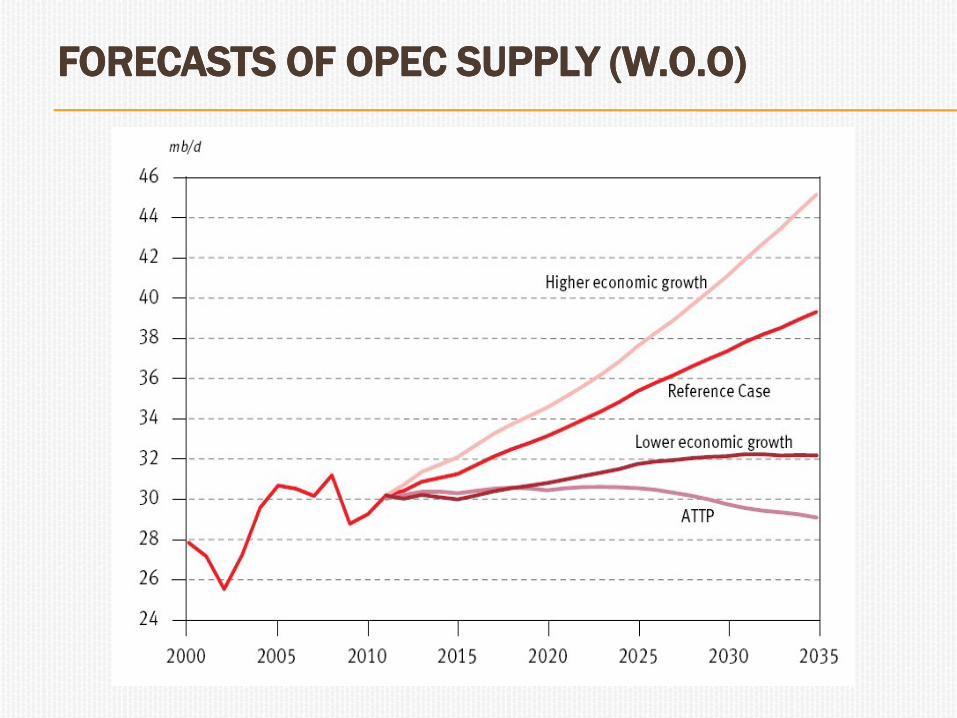
FORECASTS OF OPEC SUPPLY (W.O.O)FORECASTS OF OPEC SUPPLY (W.O.O)

ILLUSTRATION OF EFFECTS ON KUWAITILLUSTRATION OF EFFECTS ON KUWAIT
Production & Exports (MBls/day)
0.0
0.5
1.0
1.5
2.0
2.5
3.0
3.5
2013
2015
2017
2019
2021
2023
2025
2027
2029
KPC Planned Production
Domestic Consumption
(Petrochem & Transport)
Domestic Consumption
(Power & Water)
Exports with Reduced
Quota
Possible Reduced Quota
Due to Alternative Supplies
Exports @ Planned
Capacity
Fiscal Oil Price $/Bbl
80
100
120
140
160
180
200
2011
2013
2015
2017
2019
2021
2023
2025
2027
2029
KPC planned production
with sustainable energy
policy
Assumed OPEC Quota
Reduction
with sustainable energy
policy
Assumptions – quota restriction to 2.5 Mbls/day , 10% contribution to FGF
26
ACTION REQUIREDACTION REQUIRED
Economic and Industrial diversification particularly to petrochemical and new materials uses of oil
Minimise social employment & spending, increase private sector employment over complete jobs spectrum
Continued development of Oil resources to retain swing producer position.
Maximum refining to clean fuels to increase export value
Minimize Loss of Revenue due to Domestic Oil Consumption
Development of gas resources to substitute oil firing
NATIONAL SUSTAINABLE ENERGY POLICY
.
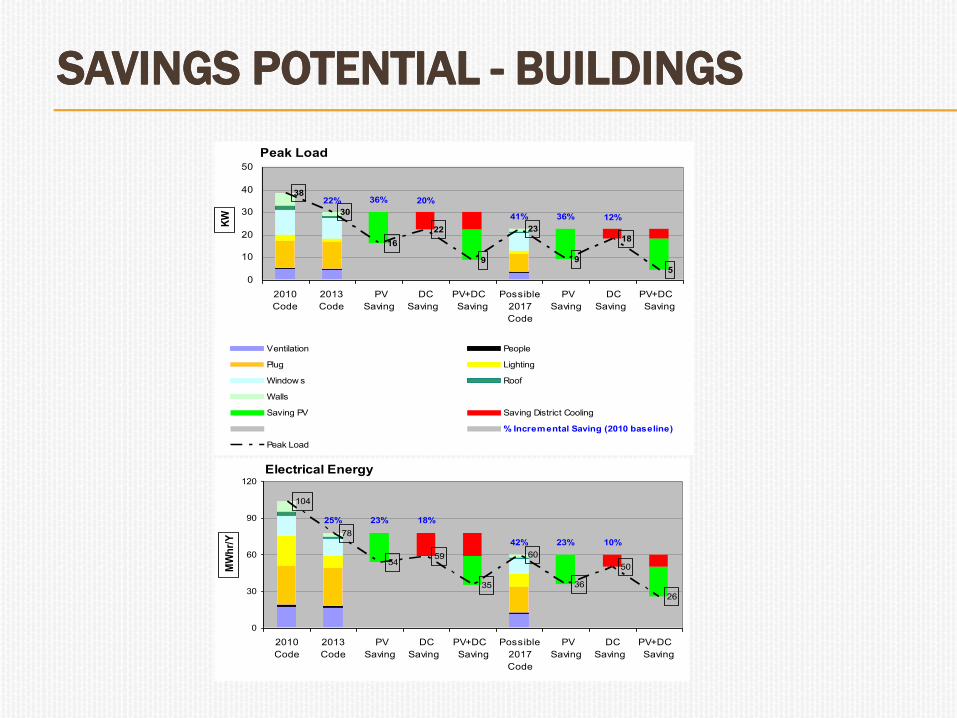
SAVINGS POTENTIAL SAVINGS POTENTIAL -- BUILDINGSBUILDINGS
Peak Load
22% 36% 20%
41% 36% 12%
38
30
16
22
9
23
9
18
5
0
10
20
30
40
50
2010
Code
2013
Code
PV
Saving
DC
Saving
PV+DC
Saving
Possible
2017
Code
PV
Saving
DC
Saving
PV+DC
Saving
KW
Ventilation People
Plug Lighting
Window s Roof
Walls
Saving PV Saving District Cooling
Series12 % Incremental Saving (2010 baseline)
Peak Load
Electrical Energy
25% 23%
42% 23% 10%
18%
104
78
5459
35
60
36
50
26
0
30
60
90
120
2010
Code
2013
Code
PV
Saving
DC
Saving
PV+DC
Saving
Possible
2017
Code
PV
Saving
DC
Saving
PV+DC
Saving
MW
hr/
Y

TARGETSTARGETS
To be the highest technically and economically justifiable.
To be periodically revised according to the technical and cost evolution of applicable measures
Setting and revision by the National Energy Council
Possible values are:
Building Energy Intensities Alternative Generation
2020 2030 2020 2030
New % Application 100 100 % Total 2 10
KWhr/M2/Y 160 130
Existing % Application 20 50
KWhr/M2/Y 200 160