methodology for the assessment of scour at bridge … for the assessment of scour at bridge sites in...
TRANSCRIPT
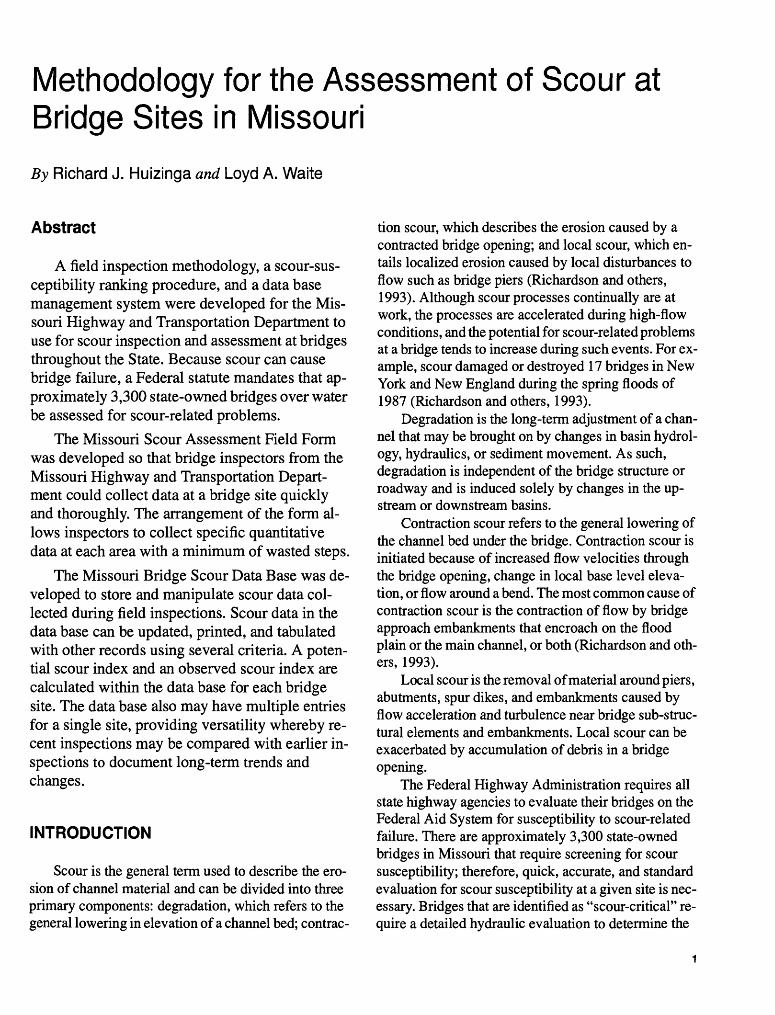
Methodology for the Assessment of Scour at Bridge Sites in Missouri
By RICHARD J. HUIZINGA and LOYD A. WAITE
U.S. GEOLOGICAL SURVEY Open-File Report 94-544
Prepared in cooperation with theMISSOURI HIGHWAY AND TRANSPORTATION DEPARTMENT
Rolla, Missouri 1994
U.S. DEPARTMENT OF THE INTERIOR
BRUCE BABBITT, Secretary
U.S. GEOLOGICAL SURVEY
Gordon P. Eaton, Director
For additional information Copies of this report may bewrite to: purchased from:
U.S. Geological SurveyDistrict Chief Earth Science Information CenterU.S. Geological Survey Open-File Reports Section1400 Independence Road Box 25286, MS 517Mail Stop 200 Federal CenterRolla, Missouri 65401 Denver, Colorado 80225
CONTENTS
Abstract...................................................................................................................^^^ 1
Introduction..........................................»^ 1
Purpose and Scope............................................................................................................................................... 2
Description of Study Area.................................................................................................................................... 2
Acknowledgments................................................................................................^ 2
Data Collection Methodology........................................................................................................................................ 2
Missouri Scour Assessment Field Form.............................................................................................................. 3
m the Tmck......................................................................................^ 3
From the Roadway..................................................................................................................................... 7
In the Upstream Channel............................................................................................................................ 7
Under the Bridge........................................................................................................................................ 9
In the Downstream Channel....................................................................................................................... 11
Limitations of Methodology................................................................................................................................ 12
Trairimg........................................................^ 12
Assessment of Bridge Sites for Observed Scour and Scour Potential........................................................................... 13
Missouri Bridge Scour Data Base........................................................................................................................ 13
Observed Scour Index Variables and Values....................................................................................................... 13
Potential Scour Index Variables and Values........................................................................................................ 15
Limitations of Observed and Potential Scour Indices.......................................................................................... 22
Sunmiaiy...................................................................................................._^ 22
References Cited............................................................................................................................................................ 23
FIGURES
1. Map showing highway districts and major physiographic regions of Missouri................................................. 3
2. The Missouri Scour Assessment Field Form...................................................................................................... 4
3-8. Diagrams showing:
3. Generalized view of hypothetical bridge site....................................................................................... 8
4. The high-flow angle of approach......................................................................................................... 9
5. Selected channel-bank information collected in the channel both upstream and downstream
from the bridge..................................................................................................................................... 10
6. Bridge opening showing various dimensions and channel position designations ............................ 10
7. Bridge opening showing designation of debris pile dimensions.......................................................... 12
8. The high-flow angle of attack on piers ................................................................................................ 18
9. Cross sections of a hypothetical channel showing the possible combinations of bed and bank
protection and the corresponding index value assigned to each......................................................................... 20
10. Representative conditions for the six stages of channel evolution..................................................................... 21
TABLES
1. Observed scour index variables and values for streams in Missouri................................................................... 14
2. Potential scour index variables and values for streams in Missouri.................................................................... 16
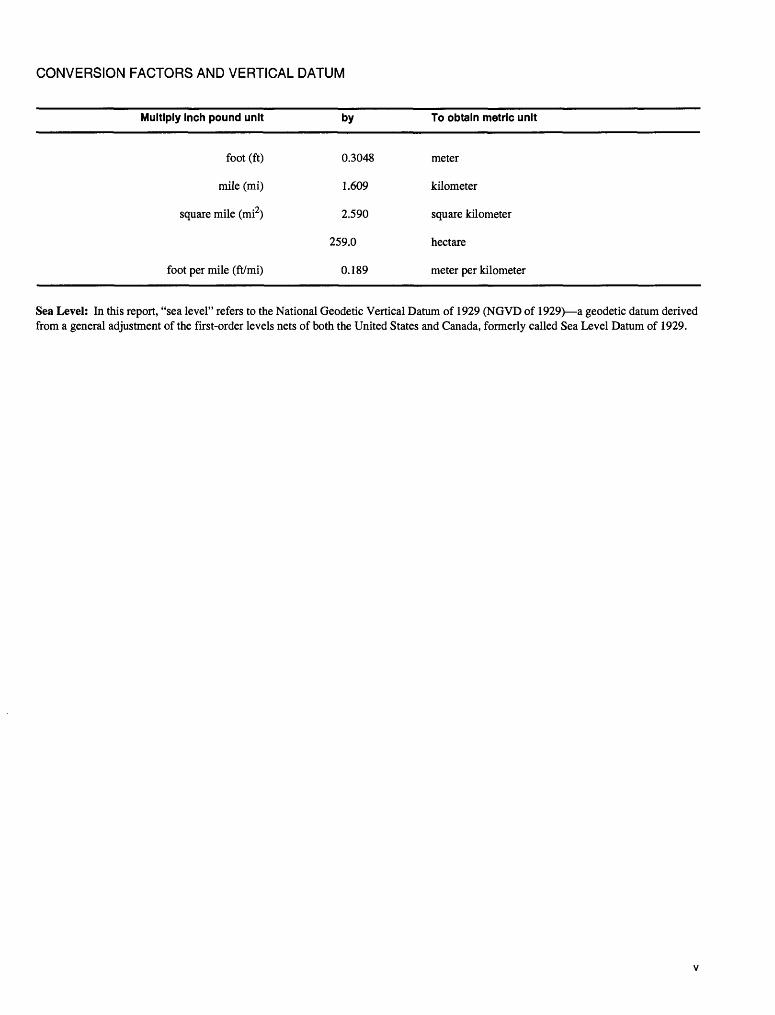
CONVERSION FACTORS AND VERTICAL DATUM
Multiply Inch pound unit
foot (ft)
mile (mi)
square mile (mi2)
foot per mile (ft/mi)
by
0.3048
1.609
2.590
259.0
0.189
To obtain metric unit
meter
kilometer
square kilometer
hectare
meter per kilometer
Sea Level: In this report, "sea level" refers to the National Geodetic Vertical Datum of 1929 (NGVD of 1929) a geodetic datum derived from a general adjustment of the first-order levels nets of both the United States and Canada, formerly called Sea Level Datum of 1929.
Methodology for the Assessment of Scour at Bridge Sites in Missouri
By Richard J. Huizinga and Loyd A. Waite
Abstract
A field inspection methodology, a scour-sus ceptibility ranking procedure, and a data base management system were developed for the Mis souri Highway and Transportation Department to use for scour inspection and assessment at bridges throughout the State. Because scour can cause bridge failure, a Federal statute mandates that ap proximately 3,300 state-owned bridges over water be assessed for scour-related problems.
The Missouri Scour Assessment Field Form was developed so that bridge inspectors from the Missouri Highway and Transportation Depart ment could collect data at a bridge site quickly and thoroughly. The arrangement of the form al lows inspectors to collect specific quantitative data at each area with a minimum of wasted steps.
The Missouri Bridge Scour Data Base was de veloped to store and manipulate scour data col lected during field inspections. Scour data in the data base can be updated, printed, and tabulated with other records using several criteria. A poten tial scour index and an observed scour index are calculated within the data base for each bridge site. The data base also may have multiple entries for a single site, providing versatility whereby re cent inspections may be compared with earlier in spections to document long-term trends and changes.
INTRODUCTION
Scour is the general term used to describe the ero sion of channel material and can be divided into three primary components: degradation, which refers to the general lowering in elevation of a channel bed; contrac
tion scour, which describes the erosion caused by a contracted bridge opening; and local scour, which en tails localized erosion caused by local disturbances to flow such as bridge piers (Richardson and others, 1993). Although scour processes continually are at work, the processes are accelerated during high-flow conditions, and the potential for scour-related problems at a bridge tends to increase during such events. For ex ample, scour damaged or destroyed 17 bridges in New York and New England during the spring floods of 1987 (Richardson and others, 1993).
Degradation is the long-term adjustment of a chan nel that may be brought on by changes in basin hydrol ogy, hydraulics, or sediment movement. As such, degradation is independent of the bridge structure or roadway and is induced solely by changes in the up stream or downstream basins.
Contraction scour refers to the general lowering of the channel bed under the bridge. Contraction scour is initiated because of increased flow velocities through the bridge opening, change in local base level eleva tion, or flow around a bend. The most common cause of contraction scour is the contraction of flow by bridge approach embankments that encroach on the flood plain or the main channel, or both (Richardson and oth ers, 1993).
Local scour is the removal of material around piers, abutments, spur dikes, and embankments caused by flow acceleration and turbulence near bridge sub-struc tural elements and embankments. Local scour can be exacerbated by accumulation of debris in a bridge opening.
The Federal Highway Administration requires all state highway agencies to evaluate their bridges on the Federal Aid System for susceptibility to scour-related failure. There are approximately 3,300 state-owned bridges in Missouri that require screening for scour susceptibility; therefore, quick, accurate, and standard evaluation for scour susceptibility at a given site is nec essary. Bridges that are identified as "scour-critical" re quire a detailed hydraulic evaluation to determine the
potential scour depths. The term "scour-critical" de scribes a bridge that is deemed unstable because abut ment or pier foundations or both have been determined to be, or have the potential to be, undermined because of erosion to the channel bed or banks (Federal High way Administration, 1988).
The U.S. Geological Survey (USGS), in coopera tion with the Missouri Highway and Transportation Department (MHTD), developed procedures for mak ing assessments and trained MHTD personnel in the application of these procedures. The USGS currently (1994) is compiling the data collected from the assess ments and ranking the State bridges based on scour po tential and observed scour problems.
Purpose and Scope
The purpose of this report is to document the devel opment and implementation of a methodology used for the timely collection of bridge scour information at ap proximately 3,300 bridge sites in Missouri. A data base management system has been established, and data col lection during field assessments currently (1994) is on going. The techniques developed to identify and rate bridges based on scour potential also are detailed in this report.
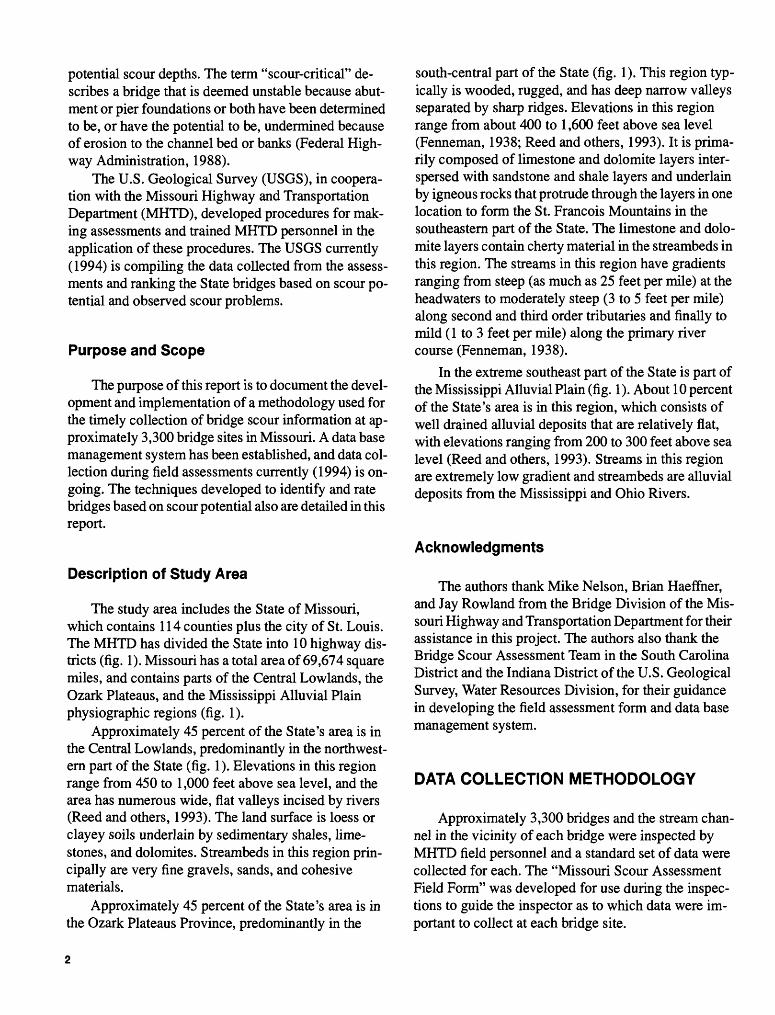
Description of Study Area
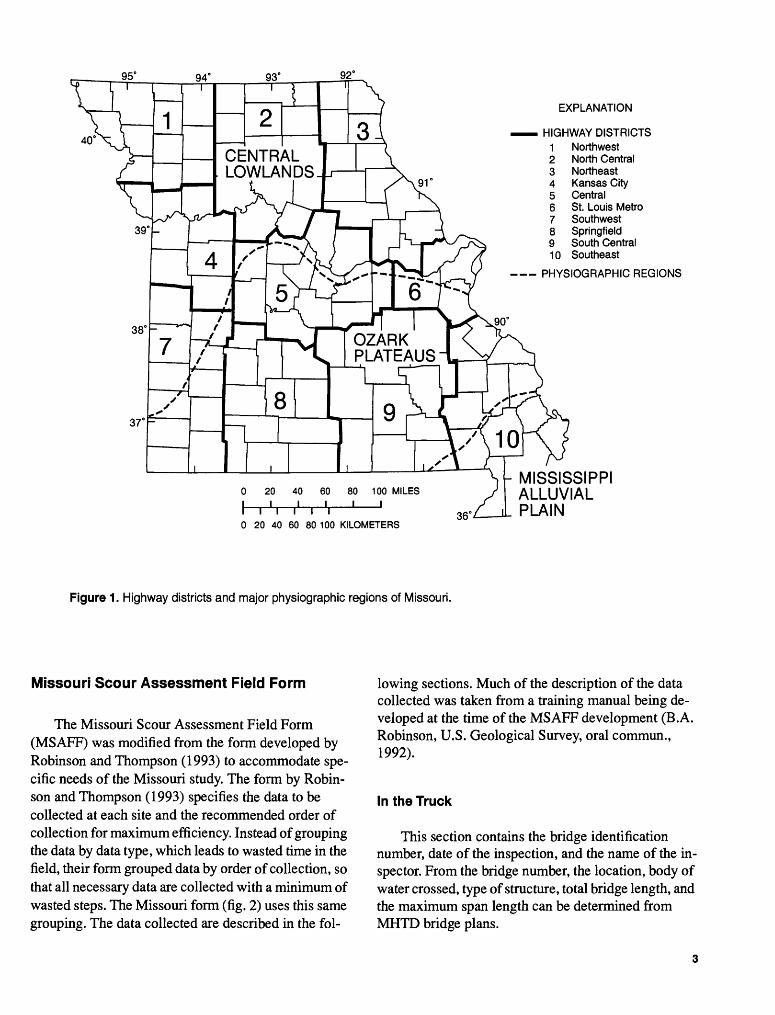
The study area includes the State of Missouri, which contains 114 counties plus the city of St. Louis. The MHTD has divided the State into 10 highway dis tricts (fig. 1). Missouri has a total area of 69,674 square miles, and contains parts of the Central Lowlands, the Ozark Plateaus, and the Mississippi Alluvial Plain physiographic regions (fig. 1).
Approximately 45 percent of the State's area is in the Central Lowlands, predominantly in the northwest ern part of the State (fig. 1). Elevations in this region range from 450 to 1,000 feet above sea level, and the area has numerous wide, flat valleys incised by rivers (Reed and others, 1993). The land surface is loess or clayey soils underlain by sedimentary shales, lime stones, and dolomites. Streambeds in this region prin cipally are very fine gravels, sands, and cohesive materials.
Approximately 45 percent of the State's area is in the Ozark Plateaus Province, predominantly in the
south-central part of the State (fig. 1). This region typ ically is wooded, rugged, and has deep narrow valleys separated by sharp ridges. Elevations in this region range from about 400 to 1,600 feet above sea level (Fenneman, 1938; Reed and others, 1993). It is prima rily composed of limestone and dolomite layers inter spersed with sandstone and shale layers and underlain by igneous rocks that protrude through the layers in one location to form the St. Francois Mountains in the southeastern part of the State. The limestone and dolo mite layers contain cherty material in the Streambeds in this region. The streams in this region have gradients ranging from steep (as much as 25 feet per mile) at the headwaters to moderately steep (3 to 5 feet per mile) along second and third order tributaries and finally to mild (1 to 3 feet per mile) along the primary river course (Fenneman, 1938).
In the extreme southeast part of the State is part of the Mississippi Alluvial Plain (fig. 1). About 10 percent of the State's area is in this region, which consists of well drained alluvial deposits that are relatively flat, with elevations ranging from 200 to 300 feet above sea level (Reed and others, 1993). Streams in this region are extremely low gradient and Streambeds are alluvial deposits from the Mississippi and Ohio Rivers.
Acknowledgments
The authors thank Mike Nelson, Brian Haefrner, and Jay Rowland from the Bridge Division of the Mis souri Highway and Transportation Department for their assistance in this project. The authors also thank the Bridge Scour Assessment Team in the South Carolina District and the Indiana District of the U.S. Geological Survey, Water Resources Division, for their guidance in developing the field assessment form and data base management system.
DATA COLLECTION METHODOLOGY
Approximately 3,300 bridges and the stream chan nel in the vicinity of each bridge were inspected by MHTD field personnel and a standard set of data were collected for each. The "Missouri Scour Assessment Field Form" was developed for use during the inspec tions to guide the inspector as to which data were im portant to collect at each bridge site.
95
CENTRAL LOWLANDS
OZARK PLATEAUS
EXPLANATION
HIGHWAY DISTRICTS Northwest North Central Northeast Kansas City CentralSt. Louis Metro Southwest Springfield South Central
10 Southeast
PHYSIOGRAPHIC REGIONS
0 20 40 60 80 100 MILES
l I I0 20 40 60 80 100 KILOMETERS
MISSISSIPPIALLUVIALPLAIN
Figure 1. Highway districts and major physiographic regions of Missouri.
Missouri Scour Assessment Field Form
The Missouri Scour Assessment Field Form (MSAFF) was modified from the form developed by Robinson and Thompson (1993) to accommodate spe cific needs of the Missouri study. The form by Robin son and Thompson (1993) specifies the data to be collected at each site and the recommended order of collection for maximum efficiency. Instead of grouping the data by data type, which leads to wasted time in the field, their form grouped data by order of collection, so that all necessary data are collected with a minimum of wasted steps. The Missouri form (fig. 2) uses this same grouping. The data collected are described in the fol
lowing sections. Much of the description of the data collected was taken from a training manual being de veloped at the time of the MSAFF development (B.A. Robinson, U.S. Geological Survey, oral commun., 1992).
In the Truck
This section contains the bridge identification number, date of the inspection, and the name of the in spector. From the bridge number, the location, body of water crossed, type of structure, total bridge length, and the maximum span length can be determined from MHTD bridge plans.

MISSOURI SCOUR ASSESSMENT FIELD FORM
Date:
Inspector:.
District*.
Bridge #_
Problem:
Followup:.
Action Taken:
QA:_
Data Input:_
Report QA:_
Date:
Date:.
Date:.
Date:.
Date:
From the Roadway
# of Bridges: L:_ R:
Landuse USLB: USRB:
Base Flow: 0 - No 1 - Yes
DSLB: DSRB: Overall:1-Urban 2-RowCrop 3-Pasture 4-Forest 5-SwampAVetland 6-Suburban 7-Brush
High Flow Angle of Approach: _____ + - RB Pushed - - LB Pushed
Upstream Channel Profile:_______ 1 - Pool 2 - Riffle
Picture from Bridge Looking US
Roll#:_______ Frame #:_ . Standing:.
Looking At:.
Picture from Bridge Looking DS
Roll #:_______ Frame #: . Standing:.
Looking At:.
Downstream Channel Profile: 1 - Pool 2 - Riffle
In the Upstream Channel
Meander Impacts: (1)_ Bank: Distance:
Distance:(2)____ Bank:____ ___________0 - No 1 - Yes 1 - LB 2 - RB 0 - At Bridge + - Upstream (ft)
(Beyond Bridge Right-of-Way for Bank and Channel Observations Only)
Bank Height Bank Angle % Veg Bank Bank (ft) Cover Material Erosion
LB RB LB RB LB RB LB RB LB RB
US Channel Width (ft). (At Bankfull Flow)
Picture from US Looking DS
Roll #:__________ Frame #:_
Looking At:_____________
1 - Sand 0 - None2 - Slt/Cl 1 - Mass Wasting3 - Gravel 2 - Fluvial4 - Cbl/Boldr5 - Bedrock6 - Con/Steel
Standing:.
Comments
Confluence #1:_
Confluence #2:__
.(ft) Entry:.
. (ft) Entry:.
Confluence #3:_ ____ 0 - No + - US 1 - Yes - - DS
(ft) Entry:.1-LB2-RB
Figure 2. The Missouri Scour Assessment Field Form.
4
Plan View Sketch of Site

Point Bar:
In the Upstream Channel (cont)
Point Bar Location:___% to ___% Distance to Mid Bar: .(ft) Mid Bar Width:.O-No l-Yes (AtBankfullDischarge) 0%-LB 100%-RB +-US --DS
Cut Bank:______ Cut Bank Location:______ Distance to Mid Cut Bank:_____
O-No l-Yes 1 - LB 2 - RB + - US - - DS
.(ft)
Sketch of Bridge Opening/Channel Cross Section at Upstream Side of Bridge
Under the Bridge
Underclearance from channel Bed to Low Steel: (ft) F999if>351 Water Deoth in channel:
Flow Deflected by Debris: 0
#0f
Shape Columns (If Shape -) (4, 5, or 6)
1-
2-
3-
4-
5-
6-
7-
8-
9-
Shape 1 -Squared 2 - Rounded 3 - Pointed 4 - Square Columns 5 - Round Column 6 - Pointed Columns
Impact Point: Distance to Impact Point:
(ft)
(ft)
-No l-Yes 1-LB 2-RB +-US 0-AtBridge --DS
Piers and ColumnsAttack Pier Pier Pier Local Footing
Diagonal Angle Location Width Length Scour Exposure (If Shape-) (feet) (feet) (4, 5, or 6)
012 012
0 1 2
0 1 2
0 1 2
0 1 2
0 1 2
0 1 2
0 1 2
0 1 2Diagonal Angle Pier Location Scour O-No +-RB Pushed LFP or RFP - Left (or R) Flood Plain 0-None l-Yes - - LB Pushed LTB or RTB - Left (or R) Top Bank 1 - Observed
LB or RB - Left (or R) Bank 2 - Unknown MCL or MCR - Main Channel Left (or R) MCM - Main Channel Middle
0 1 2
0 1 2
0 1 2
0 1 2
0 1 2
0 1 2
0 1 2
0 1 2Exposure 0 - None 1 - Footing 2 -Piles
Figure 2. The Missouri Scour Assessment Field Form-Continued.

Attack Angle
Toe Location
Left Abut:
Under the Bridge (cont)
AbutmentsFace Slope
(ft) _____
Footing Exposed
Piles Exposed
Guide Banks
Right Abut:.+ -RB Pushed --LB Pushed
_(ft)
Riprap
Present Condition(IfPres-l)
Past Bank into Stream 1 - Sloping Even w/ Bank 2 - Vertical Set Back from Bank
Bed Material
US:__ Under Bridge:__ DS:_
0 - No 1 - Yes
Debris
Accumulation:__ 0 - No 1 - Yes
US LB:US L WW:.L Abut:LB:DS L WW:.DS LB:US RB:USRWW:.R Abut:RB:DSRWW:.DS RB:Bed:
1 - Sand 3 - Gravel 5 - Bedrock 7 - Con/Steel 2-Slt/Cl 4 - Cbl/Boldr 6 - Undeter
Channel
Horizontal:0%-LB
%to
Vertical: %to
_%-RB
%
Width Under Bridge: (At Bankfull How)
.(ft)0%-Bed 100%-Low Steel
Debris Potential
Type of Material:_ 1 - Brush 2-Whole Trees
3 - Trash4-All Others
Debris Potential:
Present
1-___
0 - Low 1 - Medium 2 - High
Scour Holes
Stream Pos. Channel Pos. Width
0-Absent 2-Good Cond 1 - Present 3 - Partial
4 - Slumped
2-____ 0 - Absent 1 - Present
____(ft) ____%
_____(ft) ____% + - US LB - 0% 0 - Under Bridge RB - 100% --DS
In the Downstream Channel
-(ft)
.(ft)
Length Depth
____(ft) ____(ft)
____(ft) ____(ft)
(Beyond Bridge Right-of-Way for Bank and Channel Observations Only) Bank Height Bank Angle % Veg Bank Bank
(ft) Cover Material Erosion LB RB LB RB LB RB LB RB LB RB
DS Channel Width (ft):.
Stage of Reach Evolutic1 - Undisturbed 2 - Constructed 3 - Degradation w/
Bank Failure
>n:4 - Aggradation 5 -Vertically Stable 6 - Lateral Migration
1 -Sand 2 - Slt/Cl 3 - Gravel 4 - Cbl/Bold 5 - Bedrock 6 - Con/Steel
0 - None 1 - Mass Wasting 2 - Fluvial
Picture from DS Looking US
Roll#:__________ Frame #:.
Looking At_____________
Standing:.
Roll # Frame # Standing
Additional Photographs
Looking At Comments
Figure 2. The Missouri Scour Assessment Field Form-Continued.
6
From the Roadway
This section contains information about the overall condition of the bridge site. The number of overflow bridges to the left and right of the bridge and the rela tion of discharge at the site to base-flow conditions are recorded in this section.
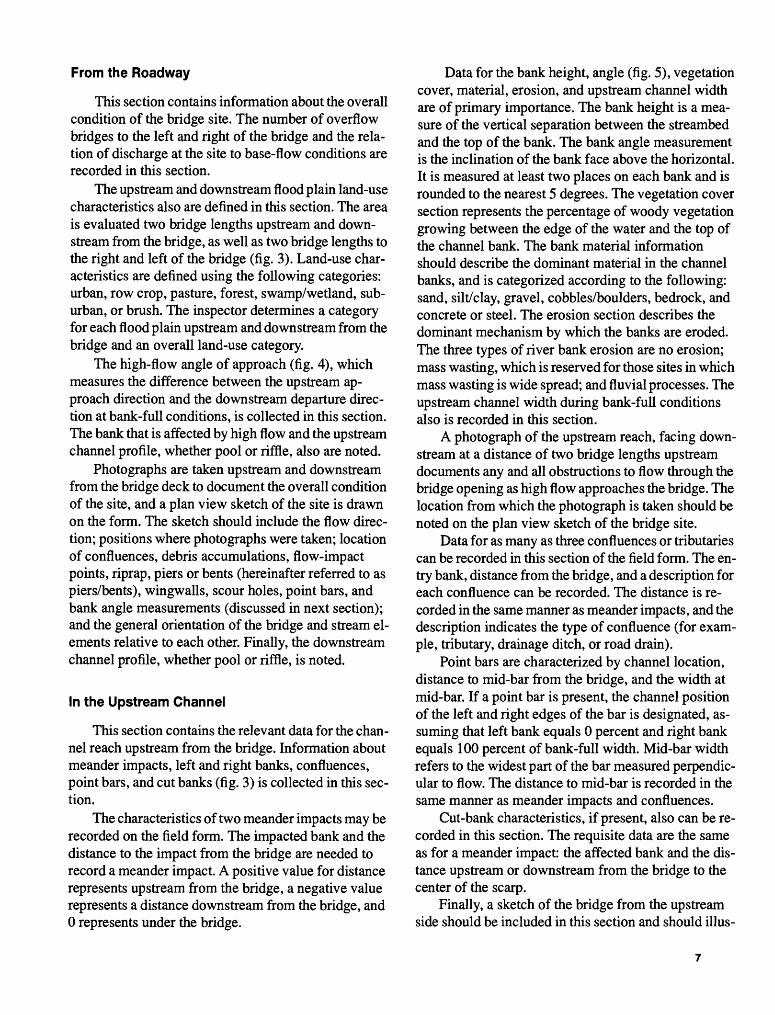
The upstream and downstream flood plain land-use characteristics also are defined in this section. The area is evaluated two bridge lengths upstream and down stream from the bridge, as well as two bridge lengths to the right and left of the bridge (fig. 3). Land-use char acteristics are defined using the following categories: urban, row crop, pasture, forest, swamp/wetland, sub urban, or brush. The inspector determines a category for each flood plain upstream and downstream from the bridge and an overall land-use category.
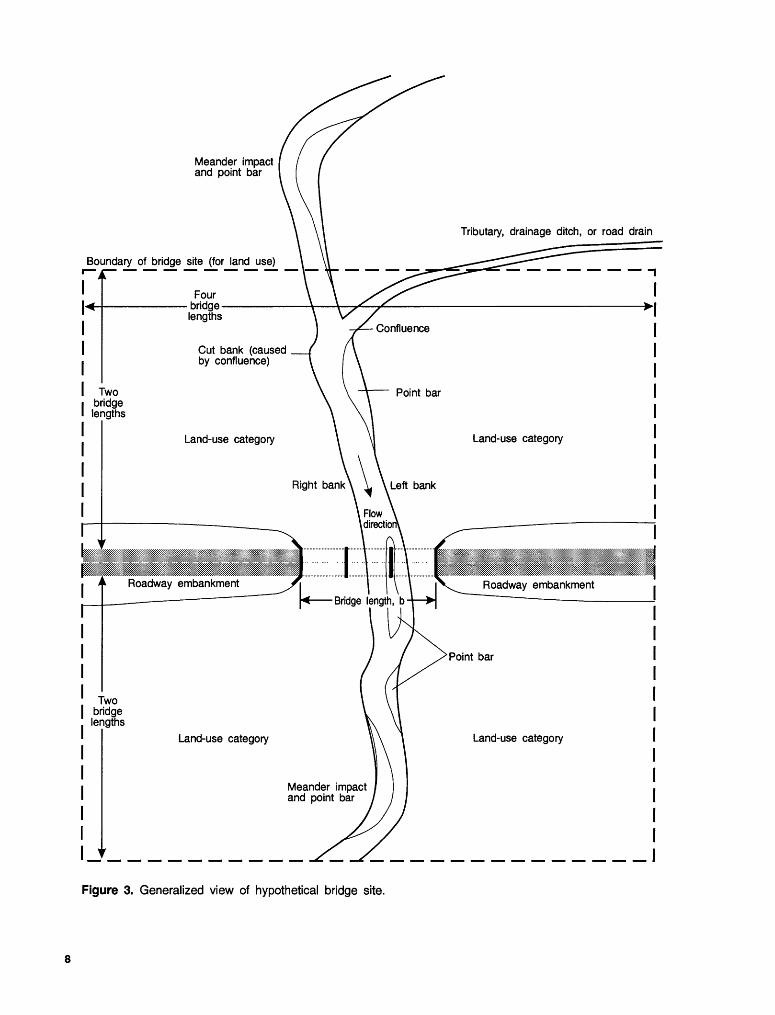
The high-flow angle of approach (fig. 4), which measures the difference between the upstream ap proach direction and the downstream departure direc tion at bank-full conditions, is collected in this section. The bank that is affected by high flow and the upstream channel profile, whether pool or riffle, also are noted.
Photographs are taken upstream and downstream from the bridge deck to document the overall condition of the site, and a plan view sketch of the site is drawn on the form. The sketch should include the flow direc tion; positions where photographs were taken; location of confluences, debris accumulations, flow-impact points, riprap, piers or bents (hereinafter referred to as piers/bents), wingwalls, scour holes, point bars, and bank angle measurements (discussed in next section); and the general orientation of the bridge and stream el ements relative to each other. Finally, the downstream channel profile, whether pool or riffle, is noted.
In the Upstream Channel
This section contains the relevant data for the chan nel reach upstream from the bridge. Information about meander impacts, left and right banks, confluences, point bars, and cut banks (fig. 3) is collected in this sec tion.
The characteristics of two meander impacts may be recorded on the field form. The impacted bank and the distance to the impact from the bridge are needed to record a meander impact. A positive value for distance represents upstream from the bridge, a negative value represents a distance downstream from the bridge, and 0 represents under the bridge.
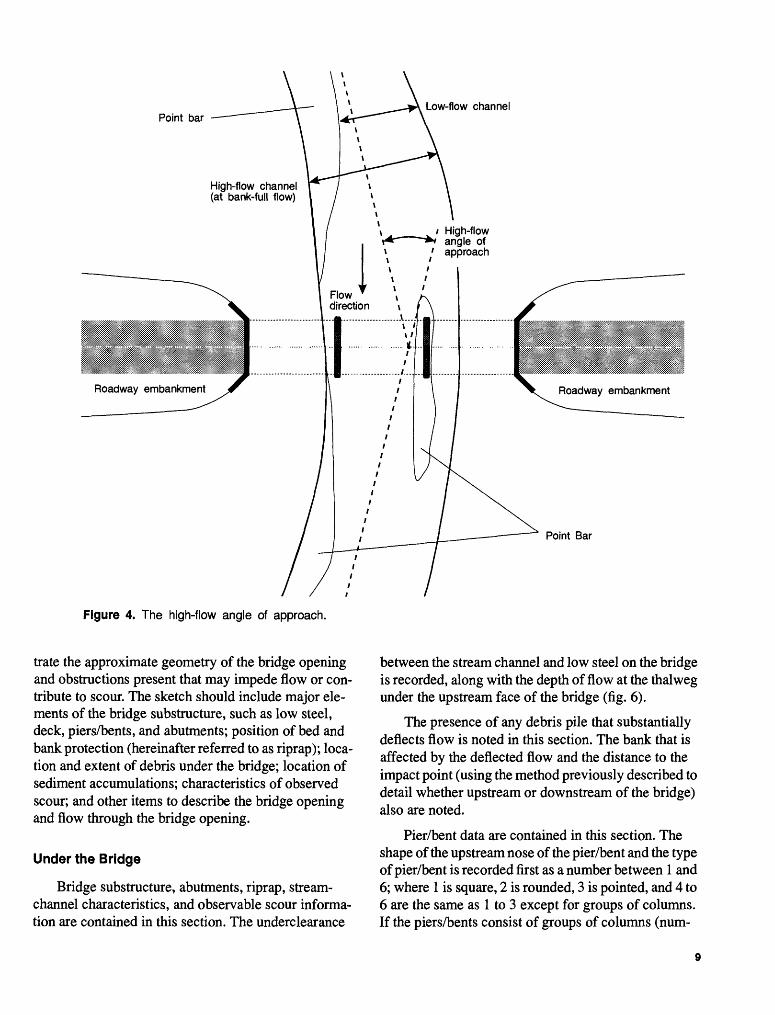
Data for the bank height, angle (fig. 5), vegetation cover, material, erosion, and upstream channel width are of primary importance. The bank height is a mea sure of the vertical separation between the streambed and the top of the bank. The bank angle measurement is the inclination of the bank face above the horizontal. It is measured at least two places on each bank and is rounded to the nearest 5 degrees. The vegetation cover section represents the percentage of woody vegetation growing between the edge of the water and the top of the channel bank. The bank material information should describe the dominant material in the channel banks, and is categorized according to the following: sand, silt/clay, gravel, cobbles/boulders, bedrock, and concrete or steel. The erosion section describes the dominant mechanism by which the banks are eroded. The three types of river bank erosion are no erosion; mass wasting, which is reserved for those sites in which mass wasting is wide spread; and fluvial processes. The upstream channel width during bank-full conditions also is recorded in this section.
A photograph of the upstream reach, facing down stream at a distance of two bridge lengths upstream documents any and all obstructions to flow through the bridge opening as high flow approaches the bridge. The location from which the photograph is taken should be noted on the plan view sketch of the bridge site.
Data for as many as three confluences or tributaries can be recorded in this section of the field form. The en try bank, distance from the bridge, and a description for each confluence can be recorded. The distance is re corded in the same manner as meander impacts, and the description indicates the type of confluence (for exam ple, tributary, drainage ditch, or road drain).
Point bars are characterized by channel location, distance to mid-bar from the bridge, and the width at mid-bar. If a point bar is present, the channel position of the left and right edges of the bar is designated, as suming that left bank equals 0 percent and right bank equals 100 percent of bank-full width. Mid-bar width refers to the widest part of the bar measured perpendic ular to flow. The distance to mid-bar is recorded in the same manner as meander impacts and confluences.
Cut-bank characteristics, if present, also can be re corded in this section. The requisite data are the same as for a meander impact: the affected bank and the dis tance upstream or downstream from the bridge to the center of the scarp.
Finally, a sketch of the bridge from the upstream side should be included in this section and should illus-
Meander impact and point bar
Tributary, drainage ditch, or road drain
Boundary of bridge site (for land use)
Four bridge lengths
Cut bank (caused by confluence)
Two bridge lengths
Land-use categoryLand-use category
Right bank \ V. \ Left bank
Roadway embankment Roadway embankment
Two bridge lengths
Land-use categoryLand-use category
Meander impact and point bar
Figure 3. Generalized view of hypothetical bridge site.
Low-flow channelPoint bar
High-flow channel (at bank-full flow)
High-flow angle of approach
Point Bar
Figure 4. The high-flow angle of approach.
trate the approximate geometry of the bridge opening and obstructions present that may impede flow or con tribute to scour. The sketch should include major ele ments of the bridge substructure, such as low steel, deck, piers/bents, and abutments; position of bed and bank protection (hereinafter referred to as riprap); loca tion and extent of debris under the bridge; location of sediment accumulations; characteristics of observed scour; and other items to describe the bridge opening and flow through the bridge opening.
Under the Bridge
Bridge substructure, abutments, riprap, stream- channel characteristics, and observable scour informa tion are contained in this section. The underclearance
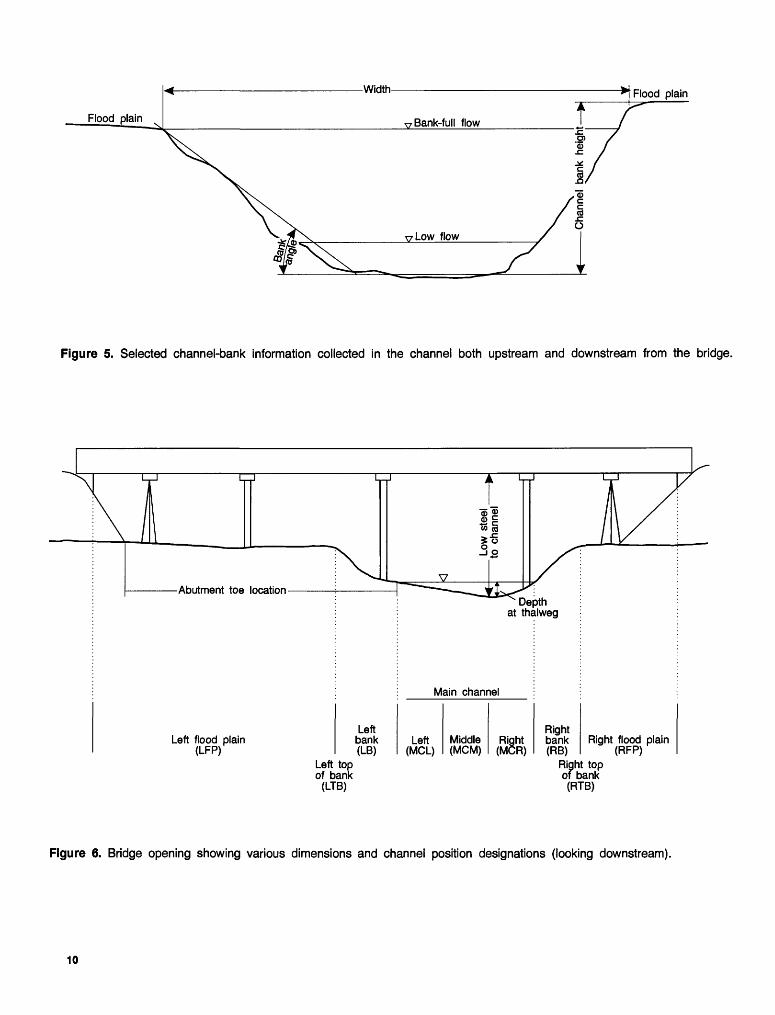
between the stream channel and low steel on the bridge is recorded, along with the depth of flow at the thalweg under the upstream face of the bridge (fig. 6).
The presence of any debris pile that substantially deflects flow is noted in this section. The bank that is affected by the deflected flow and the distance to the impact point (using the method previously described to detail whether upstream or downstream of the bridge) also are noted.
Pier/bent data are contained in this section. The shape of the upstream nose of the pier/bent and the type of pier/bent is recorded first as a number between 1 and 6; where 1 is square, 2 is rounded, 3 is pointed, and 4 to 6 are the same as 1 to 3 except for groups of columns. If the piers/bents consist of groups of columns (num-
__ Flood plain X7 Bank-full flow J,
*q Mood piain
r
Figure 5. Selected channel-bank information collected in the channel both upstream and downstream from the bridge.
Depth at thalweg
Main channel
Left flood plain (LFP)
Left bank (LB)
Left topof bank
(LTB)
Left (MCL)
Middle (MCM)
Right (MCR)
Rightbank (RB)
Right flood (RFP)
Right topof bank(RTB)
plain
Figure 6. Bridge opening showing various dimensions and channel position designations (looking downstream).
10
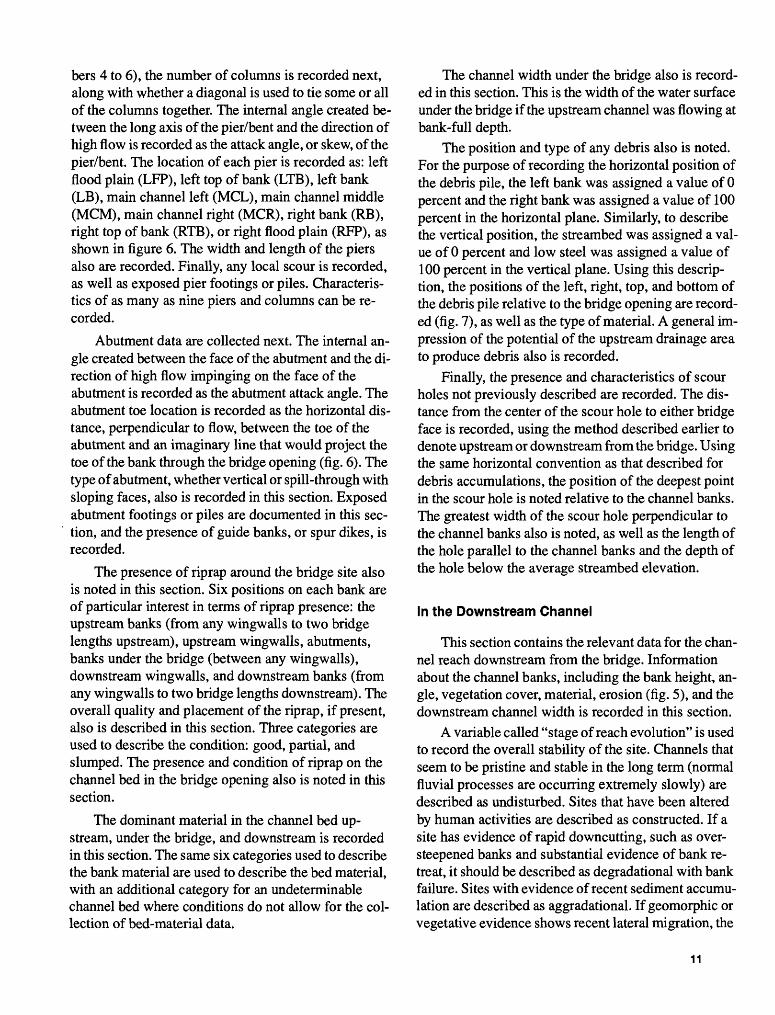
bers 4 to 6), the number of columns is recorded next, along with whether a diagonal is used to tie some or all of the columns together. The internal angle created be tween the long axis of the pier/bent and the direction of high flow is recorded as the attack angle, or skew, of the pier/bent. The location of each pier is recorded as: left flood plain (LFP), left top of bank (LTB), left bank (LB), main channel left (MCL), main channel middle (MCM), main channel right (MCR), right bank (RB), right top of bank (RTB), or right flood plain (RFP), as shown in figure 6. The width and length of the piers also are recorded. Finally, any local scour is recorded, as well as exposed pier footings or piles. Characteris tics of as many as nine piers and columns can be re corded.
Abutment data are collected next. The internal an gle created between the face of the abutment and the di rection of high flow impinging on the face of the abutment is recorded as the abutment attack angle. The abutment toe location is recorded as the horizontal dis tance, perpendicular to flow, between the toe of the abutment and an imaginary line that would project the toe of the bank through the bridge opening (fig. 6). The type of abutment, whether vertical or spill-through with sloping faces, also is recorded in this section. Exposed abutment footings or piles are documented in this sec tion, and the presence of guide banks, or spur dikes, is recorded.
The presence of riprap around the bridge site also is noted in this section. Six positions on each bank are of particular interest in terms of riprap presence: the upstream banks (from any wingwalls to two bridge lengths upstream), upstream wingwalls, abutments, banks under the bridge (between any wingwalls), downstream wingwalls, and downstream banks (from any wingwalls to two bridge lengths downstream). The overall quality and placement of the riprap, if present, also is described in this section. Three categories are used to describe the condition: good, partial, and slumped. The presence and condition of riprap on the channel bed in the bridge opening also is noted in this section.
The dominant material in the channel bed up stream, under the bridge, and downstream is recorded in this section. The same six categories used to describe the bank material are used to describe the bed material, with an additional category for an undeterminable channel bed where conditions do not allow for the col lection of bed-material data.
The channel width under the bridge also is record ed in this section. This is the width of the water surface under the bridge if the upstream channel was flowing at bank-full depth.
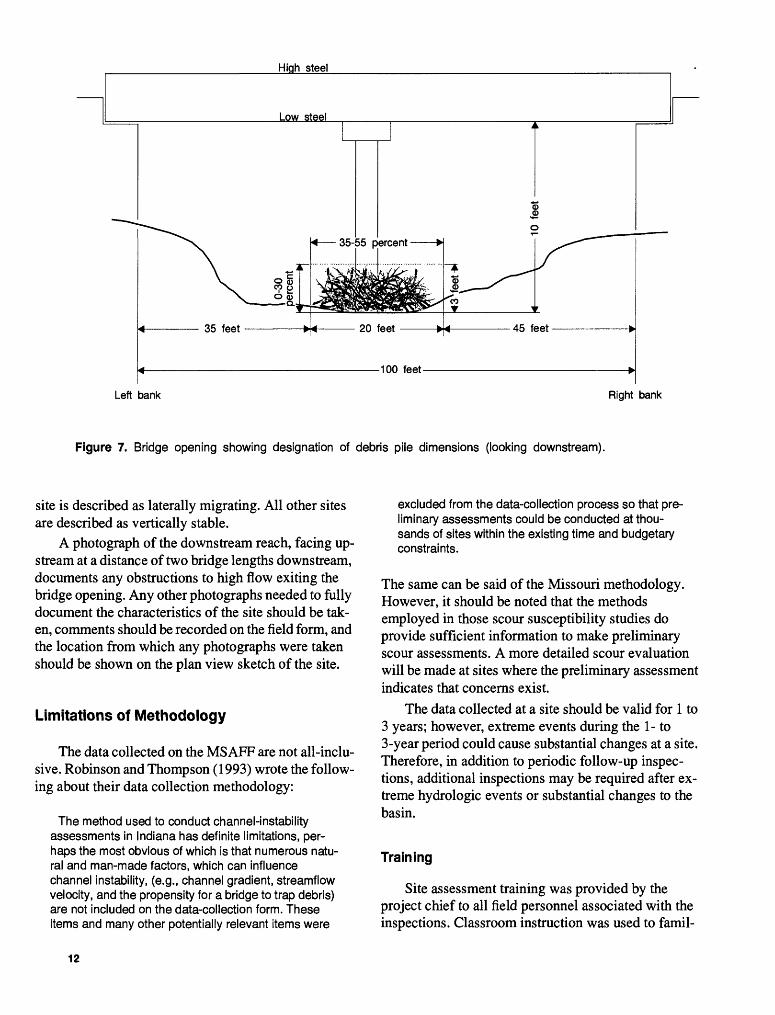
The position and type of any debris also is noted. For the purpose of recording the horizontal position of the debris pile, the left bank was assigned a value of 0 percent and the right bank was assigned a value of 100 percent in the horizontal plane. Similarly, to describe the vertical position, the streambed was assigned a val ue of 0 percent and low steel was assigned a value of 100 percent in the vertical plane. Using this descrip tion, the positions of the left, right, top, and bottom of the debris pile relative to the bridge opening are record ed (fig. 7), as well as the type of material. A general im pression of the potential of the upstream drainage area to produce debris also is recorded.
Finally, the presence and characteristics of scour holes not previously described are recorded. The dis tance from the center of the scour hole to either bridge face is recorded, using the method described earlier to denote upstream or downstream from the bridge. Using the same horizontal convention as that described for debris accumulations, the position of the deepest point in the scour hole is noted relative to the channel banks. The greatest width of the scour hole perpendicular to the channel banks also is noted, as well as the length of the hole parallel to the channel banks and the depth of the hole below the average streambed elevation.
In the Downstream Channel
This section contains the relevant data for the chan nel reach downstream from the bridge. Information about the channel banks, including the bank height, an gle, vegetation cover, material, erosion (fig. 5), and the downstream channel width is recorded in this section.
A variable called "stage of reach evolution" is used to record the overall stability of the site. Channels that seem to be pristine and stable in the long term (normal fluvial processes are occurring extremely slowly) are described as undisturbed. Sites that have been altered by human activities are described as constructed. If a site has evidence of rapid downcutting, such as over- steepened banks and substantial evidence of bank re treat, it should be described as degradational with bank failure. Sites with evidence of recent sediment accumu lation are described as aggradational. If geomorphic or vegetative evidence shows recent lateral migration, the
11
High steel
Left bank Right bank
Figure 7. Bridge opening showing designation of debris pile dimensions (looking downstream).
site is described as laterally migrating. All other sites are described as vertically stable.
A photograph of the downstream reach, facing up stream at a distance of two bridge lengths downstream, documents any obstructions to high flow exiting the bridge opening. Any other photographs needed to fully document the characteristics of the site should be tak en, comments should be recorded on the field form, and the location from which any photographs were taken should be shown on the plan view sketch of the site.
Limitations of Methodology
The data collected on the MSAFF are not all-inclu sive. Robinson and Thompson (1993) wrote the follow ing about their data collection methodology:
The method used to conduct channel-instability assessments in Indiana has definite limitations, per haps the most obvious of which is that numerous natu ral and man-made factors, which can influence channel instability, (e.g., channel gradient, streamflow velocity, and the propensity for a bridge to trap debris) are not included on the data-collection form. These items and many other potentially relevant items were
excluded from the data-collection process so that pre liminary assessments could be conducted at thou sands of sites within the existing time and budgetary constraints.
The same can be said of the Missouri methodology. However, it should be noted that the methods employed in those scour susceptibility studies do provide sufficient information to make preliminary scour assessments. A more detailed scour evaluation will be made at sites where the preliminary assessment indicates that concerns exist.
The data collected at a site should be valid for 1 to 3 years; however, extreme events during the 1- to 3-year period could cause substantial changes at a site. Therefore, in addition to periodic follow-up inspec tions, additional inspections may be required after ex treme hydrologic events or substantial changes to the basin.
Training
Site assessment training was provided by the project chief to all field personnel associated with the inspections. Classroom instruction was used to famil-
12
iarize the inspectors with the objectives of the project, the concepts behind bridge scour, and the procedure for assessing sites. The proper use of the field form, includ ing the concepts behind the variables on the form, and data-collection procedures and tools were intently fo cused on during the classroom instruction.
The training participants were guided through the assessment process at several sites and instructed on how to complete the field form. After each participant completed the assessments, the group discussed specif ic questions pertaining to the assessment procedure, sit uations they encountered during the data collection, and any differences in values they had noted on the forms.
ASSESSMENT OF BRIDGE SITES FOR OBSERVED SCOUR AND SCOUR POTENTIAL
All of the bridge sites in Missouri that are over wa ter have been inspected and are included in the Missou ri Bridge Scour Data Base (MBSD). This data base can be used to retrieve information regarding the field in spection of any bridge site and information about the preliminary assessment of potential scour and observed scour at the site.
Missouri Bridge Scour Data Base
The MBSD is used to store and manipulate data collected during field inspection. The data from the MSAFF are entered into the MBSD, using screen entry forms that have been designed to match the field form, and then are stored in a tabular format. A bridge site data record stored in the MBSD can be updated, print ed, and tabulated with other bridge site data records ac cording to any number of identification criteria (for example, structure number, county number, entry date, and inspector). Several bridge inspections for a single structure can be stored in the MBSD, which provides the ability to observe changes and long-term trends from previous inspections to recent inspections.
As the data are entered into the data base, they are checked for accuracy against information on the field form, and potential and observed scour indices are cal culated. If an unusual index value is encountered, the data record in the data base is re-examined to locate the cause of the unusual index value. In this way, each
record receives at least one secondary check to ensure data quality.
An observed scour index and a potential scour in dex are calculated for each site using several critical channel characteristics. The results from the index cal culations can be seen onscreen or output as a form, and all sites in the data base (or any subset thereof) can be sorted and tabulated based on observed or potential scour. Computation of the observed and potential scour index values is described in the next two sections.
Observed Scour Index Variables and Values
The most definitive indication of the scour suscep tibility of a bridge is the presence of scour at the bridge site. Local scour around the bridge piers/bents and abutments and contraction scour of the channel bed and banks give an indication of the hydraulic and geomor- phic processes occurring in the vicinity of the bridge. To rate the bridges in Missouri, an observed scour in dex was used in addition to the potential scour index to help define which bridges in the State were susceptible to bridge scour. The observed scour index value for a particular site is the summation of the ranking values assigned to specific site characteristics (table 1). Sever al of the variables examined correspond to those used by Simon and others (1989).
The strongest evidence of scour at a bridge is around the piers and abutments. There are several lev els of observable scour at piers and abutments, and these are assigned various index values according to their severity. Scour at the piers/bents will be addressed first followed by a discussion of scour at the abutments.
Piers are the primary support elements for the bridge, often supported by a footing resting on piles. If no scour is observed at the piers, a 0 index value is as signed to that pier or bent. If some scour is observed, but the footings or piles are not exposed, an index value of 2 is assigned. This indicates that some scour is present, but it is not threatening the pier. If the footing is exposed, an index value of 4 is assigned because the pier support is being threatened. Finally, if the footing and piles of a pier or if a large length of the piles of a pile bent are exposed, an index value of 6 is assigned. Piles are the primary bearing elements of piers and bents, and, if there is a large amount of exposure, the bearing capacity of the piers or bents may be greatly decreased. If the piers are in water deep enough to pre vent observation, the scour is unknown, an index value
13
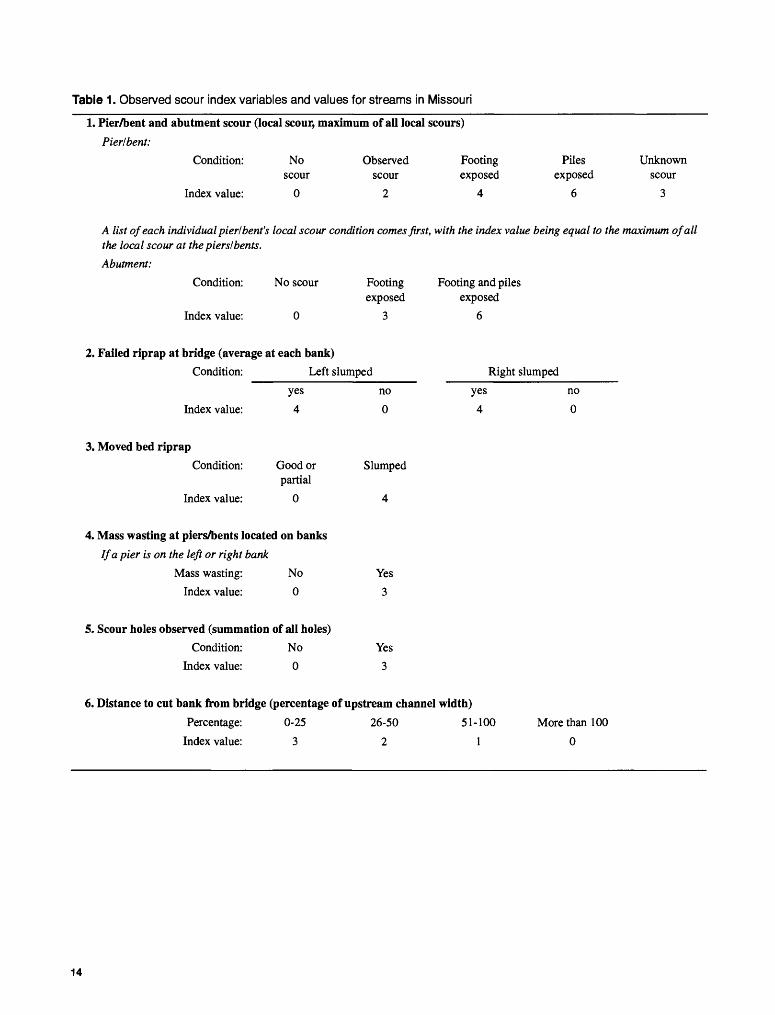
Table 1. Observed scour index variables and values for streams in Missouri
1. Pier/bent and abutment scour (local scour, maximum of all local scours)
Pier/bent:
Condition: No Observed Footing scour scour exposed
Index value: 024
Piles exposed
6
Unknown scour
3
A list of each individual pier/bent's local scour condition comes first, with the index value being equal to the maximum of all the local scour at the pierslbents.
Abutment:
Condition:
Index value:
No scour Footing exposed
3
Footing and piles exposed
6
2. Failed riprap at bridge (average at each bank)Condition: Left slumped
Index value:
yes
4
no
0
Right slumped
yes
4
no
0
3. Moved bed riprapCondition:
Index value:
Good or partial
0
Slumped
4
4. Mass wasting at piers/bents located on banksIf a pier is on the left or right bank
Mass wasting: No
Index value: 0Yes
3
5. Scour holes observed (summation of all holes)Condition: No Yes
Index value: 0 3
6. Distance to cut bank from bridge (percentage of upstream channel width)Percentage: 0-25 26-50 51-100 More than 100
Index value: 3210
14
of 3 is assigned to the pier or bent, and the observed lo cal scour variable is flagged as incomplete. A more thorough onsite examination may be warranted. Once the local scour values at all of the piers/bents have been assigned, the largest index value is taken to provide a maximum local scour index value.
Local scour at the abutments is evaluated in a sim ilar manner. If no scour is observed at an abutment, a 0 index value is assigned to the variable. The presence of scour at the abutments indicates that the embankment fill is being eroded by high streamflow or road runoff. Loss of embankment fill can cause destabilization of the structure and, ultimately, failure. An index value of 3 is assigned to the variable if the footing is exposed. If the footing and the piles are exposed, an index value of 6 is assigned to the variable because the support of the structure is decreased. Each abutment is considered separately.
Another indicator of scour problems at a bridge is the condition of the riprap, if present, on the banks and bed. Unstable, slumped bank riprap is an indication of bank instability or high-energy streamflow near the bridge. If the bank protection can be destabilized by the channel or flow conditions, then the bridge structure may be threatened. If riprap is present, the average con dition along each bank is recorded as the index value; slumped riprap is assigned an index value of 4 and un- slumped riprap is assigned a 0. For example, if there are no wingwalls, but there is riprap along the left and right banks upstream and downstream, and the riprap under the bridge has slumped on the right bank but not on the abutment, the recorded index value would be:
uslb-good l_abut-good brlb-good dslb-good - total Ib cond
0 + 0 + 0 +0 -0/4-0
usrb-good r_abut-good brrb-slumped dsrb-good - total rb cond
0 + 0 + 4 +0 -4/4-1
Likewise, if streamflow can move the riprap, degradation can occur, causing bank failure and possible undermining and destabilization of the structure. Bed protection that has moved would be assigned an index value of 4.
The phenomenon of mass wasting along the banks is examined in the potential scour index, but when a pier or bent exists along the bank, mass wasting be comes an element of observed scour. Mass wasting is an indication of an unstable bank condition and also may indicate extreme geomorphic changes occurring upstream or downstream from the bridge. An unstable
bank close to a pier or bent cannot only undermine the piers or bents, but also could impose lateral strains on the piers or bents. If a pier or bent is present on a bank where mass wasting is occurring, an index value of 3 is assigned for each pier/bent.
Observed scour holes are indicative of local scour. The presence and characteristics of two scour holes can be listed on the MHTD field sheet, and for each scour hole present, an index value of 3 is added to this vari able.
Cut banks are evidence of scour as a result of me ander impacts, debris-pile-deflected flow impact, or confluence-deflected flow impacts on a bank. The prox imity of a cut bank to the bridge provides some indica tion of the severity of scour caused by the cut bank. Therefore, as the distance from the cut bank to the bridge increases, the index value assigned to this vari able decreases.
The total of all the index values called the ob served scour index-is an indication of the observed scour at a bridge site. The maximum index value for the observed scour is 45.
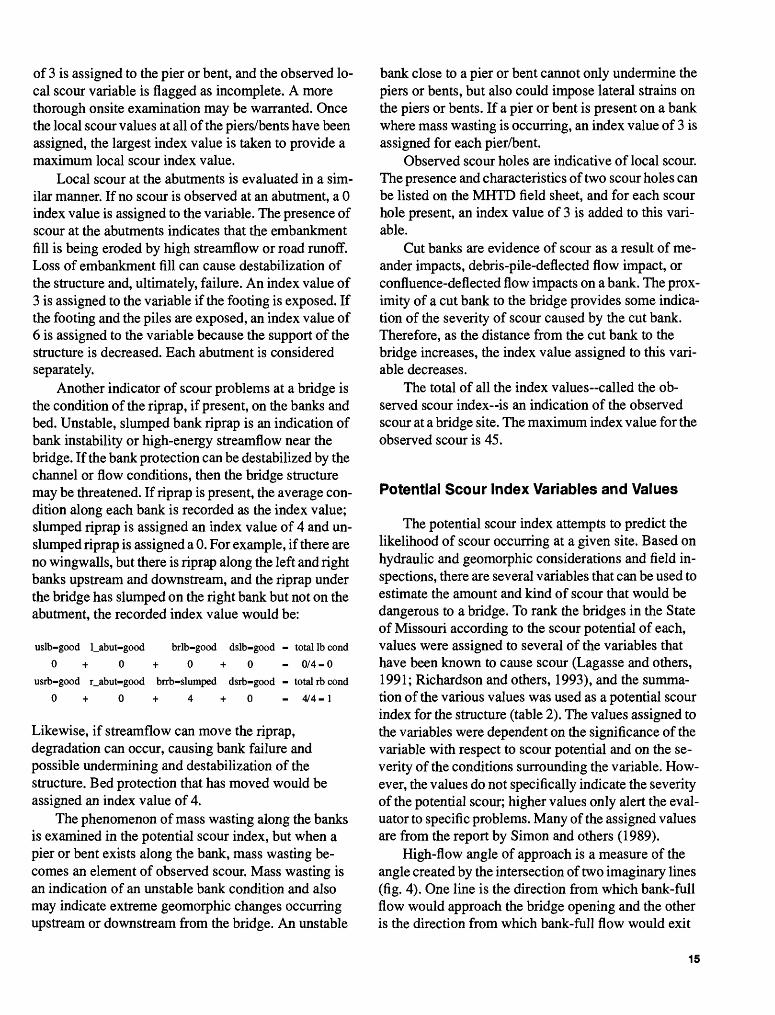
Potential Scour Index Variables and Values
The potential scour index attempts to predict the likelihood of scour occurring at a given site. Based on hydraulic and geomorphic considerations and field in spections, there are several variables that can be used to estimate the amount and kind of scour that would be dangerous to a bridge. To rank the bridges in the State of Missouri according to the scour potential of each, values were assigned to several of the variables that have been known to cause scour (Lagasse and others, 1991; Richardson and others, 1993), and the summa tion of the various values was used as a potential scour index for the structure (table 2). The values assigned to the variables were dependent on the significance of the variable with respect to scour potential and on the se verity of the conditions surrounding the variable. How ever, the values do not specifically indicate the severity of the potential scour; higher values only alert the eval- uator to specific problems. Many of the assigned values are from the report by Simon and others (1989).
High-flow angle of approach is a measure of the angle created by the intersection of two imaginary lines (fig. 4). One line is the direction from which bank-full flow would approach the bridge opening and the other is the direction from which bank-full flow would exit
15
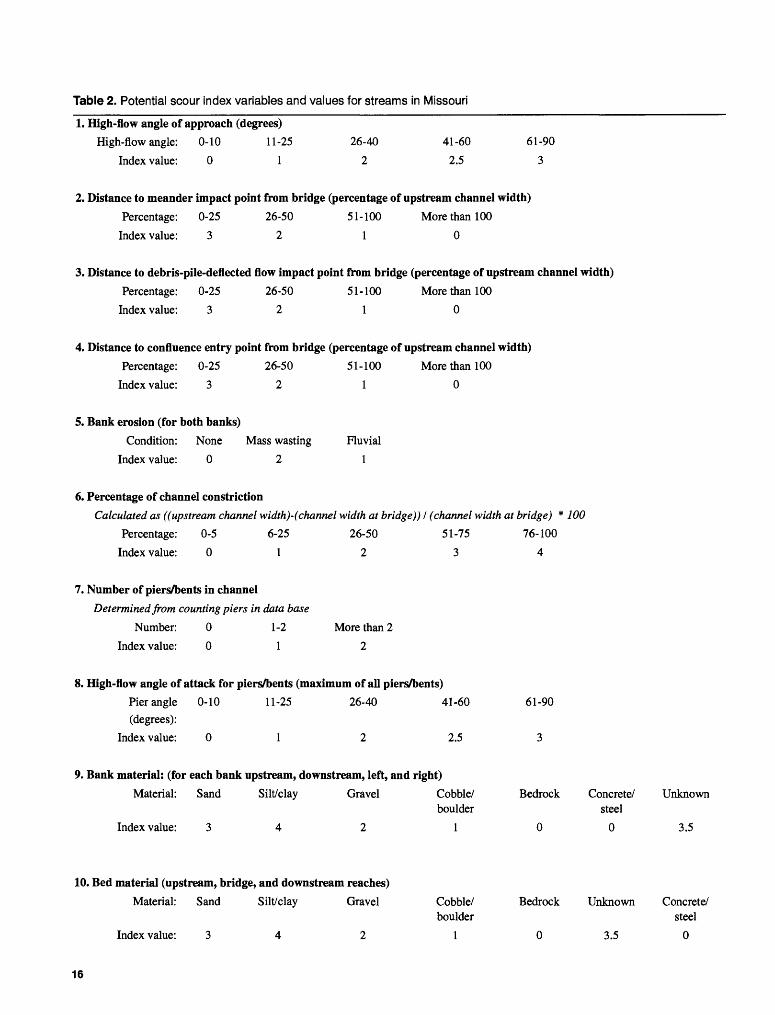
Table 2. Potential scour index variables and values for streams in Missouri
1. High-flow angle of approach (degrees)
High-flow angle: 0-10 11-25
Index value: 0 1
26-40
2
41-60
2.5
61-90
3
2. Distance to meander impact point from bridge (percentage of upstream channel width)
Percentage: 0-25 26-50 51-100 More than 100
Index value: 321 0
3. Distance to debris-pile-deflected flow impact point from bridge (percentage of upstream channel width)
Percentage: 0-25 26-50 51-100 More than 100
Index value: 321 0
4. Distance to confluence entry point from bridge (percentage of upstream channel width)
Percentage: 0-25 26-50 51-100 More than 100
Index value: 321 0
5. Bank erosion (for both banks)
Condition: None Mass wasting Fluvial
Index value: 0 2 1
6. Percentage of channel constriction
Calculated as ((upstream channel width)-(channel width at bridge)) I (channel width at bridge) * 100
Percentage: 0-5 6-25 26-50 51-75 76-100
Index value: 012 34
7. Number of piers/bents in channel
Determined from counting piers in data base
Number: 0 1-2
Index value: 0 1
More than 2
2
8. High-flow angle of attack for piers/bents (maximum of all piers/bents)
Pier angle 0-10 11-25 26-40 41-60 (degrees):
Index value: 01 2 2.5
61-90
3
9. Bank material: (for each bank upstream, downstream, left, and right)
Material: Sand Silt/clay Gravel Cobble/ Bedrockboulder
Index value: 342 10
Concrete/ Unknown steel
0 3.5
10. Bed material (upstream, bridge, and downstream reaches)
Material: Sand Silt/clay Gravel
Index value: 34 2
Cobble/ boulder
1
Bedrock Unknown
3.5
Concrete/ steel
0
16
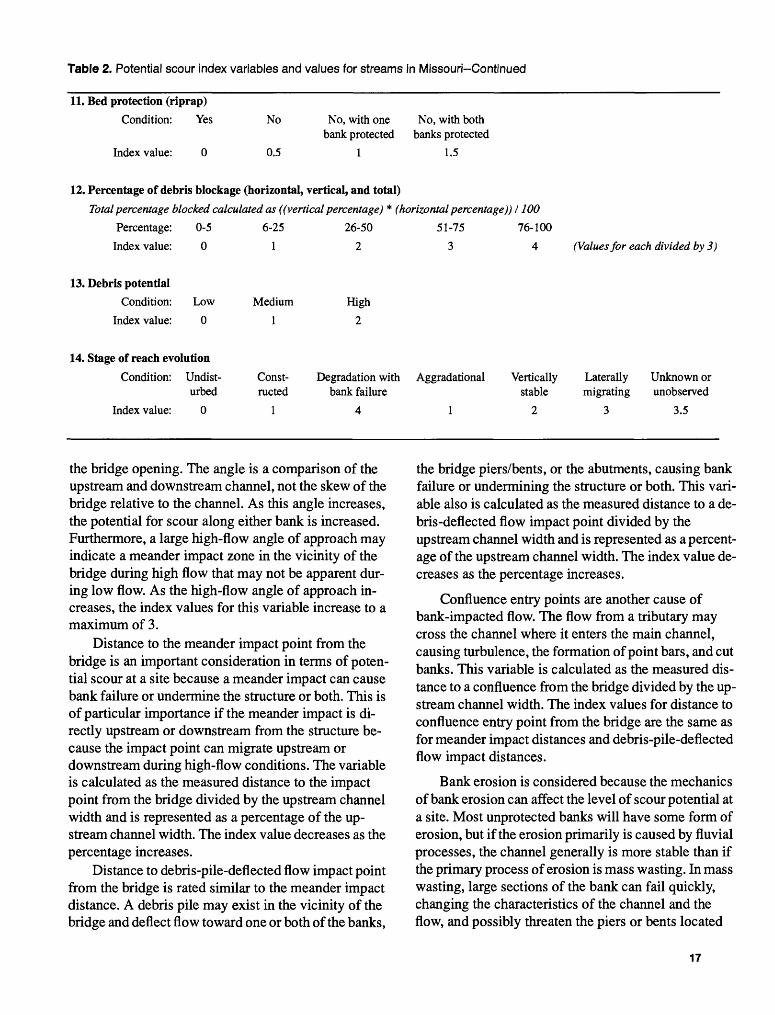
Table 2. Potential scour index variables and values for streams in Missouri-Continued
11. Bed protection (riprap)
Condition: Yes
Index value: 0
No No, with one No, with bothbank protected banks protected
0.5 1 1.5
12. Percentage of debris blockage (horizontal, vertical, and total)
Total percentage blocked calculated as ((vertical percentage) * (horizontal percentage)) 1100
Percentage: 0-5 6-25 26-50 51-75 76-100
Index value: 012 34 (Values for each divided by 3)
13. Debris potentialCondition: Low Medium High
Index value: 0 1 2
14. Stage of reach evolution
Condition: Undist- Const- urbed ructed
Index value: 0 1
Degradation with bank failure
Aggradational Vertically stable
Laterally migrating
3
Unknown or unobserved
3.5
the bridge opening. The angle is a comparison of the upstream and downstream channel, not the skew of the bridge relative to the channel. As this angle increases, the potential for scour along either bank is increased. Furthermore, a large high-flow angle of approach may indicate a meander impact zone in the vicinity of the bridge during high flow that may not be apparent dur ing low flow. As the high-flow angle of approach in creases, the index values for this variable increase to a maximum of 3.
Distance to the meander impact point from the bridge is an important consideration in terms of poten tial scour at a site because a meander impact can cause bank failure or undermine the structure or both. This is of particular importance if the meander impact is di rectly upstream or downstream from the structure be cause the impact point can migrate upstream or downstream during high-flow conditions. The variable is calculated as the measured distance to the impact point from the bridge divided by the upstream channel width and is represented as a percentage of the up stream channel width. The index value decreases as the percentage increases.
Distance to debris-pile-deflected flow impact point from the bridge is rated similar to the meander impact distance. A debris pile may exist in the vicinity of the bridge and deflect flow toward one or both of the banks,
the bridge piers/bents, or the abutments, causing bank failure or undermining the structure or both. This vari able also is calculated as the measured distance to a de bris-deflected flow impact point divided by the upstream channel width and is represented as a percent age of the upstream channel width. The index value de creases as the percentage increases.
Confluence entry points are another cause of bank-impacted flow. The flow from a tributary may cross the channel where it enters the main channel, causing turbulence, the formation of point bars, and cut banks. This variable is calculated as the measured dis tance to a confluence from the bridge divided by the up stream channel width. The index values for distance to confluence entry point from the bridge are the same as for meander impact distances and debris-pile-deflected flow impact distances.
Bank erosion is considered because the mechanics of bank erosion can affect the level of scour potential at a site. Most unprotected banks will have some form of erosion, but if the erosion primarily is caused by fluvial processes, the channel generally is more stable than if the primary process of erosion is mass wasting. In mass wasting, large sections of the bank can fail quickly, changing the characteristics of the channel and the flow, and possibly threaten the piers or bents located
17
along the channel banks. If the banks are protected or no erosion is occurring, an index value of 0 is assigned.
Percentage of channel constriction is the percent age difference between the upstream channel width and the channel width under the bridge. If there is a high de gree of constriction, flow velocities through the bridge opening and around the abutments will increase, in creasing the potential for contraction and local scour.
Piers/bents located in the channel cause turbulence and increase flow velocities in the vicinity of the bridge. As the number of piers/bents in the channel in creases, so does the potential for deeper local scour. Therefore, the index values for the number of piers/ bents in the channel constriction variable increase as
the number of piers or bents increases to a maximum index value of 2.
Another element of localized turbulence caused by piers/bents is the high-flow angle of attack between each pier/bent and the approach direction of high flow (fig. 8). Piers/bents that are angled to the flow decrease the amount of flow area through the bridge and increase the amount of turbulence around the pier/bent and the potential for local scour. Therefore, the average angle of attack for piers/bents located in the channel is used to rate the potential for increased scour.
Bank material data will indicate the erodibility of the banks. Channels cut through bedrock or lined with concrete or steel have little erodibility and are given a
Figure 8. The high-flow angle of attack on piers.
18
0 value. The most erodible bank materials are sand and silt/clay, and these materials are given the highest index values. If the material was not noted during the onsite assessment, the bank material variable is given a value of 3.5, and is flagged as incomplete.
The bed material is examined in the upstream reach, under the bridge, and in the downstream reach. There is less erosion in channels cut through bedrock or lined with concrete or steel, whereas channels with sand or silt or clay beds will be much more erodible. If the channel is deep and the bed material cannot be eas ily determined, or the bed material was not noted dur ing the field assessment, the bed is assumed to be erodible, and an index value of 3.5 is applied.
Riprap indicates the condition of the bed protection if any exists. If bed protection exists in any condition, an index value of 0 is assigned (fig. 9). Three scenarios exist if the bed is not protected. First, if with a lack of bed protection, bank protection also is lacking, then an index value of 0.5 is assigned. Second, if one of the banks has protection while the bed is unprotected, ef fects caused by contraction and local scour may be im pinged on the unprotected bank and the bed. Therefore, an index value of 1 is assigned when a single bank is protected. Third, if both banks are protected and the bed is unprotected, contraction and local scour could be severe on the bed because all of the effects are concen trated on the unprotected area. In this case, an index value of 1.5 is assigned.
Percentage of debris blockage examines the hori zontal, vertical, and total percentage of the bridge opening blocked by debris and assigns different values accordingly. Debris piles in the bridge section are a concern because they deflect flow toward banks, piers/ bents, or abutments. Debris blockage also decreases the flow area of the bridge opening, which may increase flow velocities through the bridge opening and cause turbulence around the structure. As addressed in the number of piers/bents and the high-flow angle of attack on piers/bents variables, increased flow velocities and turbulence increase the potential for contraction and lo cal scour. Minor blockage (less than 5 percent) is as signed an index value of 0, moderate blockage (as much as 50 percent) is assigned an index value of 2, and major blockage (as much as 100 percent) is as signed an index value of 4. The average index value for each percentage of debris blockage variable is found by dividing each (horizontal, vertical, and total) by 3.
The debris potential variable is used to record the qualitative assessment of the potential for debris supply from upstream drainage basin and assigns values ac cording to the scour potential (low, value of 0; medium, value of 1; or high, value of 2). The potential for in creased scour caused by debris piles impinged on a structure is dependent on the potential for debris supply upstream from the bridge.
The last variable, stage of reach evolution, is a qualitative assessment of the channel characteristics. The stages on the MS AFF correspond approximately to the stages devised by Simon and Hupp (1987) to rank channels in western Tennessee based on the condition of stability (fig. 10); however, on the MS AFF the "stag es" of channel evolution correspond more closely to types of channels rather than to evolutionary stages. Nonetheless, this variable can be used to indicate cur rent and future channel conditions.
In the first stage, the reach is undisturbed and is characterized by stable banks and bed where natural fluvial processes are occurring. Some bank instability may exist near meander impact points and some bed lowering in the vicinity of the bridge may occur, but overall the channel is changing slowly. These channels are considered undisturbed and are assigned an index value of 0.
A constructed reach has been altered by human ac tivity and is assigned an index value of 1. Although the channel may seem stable at the time of inspection, the scour potential may have increased because the chan nel may have been made more efficient, thereby in creasing the flow velocities, or the channel may have been widened, thereby decreasing the flow velocities. Either of these conditions can cause the channel to quickly change to any of the other less stable evolution categories, and frequent reinspection of the site is war ranted.
The most critical case of reach evolution is the sit uation of a degrading channel with bank failure. This stage is assigned an index value of 4, because this is the most unstable condition of a stream. It indicates a ma jor geomorphic change either upstream or downstream from the bridge. The main channel elements of the structure could be undermined by bed lowering, or the piers/bents and abutments in the flood plain may be un dermined by the bank widening process.
An aggradational stream also indicates a geomor phic change either upstream or downstream from the bridge, but the threat to the structure is not severe as in
19
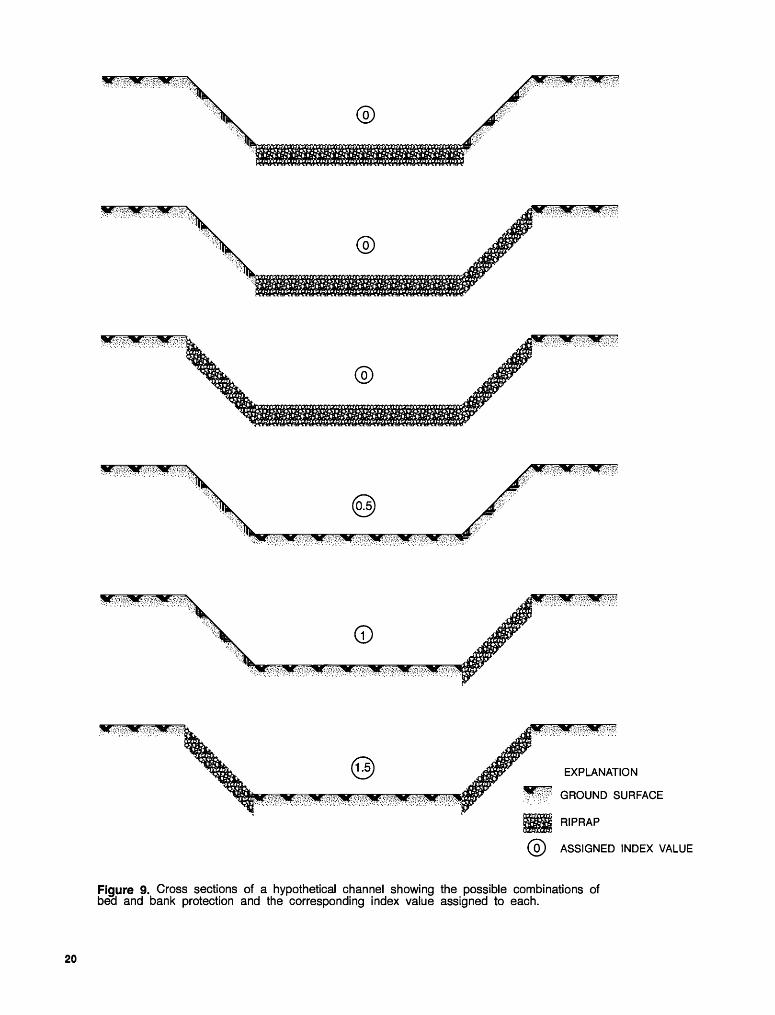
EXPLANATION
GROUND SURFACE
RIPRAP
ASSIGNED INDEX VALUE
Figure 9. Cross sections of a hypothetical channel showing the possible combinations of bed and bank protection and the corresponding index value assigned to each.
20
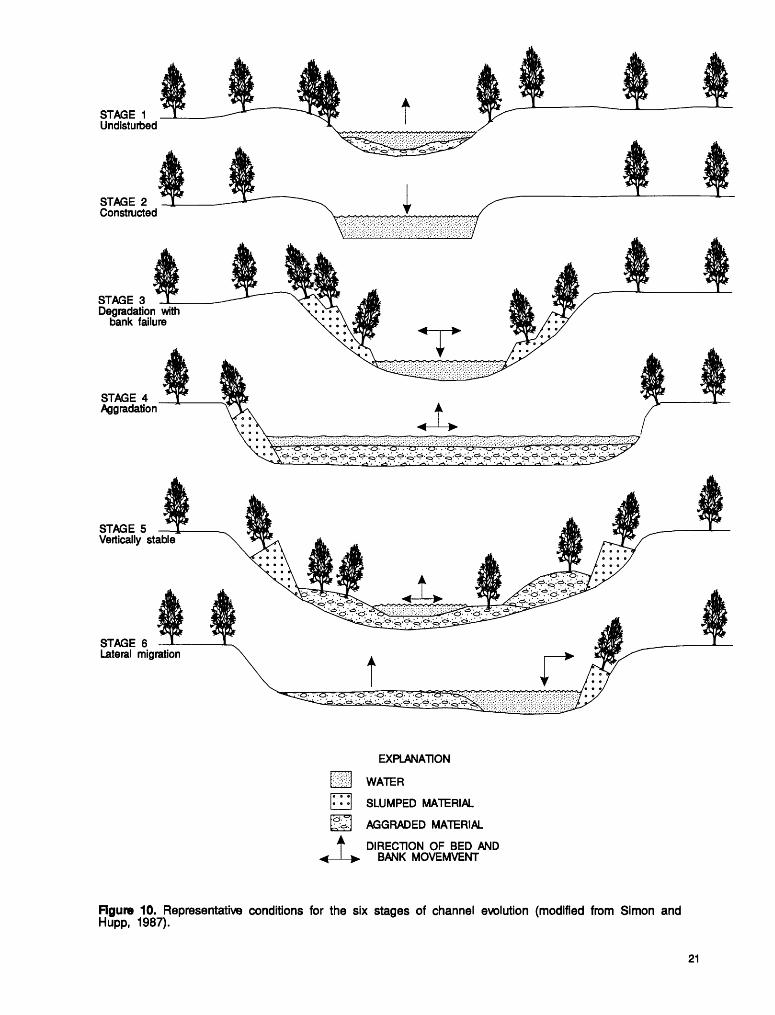
STAGE 1 Undisturbed
STAGE 2 Constructed
STAGE 3 Degradation with
bank failure
STAGE 4 Aggradation
STAGE 5 Vertically stable
STAGE 6 Lateral migration
EXPLANATION
WATER
SLUMPED MATERIAL
AGGRADED MATERIAL
DIRECTION OF BED AND BANK MOVEMVENT
Figure 10. Representative conditions for the six stages of channel evolution (modified from Simon and Hupp, 1987).
21
those cases of channel degradation. Aggradation can cause a decrease in the flow area of the bridge opening, thereby possibly increasing the flow velocity, which can subsequently cause increased local scour or more pronounced bank erosion. This case is assigned an in dex value of 1.
In a vertically stable reach, neither degradation nor aggradation are occurring, but the channel may be wid ening. The threat to the bridge in this case is not severe, but an index value of 2 is assigned to include the poten tial for damage caused by widening of the channel.
Lateral migration of a reach is a normal fluvial pro cess, which may be characterized by mass wasting of one of the banks on the outside of a meander and asso ciated deposition on the inside. Piers or bents located in the flood plain may be undermined by the cutting side of a migrating stream, and eventually an abutment may be threatened. For these reasons, this case is assigned an index value of 3.
The stage of reach evolution is useful when sum marizing the characteristics of the channel. However, if the stage of reach evolution is not noted during the on- site assessment, a conservative index value of 3.5 is as signed to this variable as a possible worst-case scenario and the variable is noted as incomplete.
The summation of all of the index values (potential scour index) is the indication of the potential scour for a bridge. The maximum possible potential scour index is 73.5. The higher the total, the more potential scour problems exist at the bridge. All of the bridges in the MBSD can be ranked according to their potential scour indices, which gives an indication of the bridges with the most scour potential.
Limitations of Observed and Potential Scour Indices
The observed scour index documents the scour at a site at the time of inspection. However, judgement must be used when evaluating this index. The user should inspect the ranking of each variable because a relatively high observed scour index could indicate ei ther high ranking for one or two variables or low rank ing for several variables. Moreover, sites with comparatively low observed scour indices are not im mune to scour-related problems. Periodic follow-up in spections can be used to document any natural or human changes at a site, and can be used to validate the potential scour index.
The potential scour index is used to evaluate a site in terms of potential scour-critical conditions to occur. However, as with the observed scour index, judgement must be used when evaluating this index. A relatively high index indicates the potential for multiple scour-re lated problems, but only an examination of the individ ual variables will indicate which conditions could produce the most severe scour conditions. Moreover, as with the observed scour index, sites with comparatively low potential scour indices are not immune to scour-re lated conditions.
SUMMARY
The U.S. Geological Survey (USGS), in coopera tion with the Missouri Highway and Transportation Department (MHTD), has developed a methodology by which approximately 3,300 bridges over water in the State of Missouri could be assessed for scour sus ceptibility. The ability to assess a large number of bridges in a timely manner was a principal goal and was accomplished through the development of the Mis souri Scour Assessment Field Form (MSAFF), the Missouri Bridge Scour Data Base (MBSD), and a pro cedure to identify and rank bridges based on scour po tential.
The MSAFF was designed after a similar form used in the USGS and has the advantages of specifying the data to be collected and grouping the data in a rea sonable order of collection so that all the necessary data are collected without repetition. Training personnel in the concepts behind the variables and the use of the form was straightforward. These characteristics of the form allowed for a quick inspection of a site.
The MBSD was established to store and manipu late the data collected during onsite inspections. Using the MBSD, the data can be updated, printed, and tabu lated with other records using a variety of criteria, and can be used by either USGS or MHTD personnel to re trieve information regarding the field inspection of any bridge site. As data records are input into the MBSD, the data are checked for accuracy against information on the field form. The observed scour index and the po tential scour index are calculated and stored using a procedure that considers various characteristics of the stream channel and bridge opening and assigns a weighted value to each.
22

REFERENCES CITED
Federal Highway Administration, 1988, Scour at bridges: Federal Highway Administration, Department of Trans portation Technical Advisory 5140.20,103 p.
Fenneman, N.M., 1938, Physiography of Eastern United States: New York, McGraw-Hill Book Company, 714 p.
Lagasse, P.F., Schall, J.D., Johnson, R, Richardson, E.V., Richardson, J.R., and Chany, F., 1991, Stream stability at highway structures: Federal Highway Administration, FHWA-IP-90-014 HEC-20,195 p.
Reed, H.L., Perkins, T.J., and Gray, G.L., Jr., 1993, Water resources data for Missouri, water year 1992: U.S. Geo logical Survey Water-Data Report MO-92-1, 234 p.
Richardson, E.V., Harrison, L.J., Richardson, J.R., and Davis, S.R., 1993, Evaluating scour at bridges: U.S.
Federal Highway Administration, FHWA-IP-90-017 HEC-18.
Robinson, B.A., and Thompson, R.E., 1993, An efficient method for assessing channel instability near bridges: Hydraulic Engineering '93, American Society of Civil Engineering Proceedings, 1993, v. 1, p. 513-518.
Simon, Andrew, and Hupp, C.R., 1987, Geomorphic and vegetative recovery processes along modified Tennessee streams-An interdisciplinary approach to disturbed flu vial systems: International Association of Hydrological Sciences Publication 167, p. 251-262.
Simon, Andrew, Outlaw, G.S., and Thomas, Randy, 1989, Evaluation, modeling, and mapping of potential bridge-scour, west Tennessee, in Proceedings of the Bridge Scour Symposium, Subcommittee on Sedimenta tion: Interagency Advisory Committee on Water Data, October 17-19,1989, p. 112-219.
23