method 8000b determinative chromatographic … · determinative chromatographic separations ......
TRANSCRIPT

CD-ROM 8000B - 1 Revision 2December 1996
METHOD 8000B
DETERMINATIVE CHROMATOGRAPHIC SEPARATIONS
1.0 SCOPE AND APPLICATION
1.1 Method 8000 is not a determinative method but instead provides guidance on analyticalchromatography and describes calibration and quality control requirements that are common to allSW-846 chromatographic methods. Apply Method 8000 in conjunction with all SW-846determinative chromatographic methods. The methods include, but are not limited to, the following:
Method ChromatographicNumber Analytes Technique (see Sec. 1.5) Detector
7580 White phosphorus (P ) GC, capillary column NPD4
8011 EDB, DBCP GC, capillary column ECD
8015 Nonhalogenated volatiles GC, packed & capillary FIDcolumn
8021 Volatiles GC, capillary column PID, ELCD
8031 Acrylonitrile GC, packed column NPD
8032 Acrylamide GC, packed column ECD
8033 Acetonitrile GC, capillary column NPD
8041 Phenols Underivatized or FID, ECDderivatized, GC, capillarycolumn
8061 Phthalates GC, capillary column ECD
8070 Nitrosamines GC, packed column NPD, ELCD, TED
8081 Organochlorine pesticides GC, capillary column ECD, ELCD
8082 Polychlorinated biphenyls GC, capillary column ECD, ELCD
8091 Nitroaromatics and cyclic GC, capillary column ECDketones
8100 PAHs GC, packed & capillary FIDcolumn
8111 Haloethers GC, capillary column ECD
8121 Chlorinated hydrocarbons GC, capillary column ECD

Method ChromatographicNumber Analytes Technique (see Sec. 1.5) Detector
CD-ROM 8000B - 2 Revision 2December 1996
8131 Aniline and selected derivatives GC, capillary column NPD
8141 Organophosphorus pesticides GC, capillary column FPD, NPD, ELCD
8151 Acid herbicides Derivatize; GC, capillary ECDcolumn
8260 Volatiles GC, capillary column MS
8270 Semivolatiles GC, capillary column MS
8275 Semivolatiles Thermal extraction/GC MS
8280 Dioxins and Dibenzofurans GC, capillary column Low resolution MS
8290 Dioxins and Dibenzofurans GC, capillary column High resolution MS
8310 PAHs HPLC, reverse phase UV, Fluorescence
8315 Carbonyl compounds Derivatize; HPLC Fluorescence
8316 Acrylamide, acrylonitrile, HPLC, reverse phase UVacrolein
8318 N-Methyl carbamates Derivatize; HPLC Fluorescence
8321 Extractable nonvolatiles HPLC, reverse phase TS/MS, UV
8325 Extractable nonvolatiles HPLC, reverse phase PB/MS, UV
8330 Nitroaromatics and nitramines HPLC, reverse phase UV
8331 Tetrazene HPLC, ion pair, reverse UVphase
8332 Nitroglycerine HPLC, reverse phase UV
8410 Semivolatiles GC, capillary column FT-IR
8430 Bis(2-chloroethyl) ether GC, capillary column FT-IRhydrolysis products
DBCP = Dibromochloropropane MS = Mass spectrometryECD = Electron capture detector NPD = Nitrogen/phosphorous detectorEDB = Ethylene dibromide PAHs = Polynuclear aromatic hydrocarbonsELCD = Electrolytic conductivity detector PB/MS = Particle beam mass spectrometryFID = Flame ionization detector PID = Photoionization detectorFPD = Flame photometric detector TED = Thermionic emission detectorFT-IR = Fourier transform-infrared TS/MS = Thermospray mass spectrometryGC = Gas chromatography UV = UltravioletHPLC = High performance liquid chromatography

CD-ROM 8000B - 3 Revision 2December 1996
1.2 Analytical chromatography is used to separate target analytes from co-extractedinterferences in samples. Chromatographic methods can be divided into two major categories: gaschromatography (GC) and high performance liquid chromatography (HPLC).
1.2.1 Gas chromatography (more properly called gas-liquid chromatography) is theseparation technique of choice for organic compounds which can be volatilized without beingdecomposed or chemically rearranged.
1.2.2 High performance liquid chromatography (HPLC) is a separation technique usefulfor semivolatile and nonvolatile chemicals or for analytes that decompose upon heating.Successful liquid chromatographic separation requires that the analyte(s) of interest be solublein the solvent(s) selected for use as the mobile phase. Because the solvents are deliveredunder pressure, the technique was originally designated as high pressure liquidchromatography, but now is commonly referred to as high performance liquid chromatography.
1.3 All chromatographic processes achieve separation by passing a mobile phase over astationary phase. Constituents in a mixture are separated because they partition differently betweenthe mobile and stationary phases and thus have different retention times. Compounds that interactstrongly with the stationary phase elute slowly (i.e., long retention time), while compounds thatremain in the mobile phase elute quickly (i.e., short retention time).
1.3.1 The mobile phase for GC is an inert gas, usually helium, and the stationary phaseis generally a silicone oil or similar material.
1.3.2 In "normal phase" HPLC, the mobile phase is less polar than the stationary phase.In "reverse phase" HPLC, the converse is true. Reverse phase HPLC is the technique ofchoice for environmental and waste analyses of non-volatile organic target analytes.
1.4 A number of specific GC and LC techniques are used for environmental and wasteanalyses. The specific techniques are distinguished by the chromatographic hardware or by thechemical mechanisms used to achieve separations.
1.4.1 GC methods, including those in SW-846, can be categorized on the basis of thechromatographic columns employed.
1.4.1.1 Packed columns are typically made from glass or stainless steel tubingand generally are 1.5 - 3 m long with a 2 - 4 mm ID, and filled with small particles (60-100mesh diatomaceous earth or carbon) coated with a liquid phase.
1.4.1.2 Capillary columns are typically made from open tubular glass capillarycolumns that are 15 - 100 m long with a 0.2 - 0.75 mm ID, and coated with a liquidphase. Most capillary columns are now made of fused silica, although glass columns arestill sold for the analysis of volatiles. Capillary columns are inherently more efficient thanpacked columns and have replaced packed columns for most SW-846 applications.
1.4.2 SW-846 HPLC methods are categorized on the basis of the mechanism ofseparation.
1.4.2.1 Partition chromatography is the basis of reverse phase HPLCseparations. Analytes are separated on a hydrophobic column using a polar mobilephase pumped at high pressure (800 - 4000 psi) through a stainless steel column 10 -

CD-ROM 8000B - 4 Revision 2December 1996
25 cm long with a 2 - 4 mm ID and packed with 3 - 10 µm silica or divinylbenzene-styrene particles.
1.4.2.2 Ion exchange chromatography is used to separate ionic species.
1.5 SW-846 methods describe columns and conditions that have been demonstrated toprovide optimum separation of all or most target analytes listed in that specific procedure. Mostoften, those columns were the ones used by EPA during method development and testing. Analystsmay change those columns and conditions, provided that they demonstrate performance for theanalytes of interest that is appropriate for the intended application. This is especially true whenlimited groups of analytes are to be monitored (i.e., if only a subset of the list of target analytes ina method are required, then the chromatographic conditions and columns may be optimized forthose analytes).
1.5.1 Chromatographic performance is demonstrated by the resolution of standards andthe ability to model the response of the detector during calibration, and by the sensitivity,accuracy, precision, frequency of false positives, and frequency of false negatives duringanalysis. The laboratory must demonstrate that an alternate chromatographic procedureprovides performance that satisfies the analytical requirements of the specific application forwhich it is being used. Such demonstrations should be performed using the proceduresoutlined in Secs. 8.2 to 8.5 of this method and those in Chapter One.
1.5.2 In addition, laboratories must be cautious whenever the use of two dissimilarcolumns is included in a method for confirmation of identification. For instance, a DB-5 columngenerally cannot be used for confirmation of results obtained using an SPB-5 column becausethe stationary phases are not sufficiently dissimilar and the changes in elution order (if any) willnot provide adequate confirmation.
1.6 When gas chromatographic conditions are changed, retention times and analyticalseparations are often affected. For example, increasing the GC oven temperature changes thepartitioning between the mobile and stationary phases, leading to shorter retention times. GCretention times can also be changed by selecting a column with a different length, stationary-phaseloading (i.e., capillary film thickness or percent loading for packed columns), or alternate liquidphase. As a result, two critical aspects of any SW-846 chromatographic method are thedetermination and/or verification of retention times and analyte separation.
1.7 HPLC retention times and analytical separations are also affected by changes in themobile and stationary phases. The HPLC mobile phase is easily changed by adjusting thecomposition of the solvent mixture being pumped through the column. In reverse phase HPLC,increasing the ratio of methanol (or acetonitrile) to water shortens retention times. HPLC retentiontimes can also be changed by selecting a column with (1) a different length, (2) an alternate bondedphase, or (3) a different particle size (e.g., smaller particles generally increase column resolution).SW-846 methods provide conditions that have been demonstrated to provide good HPLCseparations using specific instruments to analyze a limited number of samples. Analysts (particularlythose using HPLC/MS) may need to tailor the chromatographic conditions listed in the method fortheir specific application and/or instrument. HPLC methods are particularly sensitive to smallchanges in chromatographic conditions, including temperature. HPLC column temperature controlovens should be used to maintain constant retention times since ambient laboratory temperaturesoften fluctuate throughout the course of a day.
1.8 Chromatographic methods can be used to produce data of appropriate quality for theanalysis of environmental and waste samples. However, data quality can be greatly enhanced when

CD-ROM 8000B - 5 Revision 2December 1996
the analyst understands both the intended use of the results and the limitations of the specificanalytical procedures being employed. Therefore, these methods are recommended for use onlyby, or under the close supervision of, experienced analysts. Many difficulties observed in theperformance of SW-846 methods for the analysis of RCRA wastes can be attributed to the lack ofskill and training of the analyst.
1.8.1 Methods using selective (e.g., PID, NPD, ELCD) or non-selective (e.g., FID)detectors may present serious difficulties when used for site investigations, including co-elutionof target analytes, false negatives due to retention time shifts, and false positives andquantitation errors due to co-eluting non-target sample components.
1.8.2 In contrast, GC methods employing selective or non-selective detectors may beappropriate for remediation activities where the analytes of concern are known, of limitednumber, and of significantly greater concentration than potentially interfering materials.
1.8.3 If the site is not well characterized, and especially if large numbers of targetanalytes are of concern, analysis by GC/MS or HPLC/MS may be more appropriate.
1.9 Each of the chromatographic methods includes a list of the compounds that it may beused to determine. The lists in some methods are lengthy and it may not be practical or appropriateto attempt to determine all the analytes simultaneously. Such analyte lists do not imply a regulatoryrequirement for the analysis of any or all of the compounds, but rather, indicate the method(s) whichmay be applicable to those analytes.
1.10 Prior to employing this method, analysts are advised to consult the disclaimer statementat the front of the manual and the information in Chapter Two for guidance on the allowed flexibilityin the choice of apparatus, reagents, and supplies. In addition, unless specified in a regulation, theuse of SW-846 methods is not mandatory in response to Federal testing requirements. Theinformation contained in this procedure is provided by EPA as guidance to be used by the analystand the regulated community in making judgments necessary to meet the data quality objectives orneeds for the intended use of the data.
2.0 SUMMARY OF METHOD
Method 8000 describes general considerations in achieving chromatographic separations andperforming calibrations. Method 8000 is to be used in conjunction with all SW-846 determinativechromatographic methods, including, but not limited to, each method listed in Sec. 1.1. Each ofthese chromatographic methods recommends appropriate procedures for sample preparation,extraction, cleanup, and/or derivatization. Consult the specific procedures for additional informationon these crucial steps in the analytical process.
2.1 Sec. 3.1 of this method provides general guidance on minimizing contamination, includingcross-contamination between samples. Sample screening procedures are strongly recommended,and discussed in Sec. 3.2.
2.2 Before any sample or blank is introduced into a chromatographic system, the appropriateresolution criteria and calibration procedure(s) described in Method 8000 must be satisfied (seeSecs. 3.3 and 8.3).
2.3 Secs. 3.4 and 3.5 provide information on the effects of chromatographic interferences.

CD-ROM 8000B - 6 Revision 2December 1996
2.4 Sec 4.0 of this method contains generalized specifications for the components of bothGC and HPLC systems used in SW-846 analyses.
2.5 Calibration of the analytical system is another critical step in the generation of qualitydata. Sec. 7.5 discusses specific procedures and calculations for both linear and non-linearcalibration relationships. The continued use of any chromatographic procedure requires averification of the calibration relationship, and procedures for such verifications are described in thismethod as well (see Sec. 7.7).
2.6 The identification of target compounds by any chromatographic procedure is based, atleast in part, on retention times. Sec. 7.6 provides procedures for the determination of retentiontimes and retention time windows to be used with the specific methods listed in Sec. 1.1.
2.7 The calculations necessary to derive sample-specific concentration results from theinstrument responses are common to most of the analytical methods listed in Sec. 1.1. Therefore,Sec. 7.10 of Method 8000 contains a summary of the commonly used calculations.
2.8 Preventive maintenance and corrective actions are essential to the generation of qualitydata in a routine laboratory setting. Suggestions for such procedures are found in Sec. 7.11.
2.9 Most of the methods listed in Sec. 1.1 employ a common approach to quality control(QC). While some of the overall procedures are described in Chapter One, Sec. 8.0 describesroutinely used procedures for calibration verification, instrument performance checks, demonstratingacceptable performance, etc.
2.10 Before performing analyses of specific samples, analysts should determine acceptablerecovery ranges for all target analytes of interest in the type of matrices to be tested. Theseprocedures are described in Secs. 8.4, 8.5, and 8.7. Analysts must also be able to demonstrate thatthe sensitivity of the procedure employed is appropriate for the intended application. One approachto such a demonstration is to estimate the method detection limits for the analytes of interest usingthe procedures in Chapter One.
3.0 INTERFERENCES/CHROMATOGRAPHIC PERFORMANCE
3.1 Contamination by carryover can occur whenever high-concentration and low-concentration samples are analyzed in sequence. To reduce the potential for carryover, the samplesyringe or purging device must be thoroughly rinsed between samples with an appropriate solvent.Purge and trap devices or headspace devices should be thoroughly baked out between samples.Where practical, samples with unusually high concentrations of analytes should be followed by asolvent blank or by an analysis of organic-free reagent water to check for cross-contamination. Ifthe target compounds present in an unusually concentrated sample are also found to be present inthe subsequent samples, the analyst must demonstrate that the compounds are not due tocarryover. Conversely, if those target compounds are not present in the subsequent sample, thenthe analysis of a solvent blank or organic-free reagent water is not necessary.
Purging vessels may be cleaned by rinsing with methanol, followed by a distilled water rinseand drying in a 105EC oven between analyses. Detergent solutions may also be used, but care mustbe taken to remove the detergent residue from the purging vessel. Other approaches to cleaningpurging vessels may also be employed, provided that the laboratory can demonstrate that they areeffective in removing contaminants.

CD-ROM 8000B - 7 Revision 2December 1996
3.2 In addition to carryover of compounds from one sample to the next, the analysis of high-concentration samples can lead to contamination of the analytical instrument itself. This isparticularly true for GC/MS. Eliminating this contamination can require significant time and effort incleaning the instruments, time that cannot be spent analyzing samples. The most reliable procedurefor ensuring minimum down time during the GC/MS analysis of samples is to screen samples bysome other technique. Samples to be analyzed for volatiles can be screened using an automatedheadspace sampler (Method 5021) connected to a GC/PID/ELCD detector (Method 8021). Samplesto be analyzed for semivolatiles can be screened using GC/FID. Other screening methods are alsoacceptable. The analyst should use the screening results to choose an appropriate dilution factorfor the GC/MS analysis that will prevent system contamination yet still provide adequate sensitivityfor the major constituents of the sample.
3.3 One of the most important measures of chromatographic performance is resolution, theseparation of chromatographic peaks (peak separation/average peak width). Peak separations arefacilitated by good column efficiency (i.e., narrow peak widths) and good column selectivity (i.e.,analytes partition differently between the mobile and stationary phases).
3.3.1 The goal of analytical chromatography is to separate sample constituents withina reasonable time. Baseline resolution of each target analyte from co-extracted materialsprovides the best quantitative results, but is not always possible to achieve.
3.3.2 In general, capillary columns contain a greater number of theoretical plates thanpacked columns. ( A theoretical plate is a surface at which an interaction between the samplecomponents and the stationary phase may occur). As a result, capillary columns generallyprovide more complete separation of the analytes of interest. However, packed columns canprovide adequate resolution of some analytes and are most appropriately employed when thelist of analytes to be determined is relatively short.
3.3.3 The ability to resolve individual compounds is generally the limiting factor for thenumber of analytes that can be measured using a single procedure. Some procedures,particularly Method 8081 (Organochlorine Pesticides), Method 8082 (PCBs), and Method 8141(Organophosphorus Pesticides), list analytes that may not all be resolved from one another.Therefore, while each of these methods is suitable for the listed compounds, they may not besuitable to measure the entire list in a single analysis. In addition, some methods includeanalytes that are isomers or closely related compounds which are well-known as co-eluting orare not completely separable. In these instances, the results should be reported as the sumof the two (or more) analytes. Laboratories should demonstrate that target analytes areresolved during calibration and satisfy the requirements in Sec. 8.3, or should report the resultsas "totals" or "sums" (e.g., m+p-xylene). Methods that utilize mass spectrometry for detectionare less affected by resolution problems, because overlapping peaks may often bemass-resolved. However, even mass spectrometry will not be able to mass resolve positionalisomers such as m-xylene and p-xylene if the compounds co-elute.
3.4 Elevated chromatographic baselines should be minimized or eliminated during theseanalyses. Baseline humps can usually be reduced or eliminated by the application of appropriatesample clean-up (see Method 3600), extract dilution, the use of pre-columns and/or inserts, or useof a selective detector. Integration of "hump-o-grams" can result in significant quantitative errors.When elevated baselines are observed during the analysis of blanks and standards, thechromatographic system should be considered contaminated. This contamination may be the resultof impure carrier gas, inadequate gas conditioning, septum bleed, column oxidation, and/or pyrolysisproducts in the injector or column. Such contamination is unacceptable and should be addressedthrough a program of preventive maintenance and corrective action.

CD-ROM 8000B - 8 Revision 2December 1996
3.5 GC preventive maintenance and corrective action
Poor GC performance may be expected whenever a chromatographic system is contaminatedwith high-boiling materials, particularly in the injector. Analysts should perform routine maintenance,including replacement of septa, cleaning and deactivating injector liners, and removing as much as0.5 - 1 m from the injector side of a capillary column.
If chromatographic performance or ghost peaks are still a problem, cleaning of the metallicsurfaces of the injection port itself may be necessary. Capillary columns are reliable and easy touse, but several specific actions are necessary to ensure good performance.
3.5.1 Contact between the capillary column and the wall of the GC oven can affect bothchromatographic performance and column life. Care should be taken to prevent the columnfrom touching the oven walls.
3.5.2 Care should be taken to keep oxygen out of capillary columns.
3.5.3 Septa should only be changed after the oven has cooled.
3.5.4 Columns should be flushed with carrier gas for 10 minutes before reheating theoven.
3.5.5 Carrier gas should be scrubbed to remove traces of oxygen and scrubbers shouldbe changed regularly.
3.5.6 Carrier gas should always be passed through the column whenever the oven isheated.
3.6 HPLC preventive maintenance and corrective action
HPLC band broadening results from improper instrument setup or maintenance. Bandbroadening results whenever there is a dead volume between the injector and the detector.Therefore, plumbing connections should be of minimum length and diameter, and ferrules shouldbe properly positioned on the tubing to minimize dead volume.
3.6.1 Columns should not be subjected to sudden physical stress (e.g., dropping) orsolvent shocks (e.g., changing solvents without a gradient).
3.6.2 Columns can become contaminated with particulates or insoluble materials.Guard columns should be used when dirty samples are analyzed.
3.6.3 High quality columns are packed uniformly with small uniform diameter particleswith a minimum number of free silol groups. Use of such columns will result in optimumchromatographic performance.
3.6.4 Columns should be replaced when performance degrades (e.g., significant bandbroadening, peak splitting, or loss of chromatographic resolution occurs).
3.6.5 Pumping systems should deliver reproducible gradients at a uniform flow rate.Rates can be checked by collecting solvent into a graduated cylinder.

CD-ROM 8000B - 9 Revision 2December 1996
3.6.6 Column temperatures should be regulated by the use of column temperaturecontrol ovens to ensure reproducibility of retention times.
3.6.7 Small changes in the composition or pH of the mobile phase can have asignificant effect on retention times.
4.0 APPARATUS AND MATERIALS
4.1 GC inlet systems
4.1.1 Volatile organics
Volatile organic analytes are introduced into a GC through a purge-and-trap system, bydirect injection, or by other devices. The purge-and-trap apparatus is described in Method5030 for water samples and in Method 5035 for soil and other solid samples. See Method5000 for guidance on all forms of sample introduction of volatiles into the GC and GC/MSsystem.
4.1.2 Semivolatile organics
Sample extracts containing semivolatile organic compounds are introduced into a GCwith a syringe that passes through a septum into an injection port. The injection port allowsthe sample extract to be vaporized prior to being flushed onto the GC column, hence the term"gas" chromatography. Correct set up and maintenance of the injector port is necessary toachieve acceptable performance with GC methods. Septa should be changed frequentlyenough to prevent retention time shifts of target analytes and peak tailing. The schedule forsuch septa changes is dependent on the quality of the septa, the sharpness of the needle, andthe operation of the injection system. Appropriate injector liners should be installed, and linersshould be cleaned and deactivated (with dichlorodimethylsilane) regularly.
4.1.3 Injector difficulties include the destruction of labile analytes and discriminationagainst high boiling compounds in capillary injectors.
4.1.3.1 Packed columns and wide-bore capillary columns (> 0.50 mm ID) shouldbe mounted in 1/4-inch injectors. An injector liner is needed for capillary columns.
4.1.3.2 Narrow-bore capillary columns (# 0.32 mm ID) should be mounted insplit/splitless (Grob-type) injectors. Split/splitless injectors require automated valveclosures that direct most of the flow (and sample) onto the head of the analytical column.After 30 - 45 seconds, the split valve is opened, so that most of the flow is vented duringanalysis, thus eliminating the solvent tail, and maintaining proper flow through thecolumn. The initial oven temperature should be below the boiling point of the injectionsolvent if the solvent front interferes with early eluting analytes or if the solvent effect isneeded to resolve difficult-to-separate analytes.
4.1.3.3 Cool on-column injection allows the analysis of labile compounds thatdegrade on packed columns and in split/splitless injectors.

CD-ROM 8000B - 10 Revision 2December 1996
4.2 GC flow control
Precise control of the gas mobile phase is necessary to achieve reproducible GC retentiontimes. Flow controllers within any GC used for SW-846 analyses must deliver a precisely meteredgas flow at a rate appropriate for the GC column mounted in the instrument.
4.2.1 Most GCs have restrictors built into flow controllers. These restrictors are usedto provide precise flow at the carrier gas flow rate specified in the method (e.g., use <20mL/min restrictors for wide-bore capillary methods). Carrier gas flow rates should be checkedregularly (with both the injector and the oven heated) using a bubble meter or other appropriateprocedure.
4.2.2 Cylinder pressures should also be regulated properly. Manifold pressures mustbe sufficiently large that a change in the head pressure of an individual instrument does notaffect the flow through all instruments. Toggle valves that allow instruments to be isolated arerecommended for all multi-instrument gas delivery systems. Analysts should spend time eachweek conducting preventative maintenance in order to ensure that proper flow control ismaintained. One needs to search for leaks using a helium tester or soap solution at eachconnector in the gas delivery systems. Analysts should routinely conduct preventivemaintenance activities, including those designed to ensure proper flow control and to identifypotential leaks in the gas delivery system. The search for leaks may be conducted with ahelium leak tester, soap solutions, performing static pressure tests, or other appropriatemeasures.
4.2.3 Carrier gas should be of high purity and should be conditioned between thecylinder and the GC to remove traces of water and oxygen. Scrubbers should be changedaccording to manufacturers recommendations. Gas regulators should contain stainless steeldiaphragms. Neoprene diaphragms are a potential source of gas contamination, and shouldnot be used.
4.3 Gas chromatographic columns
Each determinative method in SW-846 provides a description of a chromatographic columnor columns with associated performance data. Other packed or capillary (open-tubular) columnsmay be substituted in SW-846 methods to improve performance if (1) the requirements of Secs. 8.3and 8.4 are satisfied, and (2) target analytes are sufficiently resolved from one another and fromco-extracted interferences to provide data of the appropriate quality for the intended application.
4.3.1 Narrower columns are more efficient (i.e., can resolve more analytes) but havea lower capacity (i.e., can accept less sample without peak distortion).
4.3.2 Longer columns can resolve more analytes, as resolution increases as a functionof the square root of column length.
4.3.3 Increasing column film thickness or column loading increases column capacityand retention times.
4.3.4 Use of capillary columns has become standard practice in environmental andwaste analysis. Capillary columns have an inherently greater ability to separate analytes thanpacked columns. However, packed columns can provide adequate resolution of some analytesand are most appropriately employed when the list of analytes to be determined is relativelyshort.
CD-ROM 8000B - 11 Revision 2December 1996
4.3.5 Columns used for SW-846 analyses should be installed properly. Column endsshould be cut square. Contaminated ends should be trimmed off, and columns should beplaced through ferrules before they are trimmed. Columns should not touch the walls of theGC oven during analysis, and the manufacturer's column temperature limits should not beexceeded.
4.3.6 Septa should be changed regularly and septum nuts should not be overtightened.Oxygen should not be introduced into a hot column and carrier gas should be passed througha column whenever it is heated. New columns, particularly packed columns, should beconditioned prior to analyzing samples.
4.4 GC detectors
Detectors are the transducers that respond to components that elute from a GC column andproduce the electrical signal that is used for quantitative determinations. SW-846 analyses areconducted using selective detectors or mass spectrometers listed in Sec. 1.1. Except whereotherwise recommended by the instrument manufacturer, selective non-MS detectors should bemaintained at least 20EC above the highest oven temperature employed to prevent condensationand detector contamination. The transfer lines between the GC and an MS detector should bemaintained at a temperature above the highest column temperature, or as specified by theinstrument manufacturer, to prevent condensation.
4.5 HPLC injectors
Liquids are essentially non-compressible, so a mechanical device is necessary that allowsintroduction of the sample into a high pressure flow without significant disruption in the flow rate andhydraulic pressure. Normally, a 6-port valve is used for this purpose. A sample loop (generally10-100 µL) is isolated from the flow of the mobile phase and filled with a sample extract. (Largersample loops may be used to increase sensitivity, however, they may degrade chromatographicperformance). The extract is then injected by turning the valve so that the mobile phase flowsthrough the loop. This procedure virtually eliminates dead volume in the injector and is fullycompatible with automated operation.
4.5.1 When the extract is highly viscous, a pressure spike results which canautomatically shut off the HPLC pump.
4.5.2 Contamination of subsequent injections may occur when the extract containsmaterial that is not soluble in the mobile phase.
4.5.3 Injection loops are easily changed but analysts must ensure that the compressionfittings are properly installed to prevent leaks. Injectors require maintenance, as the surfacesthat turn past each other do wear down.
4.6 HPLC pumps
The mobile phase used for HPLC must be accurately pressurized before it enters the injector.HPLC pumps are generally capable of delivering solvent at 5000 psi with excellent precision. Therate of delivery depends on the column that is used for the separation. Most environmental methodsrecommend flow rates of 0.25-1.0 mL/min. Flow rates should be checked by collecting columneffluent in a graduated cylinder.

CD-ROM 8000B - 12 Revision 2December 1996
Most pumping systems are capable of changing solvent concentration during an analysis (i.e.,gradient elution). Gradients are generated by either high pressure mixing of two streams betweenthe pump and the injector or by proportional mixing of the solvents before they are pumped. In eithercase, solvent mixing can cause changes in the solubility of dissolved gases, the formation of bubblesin the mobile phase, or non-reproducible gradients.
4.6.1 Air bubbles result in erratic baseline and, in the case of low pressure mixing,bubbles can cause the pump to cavitate. Therefore, HPLC solvents should be degassed priorto use.
4.6.2 Non-reproducible gradients can result in significant changes in retention timesfrom run to run.
4.6.3 HPLC solvents should be filtered to remove particles that cause pump pistonwear. HPLC pump maintenance includes replacing seals regularly. (Use of strong buffers orsolvents like tetrahydrofuran can significantly shorten the lifetime of pump seals.) Pumpsshould deliver solvent with minimal pulsation.
4.7 HPLC Columns
These columns must be constructed with minimum dead volume and a narrow particle sizedistribution. HPLC columns are generally constructed of stainless steel tubing and are sealed withcompression fittings. Manufacturers provide columns that are bonded with different alkyl groups(e.g., C , cyano, TMS), have different percent carbon loading, are packed with different particle18
sizes (3-10 µm), and are packed with particles of different pore size (smaller pores mean greatersurface area), or are of different dimensions.
4.7.1 Columns with higher percent loading have the capacity to analyze somewhatlarger samples, but extremely high loadings may contribute to problems with the particle beamMS interface.
4.7.2 Columns with free silol groups show less tailing of polar materials (e.g., amines).
4.7.3 A smaller particle (and pore) size generally gives better resolution, higher backpressure, and smaller sample capacity. Columns with 3 µm particle size may have shortlifetimes when they are used for the analysis of complex waste extracts.
4.7.4 Improvements in column packing have resulted in 10 and 15 cm columns thatprovide the separating power necessary for most environmental and waste analyses.
4.7.5 Internal diameters of columns used for environmental and waste analysis aregenerally 2-5 mm. Narrower columns are called microbore columns. While they provide betterseparations, they become fouled more easily.
4.7.6 The lifetime and performance of HPLC columns can be improved through propermaintenance. Analysts should filter sample extracts, use compatible guard columns, checkfor clogged frits and for column voids. Columns should not be stored dry or containing strongbuffers.

CD-ROM 8000B - 13 Revision 2December 1996
4.8 HPLC column temperature control ovens
HPLC retention times are much more reproducible if the column is held at a constanttemperature. Temperature control ovens capable of maintaining the HPLC column at ± 0.1EC shouldbe utilized to maintain consistent retention times throughout the course of an HPLC analysis. Normaloven operating temperature would be 3-5EC above ambient laboratory temperature.
4.9 HPLC detectors
Detectors are the transducers that respond to components that elute from a HPLC column andproduce the electrical signal that is used for quantitative determinations. SW-846 analyses areconducted using selective detectors or mass spectrometers listed in Sec. 1.1. HPLC/MS requiresthe use of a sophisticated interface that separates target analytes from the aqueous mobile phase.Examples include the thermospray (TSP), electrospray (ESP), and the particle beam (PB) interfaces.
4.10 Data systems
Raw chromatographic data have to be reduced in order to provide the quantitative informationrequired by analysts. The use of sophisticated data systems is strongly recommended for SW-846chromatographic methods. The ability to store and replot chromatographic data is invaluable duringdata reduction and review. Organizations should establish their priorities and select the system thatis most suitable for their applications.
4.11 Supplies
Chromatographers require a variety of supplies. The specific items that should be stockeddepend on laboratory instrumentation and the analyses performed. At a minimum, laboratories needPTFE tape, stainless steel regulators, acid-washed copper tubing, and syringes, and replacementparts for instruments.
4.11.1 Laboratories performing GC analyses also require high purity gases, scrubbersfor gas conditioning, gas-tight fittings, capillary cutters, magnifying glasses, septa with propertemperature limits, appropriate ferrules, dichlorodimethylsilane (for deactivating surfaces),glass wool, spare columns, and injection port liners.
4.11.2 Laboratories performing HPLC analyses require high purity solvents, columnpacking material, frits, 1/16-inch tubing, appropriate ferrules, solvent filtration apparatus, andsolvent degassing apparatus.
5.0 REAGENTS
See the specific extraction and determinative methods for the reagents needed.
6.0 SAMPLE COLLECTION, PRESERVATION, AND HANDLING
Refer to Chapter Four, Organic Analytes, Sec. 4.1, for information on sample collection,preservation and handling procedures. Additional information may be found in some of the individualsample extraction, preparation, and determinative methods.

CD-ROM 8000B - 14 Revision 2December 1996
7.0 PROCEDURE
Extraction and cleanup are critical for the successful analyses of environmental samples andwastes. Analysts should pay particular attention to selection of sample preparation procedures toobtain reliable measurements.
7.1 Extraction
The individual determinative methods for organic analytes in SW-846 often recommendappropriate sample extraction procedures. General guidance on semivolatile extraction procedurescan be found in Method 3500. Guidance on volatile procedures can be found in Method 5000.
7.2 Cleanup and separation
The individual determinative methods for organic analytes in SW-846 often recommendappropriate cleanup procedures. General guidance on cleanup procedures can be found in Method3600. While some relatively clean matrices (such as ground water samples) may not requireextensive cleanups, the analyst should carefully balance the time savings gained by skippingcleanups against the potential increases in instrument down time and loss of data quality that canoccur as a result.
7.3 Recommended chromatographic columns and instrument conditions are described ineach determinative method. As noted earlier, these columns and conditions are typically those usedduring the development and testing of the method. However, other chromatographic systems mayhave somewhat different characteristics. In addition, analytical instrumentation continues to evolve.Therefore, SW-846 methods allow analysts some flexibility to change these conditions (with certainexceptions), as long as they demonstrate adequate performance.
Chromatographic performance is demonstrated by the resolution of standards and the abilityto model the response of the detector during calibration, and by the sensitivity, accuracy, precision,frequency of false positives, and frequency of false negatives during analysis. If the laboratoryemploys an alternative chromatographic procedure or alternative conditions, then the laboratory mustdemonstrate that the performance satisfies the analytical requirements of the specific application forwhich the alternative chromatographic procedure is being used. Such demonstrations should beperformed using the procedures outlined in Secs. 8.2 to 8.5 of this method and those in ChapterOne.
7.4 Initial Calibration
Calibration of an analytical instrument involves the delineation of the relationship between theresponse of the instrument and the amount or concentration of an analyte introduced into theinstrument. The graphical depiction of this relationship is often referred to as the calibration curve.In order to perform quantitative measurements, this relationship must be established prior to theanalysis of any samples, and thus, is termed initial calibration.
Historically, many analytical methods have relied on linear models of the calibrationrelationship, where the instrument response is directly proportional to the amount of a targetcompound. The linear model has many advantages, among them, simplicity and ease of use.Unfortunately, given the advent of new detection techniques and the fact that many techniquescannot be optimized for all of the analytes to which they may be applied, the analyst is increasinglylikely to encounter situations where the linear model neither applies nor is appropriate.

CD-ROM 8000B - 15 Revision 2December 1996
The initial calibration for SW-846 chromatographic methods involves the analysis of standardscontaining the target compounds at a minimum of five different concentrations covering the workingrange of the instrument. In order to produce acceptable sample results, the response of theinstrument must be within the working range established by the initial calibration. The extrapolationof the calibration to concentrations above or below those of the actual calibration standards is notappropriate and may lead to significant quantitative errors regardless of the calibration modelchosen. Analysts are advised that it may be necessary to prepare calibration standards that coverconcentration ranges that are appropriate for specific projects or type of analyses. For instance, theanalyst should not necessarily expect to be able to perform a calibration appropriate for sub-ppb levelanalyses and also use the same calibration data for high-ppb or ppm level samples.
The specific options for evaluating the initial calibration are described in Sec. 7.5. Theremainder of this section describes the preparation of calibration standards, the use of external andinternal standard calibrations, and the calculation of both calibration factors and response factors.
7.4.1 Calibration standards are prepared using the procedures indicated in Sec. 5.0 ofthe determinative method of interest. However, the general procedure is described here.
7.4.1.1 For each analyte and surrogate of interest, prepare calibration standardsat a minimum of five different concentrations by adding volumes of one or more stockstandards to volumetric flasks and diluting to volume with an appropriate solvent.
7.4.1.2 The lowest concentration calibration standard that is analyzed duringan initial calibration establishes the method quantitation limit based on the final volumeof extract (or sample) described in the preparative method or employed by the laboratory.
7.4.1.3 The other concentrations should define the working range of thedetector or correspond to the expected range of concentrations found in actual samplesthat are also within the working range of the detector.
7.4.1.4 For each analyte, at least one of the calibration standards shouldcorrespond to a sample concentration at or below that necessary to meet the data qualityobjectives of the project, which may include establishing compliance with a regulatory oraction limit.
7.4.1.5 Given the number of target compounds addressed by some of themethods listed in Sec. 1.1, it may be necessary to prepare several sets of calibrationstandards, each set consisting of five solutions at different concentrations. The initialcalibration will then involve the analysis of each of these sets of five standards.
7.4.1.6 Once the standards have been prepared, the initial calibration beginsby establishing chromatographic operating parameters that provide instrumentperformance equivalent to that documented in Sec. 7.0 of the determinative method ofinterest, or that is appropriate for the data quality objectives of the intended application.
7.4.2 External standard and internal standard calibration techniques
The chromatographic system may be calibrated using either the external standard or theinternal standard techniques described below. General calibration criteria are provided in thissection for GC and HPLC procedures using non-MS detection. The applicable calibrationprocedures for GC/MS (e.g., Methods 8260, 8270, 8280, and 8290), HPLC/MS (e.g., Methods8321 and 8325), and GC/FT-IR (e.g., Method 8410) are described in those methods. Some
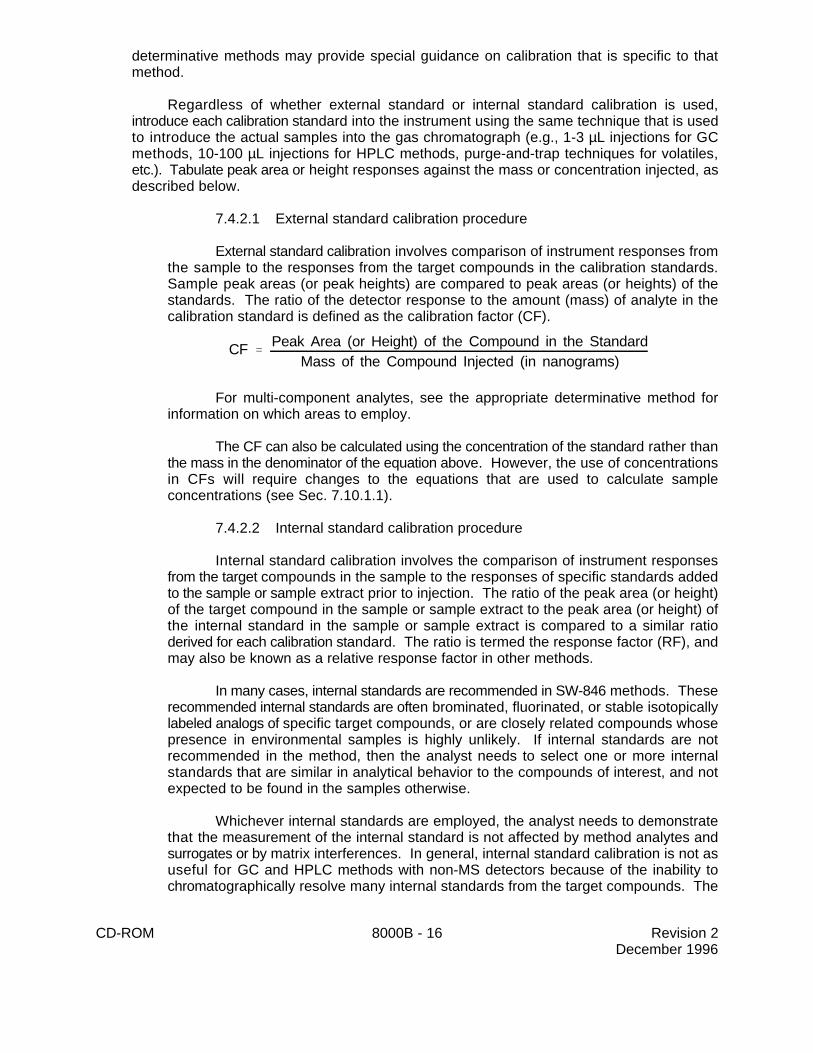
CF 'Peak Area (or Height) of the Compound in the Standard
Mass of the Compound Injected (in nanograms)
CD-ROM 8000B - 16 Revision 2December 1996
determinative methods may provide special guidance on calibration that is specific to thatmethod.
Regardless of whether external standard or internal standard calibration is used,introduce each calibration standard into the instrument using the same technique that is usedto introduce the actual samples into the gas chromatograph (e.g., 1-3 µL injections for GCmethods, 10-100 µL injections for HPLC methods, purge-and-trap techniques for volatiles,etc.). Tabulate peak area or height responses against the mass or concentration injected, asdescribed below.
7.4.2.1 External standard calibration procedure
External standard calibration involves comparison of instrument responses fromthe sample to the responses from the target compounds in the calibration standards.Sample peak areas (or peak heights) are compared to peak areas (or heights) of thestandards. The ratio of the detector response to the amount (mass) of analyte in thecalibration standard is defined as the calibration factor (CF).
For multi-component analytes, see the appropriate determinative method forinformation on which areas to employ.
The CF can also be calculated using the concentration of the standard rather thanthe mass in the denominator of the equation above. However, the use of concentrationsin CFs will require changes to the equations that are used to calculate sampleconcentrations (see Sec. 7.10.1.1).
7.4.2.2 Internal standard calibration procedure
Internal standard calibration involves the comparison of instrument responsesfrom the target compounds in the sample to the responses of specific standards addedto the sample or sample extract prior to injection. The ratio of the peak area (or height)of the target compound in the sample or sample extract to the peak area (or height) ofthe internal standard in the sample or sample extract is compared to a similar ratioderived for each calibration standard. The ratio is termed the response factor (RF), andmay also be known as a relative response factor in other methods.
In many cases, internal standards are recommended in SW-846 methods. Theserecommended internal standards are often brominated, fluorinated, or stable isotopicallylabeled analogs of specific target compounds, or are closely related compounds whosepresence in environmental samples is highly unlikely. If internal standards are notrecommended in the method, then the analyst needs to select one or more internalstandards that are similar in analytical behavior to the compounds of interest, and notexpected to be found in the samples otherwise.
Whichever internal standards are employed, the analyst needs to demonstratethat the measurement of the internal standard is not affected by method analytes andsurrogates or by matrix interferences. In general, internal standard calibration is not asuseful for GC and HPLC methods with non-MS detectors because of the inability tochromatographically resolve many internal standards from the target compounds. The

RF 'As × Cis
Ais × Cs
CD-ROM 8000B - 17 Revision 2December 1996
use of MS detectors makes internal standard calibration practical because the massesof the internal standards can be resolved from those of the target compounds even whenchromatographic resolution cannot be achieved.
When preparing calibration standards for use with internal standard calibration,add the same amount of the internal standard solution to each calibration standard, suchthat the concentration of each internal standard is constant across all of the calibrationstandards, whereas the concentrations of the target analytes will vary. The internalstandard solution will contain one or more internal standards and the concentration of theindividual internal standards may differ within the spiking solution (e.g., not all internalstandards need to be at the same concentration in this solution). The mass of eachinternal standard added to each sample extract immediately prior to injection into theinstrument or to each sample prior to purging must be the same as the mass of theinternal standard in each calibration standard. The volume of the solution spiked intosample extracts should be such that minimal dilution of the extract occurs (e.g., 10 µLof solution added to a 1 mL final extract results in only a negligible 0.1% change in thefinal extract volume which can be ignored in the calculations).
An ideal internal standard concentration would yield a response factor of 1 foreach analyte. However, this is not practical when dealing with more than a few targetanalytes. Therefore, as a general rule, the amount of internal standard should producean instrument response (e.g., area counts) that is no more than 100 times that producedby the lowest concentration of the least responsive target analyte associated with theinternal standard. This should result in a minimum response factor of approximately 0.01for the least responsive target compound.
For each of the initial calibration standards, calculate the RF values for eachtarget compound relative to one of the internal standards as follows:
where:
A = Peak area (or height) of the analyte or surrogate.s
A = Peak area (or height) of the internal standard.is
C = Concentration of the analyte or surrogate, in µg/L.s
C = Concentration of the internal standard, in µg/L.is
Note that in the equation above, RF is unitless, i.e., the units from the two areaterms and the two concentration terms cancel out. Therefore, units other than µg/L maybe used for the concentrations of the analyte, surrogate, and internal standard, providedthat both C and C are expressed in the same units. The mass of the analyte ands is
internal standard may also be used in calculating the RF value.
7.5 Calibration linearity
SW-846 chromatographic methods allow the use of both linear and non-linear models for thecalibration data, as described below. Given the limitations in instrument data systems, it is likely thatthe analyst will have to choose one model for all analytes in a particular method. Both models canbe applied to either external or internal standard calibration data.

mean CF ' CF '
jn
i'1CFi
nmean RF ' RF '
jn
i'1RFi
n
SD '
jn
i'1(CFi&CF)2
n&1SD '
jn
i'1(RFi&RF)2
n&1
CD-ROM 8000B - 18 Revision 2December 1996
NOTE: The option for non-linear calibration may be necessary to achieve low detection limits orto address specific instrumental techniques. However, it is not EPA's intent to allownon-linear calibration to be used to compensate for detector saturation at higherconcentrations or to avoid proper instrument maintenance.
Whichever calibration model is employed, a unique analyte or surrogate concentration mustfall within the calibration range. Samples with concentrations that exceed the calibration range mustbe diluted to fall within the range.
NOTE: The following sections describe various options for initial calibration and provide thecalibration acceptance criteria used to evaluate each option. The criteria listed in thesesections are designed for quantitation of trace level concentrations of the analytes ofinterest. If data of lesser quality will satisfy project-specific data needs, then lessstringent criteria may be employed, provided that they are documented and approved ina project-specific QA project plan.
The choice of a specific calibration model should be made in one of two ways. The first is tobegin with the simplest approach, the linear model through the origin, and progressing through theother options until the calibration acceptance criteria are met. The second approach is to use a prioriknowledge of the detector response to choose the calibration model. Such knowledge may comefrom previous experience, knowledge of the physics of the detector, or specific manufacturer'srecommendations.
7.5.1 Linear calibration using the average calibration or response factor
When calculated as described in Sec. 7.4, both calibration factors and response factorsare a measure of the slope of the calibration relationship and assume that the curve passesthrough the origin. Under ideal conditions, the factors will not vary with the concentration ofthe standard that is injected into the instrument. In practice, some variation is to be expected.However, when the variation, measured as the relative standard deviation (RSD), is less thanor equal to 20%, the use of the linear model is generally appropriate, and the calibration curvecan be assumed to be linear and to pass through the origin.
NOTE: Linearity through zero is a statistical assumption and not a rationale for reportingresults below the calibration range demonstrated by the analysis of the standards
To evaluate the linearity of the initial calibration, calculate the mean CF (externalstandard calibration) or RF (internal standard calibration), the standard deviation (SD), and theRSD as follows:

RSD 'SD
CF× 100 RSD '
SD
RF× 100
CD-ROM 8000B - 19 Revision 2December 1996
where n is the number of calibration standards and RSD is expressed as a percentage (%).
If the RSD of the calibration or response factors is less than or equal to 20% over thecalibration range, then linearity through the origin may be assumed, and the average calibrationor response factor may be used to determine sample concentrations.
7.5.1.1 Given the potentially large numbers of analytes that may be analyzedin some methods, it is likely that some analytes may exceed the 20% acceptance limitfor the RSD for a given calibration. In those instances, the following steps arerecommended, but not required.
The first step is generally to check the instrument operating conditions. Thesuggested maintenance procedures in Sec. 7.11 may be useful in guiding suchadjustments. This option will apply in those instances where a linear instrumentresponse is expected. It may involve some trade-offs to optimize performance acrossall target analytes. For instance, changes to the operating conditions necessary toachieve linearity for problem compounds may cause the RSD for other compounds toincrease, but as long as all analytes meet the RSD limits for linearity, the calibration isacceptable.
If the RSD for any analyte is greater than 20%, the analyst may wish to review theresults (area counts, calibration or response factors, and RSD) for those analytes toensure that the problem is not associated with just one of the five initial calibrationstandards. If the problem appears to be associated with a single standard, that onestandard may be reanalyzed and the RSD recalculated. Replacing the standard may benecessary in some cases.
A third alternative is to narrow the calibration range by replacing one or more ofthe calibration standards with standards that cover a narrower range. If linearity can beachieved using a narrower calibration range, document the calibration linearity, andproceed with analyses. The changes to the upper end of the calibration range will affectthe need to dilute samples above the range, while changes to the lower end will affectthe overall sensitivity of the method. Consider the regulatory limits or action levelsassociated with the target analytes when adjusting the lower end of the range.
NOTE: As noted in Sec. 7.4.1.2, the method quantitation limit is established by theconcentration of the lowest standard analyzed during the initial calibration.Hence, narrowing the calibration range by changing the concentration of thelowest standard will, by definition, change the method quantitation limit.When the purpose of the analysis is to demonstrate compliance with aspecific regulatory limit or action level, the analyst must ensure that themethod quantitation limit is at least as low as the regulatory limit or actionlevel.
7.5.1.2 In those instances where the RSD for one or more analytes exceeds20%, the initial calibration may still be acceptable if the following conditions are met:

1
SD 2
CD-ROM 8000B - 20 Revision 2December 1996
7.5.1.2.1 The mean of the RSD values for all analytes in thecalibration is less than or equal to 20%. The mean RSD is calculated bysumming the RSD value for each analyte and dividing by the total number ofanalytes. If no analyte has an RSD above 20%, then the mean RSD calculationneed not be performed.
7.5.1.2.2 The mean RSD criterion applies to all analytes in thestandards, regardless of whether or not they are of interest for a specific project.In other words, if the target analyte is part of the calibration standard, its RSDvalue is included in the evaluation.
7.5.1.2.3 The data user must be provided with either a summary ofthe initial calibration data or a specific list of those compounds for which the RSDexceeded 20% and the results of the mean RSD calculation.
NOTE: The analyst and the data user must be aware that the use of theapproach listed in Sec. 7.5.1.2.1 (i.e., the average of all RSD values #20%) will lead to greater uncertainty for those analytes for which theRSD is greater than 20%. The analyst and the data user should reviewthe associated quality control results carefully, with particular attentionto the matrix spike and laboratory control sample results (see Sec. 8.0),to determine if the calibration linearity poses a significant concern. Ifthis approach is not acceptable for a particular application, then theanalyst may need to employ one of the other calibration approaches(see Secs. 7.5.2 to 7.5.4) or adjust the instrument operating conditionsand/or the calibration range until the RSD is # 20%.
7.5.1.3 If all of the conditions in Sec. 7.5.1.2 are met, then the averagecalibration or response factor may be used to determine sample concentrations, asdescribed in Sec. 7.10.
7.5.2 Linear calibration using a least squares regression
If the RSD of the calibration or response factors is greater than 20% over the calibrationrange, then linearity through the origin cannot be assumed. If this is the case, the analyst mayemploy a regression equation that does not pass through the origin. This approach may alsobe employed based on past experience or a priori knowledge of the instrument response.Further, at the discretion of the analyst, this approach also may be used for analytes that domeet the RSD limits in Sec. 7.5.1.
This is most easily achieved by performing a linear regression of the instrument responseversus the concentration of the standards. Make certain that the instrument response istreated as the dependent variable (y) and the concentration as the independent variable (x).This is a statistical requirement and is not simply a graphical convention.
The analyst may also employ a weighted least squares regression if replicate multi-pointcalibrations have been performed, e.g., three 5-point curves. For all other instances, anappropriate unweighted least squares method should be used. When using a weighted linearleast squares regression, the following weighting factor should be used:

y ~ ax % b
x '(y & b)
a
AsCis
Ais
' aCs % b
CD-ROM 8000B - 21 Revision 2December 1996
where SD is the standard deviation of the replicate results at each individual standardconcentration.
The regression will produce the slope and intercept terms for a linear equation in theform:
where:
y = Instrument response (peak area or height)a = Slope of the line (also called the coefficient of x)x = Concentration of the calibration standardb = The intercept
The analyst should not force the line through the origin, but have the intercept calculatedfrom the five data points. Otherwise, the problems noted with the RSD value will occur, i.e.,a line through the origin will not meet the QC specifications. In addition, do not include theorigin (0,0) as a sixth calibration point. The use of a linear regression may not be used as arationale for reporting results below the calibration range demonstrated by the analysis of thestandards. The regression calculation will generate a correlation coefficient (r) that is ameasure of the "goodness of fit" of the regression line to the data. A value of 1.00 indicatesa perfect fit. In order to be used for quantitative purposes, r must be greater than or equal to0.99.
In calculating sample concentrations by the external standard method, the regressionequation is rearranged to solve for the concentration (x), as shown below.
When a weighted linear least squares regression is employed, the regression equationbecomes:
y = 1 (ax + b)SD2
which may be rearranged to solve for x, the concentration. Using internal standardquantitation, the regression equation is rearranged as shown below:
where:
A = Area (or height) of the peak for the target analyte in the samples
A = Area (or height) of the peak for the internal standardis
C = Concentration of the target analyte in the calibration standards
C = Concentration of the internal standardis
a = Slope of the line (also called the coefficient of C )s
b = The intercept
In calculating sample concentrations by the internal standard method, the regression equationis rearranged to solve for the concentration of the target analyte (C ), as shown below.s

Cs '
AsCis
Ais
& b
a
y ' ax 3 % bx 2 % cx % d
y ' f(a,b,c,d,x)
CD-ROM 8000B - 22 Revision 2December 1996
7.5.3 Non-linear calibration
In situations where the analyst knows that the instrument response does not follow alinear model over a sufficiently wide working range, or when the other approaches describedhere have not met the acceptance criteria, a non-linear calibration model may be employed.
NOTE: It is not EPA's intent to allow non-linear calibration to be used to compensate fordetector saturation at higher concentrations or to avoid proper instrumentmaintenance. Thus, non-linear calibration should not be employed for methodsor instruments previously shown to exhibit linear calibration for the analytes ofinterest.
When using a calibration model for quantitation, the curve must be continuous,continuously differentiable and monotonic over the calibration range. The model chosenshould have no more than four parameters, i.e., if the model is polynomial, it may be no morethan third order, as in the equation:
As noted above, the model must be continuous. A curve is continuous when it hasconsecutive numerical values along the function, whether increasing or decreasing, andwithout having breaks in the function (i.e., the pen shall never leave the paper from theminimum to the maximum). The model must also be continuously differentiable, such that allderivatives of the function are continuous functions themselves, and monotonic, such that alltangent lines of the derivative to all of the points on the calibration curve have either onlypositive or negative slopes.
If the model is not a polynomial, it should not include more than four parameters, i.e.,
where "f" indicates a function with up to four parameters.
In estimating model parameters for the calibration data, the instrumental response (y)must be treated as the dependent variable, and the calibration of the concentration standard(x) must be the independent variable. Do not force the line through the origin, i.e., do not setthe intercept as 0, and do not include the origin (0,0) as a calibration point. Model estimatesfrom the regression must be used as calculated, i.e., if the model is a polynomial, the interceptis d and may not be set to 0. Weighting in a calibration model may significantly improve itsaccuracy.
The statistical considerations in developing a non-linear calibration model require moredata than the more traditional linear approaches described above. Whereas SW-846 methodsemploy five standards for a linear (first order) calibration model, a quadratic (second order)model requires six standards, and a third order polynomial requires seven standards.

COD '
jn
i'1(yobs & y)2
&n & 1n & p j
n
i'1(yobs & Yi)
2
jn
i'1(yobs & y)2
CD-ROM 8000B - 23 Revision 2December 1996
Most curve fitting programs will use some form of least squares minimization to adjustthe coefficients of the polynomial (a,b,c, and d, above) to obtain the polynomial that best fitsthe data. The "goodness of fit" of the polynomial equation is evaluated by calculating theweighted coefficient of the determination (COD).
where:
y = Observed response (area) for each concentration from each initial calibrationobs
standard&y = Mean observed response from the initial calibrationY = Calculated (or predicted) response at each concentration from the initiali
calibration(s)n = Total number of calibration points (i.e., 6 for a quadratic model; 7 for a third
order model)p = Number of adjustable parameters in the polynomial equation (i.e., 3 for a third
order; 2 for a second order polynomial)
Under ideal conditions, with a "perfect" fit of the model to the data, the coefficient of thedetermination will equal 1.0. In order to be an acceptable non-linear calibration, the COD mustbe greater than or equal to 0.99.
As noted in Sec. 7.5, whichever of these options is employed, a unique analyte orsurrogate concentration must fall within the calibration range. Analysts are advised to checkboth second and third order calibration models to ensure that this holds true (e.g., noparabolas or repeating functions in the calibration range). Samples with concentrations thatexceed the calibration range must be diluted to fall within the range.
7.5.4 Data transformations
An understanding of the fundamental behavior of the detector may be used to choosea data transformation that will then allow for a simple calibration model. For example theresponse of a flame photometric detector in the sulfur mode is known to be proportional to thesquare of the sulfur concentration. Therefore, using the data system to take the square rootof the instrument response before integration or the square root of the peak height allows fora calibration factor approach rather than a polynomial calibration curve. Instrument responsemay be transformed prior to any calculations (including integration) subject to the followingconstraints:
7.5.4.1 Any parameters used in the transformation should be fixed for thecalibration and all subsequent analyses and verifications until the next calibration.
7.5.4.2 The transformation model chosen should be consistent with thebehavior of the instrument and detector. All data transformations must be clearly definedand documented by the analyst and related back to the fundamental behavior of thedetector. In other words, this approach may not be used in the absence of specificknowledge about the behavior of the detector, nor as a "shot in the dark" to describe thecalibration.
CD-ROM 8000B - 24 Revision 2December 1996
7.5.4.3 No transformations should be performed on areas or other results (e.g.,the transformation must be applied to the instrument response itself).
7.5.4.4 When the transformed data are used to develop calibration factors,those factors must meet the acceptance criteria described in Sec. 7.5.1.
7.6 Retention time windows
Retention time windows are crucial to the identification of target compounds. Absoluteretention times are used for compound identification in all GC and HPLC methods that do not employinternal standard calibration. Retention time windows are established to compensate for minor shiftsin absolute retention times as a result of sample loadings and normal chromatographic variability.The width of the retention time window should be carefully established to minimize the occurrenceof both false positive and false negative results. Tight retention time windows may result in falsenegatives and/or may cause unnecessary reanalysis of samples when surrogates or spikedcompounds are erroneously not identified. Overly wide retention time windows may result in falsepositive results that cannot be confirmed upon further analysis.
The following subsections describe one approach that may be used to establish retention timewindows for GC and HPLC methods. Other approaches may be employed, provided that the analystcan demonstrate that they provide performance appropriate for the intended application.
NOTE: The criteria listed in Sec. 7.6 are provided for GC and HPLC procedures using non-MSor FTIR detection. Identification procedures are different for GC/MS (e.g., Methods 8260and 8270), HPLC/MS (e.g., Methods 8321 and 8325), and GC/FT-IR (e.g., Method 8410).
7.6.1 Before establishing retention time windows, make sure that the chromatographicsystem is operating reliably and that the system conditions have been optimized for the targetanalytes and surrogates in the sample matrix to be analyzed. Make three injections of allsingle component standard mixtures and multi-component analytes (such as PCBs) over thecourse of a 72-hour period. Serial injections or injections over a period of less than 72 hoursmay result in retention time windows that are too tight.
7.6.2 Record the retention time for each single component analyte and surrogate tothree decimal places (e.g., 0.007). Calculate the mean and standard deviation of the threeabsolute retention times for each single component analyte and surrogate. Formulti-component analytes, choose three to five major peaks (see the determinative methodsfor more details) and calculate the mean and standard deviation of those peaks.
7.6.3 If the standard deviation of the retention times for a target compound is 0.000(i.e., no difference between the absolute retention times), then the laboratory may either collectdata from additional injections of standards or use a default standard deviation of 0.01 minutes.(Recording retention times to three decimal places rather than only two should minimize theinstances in which the standard deviation is calculated as 0.000).
7.6.4 The width of the retention time window for each analyte, surrogate, and majorconstituent in multi-component analytes is defined as ± 3 times the standard deviation of themean absolute retention time established during the 72-hour period. If the default standarddeviation in Sec. 7.6.3 is employed, the width of the window will be 0.03 minutes.
7.6.5 Establish the center of the retention time window for each analyte and surrogateby using the absolute retention time for each analyte and surrogate from the calibration

CD-ROM 8000B - 25 Revision 2December 1996
verification standard at the beginning of the analytical shift. For samples run during the sameshift as an initial calibration, use the retention time of the mid-point standard of the initialcalibration.
7.6.6 The laboratory must calculate absolute retention time windows for each analyteand surrogate on each chromatographic column and instrument. New retention time windowsmust be established when a new GC column is installed. The retention time windows shouldbe reported with the analysis results in support of the identifications made.
7.6.7 If the instrument data system is not capable of employing compound-specificretention time windows, then the analyst may choose the widest window and apply it to allcompounds. As noted above, other approaches may also be employed, but must bedocumented by the analyst.
7.6.8 The surrogates are added to each sample, blank, and QC sample and are alsocontained in each calibration standard. Although the surrogates may be diluted out of certainsample extracts, their retention times in the calibration standards may be useful in trackingretention time shifts. Whenever the observed retention time of a surrogate is outside of theestablished retention time window, the analyst is advised to determine the cause and correctthe problem before continuing analyses.
7.7 Calibration verification
The calibration relationship established during the initial calibration (Sec. 7.5) must be verifiedat periodic intervals. The process of calibration verification applies to both external standard andinternal standard calibration techniques, as well as to linear and non-linear calibration models.
As a general rule, the initial calibration in an SW-846 method must be verified at the beginningof each 12-hour analytical shift during which samples are analyzed. (Some methods may specifymore frequent verifications). The 12-hour analytical shift begins with the injection of the calibrationverification standard (or the MS tuning standard in MS methods). The shift ends after the completionof the analysis of the last sample or standard that can be injected within 12 hours of the beginningof the shift.
If the response (or calculated concentration) for an analyte is within ±15% of the responseobtained during the initial calibration, then the initial calibration is considered still valid, and theanalyst may continue to use the CF or RF values from the initial calibration to quantitate sampleresults. The ±15% criterion may be superseded in certain determinative methods.
Except where the determinative method contains alternative calibration verification criteria, ifthe response (or calculated concentration) for any analyte varies from the mean response obtainedduring the initial calibration by more than ±15%, then the initial calibration relationship may no longerbe valid.
NOTE: The process of calibration verification is fundamentally different from the approach called"continuing calibration" in some methods from other sources. As described in thosemethods, the calibration factors or response factors calculated during continuingcalibration are used to update the calibration factors or response factors used for samplequantitation. This approach, while employed in other EPA programs, amounts to a dailysingle-point calibration, and is not appropriate nor permitted in SW-846 chromatographicprocedures for trace environmental analyses.

% Drift 'Calculated concentration & Theoretical concentration
Theoretical concentration× 100
% Difference 'CFv & CF
CF× 100 or '
RFv & RF
RF× 100
CD-ROM 8000B - 26 Revision 2December 1996
In keeping with the approach described for initial calibration in Sec 7.5, if the average of theresponses for all analytes is within 15%, then the calibration has been verified. However, theconditions in Sec. 7.5.1.2 also apply, e.g., the average must include all analytes in the calibration,regardless of whether they are target analytes for a specific project, and the data user must beprovided with the calibration verification data or a list of those analytes that exceeded the 15% limit.The effect of using the average of the response for all analytes for calibration verification will besimilar to that for the initial calibration -- namely, that the quantitative results for those analytes wherethe difference is greater than 15% will include a greater uncertainty. The analyst and the data usershould review the note in Sec. 7.5.1.2.
If the calibration does not meet the 15% limit (either on the basis of each compound or theaverage across all compounds), check the instrument operating conditions, and if necessary, restorethem to the original settings, and inject another aliquot of the calibration verification standard. If theresponse for the analyte is still not within ±15%, then a new initial calibration must be prepared.
7.7.1 Verification of linear calibrations
Calibration verification for linear calibrations involves the calculation of the percent driftor the percent difference of the instrument response between the initial calibration and eachsubsequent analysis of the verification standard. Use the equations below to calculate % Driftor % Difference, depending on the procedure specified in the determinative method.
where the calculated concentration is determined using the mean calibration factor or responsefactor from the initial calibration and the theoretical concentration is the concentration at whichthe standard was prepared.
where CF and RF are the calibration factor and the response factor (whichever applies) fromv v
the analysis of the verification standard, and CF and RF are the mean calibration factor and–– ––
mean response factor from the initial calibration. Except where superseded in certaindeterminative methods, the % difference or % drift calculated for the calibration verificationstandard must be within ±15% for each analyte, or averaged across all analytes (see Sec 7.7),before any sample analyses may take place.
7.7.2 Verification of a non-linear calibration
Calibration verification of a non-linear calibration is performed using the percent driftcalculation described in Sec. 7.7.1, above. Except where superseded in certain determinativemethods, the % drift calculated for the calibration verification standard must be within ±15%for each analyte, or averaged across all analytes (see Sec 7.7), before any sample analysesmay take place. It may also be appropriate to employ two standards at differentconcentrations to verify the calibration. In this instance, one standard should be near theinflection point in the curve. The choice of specific standards and concentrations is generallya method- or project-specific consideration.

CD-ROM 8000B - 27 Revision 2December 1996
7.7.3 Regardless of whether a linear or non-linear calibration model is used, if eitherthe percent drift or percent difference criterion is not met, then no sample analyses may takeplace until the calibration has been verified or a new initial calibration is performed that meetsthe specifications in Sec. 7.5 and those in the determinative method. If the calibration cannotbe verified after the analysis of a single verification standard, then adjust the instrumentoperating conditions and/or perform instrument maintenance (see Sec. 7.11), and analyzeanother aliquot of the verification standard. If the calibration cannot be verified with the secondstandard, then a new initial calibration must be performed.
7.7.4 All target analytes and surrogates, including those reported as non-detects, mustbe included in a periodic calibration for purposes of retention time confirmation and todemonstrate that calibration verification criteria are being met. The frequency of this periodiccalibration is project-, method-, and analyte-specific.
7.7.5 Calibration verification may be performed using both high and low concentrationstandards from time to time. This is particularly true when the ECD or ELCD is used. Thesedetectors drift and are not as stable as FID or FPD, and periodic use of the high and lowconcentration standards serves as a further check on the initial calibration. The concentrationsof these standards should generally reflect those observed in samples.
7.7.6 Additional analyses of the mid-point calibration verification standard during a12-hour analytical shift are strongly recommended for methods involving external standardcalibration. If the response for any analyte varies from the average initial calibration responseby more than 15% in these additional determinations, corrective action (see Sec. 7.11) maybe necessary to restore the system or a new calibration curve should be prepared for thatcompound.
The frequency of verification necessary to ensure accurate measurement is dependenton the detector and the sample matrix. Very sensitive detectors that operate in thesub-nanogram range are generally more susceptible to changes in response caused by columncontamination and sample carryover. Therefore, more frequent verification of calibration (i.e.,after every 10 samples) may be necessary for the electron capture, electrochemicalconductivity, photoionization, and fluorescence detectors.
Sec. 8.2.2 specifies that samples analyzed using external standards must be bracketedby periodic analyses of standards that meet the QC acceptance criteria (e.g., calibration andretention time). Therefore, more frequent analyses of standards will minimize the number ofsample extracts that would have to be reinjected if the QC limits are violated for the standardanalysis. The results from these bracketing standards must meet the calibration verificationcriteria in Sec. 7.7.1 and 7.7.2 and the retention time criteria in Sec. 7.6. However, if thestandard analyzed after a group of samples exhibits a response for an analyte that is abovethe acceptance limit, i.e., >15%, and the analyte was not detected in any of the previoussamples during the analytical shift, then the sample extracts do not need to be reanalyzed, asthe verification standard has demonstrated that the analyte would have been detected wereit present.
7.7.7 Any method blanks specified in the preparative methods (Methods 3500 and3600) may be run immediately after the calibration verification analyses to confirm thatlaboratory contamination does not cause false positive results, or at any other time during theanalytical shift. If the method blank indicates contamination, then it may be appropriate toanalyze a solvent blank to demonstrate that the contamination is not a result of carryover fromstandards or samples.

CD-ROM 8000B - 28 Revision 2December 1996
7.8 Chromatographic analysis of samples
7.8.1 Introduction of sample extracts into the chromatograph varies, depending on thevolatility of the compound. Volatile organics are primarily introduced by purge-and-traptechniques (Method 5030, water and Method 5035, soils). However, the use of Method 5021,or another headspace technique, may be advisable for screening volatiles in some samplematrices to prevent overloading and contamination of the purge-and-trap system. Semivolatileand non-volatile analytes are introduced by direct or split/splitless injection.
7.8.1.1 Manual injection (GC)
Inject 1-5 µL of the sample extract. The use of the solvent flush technique isnecessary for packed columns. Use 1-2 µL of sample extract for capillary columns.
7.8.1.2 Automated injection (GC)
Using automated injection, smaller volumes (i.e., 1 µL) may be injected, and thesolvent flush technique is not necessary. Laboratories should demonstrate that theinjection volume is reproducible.
7.8.1.3 Purge-and-trap
Refer to Methods 5000, 5030, or 5035 for details.
7.8.1.4 Manual injection (HPLC)
Inject 10-100 µL. This is generally accomplished by over-filling the injection loopof a zero-dead-volume injector. Larger volumes may be injected if better sensitivity isrequired, however, chromatographic performance may be affected.
7.8.1.5 Automated injection (HPLC)
Inject 10-100 µL. Laboratories should demonstrate that the injection volume isreproducible. Larger volumes may be injected if greater sensitivity is required, however,chromatographic performance may be adversely affected.
7.8.2 All analyses, including field samples, matrix spike samples, matrix spikeduplicates, laboratory control samples, method blanks, and other QC samples, are performedduring an analysis sequence. The sequence begins with instrument calibration, which isfollowed by the analysis of sample extracts. Verification of calibration and retention times isnecessary no less than once every 12-hour analytical shift. The sequence ends when the setof samples has been injected or when qualitative and/or quantitative QC criteria are exceeded.As noted in Secs. 7.7.6 and 8.2.2, when employing external standard calibration, it isnecessary that a calibration verification standard be run at the end of the sequence to bracketthe sample analyses. Acceptance criteria for the initial calibration and calibration verificationare described in Secs. 7.5 - 7.7.
Analysis of calibration verification standards every 10 samples is strongly recommended,especially for the highly sensitive GC and HPLC detectors that detect sub-nanogramconcentrations. Frequent analysis of calibration verification standards helps ensure thatchromatographic systems are performing acceptably and that false positives, false negativesand poor quantitations are minimized. Samples analyzed using external standard calibration

CD-ROM 8000B - 29 Revision 2December 1996
must be bracketed by the analyses of calibration standards that meet the QC limits forverification of calibration and retention times. If criteria are exceeded, corrective action mustbe taken (see Sec. 7.11) to restore the system and/or a new calibration curve must beprepared for that compound and the samples must be reanalyzed.
Certain methods may also include QC checks on column resolution, analyte degradation,mass calibration, etc., at the beginning of a 12-hour analytical shift.
7.8.3 Sample concentrations are calculated by comparing sample responses with theinitial calibration of the system (Sec. 7.5). If sample response exceeds the limits of the initialcalibration range, dilute the extract (or sample) and reanalyze. Extracts should be diluted sothat all peaks are on scale, as overlapping peaks are not always evident when peaks are offscale. Computer reproduction of chromatograms, manipulated to ensure all peaks are onscale over a 100-fold range, is acceptable, as long as calibration limits are not exceeded.When overlapping peaks cause errors in peak area integration, the use of peak heightmeasurements is recommended.
7.8.4 If chromatographic peaks are masked by the presence of interferences, furthersample cleanup is necessary. See Method 3600 for guidance.
7.8.5 When there are a large number of target analytes, it may be difficult to fullyresolve these compounds. Examples of chromatograms for the compounds of interest areprovided in many determinative methods.
7.9 Compound Identification
Tentative identification of an analyte occurs when a peak from a sample extract falls within thedaily retention time window. Confirmation is necessary when the composition of samples is not wellcharacterized. Confirmation techniques include analysis on a second column with dissimilarstationary phase, by GC/MS (full scan or SIM) or HPLC/MS (if concentration permits), HPLC/UV dataat two different wavelengths, GC or HPLC data from two different detectors, or by other recognizedconfirmation techniques. For HPLC/UV methods, the ability to generate UV spectra with a diodearray detector may provide confirmation data from a single analysis, provided that the laboratory candemonstrate this ability for typical sample extracts (not standards) by comparison to anotherrecognized confirmation technique.
When confirmation is made on a second column, that analysis should meet all of the QCcriteria described above for calibration, retention times, etc. Confirmation is not required for GC/MSand HPLC/MS methods.
Confirmation may not be necessary if the composition of the sample matrix is well establishedby prior analyses, for instance, when a pesticide known to be produced or used in a facility is foundin a sample from that facility.
When using GC/MS for confirmation, ensure that GC/MS analysis is performed on an extractat the appropriate pH for the analyte(s) being confirmed, i.e., do not look for basic analytes in anacidic extract. Certain analytes, especially pesticides, may degrade if extraction conditions wereeither strongly acidic and/or strongly basic.
Many chromatographic interferences result from co-elution of one or more compounds with theanalyte of interest, or may be the result of the presence of a non-analyte peak in the retention timewindow of an analyte. Such co-elution problems affect quantitation as well as identification, and may

Concentration (µg/L) '(As)(Vt)(D)
(CF)(Vi)(Vs)
Concentration (µg/kg) '(As)(Vt)(D)
(CF)(Vi)(Ws)
CD-ROM 8000B - 30 Revision 2December 1996
result in poor agreement between the quantitative results from two dissimilar columns. Therefore,even when the identification has been confirmed on a dissimilar column, the analyst should evaluatethe agreement of the quantitative results on both columns, as described in Sec. 7.10.4.
7.10 Calculations
The calculation of sample results depends on the type of calibration (external or internalstandard) and the calibration model employed (linear or non-linear). The following sections describethe calculations used in each instance. Specific determinative methods may contain additionalinformation.
7.10.1 External standard calibration - linear calibration
The concentration of each analyte in the sample is determined by comparing the detectorresponse (peak area or height) to the response for that analyte in the initial calibration. Theconcentration of an analyte may be calculated as follows, depending on the sample matrix:
7.10.1.1 Aqueous samples
where:
A = Area (or height) of the peak for the analyte in the sample.s
V = Total volume of the concentrated extract (µL). For purge-and-trap analysis,t
V is not applicable and therefore is set at 1. t
D = Dilution factor, if the sample or extract was diluted prior to analysis. If nodilution was made, D = 1. The dilution factor is always dimensionless.
CF = Mean calibration factor from the initial calibration (area per ng).––
V = Volume of the extract injected (µL). The nominal injection volume fori
samples and calibration standards must be the same. For purge-and-trapanalysis, V is not applicable and therefore is set at 1. If concentration unitsi
are used in calculating the calibration factor (see Sec. 7.4.2.1), then V is noti
used in this equation.
V = Volume of the aqueous sample extracted or purged in mL. If units of literss
are used for this term, multiply the results by 1000.
Using the units specified here for these terms will result in a concentration in units ofng/mL, which is equivalent to µg/L.
7.10.1.2 Nonaqueous samples

Cs '(Cex)(Vt)
(Vs)
Concentration (µg/L) '(As)(Cis)(D)(Vi)
(Ais)(RF)(Vs)(1000)
CD-ROM 8000B - 31 Revision 2December 1996
where A , V , D, CF, and V are as described in 7.10.1.1, and s t i
––
W = Weight of sample extracted or purged (g). Either the wet weight or dry weights
may be used, depending upon the specific application of the data. If units ofkilograms are used for this term, multiply the results by 1000.
Using the units specified here for these terms will result in a concentration in units ofng/g, which is equivalent to µg/kg.
For purge-and-trap analyses where a volume of methanol extract is added toorganic-free reagent water and purged, V is the total volume of the methanol extract andt
V is the volume of methanol extract that is added to the 5 mL of organic-free reagenti
water.
7.10.1.3 If a linear calibration that does not pass through the origin has beenemployed, then the regression equation is rearranged as shown in Sec. 7.5.2, and theconcentration of the analyte is calculated from the area response (y), the slope (a), andthe intercept (b). When using this form of linear calibration, it is the laboratory'sresponsibility to ensure that the calculations take into account the volume or weight ofthe original sample, the dilution factor (if any), and dry weight (as applicable). Oneapproach to this calculation is to perform the original linear regression using theconcentration of the analyte in the final extract volume or the volume purged. Theconcentration of the analyte in the sample may then be calculated as follows:
where:
C = Concentration in the samples
C = Concentration in the final extractex
V = Total volume of the concentrated extractt
V = Volume of the sample extracted or purgeds
For solid samples, substitute the weight of the sample, W , for V .s s
For purge-and-trap analyses, the concentration of the analyte in the volume of thesample that is purged will be the same as in the original sample, except when dilutionsare performed.
7.10.2 Internal standard calibration - linear calibration
The concentration of each analyte in the sample is calculated using the results of theinitial calibration, according to one of the following sections, depending on the sample matrix:
7.10.2.1 Aqueous samples
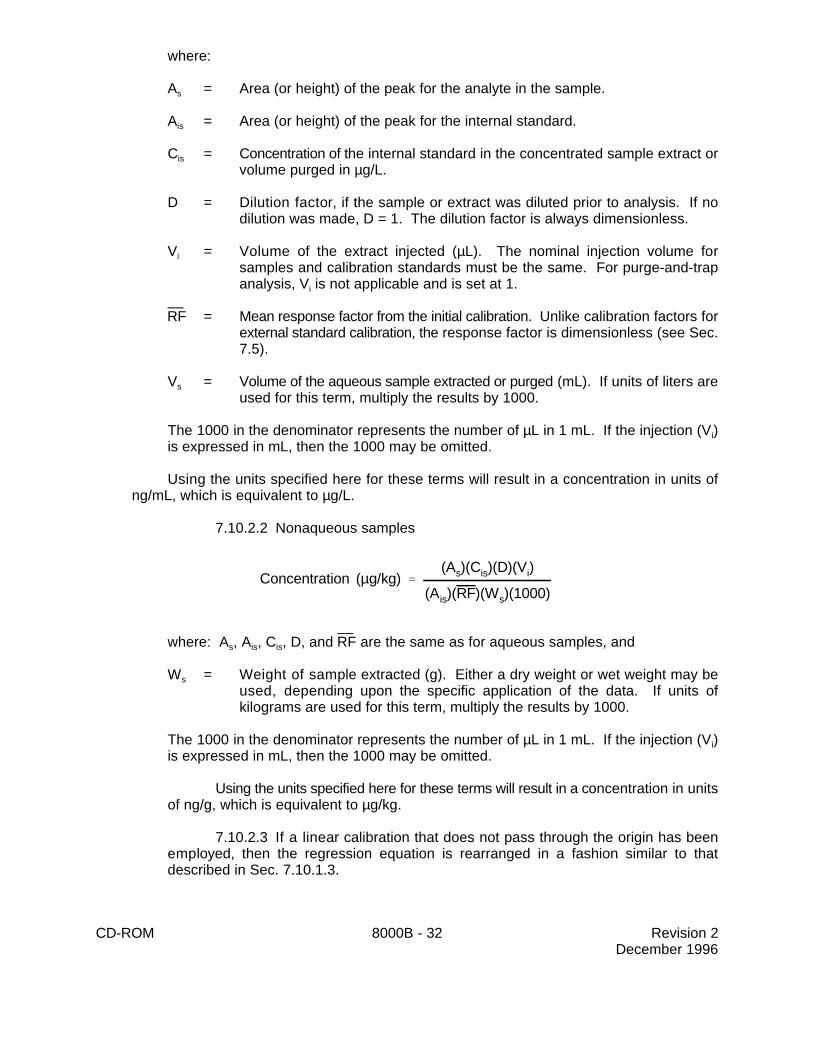
Concentration (µg/kg) '(As)(Cis)(D)(Vi)
(Ais)(RF)(Ws)(1000)
CD-ROM 8000B - 32 Revision 2December 1996
where:
A = Area (or height) of the peak for the analyte in the sample.s
A = Area (or height) of the peak for the internal standard.is
C = Concentration of the internal standard in the concentrated sample extract oris
volume purged in µg/L.
D = Dilution factor, if the sample or extract was diluted prior to analysis. If nodilution was made, D = 1. The dilution factor is always dimensionless.
V = Volume of the extract injected (µL). The nominal injection volume fori
samples and calibration standards must be the same. For purge-and-trapanalysis, V is not applicable and is set at 1.i
RF = Mean response factor from the initial calibration. Unlike calibration factors for––
external standard calibration, the response factor is dimensionless (see Sec.7.5).
V = Volume of the aqueous sample extracted or purged (mL). If units of liters ares
used for this term, multiply the results by 1000.
The 1000 in the denominator represents the number of µL in 1 mL. If the injection (V )iis expressed in mL, then the 1000 may be omitted.
Using the units specified here for these terms will result in a concentration in units ofng/mL, which is equivalent to µg/L.
7.10.2.2 Nonaqueous samples
where: A , A , C , D, and RF are the same as for aqueous samples, ands is is
––
W = Weight of sample extracted (g). Either a dry weight or wet weight may bes
used, depending upon the specific application of the data. If units ofkilograms are used for this term, multiply the results by 1000.
The 1000 in the denominator represents the number of µL in 1 mL. If the injection (V )iis expressed in mL, then the 1000 may be omitted.
Using the units specified here for these terms will result in a concentration in unitsof ng/g, which is equivalent to µg/kg.
7.10.2.3 If a linear calibration that does not pass through the origin has beenemployed, then the regression equation is rearranged in a fashion similar to thatdescribed in Sec. 7.10.1.3.

RPD '* R1 & R2 *
R1 % R2
2
x 100
CD-ROM 8000B - 33 Revision 2December 1996
7.10.3 Calculations for a non-linear calibration curve
When a non-linear curve has been employed, the non-linear model is rearranged to solvefor the concentration of the analyte in the extract or purge volume, and the extractconcentration is converted to a sample concentration in a fashion similar to that described inSec. 7.10.1.3.
When non-linear calibrations are employed, it is essential that the laboratory clearlydocument the calculation of analyte concentrations. Example calculations should be reportedthat clearly indicate how the instrument response (area) was converted into a sample result.
7.10.4 Comparison between results from different columns or detectors
When sample results are confirmed using two dissimilar columns or with two dissimilardetectors, the agreement between the quantitative results should be evaluated after theidentification has been confirmed. Calculate the relative percent difference (RPD) between thetwo results using the formula below.
where R and R are the results on the two columns and the vertical bars in the equation above1 2
indicate the absolute value of the difference. Therefore, the RPD is always a positive value.
7.10.4.1 If one result is significantly higher (e.g., >40%), check thechromatograms to see if an obviously overlapping peak is causing an erroneously highresult. If no overlapping peaks are noted, examine the baseline parameters establishedby the instrument data system (or operator) during peak integration.
7.10.4.2 If no anomalies are noted, review the chromatographic conditions. Ifthere is no evidence of chromatographic problems, report the higher result. Thisapproach is conservative relative to protection of the environment. The data user shouldbe advised of the disparity between the results on the two columns.
7.11 Suggested chromatographic system maintenance
Corrective measures may involve any one or more of the following remedial actions. This listis by no means comprehensive and analysts should develop expertise in troubleshooting theirspecific instruments and analytical procedures. The manufacturers of chromatographic instruments,detectors, columns, and accessories generally provide detailed information regarding the properoperation and limiting factors associated with their products. The importance of reading andreviewing this information cannot be over-emphasized.
7.11.1 Capillary GC columns
Routine maintenance may compel the analyst to clean and deactivate the glass injectionport insert or replace it with a fresh insert that has been cleaned and deactivated withdichlorodimethylsilane. Cut off 0.5 - 1.0 m of the injector end of the column using a 90E cut.Place ferrule onto the column before cutting.
CD-ROM 8000B - 34 Revision 2December 1996
Exceptional maintenance may compel the analyst to replace gas traps and backflush thecolumn with solvent according to the manufacturer's instructions. If these procedures fail toeliminate the degradation problem, it may be necessary to deactivate the metal injector bodyand/or replace the column.
7.11.2 Metal (GC) injector body
Turn off the oven and remove the analytical column when the oven has cooled. Removethe glass injection port insert. Lower the injection port temperature to room temperature.Inspect the injection port and remove any noticeable foreign material.
Place a beaker beneath the injector port inside the GC oven. Using a wash bottle,serially rinse the entire inside of the injector port with acetone and then toluene, catching therinsate in the beaker.
Prepare a solution of deactivating agent (dichlorodimethylsilane) following manufacturer'sdirections. After all metal surfaces inside the injector body have been thoroughly coated withthe deactivation solution, serially rinse the injector body with toluene, methanol, acetone, andhexane. Reassemble the injector and replace the GC column.
7.11.3 HPLC columns
Examine the system and check for drips that are indicative of plumbing leaks. Check thattubing connectors are of the shortest possible length to minimize dead volumes and reduceband broadening. Compatible guard columns should be installed to protect analytical columns.
If degradation of resolution or changes in back pressure are observed, the first actionshould be to replace the guard column if one is installed. Secondly, temporarily reverse theflow through the column to dislodge contamination in the frit with the column disconnectedfrom the detector. If this does not correct the problem, place the analytical column in a vise,remove the inlet compression fitting and examine the column.
Analysts should establish that no void volume has developed, that the column packinghas not become contaminated, and that the frit is not clogged. Void volumes can be filled withcompatible packing and frits replaced.
Columns must eventually be replaced as the bonding and end-capping groups used tomodify the silica are lost with time. Loss of these groups will result in chromatographic tailingand changes in analyte retention times. Retention times may also change because ofdifferences in column temperature or because the composition of the solvent gradient is notcompletely reproducible.
8.0 QUALITY CONTROL
8.1 Refer to Chapter One for specific quality control procedures. The development of in-house QC limits for each method is encouraged, as described in Sec. 8.7. The use ofinstrument-specific QC limits is encouraged, provided such limits will generate data appropriate foruse in the intended application. In general, the following QC requirements pertain to all thedeterminative methods listed in Sec. 1.1 unless superseded by specific requirements provided in thedeterminative method.
CD-ROM 8000B - 35 Revision 2December 1996
8.2 Evaluating chromatographic performance
The analyst's expertise in performing chromatography is a critical element in the successfulperformance of chromatographic methods. Successful generation of data requires selection ofsuitable preparation and analysis methods and an experienced staff to use these methods.
8.2.1 For each 12-hour period during which analysis is performed, the performance ofthe entire analytical system should be checked. These checks should be part of a formalquality control program that includes the analysis of blanks, calibration standards, matrixspikes, laboratory control samples and replicate samples, although all of these checks neednot be performed during each shift.
8.2.2 Ongoing data quality checks are compared with established performance criteriato determine if the results of analyses meet the performance characteristics of the method.Therefore, all sample analyses performed using external standard calibration must bebracketed with acceptable calibration verification standards.
8.2.3 In addition to the quantitative measures of comparison described below and inthe individual methods, analysts should evaluate chromatograms and instrument operation.Questions that should be asked include:
Do the peaks look normal (Gaussian)?Is the response obtained comparable to the response from previous calibrations?Do the column fittings need tightening?Are non-target peaks present in calibration analyses? Are contaminants present in the blanks?Is the injector leaking (e.g., does the GC injector septum need replacing)?Does the HPLC guard column need replacement?
8.2.4 Significant peak tailing, leaks, changes in detector response and laboratorycontamination should be corrected. Tailing problems are generally traceable to active siteson the column, cold spots in a GC, improper choice of HPLC mobile phase, the detector inlet,or leaks in the system.
8.2.5 Recalibration of the instrument must take place when the performance changesto the point that the calibration verification acceptance criteria (Sec. 7.7) cannot be achieved.In addition, significant maintenance activities or hardware changes may also requirerecalibration. The sections below provide general guidance on the sorts of procedures thatmay or may not require recalibration.
8.2.5.1 There are various types of instrument maintenance that should notautomatically require recalibration of the instrument. Examples include changing: septa;compressed gas cylinders; syringes; moisture, hydrocarbon, or oxygen traps; solventsin an ELCD; purge tubes; PTFE transfer lines; glow plugs; split seals; column fittings;inlets; or filaments. Other procedures include breaking off or changing a guard columnor cleaning the inlet. Whenever such procedures are performed, the analyst mustdemonstrate that the results for a calibration verification standard meet the acceptancecriteria in Sec. 7.7. before the analysis of any samples. Otherwise, recalibration isrequired.
8.2.5.2 In contrast to Sec. 8.2.5.1, some maintenance procedures are so likelyto affect the instrument response that recalibration is automatically required, regardless
CD-ROM 8000B - 36 Revision 2December 1996
of the ability to meet the calibration verification acceptance criteria. These proceduresinclude: changing, replacing, or reversing the column; recoating the bead in a detector;changing nitrogen tubes in an NPD; changing resins; changing the PID seal or lamp;changing the FID jet; changing the entrance lens, draw out lens, or repeller; cleaning theMS source; changing the electron multiplier, ion source chamber, or injector port.Whenever such procedures are performed, the analyst must perform a new initialcalibration that meets the requirement using Sec 7.5. As noted in Sec. 7.6, changing orreplacing the column will also require that the retention time windows be redetermined.
8.2.6 The analysis of method blanks is critical to the provision of meaningful sampleresults. Consult the appropriate 3500 or 5000 series method for the specifics of thepreparation of method blanks. The following general guidelines apply to the interpretation ofmethod blank results.
8.2.6.1 Method blanks should be prepared at a frequency of at least 5%, thatis, one method blank for each group of up to 20 samples prepared at the same time, bythe same procedures. For samples analyzed for volatiles by the purge-and-traptechnique, the preparation is equivalent to the analysis. Therefore, one purge-and-trapmethod blank must be analyzed with each group of up to 20 samples analyzed on thesame instrument during the same analytical shift.
8.2.6.2. When samples that are extracted together are analyzed on separateinstruments or on separate analytical shifts, the method blank associated with thosesamples (e.g., extracted with the samples) must be analyzed on at least one of thoseinstruments. A solvent blank should be analyzed on all other instruments on which theset of samples were analyzed to demonstrate that the instrument is not contributingcontaminants to the samples.
8.2.6.3 Unless otherwise described in a determinative method, the methodblank may be analyzed immediately after the calibration verification standard, to ensurethat there is no carryover from the standard, or at another point in the analytical shift.
8.2.6.4 When sample extracts are subjected to cleanup procedures, theassociated method blank must also be subjected to the same cleanup procedures.
8.2.6.5 As described in Chapter One, the results of the method blank should be:
8.2.6.5.1 Less than the laboratory's MDL for the analyte or less thanthe level of acceptable blank contamination specified in the approved qualityassurance project plan.
8.2.6.5.2 Less than 5% of the regulatory limit associated with ananalyte.
8.2.6.5.3 Or less than 5% of the sample result for the same analyte,whichever is greater.
8.2.6.5.4 If the method blank results do not meet the acceptancecriteria above, then the laboratory should take corrective action to locate andreduce the source of the contamination and to re-extract and reanalyze anysamples associated with the contaminated method blank.
CD-ROM 8000B - 37 Revision 2December 1996
8.2.6.6 The laboratory should not subtract the results of the method blank fromthose of any associated samples. Such "blank subtraction" is inappropriate for the GCand HPLC methods addressed here, and often leads to negative sample results. If themethod blank results do not meet the acceptance criteria in 8.2.6.5 and reanalysis is notpractical, then the data user should be provided with the sample results, the methodblank results, and a discussion of the corrective actions undertaken by the laboratory.
8.2.6.7 Method blanks and/or solvent blanks may also be used to check forcontamination by carryover from a high-concentration sample into subsequent samples(see Sec. 3.1). When the analysis of such blanks is not possible, such as when anunattended autosampler is employed, the analyst should review the results for at leastthe next two samples after the high-concentration sample. If analytes in the high-concentration sample are not present in the subsequent samples, then the lack ofcarryover has been demonstrated. If there is evidence that carryover may haveoccurred, then the samples should be reanalyzed.
8.3 Summary of required instrument QC
The following criteria primarily pertain to GC and HPLC methods with non-MS or FTIRdetectors, and may be superseded by criteria specified in individual determinative methods (e.g.,Methods 8021, 8260, 8270, 8321, 8325, and 8410).
8.3.1 The criteria for linearity of the initial calibration curve is an RSD of # 20%.
8.3.2 For non-linear calibration curves, the coefficient of the determination (COD) mustbe greater than or equal to 0.99 (see Sec. 7.5.2).
8.3.3 Retention time (RT) windows must be established for the identification of targetanalytes. See Sec. 7.6 for guidance on establishing the absolute RT windows.
8.3.4 The retention times of all analytes in all verification standards must fall within theabsolute RT windows. If an analyte falls outside the RT window in a calibration verificationstandard, new absolute RT windows must be calculated, unless instrument maintenancecorrects the problem.
8.3.5 The calibration verification results must be within ± 15% of the responsecalculated using the initial calibration. If the limit is exceeded, a new standard curve must beprepared unless instrument maintenance corrects the problem.
8.4 Initial demonstration of proficiency
Each laboratory must demonstrate initial proficiency with each combination of samplepreparation and determinative methods that it utilizes, by generating data of acceptable accuracyand precision for a reference sample containing the target analytes in a clean matrix. The laboratorymust also repeat this demonstration whenever new staff are trained or significant changes ininstrumentation are made.
8.4.1 The reference samples are prepared from a spiking solution containing eachanalyte of interest. The reference sample concentrate (spiking solution) may be prepared frompure standard materials, or purchased as certified solutions. If prepared by the laboratory, thereference sample concentrate must be made using stock standards prepared independentlyfrom those used for calibration.

CD-ROM 8000B - 38 Revision 2December 1996
Preparation of the reference sample concentrate is dependent upon the method beingevaluated. Guidance for reference sample concentrations for certain methods are listed inSec. 8.0 of Methods 3500 and 5000. In other cases, the determinative methods containguidance on preparing the reference sample concentrate and the reference sample. If noguidance is provided, prepare a reference sample concentrate in methanol (or any watermiscible solvent) at a concentration such that the spike will provide a concentration in the cleanmatrix that is 10 - 50 times the MDL for each analyte in that matrix.
The concentration of target analytes in the reference sample may be adjusted to moreaccurately reflect the concentrations that will be analyzed by the laboratory. If theconcentration of an analyte is being evaluated relative to a regulatory limit or action level, seeSec. 8.5.1 for information on selecting an appropriate spiking level.
8.4.2 To evaluate the performance of the total analytical process, the referencesamples must be handled in exactly the same manner as actual samples. Use a clean matrixfor spiking purposes (one that does not have any target or interference compounds), e.g.,organic-free reagent water for the aqueous matrix and organic-free sand or soil for the solidmatrix.
8.4.3 Preparation of reference samples
8.4.3.1 Volatile organic analytes
Prepare the reference sample by adding 200 µL of the reference sampleconcentrate (Sec. 8.4.1) to 100 mL of organic-free reagent water. Transfer this solutionimmediately to a 20- or 25-mL (or four 5-mL) gas-tight syringe(s) when validating wateranalysis performance by Method 5030. Alternatively, the reference sample concentratemay be injected directly through the barrel of the 5- or 25-mL syringe. See Method 5000(Sec. 8.0) for guidance on other preparative methods and matrices.
8.4.3.2 Semivolatile and nonvolatile organic analytes
Prepare the reference sample by adding 1.0 mL of the reference sampleconcentrate (Sec. 8.4.1) to each of four 1-L aliquots of organic-free reagent water. SeeMethod 3500 (Sec. 8.0) for other matrices.
8.4.4 Analyze at least four replicate aliquots of the well-mixed reference samples by thesame procedures used to analyze actual samples (Sec. 7.0 of each of the methods). This willinclude a combination of the sample preparation method (usually a 3500 series method forextractable organics or a 5000 series method for volatile organics) and the determinativemethod (an 8000 series method).
8.4.5 Calculate the average recovery ( x ) in µg/L, and the standard deviation of the–
recovery (s) in µg/L, for each analyte of interest using the four results.
8.4.6 Multiple-laboratory performance data are included in some determinative methodsand may be used as guidance in evaluating performance in a single laboratory. Compare sand x for each analyte with the corresponding performance data for precision and accuracy–
given in the performance data table at the end of the determinative method. If s and x for all–
analytes of interest meet the appropriate acceptance criteria, then the system performance isacceptable and analysis of actual samples can begin. If any individual s value exceeds the

CD-ROM 8000B - 39 Revision 2December 1996
precision limit or any individual x value falls outside the range for accuracy, then the system–
performance may be unacceptable for that analyte.
NOTE: The large number of analytes in each of the methods presents a substantialprobability that one or more analyte will fail at least one of the performancecriteria when all analytes of a given method are determined.
When one or more of the analytes fail at least one of the performance criteria, the analystshould proceed according to Sec. 8.4.6.1 or 8.4.6.2.
8.4.6.1 Locate and correct the source of the problem and repeat the test for allanalytes of interest, beginning at Sec. 8.4.2.
8.4.6.2 Beginning at Sec. 8.4.2, repeat the test only for those analytes thatfailed to meet criteria. Repeated failure, however, will confirm a general problem with themeasurement system. If this occurs, locate and correct the source of the problem andrepeat the test for all compounds of interest beginning at Sec. 8.4.2.
8.4.7 The performance data in many of the methods are based on single-laboratoryperformance. As with the multiple-laboratory data, the criteria in those methods may be usedas guidance when evaluating laboratory performance. When comparing your laboratory datato performance data developed from single-laboratory data, certain analytes may be outsidethe limits, however, the majority should be within the acceptance limits.
8.4.8 Even when the determinative method contains performance data (either multiple-laboratory or single-laboratory), the development of in-house acceptance limits is stronglyrecommended, and may be accomplished using the general considerations described in Sec.8.7.
8.4.9 In the absence of recommended acceptance criteria for the initial demonstrationof proficiency, the laboratory should use recoveries of 70 - 130% as guidance in evaluating theresults. Given that the initial demonstration is performed in a clean matrix, the averagerecoveries of analyte from the four replicates should generally fall within this range. In addition,since the laboratory will repeat the initial demonstration of proficiency whenever new staff aretrained or significant changes in instrumentation are made, the resulting data should be usedto develop in-house acceptance criteria, as described in Sec. 8.7.
8.5 Matrix spike and laboratory control samples
The laboratory must also have procedures for documenting the effect of the matrix on methodperformance (precision, accuracy, and detection limit). At a minimum, this will include the analysisof at least one matrix spike and one duplicate unspiked sample or one matrix spike/matrix spikeduplicate (MS/MSD) pair with each batch of up to 20 samples of the same matrix processed together(see Chapter One). If samples are expected to contain the target analytes of concern, thenlaboratories may use one matrix spike and a duplicate analysis of an unspiked field sample as analternative to the MS/MSD pair (see Sec. 8.5.3).
In the case of purge-and-trap methods, the MS/MSD, or MS and duplicate samples, should beprepared and analyzed concurrently with the samples. In the case of samples that involve anextraction procedure, the MS/MSD, or MS and duplicate samples, should be extracted with the batchof samples but may be analyzed at any time.

CD-ROM 8000B - 40 Revision 2December 1996
In addition, a Laboratory Control Sample (LCS) should be included with each analytical batch.The LCS consists of an aliquot of a clean (control) matrix similar to the sample matrix and of thesame weight or volume. The LCS is spiked with the same analytes at the same concentrations asthe matrix spike. When the results of the matrix spike analysis indicates a potential problem due tothe sample matrix itself, the LCS results are used to verify that the laboratory can perform theanalysis in a clean matrix.
The concentration of the matrix spike sample and/or the LCS should be determined asdescribed in Secs. 8.5.1 and 8.5.2.
8.5.1 If, as in compliance monitoring, the concentration of a specific analyte in thesample is being checked against a regulatory concentration limit or action level, the spikeshould be at or below the limit, or 1 - 5 times the background concentration (if historical dataare available), whichever concentration is higher.
If historical data are not available, it is suggested that a background sample of the samematrix from the site be submitted for matrix spiking purposes to ensure that highconcentrations of target analytes and/or interferences will not prevent calculation of recoveries.
8.5.2 If the concentration of a specific analyte in a sample is not being checked againsta limit specific to that analyte, then the analyst may spike the sample at the sameconcentration as the reference sample (Sec. 8.4.1), at 20 times the estimated quantitation limit(EQL) in the matrix of interest, or at a concentration near the middle of the calibration range.It is again suggested that a background sample of the same matrix from the site be submittedas a sample for matrix spiking purposes.
8.5.3 To develop precision and accuracy data for each of the spiked compounds, theanalyst has two choices: analyze the original sample, and an MS/MSD pair; or analyze theoriginal sample, a duplicate sample, and one spiked sample. If samples are not expected tocontain the target analytes of concern, then the laboratory may use a matrix spike and matrixspike duplicate pair. If samples are expected to contain the target analytes of concern, thenthe laboratory may use one matrix spike and a duplicate analysis of an unspiked field sampleas an alternative to the MS/MSD pair.
Begin by analyzing one sample aliquot to determine the background concentration ofeach analyte. Prepare a matrix spike concentrate according to one of the options specified inSec. 8.5.1 or 8.5.2.
Prepare a matrix spike sample by adding the appropriate volume of the matrix spikeconcentrate to another aliquot of the sample to yield the desired concentration (see Secs. 8.5.1and 8.5.2). Prepare a matrix spike duplicate sample from a third aliquot of the sample.
Analyze the MS/MSD samples using the same procedures employed for the originalsample, and calculate the concentration of each analyte in the matrix spike and matrix spikeduplicate. Likewise, analyze the LCS samples using the same procedures employed for theoriginal sample, and calculate the concentration of each analyte in the LCS.
8.5.3.1 Calculation of recovery
Accuracy is estimated from the recovery of spiked analytes from the matrix ofinterest. Laboratory performance in a clean matrix is estimated from the recovery of

Recovery ' %R 'Cs & Cu
Cn
x 100
RPD '* C1 & C2 *
C1 % C2
2
x 100
CD-ROM 8000B - 41 Revision 2December 1996
analytes in the LCS. Calculate the recovery of each spiked analyte in the matrix spike,matrix spike duplicate (if performed) and LCS according to the following formula.
where:
C = Measured concentration of the spiked sample aliquots
C = Measured concentration of the unspiked sample aliquot (use 0 for the LCS)u
C = Nominal (theoretical) concentration increase that results from spiking the sample,n
or the nominal concentration of the spiked aliquot (for LCS)
8.5.3.2 Calculation of precision
Precision is estimated from the relative percent difference (RPD) of theconcentrations (not the recoveries) measured for matrix spike/matrix spike duplicatepairs, or for duplicate analyses of unspiked samples. Calculate the RPD according to theformula below.
where:
C = Measured concentration of the first sample aliquot1
C = Measured concentration of the second sample aliquot2
8.5.4 Recommended QC acceptance criteria for matrix spike samples and LCS
It is necessary for the laboratory to develop single-laboratory performance data foraccuracy and precision in the matrices of interest (see Sec. 8.7). In addition, laboratoriesshould monitor method performance in each matrix, through the use of control charts and othertechniques.
Many methods may not contain recommended acceptance criteria for LCS results. Thelaboratory should use 70 - 130% as interim acceptance criteria for recoveries of spikedanalytes, until in-house LCS limits are developed (see Sec. 8.7). Where in-house limits havebeen developed for matrix spike recoveries, the LCS results should fall within those limits, asthe LCS is prepared in a clean matrix.
Even where the determinative methods provide performance criteria for matrix spikes andLCS, it is necessary for laboratories to develop in-house performance criteria and comparethem to those in the methods. The development of in-house performance criteria is discussedin Sec. 8.7.
As a general rule, the recoveries of most compounds spiked into samples should fallwithin the range of 70 - 130%, and this range should be used as a guide in evaluating in-houseperformance. However, as described in Sec. 8.5.4.1, matrix spike recoveries and LCSrecoveries may be affected by the spike-to-background ratio.

Accuracy ' x ) ' (a)C % b
Acceptance range (µg/L) ' Accuracy ± (2.44)Precision
CD-ROM 8000B - 42 Revision 2December 1996
Where methods do contain performance data for the matrix of interest, use Secs. 8.5.4.1and 8.5.4.2 as guidance in evaluating data generated by the laboratory.
8.5.4.1 When multiple-laboratory performance data for the matrix of interest areprovided in the determinative method, compare the percent recovery (%R) for eachanalyte in a water sample with the performance data. Given that such performancecriteria were developed from multi-laboratory data, they should be met in almost alllaboratories. See Sec. 8.7.10 for more information on comparisons between limits. Theperformance data include an allowance for error in measurement of both the backgroundand spike concentrations, and assume a spike-to-background ratio of 5:1. If spiking wasperformed at a concentration lower than that used for the reference sample (Sec. 8.4),the analyst may use either the performance data presented in the tables, or laboratory-generated QC acceptance criteria calculated for the specific spike concentration,provided that they meet the project-specific data quality objectives.
8.5.4.2 When the sample was spiked at a spike-to-background ratio other than5:1, the laboratory should calculate acceptance criteria for the recovery of an analyte.Some determinative methods contain a table entitled "Method Accuracy and Precisionas a Function of Concentration" which gives equations for calculating accuracy andprecision as a function of the spiking concentration. These equations may be used asguidance in establishing the acceptance criteria for matrix spike samples.
The equations are the result of linear regression analyses of the performancedata from a multiple-laboratory study. The equations are of the form:
where a is a number less than 1.0, b is a value greater than 0.0, and C is the testconcentration (or true value).
Performance criteria for accuracy may be calculated from these equations bysubstituting the spiking concentration used by the laboratory in place of "C," and usingthe values of a and b given in the table for each analyte.
Performance criteria for precision are calculated in a similar fashion, using the aand b values for precision given in the table for each analyte. Precision may becalculated as single analyst precision, or overall precision, using the appropriateequations from the table. An acceptable performance range may be calculated for eachanalyte as:
8.5.5 Also compare the recovery data from the matrix spike with the LCS data (use theaverage recovery if a matrix spike and matrix spike duplicate were analyzed). If any individualpercent recovery in the matrix spike (or matrix spike duplicate) falls outside the designatedrange for recovery, the laboratory should determine if there is a matrix effect or a laboratoryperformance problem. A matrix effect is indicated if the LCS data are within limits but thematrix spike data exceed the limits. The surrogate recovery data (Sec. 8.6) should also beused to evaluate the data. Recoveries of both matrix spike compounds and surrogates thatare outside of the acceptance limits suggest more pervasive analytical problems then problemswith the recoveries of either matrix spikes or surrogates alone.

Recovery (%) 'Concentration (or amount) foundConcentration (or amount) added
× 100
CD-ROM 8000B - 43 Revision 2December 1996
8.6 Surrogate recoveries
8.6.1 It is necessary that the laboratory evaluate surrogate recovery data from individualsamples versus surrogate recovery limits developed in the laboratory. The generalconsiderations for developing in-house acceptance criteria for surrogate recoveries aredescribed in Sec. 8.7.
8.6.2 Surrogate recovery is calculated as:
If recovery is not within in-house surrogate recovery limits, the following procedures arenecessary.
8.6.2.1 Check to be sure that there are no errors in the calculations, surrogatesolutions or internal standards. If errors are found, recalculate the data accordingly.Examine chromatograms for interfering peaks and integrated peak areas.
8.6.2.2 Check instrument performance. If an instrument performance problemis identified, correct the problem and re-analyze the extract (or re-analyze the sample forvolatiles).
8.6.2.3 Some samples may require dilution in order to bring one or more targetanalytes within the calibration range or to overcome significant interferences with someanalytes. This may result in the dilution of the surrogate responses to the point that therecoveries can not be measured. If the surrogate recoveries are available from a less-diluted or undiluted aliquot of the sample or sample extract, those recoveries may beused to demonstrate that the surrogates were within the QC limits, and no further actionis required. However, the results of both the diluted and undiluted (or less-diluted)analyses should be provided to the data user.
8.6.2.4 If no instrument problem is found, the sample should be re-extractedand re-analyzed (or re-analyze the sample for volatiles).
8.6.2.5 If, upon re-analysis (in either 8.6.2.2 or 8.6.2.4), the recovery is againnot within limits, report the data as an "estimated concentration." If the recovery is withinthe limits in the re-analysis, provide the re-analysis data to the data user. If the holdingtime for the method has expired prior to the re-analysis, provide both the original and re-analysis results to the data user, and note the holding time problem.
8.7 Generating performance criteria for matrix spike recoveries, surrogate recoveries, initialdemonstration of proficiency, and laboratory control sample recoveries
It is essential that laboratories calculate in-house performance criteria for matrix spikerecoveries and surrogate recoveries. It may also be useful to calculate such in-house criteria forlaboratory control sample (LCS) recoveries and for the initial demonstration of proficiency whenexperience indicates that the criteria recommended in specific methods are frequently missed forsome analytes or matrices. The development of in-house performance criteria and the use of controlcharts or similar procedures to track laboratory performance cannot be over-emphasized. Many datasystems and commercially-available software packages support the use of control charts.

CD-ROM 8000B - 44 Revision 2December 1996
The procedures for the calculation of in-house performance criteria for matrix spike recoveryand surrogate recovery are provided below. These procedures may also be applied to thedevelopment of in-house criteria for the initial demonstration of proficiency and for LCS recoveries.
8.7.1 For each matrix spike sample analyzed, calculate the percent recovery of eachmatrix spike compound added to the sample, in a fashion similar to that described in Sec.8.5.3.3. For each field sample, calculate the percent recovery of each surrogate as describedin Sec. 8.6.
8.7.2 Calculate the average percent recovery (p) and the standard deviation (s) foreach of the matrix spike compounds after analysis of 15-20 matrix spike samples of the samematrix, using the equations in Sec. 7.5.1, as guidance. Calculate the average percent recovery(p) and the standard deviation (s) for each of the surrogates after analysis of 15-20 fieldsamples of the same matrix, in a similar fashion.
8.7.3 After the analysis of 15-20 matrix spike samples of a particular matrix (or matrixspike limits) or 15-20 field samples (for surrogate limits), calculate upper and lower control limitfor each matrix spike or surrogate compound:
Upper control limit = p + 3sLower control limit = p - 3s
Calculate warning limits as:
Upper warning limit = p + 2sLower warning limit = p - 2s
For laboratories employing statistical software to determine these limits, the control limitsapproximate a 99% confidence interval around the mean recovery, while the warning limitsapproximate a 95% confidence interval.
8.7.4 Any matrix spike, surrogate, or LCS results outside of the control limits requireevaluation by the laboratory. Such actions should begin with a comparison of the results fromthe samples or matrix spike samples with the LCS results. If the recoveries of the analytes inthe LCS are outside of the control limits, then the problem may lie with the application of theextraction and/or cleanup procedures applied to the sample matrix or with the chromatographicprocedures. Once the problem has been identified and addressed, corrective action mayinclude the reanalysis of samples, or the extraction and analysis of new sample aliquots,including new matrix spike samples and LCS.
When the LCS results are within the control limits, the problem may either be related tothe specific sample matrix or to an inappropriate choice of extraction, cleanup, anddeterminative methods. If the results are to be used for regulatory compliance monitoring, thenthe analyst must take steps to demonstrate that the analytes of concern can be determined inthe sample matrix at the levels of interest.
The laboratory may use the warning limits to guide internal evaluations of methodperformance, track the performance of individual analysts, and monitor the effects of changesto the analytical procedures. Repeated results outside of the warning limits should lead tofurther evaluation.

CD-ROM 8000B - 45 Revision 2December 1996
8.7.5 Once established, control limits and warning limits for matrix spike compoundsshould be reviewed after every 10-20 matrix spike samples of the same matrix, and updatedat least semi-annually. Control limits and warning limits for surrogates should be reviewedafter every 20-30 field samples of the same matrix, and should be updated at least semi-annually. The laboratory should track trends in both performance and in the control limitsthemselves. The control and warning limits used to evaluate the sample results should bethose in place at the time that the sample was analyzed. Once limits are updated, those limitsshould apply to all subsequent analyses of new samples.
8.7.6 For methods and matrices with very limited data (e.g., unusual matrices notanalyzed often), interim limits should be established using available data or by analogy tosimilar methods or matrices.
8.7.7 Results used to develop acceptance criteria should meet all other QC criteriaassociated with the determinative method. For instance, matrix spike recoveries from aGC/MS procedure should be generated from samples analyzed after a valid GC/MS tune anda valid initial calibration that includes the matrix spike compounds. Another example is thatanalytes in GC or HPLC methods must fall within the established retention time windows inorder to be used to develop acceptance criteria.
8.7.8 Laboratories are advised to consider the effects of the spiking concentration onmatrix spike performance criteria, and to avoid censoring of data. As noted in Sec. 8.5.4, theacceptance criteria for matrix spike recovery and precision are often a function of the spikeconcentration used. Therefore, use caution when pooling matrix spike/matrix spike duplicatedata for use in establishing acceptance criteria. Not only should the results all be from thesame (or very similar) matrix, but the spiking levels should also be approximately the same(within a factor of 2).
Similarly, the matrix spike and surrogate results should all be generated using the sameset of extraction, cleanup, and analysis techniques. For example, do not mix results from solidsamples extracted by ultrasonic extraction with those extracted by Soxhlet.
8.7.9 Another common error in developing acceptance criteria is to discard data thatdo not meet a preconceived notion of acceptable performance. This results in a censored dataset, which, when used to develop acceptance criteria, will lead to unrealistically narrow criteria.Remember that for a 95% confidence interval, 1 out of every 20 observations likely will still falloutside the limits.
While professional judgement is important in evaluating data to be used to developacceptance criteria, do not discard specific results simply because they do not meet one'sexpectations. Rather, employ a statistical test for outlier values, or at least calculate theacceptance limits both with and without the results that are considered suspect and observethe effect of deleting suspect data.
8.7.10 In-house QC limits must be examined for reasonableness. It is not EPA's intentto legitimize poor recoveries that are due to the incorrect choice of methods or spiking levels.In-house limits also should be compared with the objectives of specific analyses. For example,recovery limits (for surrogates, MS, MSD, LCS, etc.) that include allowance for a relatively highpositive bias (e.g., 70 - 170%) may be appropriate for determining that an analyte is notpresent in a sample. However, they would be less appropriate for the analysis of samples nearbut below a regulatory limit, because of the potential high bias.

CD-ROM 8000B - 46 Revision 2December 1996
It may be useful to compare QC limits generated in the laboratory to the performancedata that may be listed in specific determinative methods. However, the analyst must beaware that performance data generated from multiple-laboratory data tend to be significantlywider than those generated from single-laboratory data. In addition, comparisons between in-house limits and those from other sources should generally focus more on the accuracy(recovery) limits of single analyses rather than the precision limits. For example, a meanrecovery closer to 100% is generally preferred, even if the ±3 standard deviation range isslightly wider, because those limits indicate that the result is likely closer to the "true value."In contrast, the precision range provides an indication of the results that might be expectedfrom repeated analyses of the same sample.
8.8 It is recommended that the laboratory adopt additional quality assurance practices for usewith these methods. The specific practices that are most productive depend upon the needs of thelaboratory, the nature of the samples, and project-specific requirements. Field duplicates may beanalyzed to assess the precision of the environmental measurements. When doubt exists over theidentification of a peak on the chromatogram, confirmatory techniques such as gas chromatographywith a dissimilar column, specific element detector, or mass spectrometer (selected ion monitoringor full scan) must be used. Whenever possible, the laboratory should analyze standard referencematerials and participate in relevant performance evaluation studies.
9.0 METHOD PERFORMANCE
9.1 The method detection limit (MDL) is defined as the minimum concentration of asubstance that can be measured and reported with 99% confidence that the value is above zero.The MDL concentrations listed in the SW-846 analytical methods generally were obtained usingorganic-free reagent water. Similar results were achieved using representative wastewaters. TheMDL actually achieved in a given analysis will vary depending on instrument sensitivity and matrixeffects. See Chapter One for more guidance on determination of laboratory-specific MDLs.
9.2 Refer to the determinative methods for method performance information.
10.0 REFERENCES
For further information regarding these methods, review Methods 3500, 3600, 5000, andChapter One.