methane hydrate accumulation model for the central nankai accretionary prism
TRANSCRIPT

(2006) 201–214www.elsevier.com/locate/margeo
Marine Geology 227
Methane hydrate accumulation model for the Central Nankaiaccretionary prism
Lijuan He a,⁎, Osamu Matsubayashi b, Xinglin Lei c
a Institute of Geology and Geophysics, Chinese Academy of Sciences, P.O. Box 9825, Beijing 100029, Chinab Institute for Geo-Resources and Environment, National Institute of Advanced Industrial Science and Technology,
Higashi 1-1-1, Tsukuba City, Ibaraki-ken, 305-8567, Japanc Institute of Geology and Geoinformation, National Institute of Advanced Industrial Science and Technology, Higashi 1-1-1,
Tsukuba City, Ibaraki-ken, 305-8567, Japan
Received 9 December 2004; received in revised form 16 September 2005; accepted 25 September 2005
Abstract
A two-dimensional transient model of methane hydrate accumulation is designed and applied in the Nankai accretionary prism.Model results show that the formation and distribution of methane hydrate and free gas is related to value of the thermal flux, thefluid flux, the methane flux supplied from below, and methane source within the sediment. The duration of the methane flux is ofsignificant importance. The older the sediments, implying a longer period of methane flux supply from below and within thesediments of the model, the larger the volume percentage of free gas will be. This can explain the occurrence of BSR in a area withlower methane flux observed, but absence of the BSR in the other area with higher methane flux observed. Modeling also predictsthat the maximum saturation of methane hydrate is about 1% of the pore space in the area of ODP Site 1178, and the methanehydrate occurrence zone is probably 90–200 m below the sea floor (mbsf), which is supported by both direct and indirect evidencefor hydrate. In the area near ODP Site 808, the fault zones having high fluid flow and methane flux may possibly result in methanehydrate formation without BSR occurrence.© 2005 Elsevier B.V. All rights reserved.
Keywords: methane hydrate; accumulation model; BSR; Central Nankai; Darcy's Law; porous media
1. Introduction
Bottom simulating reflectors (BSRs) commonlyoccur several hundred meters beneath the seafloor incontinental slope sediments, particularly in subductionzone accretionary prisms. BSR may lie at the base of themethane hydrate occurrence zone and wholly within themethane hydrate stability zone, if the impedance
⁎ Corresponding author. Tel.: +86 10 62007813; fax: +86 1062010846.
E-mail address: [email protected] (L. He).
0025-3227/$ - see front matter © 2005 Elsevier B.V. All rights reserved.doi:10.1016/j.margeo.2005.09.019
contrast associated with it is produced by the seismicvelocity contrast between hydrate-bearing sedimentsabove and hydrate-free sediments below, which havebeen known for many regions of the world (Stoll andBryan, 1979; Dvorkin and Nur, 1993). BSRs maysometimes occur below the methane hydrate stabilityzone, at the top of the free gas zone (e.g. Minshull et al.,1994; Holbrook et al., 1996). BSRs are usually used asindicators for the existence of methane hydrate.However, BSRs are not reliable as sole indicators ofhydrates. For example, Finley and Krason (1986)indicate Sites 490, 498, 565, and 570 on ODP (Ocean

Table 1The characteristics of Sites 1178 and 808
Location Distance fromthe deformationfront (km)
Waterdepth(mbsf)
Age a
(Ma)Depth ofthe BSR(mbsf)
Methaneflux b (molm−2 kyr−1)
1178 ∼60 1750 6 ∼400 6808 ∼1 4675 0.3 None 62
a The age of the sediments above the base of the methane hydratestability zone.b The methane flux is estimated from sulfate gradient using the
method of Borowski et al. (1996), which is based on a purely diffusivetransport of methane in sediments.
202 L. He et al. / Marine Geology 227 (2006) 201–214
Drilling Program) Leg 84 in the Middle America Trenchwhere hydrates are recovered without BSR's present.Conversely BSRs exist beneath Sites 496 and 569, yetno hydrates are recovered by coring to within 200 m(vertical) of the BSR. Similarly at Site 994 of Leg 164,hydrates were recovered without a BSR indication. Incases where hydrate contained in the sediments are notlarge enough to give a BSR impedance contrast, andwhere physical and chemical conditions (or otherreasons) do not favor the development of a free gaszone, perhaps no BSR develop but hydrate does exist.Yuan and Edwards (2000) have designed and con-structed a towed marine seafloor electric dipole–dipoleapparatus suitable for assessing offshore methanehydrate, and the presence of hydrate is predicted in aregion to the east of ODP Site 889B where there is novisible BSR.
A BSR is well developed in the landward-dippingzone of the Nankai accretionary prism, while no BSR isfound near the Nankai Trough axis zone (ShipboardScientific party, 2000). In both these sites, small samplesof methane hydrate have been found, but no massivehydrate has been recovered. The Nankai accretionaryprism is rather young and has a high heat flowbackground in its central part, which makes it differentgreatly from other low heat flow background prisms,such as the Costa Rica prism. The formation of gashydrate may also have its own distinguished character inthis prism.
Several analytical models of gas hydrate accumu-lation have been provided (Rempel and Buffett, 1997,1998; Xu and Ruppel, 1999; Davie and Buffett, 2003;Gering, 2003), and they have helped explain severalproblems related to methane hydrate accumulation ingeological environments. The analytical model ofRempel and Buffett (1997) is derived for theidealized problem of hydrate growth in a poroushalf-space, which is cooled on its boundary. Theircalculations predict the growth rate of a hydrate layerfor a given rate of cooling and show that the volumeof hydrate is strongly dependent on the two-phaseequilibrium between hydrate and seawater. Usingtypical estimates of fluid velocities in accretionaryenvironments, they obtain an accumulation rate of 1%of pore volume in 105 years. Using an analyticalformulation different from Rempel and Buffett(1997), Xu and Ruppel (1999) give some importantresults from their analysis: (1) The base of the zonein which gas hydrate actually occurs in marinesediments will not usually coincide with the base ofthe stability zone but rather will lie at a more shallowdepth than the base of the stability zone; (2) If the
BSR marks the top of the free gas zone, then theBSR should occur substantially deeper than the baseof the stability zone in some setting; (3) The presenceof methane within the pressure–temperature stabilityfield for methane gas hydrate is not sufficient toensure the occurrence of gas hydrate, which can onlyform if the mass fraction of methane dissolved inliquid exceeds methane solubility in seawater and ifthe methane flux exceeds a critical valuecorresponding to the rate of diffusive methanetransport; (4) For most values of the diffusion–dispersion coefficient, the diffusive end-member gashydrate system is characterized by a thin layer of gashydrate located near the base of the stability zone. Thenumerical model of Davie and Buffett (2003) for theformation gas hydrate assesses the influence ofmethane supply on observable features of hydrateoccurrences. The model of Gering (2003) describesmigration and biogenic formation of methane underconditions representative of dynamic marine basins,and the conversion of soluble methane into either solidhydrate or exsolved gas. His model results suggestthat the occurrence and magnitude of hydrateformation is directly tied to fundamental parameterssuch as the compaction/sedimentation rates, liquidadvection rates, seafloor depth, geothermal gradient,etc. His model also predicts that the methanemigration from compaction-driven advection mayaccount for 15–30% of the total hydrate mass presentin the Blake Ridge region.
In this paper, a transient model of methane hydrateformation and evolution is designed, which aimsmainly at studying the effects of duration of methaneflux on the accumulation of methane hydrate. A casestudy is presented for the Nankai accretionary prism inArea-I including ODP Site 1178 (the oldest part of theprism) and Area-II including ODP Site 808 (theyoungest part of the prism) based on simulationscovering 6 Ma and 0.3 Ma, respectively (Table 1).
203L. He et al. / Marine Geology 227 (2006) 201–214
Based upon modeling, we aim to explain firstly whythere is a strong BSR in the landward-dippingreflector zone of the accretionary prism and no BSRnear the deformation front. Secondly, we predict theoccurrence of methane hydrates documented indirectlyby pore water geochemical data collected duringOcean Drilling Program investigations in this region.
2. Background
2.1. Geological settings
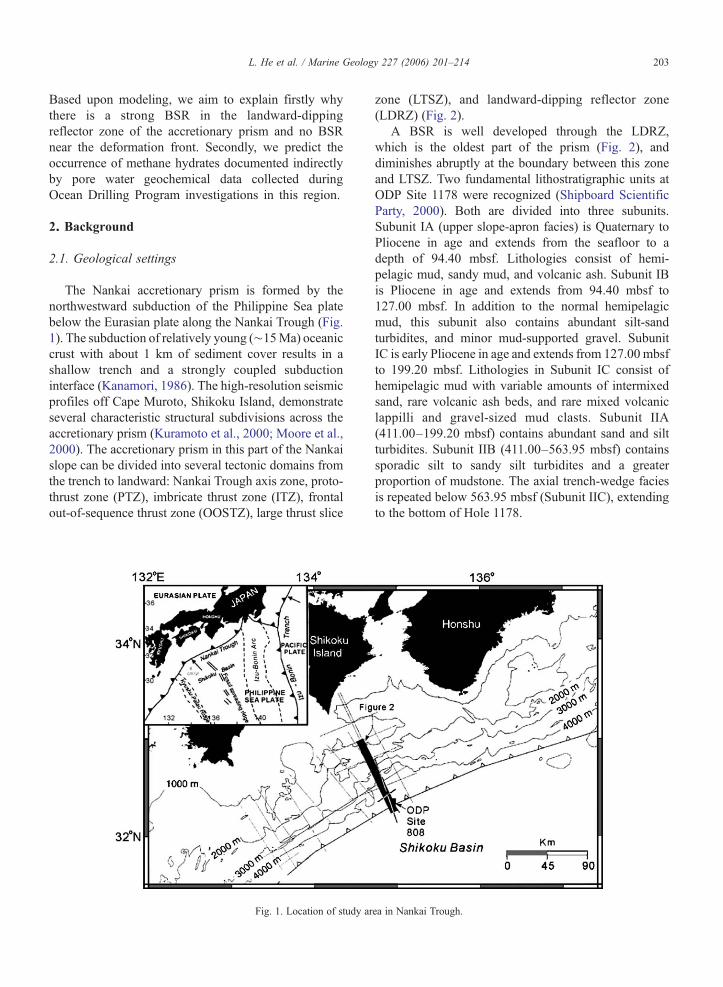
The Nankai accretionary prism is formed by thenorthwestward subduction of the Philippine Sea platebelow the Eurasian plate along the Nankai Trough (Fig.1). The subduction of relatively young (∼15Ma) oceaniccrust with about 1 km of sediment cover results in ashallow trench and a strongly coupled subductioninterface (Kanamori, 1986). The high-resolution seismicprofiles off Cape Muroto, Shikoku Island, demonstrateseveral characteristic structural subdivisions across theaccretionary prism (Kuramoto et al., 2000; Moore et al.,2000). The accretionary prism in this part of the Nankaislope can be divided into several tectonic domains fromthe trench to landward: Nankai Trough axis zone, proto-thrust zone (PTZ), imbricate thrust zone (ITZ), frontalout-of-sequence thrust zone (OOSTZ), large thrust slice
Fig. 1. Location of study ar
zone (LTSZ), and landward-dipping reflector zone(LDRZ) (Fig. 2).
A BSR is well developed through the LDRZ,which is the oldest part of the prism (Fig. 2), anddiminishes abruptly at the boundary between this zoneand LTSZ. Two fundamental lithostratigraphic units atODP Site 1178 were recognized (Shipboard ScientificParty, 2000). Both are divided into three subunits.Subunit IA (upper slope-apron facies) is Quaternary toPliocene in age and extends from the seafloor to adepth of 94.40 mbsf. Lithologies consist of hemi-pelagic mud, sandy mud, and volcanic ash. Subunit IBis Pliocene in age and extends from 94.40 mbsf to127.00 mbsf. In addition to the normal hemipelagicmud, this subunit also contains abundant silt-sandturbidites, and minor mud-supported gravel. SubunitIC is early Pliocene in age and extends from 127.00 mbsfto 199.20 mbsf. Lithologies in Subunit IC consist ofhemipelagic mud with variable amounts of intermixedsand, rare volcanic ash beds, and rare mixed volcaniclappilli and gravel-sized mud clasts. Subunit IIA(411.00–199.20 mbsf) contains abundant sand and siltturbidites. Subunit IIB (411.00–563.95 mbsf) containssporadic silt to sandy silt turbidites and a greaterproportion of mudstone. The axial trench-wedge faciesis repeated below 563.95 mbsf (Subunit IIC), extendingto the bottom of Hole 1178.
ea in Nankai Trough.

Fig. 2. Schematic interpretation of seismic line in the Muroto Transect showing tectonic domains and location of ODP drill sites (Modified fromMoore et al., 2000). LDRZ=landward-dipping reflectors zone; LTSZ=large thrust slice zone; OOST=first out-of-sequence thrust zone;ITZ=imbricate thrust zone; PTZ=proto-thrust zone.
204 L. He et al. / Marine Geology 227 (2006) 201–214
Paleomagnetic measurements of magnetic inclinationand intensity in Holes 1178A and 1178B show theexistence of four age gaps from the top of Hole 1178A tothe bottom of Hole 1178B (Shipboard Scientific party,2000). Based on the results of biostratigraphy, theinclinations changes are identified as four differentgeomagnetic polarity periods. Normal polarity isidentified from 0 to 8.5 mbsf in Hole 1178A within theBrunches Chron (0–0.78 Ma). Inclination changes from8.5 to 209.75 mbsf are considered to be geomagneticpolarity changes from late Pliocene to Miocene,including the Gauss (2.581–3.580 Ma), Gilbert(3.580–5.894 Ma), and C3A (5.894–6.935 Ma) Chrons.
The polarity changes from 209.75 to∼400 mbsf are alsoidentified as the same geomagnetic polarity changesfrom late Miocene–Pliocene. Continuous steep inclina-tions below 400mbsf may be considered to be a repeat ofthe C4r Subchron (8.072–8.699 Ma).
No BSRs are developed in the Nankai Trough axiszone, PTZ, and some seaward part of the ITZ,comprising the youngest parts of the prism. Leg 387and 131 results indicate that the stratigraphy of the trenchfloor is composed of the following lithologic units indecreasing order: trench turbidites (Holocene–Pleisto-cene), turbidite–hemipelagite transition (Pleistocene),hemipelagite with tephra layers (early Pleistocene–late
205L. He et al. / Marine Geology 227 (2006) 201–214
Pliocene), massive hemipelagite (mid-Pliocene to mid-Miocene), acidic volcaniclastics (15 Ma), and pillowbasalts (16 Ma).
2.2. Heat flow
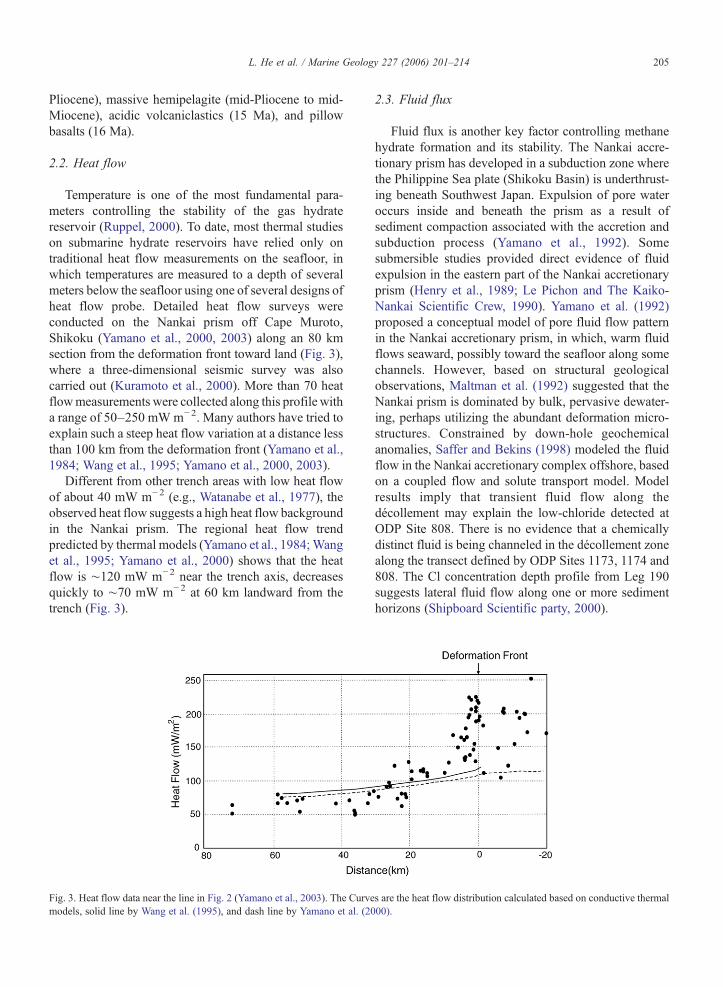
Temperature is one of the most fundamental para-meters controlling the stability of the gas hydratereservoir (Ruppel, 2000). To date, most thermal studieson submarine hydrate reservoirs have relied only ontraditional heat flow measurements on the seafloor, inwhich temperatures are measured to a depth of severalmeters below the seafloor using one of several designs ofheat flow probe. Detailed heat flow surveys wereconducted on the Nankai prism off Cape Muroto,Shikoku (Yamano et al., 2000, 2003) along an 80 kmsection from the deformation front toward land (Fig. 3),where a three-dimensional seismic survey was alsocarried out (Kuramoto et al., 2000). More than 70 heatflowmeasurements were collected along this profile witha range of 50–250 mWm−2. Many authors have tried toexplain such a steep heat flow variation at a distance lessthan 100 km from the deformation front (Yamano et al.,1984; Wang et al., 1995; Yamano et al., 2000, 2003).
Different from other trench areas with low heat flowof about 40 mW m−2 (e.g., Watanabe et al., 1977), theobserved heat flow suggests a high heat flow backgroundin the Nankai prism. The regional heat flow trendpredicted by thermal models (Yamano et al., 1984;Wanget al., 1995; Yamano et al., 2000) shows that the heatflow is ∼120 mW m−2 near the trench axis, decreasesquickly to ∼70 mW m−2 at 60 km landward from thetrench (Fig. 3).
Fig. 3. Heat flow data near the line in Fig. 2 (Yamano et al., 2003). The Curvemodels, solid line by Wang et al. (1995), and dash line by Yamano et al. (20
2.3. Fluid flux
Fluid flux is another key factor controlling methanehydrate formation and its stability. The Nankai accre-tionary prism has developed in a subduction zone wherethe Philippine Sea plate (Shikoku Basin) is underthrust-ing beneath Southwest Japan. Expulsion of pore wateroccurs inside and beneath the prism as a result ofsediment compaction associated with the accretion andsubduction process (Yamano et al., 1992). Somesubmersible studies provided direct evidence of fluidexpulsion in the eastern part of the Nankai accretionaryprism (Henry et al., 1989; Le Pichon and The Kaiko-Nankai Scientific Crew, 1990). Yamano et al. (1992)proposed a conceptual model of pore fluid flow patternin the Nankai accretionary prism, in which, warm fluidflows seaward, possibly toward the seafloor along somechannels. However, based on structural geologicalobservations, Maltman et al. (1992) suggested that theNankai prism is dominated by bulk, pervasive dewater-ing, perhaps utilizing the abundant deformation micro-structures. Constrained by down-hole geochemicalanomalies, Saffer and Bekins (1998) modeled the fluidflow in the Nankai accretionary complex offshore, basedon a coupled flow and solute transport model. Modelresults imply that transient fluid flow along thedécollement may explain the low-chloride detected atODP Site 808. There is no evidence that a chemicallydistinct fluid is being channeled in the décollement zonealong the transect defined by ODP Sites 1173, 1174 and808. The Cl concentration depth profile from Leg 190suggests lateral fluid flow along one or more sedimenthorizons (Shipboard Scientific party, 2000).
s are the heat flow distribution calculated based on conductive thermal00).

Fig. 4. Relative permeability of water–gas flow in porous sedimentagainst saturation of water or saturation of gas calculated from Corey'sLaw (Corey, 1977).
206 L. He et al. / Marine Geology 227 (2006) 201–214
Up to now, channeled fluid flow is generally believedto exist and be active near the prism axis (trench), but israther weak 50 km landward. However, there is noconclusion as to what act as channel, décollement,faults, or sediment horizons.
2.4. Methane flux
Methane flux is also a key factor controllingmethane hydrate formation and accumulation. Thethickness of the sulfate reduction zone provides a wayto estimate the methane flux (Borowski et al., 1996).Linear gradient of sulfate in a region implies that thesulfate depletion is dominated by anaerobic methaneoxidation localized at the base of the sulfate-bearingzone. Apparently, downward diffusion of sulfate fromthe overlying seawater is required to balance theupward methane flux. Because the methane is con-sumed by reaction with sulfate, linear sulfate gradientscan be used to quantify and assess the in situ methaneflux, which is a function of the methane inventorybelow (Borowski et al., 1996).
The methane flux is estimated from sulfate gradient ateach site using the method of Borowski et al. (1996). It isassumed that sulfate consumption is primarily driven byupward-diffusing methane rather than by flux of organicmatter to the sediment. Methane flux converted from thesulfate gradient are very low at ODP Sites 1178 and1176, only 6 and 8 mol m−2 kyr−1, respectively. Themethane flux values at Site HP04 (Toki et al., 2001) andODP Site 1174 are similar (77 mol m−2 kyr−1), being thehighest among all these sites. ODP Site 808 has anestimated methane flux of 62 mol m−2 kyr−1. Themethane flux values at the ODP Sites 1178 and 1176 areclose to the value of 18 mol m−2 kyr−1 for Carolina Riseand Blake Ridge estimated by Borowski et al. (1996)using the same method. In contrast, the methane fluxvalues at Site HP04, ODP Sites 1174 and 808 aredistinctly higher and close to those predicted bymodeling at ODP Site 1043 (70 mol m−2 kyr−1) offshoreCosta Rica (Ruppel and Kinoshita, 2000).
3. Method
We designed a two-dimensional transient model ofmethane hydrate formation and evolution. Following Xuand Ruppel (1999), fundamental equations governingthe two-component, three-phase system in poroussediments deal with conservation of momentum, fluidmass, energy, and methane gas. Assuming that Darcy'sLaw describes multiphase fluid flow through oceanicsediments of porosity ϕ and permeability k. The mass
fluxes q of liquid (subscript l), gas (subscript g) andhydrate (subscript h) phases are given by:
qYl ¼ � krlkqlll
jPl þ qlgYð Þ
qYg ¼ � krgkqglg
jPg þ qggY� �
qYh ¼ 0 ð1Þwhere g represents the gravitational acceleration, P ispressure, ρ is density, μ is viscosity, and krg and krldenote relative permeability functions for the gas andliquid, respectively. qhY equals to zero due to the neglectof sedimentation rate. To our knowledge it is a wellestablished practice in oil and gas reservoir engineeringfield that the two-phase flow (co-existing gas and liquidin porous media) can be treated mathematically byintroducing the saturation-dependent “relative perme-ability” (Corey, 1977) for each phases into thetraditional Darcy's Law.
krl ¼ S4e ;Se ¼ Sl � Srlð Þ=ð1� Srl � SrgÞ
krg ¼ 1� S2e� �
1� Seð Þ2 ð2Þwhere Sl is the volume saturation of water in the porespace, Srl and Srg are the irreducible saturation of waterand gas, respectively. Fig. 4 shows Krl and Krg against Slor Sg (saturation of gas). It is clear that Krg drops rapidlywhen Sg is less than 10%, indicates that the gases phase issomewhat very hard to move if Sg is less than a fewpercents.
Such an assumption might not wholly represent theprocesses involving gas hydrate formation and dissoci-ation, but it still remains one simple and validated

207L. He et al. / Marine Geology 227 (2006) 201–214
conceptual model that is supported by experience ofpractical applications. There is no basic differencebetween the hydrate–gas–liquid containing system andthat of gas–oil containing geological formations whichhas been studied so far. Furthermore, in the case of thepresent problem the multiphase fluid flow is alwayswater-dominated flow in porous sediment. Hence, abovespecial form of the Darcy's Law is good enough formodeling the conservation of momentum.
Conservation of mass for the system is given by
Að/qÞAt
þjd qY l þ qYg þ qYh
� �¼ QS ð3Þ
where t denotes time, ρ is bulk density, and QS
represents the source terms including water source andmethane. With Qm as the rate of methane gas productionin the sediments, conservation of mass for methane gasis written as:
Að/qMÞAt
þjd qYlMl þ qYgMg þ qYhMh
� �¼ jd /KmSljMlð Þ þ Qm ð4Þ
where M is mass fraction of methane in individualphases and Km the product of dispersion–diffusioncoefficient Dm and the representative fluid density ofthe system, which can nominally be taken as 1000 kgm− 3 for the sake of converting between Km and Dm.Sl stands for volume saturation of liquid in the porespace.
Conservation of energy is cast in terms of enthalpy Hand temperature T and written as
A
At/qH þ ð1� /ÞqsCsT½ �þjd qYlHl þ qYgHg þ qYhHh
� �¼ jdðkjTÞ þ Qe ð5Þ
where subscript s refers to the sediment matrix, Cdenotes specific heat capacity, Qe is heat source termrelate to radiogenic heat production and latent heat, andλ is effective thermal conductivity, which is written as alinear combination of the thermal conductivities fordifferent components of the system:
k ¼ ð1� /Þks þ / Slkl þ Sgkg þ Shkh� � ð6Þ
where Sg and Sh stands for volume saturation of gas andhydrate in the pore space, respectively.
Finally, the balance among the phases can beincorporated by writing bulk density ρ bulk enthalpy
ρH, and bulk mass fraction of methane ρM as linearcombinations of the properties of the individual phases:
q ¼ Slql þ Sgqg þ Shqh
qM ¼ SlqlMl þ SgqgMg þ ShqhMh
qH ¼ SlqlHl þ SgqgHg þ ShqhHh ð7Þwhere the saturation S are subject to the constitutiveequation:
1 ¼ Sl þ Sg þ Sh: ð8Þ
In this study, we ignore the effects of the sedimen-tation rate. Further, for simplicity, we introduce anaverage pressure P=(Pg+Pl)/2 for gas and water.Generally, Pg is larger than Pl due to capillary pressure.This assumption gives good results for water dominatedflow in porous media. After some rearrangements, thebasic governing equations can be summarized in theformal form of differential equations for diffusion andconvection. The formal differential equation for diffu-sion and convection in coefficient form is
daAUAt
�jdðcjUÞ þ bdjU þ aU ¼ f ;ðU ¼ P;T ;MlÞð9Þ
with boundary condition
ndðcjUÞ þ qU ¼ g;ðU ¼ P;T ;MlÞ ð10Þ
For average pressure P, the coefficients are
da ¼ /elSlql
þ egSgqg
!;
c ¼ klll
þ kglg
!;
b ¼ � klqlll
jql þkg
qglgjqg
!;
f ¼ gqlj
klq2lll
� �þ gqg
jkgq2glg
!þ Ql
qlþ Qg
qgð11Þ
where εl and εg are compression coefficients of waterand gas, respectively;Ql andQg are sources of water andgas, respectively.

208 L. He et al. / Marine Geology 227 (2006) 201–214
For temperature T, the coefficients are
da ¼ ð1� /ÞqsCs;
c ¼ k ¼ / Slkl þ Sgkg þ Shkh� �þ ð1� /Þks;
bt¼ Clq
tl þ Cgq
tg
� �;
a ¼ ClQl þ CgQg
� �;
f ¼ Qe: ð12ÞFor mass fraction of methane, we have
da ¼ /Slql;
c ¼ Dm/Slql ¼ Km/Sl;
bY ¼ qYl
f ¼ Qm: ð13Þ
Parameters of the sediments such as porosity,permeability, can be spatially inhomogeneous. Theseequations are generally nonlinear and coupled to eachother since some parameters such as density of gas arefunctions of P and T. We have designed a MSWindows-based program based on the finite-difference approach tosolve these equations, and it is given the name GLHpro.The problem is solved forward from the given initialcondition with a given time interval. At every step, eachgoverning equation is solved separately at first using animplicit scheme advanced with Successive Over Relax-ation (SOR) algorithm. Then an iterative procedure isapplied to deal with the nonlinear and coupling effects.The phase balance is checked at each step of iteration fortime. In the case of methane evolution, the saturation ofthe gas component is generally very small and thereforethe iterative process is very effective even for a large timeinterval (100–1000 years). However, if there is a regionhighly saturated gas phase in the model, a smaller timestep is required for convergence. We have validated ourprogram for some typical coupled diffusion–convectionproblems using the commercial software FEMLAB, afinite element program for multi-phase physics. Adetailed description and verification of the results willbe published elsewhere. Our program has also been usedfor the simulation of underground CO2 storage.
We chose two study areas for modeling along the lineof the high-resolution seismic profile mentioned above(Fig. 2). The two study areas represent two differentsettings, and both of them are near ODP Sites, whichmay provide necessary parameters and constraints formodeling. Area-I includes ODP Site 1178 with well-
developed BSRs, which is also characterized bymoderate heat flow and low methane flux, but ratherolder sediments. Area-II includes ODP Site 808, whereno BSR is developed, which is characterized by highheat flow and methane flux, but young sediments. Avertical fault zone is assumed in Area-II.
The upper boundaries fixed at constant temperature,pressure, and methane concentration. At the lowerboundary, the heat flow and fluid flow rate is fixed, and∂Ml/∂y=0. Thus, the methane flux would be determinedautomatically and stabilized at a certain value. Thevertical boundaries are defined as follows:
AT=Ax ¼ 0
AP=Ax ¼ 0
AMl=Ax ¼ 0: ð14ÞThe initial temperature field is steady state, and
pressure is hydrostatic. Initial saturations of methane gasand hydrate are assumed zero (Sg=0, Sh=0), and that ofliquid is 1 (Sl =1). The initial mass fraction of methane isgiven as it is saturated. The mass fraction of methane atthe upper boundary is the same with that in the seawater(10−8 kg kg−1). We assume that mass fraction ofmethane at the lower boundary is saturated. Methanesolubility Ceq was calculated using the methods ofRempel and Buffett (1998). In principle the equilibriumconcentration depends on both pressure and tempera-ture, but in geological applications the temperaturedependence is expected to the controlling factor(Rempel and Buffett, 1998). The temperature depen-dence of Ceq may be expressed in form of:
CeqðTÞ ¼ CeqðT3Þexp aðT � T3Þ½ � ð15Þwhere T3 is the temperature for three-phase equilibriumand Ceq(T3) is the corresponding solubility. α
− 1 is takenas 10 °C (Rempel and Buffett, 1998). The time neededfor phase transformation, solution and dissolution isignored since the methane evolution is a very slowprocess. The latent heat is 430000 J when 1 kg gas ischanged to hydrate, and that is 120000 J when 1 kg gasis changed to liquid.
4. Modeling results
4.1. Area-I
A model 600 m width and 500 m deep wasconstructed for the area near ODP Site 1178, which is

Fig. 5. Saturation of methane hydrate and free gas of the standard model. (a) Methane hydrate saturation and free gas saturation along depth at time 2Myr, 4 Myr, and 6 Myr, respectively, using standard model parameters. Ct stands for the depth distribution of the methane solubility andMl indicatesthe methane mass fraction at 6 Myr. TMHOZ=top of methane hydrate occurrence zone; BMHOZ=bottom of methane hydrate occurrence zone;BMHSZ=bottom of methane hydrate stability zone; TFGZ=top of free gas zone. (b) Chloride profile (from Moore et al., 2001). (c) Sulfate profile.(From Moore et al., 2001).
Table 2Parameters used in the model
Parameter Definition Value
λ Thermal conductivity 1.2 W m−1 K−1
g Gravitational acceleration 9.81 m s−2
μl Viscosity of liquid 8.87×10⁻⁴ kg m−1 s−1
μg Viscosity of gas 1×10⁻⁵ kg m−1 s−1
ρl Density of liquid 1000 kg m−3
ρh Density of hydrate 930 kg m−3
ρs Density of sediment 2650 kg m−3
Cl Specific heat capacityof liquid
4180 J kg−1 K−1
Ch Specific heat capacity ofhydrate
2080 J kg−1 K−1
Cs Specific heat capacityof sediment
2200 J kg−1 K−1
L Latent heat 430 kJ kg−1
k Permeability 1.0×10⁻¹⁶–1.0×10⁻¹⁸ m2
ϕ Porosity 0.6–0.33Dm Dispersion–diffusion
coefficient4.7×10−10 m2 s−1
Sources are Yamano et al. (1982), Rempel and Buffett (1998), Xu andRuppel (1999), Moore et al. (2001).
209L. He et al. / Marine Geology 227 (2006) 201–214
about 60 km landward of the deformation front. Theupper boundary has a water depth of 1750 m,temperature of 1.6 °C, and methane concentration of10−8 kg kg−1. On the lower boundary, the heat flow is70 mW m−2, fluid flow is 1×10⁻¹¹ kg m−2 s−1.Bernard ratios (C1 / (C2+C3)) at Site 1178 indicate thatbiogenic methane is present through site 1178 anddecreasing nearly linearly with increasing depth (Mooreet al., 2001). A depth related methane source is thereforeassumed as Qm=(4−3d/500)×10−14 kg m−3 s−1,where d is the depth from the sea bottom. Thus, theQm is 4×10⁻¹⁴ kg m−3 s−1 at the seafloor, and thendecreases linearly to 1×10⁻¹⁴ kg m−3 s−1 at the modelbottom. The porosity is adopted as 0.6 at the sea bottom,and decreases linearly to 0.5 at 100 mbsf. From 100 to300 mbsf, it decreases linearly from 0.5 to 0.4, and from300 to 500 mbsf, it decreases linearly from 0.4 to 0.33(Moore et al., 2001). The corresponding permeability ofthree layers are calculated by the log-linear permeabil-ity–porosity relationship (Saffer and Bekins, 1998). Thepermeability is 1×10⁻¹⁶ m2 at the sea bottom, anddecreases linearly to 1×10⁻¹⁷ m2 at 100 mbsf. From100 to 300 mbsf, it varies from 1×10⁻¹⁷ to 5×10⁻¹⁸
m2, and from 300 to 500 mbsf, it changes from 5×10⁻¹⁸
to 1×10⁻¹⁸ m2.These conditions result in a present day methane flux
of about 3×10⁻¹² kgm−2 s−1 at the sea bottom consistentroughly with the calculated value (6 mol m−2 kyr−1≈3×10⁻¹² kg m−2 s−1) from the sulfate gradient (Fig. 5c).Other parameters are listed in Table 2. The model is run 6Myr, corresponding to the age of sediment at the base ofthe methane hydrate stability zone (260 mbsf) under the
present temperature–pressure condition. The number ofgrid cells is 60(x-direction)×100(y-direction).
Modeling results show that the accumulation rate ofmethane hydrate is slower than that of free gas under theassumed conditions. After 6 Myr evolution, about 2%free gas was concentrated below the depth of 400 mbsf,and only about 1% methane hydrate formed within themethane hydrate occurrence zone (MHOZ) (Fig. 5a).Under this condition, the three interfaces, which are the

210 L. He et al. / Marine Geology 227 (2006) 201–214
bottom of methane hydrate occurrence zone (BMHOZ),the bottom of methane hydrate stability zone (BMHSZ),and the top of free gas zone (TFGZ) do not coincide.Since there is no any horizontal variation in modelparameters, the numerical model for Area-I is equivalentto a one-dimensional model. Also, as the running time islong enough, our transient numerical results at 6 Myr arebasically consistent with the theoretical predictionobtained from the stable 1-dimension model of Xu andRuppel (1999).
The top of the free gas zone is predicted to be at 400mbsf, consistent roughly with the BSR developed here.Hyndman et al. (2001) indicated 0.5% of free gas bringsdown seismic velocity significantly enough to have aBSR. This implied that the BSR here might mark the topof the free gas zone. As a result, the depth of the BSR isdeeper than the estimated bottom of the hydrate stabilityzone (∼260 mbsf). This case is similar to that found atODP Site 994, where a reflector with negativeimpedance contrast lies at 550 mbsf (Holbrook et al.,1996), far below the base of the methane hydrate zone(∼450 mbsf) as defined on the basis of chlorideanomalies (Paull et al., 1996).
According to our model results, the methane hydrateis formed within a depth zone of 90–200 mbsf (Fig. 5a).The maximum saturation is ∼1% near 150 mbsf. Thisresult could be supported by both direct (a presence of asmall amount of gas hydrate occurring at 210 mbsf) andindirect evidence for hydrate.
Cl concentration is usually served as one of thegeochemical indicators for hydrate, although reducedpore water salinities could be attributed to not only gashydrate dissociation, but also meteoric water input, claymembrane ion filtration and clay mineral dehydration(Dählmann and de Lange, 2003). At ODP Site 1178, theCl concentration–depth profile (Fig. 5b) has a steepcontinuous trend of freshening between 90 and 200mbsf with two intense Cl minima. The first is between170 and 185 mbsf. The second minimum with thelowest Cl value of 524 mM compared with that ofbottom-water value of 557 mM was measured in Core190-1178A-23X (the one with the −0.5 °C catwalktemperature). Temperatures 4–6 °C colder than thebackground were measured in several cores, mostlybetween 150 and 200 mbsf. Small areas of lowtemperatures were interpreted as indicating areaswhere endothermic hydrate decomposition decreasedthe core temperature. The associated elevated methaneconcentration, the observation that other dissolvedcomponents, such as Si and Ca, having similar dilutionminima (Shipboard Scientific Party, 2000). All theindirect evidence above, together with a presence of a
small amount of gas hydrate occurring at 210 mbsf,indicate that disseminated methane hydrate is probablywidespread at this area.
4.2. Effects of methane source and fluid flow
In this sub section, we give some analysis about theparameter sensitivity. If we change the distribution ofQm in above model (we call it ‘the standard model’),then different results could be predicted (Fig. 6a).Firstly, we choose a constant value of 2.5×10⁻¹⁴ kgm− 3 s− 1, and other parameters keep unchanged.Compared with the result of Fig. 5a, we find that thepredicted hydrate saturation is a little smaller than thestandard model, but the saturation of free gas increasesobviously and the top of the free gas moves upward.Secondly, we change the Qm distribution as (5−5d/500)×10−14 kg m−3 s−1, which implying the methanesource varies from 5×10⁻¹⁴ kg m−3 s−1 at the seafloorto zero at the model bottom. In this case, the predictedhydrate saturation is a little larger than the standardmodel, but the saturation of free gas decreases obviouslyand the top of the free gas moves downward. Thirdly,the Qm distribution is adopted as (1+3d/500)×10−14 kgm−3 s−1. Different from above cases, the Qm increaseslinearly from the seafloor downward. Under thiscondition, the hydrate saturation is smallest among allthe cases due to the lowest methane source in theshallow depth, while the saturation of the free gas is thelargest and the top of the free gas zone is the shallowestdue to the largest value of the methane source in thedeep. Therefore, the distribution of the hydrate as wellas the free gas is related closely to the Qm distribution.
In the above standard model, we choose a low fluidflow (1×10⁻¹¹ kg m−2 s−1) at the lower modelboundary in order to fit the very low observed valueof surface methane flux of 6 mol m−2 kyr−1. If weincrease the fluid flow at the lower boundary, keepingthe Qm distribution as the standard model, we can find(Fig. 6b) that larger fluid flow assigned to the lowerboundary can result in higher saturation both of hydrateand free gas, and consequently larger methane flux onthe surface. In the three cases, the fluid flow at the lowerboundary is 1×10⁻¹⁰ kg m−2 s−1, 1×10⁻⁹ kg m−2 s−1,5×10⁻⁹ kg m−2 s−1, respectively. As the fluid flowincreases, the saturation of the hydrate adds greatly,accompanying the extension of the methane hydratezone and its bottom close to the BMHSZ. In themeanwhile, the saturation of the free gas alsoenhances, and the top of the free gas zone movesupward to approach the BMHSZ. In the three cases,the resulting surface methane fluxes are 4×10⁻¹² kg

Fig. 6. Saturation of methane hydrate and free gas. (a) Methane hydrate saturation and free gas saturation along depth at 6 Myr using different Qm. (b)Methane hydrate saturation and free gas saturation along depth at 6 Myr using different fluid flow at the lower boundary.
211L. He et al. / Marine Geology 227 (2006) 201–214
m−2 s−1, 7×10⁻¹² kg m−2 s−1, and 3×10⁻¹¹ kg m−2
s−1, respectively, which are bigger than the observedvalue greatly. Therefore, we suggest that the afore-mentioned standard model in Section 4.1 is the mostreliable model for Area-I.
4.3. Area-II
Kuramoto et al. (2000) suggested that there are somedipping faults existing in the Nankai Trough axis zone.For considering the effect of fault zone, a model of1000 m width and 400 m depth with an assumedvertical fault zone in the center was run for Area-II. Theporosity is 0.6 at the sea bottom, and decreases linearlyto 0.5 at 100 mbsf. From 100 to 400 mbsf, it decreaseslinearly from 0.5 to 0.45 (Moore et al., 2001). Thepermeability distribution of the model is shown as Fig.7a. The upper boundary has a water depth of 4675 m,
temperature of 2 °C, and methane concentration of10−8 kg kg−1. On the lower boundary, the heat flow is120 mW m−2, fluid flow is 7×10⁻⁹ kg m−2 s−1, andthe boundary condition for the mass fraction ofmethane is AMl
A7 ¼ 0. Hence, the methane flux both atthe top and bottom boundaries resulted from theaforementioned conditions and has not being given asa boundary condition. A depth related methane sourceis chosen here, which is 4×10⁻¹⁴ kg m−3 s−1 at theseafloor, and then decreases linearly to 1×10⁻¹⁴ kgm−3 s−1 at the model bottom. These conditions resultin a present-day methane flux of about 2×10⁻¹¹ kgm−2 s−1 at the sea bottom consistent with the observedvalue of 62 mol m−2 kyr−1 converted from the sulfategradient obtained at ODP Site 808. The methanehydrate could only be formed within the stability zone,therefore, it should be younger than the age of thesediments in the methane hydrate stability zone. We

Fig. 7. Methane hydrate evolution for Area-II. (a) Distribution of permeability. (b) The methane concentration at time 0.1 Myr, 0.2 Myr, and 0.3 Myr,respectively.
212 L. He et al. / Marine Geology 227 (2006) 201–214
want to observe if there is methane hydrate formed, sowe only run for 0.3 Myr, equal to the age of thesediment at the base of the methane hydrate stabilityzone under present temperature–pressure conditions.The time step of modeling was chosen as 100 years,and grid cells is 100(x-direction)×40(y-direction).
Model results show that the assumption of thevertical fault zone resulted in a non-uniform distributionof methane concentration throughout the model duringthe process of methane hydrate accumulation. Withinthe fault zone, fluid flow was faster than in the
sediments because of the larger permeability. Therefore,the methane concentration in the fault zone grew fasterthan in the background region, and the contour lines ofmethane concentration are protruding in the fault zone(Fig. 7b). After 0.3 Myr, the methane hydrate saturationis about 1.5% of the pore space within the fault zone,and it is less than 0.4% outside the fault zone (Fig. 8).Although the methane flux from below is relativelylarge, the methane hydrate concentration in the youngsediments, except in the fault zone, is lower than 0.4%(Fig. 8). At the present day, unfortunately, the methane

Fig. 8. The present-day saturation of methane hydrate predicted bymodeling within the fault zone (solid line) and outside fault zone (dashline).
213L. He et al. / Marine Geology 227 (2006) 201–214
hydrate saturation is too small to be detected bygeophysical method.
In this area, less than 0.1% free gas is formed belowthe stability zone. Compared to Area-I, the methane fluxobserved in this model is ten times larger, but the freegas formed is so small due to the short duration ofevolution. The older the sediments are, implying alonger period of methane flux supply from below, thelarger the volume percentage of free gas will be, and thecloser will be the top of the free gas zone to the base ofgas stability zone.
Therefore, according to our modeling results, it isimpossible to produce a BSR in Area-II, no matterwhether at the top of the free gas zone or the base ofhydrate bearing sediments. The maximum volumepercentage of free gas is less than 0.1% of the space inthis case, which may not be enough to produce a strongnegative impedance contrast for BSR. Hydman andSpence (1992) indicated that about one-third of the porespace should be filled with hydrate to give a BSRimpedance contrast. 0.4% hydrate of the pore space inthis area is too small to give a strong impedance contrastto produce a BSR at the base of hydrate bearingsediments.
5. Conclusions
A two-dimensional transient model of methanehydrate accumulation is designed to simulate methanehydrate formation and evolution in the Nankai accre-tionary prism. Two study areas representing twodifferent geological environments are selected formodeling.
Model results show that, the formation of free gaszone and its top is not only related to the methane fluxsupplied from below or in the volume, but is also relatedto the duration of evolution according to our transientmodel. The older the sediments are, implying a longerperiod of methane flux supply from below, the larger thevolume percentage of free gas will be, and the closer thetop of the free gas zone will be to the base of gas stabilityzone. This can explain the presence of a BSR in Area-Ibut no BSR in Area-II, despite the higher methane fluxdeduced from sulfate gradient in Area-II.
Modeling results show that the methane hydrateoccurrence zone in Area-I is 90–200 mbsf, which issupported by the low chloride observed in the samedepth range, and also other geochemical observations.The maximum saturation of methane hydrate predictedis 1% of the pore space.
Near the deformation front that is characterized by ahigh heat flow and young age, only the fault zoneshaving high fluid flow and methane flux are possible toproduce high concentration of methane hydrate.
Acknowledgments
This study was supported by Japan Society for thePromotion of Science (JSPS).
References
Borowski, W.S., Paul, C.K., Ussler, W., 1996. Marine pore-watersulfate profiles indicate in situ methane flux from underlying gashydrate. Geology 24, 655–658.
Corey, A.T., 1977. Mechanics of Heterogeneous Fluids in PorousMedia. Water Resources Publications, Fort Collins, Colorado.
Davie, M.K., Buffett, B., 2003. Sources of methane for marine gashydrate: inferences from a comparison of observations andnumerical models. Earth Planet. Sci. Lett. 206, 51–63.
Dählmann, A., de Lange, G.J., 2003. Fluid–sediment interactions atEastern Mediterranean mud volcanoes: a stable isotope study fromODP Leg 160. Earth Planet. Sci. Lett. 212, 377–391.
Dvorkin, J., Nur, A., 1993. Rock physics for characterization of gashydrates. The Future of Energy Gases, U.S. Geol. Surv. Prof. Pap.,vol. 1570, pp. 293–298.
Finley, P., Krason, J., 1986. Geological Evolution and Analysis ofConfirmed or Suspected Gas Hydrate Localities: Basin Analysis,Formation and Stability of Gas Hydrates in the Middle AmericaTrench. U.S. Department of Energy, p. 9. DOE/MC/21181-1950.
Gering, K., 2003. Simulations of methane hydrate phenomena overgeologic timescales: Part I. Effects of sediment compaction rateson methane hydrate and free gas accumulations. Earth Planet. Sci.Lett. 206, 65–81.
Henry, P., Lallemant, S.J., Le Pichon, X., Lallemand, S.E., 1989. Fluidventing along Japanese trenches: tectonic context and thermalmodeling. Tectonophysics 160, 277–291.
Holbrook, W.S., Hoskins, H., Wood, W.T., Stephen, R.A., Lizarralde,Leg 164 Science Party, 1996. Methane hydrate and free gas on the
214 L. He et al. / Marine Geology 227 (2006) 201–214
Blake Ridge from vertical seismic profiling. Science 273,1840–1843.
Hydman, R., Spence, G.D., 1992. A seismic study of methane hydratemarine bottom simulating reflectors. J. Geophys. Res. 97,6683–6698.
Hyndman, R.D., Spence, G.D., Chapman, R., Riedel, M., Edwards, R.N., 2001. Geophysical Studies of Marine Gas Hydrate in NorthernCascadia. Natural Gas Hydrates: Occurrence, Distribution, andDetectionAGU Monograph, vol. 124, pp. 273–295.
Kanamori, H., 1986. Rupture process of subduction-zone earthquakes.Annu. Rev. Earth Planet. Sci. 14, 293–322.
Kuramoto, S., Taira, A., Bangs, N.L., 2000. Seismogenic zone in theNankai accretionary wedge' general summary of Japan–U.S.collaborative 3-D seismic investigation. J. Geography 109,531–539 (in Japanese with English abstract).
Le Pichon, X., The Kaiko-Nankai Scientific Crew, 1990. Fluid ventingin easternmost Nankai accretionary prism based on Kaiko-Nankaicruise results. Int. Conf. Fluids in Subduction Zones, Paris(abstract).
Maltman, A., Byrne, T., Karig, D., 1992. Structural geologicalevidence from ODP Leg 131 regarding fluid flow in the Nankaiprism, Japan. Earth Planet. Sci. Lett. 109, 463–468.
Minshull, T.A., Singh, S.C., Westbrook, G.K., 1994. Seismic velocitystructure at a gas hydrate reflector, offshore western Colombia,from full waveform inversion. J. Geophys. Res. 99, 4715–4734.
Moore, G.F., Taira, A., Baldauf, J., Klaus, A., 2000. Proc. ODP,Scientific Prospectus 190. Ocean Drilling Program. Texas A&MUniversity, College Station TX 77845-9547, USA.
Moore, G.F., Taira, A., Klaus, A., et al., 2001. Proc. ODP, Init. Repts.,190. Ocean Drilling Program. Texas A&M University, CollegeStation TX 77845 9547, USA.
Paull, C.K., Matsumoto, R., Wallace, P., Leg 164 Science Party, 1996.Proceedings of the Ocean Drilling Program, Initial Reports, vol.164. Ocean Drill. Program, College Station, Tex.
Rempel, A.W., Buffett, B.A., 1997. Formation and accumulation ofgas hydrate in porous media. J. Geophys. Res. 102, 10151–10164.
Rempel, A.W., Buffett, B.A., 1998. Mathematical models of gashydrate accumulation. In: Henriet, J.P., Mienert, J. (Eds.), GasHydrates: Relevance to World Margin Stability and ClimateChange. Geological Society, London, Special Publications, vol.137, pp. 63–74.
Ruppel, C., 2000. Thermal state of the gas hydrate reservoir. In:Max, M.D. (Ed.), Natural Gas Hydrate in Oceanic andPermafrost Environments. Kluwer Academic Publisher, Nether-lands, pp. 29–42.
Ruppel, C., Kinoshita, M., 2000. Fluid, methane, and energy flux in anactive margin gas hydrate province, offshore Costa Rica. EarthPlanet. Sci. Lett. 179, 153–165.
Saffer, D.M., Bekins, B.A., 1998. Episodic fluid flow in the Nankaiaccretionary complex: timescale, geochemistry, flow rates, andfluid budget. J. Geophys. Res. 103, 30351–30370.
Shipboard Scientific Party, 2000. Leg 190 preliminary report:deformation and fluid flow processes in the Nankai Troughaccretionary prism. ODP Prelim. Rpt., p. 190.
Stoll, R.D., Bryan, G.M., 1979. Physical properties of sedimentscontaining gas hydrates. J. Geophys. Res. 84, 1929–1634.
Toki, T., Gamo, T., Yamanaka, T., 2001. Methane migration from theNankai Trough accretionary prism. Bull. Geol. Surv. Jpn. 52, 1–8(in Japanese with English abstract).
Wang, K., Hyndman, R.D., Yamano, M., 1995. Thermal regime of theSouthwest Japan subduction zone: effects of age history of thesubducting plate. Tectonophysics 248, 53–69.
Watanabe, T., Langseth, M.G., Anderson, R.N., 1977. Heat flow inback-arc basins of the Western Pacific. In: Talwani, M., PitmanIIIIII, W.C. (Eds.), Island Arcs, Deep Sea Trenches, and Back-arcBasins. Maurice Ewing Ser., vol. 1. Amer. Geophys. Union,Washington, D.C., pp. 137–167.
Xu, W., Ruppel, C., 1999. Predicting the occurrence, distribution, andevolution of methane gas hydrate in porous sediments. J. Geophys.Res. 104, 5081–5095.
Yamano, M., Uyeda, S., Aoki, Y., Shipley, T.H., 1982. Estimates ofheat flow derived from gas hydrates. Geology 10, 339–343.
Yamano, M., Honda, S., Uyeda, S., 1984. Nankai Trough' a hot trench?Mar. Geophys. Res. 6, 187–203.
Yamano, M., Foucher, J.P., Kinoshita, M., Fisher, A., Hyndman, R.D.,1992. Heat flow and fluid regime in the western Nankaiaccretionary prism. Earth Planet. Sci. Lett. 109, 451–462.
Yamano, M., Kinoshita, M., Matsubayashi, O., Nakano, Y., 2000.Thermal structure of the Nankai accretionary prism and effects ofadvective heat transfer by pore fluid flows. J. Geography 109,540–553.
Yamano, M., Kinoshita, M., Goto, S., Matsubayashi, O., 2003.Extremely high heat flow anomaly in the middle part of the NankaiTrough. Phys. Chem. Earth 28, 487–497.
Yuan, J., Edwards, R.N., 2000. The assessment of marine gas hydratethrough electrical remote sounding: hydrate without a BSR?Geophys. Res. Lett. 27, 2397–2400.