metastatic breast cancer stem cells - altilabsites.altilab.com/files/30/calendrier/ginestier.pdf ·...
TRANSCRIPT
Metastatic breast cancer stem cells
Christophe GINESTIER, PhD
Centre de Recherche en Cancérologie de Marseille Laboratoire d’Oncologie Moléculaire Breast Stem Cell Group U1068/Inserm/Institut Paoli-Calmettes Marseille

Normal breast
epithelium Preneoplasia Invasive
Carcinoma Metastasis Carcinoma
in situ
Different step of the breast carcinogenesis
Initiation of carcinogenesis
Screening and Prevention
Diagnostic and
Treatment
“BRCA1 regulates human mammary stem/progenitor cell fate” (Liu, Ginestier et al. PNAS, 2008)

ALDH
BAAA
DEAB
ALDEFLUOR + cells
With DEAB Without DEAB
6%

With DEAB Without DEAB
R1 R2 R1 R2
ALDEFLUOR- 50,000 cells 5000 cells 500 cells
ALDEFLUOR+ 50,000 cells 5000 cells 500 cells
ALDEFLUOR + 500 cells
ALDEFLUOR – 50,000 cells
ALDEFLUOR- ALDEFLUOR+
ALDEFLUOR+ population and tumorigenicity
5% to 10% of ALDEFLUOR + population in Breast tumors
Ginestier et al. Cell stem cell, 2007
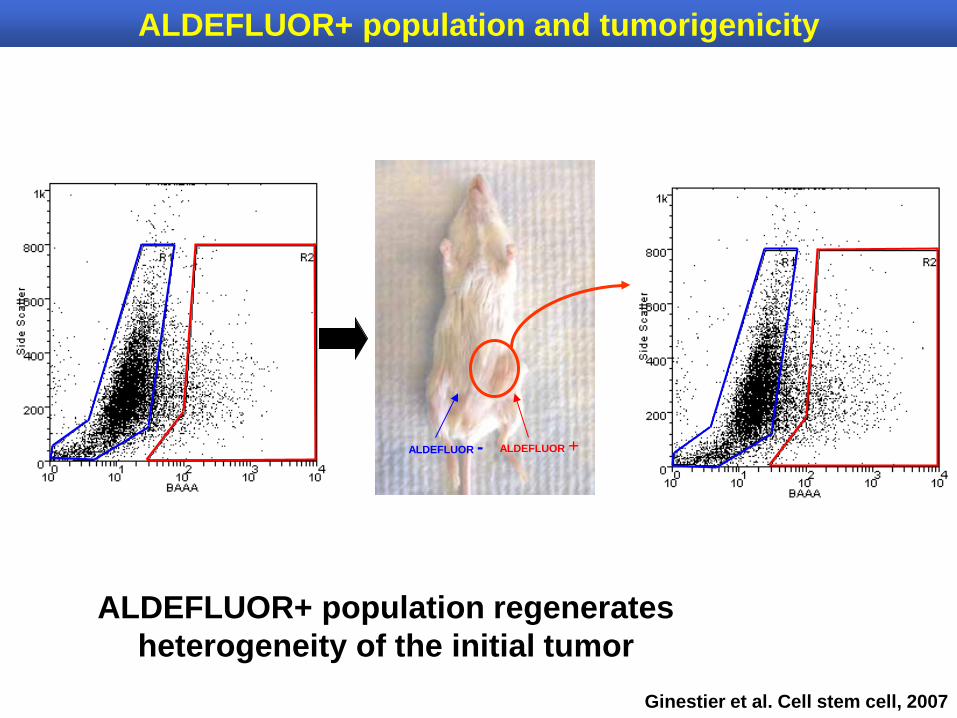
ALDEFLUOR+ population and tumorigenicity
ALDEFLUOR + ALDEFLUOR -
ALDEFLUOR+ population regenerates heterogeneity of the initial tumor
Ginestier et al. Cell stem cell, 2007

Cancer stem cells and metastasis

matrigel
DMEM with 10% human serum
Cell invasion assay
ALDEFLUOR-positive or
ALDEFLUOR-negative

0
1000
2000
3000
4000
5000
6000
7000
8000
SUM-149 HCC1954 SUM-159 MDAMB 453 MDAMB 436 BRCAMZ 01Num
ber o
f tot
al c
ells
inva
ded/
10,
000
cells
pla
ted ALDEFLUOR-positive ALDEFLUOR-negative
Cell invasion assay

Intracardiac injections
R2 R1
Lentivirus expressing Luciferase

0
25
50
75
100
1 3 5 7 9 11 13 15
Weeks after injection
100,000 ALDELFUOR-positive
100,00 ALDEFLUOR-negative
100,000 Unseparated
Weeks after injections
Nor
mal
ized
pho
ton
flux
ALDEFLUOR+ (100k)
Unsorted (100K)
ALDEFLUOR- (100K)
0
25
50
75
100
1 3 5 7 9 11 13 15
Weeks after injection
50,000 ALDELFUOR-positive
50,00 ALDEFLUOR-negative
50,000 Unseparated
Nor
mal
ized
pho
ton
flux
Intracardiac injections

Invasive Carcinoma Metastasis
Anti-CSC therapy
Conventional therapy

Breast Cancer Stem Cell Gene Expression Signature
184a1 HCC1954 SUM149 SUM159 MDAMB453 MDAMB231 BrCaMZ01 SKBR7
184a1 HCC1954 SUM149 SUM159 MDAMB453 MDAMB231 BrCaMZ01 SKBR7
8 Breast cell lines
184a
1 H
CC
1954
SU
M14
9 SU
M15
9 M
DAM
B45
3
MD
AMB
231
BrC
a-M
Z-01
B
rCa-
MZ-
01
SUM
149
SKB
R7
SKB
R7
184a
1 SU
M15
9 H
CC
1954
M
DAM
B45
3 M
DAM
B23
1
413 genes breast cancer stem cell signature
33 genes overexpressed in the ALDEFLUOR-positive populations 380 genes overexpressed in the ALDEFLUOR-negative populations

NOTCH2 NFYA TPRXL RBM15 PCNX
FBXO21 CAMK2B ADRBK1 UGCCL1
CXCR1 CD300LB GIPC3 TAS2R14
RAD51 ARID1B
ZFP41 FAM49B PSORS1C2
Role in stem cell biology
Cell Signaling
Membrane protein
DNA repair/ Chromatin remodeling
Unknown
Genes up-regulated in ALDEFLUOR-positive populations
184a
1 H
CC
1954
SU
M14
9 SU
M15
9 M
DAM
B45
3
MD
AMB
231
BrC
a-M
Z-01
B
rCa-
MZ-
01
SUM
149
SKB
R7
SKB
R7
184a
1 SU
M15
9 H
CC
1954
M
DAM
B45
3 M
DAM
B23
1
MRPL41 PDCD10 PDCD5
ATP5S NDUFA2 ATP5J2 IMMP1L CCNL1 PRPF39 LSM3 SFRS7 PRPF4B
NACA
ALG5 HBLD2 GART DC2 COMMD6 UBL5
Cell Signaling
Apoptosis
Differentiation
Oxidative phosphorylation
RNA splicing
Genes up-regulated in ALDEFLUOR-negative
populations
Breast Cancer Stem Cell Gene Expression Signature
CXCR1
Charafe-Jauffret et al., Cancer Research, 2009
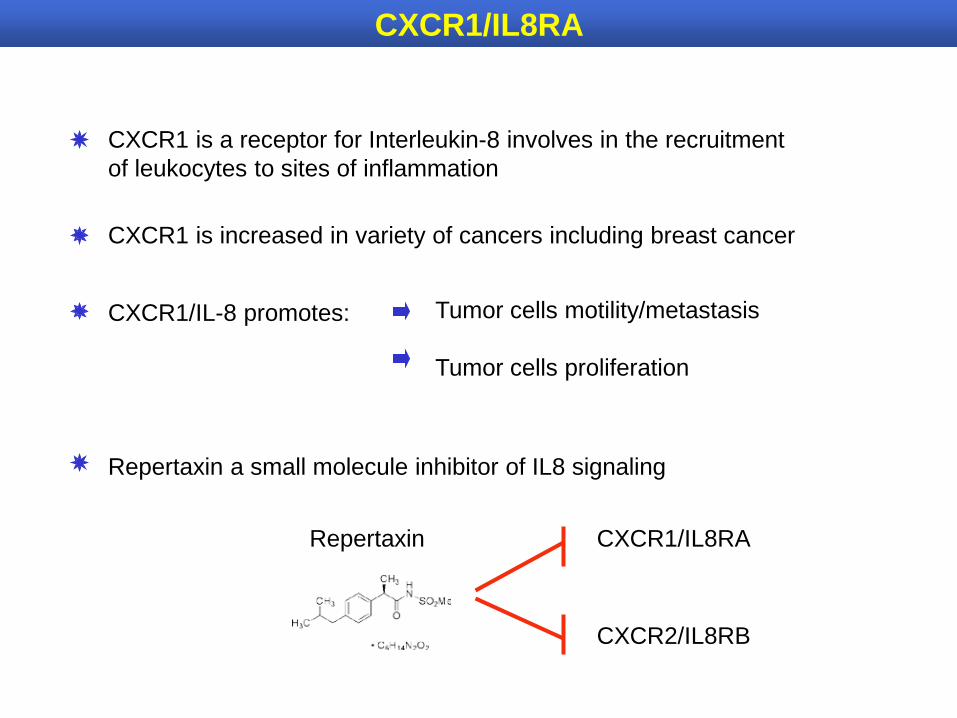
CXCR1/IL8RA
CXCR1 is a receptor for Interleukin-8 involves in the recruitment of leukocytes to sites of inflammation
CXCR1 is increased in variety of cancers including breast cancer
CXCR1/IL-8 promotes: Tumor cells motility/metastasis Tumor cells proliferation
Repertaxin a small molecule inhibitor of IL8 signaling
Repertaxin CXCR1/IL8RA
CXCR2/IL8RB

Ginestier et al. JCI, 2010 Ginestier et al. JCI, 2010
0
1
2
3
4
5
6
7
8
9
-40 -30 -20 -10 0 10 20 30
98 7 6 5 4 3 2 1 0 -40 -30 -20 -10 0 10 20 30
Days after injection
Tum
or s
ize
(mm
)
Control Repertaxin Docetaxel Repertaxin/Docetaxel
0
4
8
12
16
20
Control
Repertaxin
Docetaxel
epertaxin/Docetaxel
20
16
12
8
4
0
ALD
EFLU
OR
-pos
itive
pop
ulat
ion
(%)
0
0.5
1
1.5
10,000 1,000 100Tu
mor
siz
e (m
m)
Control
Repertaxin
Docetaxel
Repertaxin/Docetaxel
10,000 1,000 100
15
10
5
0
Number of cells injected
Xenotransplantation
4mm
Repertaxin
28 days
Tumor size
% Cancer stem cells
Effect of Repertaxin treatment on cancer cells survival

HCC1954 MDA-MB-453 SUM159
IL8 - - - + + + - - - + + +
ALDEFLUOR + + + + + + - - - - - -
IL-8 induces invasion of breast CSC
Charafe-Jauffret et al., Cancer Research, 2009

Effect of CXCR1 blockade on metastasis formation
Repertaxin
Control
0
100
200
300
400
500
1 2 3 4 5
Repertaxin
Control
SUM159 Control Repertaxin
Nor
mal
ized
Pho
ton
Flux
Weeks after injection
0
100
200
300
400
500
1 2 3 4 5 6
HCC1954
Nor
mal
ized
Pho
ton
Flux
Weeks after injection
Control Repertaxin
Ginestier et al. JCI, 2010

Time from birth (weeks)
3 5 7 12
b-oestradiol
Humanization
Human fibroblasts
Passages
«Clearing»
Patient-derived xenograft (PDX)
+ Matrigel Tumoral growth monitoring
Primary Tumor
Dissociation

> 200 Primary tumor injections
> 50 established PDXs
Xenobank
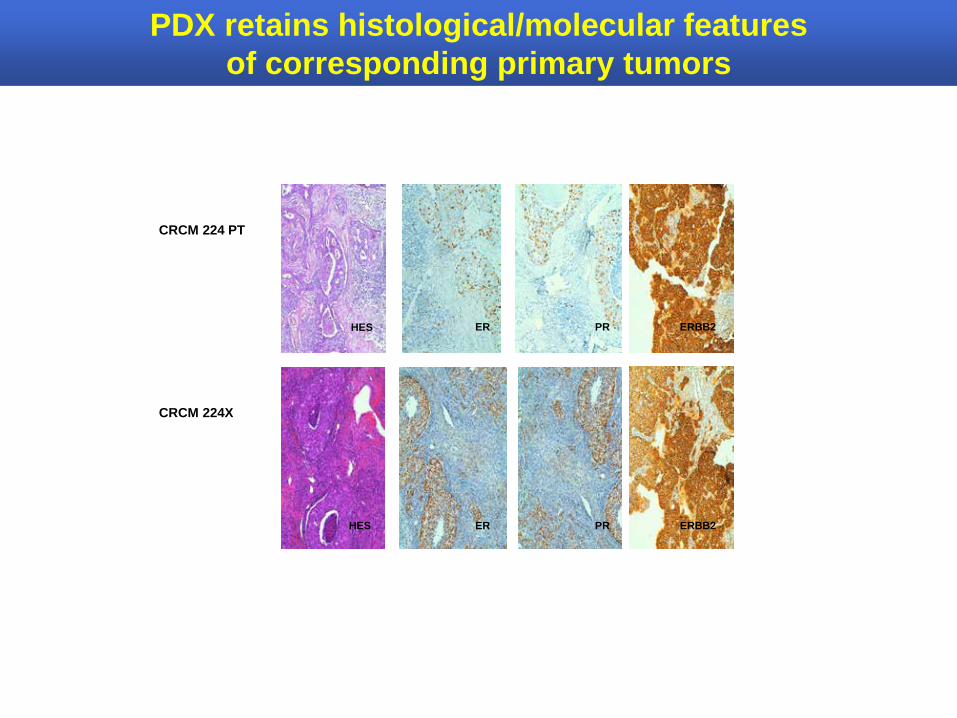
CRCM 224 PT
CRCM 224X
HES
HES
ER
ER PR
PR ERBB2
ERBB2
PDX retains histological/molecular features of corresponding primary tumors

0 10 20 30 40
0.0
0.2
0.4
0.6
0.8
1.0
Months
met
asta
sis-
free
su
rviv
al
LogRank p = 0.00352Grp 1 : 0 N=35, 3-Year survival = 96%, 95%CI = [0.88-1]Grp 2 : 1 N=18, 3-Year survival = 66%, 95%CI = [0.47-0.92]
p=0.00352
PT engrafter
Met
asta
sis-
free
sur
viva
l
PT non-engrafter
Months after surgery
Prop
ortio
n of
tum
or o
utgr
owth
ALDH1+
ALDH1-
p=0.007e-5
0 100 200 300 400
0.0
0.2
0.4
0.6
0.8
1.0
Days
Pris
e (%
)
LogRank p = 1.00e-05 Grp 1 : 0 N=29, 5-Year survival = 100%, 95%CI = [1-1]
0 1
Days after PT implantation
1
0.8
0.6
0.4
0.2
0
ALDH1
ALDH1+
ALDH1-
0 100 200 300 400 0 100 200 300 400
0.0
0.2
0.4
0.6
0.8
1.0
Days
Pris
e (%
)
GRD
123
Prop
ortio
n of
tum
or o
utgr
owth
Days after PT implantation
SBR Grade
I II
III p=0.0005
1
0.8
0.6
0.4
0.2
0
0 100 200 300 400
Variable Hazard ratio (95% CI) p-value
ER 0.78 [0.27-2.31] 0,66
PR 0.67 [0.23-1.92] 0,45
SBR Grade 2.94 [1.02-8.44] 4,60E-02 KI67 1.32 [0.46-3.82] 0,61
ALDH1 3.61 [1.12-11.65] 3,20E-02
Charafe-Jauffret et al., Submitted
25% engrafment rate

GFP +
Lentiviral infection
Mammary fat pad implantation
Xenograft removal
Xenograft removal Mammary fat pad implantation
Xenograft removal
Bioluminescent imaging
PDX model for metastasis study
GFP+ Cell sorting

CV
Fo Ce
Po
Ra Re
Ut
TD
Co Th poumons 11%
rein 0,6%
rate 0,2% uterus
8%
tube digestif
14% ganglion
44%
pancréas 22%
CRCM389X
CRCM318X
foie 11%
uterus 4%
cerveau 2%
tube digestif
11% os 72%
Ce
Fo
Ut Po
Pa
Re
Ra
TD
Co
TD Fo Co
Ra
Re
Ut
Ce
Po
Pa Gg
CRCM341X
Metastatic patterns
Bone
Liver Brain Uterus
Digestive tract
Lymph node
Pancreas Lung
Uterus
Digestive tract
poumons 100% Lung

0
25
50
75
100
Bone
Genita
l trac
t
GI trac
tLiv
erLu
ngBrai
nKidn
ey
Spleen
Heart
Lymph
Nod
e
Pancre
as
Adrena
l Glan
d
0
25
50
75
100
Bone
Genita
l trac
t
GI trac
tLiv
erLu
ngBr
ain
Kidn
ey
Splee
nHea
rt
Lymph
Nod
e
Panc
reas
Adrena
l Glan
d
0
25
50
75
100
Bone
Genita
l trac
t
GI tract
Liver
Lung
Brain
Kidney
Spleen
Heart
Lymph N
ode
Pancre
as
Adrena
l Glan
d
0
25
50
75
100
Bone
Genital tr
act
GI tract
Liver
Lung
BrainKidn
ey
SpleenHea
rt
Lymph
Node
Pancreas
Adrenal G
land
0
25
50
75
100
Bone
Genita
l trac
t
GI tract
Liver
Lung
Brain
Kidney
Spleen
Heart
Lymph
Nod
e
Pancre
as
Adrena
l Glan
d
0
25
50
75
100
Bone
Genita
l trac
t
GI trac
tLiv
erLu
ngBr
ain
Kidn
ey
Splee
nHea
rt
Lymph
Nod
e
Panc
reas
Adre
nal G
land
* * * * *
* * *
* *
*
*
*
**
T412 (5 mice) Lung Mets-enriched
T434 (5 mice, 2 to come) Lung Mets-reduced
T389 (6 mice) Lung Mets-enriched Brain Mets-reduced
T318 (3 mice, 1 to come) Lymph node Mets-enriched
T341 (7 mice) Liver Mets-enriched Brain Mets-enriched
T226 (3 mice, 2 to come) Liver Mets-enriched Lung Mets-enriched

Max WICHA Gabriela DONTU Suling LIU Hasan KORKAYA Marc DIEBEL
Daniel BIRNBAUM Emmanuelle CHARAFE-JAUFFRET Marion SALVADOR Simon LAUNAY Rita EL HELOU Julien WICINSKI Olivier CABAUD Emmanuelle JOSSELIN
University of Michigan
J-F Saunière
François BERTUCCI Nathalie CERVERA Pascal FINETTI
Mofitt Cancer center
Said Sebti
IRIS
Stephane Depil Helene Lelièvre Laurence Kraus-Berthier