metabolomic analysis reveals metabolic disturbance … · metabolomic analysis reveals metabolic...
TRANSCRIPT
Metabolomic Analysis Reveals Metabolic Disturbance inthe Cortex and Hippocampus of Subchronic MK-801Treated RatsLiya Sun1,2, Juan Li3,5, Kejun Zhou1,2, Ming Zhang1,2, Jinglei Yang1,2, Yang Li1,2, Baohu Ji1,2,
Zhao Zhang1,2, Hui Zhu1,2, Lun Yang1,2, Guang He1,2, Linghan Gao1,2, Zhiyun Wei1,2, Kejian Wang1,2,
Xue Han4, Weiqing Liu4, Liwen Tan4, Yihua Yu3*, Lin He1,2*, Chunling Wan1,2*
1 Bio-X Institutes, Key Laboratory for the Genetics of Developmental and Neuropsychiatric Disorders, Ministry of Education, Shanghai Jiao Tong University, Shanghai,
People’s Republic of China, 2 Institutes for Nutritional Sciences, Shanghai Institute of Biological Sciences, Chinese Academy of Sciences, Shanghai, People’s Republic of
China, 3 East China Normal University, Department of Physics, Shanghai, People’s Republic of China, 4 Second Xiangya Hospital, Central South University, Institute of
Mental Health, Changsha, People’s Republic of China, 5CSIRO Animal, Food and Health Sciences, Queensland Bioscience Precinct, St. Lucia, Brisbane, Queensland,
Australia
Abstract
Background: Although a number of proteins and genes relevant to schizophrenia have been identified in recent years, feware known about the exact metabolic pathway involved in this disease. Our previous proteomic study has revealed theenergy metabolism abnormality in subchronic MK-801 treated rat, a well-established animal model for schizophrenia. Thisprompted us to further investigate metabolite levels in the same rat model to better delineate the metabolism dysfunctionsand provide insights into the pathology of schizophrenia.
Methods: Metabolomics, a high-throughput investigatory strategy developed in recent years, can offer comprehensivemetabolite-level insights that complement protein and genetic findings. In this study, we employed a nondestructivemetabolomic approach (1H-MAS-NMR) to investigate the metabolic traits in cortex and hippocampus of MK-801 treatedrats. Multivariate statistics and ingenuity pathways analyses (IPA) were applied in data processing. The result was furtherintegrated with our previous proteomic findings by IPA analysis to obtain a systematic view on our observations.
Results: Clear distinctions between the MK-801 treated group and the control group in both cortex and hippocampus werefound by OPLS-DA models (with R2X = 0.441, Q2Y = 0.413 and R2X = 0.698, Q2Y = 0.677, respectively). The change of a seriesof metabolites accounted for the separation, such as glutamate, glutamine, citrate and succinate. Most of these metabolitesfell in a pathway characterized by down-regulated glutamate synthesis and disturbed Krebs cycle. IPA analysis furtherconfirmed the involvement of energy metabolism abnormality induced by MK-801 treatment.
Conclusions: Our metabolomics findings reveal systematic changes in pathways of glutamate metabolism and Krebs cyclein the MK-801 treated rats’ cortex and hippocampus, which confirmed and improved our previous proteomic observationand served as a valuable reference to the etiology research of schizophrenia.
Citation: Sun L, Li J, Zhou K, Zhang M, Yang J, et al. (2013) Metabolomic Analysis Reveals Metabolic Disturbance in the Cortex and Hippocampus of SubchronicMK-801 Treated Rats. PLoS ONE 8(4): e60598. doi:10.1371/journal.pone.0060598
Editor: Madepalli K. Lakshmana, Torrey Pines Institute for Molecular Studies, United States of America
Received November 15, 2012; Accepted February 28, 2013; Published April 5, 2013
Copyright: � 2013 sun et al. This is an open-access article distributed under the terms of the Creative Commons Attribution License, which permits unrestricteduse, distribution, and reproduction in any medium, provided the original author and source are credited.
Funding: This work was supported by the 973 Program (2012CB910100, 2010CB529600) (http://www.973.gov.cn/), the National Nature Science Foundation ofChina (31071159, 81271486, 81121001) (http://www.nsfc.gov.cn/), the National Key Technology R&D Program (2006BAI05A09), the 863 Program (2009AA022701)(http://www.863.gov.cn/), and the Shanghai Municipal Commission of Science and Technology Program (09DJ1400601) (http://www.shanghai.gov.cn/). Thefunders had no role in study design, data collection and analysis, decision to publish, or preparation of the manuscript.
Competing Interests: The authors have declared that no competing interests exist.
* E-mail: [email protected] (YY); [email protected] (LH); [email protected] (CW)
Introduction
Schizophrenia is a severe and complicated mental disorder that
seriously impairs human independence and imposes a significant
burden on society [1]. Both hereditary and environmental factors
contribute to this disease. Much has been done in the past decades
to unravel the pathogenesis of schizophrenia, leading to various
hypotheses [2,3]. The glutamate hypothesis focusing on N-methyl-
D-aspartate (NMDA) glutamate receptor hypofunction has shown
a number of promising leads [4]. NMDA receptor mediates
glutamate-related cell signaling among neural cells. When the
receptor is activated, transcription factors such as CREB (cAMP
response element-binding) is mobilized to modulate long-term
potentiation, long-term memory, synaptic plasticity and cell
survival status. Based on this hypothesis, animal models treated
by noncompetitive NMDA receptor antagonists, such as dizocil-
pine (MK-801) and phencyclidine, are widely used in schizophre-
nia research [5]. It has been shown that MK-801 treated rats
demonstrate both positive and negative symptoms of schizophre-
nia [6].
PLOS ONE | www.plosone.org 1 April 2013 | Volume 8 | Issue 4 | e60598
Our previous proteomic study scrutinized cortical synaptosome
proteins in subchronic MK-801 treated rats and revealed
dysfunctions in energy metabolism in these rats [7]. Although
alterations in brain energy metabolism have been found in human
proteomic studies for schizophrenia [8], the exact metabolism
pathways involved in the dysfunction have not been identified yet.
This prompted us to further investigate metabolite levels in the
same rat model to delineate the involved pathways which would
provide insights to the pathology of schizophrenia. In the past,
several studies concerning with certain metabolites have been
conducted with the brain tissue extract of the MK-801 treated rats,
finding that neurotransmitter metabolism in glial–neuronal
interactions was impaired [9–12]. Metabolomics, as a modern
systems biology approach, is different from the studies focusing on
individual metabolites. It monitors entire pattern of low molecular
weight compounds and models the global metabolic status of the
samples. In the present study, we used proton magic angle
spinning nuclear magnetic resonance (1H MAS NMR) spectros-
copy to scan the overall metabolite signals in cortex and
hippocampus of MK-801 treated rats. 1H MAS NMR spectros-
copy has the advantage of a nondestructive procedure that can
detect metabolites directly in the intact tissues. Cortex and
hippocampus are two brain tissues that are rich of NMDA
receptors and thus are responsive to MK-801, which helps us to
identify the typical metabolism dysfunctions induced by MK-801.
Multivariate statistics and ingenuity pathways analyses (IPA) were
employed in data processing. The result was further combined
with our previous proteomic data in IPA for a more systematic
view on metabolomic observations.
Materials and Methods
Animal Model and Ethics StatementAll animal handling and procedures were performed in
accordance with the Guide for the Care and Use of Laboratory
Animals once the study received approval by the Institutional
Animal Care and Use Committee at Shanghai Jiao Tong
University Bio-X institutes, Shanghai, China. All surgery was
performed aseptically and every attempt was made to minimize
pain and discomfort.
23 male Sprague-Dawley rats (220–250 g) were randomly
divided in two groups. Rats in the control group (n= 11) were
injected subcutaneously with physiological saline 3.5 ml/kg (0.9%
wt/vol NaCl [aqueous]) and those in the treatment group (n= 12)
with 0.7 mg/kg MK-801 (Research Biochemicals, Natick, Massa-
chusetts) (saline as vehicle) for 10 days. We chose the dose of
0.7 mg/kg as it produced the proper animal model [9] and it was
the same dose as our previous work [7]. The volumes of MK-801
or saline were adjusted according to the body weight of each
individual animal. The rats were kept in a 12:12-hour light/dark
cycle with food and water available ad libitum. On day 11,
approximately 24 hours after the final injection, the rats were
killed by cervical dislocation (http://www.ccac.ca/en_/standards/
guidelines). The brains were quickly removed and the frontal and
parietal lobe of cortex and hippocampus were excised from the
brain and immediately snap-frozen in liquid nitrogen and stored at
280uC pending analysis. These operations were typically
processed within 5–10 min to limit post-mortem changes in the
metabolite content of the samples.
1H MAS NMR Spectroscopic AnalysisEach frozen 15–20 mg intact sample was rinsed with D2O
solution (1 mg/ml) and then rapidly inserted into a zirconia 4 mm
outer diameter rotor (Bruker Analytische GmbH, Rheinstetten,
Germany). D2O provided a field-frequency lock. 1H MAS NMR
data were recorded on a Bruker AVANCE spectrometer with
a field strength of 500.13 MHz. Samples were spun at 5 KHz and
maintained at 298 K throughout the experiment to minimize
temperature-dependent metabolic changes [13]. In order to
suppress broad signals from macromolecules, such as proteins,
and hence to focus the subsequent analysis on the relatively small
molecules, Carr–Purcell–Meiboom–Gill (CPMG) spin-echo pulse
sequence [D–90u–(t–180u–t)n–FID, where FID is free induction
decay] with a fixed spin–spin relaxation delay, 2 nt of 64 ms
(n= 128, t=400 ms), was applied to acquire 1H MAS NMR
spectra of all samples. Typically, 256 transients were collected into
64 K data points with a spectral width of 30 ppm and an
acquisition time of 2.18 s per scan. Prior to Fourier trans-
formation, the FIDs were multiplied by an exponential weighting
function corresponding to a line broadening factor of 1 Hz.
Manual phase and baseline correction was performed using
TOPSPIN software (Bruker Biospin GmbH, version 2.1). The
spectra were referenced to lactate (CH3 d=1.325). Metabolites
were identified with reference to the literatures [14–17] and the
standard spectra database in HMDB (http://www.hmdb.ca).
Data Reduction and Statistical AnalysesA bucket size of 0.01 ppm was chosen to reduce the spectra data
using AMIX software (Bruker Biospin GmbH, version 3.8.6). The
regions 0–0.6 ppm (no signal peaks), 1.1–1.23 ppm (ethanol),
3.62–3.7 ppm (ethanol), 4.54–5.0 ppm (water) and 8.3–20 ppm
(no signal peaks), were excluded. The reduced spectral data were
then normalized to a constant sum for each spectrum.
The univariate Student’s t-test was applied to each bin to
evaluate its variation between groups. To account for multiple
comparisons, the p-value from each t-test was mapped to a Storey-
Tibshirani’s q-value using the ‘‘qvalue’’ package in R platform
(http://www.r-project.org) to estimate the false discovery rate of
the test when it’s called significant. The bins with q-values lower
than 0.2 were regarded as significantly changed bins [18]. For
multivariate statistical analysis, bucket tables were imported to
SIMCA-P software (version 11.5; Umetrics, Umea, Sweden). In
the software, the univariance scaling method was employed to
avoid over-weighting of peaks from metabolites of high concen-
trations. Orthogonal Partial Least Squares-Discriminant Analysis
(OPLS-DA) was conducted to separate MK-801 group from the
control group, optimizing the discovery of treatment-related
metabolites. For each PLS model, the explained variation (R2)
and goodness of prediction (Q2) were given by the software for
model evaluation. A cross validation was additionally conducted to
test the predictability of the models. Firstly, a test set was
constructed using three observations from each class. The left
observations constituted the training set. A model was built with
the training set and was used to predict the test set’s class
membership with a cutoff of 1.5 (1 for the treated & 2 for the
control). This was repeated for four times and the average
percentage of correct classification was calculated.
To better interpret the results from OPLS-DA, back-scaled
coefficient plots were drawn using R software (http://www.r-
project.org/): firstly, the coefficients of the first OPLS component
were back-transformed by multiplying all values by the respective
variable standard deviation; secondly, the back-transformed
coefficients were plotted and colored according to respective
VIP (Variable Importance for the Projection) values generated by
SIMCA-P software for the model. The scale range of the colors
was set using the maximum and the minimum of the VIP values.
Variables (bins) that with a Student’s t-test q-value lower than
0.2 or an OPLS-DA VIP value higher than 1.5 were selected as
Metabolomic Analysis of MK-801 Treated Rats
PLOS ONE | www.plosone.org 2 April 2013 | Volume 8 | Issue 4 | e60598
the MK-801 treatment related bins. Those bins were assigned with
corresponding metabolites. An average fold change of the bins
from the same metabolite was calculated as the ratio of the average
bin value in treated group to that in control group, indicating an
overall change direction of the treatment related metabolite. This
result was then imported in Ingenuity Pathways Analysis (IPA)
software for molecular pathway and network analysis.
Molecular Pathway and Network Analysis in IPAIngenuity Pathways Analysis (IPA; http://www.ingenuity.com)
is a web-based software application that identifies biological
pathways and functions relevant to bio-molecules of interest. To
scrutinize the systematic influence of the treatment related
metabolites, we uploaded the metabolite lists (with KEGG IDs)
and the change directions of these metabolites onto an IPA server.
Canonical pathways and molecular interaction networks were
generated based on the knowledge sorted in the Ingenuity
Pathway Knowledge Base. A ratio of the number of metabolites
that map to the canonical pathway divided by the total number of
molecules that map to the pathway was displayed. Fisher’s exact
test was used to calculate a p-value determining the probability
that the association between the metabolites and the canonical
pathway was explained by chance alone. The network score was
based on the hypergeiometric distribution and was calculated with
the right-tailed Fisher’s Exact Test. The higher a score was, the
more relevant the eligible submitted molecules were to the
network. Integrated analysis of results from the present study
and our previous proteomic study was also conducted in IPA by
uploading a combined list of the treatment related metabolites and
proteins onto the IPA server.
Results
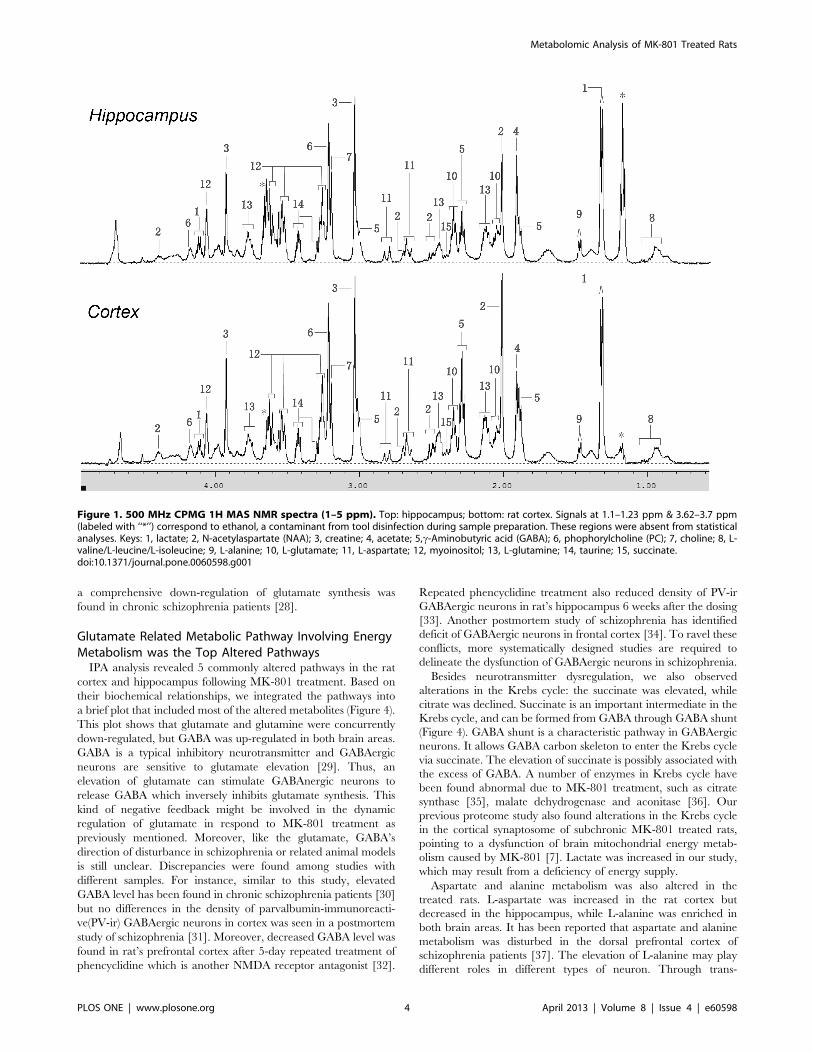
The 1H MAS NMR spectra from cortex were similar to that
from hippocampus (Figure 1). After data reduction, 325 bins
(variables) were obtained from the spectra. Bins from the MK-801
treated group and the control group were compared by Student’s
t-test. 48 bins had p-values lower than 0.05 in the cortex, of which
44 had q-values lower than 0.2. 34 bins had p-values lower than
0.05 in the hippocampus, of which 11 had q-values lower than 0.2
(Table S1 & S2). Compared with bins in the hippocampus, more
bins in the cortex showed statistically significant changes.
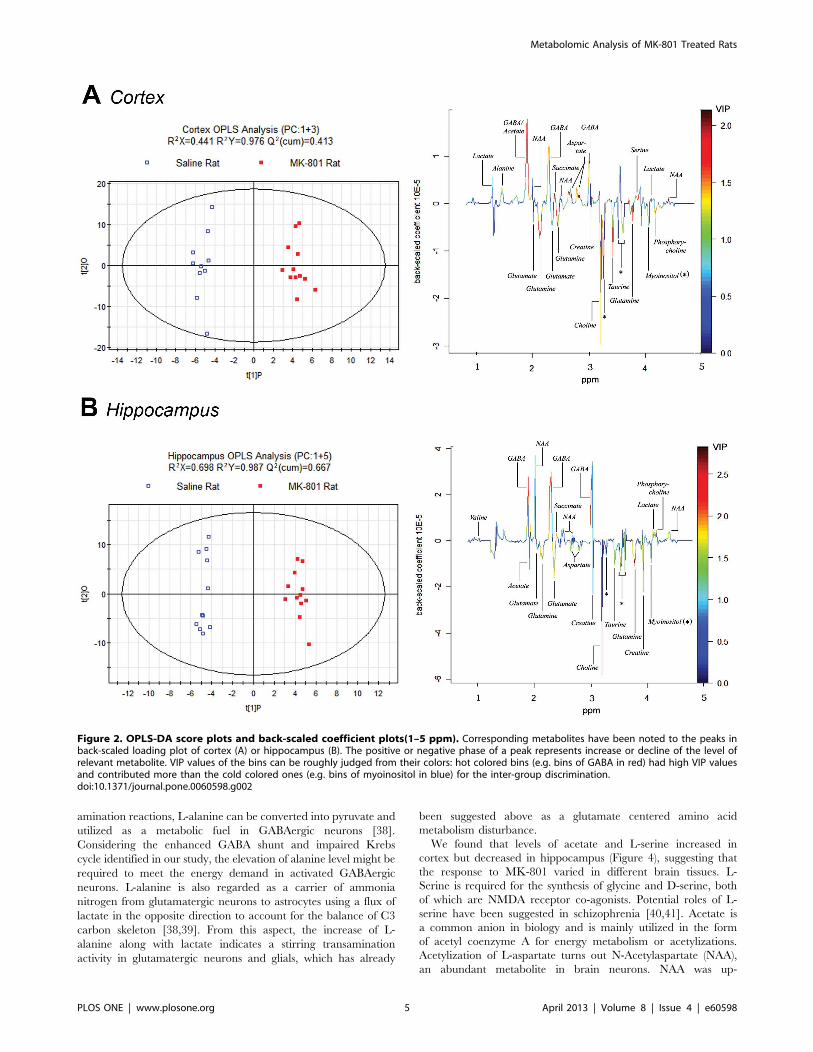
Multivariate OPLS-DA analysis was implemented to directly
search for treatment related metabolites and the results were
displayed in the forms of score plots and back-scaled loadings plots
(Figure 2). The score plots showed a clear separation between the
MK-801 treated group and the control group in both cortex and
hippocampus (with R2X=0.441, Q2Y= 0.413 and R2X=0.698,
Q2Y= 0.677, respectively). Further validation showed that cortex
models could predict class membership well with an accuracy of
83.3% and hippocampus models with an accuracy of 82.6%. In
the cortex of the MK-801 treated rats, the back-scaled loading plot
shows increased levels of lactate, acetate, L-alanine, L-aspartate,
GABA, NAA, scyllitol, L-serine and succinate, and decreased
levels of citrate, glutamine, glutamate, myoinositol, choline,
phosphorylcholine, creatine and taurine. Similar result was seen
in the hippocampus but with some differences, such as acetate and
L-aspartate levels which were elevated in the cortex but decreased
in the hippocampus. The VIP values of the bins can be roughly
judged from the colors indicated in the back-scaled loading plots.
Warm colored bins (e.g. bins of GABA in red) with high VIP value
contributed more than the cold colored ones (e.g. bins of
myoinositol in blue) in the inter-group discrimination.
We listed all the treatment related variables (bins) with either
VIP value .1.5 or q-value ,0.2 (Table S1 & S2). Those variables
(bins) with higher VIP values in OPLS analysis tended to have
lower p-values and q-values in the Student’s t-tests. Most of the
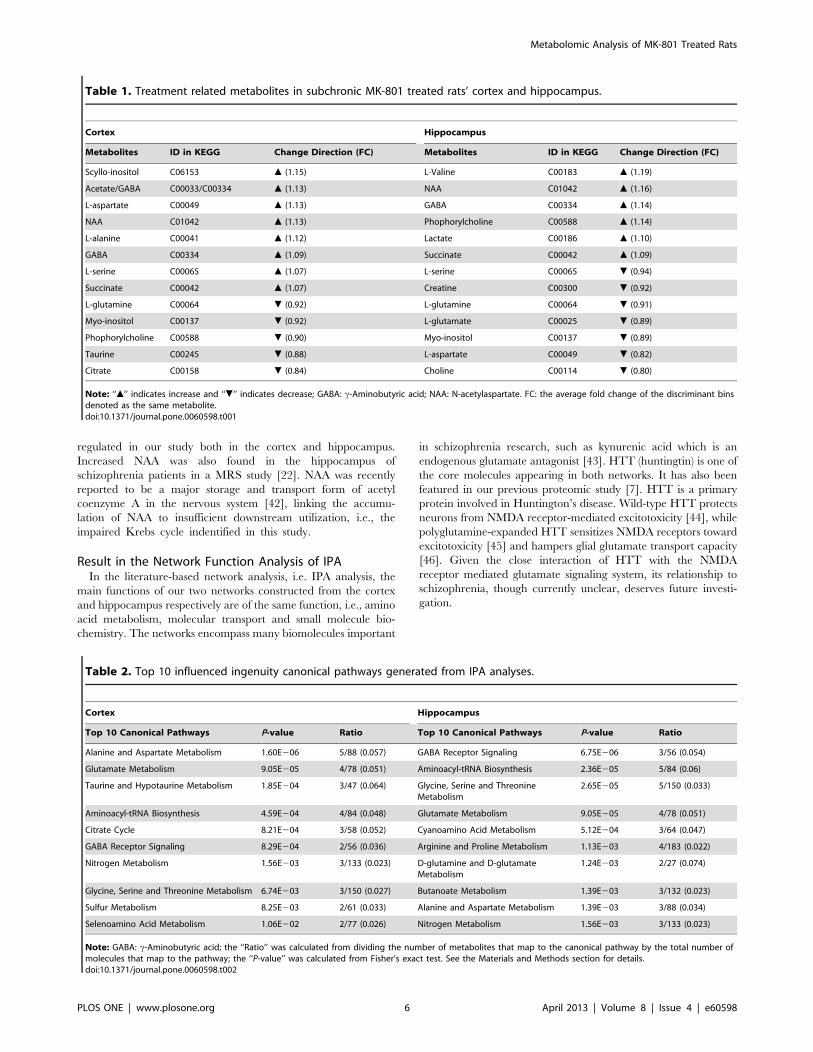
bins could be assigned to corresponding metabolites. Table 1 is an
extract of Table S1 & S2 that lists all these treatment related
metabolites found in cortex and hippocampus of MK-801 treated
rats. The change direction of a metabolite was indicated along
with an average fold change value of the bins of the same
metabolite. Among these metabolites, GABA, succinate and NAA
were up-regulated in both the cortex and hippocampus; levels of
myoinositol and glutamine were consistently decreased in the two
brain tissues; concentrations of L-aspartate, phosphocholine (PC)
and L-serine changed differently in the cortex and hippocampus,
suggesting a variation in response to MK-801 in different brain
areas.
IPA analysis was applied with treatment related metabolites to
explore systematic influences of subchronic MK-801 treatment.
The top ten altered pathways were generated and are listed in
Table 2. The common pathways shared by the two brain regions
were alanine and aspartate metabolism, glutamate metabolism,
GABA receptor signaling, nitrogen metabolism and glycine, serine
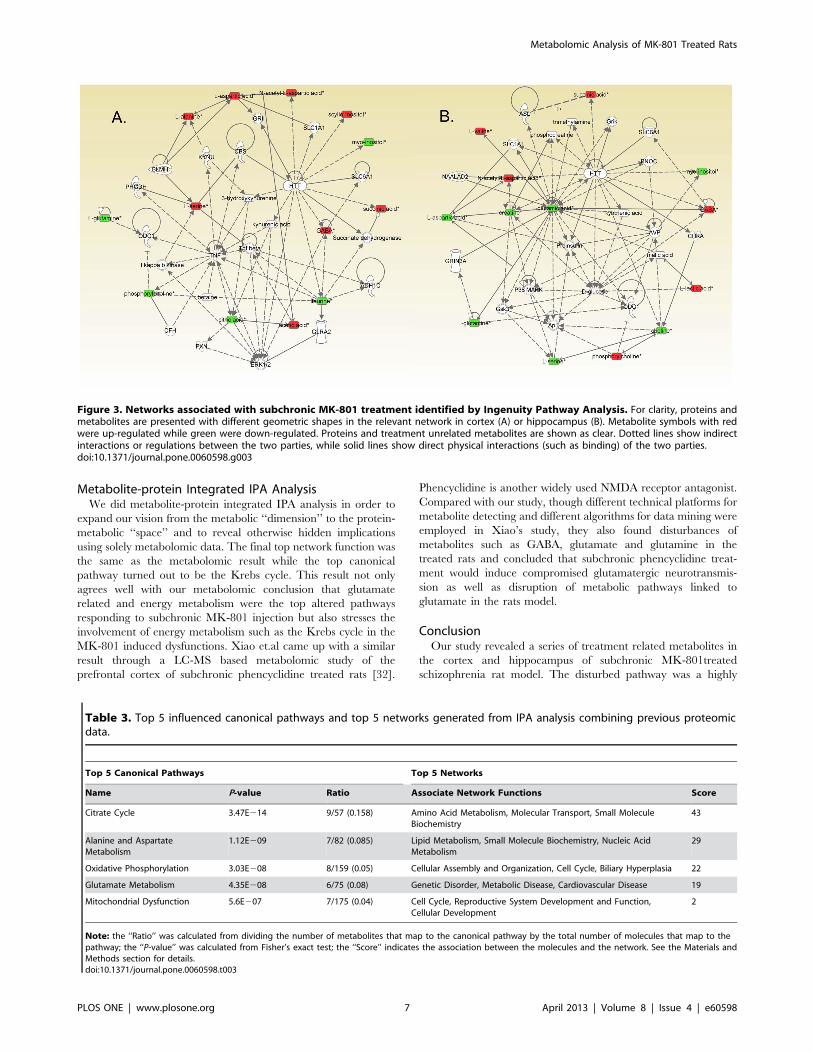
and threonine metabolism. In the network function analysis,
treatment related metabolites in cortex and hippocampus tended
to gather into one single network, respectively (Figure 3). The two
networks were similar and shared the same functions, i.e., amino
acid metabolism, molecular transport and small molecule bio-
chemistry.
Our previous proteome study revealed 49 proteins altered in the
cortical synaptosomes of subchronic MK-801 treated rats (Table
S3). We combined those differentially expressed proteins with
treatment related metabolites in the cortex of this study and
carried out an additional IPA analysis [7]. The top network
function was still the amino acid metabolism, molecular transport
and small molecule biochemistry, while the top canonical pathway
switched to the Krebs cycle (Table 3).
Discussion
In this study, we employed modern metabolomic method on the
platform of 1H MAS NMR to scrutinize metabolite traits in cortex
and hippocampus of subchronic MK-801 treated rats, a NMDA
receptor hypofunction animal model for schizophrenia. We found
that metabolites, not only neurotransmitters but also those
involved in energy metabolism, were altered in this schizophrenia
animal model.
NMDA Receptor Hypofunction Causes Disturbance toGlutamate HomeostasisGlutamate was reduced in the hippocampus and had a trend of
decrease in the cortex in our study (Table 1 & Figure 2). The
change of glutamate in the brain of schizophrenia patients has
been the subject of discussion since 1980 but no consensus has so
far been achieved [19–24]. Animal models offer valuable evidence
in this field. Acute injection of MK-801 in rats has been shown to
cause an elevation of glutamate in certain brain regions [25,26].
However, in line with our result, a mouse model subject to 7-day
subchronic MK-801 injection showed decreased extracellular
glutamate level in the prefrontal cortex [27]. Similar results were
obtained in most of brain subareas of MK-801 treated Sprague-
Dawley rat model [10]. This implies a potential dynamic
regulation of glutamate level in response to the length of MK-
801 treatment, which is suggestive for human studies since
Metabolomic Analysis of MK-801 Treated Rats
PLOS ONE | www.plosone.org 3 April 2013 | Volume 8 | Issue 4 | e60598
a comprehensive down-regulation of glutamate synthesis was
found in chronic schizophrenia patients [28].
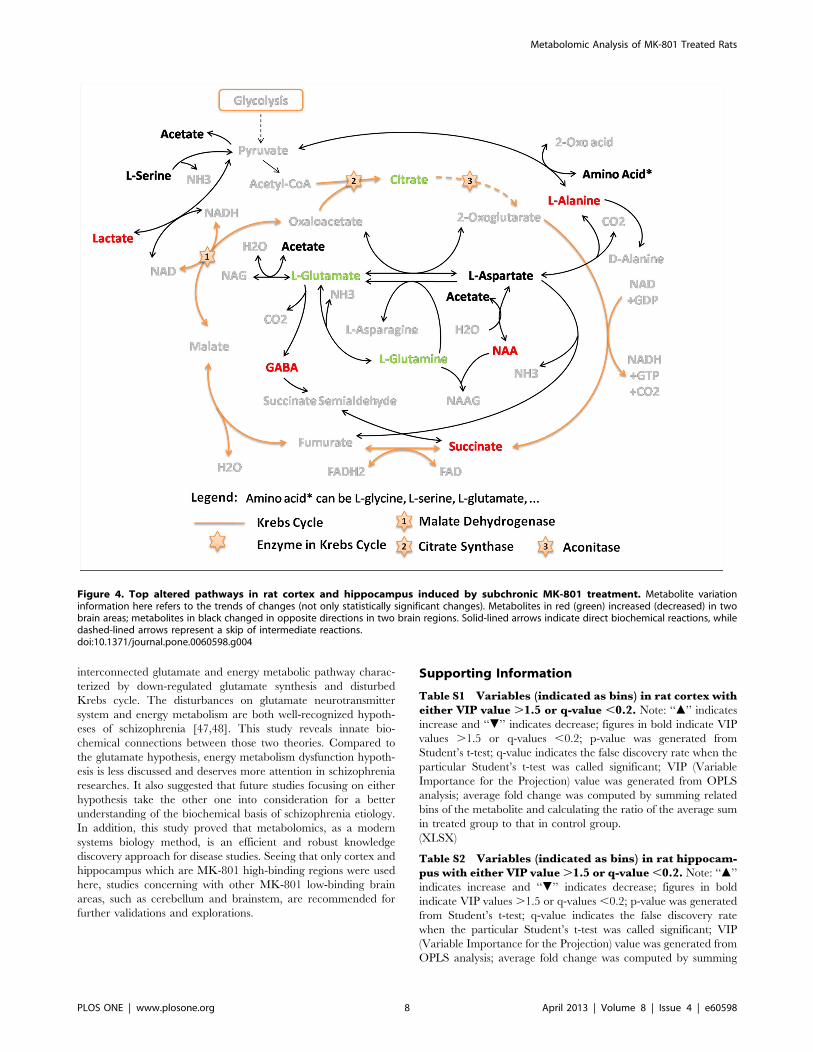
Glutamate Related Metabolic Pathway Involving EnergyMetabolism was the Top Altered PathwaysIPA analysis revealed 5 commonly altered pathways in the rat
cortex and hippocampus following MK-801 treatment. Based on
their biochemical relationships, we integrated the pathways into
a brief plot that included most of the altered metabolites (Figure 4).
This plot shows that glutamate and glutamine were concurrently
down-regulated, but GABA was up-regulated in both brain areas.
GABA is a typical inhibitory neurotransmitter and GABAergic
neurons are sensitive to glutamate elevation [29]. Thus, an
elevation of glutamate can stimulate GABAnergic neurons to
release GABA which inversely inhibits glutamate synthesis. This
kind of negative feedback might be involved in the dynamic
regulation of glutamate in respond to MK-801 treatment as
previously mentioned. Moreover, like the glutamate, GABA’s
direction of disturbance in schizophrenia or related animal models
is still unclear. Discrepancies were found among studies with
different samples. For instance, similar to this study, elevated
GABA level has been found in chronic schizophrenia patients [30]
but no differences in the density of parvalbumin-immunoreacti-
ve(PV-ir) GABAergic neurons in cortex was seen in a postmortem
study of schizophrenia [31]. Moreover, decreased GABA level was
found in rat’s prefrontal cortex after 5-day repeated treatment of
phencyclidine which is another NMDA receptor antagonist [32].
Repeated phencyclidine treatment also reduced density of PV-ir
GABAergic neurons in rat’s hippocampus 6 weeks after the dosing
[33]. Another postmortem study of schizophrenia has identified
deficit of GABAergic neurons in frontal cortex [34]. To ravel these
conflicts, more systematically designed studies are required to
delineate the dysfunction of GABAergic neurons in schizophrenia.
Besides neurotransmitter dysregulation, we also observed
alterations in the Krebs cycle: the succinate was elevated, while
citrate was declined. Succinate is an important intermediate in the
Krebs cycle, and can be formed from GABA through GABA shunt
(Figure 4). GABA shunt is a characteristic pathway in GABAergic
neurons. It allows GABA carbon skeleton to enter the Krebs cycle
via succinate. The elevation of succinate is possibly associated with
the excess of GABA. A number of enzymes in Krebs cycle have
been found abnormal due to MK-801 treatment, such as citrate
synthase [35], malate dehydrogenase and aconitase [36]. Our
previous proteome study also found alterations in the Krebs cycle
in the cortical synaptosome of subchronic MK-801 treated rats,
pointing to a dysfunction of brain mitochondrial energy metab-
olism caused by MK-801 [7]. Lactate was increased in our study,
which may result from a deficiency of energy supply.
Aspartate and alanine metabolism was also altered in the
treated rats. L-aspartate was increased in the rat cortex but
decreased in the hippocampus, while L-alanine was enriched in
both brain areas. It has been reported that aspartate and alanine
metabolism was disturbed in the dorsal prefrontal cortex of
schizophrenia patients [37]. The elevation of L-alanine may play
different roles in different types of neuron. Through trans-
Figure 1. 500 MHz CPMG 1H MAS NMR spectra (1–5 ppm). Top: hippocampus; bottom: rat cortex. Signals at 1.1–1.23 ppm & 3.62–3.7 ppm(labeled with ‘‘*’’) correspond to ethanol, a contaminant from tool disinfection during sample preparation. These regions were absent from statisticalanalyses. Keys: 1, lactate; 2, N-acetylaspartate (NAA); 3, creatine; 4, acetate; 5,c-Aminobutyric acid (GABA); 6, phophorylcholine (PC); 7, choline; 8, L-valine/L-leucine/L-isoleucine; 9, L-alanine; 10, L-glutamate; 11, L-aspartate; 12, myoinositol; 13, L-glutamine; 14, taurine; 15, succinate.doi:10.1371/journal.pone.0060598.g001
Metabolomic Analysis of MK-801 Treated Rats
PLOS ONE | www.plosone.org 4 April 2013 | Volume 8 | Issue 4 | e60598
amination reactions, L-alanine can be converted into pyruvate and
utilized as a metabolic fuel in GABAergic neurons [38].
Considering the enhanced GABA shunt and impaired Krebs
cycle identified in our study, the elevation of alanine level might be
required to meet the energy demand in activated GABAergic
neurons. L-alanine is also regarded as a carrier of ammonia
nitrogen from glutamatergic neurons to astrocytes using a flux of
lactate in the opposite direction to account for the balance of C3
carbon skeleton [38,39]. From this aspect, the increase of L-
alanine along with lactate indicates a stirring transamination
activity in glutamatergic neurons and glials, which has already
been suggested above as a glutamate centered amino acid
metabolism disturbance.
We found that levels of acetate and L-serine increased in
cortex but decreased in hippocampus (Figure 4), suggesting that
the response to MK-801 varied in different brain tissues. L-
Serine is required for the synthesis of glycine and D-serine, both
of which are NMDA receptor co-agonists. Potential roles of L-
serine have been suggested in schizophrenia [40,41]. Acetate is
a common anion in biology and is mainly utilized in the form
of acetyl coenzyme A for energy metabolism or acetylizations.
Acetylization of L-aspartate turns out N-Acetylaspartate (NAA),
an abundant metabolite in brain neurons. NAA was up-
Figure 2. OPLS-DA score plots and back-scaled coefficient plots(1–5 ppm). Corresponding metabolites have been noted to the peaks inback-scaled loading plot of cortex (A) or hippocampus (B). The positive or negative phase of a peak represents increase or decline of the level ofrelevant metabolite. VIP values of the bins can be roughly judged from their colors: hot colored bins (e.g. bins of GABA in red) had high VIP valuesand contributed more than the cold colored ones (e.g. bins of myoinositol in blue) for the inter-group discrimination.doi:10.1371/journal.pone.0060598.g002
Metabolomic Analysis of MK-801 Treated Rats
PLOS ONE | www.plosone.org 5 April 2013 | Volume 8 | Issue 4 | e60598
regulated in our study both in the cortex and hippocampus.
Increased NAA was also found in the hippocampus of
schizophrenia patients in a MRS study [22]. NAA was recently
reported to be a major storage and transport form of acetyl
coenzyme A in the nervous system [42], linking the accumu-
lation of NAA to insufficient downstream utilization, i.e., the
impaired Krebs cycle indentified in this study.
Result in the Network Function Analysis of IPAIn the literature-based network analysis, i.e. IPA analysis, the
main functions of our two networks constructed from the cortex
and hippocampus respectively are of the same function, i.e., amino
acid metabolism, molecular transport and small molecule bio-
chemistry. The networks encompass many biomolecules important
in schizophrenia research, such as kynurenic acid which is an
endogenous glutamate antagonist [43]. HTT (huntingtin) is one of
the core molecules appearing in both networks. It has also been
featured in our previous proteomic study [7]. HTT is a primary
protein involved in Huntington’s disease. Wild-type HTT protects
neurons from NMDA receptor-mediated excitotoxicity [44], while
polyglutamine-expanded HTT sensitizes NMDA receptors toward
excitotoxicity [45] and hampers glial glutamate transport capacity
[46]. Given the close interaction of HTT with the NMDA
receptor mediated glutamate signaling system, its relationship to
schizophrenia, though currently unclear, deserves future investi-
gation.
Table 1. Treatment related metabolites in subchronic MK-801 treated rats’ cortex and hippocampus.
Cortex Hippocampus
Metabolites ID in KEGG Change Direction (FC) Metabolites ID in KEGG Change Direction (FC)
Scyllo-inositol C06153 m (1.15) L-Valine C00183 m (1.19)
Acetate/GABA C00033/C00334 m (1.13) NAA C01042 m (1.16)
L-aspartate C00049 m (1.13) GABA C00334 m (1.14)
NAA C01042 m (1.13) Phophorylcholine C00588 m (1.14)
L-alanine C00041 m (1.12) Lactate C00186 m (1.10)
GABA C00334 m (1.09) Succinate C00042 m (1.09)
L-serine C00065 m (1.07) L-serine C00065 . (0.94)
Succinate C00042 m (1.07) Creatine C00300 . (0.92)
L-glutamine C00064 . (0.92) L-glutamine C00064 . (0.91)
Myo-inositol C00137 . (0.92) L-glutamate C00025 . (0.89)
Phophorylcholine C00588 . (0.90) Myo-inositol C00137 . (0.89)
Taurine C00245 . (0.88) L-aspartate C00049 . (0.82)
Citrate C00158 . (0.84) Choline C00114 . (0.80)
Note: ‘‘m’’ indicates increase and ‘‘.’’ indicates decrease; GABA: c-Aminobutyric acid; NAA: N-acetylaspartate. FC: the average fold change of the discriminant binsdenoted as the same metabolite.doi:10.1371/journal.pone.0060598.t001
Table 2. Top 10 influenced ingenuity canonical pathways generated from IPA analyses.
Cortex Hippocampus
Top 10 Canonical Pathways P-value Ratio Top 10 Canonical Pathways P-value Ratio
Alanine and Aspartate Metabolism 1.60E206 5/88 (0.057) GABA Receptor Signaling 6.75E206 3/56 (0.054)
Glutamate Metabolism 9.05E205 4/78 (0.051) Aminoacyl-tRNA Biosynthesis 2.36E205 5/84 (0.06)
Taurine and Hypotaurine Metabolism 1.85E204 3/47 (0.064) Glycine, Serine and ThreonineMetabolism
2.65E205 5/150 (0.033)
Aminoacyl-tRNA Biosynthesis 4.59E204 4/84 (0.048) Glutamate Metabolism 9.05E205 4/78 (0.051)
Citrate Cycle 8.21E204 3/58 (0.052) Cyanoamino Acid Metabolism 5.12E204 3/64 (0.047)
GABA Receptor Signaling 8.29E204 2/56 (0.036) Arginine and Proline Metabolism 1.13E203 4/183 (0.022)
Nitrogen Metabolism 1.56E203 3/133 (0.023) D-glutamine and D-glutamateMetabolism
1.24E203 2/27 (0.074)
Glycine, Serine and Threonine Metabolism 6.74E203 3/150 (0.027) Butanoate Metabolism 1.39E203 3/132 (0.023)
Sulfur Metabolism 8.25E203 2/61 (0.033) Alanine and Aspartate Metabolism 1.39E203 3/88 (0.034)
Selenoamino Acid Metabolism 1.06E202 2/77 (0.026) Nitrogen Metabolism 1.56E203 3/133 (0.023)
Note: GABA: c-Aminobutyric acid; the ‘‘Ratio’’ was calculated from dividing the number of metabolites that map to the canonical pathway by the total number ofmolecules that map to the pathway; the ‘‘P-value’’ was calculated from Fisher’s exact test. See the Materials and Methods section for details.doi:10.1371/journal.pone.0060598.t002
Metabolomic Analysis of MK-801 Treated Rats
PLOS ONE | www.plosone.org 6 April 2013 | Volume 8 | Issue 4 | e60598
Metabolite-protein Integrated IPA AnalysisWe did metabolite-protein integrated IPA analysis in order to
expand our vision from the metabolic ‘‘dimension’’ to the protein-
metabolic ‘‘space’’ and to reveal otherwise hidden implications
using solely metabolomic data. The final top network function was
the same as the metabolomic result while the top canonical
pathway turned out to be the Krebs cycle. This result not only
agrees well with our metabolomic conclusion that glutamate
related and energy metabolism were the top altered pathways
responding to subchronic MK-801 injection but also stresses the
involvement of energy metabolism such as the Krebs cycle in the
MK-801 induced dysfunctions. Xiao et.al came up with a similar
result through a LC-MS based metabolomic study of the
prefrontal cortex of subchronic phencyclidine treated rats [32].
Phencyclidine is another widely used NMDA receptor antagonist.
Compared with our study, though different technical platforms for
metabolite detecting and different algorithms for data mining were
employed in Xiao’s study, they also found disturbances of
metabolites such as GABA, glutamate and glutamine in the
treated rats and concluded that subchronic phencyclidine treat-
ment would induce compromised glutamatergic neurotransmis-
sion as well as disruption of metabolic pathways linked to
glutamate in the rats model.
ConclusionOur study revealed a series of treatment related metabolites in
the cortex and hippocampus of subchronic MK-801treated
schizophrenia rat model. The disturbed pathway was a highly
Figure 3. Networks associated with subchronic MK-801 treatment identified by Ingenuity Pathway Analysis. For clarity, proteins andmetabolites are presented with different geometric shapes in the relevant network in cortex (A) or hippocampus (B). Metabolite symbols with redwere up-regulated while green were down-regulated. Proteins and treatment unrelated metabolites are shown as clear. Dotted lines show indirectinteractions or regulations between the two parties, while solid lines show direct physical interactions (such as binding) of the two parties.doi:10.1371/journal.pone.0060598.g003
Table 3. Top 5 influenced canonical pathways and top 5 networks generated from IPA analysis combining previous proteomicdata.
Top 5 Canonical Pathways Top 5 Networks
Name P-value Ratio Associate Network Functions Score
Citrate Cycle 3.47E214 9/57 (0.158) Amino Acid Metabolism, Molecular Transport, Small MoleculeBiochemistry
43
Alanine and AspartateMetabolism
1.12E209 7/82 (0.085) Lipid Metabolism, Small Molecule Biochemistry, Nucleic AcidMetabolism
29
Oxidative Phosphorylation 3.03E208 8/159 (0.05) Cellular Assembly and Organization, Cell Cycle, Biliary Hyperplasia 22
Glutamate Metabolism 4.35E208 6/75 (0.08) Genetic Disorder, Metabolic Disease, Cardiovascular Disease 19
Mitochondrial Dysfunction 5.6E207 7/175 (0.04) Cell Cycle, Reproductive System Development and Function,Cellular Development
2
Note: the ‘‘Ratio’’ was calculated from dividing the number of metabolites that map to the canonical pathway by the total number of molecules that map to thepathway; the ‘‘P-value’’ was calculated from Fisher’s exact test; the ‘‘Score’’ indicates the association between the molecules and the network. See the Materials andMethods section for details.doi:10.1371/journal.pone.0060598.t003
Metabolomic Analysis of MK-801 Treated Rats
PLOS ONE | www.plosone.org 7 April 2013 | Volume 8 | Issue 4 | e60598
interconnected glutamate and energy metabolic pathway charac-
terized by down-regulated glutamate synthesis and disturbed
Krebs cycle. The disturbances on glutamate neurotransmitter
system and energy metabolism are both well-recognized hypoth-
eses of schizophrenia [47,48]. This study reveals innate bio-
chemical connections between those two theories. Compared to
the glutamate hypothesis, energy metabolism dysfunction hypoth-
esis is less discussed and deserves more attention in schizophrenia
researches. It also suggested that future studies focusing on either
hypothesis take the other one into consideration for a better
understanding of the biochemical basis of schizophrenia etiology.
In addition, this study proved that metabolomics, as a modern
systems biology method, is an efficient and robust knowledge
discovery approach for disease studies. Seeing that only cortex and
hippocampus which are MK-801 high-binding regions were used
here, studies concerning with other MK-801 low-binding brain
areas, such as cerebellum and brainstem, are recommended for
further validations and explorations.
Supporting Information
Table S1 Variables (indicated as bins) in rat cortex witheither VIP value .1.5 or q-value ,0.2. Note: ‘‘m’’ indicates
increase and ‘‘.’’ indicates decrease; figures in bold indicate VIP
values .1.5 or q-values ,0.2; p-value was generated from
Student’s t-test; q-value indicates the false discovery rate when the
particular Student’s t-test was called significant; VIP (Variable
Importance for the Projection) value was generated from OPLS
analysis; average fold change was computed by summing related
bins of the metabolite and calculating the ratio of the average sum
in treated group to that in control group.
(XLSX)
Table S2 Variables (indicated as bins) in rat hippocam-pus with either VIP value.1.5 or q-value,0.2. Note: ‘‘m’’
indicates increase and ‘‘.’’ indicates decrease; figures in bold
indicate VIP values .1.5 or q-values ,0.2; p-value was generated
from Student’s t-test; q-value indicates the false discovery rate
when the particular Student’s t-test was called significant; VIP
(Variable Importance for the Projection) value was generated from
OPLS analysis; average fold change was computed by summing
Figure 4. Top altered pathways in rat cortex and hippocampus induced by subchronic MK-801 treatment. Metabolite variationinformation here refers to the trends of changes (not only statistically significant changes). Metabolites in red (green) increased (decreased) in twobrain areas; metabolites in black changed in opposite directions in two brain regions. Solid-lined arrows indicate direct biochemical reactions, whiledashed-lined arrows represent a skip of intermediate reactions.doi:10.1371/journal.pone.0060598.g004
Metabolomic Analysis of MK-801 Treated Rats
PLOS ONE | www.plosone.org 8 April 2013 | Volume 8 | Issue 4 | e60598
related bins of the metabolite and calculating the ratio of the
average sum in treated group to that in control group.
(XLSX)
Table S3 Significantly changed proteins found in ourprevious proteomic study.
(XLSX)
Acknowledgments
The authors are grateful to Dr. Huiru Tang and Dr. Genjin Yang for
instructions and assistance on data analysis. Thanks to Ran Huo for
comments on manuscript writing.
Author Contributions
Revised the manuscript: CW ZW KW. Conceived and designed the
experiments: CW LH. Performed the experiments: JL HZ LS BJ. Analyzed
the data: LS ZZ KZ JY YL. Contributed reagents/materials/analysis tools:
MZ LY GH LG XH WL LT YY. Wrote the paper: LS CW.
References
1. Knapp M, Mangalore R, Simon J (2004) The global costs of schizophrenia.Schizophr Bull 30: 279–293.
2. Rogers DP, Goldsmith CA (2009) Treatment of schizophrenia in the 21st
Century: beyond the neurotransmitter hypothesis. Expert Rev Neurother 9: 47–54.
3. Vita A, Dieci M, Giobbio GM, Tenconi F, Invernizzi G (1997) Time course of
cerebral ventricular enlargement in schizophrenia supports the hypothesis of itsneurodevelopmental nature. Schizophr Res 23: 25–30.
4. Coyle JT (2006) Glutamate and schizophrenia: beyond the dopamine
hypothesis. Cell Mol Neurobiol 26: 365–384.
5. Bubenikova-Valesova V, Horacek J, Vrajova M, Hoschl C (2008) Models ofschizophrenia in humans and animals based on inhibition of NMDA receptors.
Neurosci Biobehav Rev 32: 1014–1023.
6. Rung JP, Carlsson A, Ryden Markinhuhta K, Carlsson ML (2005) (+)-MK-801induced social withdrawal in rats; a model for negative symptoms of
schizophrenia. Prog Neuropsychopharmacol Biol Psychiatry 29: 827–832.
7. Zhou K, Yang Y, Gao L, He G, Li W, et al. (2010) NMDA ReceptorHypofunction Induces Dysfunctions of Energy Metabolism And Semaphorin
Signaling in Rats: A Synaptic Proteome Study. Schizophr Bull.
8. Martins-de-Souza D, Harris LW, Guest PC, Bahn S (2011) The role of energymetabolism dysfunction and oxidative stress in schizophrenia revealed by
proteomics. Antioxid Redox Signal 15: 2067–2079.
9. Eyjolfsson EM, Brenner E, Kondziella D, Sonnewald U (2006) Repeatedinjection of MK801: an animal model of schizophrenia? Neurochem Int 48:
541–546.
10. Eyjolfsson EM, Nilsen LH, Kondziella D, Brenner E, Haberg A, et al. (2010)Altered (13)C glucose metabolism in the cortico-striato-thalamo-cortical loop in
the MK-801 rat model of schizophrenia. J Cereb Blood Flow Metab.
11. Kondziella D, Brenner E, Eyjolfsson EM, Markinhuhta KR, Carlsson ML, et al.(2006) Glial-neuronal interactions are impaired in the schizophrenia model of
repeated MK801 exposure. Neuropsychopharmacology 31: 1880–1887.
12. Kondziella D, Brenner E, Eyjolfsson EM, Sonnewald U (2007) How do glial-neuronal interactions fit into current neurotransmitter hypotheses of schizo-
phrenia? Neurochem Int 50: 291–301.
13. Tsang TM, Griffin JL, Haselden J, Fish C, Holmes E (2005) Metaboliccharacterization of distinct neuroanatomical regions in rats by magic angle
spinning 1H nuclear magnetic resonance spectroscopy. Magn Reson Med 53:1018–1024.
14. Fan TWM (1996) Metabolite profiling by one- and two-dimensional NMR
analysis of complex mixtures. Progress in Nuclear Magnetic ResonanceSpectroscopy 28: 161–219.
15. Pears MR, Cooper JD, Mitchison HM, Mortishire-Smith RJ, Pearce DA, et al.
(2005) High resolution 1H NMR-based metabolomics indicates a neurotrans-mitter cycling deficit in cerebral tissue from a mouse model of Batten disease.
J Biol Chem 280: 42508–42514.
16. Tsang TM, Haselden JN, Holmes E (2009) Metabonomic Characterization ofthe 3-Nitropropionic Acid Rat Model of Huntington’s Disease. Neurochemical
Research: 1–11.
17. Salek RM, Xia J, Innes A, Sweatman BC, Adalbert R, et al. (2010) Ametabolomic study of the CRND8 transgenic mouse model of Alzheimer’s
disease. Neurochem Int 56: 937–947.
18. Ting L, Cowley MJ, Hoon SL, Guilhaus M, Raftery MJ, et al. (2009)Normalization and statistical analysis of quantitative proteomics data generated
by metabolic labeling. Mol Cell Proteomics 8: 2227–2242.
19. Kim JS, Kornhuber HH, Schmid-Burgk W, Holzmuller B (1980) Lowcerebrospinal fluid glutamate in schizophrenic patients and a new hypothesis
on schizophrenia. Neurosci Lett 20: 379–382.
20. van Elst LT, Valerius G, Buchert M, Thiel T, Rusch N, et al. (2005) Increasedprefrontal and hippocampal glutamate concentration in schizophrenia: evidence
from a magnetic resonance spectroscopy study. Biol Psychiatry 58: 724–730.
21. Purdon SE, Valiakalayil A, Hanstock CC, Seres P, Tibbo P (2008) Elevated 3Tproton MRS glutamate levels associated with poor Continuous Performance
Test (CPT-0X) scores and genetic risk for schizophrenia. Schizophr Res 99:218–224.
22. Lutkenhoff ES, van Erp TG, Thomas MA, Therman S, Manninen M, et al.
(2010) Proton MRS in twin pairs discordant for schizophrenia. Mol Psychiatry15: 308–318.
23. Tayoshi S, Sumitani S, Taniguchi K, Shibuya-Tayoshi S, Numata S, et al.
(2009) Metabolite changes and gender differences in schizophrenia using 3-Tesla
proton magnetic resonance spectroscopy (1H-MRS). Schizophr Res 108: 69–77.
24. Ohrmann P, Siegmund A, Suslow T, Spitzberg K, Kersting A, et al. (2005)
Evidence for glutamatergic neuronal dysfunction in the prefrontal cortex in
chronic but not in first-episode patients with schizophrenia: a proton magnetic
resonance spectroscopy study. Schizophr Res 73: 153–157.
25. Loscher W, Honack D, Fassbender CP (1991) Regional alterations in brain
amino acids after administration of the N-methyl-D-aspartate receptor
antagonists MK-801 and CGP 39551 in rats. Neurosci Lett 124: 115–118.
26. Brenner E, Kondziella D, Haberg A, Sonnewald U (2005) Impaired glutamine
metabolism in NMDA receptor hypofunction induced by MK801. J Neurochem
94: 1594–1603.
27. Zuo DY, Zhang YH, Cao Y, Wu CF, Tanaka M, et al. (2006) Effect of acute and
chronic MK-801 administration on extracellular glutamate and ascorbic acid
release in the prefrontal cortex of freely moving mice on line with open-field
behavior. Life Sci 78: 2172–2178.
28. Theberge J, Al-Semaan Y, Williamson PC, Menon RS, Neufeld RW, et al.
(2003) Glutamate and glutamine in the anterior cingulate and thalamus of
medicated patients with chronic schizophrenia and healthy comparison subjects
measured with 4.0-T proton MRS. Am J Psychiatry 160: 2231–2233.
29. Gonzalez-Burgos G, Lewis DA (2008) GABA neurons and the mechanisms of
network oscillations: implications for understanding cortical dysfunction in
schizophrenia. Schizophr Bull 34: 944–961.
30. Ongur D, Prescot AP, McCarthy J, Cohen BM, Renshaw PF (2010) Elevated
gamma-aminobutyric acid levels in chronic schizophrenia. Biol Psychiatry 68:
667–670.
31. Cotter D, Landau S, Beasley C, Stevenson R, Chana G, et al. (2002) The density
and spatial distribution of GABAergic neurons, labelled using calcium binding
proteins, in the anterior cingulate cortex in major depressive disorder, bipolar
disorder, and schizophrenia. Biol Psychiatry 51: 377–386.
32. Xiao X, Dawson N, Macintyre L, Morris BJ, Pratt JA, et al. (2011) Exploring
metabolic pathway disruption in the subchronic phencyclidine model of
schizophrenia with the Generalized Singular Value Decomposition. BMC Syst
Biol 5: 72.
33. Jenkins TA, Harte MK, Reynolds GP (2010) Effect of subchronic phencyclidine
administration on sucrose preference and hippocampal parvalbumin immuno-
reactivity in the rat. Neurosci Lett 471: 144–147.
34. Reynolds GP, Beasley CL (2001) GABAergic neuronal subtypes in the human
frontal cortex–development and deficits in schizophrenia. J Chem Neuroanat
22: 95–100.
35. Meloni BP, Van Dyk D, Cole R, Knuckey NW (2005) Proteome analysis of
cortical neuronal cultures following cycloheximide, heat stress and MK801
preconditioning. Proteomics 5: 4743–4753.
36. Paulson L, Martin P, Nilsson CL, Ljung E, Westman-Brinkmalm A, et al. (2004)
Comparative proteome analysis of thalamus in MK-801-treated rats. Proteomics
4: 819–825.
37. Middleton FA, Mirnics K, Pierri JN, Lewis DA, Levitt P (2002) Gene expression
profiling reveals alterations of specific metabolic pathways in schizophrenia.
J Neurosci 22: 2718–2729.
38. Schousboe A, Sonnewald U, Waagepetersen HS (2003) Differential roles of
alanine in GABAergic and glutamatergic neurons. Neurochem Int 43: 311–315.
39. Waagepetersen HS, Sonnewald U, Larsson OM, Schousboe A (2000) A possible
role of alanine for ammonia transfer between astrocytes and glutamatergic
neurons. J Neurochem 75: 471–479.
40. Ozeki Y, Pickard BS, Kano S, Malloy MP, Zeledon M, et al. (2011) A novel
balanced chromosomal translocation found in subjects with schizophrenia and
schizotypal personality disorder: altered l-serine level associated with disruption
of PSAT1 gene expression. Neurosci Res 69: 154–160.
41. Ohnuma T, Sakai Y, Maeshima H, Hatano T, Hanzawa R, et al. (2008)
Changes in plasma glycine, L-serine, and D-serine levels in patients with
schizophrenia as their clinical symptoms improve: results from the Juntendo
University Schizophrenia Projects (JUSP). Prog Neuropsychopharmacol Biol
Psychiatry 32: 1905–1912.
42. Ariyannur PS, Moffett JR, Manickam P, Pattabiraman N, Arun P, et al. (2010)
Methamphetamine-induced neuronal protein NAT8L is the NAA biosynthetic
Metabolomic Analysis of MK-801 Treated Rats
PLOS ONE | www.plosone.org 9 April 2013 | Volume 8 | Issue 4 | e60598
enzyme: implications for specialized acetyl coenzyme A metabolism in the CNS.
Brain Res 1335: 1–13.43. Erhardt S, Schwieler L, Nilsson L, Linderholm K, Engberg G (2007) The
kynurenic acid hypothesis of schizophrenia. Physiol Behav 92: 203–209.
44. Leavitt BR, van Raamsdonk JM, Shehadeh J, Fernandes H, Murphy Z, et al.(2006) Wild-type huntingtin protects neurons from excitotoxicity. J Neurochem
96: 1121–1129.45. Sun Y, Savanenin A, Reddy PH, Liu YF (2001) Polyglutamine-expanded
huntingtin promotes sensitization of N-methyl-D-aspartate receptors via post-
synaptic density 95. J Biol Chem 276: 24713–24718.
46. Faideau M, Kim J, Cormier K, Gilmore R, Welch M, et al. (2010) In vivo
expression of polyglutamine-expanded huntingtin by mouse striatal astrocytesimpairs glutamate transport: a correlation with Huntington’s disease subjects.
Hum Mol Genet 19: 3053–3067.
47. Martins-de-Souza D, Harris LW, Guest PC, Bahn S (2011) The role of energymetabolism dysfunction and oxidative stress in schizophrenia revealed by
proteomics. Antioxid Redox Signal 15: 2067–2079.48. Moghaddam B, Javitt D (2012) From revolution to evolution: the glutamate
hypothesis of schizophrenia and its implication for treatment. Neuropsycho-
pharmacology 37: 4–15.
Metabolomic Analysis of MK-801 Treated Rats
PLOS ONE | www.plosone.org 10 April 2013 | Volume 8 | Issue 4 | e60598