messs 2014 salmon enumeration_final report no pics
TRANSCRIPT
1
M a i n l a n d E n h a n c e m e n t S a l m o n i d S p e c i e s S o c i e t y ( M . E . S . S . S . ) G e n e r a l D e l i v e r y , S i m o o m S o u n d , ( B C ) , V 0 P 1 S 0
2014 Salmon Enumeration Program
Fall 2014
08 Fall
Report Prepared By: Marie-‐Josée Gagnon (B.Sc.) [email protected]
Final Report to M.E.S.S.S. and the Department of Fisheries and Oceans
2
Table of Contents
ACKNOWLEGMENTS …………………………….………………………………………………………………... 3 EXECUTIVE SUMMARY …………………………………..……………………..……………………………….. 4 1.0 Survey Description ………………………………..…………………………………………………... 5 2.0 Survey Locations ………………………………………………………………………………………………6
Figure 1. Fall 2014 salmon enumeration sites in East Broughton. Stream names are listed in the stream summary Figure 2. Fall 2014 salmon enumeration sites in West Broughton. Stream names are listed in the stream summary.
3.0 Escapement Data 2011-‐2014 ……………………..……………………………………………………..7 Table 1. Comparison of total live observed counts for 16 M.E.S.S.S. and DFO systems surveyed this season (2014) and in the previous 3 years Table 2. Live observed counts and stream estimates (bold) (accounting for efficiency) for DFO systems enumerated from August 12th to November 10th, 2014 …………………………………………8 Table 3. Comparison of peak counts (observed/estimated) for 12 M.E.S.S.S. and DFO systems surveyed this season (2014) and in the previous two years ……………………………………………... .9 Figure 3. Peak observed pink counts for of Statistical Area 12 enumerated from 2011 to 2014 with color coordination representing even-‐year line comparisons......................................................9 Figure 4. Peak observed chum counts for of Statistical Area 12 enumerated from 2011 to 2014………………………………………………………………………………………………………………………………. 10 Figure 5. Peak observed coho counts for of Statistical Area 12 enumerated from 2011 to 2014 with color coordination representing the 3-‐year class comparison. …………………………………..10
4.0 Pacific Salmon Life History………………………………………………………………………………. 11 4.1 Pink Salmon 4.2 Chum Salmon 4.3 Coho Salmon
5.0 System Summaries ………………………………………………………………………………………….. 12 5.1 Ahta ………………………………………………………………………………………………………………….. 12 5.2 Viner…………………………………………………………………………………………………………………. 13 5.3 Scott Cove …………………………………………………………………………………………………………. 14 5.4 Shoal Harbour……………………………………………………………………………………………………. 15 5.5 Gilford Creek...............................................................................................................................................16 5.6 Embly Lagoon……………………………………………………………………………………………………. 17
6.0 M.E.S.S.S. System Summaries…………………………………………………………………………………… 20 6.1 Wahkana …………………………………………………………………………………………………………… 20 6.2 Simoom Sound …………………………………………………………………………………………………… 20 6.3 Maple Cove…………………………………………………………………………………………………………. 21 6.4 Sir Edmund Bay………………………………………………………………………………………………….. 21 6.5 Carridean Bay……………………………………………………………………………………………………... 22 6.6 Mini-‐hump Creek………………………………………………………………………………………………... 23 6.7 Loose Lake Systems………………………………………………………………………………………..…… 24
7.0 Comments…………………………………………………………………………………………………………………… 24 7.1 Highlights…………………………………………………………………………………………………………… 27 7.2 Hurdles………………………………………………………………………………………………………………. 25
8.0 Recommendations…………………………………………………………………………………………………….. 25 8.1 Trail Work………………………………………………………………………………………………………….. 26 8.2 Equipment………………………………………………………………………………………………………….. 26 8.3 Gilford………………………………………………………………………………………………………………… 26 8.4 Consistency………………………………………………………………………………………………………… 27 8.5 Segment delineation……………………………………………………………………………………………. 27 8.6 M.E.S.S.S. Survey Program……………………………………………………………………………………. 28 8.7 Survey Timing…………………………………………………………………………………………………….. 28
3
ACKNOWLEGMENTS
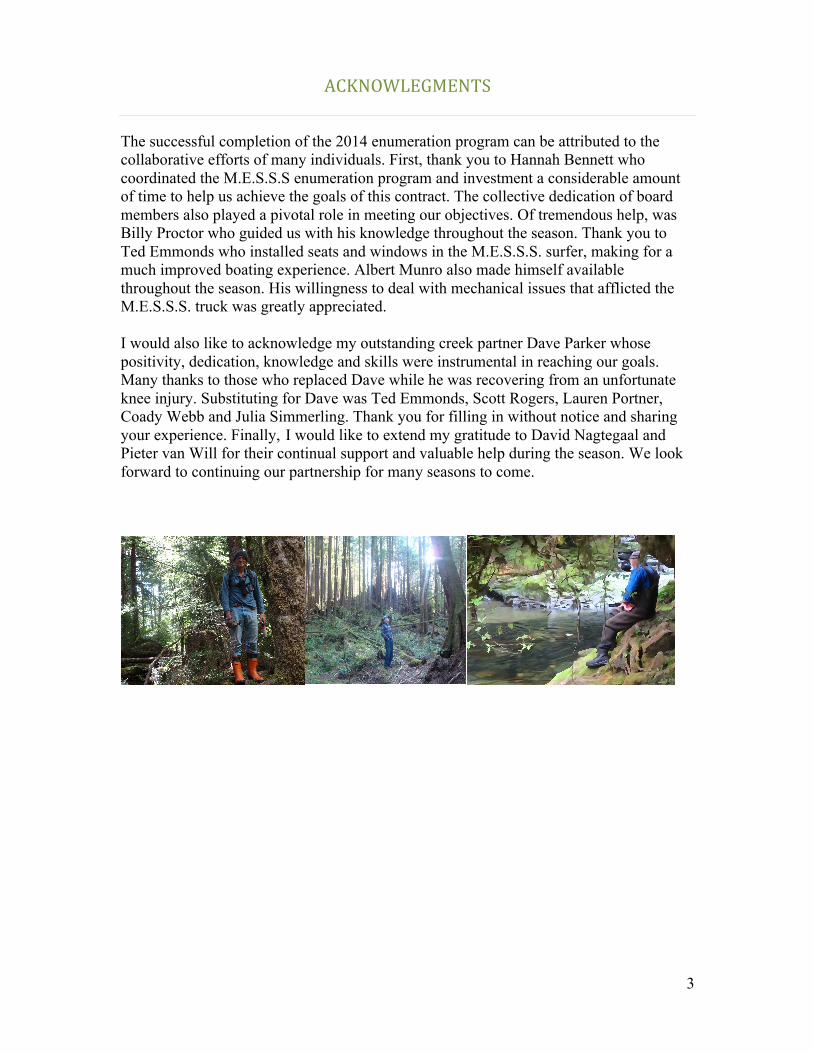
The successful completion of the 2014 enumeration program can be attributed to the collaborative efforts of many individuals. First, thank you to Hannah Bennett who coordinated the M.E.S.S.S enumeration program and investment a considerable amount of time to help us achieve the goals of this contract. The collective dedication of board members also played a pivotal role in meeting our objectives. Of tremendous help, was Billy Proctor who guided us with his knowledge throughout the season. Thank you to Ted Emmonds who installed seats and windows in the M.E.S.S.S. surfer, making for a much improved boating experience. Albert Munro also made himself available throughout the season. His willingness to deal with mechanical issues that afflicted the M.E.S.S.S. truck was greatly appreciated. I would also like to acknowledge my outstanding creek partner Dave Parker whose positivity, dedication, knowledge and skills were instrumental in reaching our goals. Many thanks to those who replaced Dave while he was recovering from an unfortunate knee injury. Substituting for Dave was Ted Emmonds, Scott Rogers, Lauren Portner, Coady Webb and Julia Simmerling. Thank you for filling in without notice and sharing your experience. Finally, I would like to extend my gratitude to David Nagtegaal and Pieter van Will for their continual support and valuable help during the season. We look forward to continuing our partnership for many seasons to come.
M.E.S.S.S. Salmon Enumeration Program 2014
EXECUTIVE SUMMARY
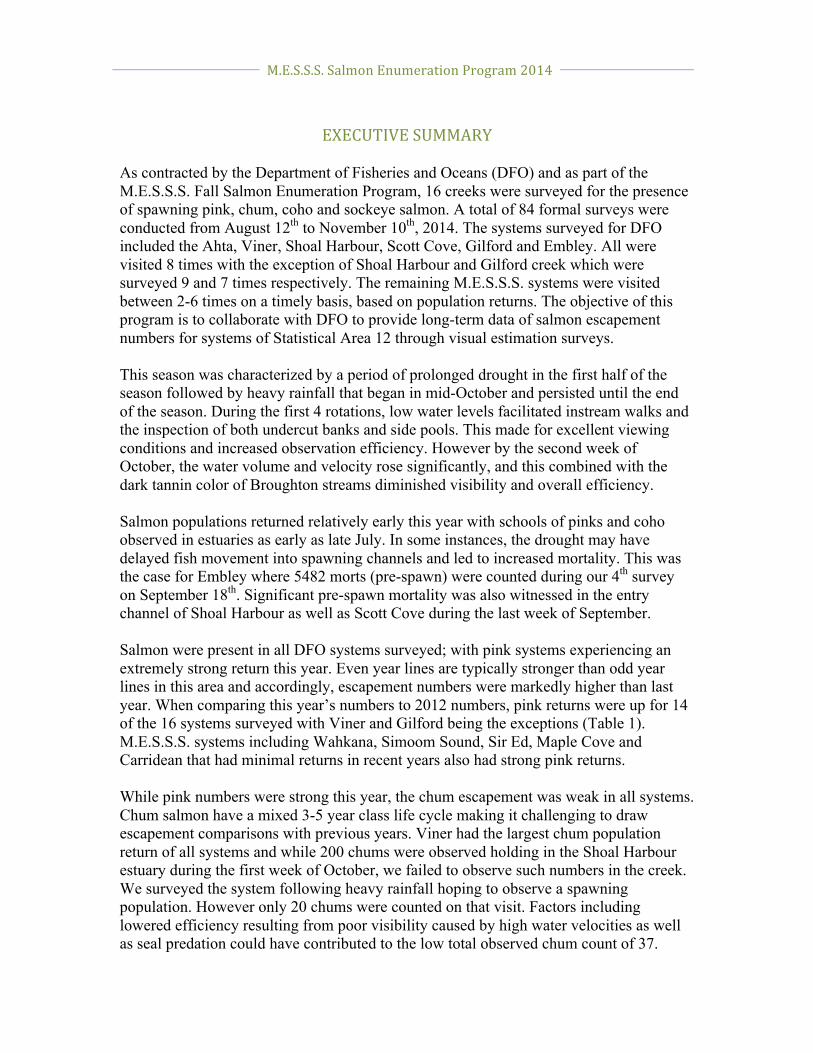
As contracted by the Department of Fisheries and Oceans (DFO) and as part of the M.E.S.S.S. Fall Salmon Enumeration Program, 16 creeks were surveyed for the presence of spawning pink, chum, coho and sockeye salmon. A total of 84 formal surveys were conducted from August 12th to November 10th, 2014. The systems surveyed for DFO included the Ahta, Viner, Shoal Harbour, Scott Cove, Gilford and Embley. All were visited 8 times with the exception of Shoal Harbour and Gilford creek which were surveyed 9 and 7 times respectively. The remaining M.E.S.S.S. systems were visited between 2-6 times on a timely basis, based on population returns. The objective of this program is to collaborate with DFO to provide long-term data of salmon escapement numbers for systems of Statistical Area 12 through visual estimation surveys. This season was characterized by a period of prolonged drought in the first half of the season followed by heavy rainfall that began in mid-October and persisted until the end of the season. During the first 4 rotations, low water levels facilitated instream walks and the inspection of both undercut banks and side pools. This made for excellent viewing conditions and increased observation efficiency. However by the second week of October, the water volume and velocity rose significantly, and this combined with the dark tannin color of Broughton streams diminished visibility and overall efficiency. Salmon populations returned relatively early this year with schools of pinks and coho observed in estuaries as early as late July. In some instances, the drought may have delayed fish movement into spawning channels and led to increased mortality. This was the case for Embley where 5482 morts (pre-spawn) were counted during our 4th survey on September 18th. Significant pre-spawn mortality was also witnessed in the entry channel of Shoal Harbour as well as Scott Cove during the last week of September. Salmon were present in all DFO systems surveyed; with pink systems experiencing an extremely strong return this year. Even year lines are typically stronger than odd year lines in this area and accordingly, escapement numbers were markedly higher than last year. When comparing this year’s numbers to 2012 numbers, pink returns were up for 14 of the 16 systems surveyed with Viner and Gilford being the exceptions (Table 1). M.E.S.S.S. systems including Wahkana, Simoom Sound, Sir Ed, Maple Cove and Carridean that had minimal returns in recent years also had strong pink returns. While pink numbers were strong this year, the chum escapement was weak in all systems. Chum salmon have a mixed 3-5 year class life cycle making it challenging to draw escapement comparisons with previous years. Viner had the largest chum population return of all systems and while 200 chums were observed holding in the Shoal Harbour estuary during the first week of October, we failed to observe such numbers in the creek. We surveyed the system following heavy rainfall hoping to observe a spawning population. However only 20 chums were counted on that visit. Factors including lowered efficiency resulting from poor visibility caused by high water velocities as well as seal predation could have contributed to the low total observed chum count of 37.
5
A high number of coho passed through the area during sport fishing season as evidenced by recreational fishermen catches. However the total number of live coho observed was lower than initially expected. This was true for all systems including Scott cove where an abundance of coho jumpers were observed in the estuary early in the season. However the number of coho observed in the creek as well as associated Loose Lake system remained relatively low (Table 1). Unfortunately persistent mechanical problems to the truck during the last week of October prevented us from surveying Loose Lake systems during the typical peak observation period. With the exception of Loose creek, no coho were observed which can be expected given the timing of our surveys. Similarly, coho numbers observed beneath the Ahta falls and in Gilford creek were lower than the numbers observed in 2011 (3-year life class comparison; Table 2). As usual, the dark tannin water as well as the hiding ability of coho made creek side observation challenging. For some systems including Scott Cove and Gilford, surveying efforts during high flow conditions were restricted to 20-minute observation sessions at falls or other set locations. And so when in comes to coho, visual surveys may not be an optimal method for accurately estimating population returns. The timing and selection of M.E.S.S.S. creeks surveyed was highly influenced by the presence of fish in the estuary, the weather and the tides. Heavy rains following a period of drought as well as large tides are known to promote fish movement upstream. As such, we attempted to re-adjust the timing of surveys according to these events. Similarly, when visibility became a challenge in October due to heavy rainfall, we attempted to take advantage of sunny days, hoping that a potential drop in water levels would improve overall visibility. We notably choose to anchor out the boat and kayak to the creek which liberated us from the constraint of tides. This greatly increased our scheduling flexibility.
1.0 Survey Description Primary Stream Walkers: Marie-Josée Gagnon and Dave Parker. Additional Stream Walkers: Ted Emmonds, Scott Rogers, Lauren Portner, Coady Webb and Julia Simmerling. Stream Responsibilities: DFO Streams (6): Enumerated every 9-14 days: 48 visits overall: Ahta River(x8), Embley River(x8), Gilford Creek(x7), Scott Cove Creek(x8), Shoal Harbour Creek(x9), Viner Creek(x8). MESSS Streams (10): Enumerated every 8-15 days: 36 visits overall - opportunistically as was timely for pink and coho returns: Loose Creek(x3), and Chris Bennett(x2), John Lewis(x2), Connector Cr.(x2), Mini-hump(x4), Maple Cove(x4), Wahkana(x6), Carridean(x4), Simoom Sound(x5), Sir Ed(x4).
6
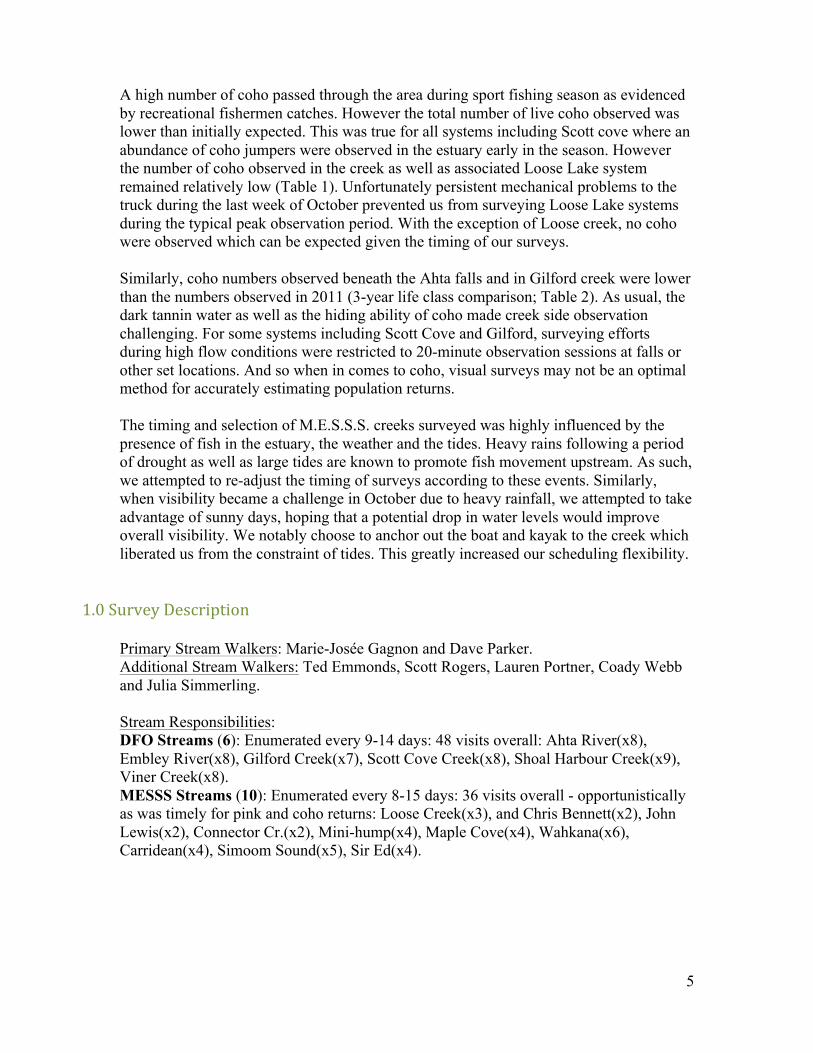
2.0 Survey Locations
Figure 1. Fall 2014 salmon enumeration sites in East Broughton. Stream names are listed in Table 1.
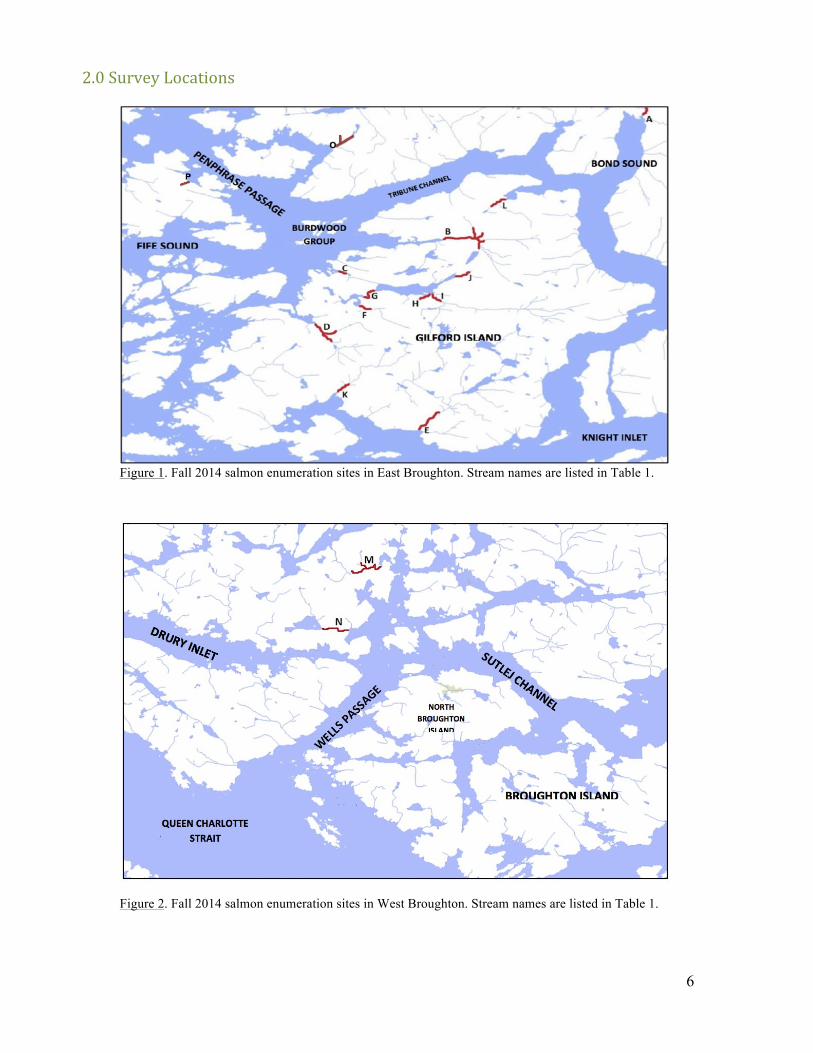
Figure 2. Fall 2014 salmon enumeration sites in West Broughton. Stream names are listed in Table 1.
7
3.0 Escapement Data: 2011-‐2014
STREAM # of Visits 12/13/14
PINKS CHUMS COHO 2011 2012 2013 2014 2011 2012 2013 2014 2011 2012 2013 2014
A. Ahta River 6/7/8 5208 25822 33620 164440 213 890 406 212 1551 1272 2363 930
B. Viner River 5/7/8 659 3939 1414 3989 1756 5667 3074 573 4 1 8 18
C. Scott C. Cr. 6/7/8 0 2 0 438 0 1 0 6 79 196 408 193
D. Shoal H. Cr. 6/7/9 29 214 75 687 198 54 307 37 2 8 10 3
E. Gilford Cr. 5/7/7 0 142 5 63 0 0 2 0 16 56 2 5
M. Embley River 6/6/8 -‐-‐-‐ 13067 75 274597 -‐-‐-‐ 17 22 16 -‐-‐-‐ 92 38 3
F. Connector Cr. 2/0/3 0 -‐-‐-‐ 26MH 0 0 -‐-‐-‐ 0 0 0 -‐-‐-‐ 0 0
G. Minihump Cr. 3/2/4 1023MH 122MH 1236MH 449MH 0 0 0 0 0 3 0 12
H. Chris B. Cr. 3/2/2 0 0 0 0 0 0 0 0 2 4 0 0
I. Loose Cr. 2/2/2 0 0 0 0 0 0 0 0 0 0 0 2
J. John Lewis Cr. 0/2/2 0 -‐-‐-‐ 0 0 0 0 0 0 0 0 0 0
K. Maple Co. Cr. 1/3/4 4 0 0 56 1 0 0 0 0 0 0 0
L. Wahkana Cr. 3/1/7 9 10 8 944 0 0 0 13 0 0 4 16
N. Carridean Cr. 1/1/5 0 0 0 5295* 0 0 0 0 0 0 0 6
O. Simoom Cr. 0/0/5 0 -‐-‐-‐ -‐-‐-‐ 372 0 -‐-‐-‐ -‐-‐-‐ 0 0 -‐-‐-‐ -‐-‐-‐ 0
P. Sir Ed Cr. 0/0/4 0 -‐-‐-‐ -‐-‐-‐ 13 0 -‐-‐-‐ -‐-‐-‐ 0 0 -‐-‐-‐ -‐-‐-‐ 0
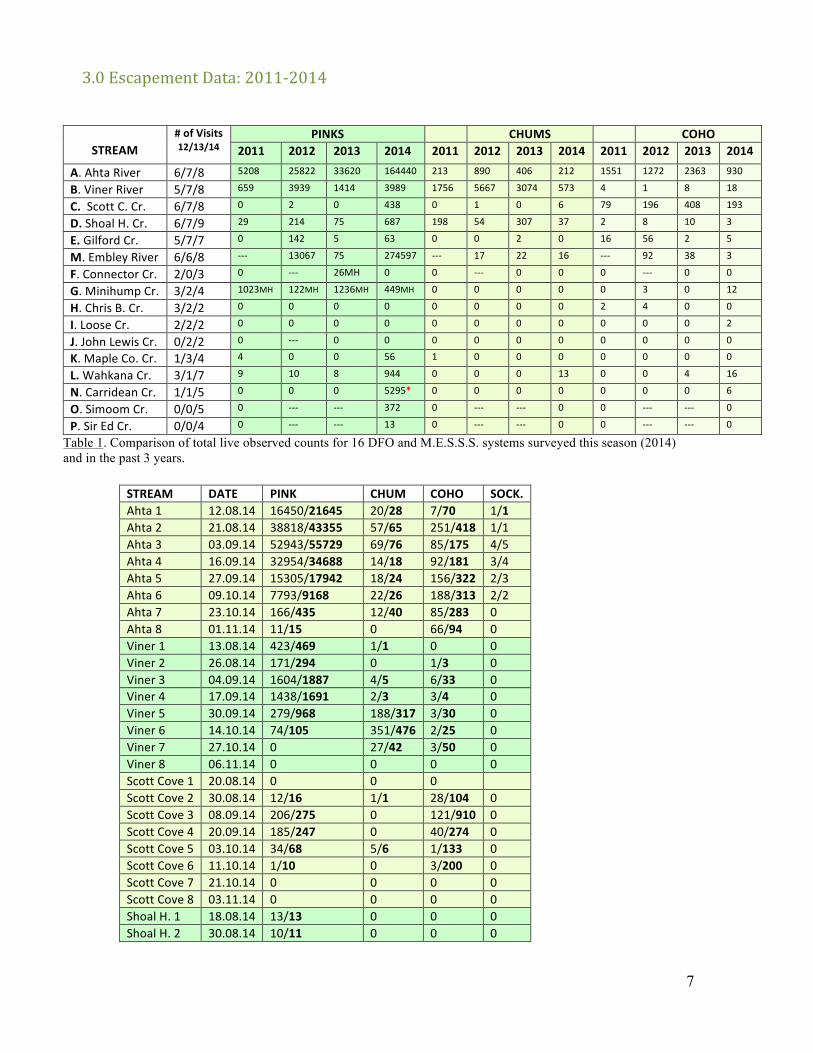
Table 1. Comparison of total live observed counts for 16 DFO and M.E.S.S.S. systems surveyed this season (2014) and in the past 3 years.
STREAM DATE PINK CHUM COHO SOCK. Ahta 1 12.08.14 16450/21645 20/28 7/70 1/1 Ahta 2 21.08.14 38818/43355 57/65 251/418 1/1 Ahta 3 03.09.14 52943/55729 69/76 85/175 4/5 Ahta 4 16.09.14 32954/34688 14/18 92/181 3/4 Ahta 5 27.09.14 15305/17942 18/24 156/322 2/3 Ahta 6 09.10.14 7793/9168 22/26 188/313 2/2 Ahta 7 23.10.14 166/435 12/40 85/283 0 Ahta 8 01.11.14 11/15 0 66/94 0 Viner 1 13.08.14 423/469 1/1 0 0 Viner 2 26.08.14 171/294 0 1/3 0 Viner 3 04.09.14 1604/1887 4/5 6/33 0 Viner 4 17.09.14 1438/1691 2/3 3/4 0 Viner 5 30.09.14 279/968 188/317 3/30 0 Viner 6 14.10.14 74/105 351/476 2/25 0 Viner 7 27.10.14 0 27/42 3/50 0 Viner 8 06.11.14 0 0 0 0 Scott Cove 1 20.08.14 0 0 0 Scott Cove 2 30.08.14 12/16 1/1 28/104 0 Scott Cove 3 08.09.14 206/275 0 121/910 0 Scott Cove 4 20.09.14 185/247 0 40/274 0 Scott Cove 5 03.10.14 34/68 5/6 1/133 0 Scott Cove 6 11.10.14 1/10 0 3/200 0 Scott Cove 7 21.10.14 0 0 0 0 Scott Cove 8 03.11.14 0 0 0 0 Shoal H. 1 18.08.14 13/13 0 0 0 Shoal H. 2 30.08.14 10/11 0 0 0
8
Shoal H. 3 08.09.14 29/36 0 0 0 Shoal H. 4a 21.09.14 17/21 0 0 0 Shoal H. 4b 26.09.14 126/148 2/2 0 0 Shoal H. 5 05.10.14 367/432 14/17 0 0 Shoal H. 6 13.10.14 93/310 20/80 2/50 0 Shoal H. 7 21.10.14 32/91 1/10 1/100 0 Shoal H. 8 02.11.14 0 0 0 0 Gilford 1 17.08.14 0 0 0 0 Gilford 2 29.08.14 8/13 0 1/14 0 Gilford 3 09.09.14 11/18 0 2/10 0 Gilford 4 22.09.14 40/57 0 1/8 0 Gilford 5 04.10.14 4/16 0 1/50 0 Gilford 6 25.10.14 0 0 0 0 Gilford 7 08.11.14 0 0 0 0 Embley 1 15.08.14 31748/49765 0 13/20 0 Embley 2 28.08.14 52207/81479 2/5 8/20 0 Embley 3 07.09.14 109283/152068 1/11 3/50 0 Embley 4 18.09.14 37153/52950 0/0 3/43 1/1 Embley 5 01.10.14 34500/46824 12/16 29/347 2/3 Embley 6 15.10.14 7107/14139 1/16 3/150 0 Embley 7 26.10.14 2424/5219 0 0 0 Embley 8 09.11.14 175/467 0 1/100 0
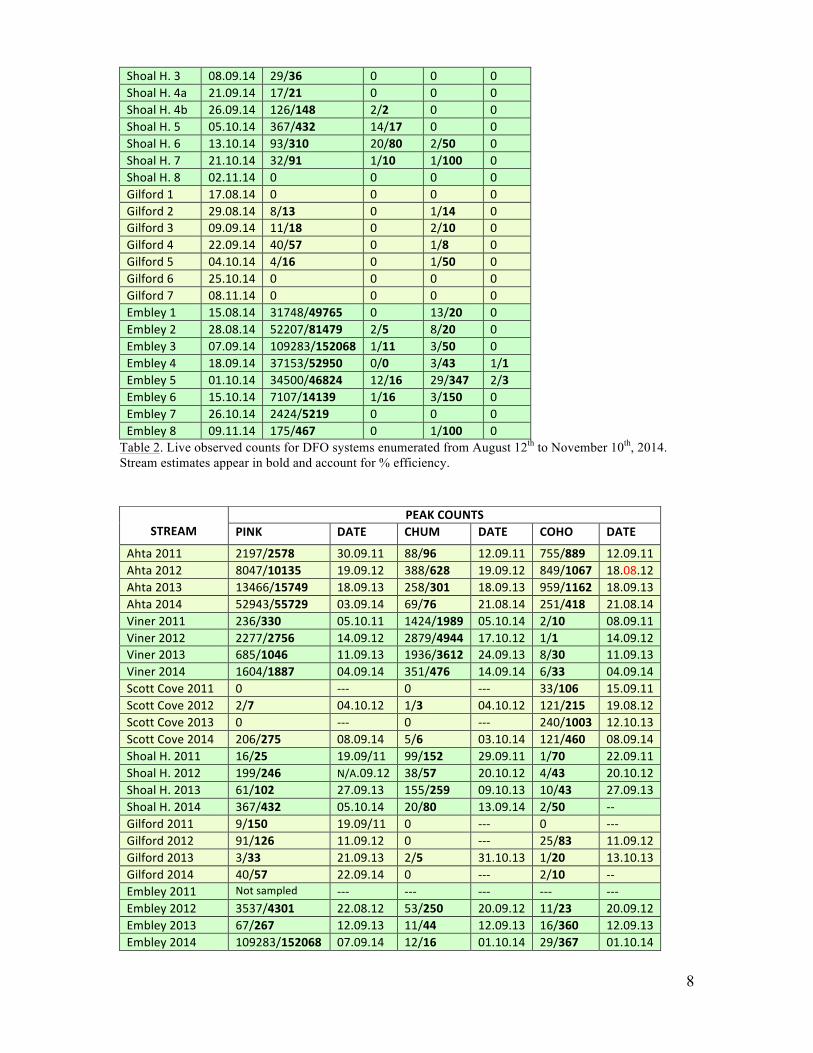
Table 2. Live observed counts for DFO systems enumerated from August 12th to November 10th, 2014. Stream estimates appear in bold and account for % efficiency.
STREAM PEAK COUNTS
PINK DATE CHUM DATE COHO DATE
Ahta 2011 2197/2578 30.09.11 88/96 12.09.11 755/889 12.09.11 Ahta 2012 8047/10135 19.09.12 388/628 19.09.12 849/1067 18.08.12 Ahta 2013 13466/15749 18.09.13 258/301 18.09.13 959/1162 18.09.13 Ahta 2014 52943/55729 03.09.14 69/76 21.08.14 251/418 21.08.14 Viner 2011 236/330 05.10.11 1424/1989 05.10.14 2/10 08.09.11 Viner 2012 2277/2756 14.09.12 2879/4944 17.10.12 1/1 14.09.12 Viner 2013 685/1046 11.09.13 1936/3612 24.09.13 8/30 11.09.13 Viner 2014 1604/1887 04.09.14 351/476 14.09.14 6/33 04.09.14 Scott Cove 2011 0 -‐-‐-‐ 0 -‐-‐-‐ 33/106 15.09.11 Scott Cove 2012 2/7 04.10.12 1/3 04.10.12 121/215 19.08.12 Scott Cove 2013 0 -‐-‐-‐ 0 -‐-‐-‐ 240/1003 12.10.13 Scott Cove 2014 206/275 08.09.14 5/6 03.10.14 121/460 08.09.14 Shoal H. 2011 16/25 19.09/11 99/152 29.09.11 1/70 22.09.11 Shoal H. 2012 199/246 N/A.09.12 38/57 20.10.12 4/43 20.10.12 Shoal H. 2013 61/102 27.09.13 155/259 09.10.13 10/43 27.09.13 Shoal H. 2014 367/432 05.10.14 20/80 13.09.14 2/50 -‐-‐ Gilford 2011 9/150 19.09/11 0 -‐-‐-‐ 0 -‐-‐-‐ Gilford 2012 91/126 11.09.12 0 -‐-‐-‐ 25/83 11.09.12 Gilford 2013 3/33 21.09.13 2/5 31.10.13 1/20 13.10.13 Gilford 2014 40/57 22.09.14 0 -‐-‐-‐ 2/10 -‐-‐ Embley 2011 Not sampled -‐-‐-‐ -‐-‐-‐ -‐-‐-‐ -‐-‐-‐ -‐-‐-‐ Embley 2012 3537/4301 22.08.12 53/250 20.09.12 11/23 20.09.12 Embley 2013 67/267 12.09.13 11/44 12.09.13 16/360 12.09.13 Embley 2014 109283/152068 07.09.14 12/16 01.10.14 29/367 01.10.14
9
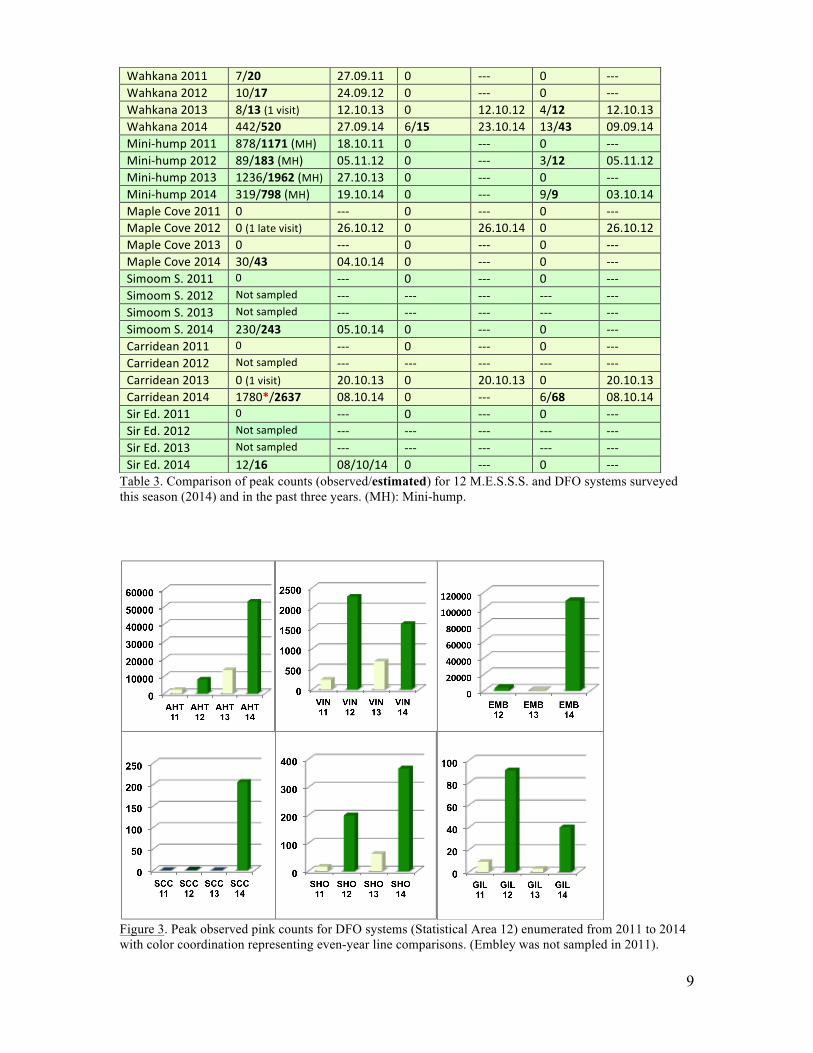
Table 3. Comparison of peak counts (observed/estimated) for 12 M.E.S.S.S. and DFO systems surveyed this season (2014) and in the past three years. (MH): Mini-hump.
Figure 3. Peak observed pink counts for DFO systems (Statistical Area 12) enumerated from 2011 to 2014 with color coordination representing even-year line comparisons. (Embley was not sampled in 2011).
Wahkana 2011 7/20 27.09.11 0 -‐-‐-‐ 0 -‐-‐-‐ Wahkana 2012 10/17 24.09.12 0 -‐-‐-‐ 0 -‐-‐-‐ Wahkana 2013 8/13 (1 visit) 12.10.13 0 12.10.12 4/12 12.10.13 Wahkana 2014 442/520 27.09.14 6/15 23.10.14 13/43 09.09.14 Mini-‐hump 2011 878/1171 (MH) 18.10.11 0 -‐-‐-‐ 0 -‐-‐-‐ Mini-‐hump 2012 89/183 (MH) 05.11.12 0 -‐-‐-‐ 3/12 05.11.12 Mini-‐hump 2013 1236/1962 (MH) 27.10.13 0 -‐-‐-‐ 0 -‐-‐-‐ Mini-‐hump 2014 319/798 (MH) 19.10.14 0 -‐-‐-‐ 9/9 03.10.14 Maple Cove 2011 0 -‐-‐-‐ 0 -‐-‐-‐ 0 -‐-‐-‐ Maple Cove 2012 0 (1 late visit) 26.10.12 0 26.10.14 0 26.10.12 Maple Cove 2013 0 -‐-‐-‐ 0 -‐-‐-‐ 0 -‐-‐-‐ Maple Cove 2014 30/43 04.10.14 0 -‐-‐-‐ 0 -‐-‐-‐ Simoom S. 2011 0 -‐-‐-‐ 0 -‐-‐-‐ 0 -‐-‐-‐ Simoom S. 2012 Not sampled -‐-‐-‐ -‐-‐-‐ -‐-‐-‐ -‐-‐-‐ -‐-‐-‐ Simoom S. 2013 Not sampled -‐-‐-‐ -‐-‐-‐ -‐-‐-‐ -‐-‐-‐ -‐-‐-‐ Simoom S. 2014 230/243 05.10.14 0 -‐-‐-‐ 0 -‐-‐-‐ Carridean 2011 0 -‐-‐-‐ 0 -‐-‐-‐ 0 -‐-‐-‐ Carridean 2012 Not sampled -‐-‐-‐ -‐-‐-‐ -‐-‐-‐ -‐-‐-‐ -‐-‐-‐ Carridean 2013 0 (1 visit) 20.10.13 0 20.10.13 0 20.10.13 Carridean 2014 1780*/2637 08.10.14 0 -‐-‐-‐ 6/68 08.10.14 Sir Ed. 2011 0 -‐-‐-‐ 0 -‐-‐-‐ 0 -‐-‐-‐ Sir Ed. 2012 Not sampled -‐-‐-‐ -‐-‐-‐ -‐-‐-‐ -‐-‐-‐ -‐-‐-‐ Sir Ed. 2013 Not sampled -‐-‐-‐ -‐-‐-‐ -‐-‐-‐ -‐-‐-‐ -‐-‐-‐ Sir Ed. 2014 12/16 08/10/14 0 -‐-‐-‐ 0 -‐-‐-‐
10
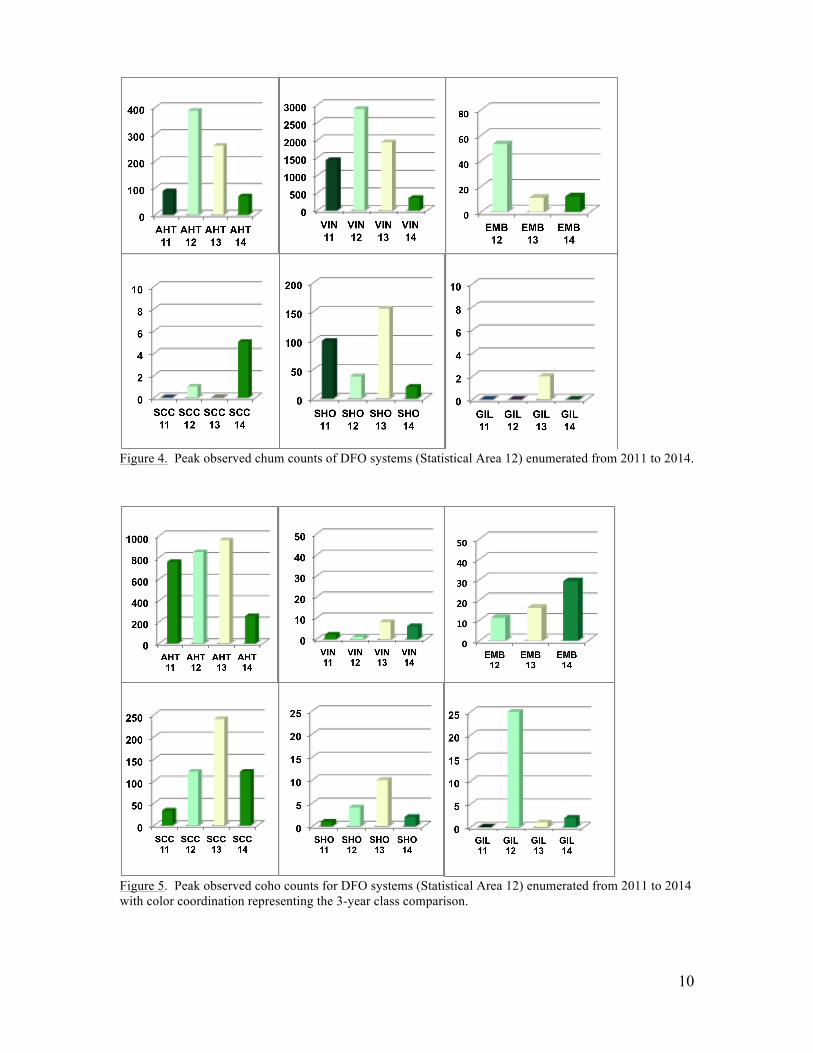
Figure 4. Peak observed chum counts of DFO systems (Statistical Area 12) enumerated from 2011 to 2014.
Figure 5. Peak observed coho counts for DFO systems (Statistical Area 12) enumerated from 2011 to 2014 with color coordination representing the 3-year class comparison.
11
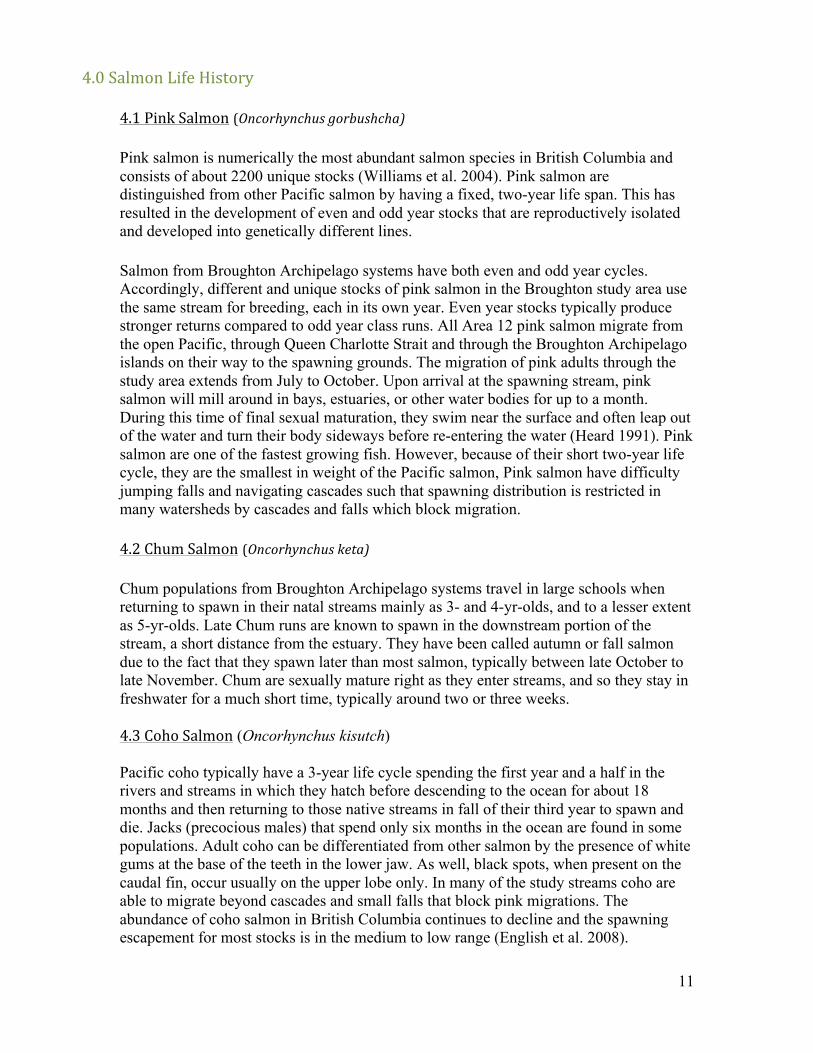
4.0 Salmon Life History
4.1 Pink Salmon (Oncorhynchus gorbushcha) Pink salmon is numerically the most abundant salmon species in British Columbia and consists of about 2200 unique stocks (Williams et al. 2004). Pink salmon are distinguished from other Pacific salmon by having a fixed, two-year life span. This has resulted in the development of even and odd year stocks that are reproductively isolated and developed into genetically different lines.
Salmon from Broughton Archipelago systems have both even and odd year cycles. Accordingly, different and unique stocks of pink salmon in the Broughton study area use the same stream for breeding, each in its own year. Even year stocks typically produce stronger returns compared to odd year class runs. All Area 12 pink salmon migrate from the open Pacific, through Queen Charlotte Strait and through the Broughton Archipelago islands on their way to the spawning grounds. The migration of pink adults through the study area extends from July to October. Upon arrival at the spawning stream, pink salmon will mill around in bays, estuaries, or other water bodies for up to a month. During this time of final sexual maturation, they swim near the surface and often leap out of the water and turn their body sideways before re-entering the water (Heard 1991). Pink salmon are one of the fastest growing fish. However, because of their short two-year life cycle, they are the smallest in weight of the Pacific salmon, Pink salmon have difficulty jumping falls and navigating cascades such that spawning distribution is restricted in many watersheds by cascades and falls which block migration. 4.2 Chum Salmon (Oncorhynchus keta)
Chum populations from Broughton Archipelago systems travel in large schools when returning to spawn in their natal streams mainly as 3- and 4-yr-olds, and to a lesser extent as 5-yr-olds. Late Chum runs are known to spawn in the downstream portion of the stream, a short distance from the estuary. They have been called autumn or fall salmon due to the fact that they spawn later than most salmon, typically between late October to late November. Chum are sexually mature right as they enter streams, and so they stay in freshwater for a much short time, typically around two or three weeks. 4.3 Coho Salmon (Oncorhynchus kisutch) Pacific coho typically have a 3-year life cycle spending the first year and a half in the rivers and streams in which they hatch before descending to the ocean for about 18 months and then returning to those native streams in fall of their third year to spawn and die. Jacks (precocious males) that spend only six months in the ocean are found in some populations. Adult coho can be differentiated from other salmon by the presence of white gums at the base of the teeth in the lower jaw. As well, black spots, when present on the caudal fin, occur usually on the upper lobe only. In many of the study streams coho are able to migrate beyond cascades and small falls that block pink migrations. The abundance of coho salmon in British Columbia continues to decline and the spawning escapement for most stocks is in the medium to low range (English et al. 2008).
12
5.0 DFO System Summaries 5.1 Ahta River (50°52'13.60"; 126°10'12.49"W) The Ahta River is a non-glacial watershed that drains into Bond Sound to the south through the Ahta Valley, which connects to the head of Kingcome Inlet to the north. The river has a total length of 12.2 km and opens into a lake of an area of 11.8 ha/km (English et al. 2008). There are steep falls at the 1.2 km mark prevent salmon passage. And so because spawning only occurs in this section of the river, our survey ended at the falls. This system is separated into 2 segments. The first is 600 meters and ranges from the estuary to the landslide area. A large pool under logs that have fallen across the stream marks its stop boundary. The Ahta has an estimated 4800 m2 of suitable spawning gravel (Williams et al. 2004). Gravel covers most of segment 1 and typically, instream walking is possible because the bankfull remains below 75%. The second segment begins at the shallow ripple zone following the landslide and extends to the steep falls (Figure 6). This segment is also 600 meters and the last 250 meters consists of fast flowing ‘bouldery; cascades that have a slight incline. Fewer pinks are observed in this section. The majority of the coho population can be observed in a large school below the falls, where they hold for most of the season. We surveyed the Ahta River a total of 8 times between August 12th and November 1st on average every 9-14 days. Pinks began moving up the system early in the season with schools of pinks being observed in the estuary in late July. A total of 16,450 pinks were counted during our first visit, which was cut short by 2 grizzlies feeding near the bottom of the cascades of segment 2. We observed the highest number of pinks September 3rd during our third visit (52,943). The numbers began to decrease from that point forward as did the number of jumpers observed during our 20-minute observation session of the estuary. A relatively low number of jumpers were observed in the estuary throughout the season, with the last 2 jumpers spotted on September 27th. The highest number recorded was 34, during our 4th survey, September 16th. Despite of the low precipitation during the first half of the season, the system remained healthy with water levels staying relatively stable and no mass mortality or algae blooms observed. The bankfull only increased above 50% on our 7th survey (October 23rd) following heavy rainfall. The high water velocity made instream walking impossible on this visit, which diminished visibility and decreased our efficiency to 30-40%. However prior to this point, water levels remained relatively low, which made for great viewing conditions, helping us maintain an efficiency of 85% or greater. The chum escapement was significantly lower than recorded in the past 2 years but comparable to 2011 numbers (Table 1). A total of 212 chums were observed during the season with numbers peaking at 69 on our 3rd visit, September 9th. The numbers observed during the rest of the season remained low, varying between 12 and 22 (Table 2). Considering that coho have a 3-year life cycle a comparison between escapements recorded in 2011 and 2014 is warranted. The peak coho count was lower in 2014 than in 2011, with numbers of 250 and 755 recorded respectively (Table 3). The 2011 crew recorded a total of 1551 coho in 6 visits while we recorded 930 coho in 8 visits. Visibility
13
under the falls between rotation 6 and 8 was nearly null which diminished surveying efficiency to less than 20%. We observed coho moving downstream from the falls between rotation 7 and 8 when they were ready to spawn. A total of 65 reddish coho were observed in the gravel flats of segment 2 on November 1st. 5.2 Viner River (50o47’259”N; 126o22’033”W) The Viner River drains a watershed with an area of approximately 25 km2. The river supports 9 km of fish habitat in the mainstream and tributary reaches that are accessible to coho, pink, chum, sockeye and steelheard salmon as well as cutthroat and rainbow trout (Ebell and Compton, 2005). Historically, the Viner River is known to have supported an abundance of salmonids (English et al. 2008). However DFO stock assessment data and local knowledge report significant declines in all Viner River salmon stocks in comparison with recorded historical escapements, especially in the case of chum (Ebell and Baxter, 2008). Impacts on fish habitat from natural slope instability have been compounded in much of this steep-sided drainage by logging and road construction And so a combination of both natural and human induced landslides has contributed to sediment loading in the stream channels resulting in a loss of fish habitat (Wise 2003). Additional impacts have resulted from the loss of riparian vegetation throughout much of the watershed. Water levels in the Viner river tend to go up and down quickly because the system is a floodplain and Viner lake which is quite small, is the sole body of waters draining into it. Because Viner becomes flooded easily, we tried to avoid conducting a survey immediately following heavy rainfall. Lakes stabilize discharge by buffering flood effects, thereby reducing stream bank erosion and bedload movement compared to systems with highly variable discharge regimes (Montgomery et al. 1996). Thus, studies have shown that spawning habitat quality and egg-to-fry survival can be relatively higher in lake-moderated systems than small or no-lake moderated systems (Chapman, 1988; Montgomery et al., 1996). We surveyed Viner 8 times from August 13th to November 6th, on average every 10-14 days. We found that the optimal surveying method for this system was to drive to the 14.5 km from Scott Cove, walk the upstream tributaries and then the downstream segments back to the estuary. This was not necessary on our first and last visit because no fish were expected to have moved up in the upper tributaries. Overall visibility remained good throughout the season. We were able to walk the lower reaches of the system instream for most of the season and did not notice any major siltation issues. The river was severely affected by the early season drought with portions of segment 1 being found nearly dry on September 17th (rotation 4). This is a concern because low water levels mean salmon are much easier prey for predators like bears, eagles and raccoons. Furthermore, low water levels lead to increased water temperature, which causes everything to grow faster including bacteria and algae. Filamentous green algae blooms plagued the system this season, persisting until September 30th (rotation 5). Brown algae also covered most of the spawning gravel habitat, but cleared by our next survey, once water velocity increased following a week of downpours.

14
Considering the strength of overall pink return in Area 12, the total Viner pink escapement was relatively modest. The total live pink count recorded in 2014 was comparable to 2012. However the system was surveyed 5 times in 2012 (compared to 8 in 2014). And so total observed counts do not provide a level basis of comparison. Peak counts are more revealing in this instance. The highest number of pinks recorded during a survey in 2014 was lower than the peak number recorded in 2012 (Table 3). In fact, Viner was the only system (asides from Gilford creek) that had a lower pink return than 2012. Interesting to note, is that despite of the low water levels, pinks migrated upstream in the system quite early, being observed at the bottom of segment 2 cascades during our first visit on August 13th. We walked from the estuary to the 14.5 km bridge where tributaries branch off during this first survey and observed 400 pinks holding in the large pool just before the cascades. Pinks were observed in upper tributaries on rotations 3-6 with numbers peaking at 83 on September 17th (rotation 4). We began to notice pinks phasing out while chums moved in on September 30th (rotation 5). Late chum runs are know to spawn soon after entering the system, relatively close to the estuary. On this visit, 80% of chums were paired up and actively spawning, predominantly in the lower reaches of segment 1. When we returned on October 14th, the system had transitioned into being populated by chums. We observed 351 live chums on this visit, which was the peak count this season. This was significantly lower than peak counts observed in the previous 3 years (Table 3). While the Viner River had the highest chum return of all systems surveyed, the total count of 573 was still considerably lower than observed during the past 3 years (Table 1). Coho in the Viner River are typically observed in the upper tributaries, under the bridge or spotted when they are migrating up to Viner lake. A total of 18 live coho were observed in 8 visits which is low, but nearly double the escapement recorded in 5-7 visits during the past 3 years (Table 1). 5.3 Scott Cove (50°45'59.17"N; 126°27'29.96"W) Scott Cove was surveyed a total of 8 times between August 20th and November 3rd on average, every 8 to 14 days. Coho and pinks moved into the estuary quite early with jumpers already being observed by the 3rd week of July. Schools consisted of mostly pinks until September 9th (rotation 3). Coho began to dominate at this point. The jumper frequency in the estuary was the highest during our very first 20-minute survey and decreased progressively until September 20th (rotation 4), when the last 6 jumpers were observed. Low water levels during the first half of the season made for good viewing conditions and permitted instream walking to the ‘PSF’ falls of the first segment (PSF: Pacific Salmon Foundation marked viewing point formerly known as ‘clothes line’). During our 4th survey, (September 20th) we encountered an unusual number of pre-spawn pink morts (51), in the first 20-meter stretch of the creek. Most of the morts were males and the rest pre-spawned females. The predator scars on the males made us suspect that a black bear (frequently seen that season) may have killed the males while searching for female roe. However the high water temperature (17.5oC) resulting from low water volumes cannot

15
be ruled out as a contributing factor. Having enough water in streams and rivers is important for keeping the water cool enough for salmon to thrive. Moreover, studies indicate that while pink salmon eggs and alevins can withstand a wide fluctuation in temperature, decreased survival and impaired development occurs at temperatures below 5oC and above 16oC (Sullivan et al. 2000; Murray and McPhail 1988). Lastly, seal predation is on the shortlist of potential mortality causes. A high number of seals were observed during the season, with as many as 28 counted on October 20th (rotation 7). Thankfully, salmon were no longer holding in the estuary at that point. Heavy rainfall finally came during the first week of October, increasing the bankfull to approximately 60% and decreasing our percent efficiency to 50%. The rains persisted until the end of the season and the bankfull increased to 100%. The high water velocity made it nearly impossible to observe fish along the first segment, such that our estimated observed counts became predominantly based on jumpers observed during our 20- minute counts at the PSF and 1.5km falls. Our 5th visit (October 3rd) marked our last observation of pinks (34) and chums (5) and also the last time we spotted coho jump at the 1.5km falls in segment 2 (Figure 8c). Also to be noted is that no morts were spotted from that point forward. The pink return this season proved to be very strong compared to numbers observed in the past 3 years. No pinks were observed in 2011 and 2013 and only 2 were counted in 2012. We observed the highest number of pinks on September 8th (rotation 3), with a total of 206 pinks seen fining in shallow pools along the first 50 meters stretch (Figure 8a). Our percent efficiency during this visit was relatively high (75%) because low water levels allowed us to literally count the majority of the fish in the school. Moving upstream, the population transitioned to coho with 121 observed holding in the pool beneath the PSF falls which only coho are able to jump. This number was also the peak number of coho recorded in this system. On this same visit, the highest jumper frequency of coho was also observed at 1.5km falls of segment 2, where 42 coho and 10 trout jumpers recorded. When comparing coho returns to the 3-year cycle run of 2011, numbers increased from 79 to 193. Remarkably, coho numbers were down from the 418 recorded last year, despite of a promising population return evidenced by the marine recreational catch in July and August. 5.4 Shoal Harbour (50o43’953”N; 126o29’472”W) We visited Shoal Harbour creek a total of 9 times from August 8th to November 2nd, on average every 8 to 13 days. We added a visit on September 29th, 6 days after the 4th rotation when heavy rain promoted fish movement up the creek following a period of sustained drought. The observed live pink counts varied between 10 and 29 prior to September 29th with our percent efficiency remaining above 80% due to low water levels and clear visibility (Figure 9a). Undercut banks were always examined by throwing rocks to detect fish that tend use this as holding habitat to protect themselves against predators. The majority of pinks in the first 4 rotations were observed in the large pool under logs that fell and settled across the stream during the 2011windfall. We were surprised to see that despite of low water levels, pinks were able to move past the windfall logjam. Indeed, 2 pinks
16
were seen holding in the dark deep pool past the windfall on September 8th (rotation 3). The water level past this point to was much too low to support fish (Figure 9b). While water levels rose in October, no salmon were observed in the 2 tributaries that branch off from the mainstream. And so all morts and live salmon were observed in segment 1. While the pink numbers dropped from 29 to 17 between the 3rd and 4th rotation, the jumper frequency in the estuary increased from 12 on to 218 on September 20th. A large school of 350-400 pinks were seen holding in the estuary, waiting on rainfall to move up on this visit. And 6 days later, the rain came and the school size holding in the estuary grew to 700. The school was made up mostly of pinks and approximately 150 chums, 30 coho. A total of 126 live pinks, 147 pink morts as well as 2 chums were counted in segment 1 on this visit. A total of 52 morts were pre-spawn pinks spotted in the first 10 meter-stretch of the stream. Most were males with predator scars, leading to the suspicion that a bear searching for female roe may have been to blame. Fresh bear scat was also spotted around the area. As previously mentioned, the rain persisted through the entire month of October and accordingly, pink salmon schools observed in the estuary continued to move up. During our following visit on October 5th we observed 367 pinks, which was the highest number recorded all season. We also counted 14 chums on that date but expected more given that approximately 200 were seen holding during the days prior. By the same token, we hoped to see significantly more chums during our 6th survey on October 13th. However we were disappointed with a final live count of 20 chums and 6 morts. Then again, our overall efficiency was low, set at 25% for this visit due to poor viewing conditions attributed to the high water velocity that forced a bandwalk survey (Figure 9c). And so the chum count with efficiency factored in was 80. Lastly, it should be noted that 8 seals were seen swimming in the estuary. And so seal predation may have contributed to the low chum count. All things considered, the 2014 pink escapement was stronger than 2012 with 687 live pinks counted in 9 visits compared to 212 counted in 6 visits during 2012 (Table 1). As for peak numbers, the 2014 count was roughly doubled than 2012 with 367 and 199 recorded respectively (Table 3). Chum numbers were the lowest recorded in 4 seasons with only 37 live chums observed in 9 visits. This is significantly lower than last year’s return of 307 chums observed in 7 visits. The coho escapement has remained inferior to 16 from 2019-2013 and this year was no different with only 3 coho observed during our 6th and 7th survey. 5.5 Gilford Creek (50o39’555”N; 126o23’009”W) We surveyed Gilford creek 7 times from August 17th to November 8th, on average every 12 to 15 days. Harsh weather prevented boat travel during the 3rd week of October, forcing us to leave out a rotation. The low water volumes and velocity in the first half of the season improved our efficiency, as we were able to walk instream by jumping from rock to rock while disturbing undercut banks to detect fish. The first segment of this system consists of continuous cascades that flow at a moderate incline, intermixed with some dark deep pools. Viewing conditions became literally null from the beginning of October until the end of the season after significant rainfall led to high flow conditions.
17
We saw no signs of fish after our 5th visit on October 4th. At this point, we became reliant on spotting jumpers at set viewpoints. Evidently, visual surveys can be useful to count pinks early in the season when water levels are still low. However, visual surveys were not an efficient surveying method for coho because their tendency to hide in dark pools made it nearly impossible to spot them and obtain an accurate estimate of the population. Very few jumpers were observed in the estuary this season, with 18 being the highest count recording during our 20-minute season of September 22nd. It should also be noted that the majority of jumper counts were from the same fish jumping successively. The wildlife activity in the estuary was relatively quiet with few eagles and gulls seen throughout the season. Also interesting, was that no signs of morts were detected this season. We did see an abundance of fresh bear scat and a mother with 2 cubs during our first visits as well as 2 larger sized male bears later on that season. Gilford is known as a coho system. However with a total escapement of only 5 coho recorded the entire season, it is fair to say the population is struggling to sustain itself. Coho typically have a 3-year life cycle. And so numbers dropped from 2011 when 16 was the total count recorded. All coho were observed in deep pools of the first segment. No coho were seen during our 20-minute observation at the ‘blue-taped’ falls of segment 1. Likewise, no fish were seen in segment 2, which begins at the 1.5km mark accessible by the logging roads. We conducted a 20-minute observation bridge and walked approximately 300 meters upstream and downstream from the bridge but did not see any signs of live fish of morts this season. Gilford creek was the only system that had a lower pink return than observed in 2012 (2-year even life cycle). The peak pink count in 2014 was observed on September 22nd with a total of 40 fish counted along the first 150 meters of segment 1 cascades. Comparatively, the peak observed pink count in 2012 was 91, recorded September 11th
(Table 3). The low water levels made for good visibility and relatively high observation efficiency in the first half of the season. The total pink escapement observed in 2012 during 5 visits was higher than the total observed count of 2014 with 142 and 63 pinks recorded respectively. 5.6 Embley Lagoon (50o56’984’N; 126o52’819”W) Embley is a non-glacial watershed that opens into Huaskin lake, which has an impressive area of 441.7 ha/km (Williams et al. 2004). The distance from the estuary to Huaskin Lake the river is 4.8 km. Embley is the longest and also the most challenging system we surveyed. Early on in the season, it was our goal to reach the lake. However the absence of a trail at an approximate distance of 3.5 km made it impossible to do so. We reached the 3.8 km mark from the estuary, which can be landmarked by an old train trestle. The last 300-meter stretch must be walked instream, meaning that water levels must be sufficiently low. Embley is currently delineated into 5 segments. Segment 1 covers the fish ladder area as well as the entry channel parallel to it. The fish ladder was built in 1962 by DFO as part of an enhancement project. There are 5 main levels to the ladder all with deep dark holding pools. However salmon are only partially visible in a single holding pool.

18
Segment 2 ranges from the top of the fish ladder to a log bridge. This log bridge should be used to cross the creek at this point. Segment 2 habitat consists of a murky slow flowing stretch of river with poor spawning gravel. Segment 3 is similar to segment 2. There is a significant landslide at the beginning of segment 3 that blocks a portion of the creek and trail. This decreased the percent population inspected, because the creek was not visible from the trail for a stretch of approximately 250 meters. Segment 4 covers a side tributary that veers into a U back to the bottom of the steep cascade portion of the creek. This marks the beginning of the 5th segment. The tributary of segment 4 has good spawning gravel but remained dry until our 5th survey on October 1st. Segment 5 consists of a steep cascade portion that are passable by pink salmon, followed by a beautiful stretch of flat gravel which transitions into a ‘bouldery’ cascade stretch at the 3.5 km mark. Salmon densities drastically declined past this point, because the habitat was not as suitable for holding or spawning. Huaskin Lake is the stop boundary for segment 5 and salmon do travel and spawn all the way to the lake. We surveyed the Embley River 8 times from August 15th to November 9th on average every 11 to 14 days. During our first visit, we were astounded by the wildlife activity in the estuary. The jumper frequency remained very high throughout the season and peaked on August 27th, when 9050 jumpers were recorded during our 20-minute session. The schools of fish observed in the estuary during our first 3 visits ranged from 15,000 to 25,000. School sizes progressively decreased from thousands to hundreds in the following weeks. Unusual, was the fact that we observed a school of approximately 80 pinks as late as October 26th when we conducted our 7th survey. We also counted as many as 85 eagles perched in trees of the estuary on that date. Other interesting wildlife encounters included the sighting of a large black bear feeding on morts of segment 5 during our first survey. This was an indicator that pinks had likely travelled quite far into the system, quite early. Also unusual was the number of pink jumpers observed in the river. Indeed, pinks were jumping like firecrakers throughout the entire along the first 3 segments of the river. Finally, during our 3rd survey we nervously encountered a grizzly mom with 2 cubs playing in the river. Grizzly scat was also spotted in subsequent visits. Undisputedly, the pink salmon escapement was impressive this season. We counted a total of 274,597 pinks in 8 visits and found ourselves overwhelmed by the density of pinks observed. This would have been a case where a drone would have been needed to accurately survey the population from the estuary to the lake. The stock return was significantly higher than numbers recorded in 2012 when 13,067 pinks were observed in 6 visits. The peak count was observed on our 3rd visit (September 9th) with 109,283 pinks recorded in a 3.1 km stretch. School sizes of 2000 pinks were observed in nearly every 50-meter interval, with the exception of the steep cascade portion (segment 5) where schools of 100-200 were observed in small side pools. It was quite impressive to witness the motivation of pinks climbing the steep cascades on their quest to reach the upper stretch of gravel habitat. The pinks in this system were generally healthy looking and remarkably larger than pink populations from other systems. Furthermore, spawning began later than they seemed to in other systems. The majority of pinks did not begin spawning until mid-October nor did they develop spawning traits before that time. As for the chum and coho returns, numbers were low with 16 chums and 3 coho counted in 8 visits. M.E.S.S.S began surveying Embley in 2012 and so we lack the escapement
19
data prior to 2012. While chum numbers were comparable to those observed in 2012 and 2013, the total number of coho observed was significantly lower than recorded in those same years (Table 1). The high density of pinks likely decreased our observation efficiency for coho making it more challenging to spot them amidst dense pink schools. It is also probable that coho travelled directly to the lake, not holding very long along the river. This would have further decreased our observation efficiency. The system was generally healthy looking although it did suffer from the lack of precipitation in the first half of the season. Low water levels and flow is concerning because it causes water temperatures to warm up which enables diseases to propagate more quickly. The water temperature remained well above the normal range for spawning and was 18.5oC on our first visit. It reached a high of 19.5oC on September 7th, which coincided with the highest pink density of the season (rotation 3). Although we did not measure dissolved oxygen levels, it is clear that the high density of pink salmon contributed to a decline in oxygen levels. Furthermore, warmer water also doesn’t allow for as much oxygen to dissolve. This causes a problem called hyperoxia for salmon. The combination of stress on salmon’s metabolism and lower oxygen levels weakens the salmon’s immune system, making them more susceptible to parasites and diseases. The combination of conditions explained above had a severe impact on the pink population, and on September 18th (rotation 4), we were horrified to find a mass mortality event in the first 3 segments of the stream. The entry channel of segment 1 was completely dry and a total of 550 pre-spawn morts were counted in a stretch of less than 20 meters. Schools of morts in segment 2 and 3 were so prominent that we found ourselves counting schools of morts instead of schools of fish. A total of 3638 pre-spawned pink morts were recorded in these slow flowing segments. This slow flow and low oxygen mixing likely contributed to the death of salmon schools that were in holding mode. The total pink mortality recorded on this visit was 5482 and we believe that this is likely an underestimate. During our 6th visit to the system (October 15th), we noticed that quite a few pinks had boil like lesions on the skin and musculature that were not predation related. We learned that this was a clinical symptom of salmon with furunculosis, which is caused by the bacterium Aeromonas salmonicida. The disease is named after the raised liquefactive muscle lesions (furuncles) that can sometimes be seen in chronically infected fish. However it is believed that in acute outbreaks fish may die rapidly with few signs (Hastings, 1988). The major route of transmission appears to be via infected fish and contaminated water (Hastings, 1988). Aeromonas salmonicida is more likely to occur in smolting and spawning fish with the onset of higher water temperatures in spring or during periods of rapid temperature change. After reporting these findings to the M.E.S.S.S. board, we were asked to conduct disease testing for Alexandra Morton on our subsequent visit. The Salmon Coast Field Station Society (SCFSS) equipped us with a disease testing kit, and we were able to collect tissue samples from 2 pinks. These were masterly captured by Coady Webb (SCFSS) from a school of 80 fish in the estuary. Interestingly, Coady pointed out that most of pinks in the school appeared to have suspicious lesions.

20
6.0 M.E.S.S.S. System Summaries 6.1 Wahkana (50°48'58.69"N; 126°18'0.54"W) Wahkana creek empties into Wahkana bay, which indents the south side of Tribune Channel, between Clam Point and Irvine Point. We surveyed this system 6 times, from September 3rd to November 1st. We were fortunate to be able to walk instream until nearly the end of the season. This significantly increased viewing conditions and overall efficiency. The trail in the first segment was practically inexistent such that we would have missed a considerable number of fish hiding in undercut banks if water levels had been higher. We were able to clear the trail over several visits and create openings close to the creek to permit efficient viewing. During our first visit, we were elated to see a school of 500 pinks in the estuary as well 42 jumpers within our 20-minute observation period. We observed the largest school of pinks in the estuary on our second survey, September 16th, when 950 pinks separated in 2 schools were spotted. This was a sight filled with promise and just as we had hoped, the pink escapement in Wahkana was the largest observed in several years, with a total live of 944 pinks recorded in 6 visits. The peak pink count of 442 was recorded on September 27th. With an efficiency set at 85% the total estimated count for this visit amounted to 520 pinks. A total of 98 morts were also counted on this visit with low pre-spawn mortality noted. Spawning noticeably began to be observed on this visit with 13 redds counted. All pink spawning occurred in segment 1 which consists of an 800-meter long channel that has slow flowing water, great gravel relatively shallow areas as well as 2 long dark pools. There is a beaver pond at the 800 meter. We cut through the forest to reach segment 2, which consists of 300-meter stretch of boulder rapids that stop at the falls The pink escapement recorded this year represents a considerable jump from 2011-2013 escapement numbers, which oscillated between 8-10 pinks observed in 1-3 visits. While the total number of pinks recorded in 2010 was slightly higher than 2011-2013 numbers, the crew visited the system 5 times, such that relatively speaking the population return of 26 pinks was not necessarily higher. As for chum and coho, the total live counts were 13 and 16 respectively. We spotted a single coho in segment 2 this season and no pinks or chum in this segment. 6.2 Simoom Sound (50°45′10″N; 126°29′35″W) We surveyed Simoom creek 5 times this season, from September 21st to October 24th. Our first visit was a root jam-clearing mission that was recommended by Billy Proctor. The purpose was to clear a water pathway to allow salmon to move upstream into the segment 2 of the creek. On this first visit, we were welcomed by a large school of 600 pinks holding in the estuary. One chum and 2 coho were also spotted in that school. The water flow of the creek was very low and only 3 pinks were observed in the first few meters of the creek. We physical cleared the root jam removing several logs and branches to enable water circulation. This led to an instant rise of water flowing into segment 1. We visited the creek 7 days later on October 5th. We were happy to see 109 pinks actively moving up in the first segment of the stream, as well as 93 pink morts and a black bear on
21
the left bank. The first segment of the creek is 300 meters long and consists of ‘bouldery’ cascade habitat that flows on a slight incline. Despite of the lack of flat gravel areas, all pinks spawned in this segment. During our 3rd survey 10 days later, we observed 230 pinks. This was the peak number observed this season. We also saw 1 sockeye in the pool below the root jam of segment 1. It had notably been seen holding in the estuary during our previous survey. We also began clearing a trail along the creek during our 3rd visit and invested considerable effort looking for salmon in segment 2. We walked both tributaries, exploring the right tributary relatively far, approximately 200 meters past the pond. There is great gravel in this tributary however the water level remained much too low for salmon to safely spawn in the habitat. Ultimately, only 2 pinks were spotted in segment 2 directly above the root jam. The numbers observed dropped quickly during our last 3 surveys with no fish observed during our last 2 visits. With a total escapement of 372, the pink population return was remarkable this season. This system was not surveyed in 2012 or 2013. No fish were observed in 2011 and only 5 pinks were counted during the 2010 season. As for chum and coho, none were observed in the system this season. 6.3 Maple Cove (50°40′837″N; 126°27′881″W) We surveyed Maple Cove creek a total of 4 times this season, from August 29th to October 19th. No signs of fish were observed during our first visit because the creek was too dry to provide suitable holding habitat. The trail along this creek is severely overgrown with salmon berries and several fallen logs create barriers along the way. The first segment is 800 meters long with an end boundary delineated by a decommissioned bridge. The forest on either side has been clear-cut, leaving behind a poor buffer zone. There is an overload of fallen logs every few meters along the creek. These do not block access to fish and do create shade as well as camouflage habitat. However they pose a considerable challenge to instream surveys. There is magnificent spawning gravel throughout this segment and deep holding pools for fish to hide along the way. During our second visit on September 22nd, we observed 26 live pinks and 6 morts. The number of live pinks observed during our 3rd survey, October 4th climbed to 30, including 2 spotted in segment 2 past the decommissioned bridge. We also counted 15 morts on this date. No fish were observed on our last visit, October 19th such that the total escapement recorded this season was 56. Zero fish were observed in Maple Cove in 2012 and 2013. However the 2011 crew did observe a total of 4 live pinks while the 2010 crew recorded a total of 28 live pinks and 1 chum during a single visit on September 28th. Note that the 2010 crew visited Maple Cove 4 times, as did we. While no fish were recorded in the even year run of 2012, the crew only visited the system once. Accordingly, the pink stock may not have been fully assessed. 6.4 Sir Edmund Bay (50°50'2.67"N; 126°37'11.85"W) Sir Edmund creek is short, narrow and shallow creek located in Penphrase Channel. It has a total length of 300 meters and is bordered by a steep bank that is approximately 1.5-
22
meter high with a clear trail on both sides. While the creek tends to dry up easily, it has great spawning gravel and good undercut banks that fish can use to shelter themselves from predators. We conducted 3 surveys of Sir Ed creek during our return trip from Carridean creek between September 28th and October 22nd. The estuary consists of a narrow channel and is quite murky and dark. While the visibility was poor, we did see a school of approximately 140 pinks as well as 1 coho during our first visit on September 28th. We also surveyed the estuary on September 20th and notably saw 1 chum and a school of 200 pinks. These were the only schools spotted all season. While the creek was nearly dry with only a trickle of water on September 28th, there was a lone female pink holding in the first few meters of the creek as well as 8 morts in the estuary and 6 morts on the creek banks. We also saw fresh bear tracks and scat. On our second visit followed significant rainfall and resulted in the observation of 12 live pinks as well as 20 morts. The water levels were significantly higher and our efficiency was approximately 75%, making for an estimated count of 16 pinks. This was the peak count observed this season and no salmon were observed during our last visit, October 22nd. Like Simoom Sound, this system was not surveyed in 2012 and 2014. No fish were observed from 2011 and only 2 pinks was recorded by the 2010 crew. 6.5 Carridean Bay (50°54'40.66"N; 126°54'33.45"W) We surveyed Carridean creek a total of 4 times from September 28th to October 31st. There were no fish remaining in the estuary on October 31st and so we deemed it unnecessary to conduct a 5th survey because we would have been counting fish already counted during our last visit. We surveyed the estuary of this system on September 20th and were astounded to see a school of approximately 10 000 pinks lining the shore 100 meters along the estuary. We were unsure whether this was a population native to this creek or if salmon were only temporarily holding in the estuary. When we returned on September 28th, the estuary was still very active with the school size estimated at 3500. We also noticed a relatively high number of pink morts lining the ocean floor (450). Walking up the creek, we were pleased to see that pinks were actively moving up despite of extremely low water levels. The lack of water created a barrier to fish approximately 100 meters upstream due to a vertical stack of rocks that created a steep cascade. The live pink count up to that point was 186. We also recorded 245 morts and a 30% ratio of pre-spawn mortality. The live pink count rose sharply on our second visit (October 8th), which followed heavy rainfall that allowed salmon to move past the steep cascade mentioned above. We walked up to the landslide pool 800 meters upstream on this visit and observed a total of 1780 live pinks, 6 coho as well as 92 morts. The landslide occurred in 2010 and considerably changed the topography of the creek at this point. During our subsequent survey on October 22th, the bankfull had risen to 100% making it impossible to walk instream. Unfortunately, the trail was completely overgrown, which made for extremely challenging viewing conditions. As a result, we spent a considerable amount of time clearing the trail from that point forward. Once again, time constraints forced us to stop our survey at the 800-meter mark. We remained unsure if salmon were able to move past the landslide blockade. The total live count on this visit was 1610 pinks and 45 morts. We
23
were able to hike above the landslide on our last survey and were absolutely astounded by the density of fish observed in the flat narrow channel of this second segment. Because of time constraint, we turned back 150 meters short of Rosemary Lake. The total live count on this visit was 869 pinks in segment 1 and 850 pinks in segment 2. Given that we did not survey the population past the landslide on previous visits, we estimated that the percent population inspected during our 2nd and 3rd survey was 75% and 50% respectively. The total pink escapement for Carridean this season was 5295 (observed count). However when considering both percent efficiency and the percent population inspected the total estimated count was 9941, which is nearly double. The 2012 and 2013 crews surveyed this system once and observed no fish while the 2011 crew visited the system twice with no signs of fish observed either. On the other hand, the 2010 crew surveyed Carridean a total of 4 times and had better success recording 98 live pinks and 2 coho during the season. 6.6 Mini-‐hump Creek Mini-hump Creek is 850 m in length and connects Townie Lake to Loose Lake. It can be accessed at the 4km mark from the Scott Cove main logging road. Human impacts on the stream have been extensive. A wooden weir at the lake outlet was used to drive a log flume at one time. A log camp was reputed to exist along side the stream for some years. Despite the numerous impacts to the headwater lake and stream, fish habitat conditions in the stream are stable and functioning. Gravel sites do exist within the mid reach of the stream offering some excellent spawning opportunities. Sand is the dominant substrate throughout much of the stream. Large woody debris (LWD) is abundant in the stream. A young forest approximately 30 years in age is thickly established along the stream. The thick forest cover provides little daylight exposure to the stream and banks. The heavy shading limits understory growth and is likely limiting primary productivity. We surveyed Mini-hump creek a total of 4 times from October 3rd to November 3rd. This system provides spawning ground for coho and mini-hump salmon. Results from genetic samples taken by M.E.S.S.S. in 2010 reveal the dwarf sardine-like salmon as a rare strain of sockeye. Contrary to other anadromonous salmon, it is believed that mini-humps do not die after spawning choosing instead to returning to Loose Lake. During our first visit, we were delighted to see 9 coho that had moved up from Loose Lake and were holding at the beaver dam barrier under the first road bridge. We wondered if the beaver dam was a barrier to salmon. We returned 5 days later, following heavy rain and cleared a few of the surface branches and logs to permit access. During our next visit on October 11th, we saw 3 coho hiding under large logs in the last half of the creek that follows the fast flowing cascade portion of the creek. We were surprised to count 118 mini-humps on this visit given that records from previous years revealed that mini-humps generally were not observed before 3rd week of October. We also saw 4 pre-spawn morts in the first 50-meter stretch of the creek during this visit. The total mini-hump escapement recorded in 4 visits was considerably lower than observed in 2011 and 2013 (Table 1). A total of 449 were the observed this season while
24
1236 mini-humps were recorded last year in only 2 visits and 1023 mini-humps were recorded in 2011. However this year’s total observed count was higher than the escapement recorded in 2012 when only 122 mini-humps were recorded in 3 visits. We do believe that we may have missed the peak of the return this season as a result of not being able to survey the creek between October 19th and November 3rd. Unfortunately the M.E.S.S.S. truck broke down on October 20th and Dave Parker’s re-occurring knee injury prevented him from walking to the creek during that period. Ultimately, we believe that our total mini-hump count may be an underestimate. 6.7 Loose Lake Creeks Unfortunately we were only able to survey Chris Bennett, John Lewis, Connector and Loose creek twice on October 3rd and October 16th due to mechanical issues that sidelined the truck on October 20th. The Loose lake systems are accessed via the Scott Cove camp and must be driven to. This was ill fated given that the breakdown came at the typical peak of Coho returns. Furthermore, we were looking forward to potentially seeing coho spawn in the gravel that was added to John Lewis, Chris Bennett and the Connector systems during habitat restoration efforts at the end of the summer. While we saw no live salmon in these systems we did see 1 coho mort in Loose creek on October 16th. It had a large predator scar and seemed to have been freshly killed by an eagle. We also saw coho jumpers at the entrance of Loose creek at the mouth Loose lake on our earlier visit. Note that Loose creek can be accessed by a beautiful trail bordering a tributary of the main creek approximately 500 meters ahead of the bridge. Billy Proctor mentioned to us that coho had previously been observed in this tributary. Overall, the Loose lake systems were generally healthy. However we did find the pH was quite acidic and below the desired range. The measured pH range on October 16th was below 5.2 for all systems. Most notably, the pH in Connector creek was 4.7, which is the most acidic level measured all season for all creeks surveyed. As such, these systems could possibly benefit from lime additions as previously proposed by the M.E.S.S.S. board.
7.0 Comments
7.1 Highlights
• Remarkably strong pink escapement recorded in all pink systems (except for Viner) with notably high returns recorded Embley creek, Carridean creek, Wahkana, Simoom sound and the Ahta river.
• Very disappointing chum escapement for all systems. • Season characterized by a severe lack of rain and the lowest water levels recorded
in years. This was followed by heavy rainfall beginning during the first week of October and persisting until the end of the season.
25
• Mass mortality event in Embley brought upon by low water levels, hypoxia and high water temperatures as well high predator related mortality in Shoal Harbour, Scott Cove.
• Severely dry conditions observed in the Viner River in August and September accompanied by prominent blooms of green filamentous algae and brown algae covering the spawning gravel.
• Embley: High density of schools recorded in the estuary throughout the season; and late spawning observed compared to other systems.
• Mother grizzly and 2 cubs observed in Embley (survey #3), 2 grizzlies observed in the Ahta (survey #1), grizzly scat observed in Viner (survey #1).
7.2 Hurdles
• The M.E.S.S.S. truck was plagued with mechanical problems on October 20th and declared to be out of commission indeterminately. This cut short surveys of Loose Lake system during the peak coho return period. It also prevented us from surveying Billy Proctor creek.
• A re-occurring knee injury forced Dave Parker to miss part of the season. Fortunately, experienced stream walkers were available to fill in, bringing along with them new and valuable perspectives.
• Challenging weather and winds in mid-October prevented boat travel to Gilford Island. This forced us to miss a visit, meaning that we surveyed the system 7 times instead of 8 times as prescribed by the DFO contract.
• The 5th segment of Embley begins at the bottom of the cascades and ends at Huaskin Lake (4.8km). However an overgrown trail 3.5 km away from the lake made it impossible to reach the lake. Pinks were still observed beyond that point which made it was challenging to estimate the percent total population observed given our uncertainty of the type of habitat was ahead. The absence of a clear stop boundary for this system was a challenge for us.
• Severely overgrown trail conditions particularly in M.E.S.S.S. creeks created challenging surveying conditions. Significant trail clearing was conducted in Carridean, Wahkana, Simoom Sound and on the Gilford logging road along the 1.5km stretch to reach the bridge of segment 2.
8.0 Recommendations 8.1 Trail Work Notable efforts were made to improve the status of system trails this season. Dave Parker completed trail building in Simoom Sound, Carridean and Wahkana. Previous crews had not visited these creeks on a frequent basis resulting in overgrown trail conditions. Trail clearing was also completed on the logging road to Coyote tributary and in both the Viner and Ahta Rivers. It is a challenge to combine trail work with salmon enumeration efforts. And so we highly recommended the implementation of a trail building contract in August, prior to the beginning of fall enumerations. Loose creek, John Lewis and off-road portions of Chris Bennett creek would benefit from chainsaw-based trail building as
26
nearby access to creeks is for the most par inexistent. We also recommend the continuation of chainsaw trail clearing in Carridean and Maple Cove. Ultimately, all systems will necessitate basic trail clearing next season with Shoal, Scott Cove, Embley and the Ahta being the lowest on the priority list. 8.2 Equipment As recommended by the 2014 crew, significant improvements were made to the M.E.S.S.S. surfer. Indeed, seats and see-through windows were installed which made for a much-improved boating experience. Potential upgrades for next season could include a windshield wiper, a heavy anchor and mounted GPS. We were unable to resolve the compatibility problem that seemed to prevent the chip from displaying maps on the handheld GPS. As such, the device which is brand new should be returned to the Garmin manufacture for repair. Also, This year’s crew did not use the M.E.S.S.S. waterproof camera as the cord to charge and download photos from the unit is missing. A new cord should be acquired. Ted Emmonds may be able to provide compatibility details, as he owns the same brand of camera. Furthermore, the truck is currently out of commission. Depending on the ultimate cost of repairs, M.E.S.S.S. should investigate the option of trading in the current truck for a used model with a higher bottom clearance. Last and not least I would highly recommend that M.E.S.S.S. invest in a “72HR” survival kit for the surfer. 72HR is a company that puts together professional marine and field survival kits. I received one for Christmas and was genuinely impressed by the quality and completeness of the kit. I suspect that putting together a homemade kit may not be as cost effective when time investment is factored in. (http://72hours.ca/) * 8.3 Gilford Gilford creek can no longer be accessed via logging roads and can only be travelled to by boat. The transit time is at least an hour depending on weather, which can pose a considerable challenge due to the nature of winds and currents coming from Knight inlet. And so our visits were constrained by weather and often not cost-effective given that high water levels in the creek during the latter portion of the season made it impossible to spot coho through visual surveys. A better avenue may be to install a salmon counting fence or to conduct fry surveys in the spring using traps. First Nations has expressed interest in taking on the enumeration of Gilford creek. M.E.S.S.S. came to the agreement at the last AGM meeting that this would be a logical and more cost-effective course of action. The trail to Coyote Lake (segment 3) is now severely overgrown and the 2015 crew should budget at least an extra day to clear it. The 2012 crew was successful in seeing coho along this tributary and so it would be worth the time investment. 8.4 Consistency Given the subjective nature of visual surveys and the variable nature of salmon estimates associated with having different crews conducting enumerations each year, it would be beneficial to take consistency into account when hiring crews. The high turnover of crew

27
members is detrimental to the consistency and accuracy of the data. Moreover, an effort should be made to conduct a fixed number of surveys for each system in order to improve the comparative potential of the data. 8.5 Segment delineation The determination of system segments are based on differences in habitat types. Segment delineation updates should be made to Shoal Harbour, Carridean Bay and Embley. Shoal Harbour: A windfall in 2011 had significant instream impacts and created 2 distinctively recognizable habitat types before and after the windfall. Segment 1 is delineated from the estuary to the bridge that reaches Bridie Lake. However we recommend that the stop boundary of segment 1 end at the windfall as the habitat type changes from inclining cascades to slow and shallow flowing waters with some deep pools past that point. Accordingly, the pool just past the windfall would be start boundary for segment 2 and the bridge to Bridie Lake would be the stop boundary. Segment 3 would then become the tributary that veers to the left where the creek splits, to the logging road that is typically used to walk back to the estuary. As a side note, an additional recommendation should be made regarding safety considerations to be taken when planning to survey Shoal Harbour. Because of its proximity to Echo Bay, crews often choose to visit this creek when others cannot be travelled to because of high winds. However the system should not be surveyed when gale wind warnings are in effect. There are clearcuts bordering the creek and this has significantly diminished the wind buffer zone along the creek. The small riparian area have trees that swing back and forth and many seem to be near the threshold of falling down. Fallen trees in the creek were noticeably seen on at 4 different occasions this season. Carridean: A massive landside in the fall of 2010 significantly impacted the groundwater flow at the point of impact. It is recommended that the landslide delineate the end of segment 1 at the 1 km mark. The habitat type in this section consists of a relatively steep ‘bouldery’ cascade with an approximate incline of 40%. There is a nice pool just prior to the landslide where a large school appeared to hold because they were bottlenecked by a high mountain of trees that blocks the creek. However there is a narrow passage that allows salmon to move through beyond the landslide. The pink density increased beyond the landside, which is quite steep and must be hiked to reach the other side. We recommend that this be the start boundary of segment 2 and that Rosemary Lake, 1 km away be the stop boundary. The stream at that point consists of narrow channel with slow flowing water and good spawning gravel. Embley: As previously mentioned, the last and 5th segment of the Embley river consists of a steep cascade portion followed by a beautiful stretch of gravel along a flat, narrow channel of slow flowing water. Pink salmon densities were high in this stretch. This channel then transitions into a flat boulder cascade stretch at the 3.5 km mark. When we walked past that point, salmon densities drastically declined because the habitat was not as suitable for holding or spawning. And so, there are at least 3 very different habitat

28
types in this segment. It is therefore recommended that this segment be broken up into 3 additional segments such that the creek would be broken up into a total of 8 segments. As a side note, it should be mentioned that 2012 and 2013 crews accessed segment 5 from Clayton bay, which is an hour hike away. And so they surveyed this creek in 2 days. We found that hiking from the estuary to the bottom of segment 5 takes nearly the same amount of time and therefore saw no benefit in detouring from Clayton Bay. Especially given the fact that we observed a consistent abundance of salmon all along the way. While it makes for a long day, it entirely possible to survey this creek in one day and reach the end of the trail at the 3.5 km mark. Even when the system is stocked to the brink with fish. 8.6 M.E.S.S.S. Survey Program Somewhere along the way the enumeration of M.E.S.S.S. systems became labeled as being volunteer work. While it should be a priority to meet the contract obligations of DFO systems, M.E.S.S.S. creeks should be enumerated with equal focus and effort. Given that M.E.S.S.S. now subsidizes the salary of the crew, the enumeration of these non-DFO systems should be considered to be part of the season’s mandate. Furthermore, a survey program should be established at the beginning of the season with the guidance of M.E.S.S.S. board members. Depending on the strength of runs on a given year, clear objectives on the specific creeks to be surveyed and the number of visits should be set by the crew and submitted to M.E.S.S.S. for approval. 8.7 Survey Timing There is no set start time for conducting M.E.S.S.S. surveys. And so the hired crew should survey M.E.S.S.S. creek estuaries, looking for schools of fish during the first few weeks of the season. We based the beginning of our surveys on the presence of fish in the estuary. We tried to visit creeks that had fish in the estuary immediately following heavy precipitation events or large tides knowing that fish movement upstream is promoted by these events. We then followed up with surveys every 7 to 14 days until fish were no longer observed. We found this to be an effective method for establishing the survey timing of M.E.S.S.S. creeks.
29
REFERENCES Chapman. D.W. 1988. Critical Review of Variables Used to Define Effects of Fines in
Redds of Large Salmonids. Transactions of the American Fisheries Society. 117: 1-21. Ebell, J. and B. Baxter. 2008, Viner River Watershed Restoration As-built Report and
Effectiveness Evaluation 2007. Prepared for International Forest Products Ltd. 24pp. Ebell, J. and A. Compton. 2005. Viner River Watershed Restoration As-built Report and
Effectiveness Evaluation 2005. 15pp. English, Karl K., Gordon Glova, and Anita Blakley. 2008. An Upstream Battle: Declines
in 10 Pacific salmon stocks and solutions for their survival. Prepared for David Suzuki Foundation.
Hastings, T. S. 1988. Furunculosis vaccines. In: Fish vaccination (Ed. A. E. Ellis) pp93-
111 Academic Press. Montgomery DR, Buffington JM, Peterson NP, Schuett-Hames D, Quinn TP. 1996.
Stream-bed scour, egg burial depths, and the influence of salmonid spawning on bed surface mobility and embryo survival. Can J Fish Aquat Sci 53:1061–1070.
Murray, C.B., and J.D. McPhail. 1988. Effect of incubation temperature on the
development of five species of Pacific salmon (Oncorhynchus) embryos and alevins. Can. J. Zool. 66:266-273.
Sullivan K., D.J. Martin, R.D. Cardwell, J.E. Toll, and S. Duke. 2000. An analysis of the
effects of temperature on salmonids of the Pacific Northwest with implications for selecting temperature criteria. Sustainable Ecosystems Institute. Portland, OR. 147 pp.
Williams, I., Groot C. and L. Walthers. 2004. Possible factors contributing to the low
productivity of the 2000 brood year pink salmon (Oncorhynchus gorbuscha) that migrate through the Broughton Archipelago, B.C. David Suzuki Foundation.
Wise, M. 2003. Sediment Source Survey Viner River Watershed Central Coast forest
District report by Geo Wise Engineering for Streamline Environmental Consulting Ltd.