melbourne cbd - knight frankcontent.knightfrank.com/research/305/documents/en/...highlights research...
TRANSCRIPT
HIGHLIGHTS
RESEARCH
MELBOURNE CBD OFFICE MARKET OVERVIEW SEPTEMBER 2017
New supply in the Melbourne CBD office market will be significantly constrained over the next 12 months, with vacancy projected to fall to 10-year lows by mid 2018.
Strong employment growth across Victoria has supported above average levels of net absorption, with the Melbourne CBD recording the highest volume nationally in the 12 months to July 2017.
Strong investment volumes have been recorded in the year to date with $2.2 billion transacted, 12% above the 2016 total. Offshore purchasers have accounted for 56% of total sales.
2
KEY FINDINGS
CBD total vacancy fell from
7.1% to 6.5% in the 12 months
to July 2017, the lowest level in
four years.
The CBD recorded the
strongest net absorption figure
nationally, totalling 128,389m2 in
the 12 months to July 2017.
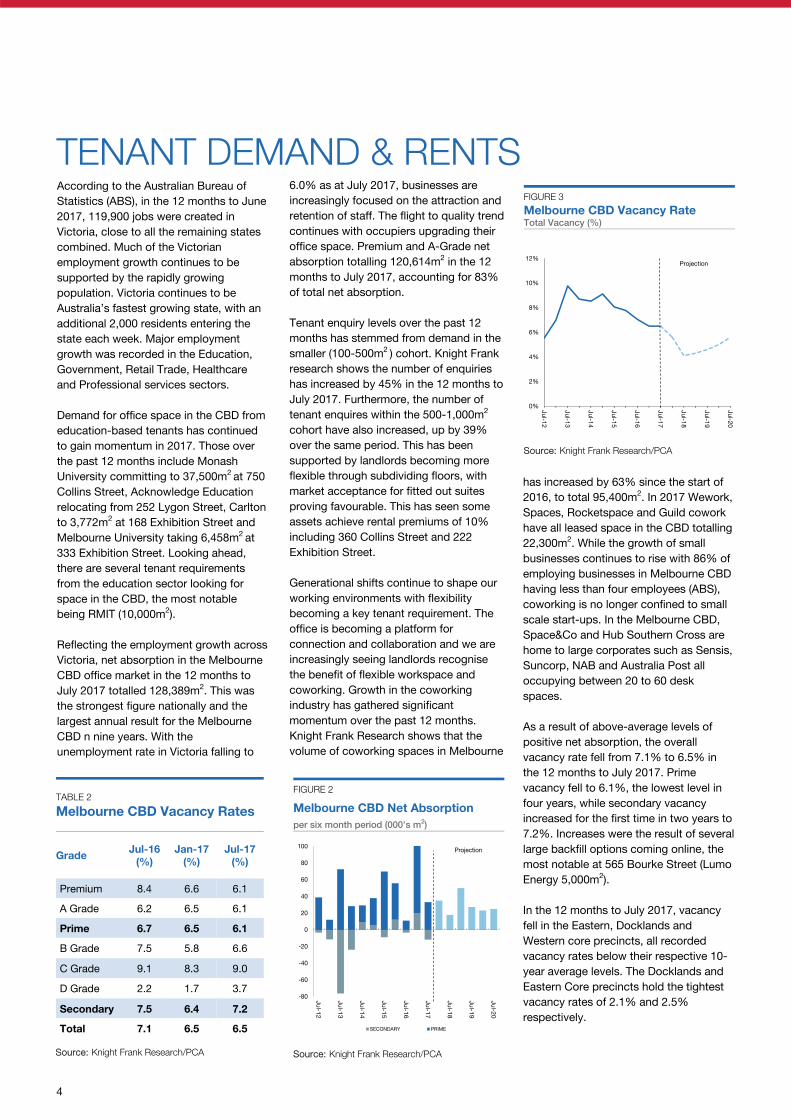
The overall vacancy rate is
expected to fall to 4.1% over
the next 12 months with no
developments scheduled to be
completed until Q2 2018.
Reflecting the declining vacancy
rate, average prime effective
rents grew at their strongest
rate in seven years.
The current spread between
prime and secondary yields is
75 basis points, the tightest on
record.
SUPPLY & DEVELOPMENT
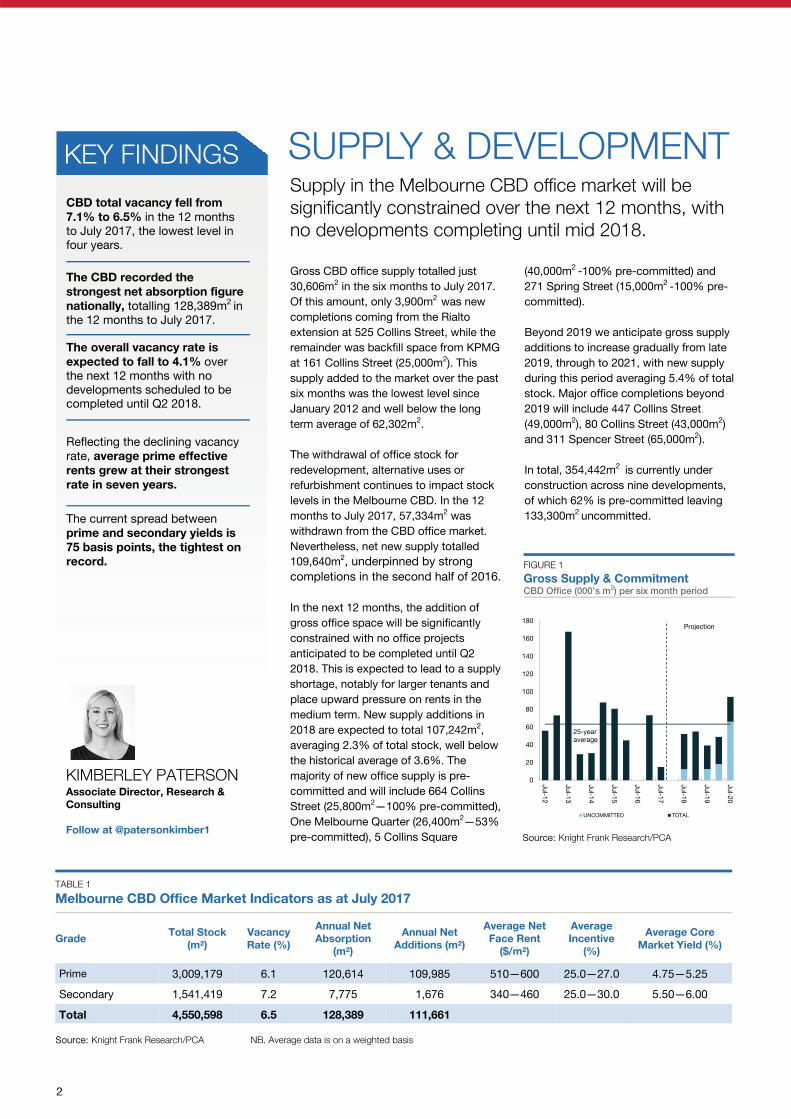
Gross CBD office supply totalled just
30,606m2 in the six months to July 2017.
Of this amount, only 3,900m2
was new
completions coming from the Rialto
extension at 525 Collins Street, while the
remainder was backfill space from KPMG
at 161 Collins Street (25,000m2). This
supply added to the market over the past
six months was the lowest level since
January 2012 and well below the long
term average of 62,302m2.
The withdrawal of office stock for
redevelopment, alternative uses or
refurbishment continues to impact stock
levels in the Melbourne CBD. In the 12
months to July 2017, 57,334m2 was
withdrawn from the CBD office market.
Nevertheless, net new supply totalled
109,640m2, underpinned by strong
completions in the second half of 2016.
In the next 12 months, the addition of
gross office space will be significantly
constrained with no office projects
anticipated to be completed until Q2
2018. This is expected to lead to a supply
shortage, notably for larger tenants and
place upward pressure on rents in the
medium term. New supply additions in
2018 are expected to total 107,242m2,
averaging 2.3% of total stock, well below
the historical average of 3.6%. The
majority of new office supply is pre-
committed and will include 664 Collins
Street (25,800m2—100% pre-committed),
One Melbourne Quarter (26,400m2—53%
pre-committed), 5 Collins Square
(40,000m2 -100% pre-committed) and
271 Spring Street (15,000m2 -100% pre-
committed).
Beyond 2019 we anticipate gross supply
additions to increase gradually from late
2019, through to 2021, with new supply
during this period averaging 5.4% of total
stock. Major office completions beyond
2019 will include 447 Collins Street
(49,000m2), 80 Collins Street (43,000m
2)
and 311 Spencer Street (65,000m2).
In total, 354,442m2 is currently under
construction across nine developments,
of which 62% is pre-committed leaving
133,300m2 uncommitted.
TABLE 1
Melbourne CBD Office Market Indicators as at July 2017
Grade Total Stock
(m²)
Vacancy
Rate (%)
Annual Net
Absorption
(m²)
Annual Net
Additions (m²)
Average Net
Face Rent
($/m²)
Average
Incentive
(%)
Average Core
Market Yield (%)
Prime 3,009,179 6.1 120,614 109,985 510—600 25.0—27.0 4.75—5.25
Secondary 1,541,419 7.2 7,775 1,676 340—460 25.0—30.0 5.50—6.00
Total 4,550,598 6.5 128,389 111,661
Source: Knight Frank Research/PCA NB. Average data is on a weighted basis
Source: Knight Frank Research/PCA
FIGURE 1
Gross Supply & Commitment CBD Office (000’s m
2) per six month period
0
20
40
60
80
100
120
140
160
180
Jul-1
2
Jul-1
3
Jul-1
4
Jul-1
5
Jul-1
6
Jul-1
7
Jul-1
8
Jul-1
9
Jul-2
0
UNCOMMITTED TOTAL
25-year
average
Projection
Supply in the Melbourne CBD office market will be significantly constrained over the next 12 months, with no developments completing until mid 2018.
KIMBERLEY PATERSON Associate Director, Research &
Consulting
Follow at @patersonkimber1
3
RESEARCH MELBOURNE CBD OFFICE SEPTEMBER 2017
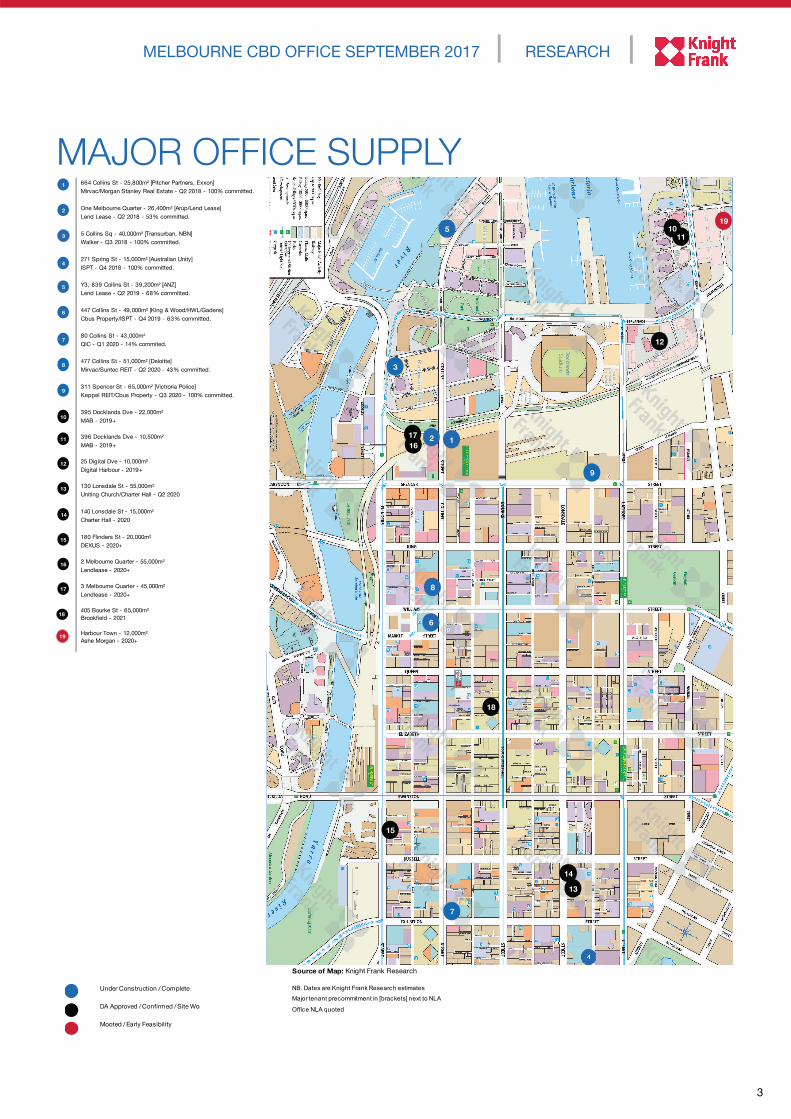
MAJOR OFFICE SUPPLY
Source of Map: Knight Frank Research
NB. Dates are Knight Frank Research estimates
Major tenant precommitment in [brackets] next to NLA
Office NLA quoted
511
12
3
18
15
7
13
6
8
16
9
12
10
17
19
14
Source of Map: Knight Frank Research
Under Construction / Complete
DA Approved / Confirmed / Site Wor
Mooted / Early Feasibility
664 Collins St - 25,800m² [Pitcher Partners, Exxon]
Mirvac/Morgan Stanley Real Estate - Q2 2018 - 100% committed.
One Melbourne Quarter - 26,400m² [Arup/Lend Lease]
Lend Lease - Q2 2018 - 53% committed.
5 Collins Sq - 40,000m² [Transurban, NBN]
Walker - Q3 2018 - 100% committed.
271 Spring St - 15,000m² [Australian Unity]
ISPT - Q4 2018 - 100% committed.
Y3, 839 Collins St - 39,200m² [ANZ]
Lend Lease - Q2 2019 - 68% committed.
447 Collins St - 49,000m² [King & Wood/HWL/Gadens]
Cbus Property/ISPT - Q4 2019 - 63% committed.
80 Collins St - 43,000m²
QIC - Q1 2020 - 14% commited.
477 Collins St - 51,000m² [Deloitte]
Mirvac/Suntec REIT - Q2 2020 - 43% committed.
311 Spencer St - 65,000m² [Victroria Police]
Keppel REIT/Cbus Property - Q3 2020 - 100% committed.
395 Docklands Dve - 22,000m²
MAB - 2019+
396 Docklands Dve - 10,500m²
MAB - 2019+
25 Digital Dve - 10,000m²
Digital Harbour - 2019+
130 Lonsdale St - 55,000m²
Uniting Church/Charter Hall - Q2 2020
140 Lonsdale St - 15,000m²
Charter Hall - 2020
180 Flinders St - 20,000m²
DEXUS - 2020+
2 Melbourne Quarter - 55,000m²
Lendlease - 2020+
3 Melbourne Quarter - 45,000m²
Lendlease - 2020+
405 Bourke St - 65,000m²
Brookfield - 2021
Harbour Town - 12,000m²
Ashe Morgan - 2020+
1
2
3
5
6
7
8
9
10
11
12
13
15
16
17
18
4
14
19
4
6.0% as at July 2017, businesses are
increasingly focused on the attraction and
retention of staff. The flight to quality trend
continues with occupiers upgrading their
office space. Premium and A-Grade net
absorption totalling 120,614m2 in the 12
months to July 2017, accounting for 83%
of total net absorption.
Tenant enquiry levels over the past 12
months has stemmed from demand in the
smaller (100-500m2 ) cohort. Knight Frank
research shows the number of enquiries
has increased by 45% in the 12 months to
July 2017. Furthermore, the number of
tenant enquires within the 500-1,000m2
cohort have also increased, up by 39%
over the same period. This has been
supported by landlords becoming more
flexible through subdividing floors, with
market acceptance for fitted out suites
proving favourable. This has seen some
assets achieve rental premiums of 10%
including 360 Collins Street and 222
Exhibition Street.
Generational shifts continue to shape our
working environments with flexibility
becoming a key tenant requirement. The
office is becoming a platform for
connection and collaboration and we are
increasingly seeing landlords recognise
the benefit of flexible workspace and
coworking. Growth in the coworking
industry has gathered significant
momentum over the past 12 months.
Knight Frank Research shows that the
volume of coworking spaces in Melbourne
According to the Australian Bureau of
Statistics (ABS), in the 12 months to June
2017, 119,900 jobs were created in
Victoria, close to all the remaining states
combined. Much of the Victorian
employment growth continues to be
supported by the rapidly growing
population. Victoria continues to be
Australia’s fastest growing state, with an
additional 2,000 residents entering the
state each week. Major employment
growth was recorded in the Education,
Government, Retail Trade, Healthcare
and Professional services sectors.
Demand for office space in the CBD from
education-based tenants has continued
to gain momentum in 2017. Those over
the past 12 months include Monash
University committing to 37,500m2 at 750
Collins Street, Acknowledge Education
relocating from 252 Lygon Street, Carlton
to 3,772m2 at 168 Exhibition Street and
Melbourne University taking 6,458m2 at
333 Exhibition Street. Looking ahead,
there are several tenant requirements
from the education sector looking for
space in the CBD, the most notable
being RMIT (10,000m2).
Reflecting the employment growth across
Victoria, net absorption in the Melbourne
CBD office market in the 12 months to
July 2017 totalled 128,389m2. This was
the strongest figure nationally and the
largest annual result for the Melbourne
CBD n nine years. With the
unemployment rate in Victoria falling to
TENANT DEMAND & RENTS
has increased by 63% since the start of
2016, to total 95,400m2. In 2017 Wework,
Spaces, Rocketspace and Guild cowork
have all leased space in the CBD totalling
22,300m2. While the growth of small
businesses continues to rise with 86% of
employing businesses in Melbourne CBD
having less than four employees (ABS),
coworking is no longer confined to small
scale start-ups. In the Melbourne CBD,
Space&Co and Hub Southern Cross are
home to large corporates such as Sensis,
Suncorp, NAB and Australia Post all
occupying between 20 to 60 desk
spaces.
As a result of above-average levels of
positive net absorption, the overall
vacancy rate fell from 7.1% to 6.5% in
the 12 months to July 2017. Prime
vacancy fell to 6.1%, the lowest level in
four years, while secondary vacancy
increased for the first time in two years to
7.2%. Increases were the result of several
large backfill options coming online, the
most notable at 565 Bourke Street (Lumo
Energy 5,000m2).
In the 12 months to July 2017, vacancy
fell in the Eastern, Docklands and
Western core precincts, all recorded
vacancy rates below their respective 10-
year average levels. The Docklands and
Eastern Core precincts hold the tightest
vacancy rates of 2.1% and 2.5%
respectively.
Source: Knight Frank Research/PCA
FIGURE 3
Melbourne CBD Vacancy Rate Total Vacancy (%)
Source: Knight Frank Research/PCA
FIGURE 2
Melbourne CBD Net Absorption
per six month period (000’s m2)
TABLE 2
Melbourne CBD Vacancy Rates
Grade Jul-16
(%)
Jan-17
(%)
Jul-17
(%)
Premium 8.4 6.6 6.1
A Grade 6.2 6.5 6.1
Prime 6.7 6.5 6.1
B Grade 7.5 5.8 6.6
C Grade 9.1 8.3 9.0
D Grade 2.2 1.7 3.7
Secondary 7.5 6.4 7.2
Total 7.1 6.5 6.5
Source: Knight Frank Research/PCA
-80
-60
-40
-20
0
20
40
60
80
100
Jul-1
2
Jul-1
3
Jul-1
4
Jul-1
5
Jul-1
6
Jul-1
7
Jul-1
8
Jul-1
9
Jul-2
0
SECONDARY PRIME
Projection
0%
2%
4%
6%
8%
10%
12%
Jul-1
2
Jul-1
3
Jul-1
4
Jul-1
5
Jul-1
6
Jul-1
7
Jul-1
8
Jul-1
9
Jul-2
0
Projection
5
RESEARCH MELBOURNE CBD OFFICE SEPTEMBER 2017
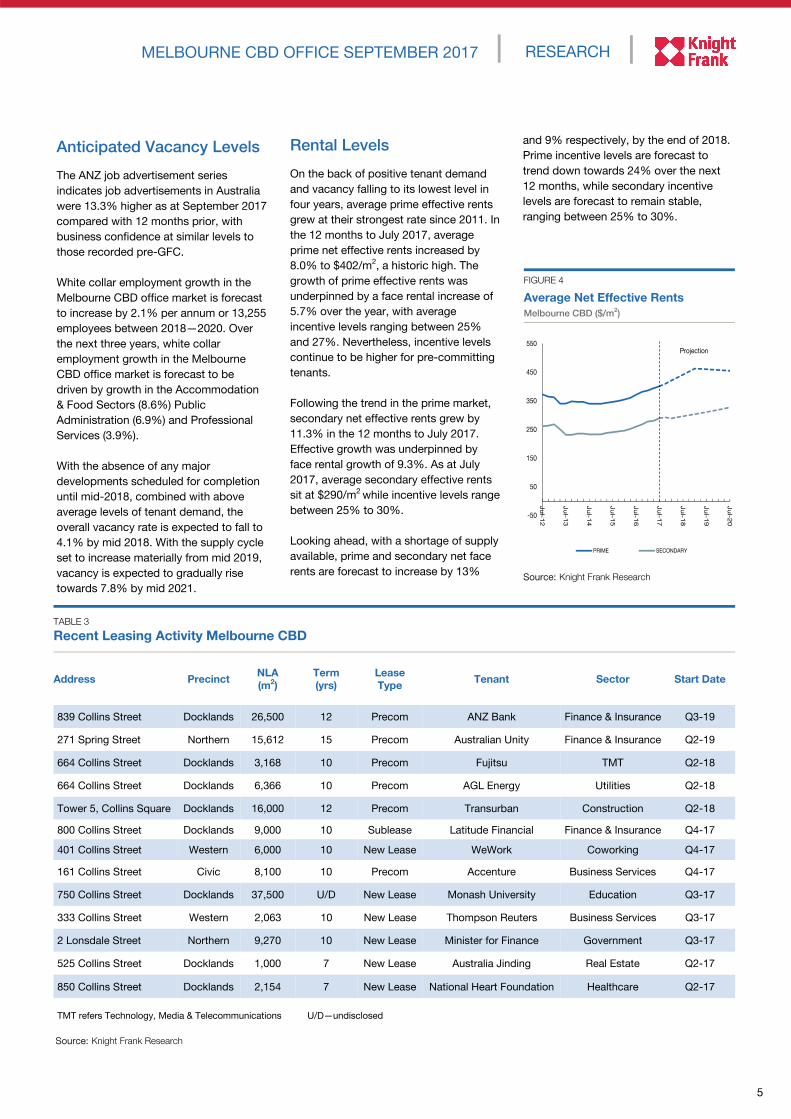
Rental Levels
On the back of positive tenant demand
and vacancy falling to its lowest level in
four years, average prime effective rents
grew at their strongest rate since 2011. In
the 12 months to July 2017, average
prime net effective rents increased by
8.0% to $402/m2, a historic high. The
growth of prime effective rents was
underpinned by a face rental increase of
5.7% over the year, with average
incentive levels ranging between 25%
and 27%. Nevertheless, incentive levels
continue to be higher for pre-committing
tenants.
Following the trend in the prime market,
secondary net effective rents grew by
11.3% in the 12 months to July 2017.
Effective growth was underpinned by
face rental growth of 9.3%. As at July
2017, average secondary effective rents
sit at $290/m2 while incentive levels range
between 25% to 30%.
Looking ahead, with a shortage of supply
available, prime and secondary net face
rents are forecast to increase by 13%
Anticipated Vacancy Levels
The ANZ job advertisement series
indicates job advertisements in Australia
were 13.3% higher as at September 2017
compared with 12 months prior, with
business confidence at similar levels to
those recorded pre-GFC.
White collar employment growth in the
Melbourne CBD office market is forecast
to increase by 2.1% per annum or 13,255
employees between 2018—2020. Over
the next three years, white collar
employment growth in the Melbourne
CBD office market is forecast to be
driven by growth in the Accommodation
& Food Sectors (8.6%) Public
Administration (6.9%) and Professional
Services (3.9%).
With the absence of any major
developments scheduled for completion
until mid-2018, combined with above
average levels of tenant demand, the
overall vacancy rate is expected to fall to
4.1% by mid 2018. With the supply cycle
set to increase materially from mid 2019,
vacancy is expected to gradually rise
towards 7.8% by mid 2021.
Source: Knight Frank Research
and 9% respectively, by the end of 2018.
Prime incentive levels are forecast to
trend down towards 24% over the next
12 months, while secondary incentive
levels are forecast to remain stable,
ranging between 25% to 30%.
Source: Knight Frank Research
FIGURE 4
Average Net Effective Rents
Melbourne CBD ($/m2)
TABLE 3
Recent Leasing Activity Melbourne CBD
Address Precinct NLA
(m2)
Term
(yrs)
Lease
Type Tenant Sector Start Date
839 Collins Street Docklands 26,500 12 Precom ANZ Bank Finance & Insurance Q3-19
271 Spring Street Northern 15,612 15 Precom Australian Unity Finance & Insurance Q2-19
664 Collins Street Docklands 3,168 10 Precom Fujitsu TMT Q2-18
664 Collins Street Docklands 6,366 10 Precom AGL Energy Utilities Q2-18
Tower 5, Collins Square Docklands 16,000 12 Precom Transurban Construction Q2-18
800 Collins Street Docklands 9,000 10 Sublease Latitude Financial Finance & Insurance Q4-17
401 Collins Street Western 6,000 10 New Lease WeWork Coworking Q4-17
161 Collins Street Civic 8,100 10 Precom Accenture Business Services Q4-17
750 Collins Street Docklands 37,500 U/D New Lease Monash University Education Q3-17
333 Collins Street Western 2,063 10 New Lease Thompson Reuters Business Services Q3-17
2 Lonsdale Street Northern 9,270 10 New Lease Minister for Finance Government Q3-17
525 Collins Street Docklands 1,000 7 New Lease Australia Jinding Real Estate Q2-17
850 Collins Street Docklands 2,154 7 New Lease National Heart Foundation Healthcare Q2-17
TMT refers Technology, Media & Telecommunications U/D—undisclosed
-50
50
150
250
350
450
550
Ju
l-12
Ju
l-13
Ju
l-14
Ju
l-15
Ju
l-16
Ju
l-17
Ju
l-18
Ju
l-19
Ju
l-20
PRIME SECONDARY
Projection
6
22,500m2. This transaction followed
another divestment by Mirvac, with
Morgan Stanley Real Estate acquiring a
50% stake in 664 Collins Street. The
building is currently under construction,
scheduled for completion in Q2 2018 and
is fully pre-committed to Pitcher Partners,
AGL, Exxon and Fujitsu.
Another notable transaction was 311
Spencer Street where Keppel REIT
acquired a 50% share totalling $347.8
million. The transaction reflected an initial
yield of 5.00%. The 40-storey tower is
currently under construction and is
anticipated to complete in Q3 2020.
Victoria Police will vacate their current
premises at 637 Flinders Street to occupy
the entire 65,000m2 building.
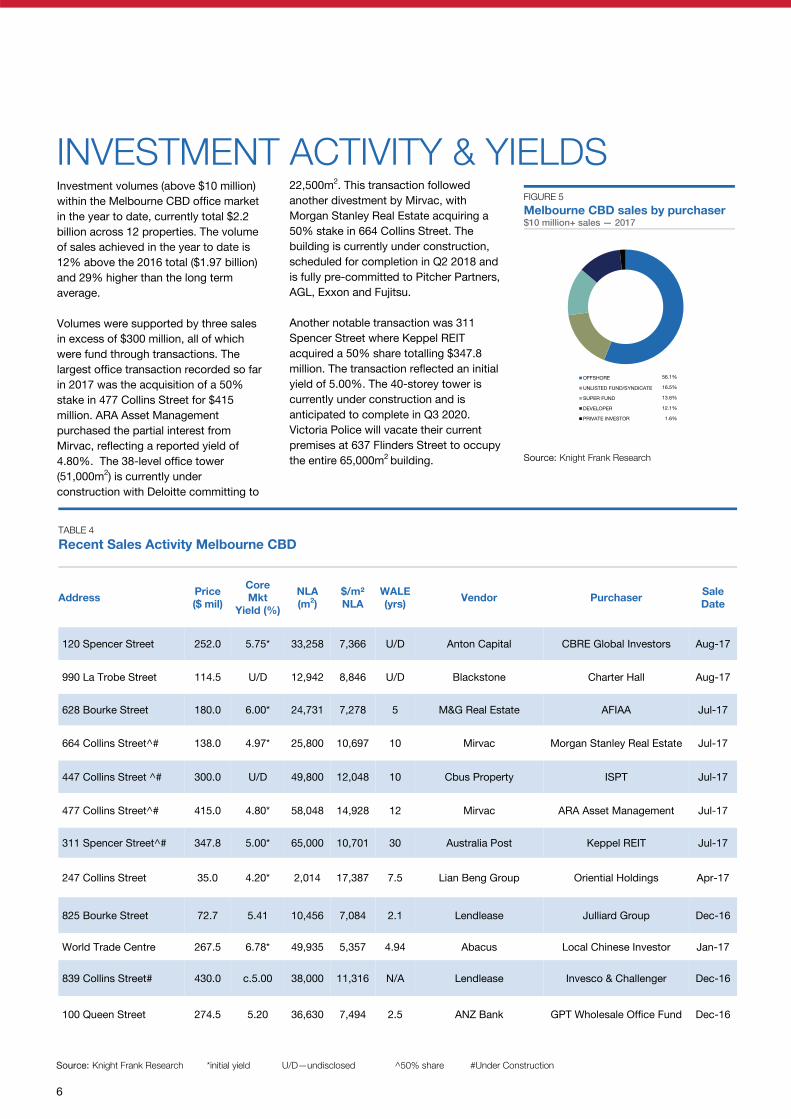
Investment volumes (above $10 million)
within the Melbourne CBD office market
in the year to date, currently total $2.2
billion across 12 properties. The volume
of sales achieved in the year to date is
12% above the 2016 total ($1.97 billion)
and 29% higher than the long term
average.
Volumes were supported by three sales
in excess of $300 million, all of which
were fund through transactions. The
largest office transaction recorded so far
in 2017 was the acquisition of a 50%
stake in 477 Collins Street for $415
million. ARA Asset Management
purchased the partial interest from
Mirvac, reflecting a reported yield of
4.80%. The 38-level office tower
(51,000m2) is currently under
construction with Deloitte committing to
Source: Knight Frank Research
FIGURE 5
Melbourne CBD sales by purchaser $10 million+ sales — 2017
INVESTMENT ACTIVITY & YIELDS
TABLE 4
Recent Sales Activity Melbourne CBD
Address Price
($ mil)
Core
Mkt
Yield (%)
NLA
(m2)
$/m²
NLA
WALE
(yrs) Vendor Purchaser
Sale
Date
120 Spencer Street 252.0 5.75* 33,258 7,366 U/D Anton Capital CBRE Global Investors Aug-17
990 La Trobe Street 114.5 U/D 12,942 8,846 U/D Blackstone Charter Hall Aug-17
628 Bourke Street 180.0 6.00* 24,731 7,278 5 M&G Real Estate AFIAA Jul-17
664 Collins Street^# 138.0 4.97* 25,800 10,697 10 Mirvac Morgan Stanley Real Estate Jul-17
447 Collins Street ^# 300.0 U/D 49,800 12,048 10 Cbus Property ISPT Jul-17
477 Collins Street^# 415.0 4.80* 58,048 14,928 12 Mirvac ARA Asset Management Jul-17
311 Spencer Street^# 347.8 5.00* 65,000 10,701 30 Australia Post Keppel REIT Jul-17
247 Collins Street 35.0 4.20* 2,014 17,387 7.5 Lian Beng Group Oriential Holdings Apr-17
825 Bourke Street 72.7 5.41 10,456 7,084 2.1 Lendlease Julliard Group Dec-16
World Trade Centre 267.5 6.78* 49,935 5,357 4.94 Abacus Local Chinese Investor Jan-17
839 Collins Street# 430.0 c.5.00 38,000 11,316 N/A Lendlease Invesco & Challenger Dec-16
100 Queen Street 274.5 5.20 36,630 7,494 2.5 ANZ Bank GPT Wholesale Office Fund Dec-16
Source: Knight Frank Research *initial yield U/D—undisclosed ^50% share #Under Construction
OFFSHORE
UNLISTED FUND/SYNDICATE
SUPER FUND
DEVELOPER
PRIVATE INVESTOR
56.1%
16.5%
13.6%
12.1%
1.6%
7
RESEARCH MELBOURNE CBD OFFICE SEPTEMBER 2017
Offshore purchasers were the most
active buyers in the year to date,
acquiring $1.23 billion, accounting for
56% of total sales activity. This is the
second highest total on record, with
volumes in 2015 totalling $1.36 billion.
While Singaporean and Chinese-based
investors acquired the majority of CBD
assets purchased by foreign investors,
American and Swiss based investors
were also active, accounting for 26% of
cross-border investment into the
Melbourne CBD office market in the year
to date. The most notable acquisition
included 628 Bourke Street ($180 million)
by AFIAA reflecting an initial yield of
6.00%.
Investors remained focused on Prime
grade stock with Premium and A-grade
assets accounting for 60% of sales
volume or $1.31 billion. Prime grade
asset sales have surpassed secondary
asset sales every year for the past six
years.
While prime assets accounted for the
majority of investment volume, secondary
CBD offices transacted over the year
totalled $888 million, 51% above the long
term average. Within the secondary
market, offshore groups were the most
active buyers, acquiring $335 million in
the year to date.
Fewer buying opportunities, combined
with strong investor demand, particularly
offshore investors, has resulted in further
yield compression of both prime and
Over the next three years, white
collar employment within the
Melbourne CBD is forecast to
grow by 13,255 employees.
Tenant demand in the CBD is
expected to remain strong over
the next three years,
underpinned by growth in the
Accommodation & Food sectors,
Public Administration and
Professional Services.
Net supply of office space in
Melbourne will be significantly
constrained over the next 12
months with no new office
projects anticipated to complete
until Q2 2018.
The new supply pipeline is
expected to expand from 2019
onwards with new supply during
this period averaging 5.4% of
total stock. Major office
completions beyond 2019 will
include 447 Collins Street
(49,000m2), 80 Collins Street
(43,000m2) and 311 Spencer
Street (65,000m2).
The overall vacancy rate in the
CBD is anticipated to continue
trending down over the next 12
months, falling to 4.1% by mid-
2018, Beyond 2019, we expect
the overall vacancy rate to revert
closer to its historical average of
7.5% when the next
development cycle commences.
While tenant demand in the
Melbourne CBD remains strong,
net absorption is expected to be
well below the long term average
over the next 12 months due to
the lack of available space.
With the vacancy forecast to
remain below the historical
average over the next three
years, further gains in rents are
projected. Prime and secondary
net face rents are forecast to
grow by 6.5% and 4.5% per
annum over the next two years
respectively.
Looking ahead, investment
volumes are anticipated to
remain above the five year
average in 2017. This is unlikely
to match volumes recorded in
2014 as impacted by the scarcity
of investment opportunities
rather than diminishing investor
appetite.
Outlook
Source: Knight Frank Research
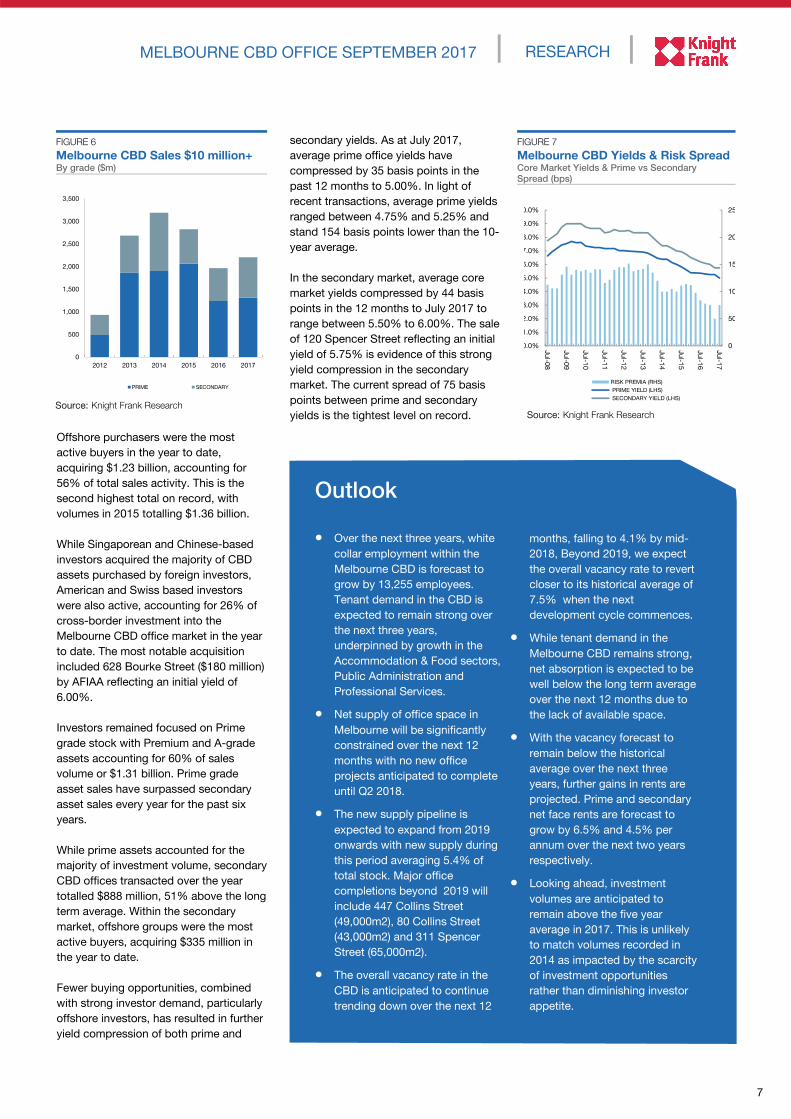
FIGURE 7
Melbourne CBD Yields & Risk Spread Core Market Yields & Prime vs Secondary
Spread (bps)
Source: Knight Frank Research
FIGURE 6
Melbourne CBD Sales $10 million+ By grade ($m)
secondary yields. As at July 2017,
average prime office yields have
compressed by 35 basis points in the
past 12 months to 5.00%. In light of
recent transactions, average prime yields
ranged between 4.75% and 5.25% and
stand 154 basis points lower than the 10-
year average.
In the secondary market, average core
market yields compressed by 44 basis
points in the 12 months to July 2017 to
range between 5.50% to 6.00%. The sale
of 120 Spencer Street reflecting an initial
yield of 5.75% is evidence of this strong
yield compression in the secondary
market. The current spread of 75 basis
points between prime and secondary
yields is the tightest level on record.
0
500
1,000
1,500
2,000
2,500
3,000
3,500
2012 2013 2014 2015 2016 2017
PRIME SECONDARY
0
50
10
15
20
25
0.0%
1.0%
2.0%
3.0%
4.0%
5.0%
6.0%
7.0%
8.0%
9.0%
0.0%
Jul-0
8
Jul-0
9
Jul-1
0
Jul-1
1
Jul-1
2
Jul-1
3
Jul-1
4
Jul-1
5
Jul-1
6
Jul-1
7
RISK PREMIA (RHS)
PRIME YIELD (LHS)
SECONDARY YIELD (LHS)

Knight Frank Research provides strategic advice, consultancy services and forecasting
to a wide range of clients worldwide including developers, investors, funding
organisations, corporate institutions and the public sector. All our clients recognise the
need for expert independent advice customised to their specific needs.
RECENT MARKET-LEADING RESEARCH PUBLICATIONS
Canberra Office
Market Brief
September 2017
Office Market
Transactions Update
July 2017
Active Capital
2017
Knight Frank Research Reports are available at KnightFrank.com.au/Research
Perth CBD Office
Market Overview
September 2017
© Knight Frank 2017 This report is published for general information only. Although high standards have been used in
the preparation of the information, analysis, views and projections presented in this report, no legal responsibility can be
accepted by Knight Frank Research or Knight Frank for any loss or damage resultant from the contents of this
document. As a general report, this material does not necessarily represent the view of Knight Frank in relation to
particular properties or projects. Reproduction of this report in whole or in part is not permitted without prior consent of,
and proper reference to Knight Frank Research.
For the latest news, views and analysisof the commercial property market, visitknightfrankblog.com/commercial-briefing/
COMMERCIAL BRIEFING
RESEARCH & CONSULTING
Kimberley Paterson Associate Director, Victoria
+61 3 9604 4608
VICTORIA
James Templeton Managing Director, Victoria
+61 3 9604 4724
CAPITAL MARKETS
Martin O’Sullivan Senior Director, Institutional Sales
+61 3 9604 4619
Martin.o’[email protected]
Paul Henley Head of Commercial Sales, Australia
+61 3 9604 4760
Danny Clark Head of Commercial Sales, Victoria
+61 3 9604 4686
OFFICE LEASING
Hamish Sutherland Senior Director, Head of Division
+61 3 9604 4734
Michael Nunan Director—Office Leasing
+61 3 9604 4681
James Pappas Director—Office Leasing
+61 3 9604 4635
Simon Hale Director—Office Leasing
+61 3 9604 4776
OCCUPIER SOLUTIONS
Gordon Wyllie Director—Occupier Solutions
+61 3 9604 4666
VALUATIONS & CONSULTANCY
Michael Schuh Joint Managing Director—Victoria
+61 3 9604 4726