meeting of the budget and finance subcommitteeweb).pdf · summary minutes of the . budget and...
TRANSCRIPT
VALLEY METRO • 101 N 1ST AVE • STE 1300 • PHOENIX AZ • 602-262-7433
MEETING OF THE
Budget and Finance Subcommittee
MEETING DATE
April 2, 2015
TIME 12:00 p.m.
LOCATION Valley Metro 101 N. 1st Ave., 10th Floor Lake Mead Conference Room Phoenix, AZ 85003
VALLEY METRO • 101 N 1ST AVE • STE 1300 • PHOENIX AZ • 602-262-7433
March 27, 2015
Budget and Finance Subcommittee Agenda
Thursday, April 2, 2015 10th Floor, Lake Mead Conference Room
101 N. 1st Avenue, 10th Floor 12:00 p.m.
For those participating by telephone, please mute your phone when not speaking. Action Recommended
1. Public Comment
An opportunity for general public comment on issues related to Valley Metro. Up to three (3) minutes will be provided for each speaker.
For information
2. Minutes Minutes from the March 5, 2015 BFS meeting are presented for approval.
For action
3. FY 2016 Preliminary Operating and Capital Budget and Five Year Operating Forecast and Capital Program FY 2016 - 2020
John McCormack will present the FY16 budget and five year plan.
For information
4. FY15 Third Quarter Report John McCormack will provide an update of third quarter activities for FY15.
For information
5. Future BFS Agenda Items
Chair Sherwood will request future BFS agenda items from members.
For information
2
6. Next Meeting The next meeting of the BFS is tentatively scheduled for Thursday, May 14, 2015 at 12:00 p.m.
For information
Qualified sign language interpreters are available with 72 hours notice. Materials in alternative formats (large print, audiocassette, or computer diskette) are available upon request. For further information, please call Rosalia Castro, Valley Metro at 602-495-8211 or TTY at 602-251-2039. To attend this meeting via teleconference, contact the receptionist at 602-262-7433 for the dial-in-information. The supporting information for this agenda can be found on our web site at www.valleymetro.org
VALLEY METRO • 101 N 1ST AVE • STE 1300 • PHOENIX AZ • 602-262-7433
DATE AGENDA ITEM 1 March 27, 2015 SUBJECT Public Comment PURPOSE For information BACKGROUND/DISCUSSION/CONSIDERATION An opportunity for general public comment on issues related to Valley Metro. Up to three (3) minutes will be provided to each speaker. COST AND BUDGET None COMMITTEE PROCESS None RECOMMENDATION For information only CONTACT John P. McCormack Chief Financial Officer 602-495-7433 [email protected] ATTACHMENTS None

VALLEY METRO • 101 N 1ST AVE • STE 1300 • PHOENIX AZ • 602-262-7433
DATE AGENDA ITEM 2 March 27, 2015
Summary Minutes of the Budget and Finance Subcommittee
March 5, 2015 Lake Mead Conference Room
Phoenix, AZ 12:00 p.m.
Meeting Participants Councilmember, Gary Sherwood, City of Glendale Councilmember, Jenn Daniels, Town of Gilbert (via phone) Councilmember, Suzanne Klapp, City of Scottsdale Vice Mayor, Joe Pizzillo, City of Goodyear Chair McDonald called the meeting to order at 12:14 p.m.
1. Public Comment
None
2. Summary Minutes IT WAS MOTIONED BY COUNCILMEMBER SHERWOOD, MOVED BY COUNCILMEMBER KLAPP, SECONDED BY VICE MAYOR PIZZILLO, AND UNANIMOUSLY CARRIED TO APPROVE THE OCTOBER 9, 2014 BUDGET AND FINANCE SUBCOMMITTEE (BFS) SUMMARY MEETING MINUTES.
2
3. Preliminary FY16 Budget (Budget process and baseline assumptions)
Councilmember Sherwood introduced John McCormack to review the RPTA Preliminary FY16 Budget Overview.
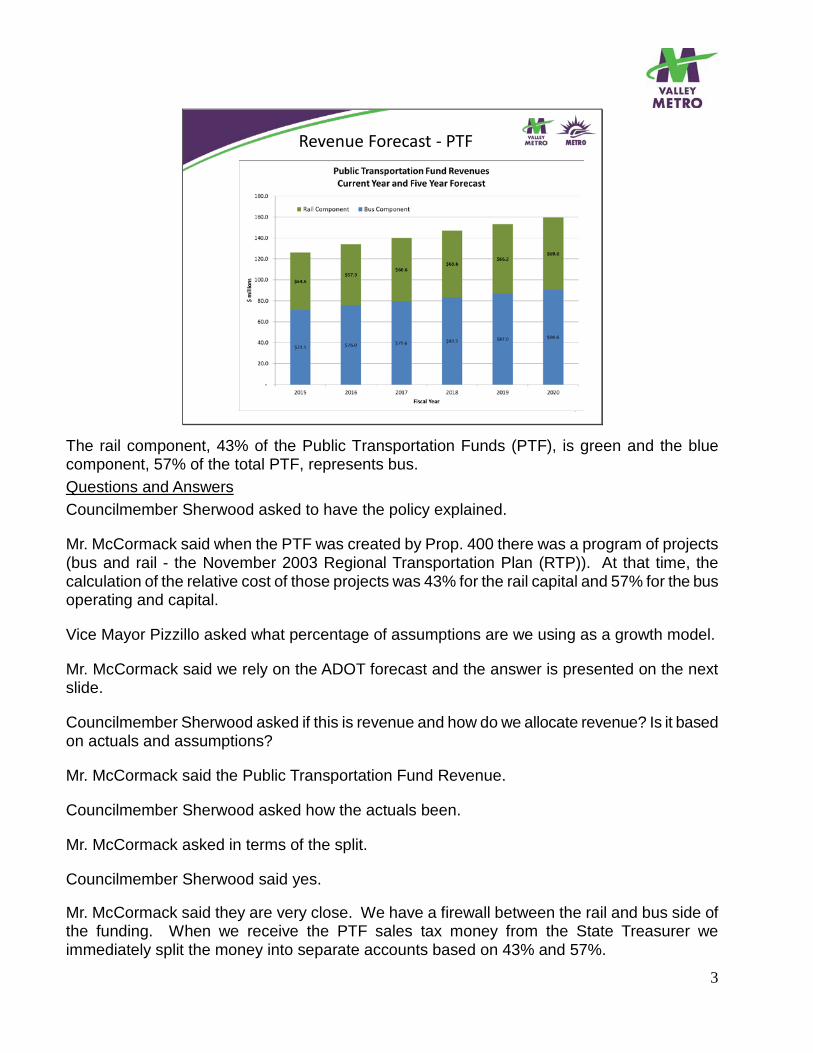
Budget Schedule FY16
3
Jan 14th -- Board approves Agency goalsFeb 19th -- Board approves service changes effective April 2015Feb 20th – Preliminary FY16 Budget delivered to Fin. Working GroupFeb 27th – Executive Summary / 5 year Plan posted to website
Mar 20th – 30 day review period….Member City Comments
Mar 25th -- Draft Budget delivered to TMC / BFSApr 1st -- Budget presented for information to TMCApr 2nd -- Budget presented for information to BFSApr 16th -- Budget presented to Board of Directors for information
May 21st -- Board Meeting – Budget Adoption
2
Valley Metro RPTAPreliminary FY16Budget Overview
Budget and Finance SubcommitteeMarch 5, 2015
2
Valley Metro RPTAPreliminary FY16Budget Overview
Budget and Finance SubcommitteeMarch 5, 2015
3
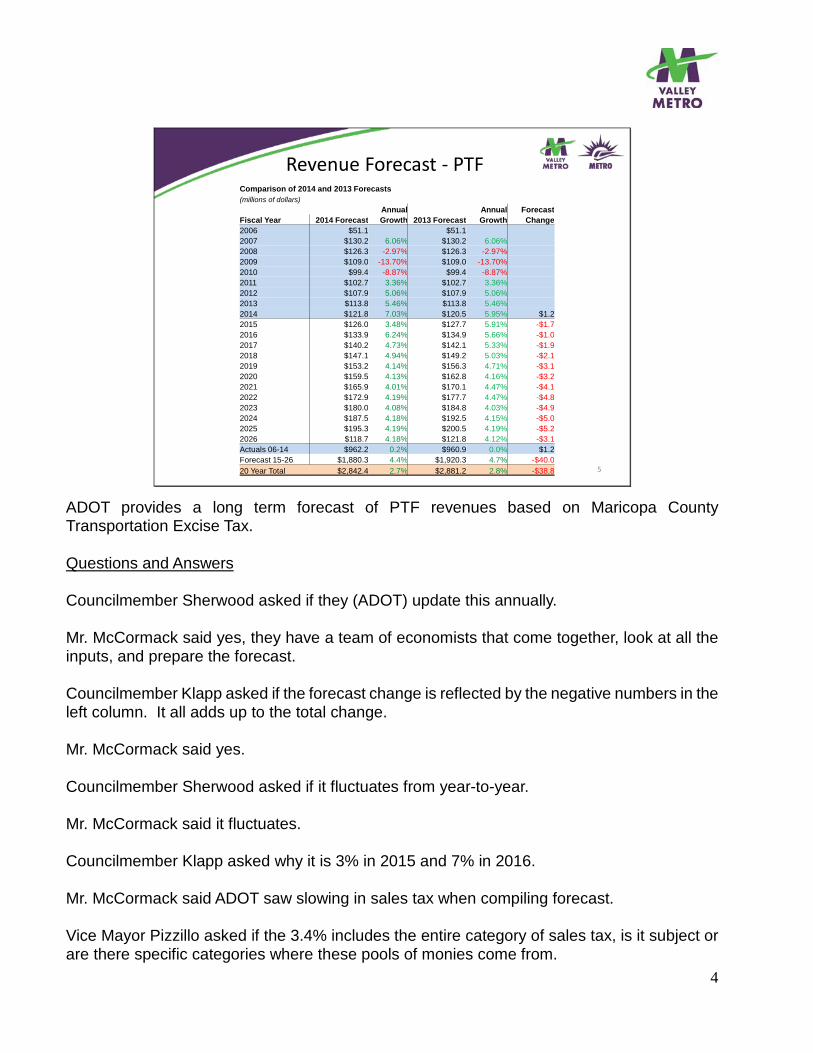
Revenue Forecast - PTF
4
The rail component, 43% of the Public Transportation Funds (PTF), is green and the blue component, 57% of the total PTF, represents bus.
Questions and Answers
Councilmember Sherwood asked to have the policy explained. Mr. McCormack said when the PTF was created by Prop. 400 there was a program of projects (bus and rail - the November 2003 Regional Transportation Plan (RTP)). At that time, the calculation of the relative cost of those projects was 43% for the rail capital and 57% for the bus operating and capital. Vice Mayor Pizzillo asked what percentage of assumptions are we using as a growth model. Mr. McCormack said we rely on the ADOT forecast and the answer is presented on the next slide. Councilmember Sherwood asked if this is revenue and how do we allocate revenue? Is it based on actuals and assumptions? Mr. McCormack said the Public Transportation Fund Revenue. Councilmember Sherwood asked how the actuals been. Mr. McCormack asked in terms of the split. Councilmember Sherwood said yes. Mr. McCormack said they are very close. We have a firewall between the rail and bus side of the funding. When we receive the PTF sales tax money from the State Treasurer we immediately split the money into separate accounts based on 43% and 57%.
4
5
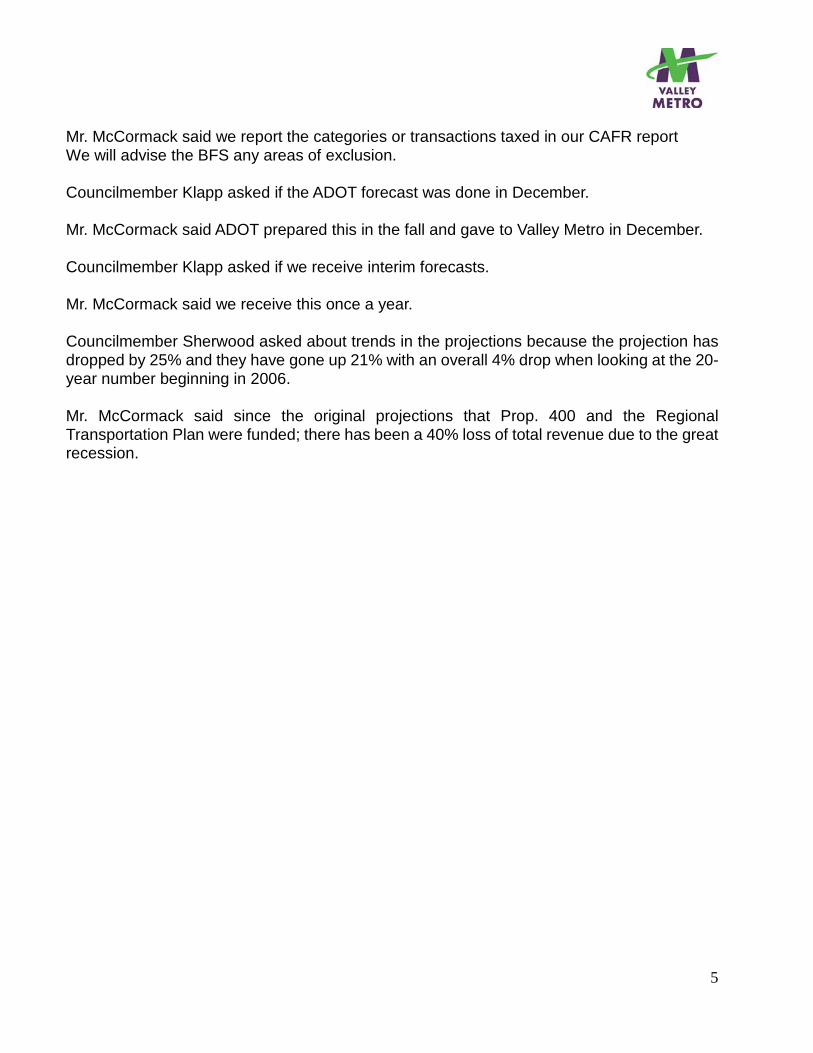
Comparison of 2014 and 2013 Forecasts(millions of dollars)
Annual Annual ForecastFiscal Year 2014 Forecast Growth 2013 Forecast Growth Change2006 $51.1 $51.12007 $130.2 6.06% $130.2 6.06%2008 $126.3 -2.97% $126.3 -2.97%2009 $109.0 -13.70% $109.0 -13.70%2010 $99.4 -8.87% $99.4 -8.87%2011 $102.7 3.36% $102.7 3.36%2012 $107.9 5.06% $107.9 5.06%2013 $113.8 5.46% $113.8 5.46%2014 $121.8 7.03% $120.5 5.95% $1.22015 $126.0 3.48% $127.7 5.91% -$1.72016 $133.9 6.24% $134.9 5.66% -$1.02017 $140.2 4.73% $142.1 5.33% -$1.92018 $147.1 4.94% $149.2 5.03% -$2.12019 $153.2 4.14% $156.3 4.71% -$3.12020 $159.5 4.13% $162.8 4.16% -$3.22021 $165.9 4.01% $170.1 4.47% -$4.12022 $172.9 4.19% $177.7 4.47% -$4.82023 $180.0 4.08% $184.8 4.03% -$4.92024 $187.5 4.18% $192.5 4.15% -$5.02025 $195.3 4.19% $200.5 4.19% -$5.22026 $118.7 4.18% $121.8 4.12% -$3.1Actuals 06-14 $962.2 0.2% $960.9 0.0% $1.2Forecast 15-26 $1,880.3 4.4% $1,920.3 4.7% -$40.020 Year Total $2,842.4 2.7% $2,881.2 2.8% -$38.8
Revenue Forecast - PTF
ADOT provides a long term forecast of PTF revenues based on Maricopa County Transportation Excise Tax. Questions and Answers Councilmember Sherwood asked if they (ADOT) update this annually. Mr. McCormack said yes, they have a team of economists that come together, look at all the inputs, and prepare the forecast. Councilmember Klapp asked if the forecast change is reflected by the negative numbers in the left column. It all adds up to the total change. Mr. McCormack said yes. Councilmember Sherwood asked if it fluctuates from year-to-year. Mr. McCormack said it fluctuates. Councilmember Klapp asked why it is 3% in 2015 and 7% in 2016. Mr. McCormack said ADOT saw slowing in sales tax when compiling forecast. Vice Mayor Pizzillo asked if the 3.4% includes the entire category of sales tax, is it subject or are there specific categories where these pools of monies come from.
5
Mr. McCormack said we report the categories or transactions taxed in our CAFR report We will advise the BFS any areas of exclusion. Councilmember Klapp asked if the ADOT forecast was done in December. Mr. McCormack said ADOT prepared this in the fall and gave to Valley Metro in December. Councilmember Klapp asked if we receive interim forecasts. Mr. McCormack said we receive this once a year. Councilmember Sherwood asked about trends in the projections because the projection has dropped by 25% and they have gone up 21% with an overall 4% drop when looking at the 20-year number beginning in 2006. Mr. McCormack said since the original projections that Prop. 400 and the Regional Transportation Plan were funded; there has been a 40% loss of total revenue due to the great recession.

6
Revenue Forecast
6
This is the five year federal forecast (FY15 – FY 20). The operating revenues are $10 million in FY15 and FY16 and drop and drop in FY20 $6 - $7 million. These federal revenues are programmed in our Regional Transportation Investment Plan with the exception of FY19 and FY20. Risk related to this forecast is with the overall federal revenues made available by Congress. Our expectation is consistent with the MAG forecast approach; which is, we expect overall formula funds to remain flat. Questions and Answers Vice Mayor Pizzillo asked when does federal money run out. Ms. McLaren said in May of 2015, the current federal continuing resolution runs out.
7
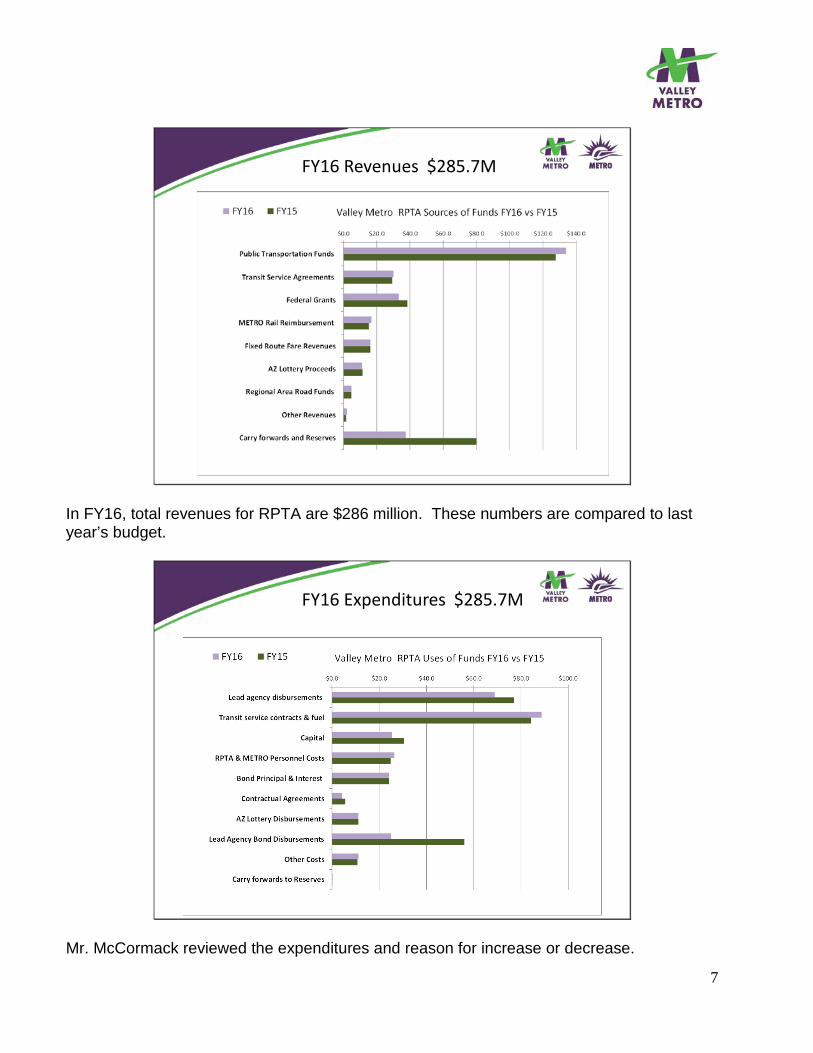
FY16 Revenues $285.7M
7
In FY16, total revenues for RPTA are $286 million. These numbers are compared to last year’s budget.
FY16 Expenditures $285.7M
8
Mr. McCormack reviewed the expenditures and reason for increase or decrease.
8
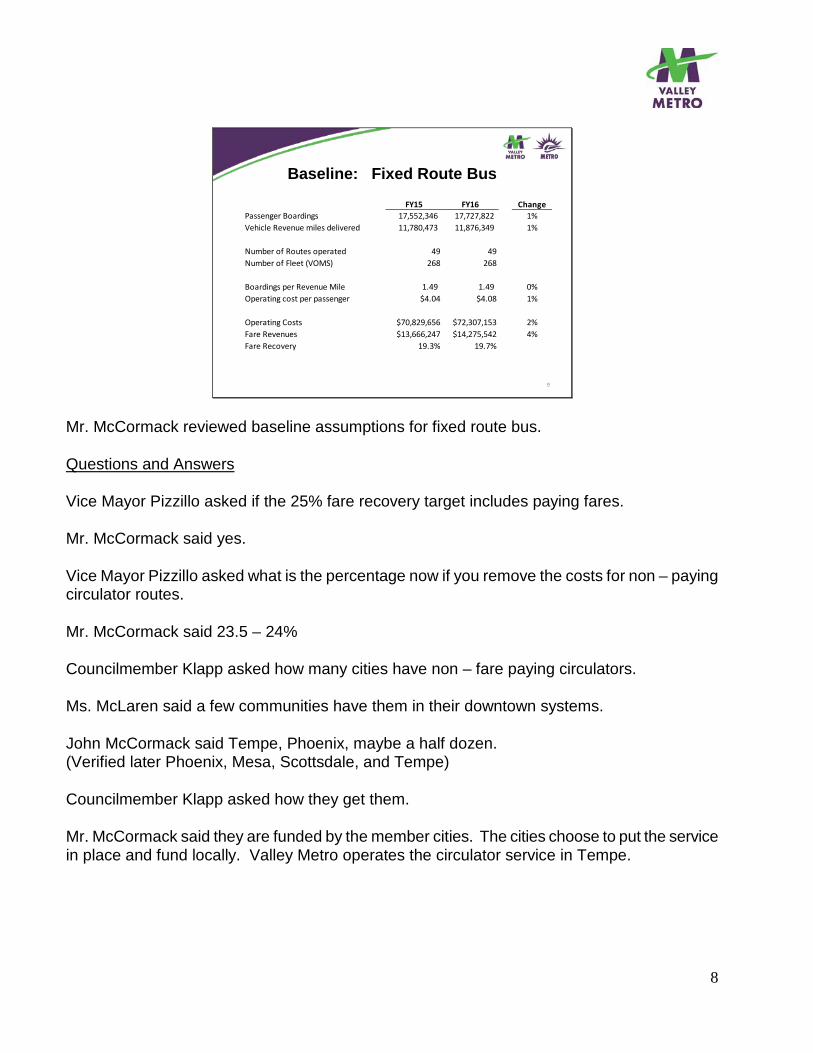
Baseline: Fixed Route Bus
9
FY15 FY16 ChangePassenger Boardings 17,552,346 17,727,822 1%Vehicle Revenue miles delivered 11,780,473 11,876,349 1%
Number of Routes operated 49 49 Number of Fleet (VOMS) 268 268
Boardings per Revenue Mile 1.49 1.49 0%Operating cost per passenger $4.04 $4.08 1%
Operating Costs $70,829,656 $72,307,153 2%Fare Revenues $13,666,247 $14,275,542 4%Fare Recovery 19.3% 19.7%
Mr. McCormack reviewed baseline assumptions for fixed route bus. Questions and Answers Vice Mayor Pizzillo asked if the 25% fare recovery target includes paying fares. Mr. McCormack said yes. Vice Mayor Pizzillo asked what is the percentage now if you remove the costs for non – paying circulator routes. Mr. McCormack said 23.5 – 24% Councilmember Klapp asked how many cities have non – fare paying circulators. Ms. McLaren said a few communities have them in their downtown systems. John McCormack said Tempe, Phoenix, maybe a half dozen. (Verified later Phoenix, Mesa, Scottsdale, and Tempe) Councilmember Klapp asked how they get them. Mr. McCormack said they are funded by the member cities. The cities choose to put the service in place and fund locally. Valley Metro operates the circulator service in Tempe.
9
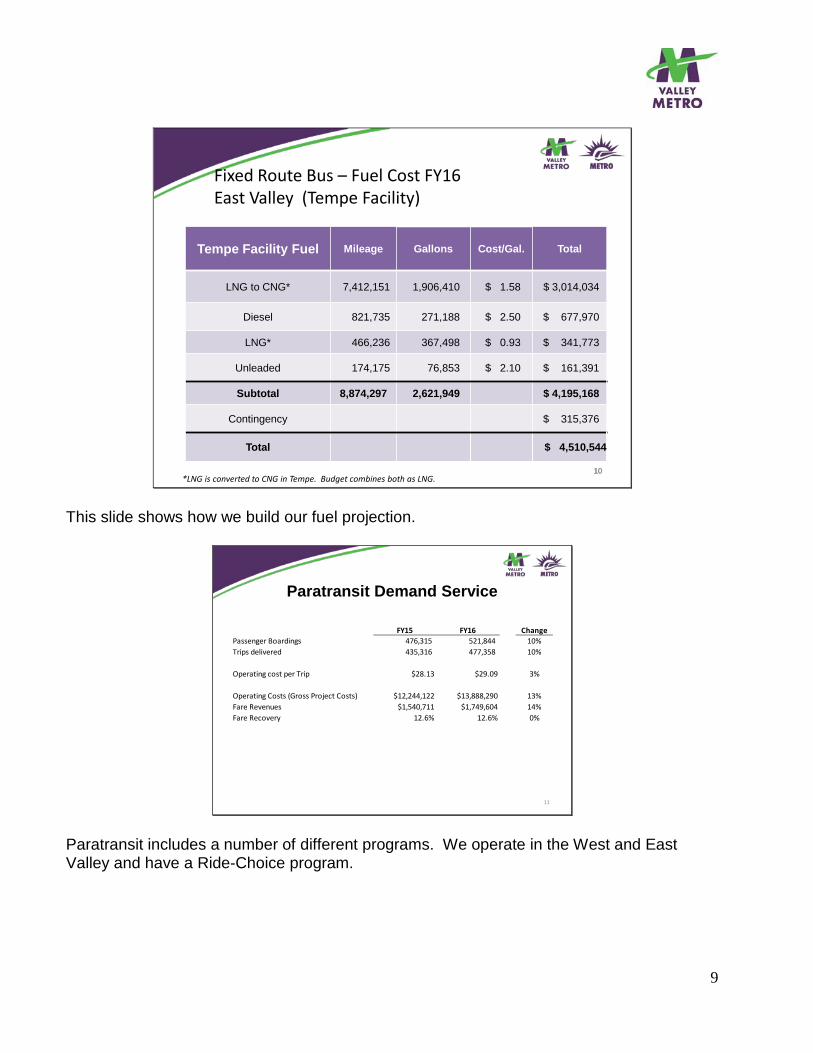
Fixed Route Bus – Fuel Cost FY16 East Valley (Tempe Facility)
1010
Tempe Facility Fuel Mileage Gallons Cost/Gal. Total
LNG to CNG* 7,412,151 1,906,410 $ 1.58 $ 3,014,034
Diesel 821,735 271,188 $ 2.50 $ 677,970
LNG* 466,236 367,498 $ 0.93 $ 341,773
Unleaded 174,175 76,853 $ 2.10 $ 161,391
Subtotal 8,874,297 2,621,949 $ 4,195,168
Contingency $ 315,376
Total $ 4,510,544
*LbD is converted to CbD in Tempe. Budget combines both as LbD. This slide shows how we build our fuel projection.
Paratransit Demand Service
11
FY15 FY16 ChangePassenger Boardings 476,315 521,844 10%Trips delivered 435,316 477,358 10%
Operating cost per Trip $28.13 $29.09 3%
Operating Costs (Gross Project Costs) $12,244,122 $13,888,290 13%Fare Revenues $1,540,711 $1,749,604 14%Fare Recovery 12.6% 12.6% 0%
Paratransit includes a number of different programs. We operate in the West and East Valley and have a Ride-Choice program.

10
Vanpool Program
12* Fuel costs are paid by passengers directly and not a part of operating costs shown
FY15 FY16 ChangePassenger Boardings 1,166,424 1,239,326 6%Vehicle Revenue miles delivered 6,104,716 6,486,261 6%
Number of Vanpools operated 400 425 6%Number of Fleet 432 457 6%
Boardings per Revenue Mile 0.19 0.19 0%Operating cost per passenger $0.87 $0.84 -3%
Operating Costs * $1,012,104 $1,045,338 3%Fare Revenues $1,045,388 $1,087,152 4%Fare Recovery 103% 104% 1%
Regional Services
13
Questions and Answers Councilmember Sherwood asked what the cost driver was for Service and Capital Planning in FY15. Mr. McCormack said the Origins and Destinations Survey was the major project in FY15 that will be completed.
11
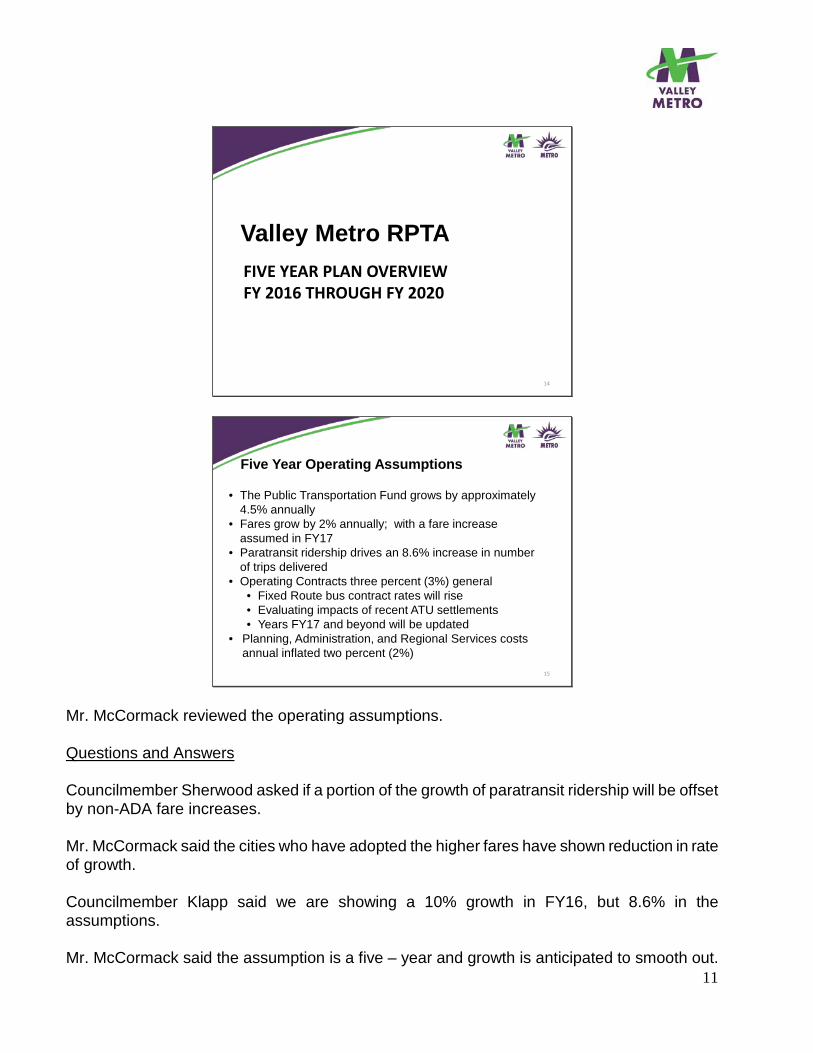
FIVE YEAR PLAN OVERVIEWFY 2016 THROUGH FY 2020
Valley Metro RPTA
14
Five Year Operating Assumptions
15
• The Public Transportation Fund grows by approximately 4.5% annually
• Fares grow by 2% annually; with a fare increase assumed in FY17
• Paratransit ridership drives an 8.6% increase in number of trips delivered
• Operating Contracts three percent (3%) general• Fixed Route bus contract rates will rise• Evaluating impacts of recent ATU settlements• Years FY17 and beyond will be updated
• Planning, Administration, and Regional Services costs annual inflated two percent (2%)
Mr. McCormack reviewed the operating assumptions. Questions and Answers Councilmember Sherwood asked if a portion of the growth of paratransit ridership will be offset by non-ADA fare increases. Mr. McCormack said the cities who have adopted the higher fares have shown reduction in rate of growth. Councilmember Klapp said we are showing a 10% growth in FY16, but 8.6% in the assumptions. Mr. McCormack said the assumption is a five – year and growth is anticipated to smooth out.
12
Five Year Operating AssumptionsProposed Fixed Route Service Changes
16
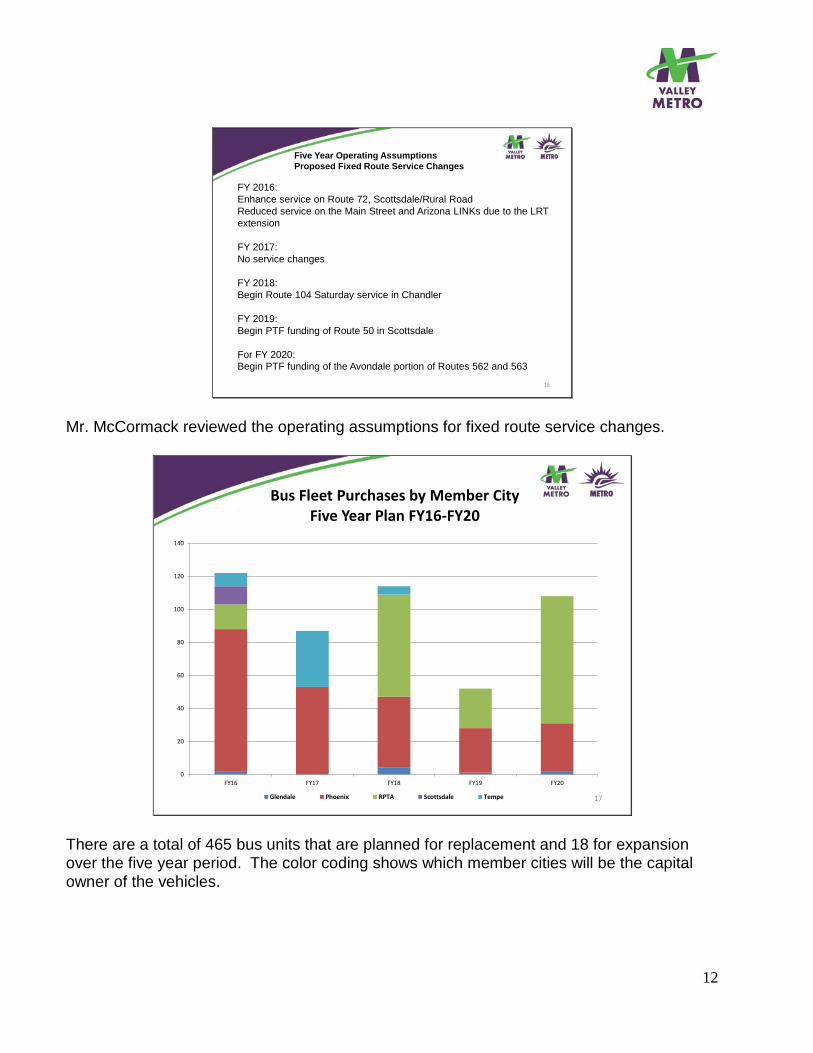
FY 2016:Enhance service on Route 72, Scottsdale/Rural Road Reduced service on the Main Street and Arizona LINKs due to the LRT extension
FY 2017:No service changes
FY 2018:Begin Route 104 Saturday service in Chandler
FY 2019:Begin PTF funding of Route 50 in Scottsdale
For FY 2020:Begin PTF funding of the Avondale portion of Routes 562 and 563
Mr. McCormack reviewed the operating assumptions for fixed route service changes.
17
0
20
40
60
80
100
120
140
FY16 FY17 FY18 FY19 FY20
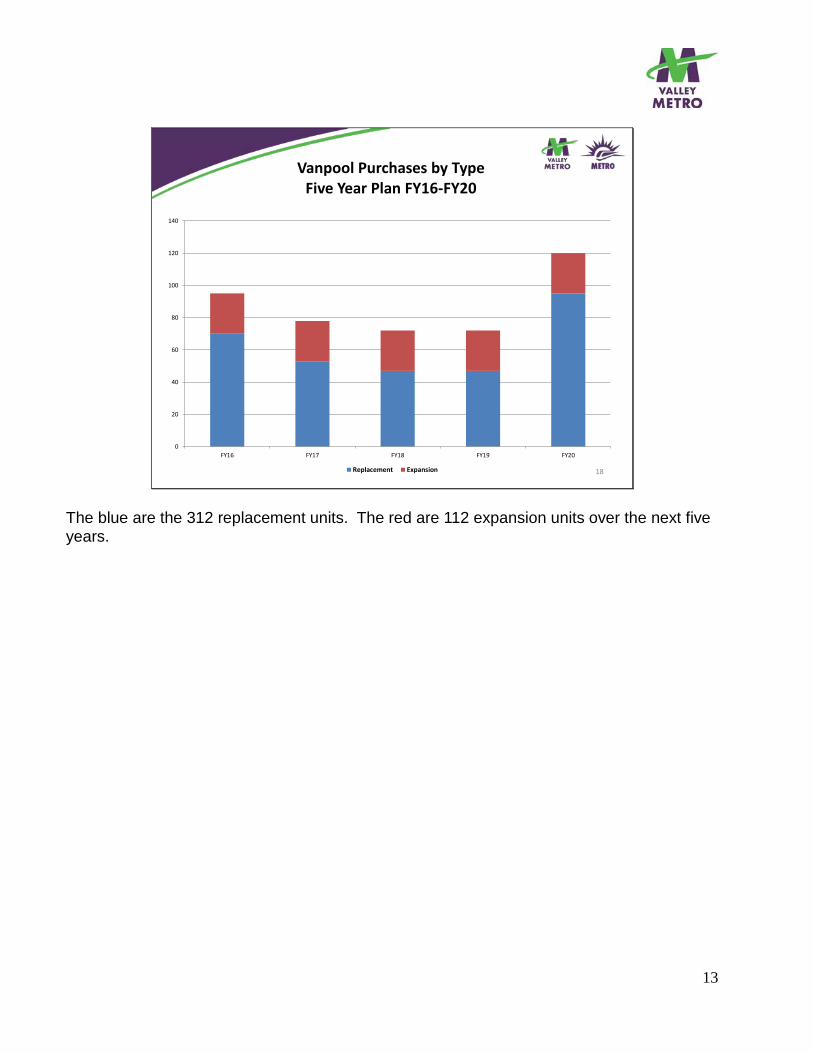
Bus Fleet Purchases by Member CityFive Year Plan FY16-FY20
Glendale Phoenix RPTA Scottsdale Tempe
There are a total of 465 bus units that are planned for replacement and 18 for expansion over the five year period. The color coding shows which member cities will be the capital owner of the vehicles.
13
18
0
20
40
60
80
100
120
140
FY16 FY17 FY18 FY19 FY20
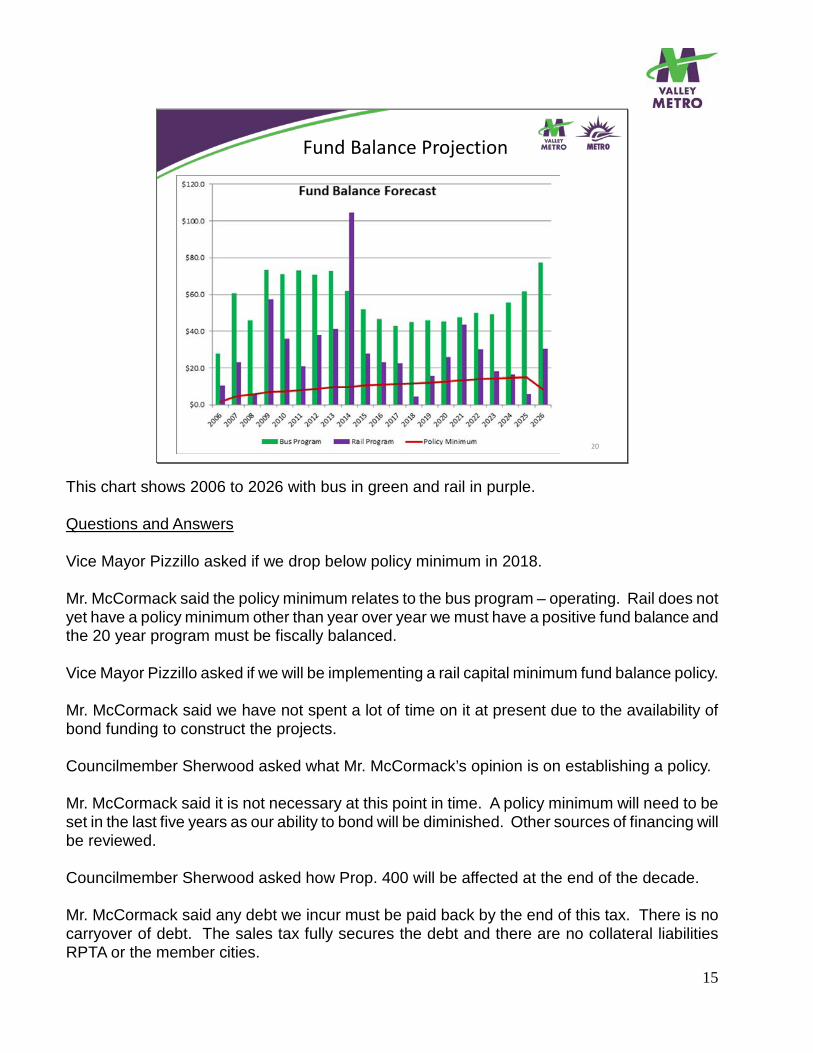
Vanpool Purchases by TypeFive Year Plan FY16-FY20
Replacement Expansion
The blue are the 312 replacement units. The red are 112 expansion units over the next five years.

14
19
$0.0
$1.0
$2.0
$3.0
$4.0
$5.0
$6.0
$7.0
$8.0
$9.0
FY16 FY17 FY18 FY19 FY20
$ m
illio
ns
Facilities and EquipmentFive Year Plan FY16-FY20
Facilities Equipment
FY16 Facilities and Equipment:
Scottsdale/ Rural Road bus stop improvements and traffic signal priority
Peoria Transit Center & PNR59th Avenue and Laveen PNRNorth Glendale PNR
51 Bus APC installationsRegional Communications UpgradeFare Collection System Development
State of Good Repair34 Bus engine rebubilds/ 5 transmissions
Over the next three years we will have facilities expenditures related to the Scottsdale Rural Road bus stop improvements and three park and rides under construction. Equipment expenditures will include Automatic Passenger Counters (APC) installation in 51 buses, a regional communication upgrade, and development of fare collection system to include mobile ticketing and smart card options. Questions and Answers Councilmember Sherwood asked how many buses we currently have APC’s on. Ms. McLaren said they are currently on all our light rail vehicles and 20 or 30 buses. Councilmember Sherwood asked if we intend to install on all buses. Mr. McCormack and Ms. McLaren said yes.
15
20
Fund Balance Projection
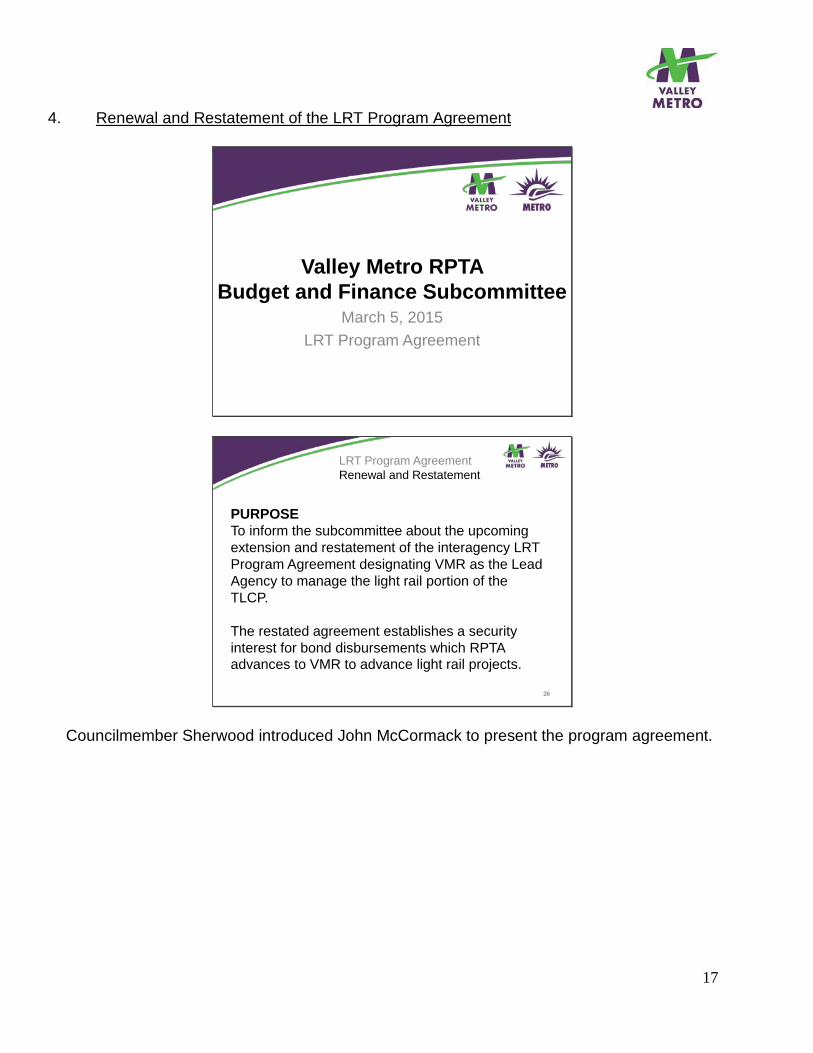
This chart shows 2006 to 2026 with bus in green and rail in purple. Questions and Answers Vice Mayor Pizzillo asked if we drop below policy minimum in 2018. Mr. McCormack said the policy minimum relates to the bus program – operating. Rail does not yet have a policy minimum other than year over year we must have a positive fund balance and the 20 year program must be fiscally balanced. Vice Mayor Pizzillo asked if we will be implementing a rail capital minimum fund balance policy. Mr. McCormack said we have not spent a lot of time on it at present due to the availability of bond funding to construct the projects. Councilmember Sherwood asked what Mr. McCormack’s opinion is on establishing a policy. Mr. McCormack said it is not necessary at this point in time. A policy minimum will need to be set in the last five years as our ability to bond will be diminished. Other sources of financing will be reviewed. Councilmember Sherwood asked how Prop. 400 will be affected at the end of the decade. Mr. McCormack said any debt we incur must be paid back by the end of this tax. There is no carryover of debt. The sales tax fully secures the debt and there are no collateral liabilities RPTA or the member cities.

16
21
Fund Balance Projection
Budget Schedule FY16
22
Jan 14th -- Board approves Agency goalsFeb 19th -- Board approves service changes effective April 2015Feb 20th – Preliminary FY16 Budget delivered to Fin. Working GroupFeb 27th – Executive Summary / 5 year Plan posted to website
Mar 20th – 30 day review period….Member City Comments
Mar 25th -- Draft Budget delivered to TMC / BFSApr 1st -- Budget presented for information to TMCApr 2nd -- Budget presented for information to BFSApr 16th -- Budget presented to Board of Directors for information
May 21st -- Board Meeting – Budget Adoption
Questions and Answers Councilmember Klapp asked if member city comments are shared with board members. Mr. McCormack said we receive comments on the budget through the Financial Working Groups and also provide responses to the Regional Transit Advisory Group (RTAG).
17
4. Renewal and Restatement of the LRT Program Agreement
Valley Metro RPTA Budget and Finance Subcommittee
March 5, 2015LRT Program Agreement
26
PURPOSETo inform the subcommittee about the upcoming extension and restatement of the interagency LRT Program Agreement designating VMR as the Lead Agency to manage the light rail portion of the TLCP.
The restated agreement establishes a security interest for bond disbursements which RPTA advances to VMR to advance light rail projects.
26
LRT Program AgreementRenewal and Restatement
Councilmember Sherwood introduced John McCormack to present the program agreement.
18
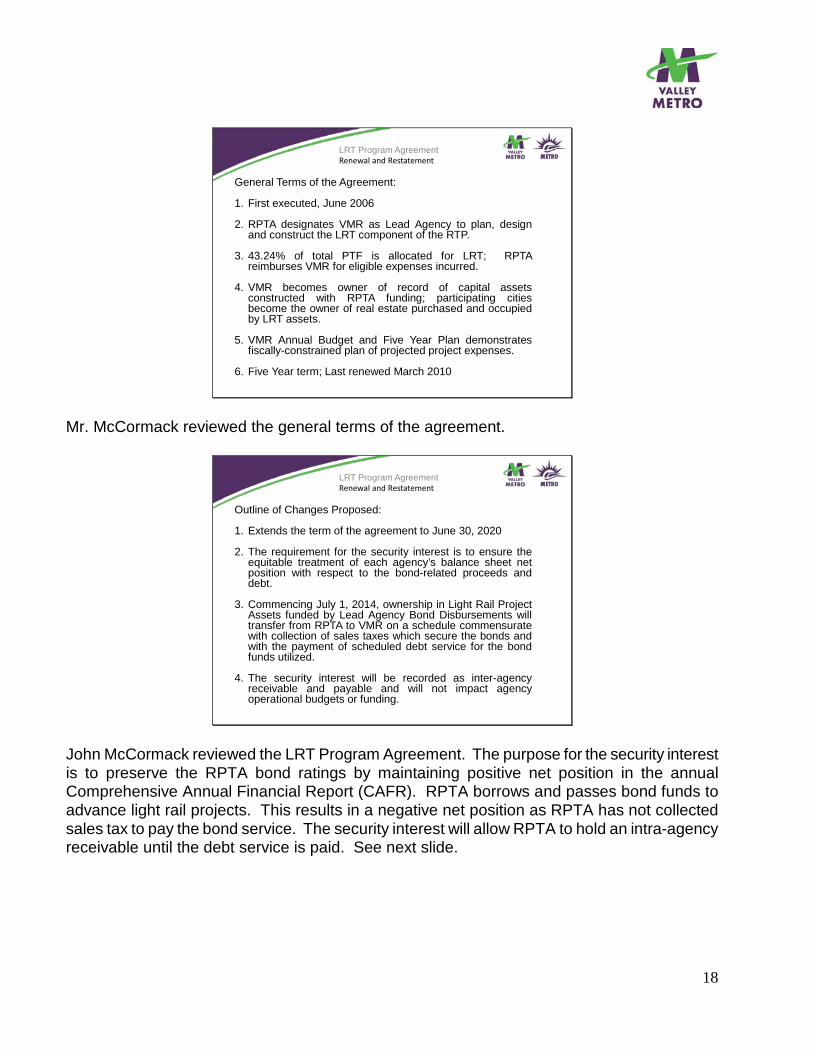
General Terms of the Agreement:
1. First executed, June 2006
2. RPTA designates VMR as Lead Agency to plan, designand construct the LRT component of the RTP.
3. 43.24% of total PTF is allocated for LRT; RPTAreimburses VMR for eligible expenses incurred.
4. VMR becomes owner of record of capital assetsconstructed with RPTA funding; participating citiesbecome the owner of real estate purchased and occupiedby LRT assets.
5. VMR Annual Budget and Five Year Plan demonstratesfiscally-constrained plan of projected project expenses.
6. Five Year term; Last renewed March 2010
LRT Program AgreementRenewal and Restatement
Mr. McCormack reviewed the general terms of the agreement.
Outline of Changes Proposed:
1. Extends the term of the agreement to June 30, 2020
2. The requirement for the security interest is to ensure theequitable treatment of each agency’s balance sheet netposition with respect to the bond-related proceeds anddebt.
3. Commencing July 1, 2014, ownership in Light Rail ProjectAssets funded by Lead Agency Bond Disbursements willtransfer from RPTA to VMR on a schedule commensuratewith collection of sales taxes which secure the bonds andwith the payment of scheduled debt service for the bondfunds utilized.
4. The security interest will be recorded as inter-agencyreceivable and payable and will not impact agencyoperational budgets or funding.
LRT Program AgreementRenewal and Restatement
John McCormack reviewed the LRT Program Agreement. The purpose for the security interest is to preserve the RPTA bond ratings by maintaining positive net position in the annual Comprehensive Annual Financial Report (CAFR). RPTA borrows and passes bond funds to advance light rail projects. This results in a negative net position as RPTA has not collected sales tax to pay the bond service. The security interest will allow RPTA to hold an intra-agency receivable until the debt service is paid. See next slide.
19
2929
LRT Program AgreementRenewal and Restatement
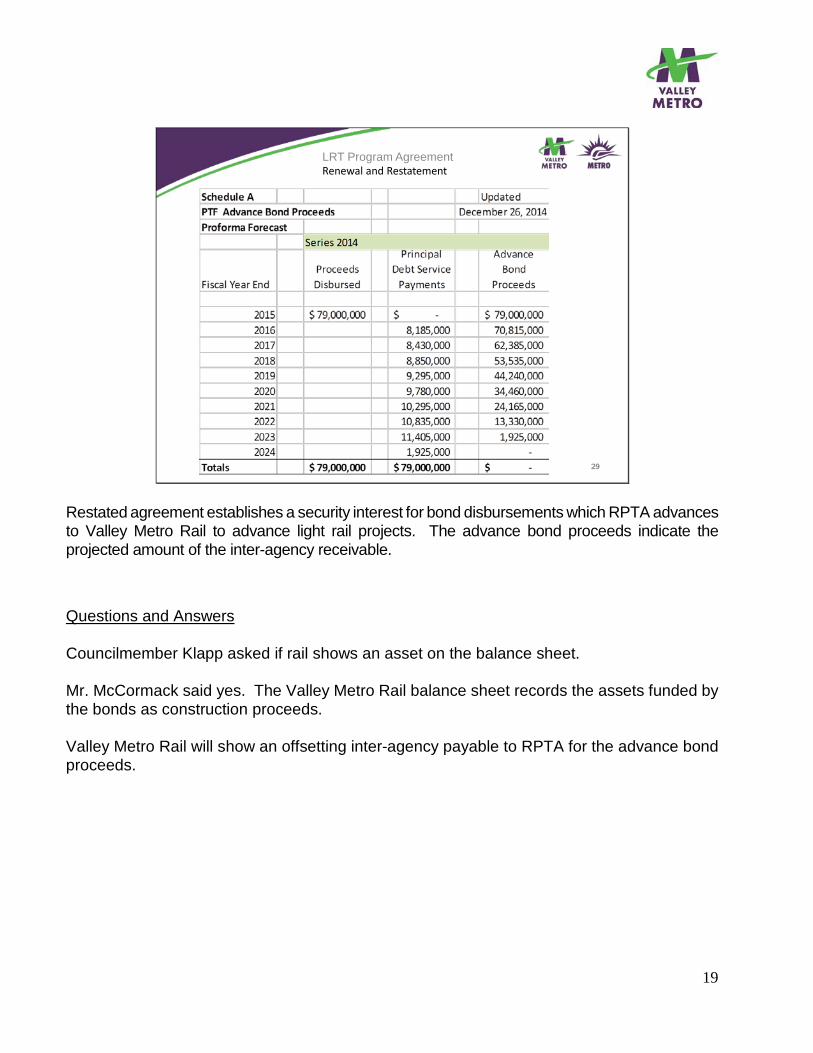
Restated agreement establishes a security interest for bond disbursements which RPTA advances to Valley Metro Rail to advance light rail projects. The advance bond proceeds indicate the projected amount of the inter-agency receivable.
Questions and Answers Councilmember Klapp asked if rail shows an asset on the balance sheet. Mr. McCormack said yes. The Valley Metro Rail balance sheet records the assets funded by the bonds as construction proceeds. Valley Metro Rail will show an offsetting inter-agency payable to RPTA for the advance bond proceeds.
20
5. Cash Investment Management Services Update
Councilmember Sherwood introduced John McCormack.
April Board Request
32
Goal:Maximize return on cash and investments in accordance with the RPTA Investment Policy and ARS Title 35 policies
Request for proposals for the delivery of Investment Management Services (IMS) to be funded by a portion of the investment earnings to be generated by the RPTA investment pool.
31
Valley Metro RPTACash Investment Management
ServicesBudget and Finance Subcommittee
March 5, 2015
31
Valley Metro RPTACash Investment Management
ServicesBudget and Finance Subcommittee
March 5, 2015
21
Cash and InvestmentsDecember 31, 2014
33
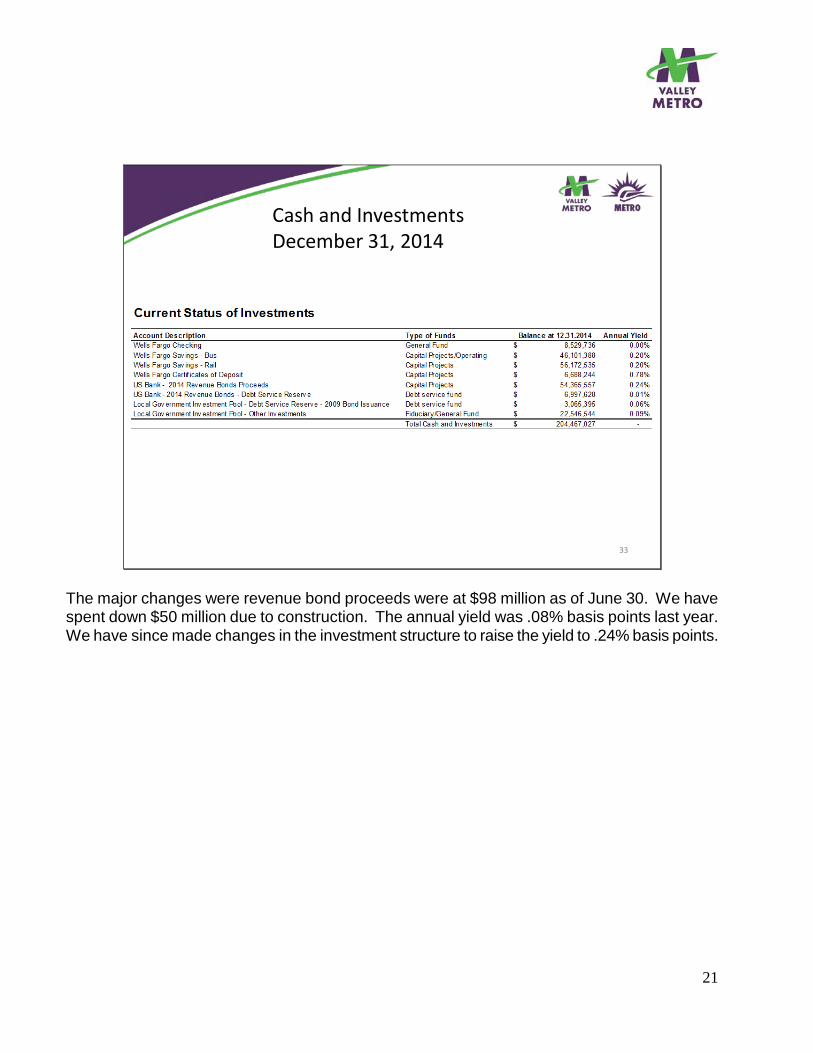
The major changes were revenue bond proceeds were at $98 million as of June 30. We have spent down $50 million due to construction. The annual yield was .08% basis points last year. We have since made changes in the investment structure to raise the yield to .24% basis points.

22
Cash and InvestmentsInterest Earnings
34
Description
Interest EarningsFirst Six Months
Interest Earnings
For 2/28/15Total- YTD
ActualTotal- FY15
Fcst RPTA Market Rate Savings - old account 1 24,106$ -$ 24,106$ 24,106$ RPTA Market Rate Savings - new account 2 9,246.77 24,608.64 33,855.41 50,783 Metro Market Rate Savings 3 54,173.35 9,017.23 63,190.58 94,786 WF Securities - Certificate on Deposit 4 15,106.34 2,958.66 18,065.00 27,098 2014 Revenue Bonds Debt Service 5 108.45 22.45 130.90 196 2014 Revenue Bonds Proceeds 6 33,733.89 (8,268.46) 25,465.43 60,357 2014 Revenue Bonds COI 7 0.44 0.06 0.50 1 Senior Debt Service Tax Exempt 09 Rail LGIP 7 8 429.41 122.83 552.24 828 Senior Debt Service Tax Exempt 09 Bus LGIP 7 9 390.37 111.66 502.03 753 Senior Debt Service Taxable 09 Rail LGIP 7 10 82.33 13.22 95.55 143 Senior Debt Service Taxable 09 Bus LGIP 7 11 92.88 15.17 108.05 162 PTF-RARF -State of AZ Pool 5 LGIP 12 11,638.95 2,634.03 14,272.98 21,409 PTF-Bus -State of AZ Pool 5 LGIP 13 112.32 21.74 134.06 201 PTF-LRT -State of AZ Pool 5 LGIP 14 181.63 35.15 216.78 325
149,403$ 31,292$ 180,696$ 281,150$
Mr. McCormack reviewed interest earnings. Questions and Answers Vice Mayor Pizzillo asked how we will pay the portfolio manager and if we will do better than depositing in the state fund. Mr. McCormack said we would pay the portfolio manager out of the anticipated increased yields and will be analyzing if we will do better versus depositing in the state fund.

23
35
Cash and InvestmentsForecast FY15 thru FY17
This slide shows a forecast of cash and investment balances each quarter.
24
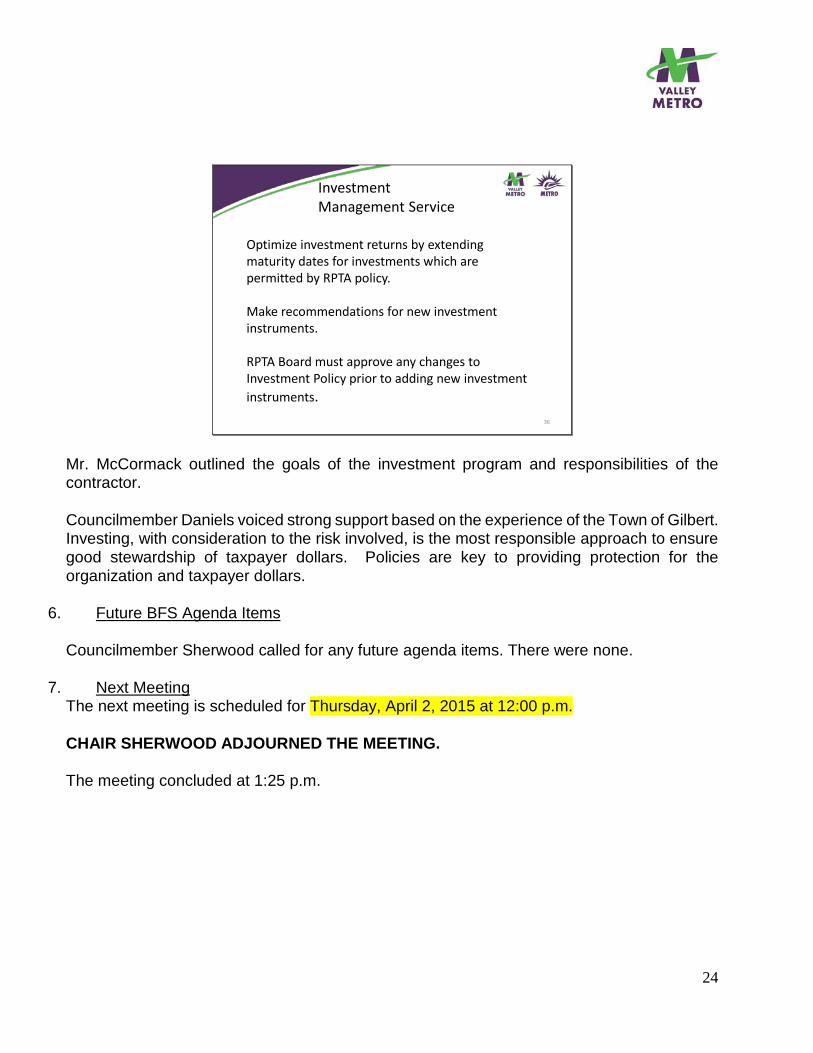
Investment Management Service
36
Optimize investment returns by extending maturity dates for investments which are permitted by RPTA policy.
Make recommendations for new investment instruments.
RPTA Board must approve any changes to Investment Policy prior to adding new investment instruments.
Mr. McCormack outlined the goals of the investment program and responsibilities of the contractor. Councilmember Daniels voiced strong support based on the experience of the Town of Gilbert. Investing, with consideration to the risk involved, is the most responsible approach to ensure good stewardship of taxpayer dollars. Policies are key to providing protection for the organization and taxpayer dollars.
6. Future BFS Agenda Items
Councilmember Sherwood called for any future agenda items. There were none.
7. Next Meeting The next meeting is scheduled for Thursday, April 2, 2015 at 12:00 p.m. CHAIR SHERWOOD ADJOURNED THE MEETING. The meeting concluded at 1:25 p.m.
VALLEY METRO • 101 N 1ST AVE • STE 1300 • PHOENIX AZ • 85003 • 602-262-7433
DATE AGENDA ITEM 3 March 27, 2015 SUBJECT Valley Metro Fiscal Year 2016 (FY16) Operating and Capital Budget and Five-Year Operating Forecast and Capital Program (FY16 thru FY20) PURPOSE To provide information to the Board of Directors regarding the FY16 Budget and Five-Year Operating Forecast and Capital Program (FY16 thru FY20). BACKGROUND/DISCUSSION/CONSIDERATION The Valley Metro Regional Public Transportation Authority (RPTA) FY16 combined operating and capital budget (the budget) is $284.7 million (M) and includes $133.9M in projects funded with Proposition 400 Public Transportation Fund (PTF) revenues. Of the $133.9M PTF revenues, $76.0M is for bus operating and bus capital and $57.9M is for light rail/high capacity transit capital. The preliminary FY16 operating and capital budget has been prepared with the goal of delivering a fiscally prudent, balanced budget using carry forwards, reserves and bond proceeds. The budget was developed in compliance with Board of Directors’ adopted budget, financial and Transit Life Cycle Program (TLCP) policies. The annual budget is prepared on an accrual basis and adopted by the Board of Directors each fiscal year. The legal level of budgetary control is the total annual appropriated budget. With respect to Capital Budgets, project contingency accounting is used to control expenditures within available project funding limits. With respect to Operating Budgets, encumbrance accounting is not used and all appropriations lapse at the end of the year. Prior to final adoption, a proposed budget is presented to the Board of Directors for review and public comment is received. Final adoption of the budget must be on or before June 30 of each year. The total operating budget of $158.7M represents a $5.1M (3.3%) increase from the previous year’s operating budget of $153.6M. The total capital budget of $126.0M represents a $45.1M (26.4%) decrease from the previous year’s capital budget of $171.1M. The major factor causing the decrease in the capital budget is a reduced level of LRT construction. Details and explanations of the major budget changes are discussed in the attached Budget Analysis and Overview document. With the agency integration, the RPTA and Valley Metro Rail (VMR) budgets are developed with a unified staff plan, with department managers planning the level of effort required to meet the bus and rail activities. Salary and overhead charges to bus and rail projects are based on actual time worked on each project. For FY16 there are 312 employees budgeted in the integrated agency, with 129 FTE’s budgeted to RPTA activities and 183 budgeted to VMR activities. Compensation budget based on 3%
2
increase. For staff salary changes, merit increases are evaluated based on employee performance; division level control to manage total costs within budget. Valley Metro completed a comprehensive survey of positions and pay grades with regional governmental agencies as well as transit peer cities located in the Western US. Pay grades are increasing by 2% in response to inflation trends which have occurred since last changes to agency-wide pay grades in July 2007. COMMITTEE PROCESS Preliminary Budget Review: Financial Working Group: February 24, 2015 for information RTAG: March 17, 2015 for information TMC: April 1, 2015 for information Budget and Finance Subcommittee: April 2, 2015 for information Board of Directors: April 16, 2015 for information Proposed Budget Adoption: TMC: May 6, 2015 for action Budget and Finance Subcommittee: May 14, 2015 for action Board of Directors: May 21, 2015 for action RECOMMENDATION This item is being presented for information only. CONTACT John P. McCormack Chief Financial Officer 602-495-7433 [email protected] ATTACHMENT Valley Metro Fiscal Year 2016 (FY16) Operating and Capital Budget and Five-Year Operating Forecast and Capital Program (FY16 thru FY20) Executive Summary A full copy of the Valley Metro Rail, Inc. Fiscal Year 2016 (FY16) Operating and Capital Budget and Five-Year Operating Forecast and Capital Program (FY 2016 thru 2020) can be found on our website.

Executive Summary - Fiscal Year 2016 Valley Metro Preliminary Annual Operating and Capital Budget
Valley Metro provides public transportation services for Maricopa County located in the Phoenix,
Arizona metropolitan area. The FY16 Preliminary Budget covers the 12 month period ending June 30,
2016. Services include fixed-route bus, paratransit, dial-a-ride, vanpool, regional planning, marketing,
customer service, alternative transportation, trip reduction, and fiscal management of Regional Public
Transportation Funds.
FY16 Sources of Funds
Total Sources of Funds for FY16 are $284.7M, a decrease of $40.0M or 12% from FY15. For FY16, PTF
sales tax revenues are increasing by $6.2M or 5% above last year. Federal Grant revenues are
decreasing by $4.7M (12%) primarily a reduction of CMAQ capital funding due to restructuring of the
Scottsdale/Rural Road corridor. For budget purposes, funding sources include bond proceeds in the
year of issuance. Consumption of those bond funds and cash reserves are down in FY16 to $35.9M due
to construction level decreases for light rail capital projects which are nearing completion.
$0.0 $20.0 $40.0 $60.0 $80.0 $100.0 $120.0 $140.0
Public Transportation Funds
Transit Service Agreements
Federal Grants
METRO Rail Reimbursement
Fixed Route Fare Revenues
AZ Lottery Proceeds
Regional Area Road Funds
Other Revenues
Carry forwards and Reserves
FY16 FY15 Valley Metro RPTA Sources of Funds FY16 vs FY15

2
FY16 Uses of Funds
Total Uses of Funds for FY16 are $284.7M, a decrease of $40.0M or 12% from FY15. Lead Agency
Disbursements are decreasing by $9.3M due to decrease in construction activity for light rail projects,
offset by increases in ADA disbursement and lead agency disbursements for regional bus fleet. Transit
service contracts and fuel are increasing by $4.5M or 5% primarily due to programmed contract rate
increases for bus services and paratransit ridership demand increases. Capital Expenditures are down
$4.6M primarily due to reductions in land acquisition and improvements of $14.0M related to
Scottsdale/Rural Road LINK project offset by increases in regional fleet and equipment purchases of
$9.4M. Lead Agency Bond disbursements are decreasing by $31.0M due to decreased LRT capital
construction activity on the Northwest Extension in Phoenix and Central Mesa Extension. In FY16, Carry
forwards to Reserves include $0.3M in capital reserve increases.
$0.0 $20.0 $40.0 $60.0 $80.0 $100.0
Lead agency disbursements
Transit service contracts & fuel
Capital
RPTA & METRO Personnel Costs
Bond Principal & Interest
Contractual Agreements
AZ Lottery Disbursements
Lead Agency Bond Disbursements
Other Costs
Carry forwards to Reserves
FY16 FY15 Valley Metro RPTA Uses of Funds FY16 vs FY15
3
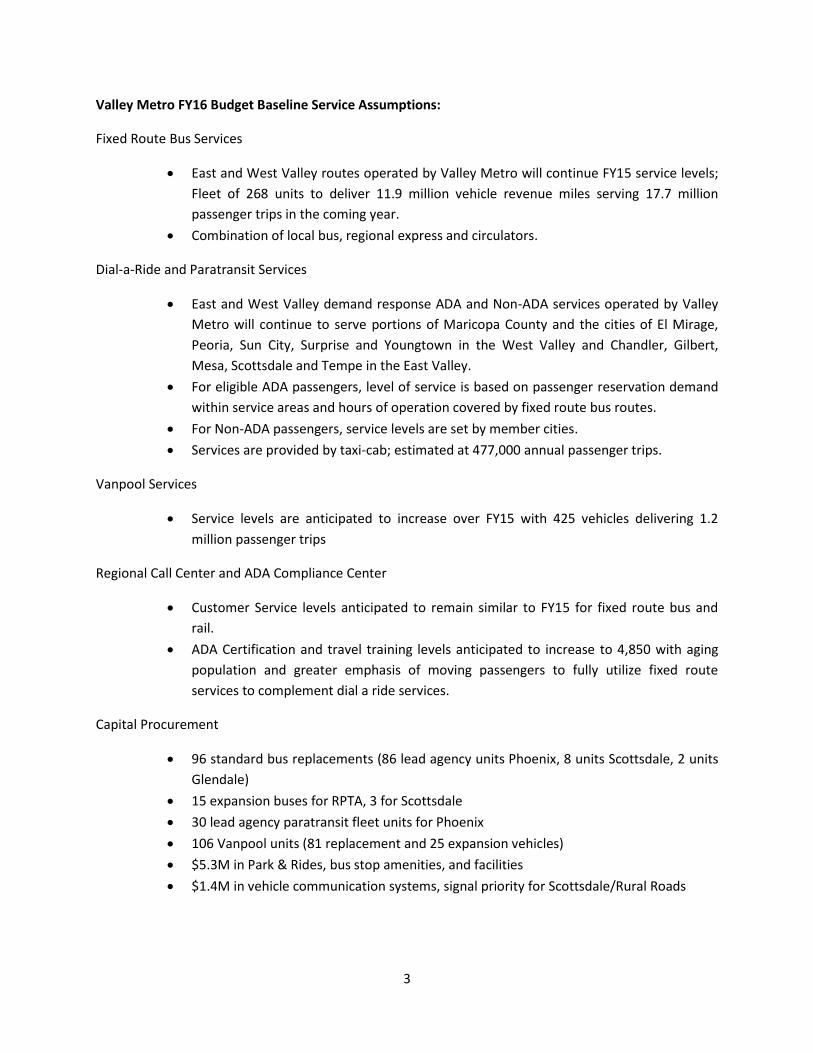
Valley Metro FY16 Budget Baseline Service Assumptions:
Fixed Route Bus Services
East and West Valley routes operated by Valley Metro will continue FY15 service levels;
Fleet of 268 units to deliver 11.9 million vehicle revenue miles serving 17.7 million
passenger trips in the coming year.
Combination of local bus, regional express and circulators.
Dial-a-Ride and Paratransit Services
East and West Valley demand response ADA and Non-ADA services operated by Valley
Metro will continue to serve portions of Maricopa County and the cities of El Mirage,
Peoria, Sun City, Surprise and Youngtown in the West Valley and Chandler, Gilbert,
Mesa, Scottsdale and Tempe in the East Valley.
For eligible ADA passengers, level of service is based on passenger reservation demand
within service areas and hours of operation covered by fixed route bus routes.
For Non-ADA passengers, service levels are set by member cities.
Services are provided by taxi-cab; estimated at 477,000 annual passenger trips.
Vanpool Services
Service levels are anticipated to increase over FY15 with 425 vehicles delivering 1.2
million passenger trips
Regional Call Center and ADA Compliance Center
Customer Service levels anticipated to remain similar to FY15 for fixed route bus and
rail.
ADA Certification and travel training levels anticipated to increase to 4,850 with aging
population and greater emphasis of moving passengers to fully utilize fixed route
services to complement dial a ride services.
Capital Procurement
96 standard bus replacements (86 lead agency units Phoenix, 8 units Scottsdale, 2 units
Glendale)
15 expansion buses for RPTA, 3 for Scottsdale
30 lead agency paratransit fleet units for Phoenix
106 Vanpool units (81 replacement and 25 expansion vehicles)
$5.3M in Park & Rides, bus stop amenities, and facilities
$1.4M in vehicle communication systems, signal priority for Scottsdale/Rural Roads

4
Valley Metro FY16 Initiatives:
Improving Passenger Services
Year 3 East Valley Bus Services Unification
In FY14, Valley Metro combined Tempe and Mesa based fixed route operations resulting in greater efficiency
Savings to Region enables stretching our sales tax revenues to provide more service
Year 4 East Valley Dial-a-Ride
In FY13, Valley Metro instituted a taxi-based Dial-a-Ride System
Passengers receive direct route trips getting to destination faster
Savings enables passengers to receive more trips versus traditional Dial-a-Ride
Regional Services Marketing Initiatives
Improve passenger information systems o Upgrade the Valley Metro website providing simpler navigation, greater
accessibility and further integration of fare purchasing tools and use by mobile
devices.
o Begin implementation of an improved rider alerts system to notify customers of
service delays on multiple platforms including the website, trip planner, text
message and mobile devices.
o Evolve the Transit Book to better integrate new technologies and reduce waste.
o Continue the roll-out of the new Ridekick™ mobile application, which provides
riders with trip planning services, interactive maps and the ability to bookmark
their favorite routes.
o Continue wayfinding program improvements by implementing new signage at
regional park-and-rides.
Projection of Costs
$ millions
East Valley Fixed Route Bus Service FY13 FY14 FY15 FY16
Costs before Unification $67.3 $69.3 $71.4 $73.5
(assumes 3% per year inflation)
Costs after Unification N/A $60.6 $65.8 $67.1
Estimated cost savings $8.7 $5.5 $6.4
12% 8% 9%
East Valley Dial-a-Ride Service FY12 FY13 FY14 FY15 Fcst FY16 Fcst
Trips Delivered 203,000 252,000 283,000 305,000 325,000
Net Program Cost after Fares $M 8.822$ 6.798$ 7.667$ 7.634$ 8.568$
Net Cost per Trip 43.46$ 27.00$ 27.05$ 25.01$ 26.34$
5
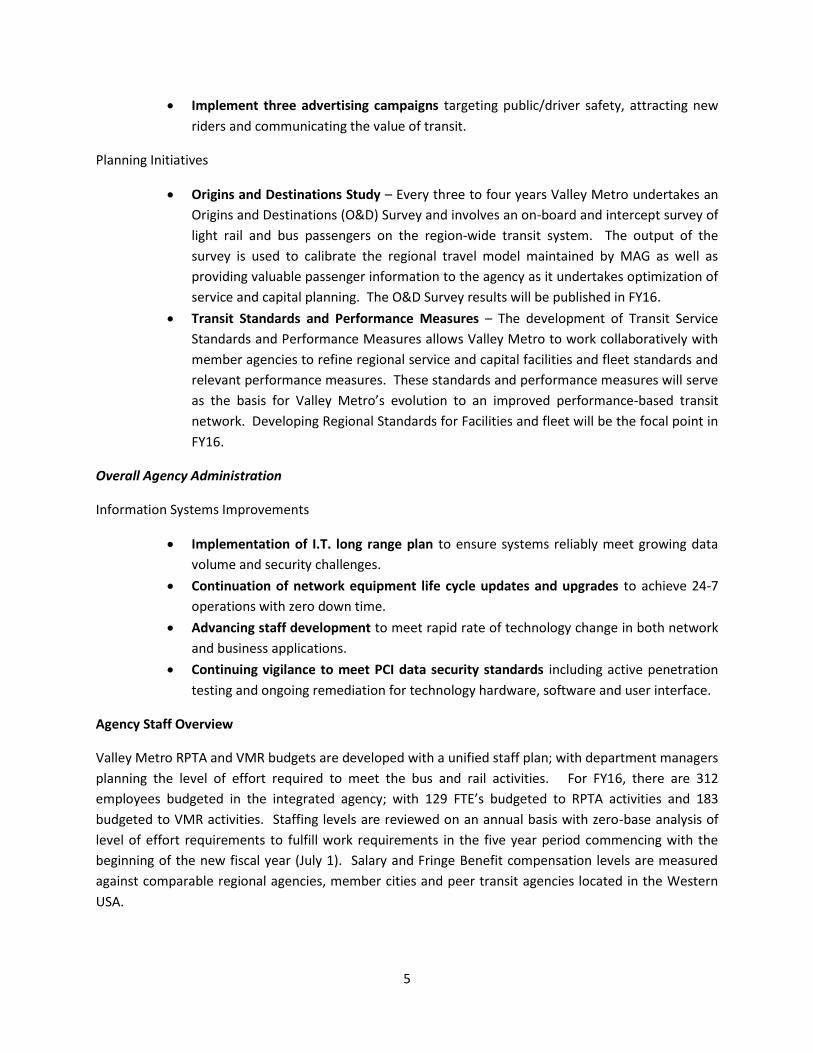
Implement three advertising campaigns targeting public/driver safety, attracting new
riders and communicating the value of transit.
Planning Initiatives
Origins and Destinations Study – Every three to four years Valley Metro undertakes an
Origins and Destinations (O&D) Survey and involves an on-board and intercept survey of
light rail and bus passengers on the region-wide transit system. The output of the
survey is used to calibrate the regional travel model maintained by MAG as well as
providing valuable passenger information to the agency as it undertakes optimization of
service and capital planning. The O&D Survey results will be published in FY16.
Transit Standards and Performance Measures – The development of Transit Service
Standards and Performance Measures allows Valley Metro to work collaboratively with
member agencies to refine regional service and capital facilities and fleet standards and
relevant performance measures. These standards and performance measures will serve
as the basis for Valley Metro’s evolution to an improved performance-based transit
network. Developing Regional Standards for Facilities and fleet will be the focal point in
FY16.
Overall Agency Administration
Information Systems Improvements
Implementation of I.T. long range plan to ensure systems reliably meet growing data
volume and security challenges.
Continuation of network equipment life cycle updates and upgrades to achieve 24-7
operations with zero down time.
Advancing staff development to meet rapid rate of technology change in both network
and business applications.
Continuing vigilance to meet PCI data security standards including active penetration
testing and ongoing remediation for technology hardware, software and user interface.
Agency Staff Overview
Valley Metro RPTA and VMR budgets are developed with a unified staff plan; with department managers
planning the level of effort required to meet the bus and rail activities. For FY16, there are 312
employees budgeted in the integrated agency; with 129 FTE’s budgeted to RPTA activities and 183
budgeted to VMR activities. Staffing levels are reviewed on an annual basis with zero-base analysis of
level of effort requirements to fulfill work requirements in the five year period commencing with the
beginning of the new fiscal year (July 1). Salary and Fringe Benefit compensation levels are measured
against comparable regional agencies, member cities and peer transit agencies located in the Western
USA.
6
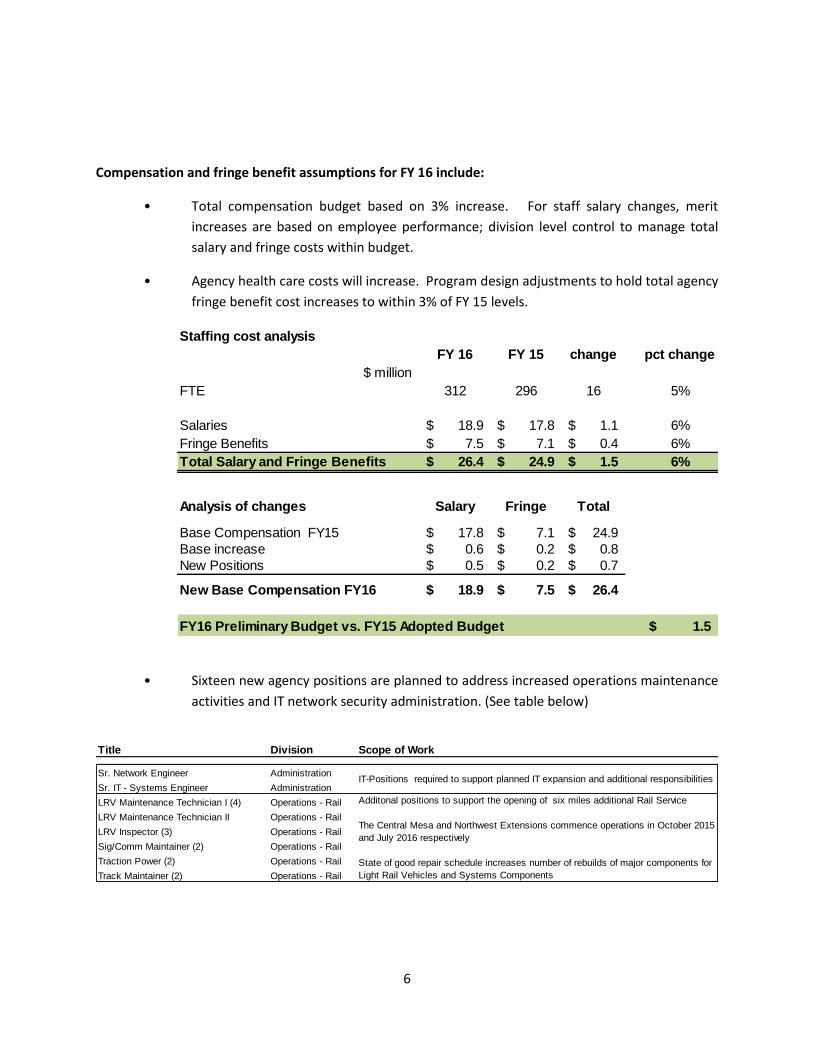
Compensation and fringe benefit assumptions for FY 16 include:
• Total compensation budget based on 3% increase. For staff salary changes, merit
increases are based on employee performance; division level control to manage total
salary and fringe costs within budget.
• Agency health care costs will increase. Program design adjustments to hold total agency
fringe benefit cost increases to within 3% of FY 15 levels.
• Sixteen new agency positions are planned to address increased operations maintenance
activities and IT network security administration. (See table below)
Staffing cost analysis
FY 16 FY 15 change pct change
$ million
FTE 312 296 16 5%
Salaries 18.9$ 17.8$ 1.1$ 6%
Fringe Benefits 7.5$ 7.1$ 0.4$ 6%
Total Salary and Fringe Benefits 26.4$ 24.9$ 1.5$ 6%
Analysis of changes Salary Fringe Total
Base Compensation FY15 17.8$ 7.1$ 24.9$
Base increase 0.6$ 0.2$ 0.8$
New Positions 0.5$ 0.2$ 0.7$
New Base Compensation FY16 18.9$ 7.5$ 26.4$
FY16 Preliminary Budget vs. FY15 Adopted Budget 1.5$
Title Division Scope of Work
Sr. Network Engineer Administration
Sr. IT - Systems Engineer Administration
LRV Maintenance Technician I (4) Operations - Rail
LRV Maintenance Technician II Operations - Rail
LRV Inspector (3) Operations - Rail
Sig/Comm Maintainer (2) Operations - Rail
Traction Power (2) Operations - Rail
Track Maintainer (2) Operations - Rail
IT-Positions required to support planned IT expansion and additional responsibilities
Additonal positions to support the opening of six miles additional Rail Service
The Central Mesa and Northwest Extensions commence operations in October 2015
and July 2016 respectively
State of good repair schedule increases number of rebuilds of major components for
Light Rail Vehicles and Systems Components
7
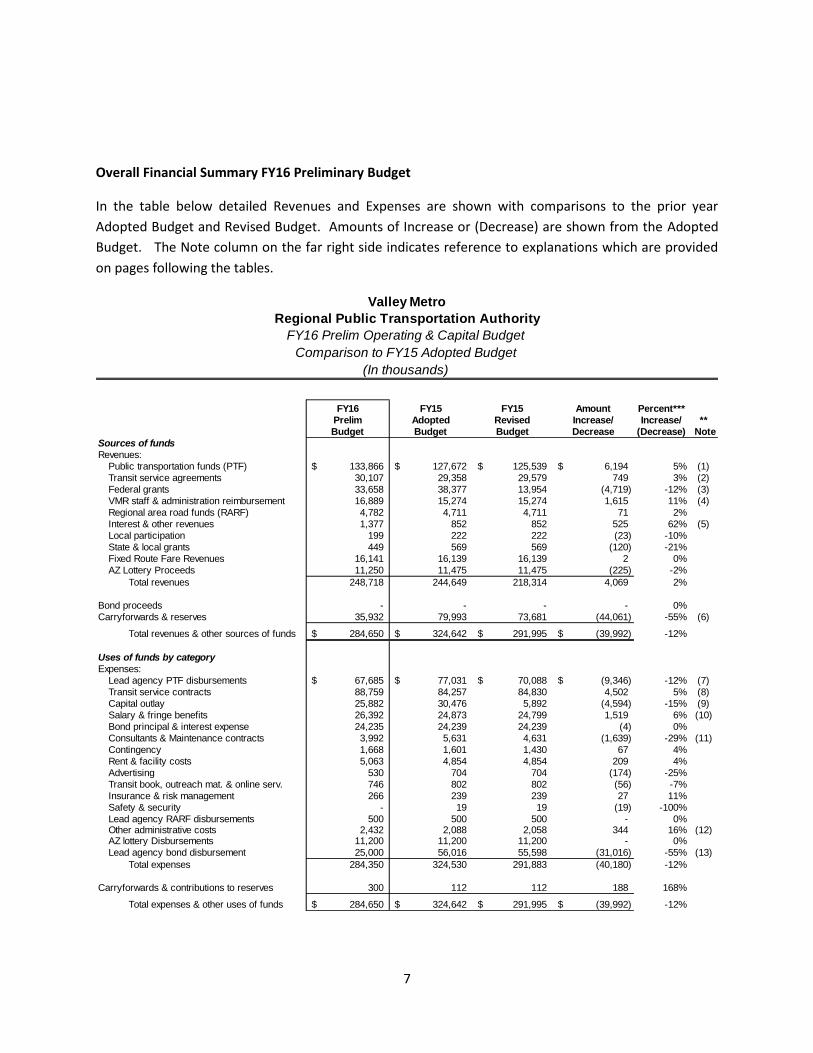
Overall Financial Summary FY16 Preliminary Budget
In the table below detailed Revenues and Expenses are shown with comparisons to the prior year
Adopted Budget and Revised Budget. Amounts of Increase or (Decrease) are shown from the Adopted
Budget. The Note column on the far right side indicates reference to explanations which are provided
on pages following the tables.
Valley Metro
Regional Public Transportation Authority
FY16 Prelim Operating & Capital Budget
Comparison to FY15 Adopted Budget
(In thousands)
FY16 FY15 FY15 Amount Percent***
Prelim Adopted Revised Increase/ Increase/ **
Budget Budget Decrease (Decrease) Note
Sources of funds
Revenues:
Public transportation funds (PTF) $ 133,866 $ 127,672 $ 125,539 $ 6,194 5% (1)
Transit service agreements 30,107 29,358 29,579 749 3% (2)
Federal grants 33,658 38,377 13,954 (4,719) -12% (3)
VMR staff & administration reimbursement 16,889 15,274 15,274 1,615 11% (4)
Regional area road funds (RARF) 4,782 4,711 4,711 71 2%
Interest & other revenues 1,377 852 852 525 62% (5)
Local participation 199 222 222 (23) -10%
State & local grants 449 569 569 (120) -21%
Fixed Route Fare Revenues 16,141 16,139 16,139 2 0%
AZ Lottery Proceeds 11,250 11,475 11,475 (225) -2%
Total revenues 248,718 244,649 218,314 4,069 2%
Bond proceeds - - - - 0%
Carryforwards & reserves 35,932 79,993 73,681 (44,061) -55% (6)
Total revenues & other sources of funds $ 284,650 $ 324,642 $ 291,995 $ (39,992) -12%
Uses of funds by category
Expenses:
Lead agency PTF disbursements $ 67,685 $ 77,031 $ 70,088 $ (9,346) -12% (7)
Transit service contracts 88,759 84,257 84,830 4,502 5% (8)
Capital outlay 25,882 30,476 5,892 (4,594) -15% (9)
Salary & fringe benefits 26,392 24,873 24,799 1,519 6% (10)
Bond principal & interest expense 24,235 24,239 24,239 (4) 0%
Consultants & Maintenance contracts 3,992 5,631 4,631 (1,639) -29% (11)
Contingency 1,668 1,601 1,430 67 4%
Rent & facility costs 5,063 4,854 4,854 209 4%
Advertising 530 704 704 (174) -25%
Transit book, outreach mat. & online serv. 746 802 802 (56) -7%
Insurance & risk management 266 239 239 27 11%
Safety & security - 19 19 (19) -100%
Lead agency RARF disbursements 500 500 500 - 0%Other administrative costs 2,432 2,088 2,058 344 16% (12)AZ lottery Disbursements 11,200 11,200 11,200 - 0%
Lead agency bond disbursement 25,000 56,016 55,598 (31,016) -55% (13)
Total expenses 284,350 324,530 291,883 (40,180) -12%
Carryforwards & contributions to reserves 300 112 112 188 168%
Total expenses & other uses of funds $ 284,650 $ 324,642 $ 291,995 $ (39,992) -12%
Budget
8
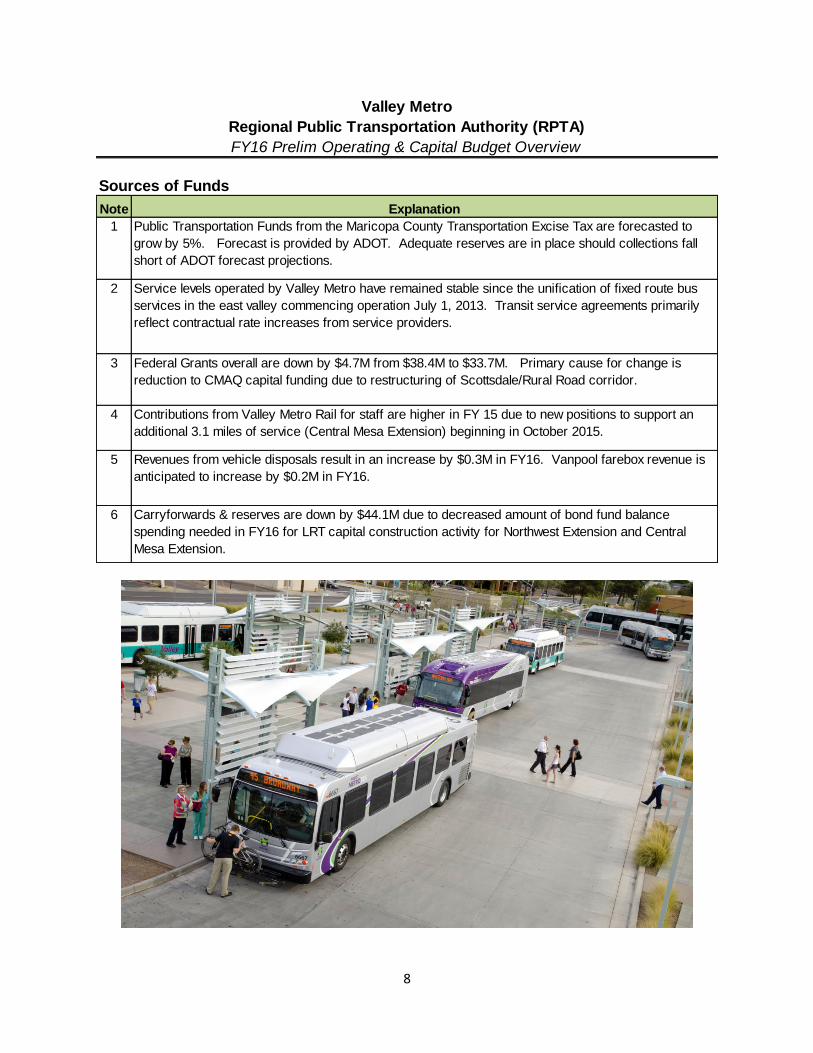
Valley Metro
Regional Public Transportation Authority (RPTA)
FY16 Prelim Operating & Capital Budget Overview
Sources of Funds
Note
1
2
3
4
5
6
Revenues from vehicle disposals result in an increase by $0.3M in FY16. Vanpool farebox revenue is
anticipated to increase by $0.2M in FY16.
Carryforwards & reserves are down by $44.1M due to decreased amount of bond fund balance
spending needed in FY16 for LRT capital construction activity for Northwest Extension and Central
Mesa Extension.
Explanation
Public Transportation Funds from the Maricopa County Transportation Excise Tax are forecasted to
grow by 5%. Forecast is provided by ADOT. Adequate reserves are in place should collections fall
short of ADOT forecast projections.
Service levels operated by Valley Metro have remained stable since the unification of fixed route bus
services in the east valley commencing operation July 1, 2013. Transit service agreements primarily
reflect contractual rate increases from service providers.
Federal Grants overall are down by $4.7M from $38.4M to $33.7M. Primary cause for change is
reduction to CMAQ capital funding due to restructuring of Scottsdale/Rural Road corridor.
Contributions from Valley Metro Rail for staff are higher in FY 15 due to new positions to support an
additional 3.1 miles of service (Central Mesa Extension) beginning in October 2015.

9
Valley Metro
Regional Public Transportation Authority (RPTA)
FY16 Prelim Operating & Capital Budget Overview
Uses of Funds by Category
Note
7
8
9
10
11
12
13
Overall staff cost in FY16 $26.4M is 9% of total budget. Salary and Fringe increase $1.5M, broken
down as follows: base salary and fringe increase $0.8M, new positions $0.7M.
Reductions to consulting contracts are primarily due to decreasing services resulting from the wrap up
of the passenger Origins and Destination study conducted in 2015.
Lead Agency Bond Disbursements are down by $31.0M from $56.0 to $25.0M due to decreased LRT
capital construction activity on the Northwest Extension in Phoenix and Central Mesa Extension.
Other administrative cost increases include employee development and training expenditures to
improve agency performance and increasing data and telecommunication costs.
Decrease in PTF Lead Agency Disbursements is primarily due to a major decrease in construction
activity for light rail projects, offset by increases in ADA disbursements and lead agency
disbursements for regional bus fleet.
Fixed route bus service levels operated by Valley Metro have remained stable since the unification in
the East Valley commencing operation July 1, 2013. Transit service contracts primarily reflect
contractual rate increases from fixed route service providers. Paratransit service levels are forecasted
to increase by 10% and contract rates are scheduled to increase by 3%.
Capital Outlay was reduced by $4.6M due to reductions in land acquisition and improvements of
$14.0M related to the Scottsdale/Rural Road Link project offset by increases in regional fleet and
equipment purchases of $9.4M.
Explanation

10
Valley Metro
Regional Public Transportation Authority
FY16 Prelim Operating & Capital Budget
Comparison to FY15 Adopted Budget
(In thousands)
FY16 FY15 FY15 Amount Percent***
Prelim Adopted Revised Increase/ Increase/ **
Budget Budget Decrease (Decrease) Note
Uses of funds by Division
Operating:
Operations $ 120,318 $ 115,622 $ 116,195 $ 4,695 4% (14)
Communications & Marketing 5,020 4,831 4,831 189 4%
Finance, Administration & Org. Dev. 1,312 1,366 1,366 (54) -4%
Planning & Development 2,184 3,654 3,654 (1,470) -40% (15)
Chief Executive Officer's Division 1,230 1,120 1,120 110 10%
Non-Departmental 28,589 26,974 26,974 1,615 6% (16)
Total Operating Budget 158,653 153,568 154,141 5,085 3.3%
Capital:
Design & Construction 125 101 101 24 24%
Valley Metro Rail 64,044 109,206 108,788 (45,162) -41% (17)
Bus and other transit 61,828 61,767 28,965 61 0%
Total Capital Budget 125,997 171,074 137,854 (45,077) -26%
Total Operating & Capital Budget $ 284,650 $ 324,642 $ 291,995 $ (39,992) -12%
Budget
Valley Metro
Regional Public Transportation Authority (RPTA)
FY16 Prelim Operating & Capital Budget Overview
Uses of Funds by Division
Note
14
15
16
17 Valley Metro Rail capital activities down $45.2M due to decreased lead agency disbursements to
support LRT capital construction.
Explanation
Non-Departmental expenses are up by $1.6M primarily due to Valley Metro Rail staffing to support the
additional 3 miles of rail operations commencing in October 2015. All Valley Metro Rail staff are
employees of the RPTA whose costs are fully funded by Valley Metro Rail Inc. revenue sources.
Operations Division up $4.7M primarily due to programmed contractual increases for Fixed Route bus
service of $1.5M (see project 2015 and 2017), increases in contract payments to City of Phoenix of
$.8M (see Project 2010 ) and increases for paratransit services of $1.2M (see projects 2030, 2047,
2048). ADA lead agency disbursements increase by $0.7M and regional vanpool, customer service,
and contingency up by $0.5M.
Reductions to Planning and Development are primarily due to decreasing consulting services related to
the wrap up of the passenger Origins and Destination study.
11
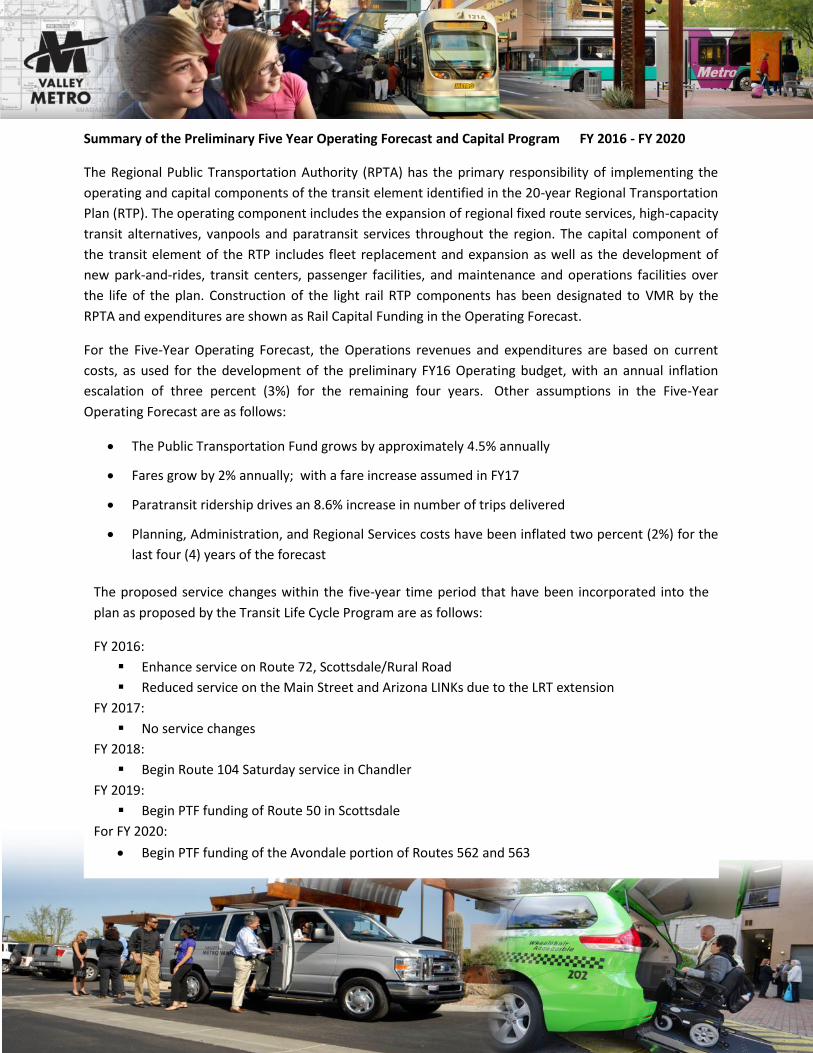
Summary of the Preliminary Five Year Operating Forecast and Capital Program FY 2016 - FY 2020
The Regional Public Transportation Authority (RPTA) has the primary responsibility of implementing the
operating and capital components of the transit element identified in the 20-year Regional Transportation
Plan (RTP). The operating component includes the expansion of regional fixed route services, high-capacity
transit alternatives, vanpools and paratransit services throughout the region. The capital component of
the transit element of the RTP includes fleet replacement and expansion as well as the development of
new park-and-rides, transit centers, passenger facilities, and maintenance and operations facilities over
the life of the plan. Construction of the light rail RTP components has been designated to VMR by the
RPTA and expenditures are shown as Rail Capital Funding in the Operating Forecast.
For the Five-Year Operating Forecast, the Operations revenues and expenditures are based on current
costs, as used for the development of the preliminary FY16 Operating budget, with an annual inflation
escalation of three percent (3%) for the remaining four years. Other assumptions in the Five-Year
Operating Forecast are as follows:
The Public Transportation Fund grows by approximately 4.5% annually
Fares grow by 2% annually; with a fare increase assumed in FY17
Paratransit ridership drives an 8.6% increase in number of trips delivered
Planning, Administration, and Regional Services costs have been inflated two percent (2%) for the
last four (4) years of the forecast
The proposed service changes within the five-year time period that have been incorporated into the
plan as proposed by the Transit Life Cycle Program are as follows:
FY 2016:
Enhance service on Route 72, Scottsdale/Rural Road
Reduced service on the Main Street and Arizona LINKs due to the LRT extension
FY 2017:
No service changes
FY 2018:
Begin Route 104 Saturday service in Chandler
FY 2019:
Begin PTF funding of Route 50 in Scottsdale
For FY 2020:
Begin PTF funding of the Avondale portion of Routes 562 and 563

12
Summary of the Preliminary Five Year Operating Forecast and Capital Program FY 2016 - FY 2020
Five-Year Operating Forecast FY16-FY20
(thousands)
5-Year
Total
Revenues
Public Transportation Fund (ADOT) 733,932$
PTF Bond Proceeds 61,257
Less: Debt Service Bus & Rail (149,124)
Less: Rail Capital Funding (current) (253,861)
Net PTF for Operations 392,204$
Other Regional Funds 25,749$
Federal Funds 41,119
Transit service reimbursements 165,486
Fare Revenues 96,527
Interest and other revenue 160
Total revenues 721,246$
(thousands)
5-Year
Expenditures Total
Operations
Fixed Route 447,265$
Paratransit - EVDAR 51,398
Alternative Trans. Ridechoice, NWDAR, MS 20,217
Vanpool Service 5,545
ADA 100,992
Total operations expenditures 625,417$
Transportation Demand Management 7,140$
Planning & Administration 24,594
Regional Services 41,731
Safety & Security 1,835
Operations Contingency 1,150
Total expenditures 701,867$
Excess/(deficiency) of revenues
over expenditures - operations 19,379$
Less: Bus Capital Funding (61,699)$
Undesignated fund balance, July 1, 2015 77,512$
Excess/(deficiency) (42,320)
Undesignated fund balance, June 30, 2020 35,192$
The Revenue Operating Forecast
begins with the PTF sales tax
funds, which are estimated by
ADOT team of economists.
Debt Service and Rail Capital
Funding requirements are
deducted to derive PTF available
for operations.
Operations expenditures for the
Five Year period are impacted by
service contract increases and
paratransit demand ridership.
Due to aging population,
paratransit ridership is
forecasted to grow significantly.
Regional Services, Planning and
Admin. costs are forecasted to
grow about 2% per year.
A $19.4M operating surplus is
projected, which will be used to
fund bus capital purchases along
with existing fund balance which
has been built to accommodate
the cyclical bus capital
drawdown.
13
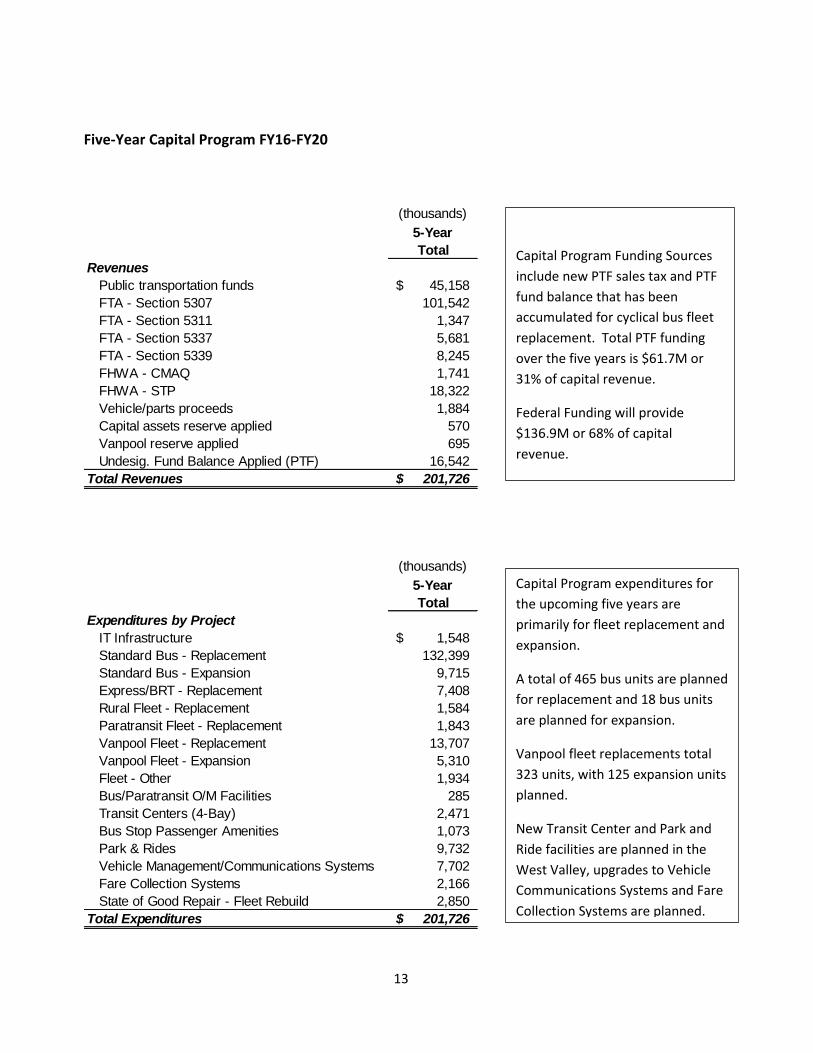
Five-Year Capital Program FY16-FY20
(thousands)
5-Year
Total
Revenues
Public transportation funds 45,158$
FTA - Section 5307 101,542
FTA - Section 5311 1,347
FTA - Section 5337 5,681
FTA - Section 5339 8,245
FHWA - CMAQ 1,741
FHWA - STP 18,322
Vehicle/parts proceeds 1,884
Capital assets reserve applied 570
Vanpool reserve applied 695
Undesig. Fund Balance Applied (PTF) 16,542
Total Revenues 201,726$
(thousands)
5-Year
Total
Expenditures by Project
IT Infrastructure 1,548$
Standard Bus - Replacement 132,399
Standard Bus - Expansion 9,715
Express/BRT - Replacement 7,408
Rural Fleet - Replacement 1,584
Paratransit Fleet - Replacement 1,843
Vanpool Fleet - Replacement 13,707
Vanpool Fleet - Expansion 5,310
Fleet - Other 1,934
Bus/Paratransit O/M Facilities 285
Transit Centers (4-Bay) 2,471
Bus Stop Passenger Amenities 1,073
Park & Rides 9,732
Vehicle Management/Communications Systems 7,702
Fare Collection Systems 2,166
State of Good Repair - Fleet Rebuild 2,850
Total Expenditures 201,726$
Capital Program Funding Sources
include new PTF sales tax and PTF
fund balance that has been
accumulated for cyclical bus fleet
replacement. Total PTF funding
over the five years is $61.7M or
31% of capital revenue.
Federal Funding will provide
$136.9M or 68% of capital
revenue.
Capital Program expenditures for
the upcoming five years are
primarily for fleet replacement and
expansion.
A total of 465 bus units are planned
for replacement and 18 bus units
are planned for expansion.
Vanpool fleet replacements total
323 units, with 125 expansion units
planned.
New Transit Center and Park and
Ride facilities are planned in the
West Valley, upgrades to Vehicle
Communications Systems and Fare
Collection Systems are planned.
VALLEY METRO • 101 N 1ST AVE • STE 1300 • PHOENIX AZ • 85003 • 602-262-7433
DATE AGENDA ITEM 4 March 27, 2015 SUBJECT Fiscal Year 2015 (FY15) Third Quarter Report PURPOSE To provide a quarterly update of activities at Valley Metro.
BACKGROUND/DISCUSSION/CONSIDERATION John McCormack will provide an informational update on the previous quarter ongoing activity at Valley Metro for the Finance Division COST AND BUDGET None COMMITTEE PROCESS RTAG: March 12, 2015 for information TMC: April 1, 2015 for information Budget and Finance Subcommittee: April 2, 2015 for information Board of Directors: April 16, 2015 for information RECOMMENDATION This item is presented for information only. CONTACT John P. McCormack Chief Financial Officer
602-262-7433 [email protected] ATTACHMENT None

VALLEY METRO • 101 N 1ST AVE • STE 1300 • PHOENIX AZ • 602-262-7433
DATE AGENDA ITEM 5 March 27, 2015 SUBJECT Future BFS Agenda Item Requests PURPOSE For information BACKGROUND/DISCUSSION/CONSIDERATION Chair Sherwood will request future BFS agenda items from members.
May 2015 Tentative Agenda
• FY16 Budget & FY 16 – 20 Five Year Plan for approval • Draft Transit Life Cycle Program – 2015 Update for information
COST AND BUDGET None COMMITTEE PROCESS None RECOMMENDATION For information only CONTACT John P. McCormack Chief Financial Officer 602-495-7433 [email protected] ATTACHMENTS None
VALLEY METRO • 101 N 1ST AVE • STE 1300 • PHOENIX AZ • 602-262-7433
DATE AGENDA ITEM 6 March 27, 2015 SUBJECT Next Meeting PURPOSE For information and discussion BACKGROUND/DISCUSSION/CONSIDERATION The next meeting of the BFS is tentatively scheduled for Thursday, May 14, 2015 at 12:00 p.m.
COST AND BUDGET None COMMITTEE PROCESS None RECOMMENDATION For information only CONTACT John P. McCormack Chief Financial Officer 602-495-7433 [email protected] ATTACHMENTS None