medium-sized industrial companies in north-east italy ... · 3 medium-sized industrial companies in...
TRANSCRIPT
Ferrara, 8 May 2009
Medium-sized industrial companies in North-EastItaly, 1997-2006 and 2007-2008
Emanuela Salerno, Mediobanca Research Department
Medium-sized industrial companies in North-East
Italy, 1997-2006 and 2007-2008
2
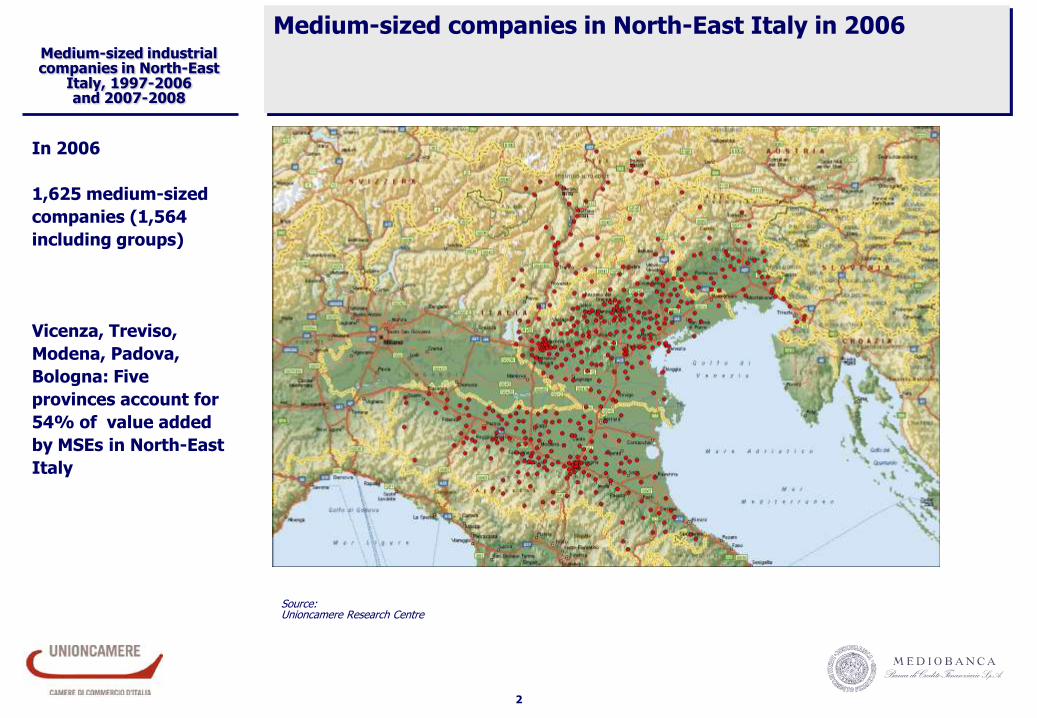
In 2006
1,625 medium-sized
companies (1,564
including groups)
Vicenza, Treviso,
Modena, Padova,
Bologna: Five
provinces account for
54% of value added
by MSEs in North-East
Italy
Medium-sized companies in North-East Italy in 2006
Source: Unioncamere Research Centre
3
Medium-sized industrial companies in North-East
Italy, 1997-2006 and 2007-2008
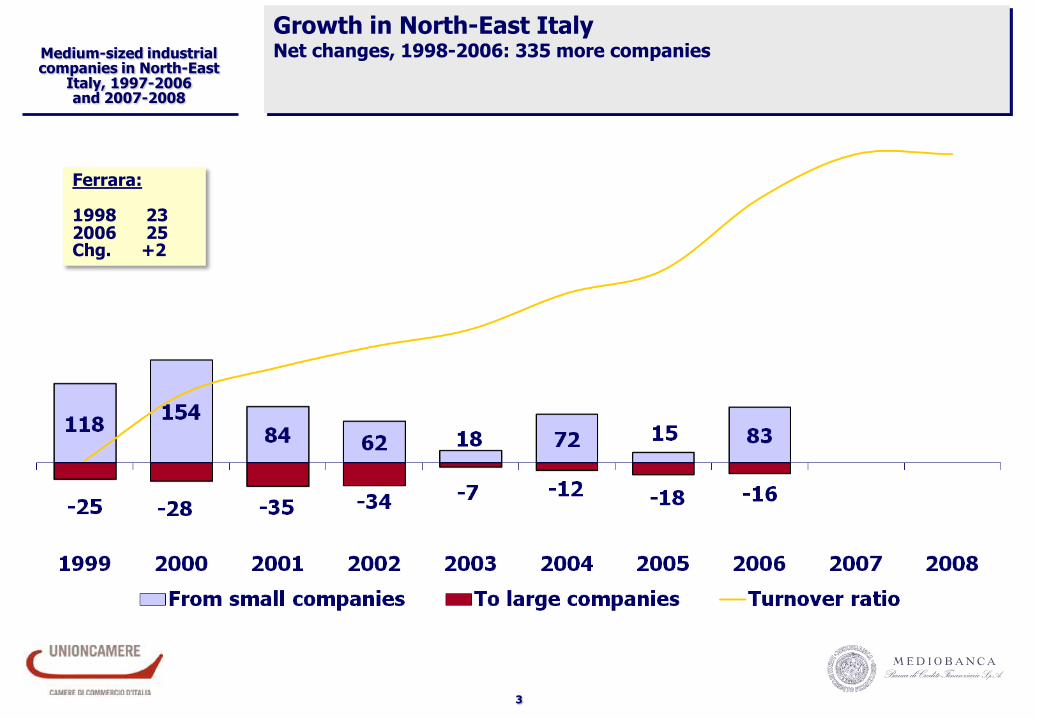
Growth in North-East ItalyNet changes, 1998-2006: 335 more companies
Ferrara:
1998 232006 25Chg. +2
4
Medium-sized industrial companies in North-East
Italy, 1997-2006 and 2007-2008
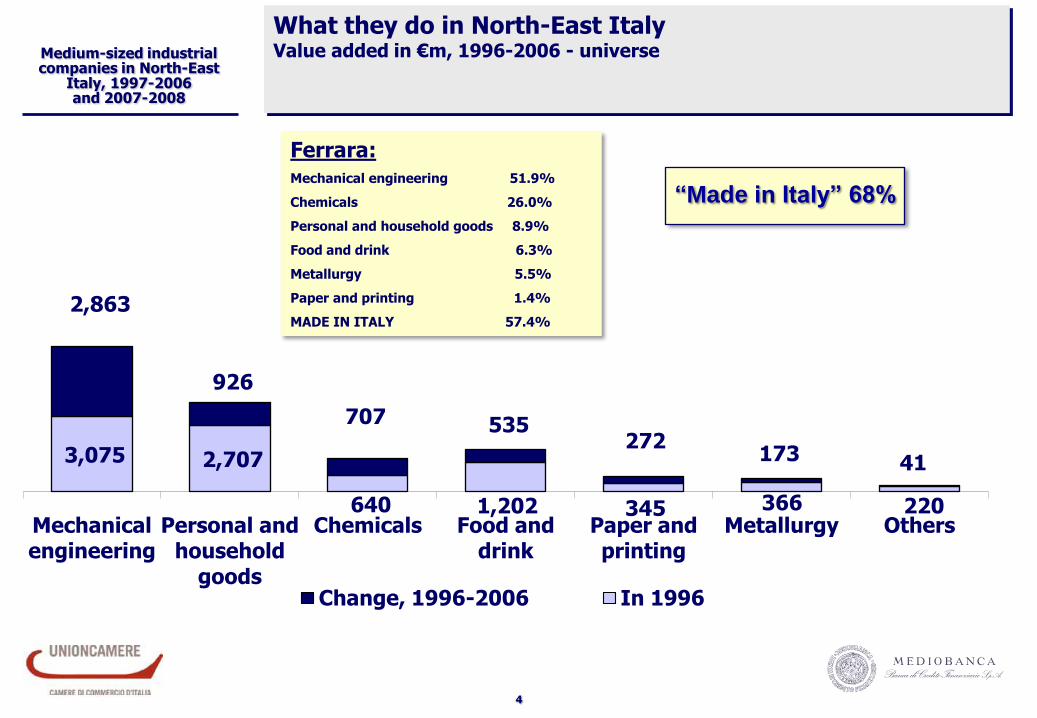
What they do in North-East ItalyValue added in €m, 1996-2006 - universe
3,075 2,707
640 1,202 345 366 220
2,863
926
707 535 272
173 41
Mechanical engineering
Personal and household
goods
Chemicals Food and drink
Paper and printing
Metallurgy Others
Change, 1996-2006 In 1996
Ferrara:Mechanical engineering 51.9%
Chemicals 26.0%
Personal and household goods 8.9%
Food and drink 6.3%
Metallurgy 5.5%
Paper and printing 1.4%
MADE IN ITALY 57.4%
“Made in Italy” 68%
5
Medium-sized industrial companies in North-East
Italy, 1997-2006 and 2007-2008
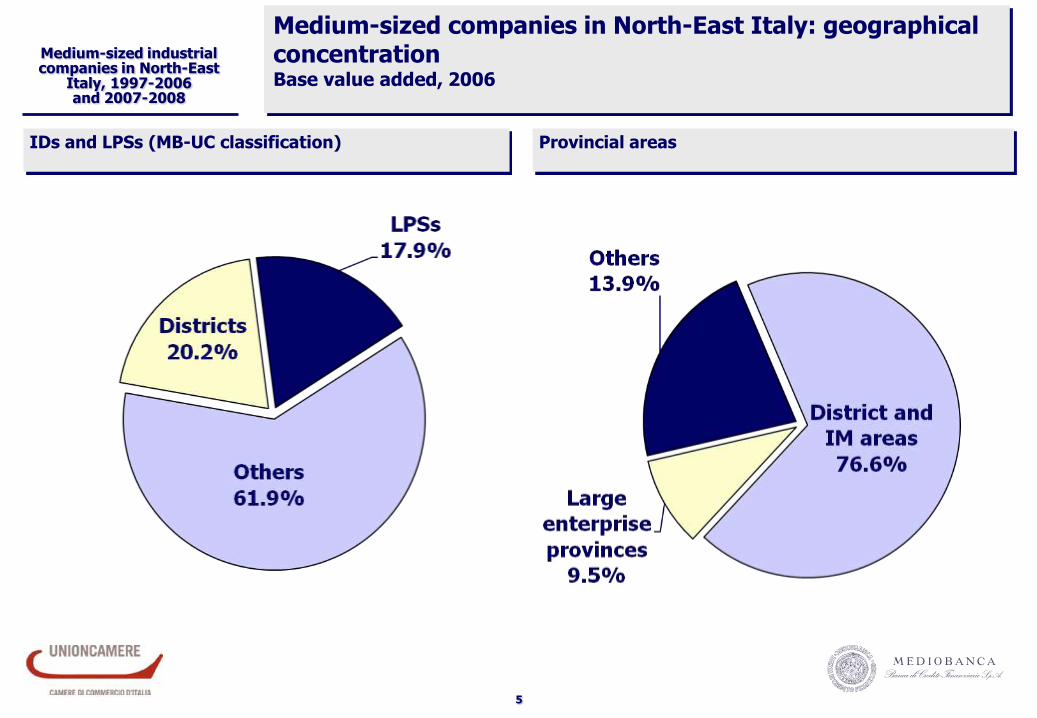
Medium-sized companies in North-East Italy: geographicalconcentrationBase value added, 2006
IDs and LPSs (MB-UC classification) Provincial areas
6
Medium-sized industrial companies in North-East
Italy, 1997-2006 and 2007-2008
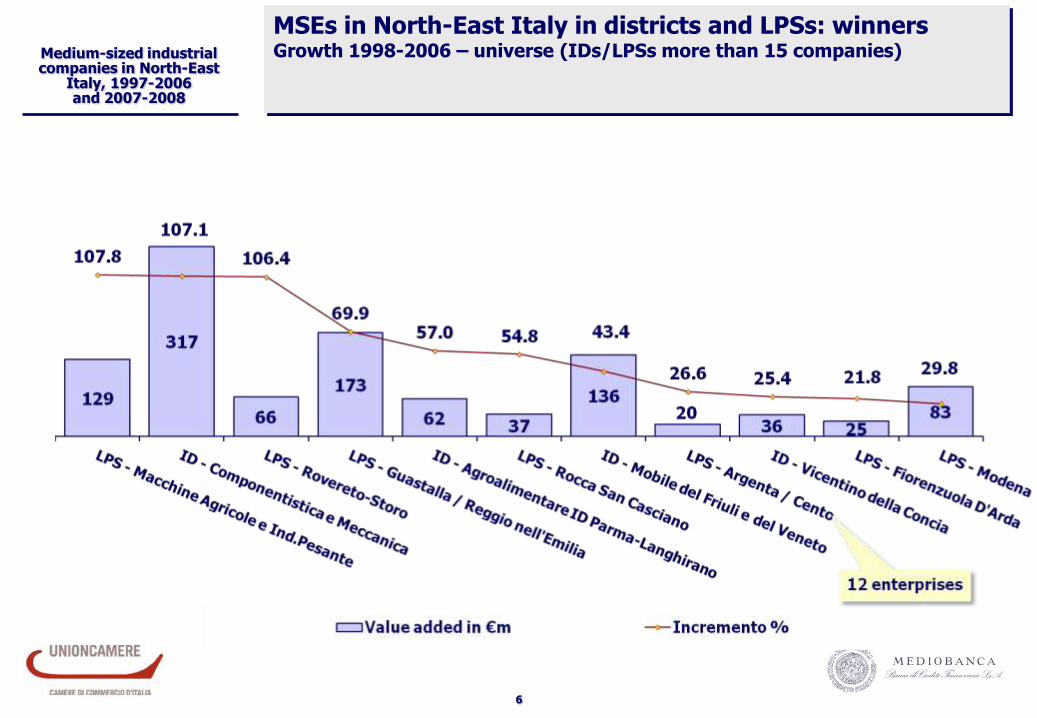
MSEs in North-East Italy in districts and LPSs: winnersGrowth 1998-2006 – universe (IDs/LPSs more than 15 companies)
7
Medium-sized industrial companies in North-East
Italy, 1997-2006 and 2007-2008
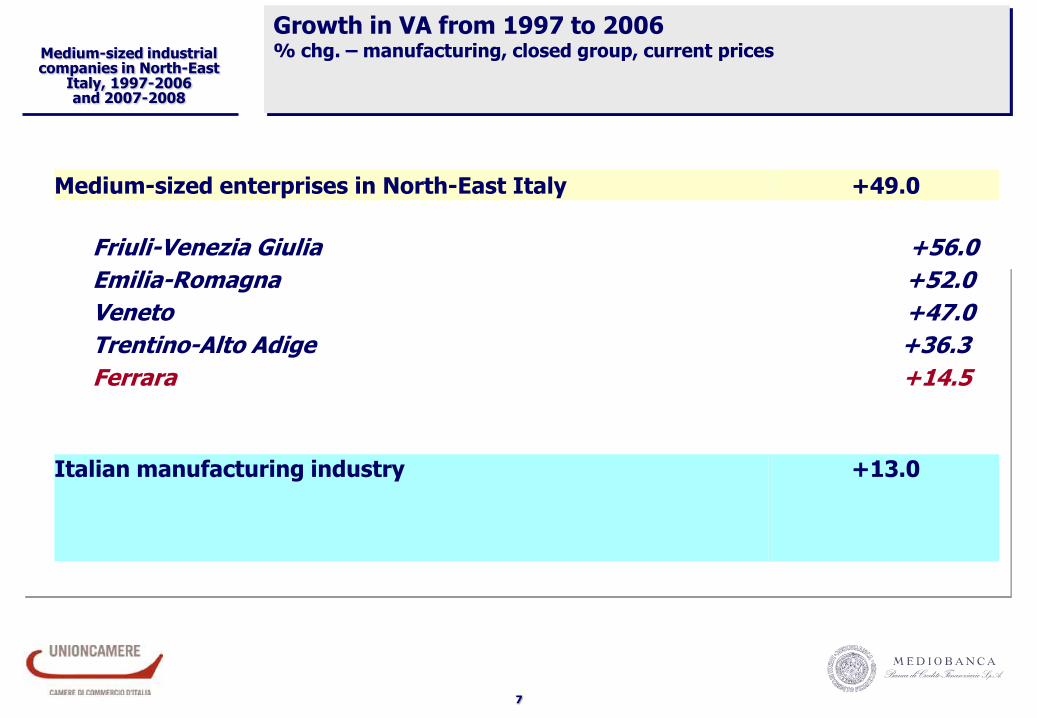
Growth in VA from 1997 to 2006% chg. – manufacturing, closed group, current prices
Medium-sized enterprises in North-East Italy +49.0
Friuli-Venezia Giulia
Emilia-Romagna
Veneto
Trentino-Alto Adige
Ferrara
+56.0
+52.0
+47.0
+36.3
+14.5
Italian manufacturing industry +13.0
8
Medium-sized industrial companies in North-East
Italy, 1997-2006 and 2007-2008
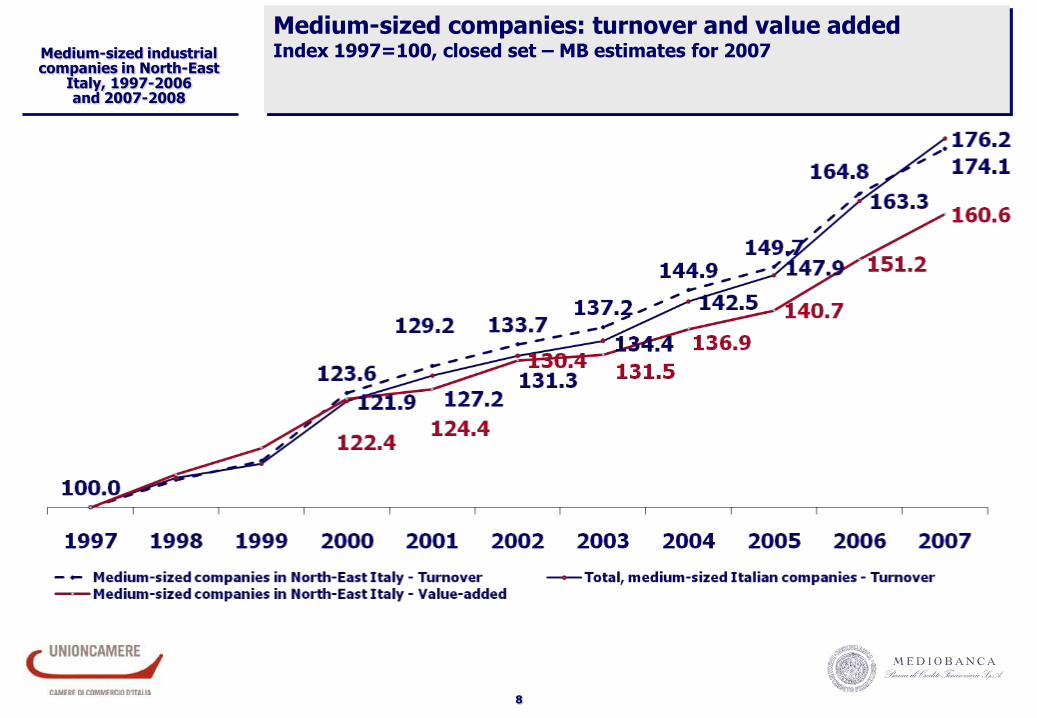
Medium-sized companies: turnover and value addedIndex 1997=100, closed set – MB estimates for 2007
9
Medium-sized industrial companies in North-East
Italy, 1997-2006 and 2007-2008
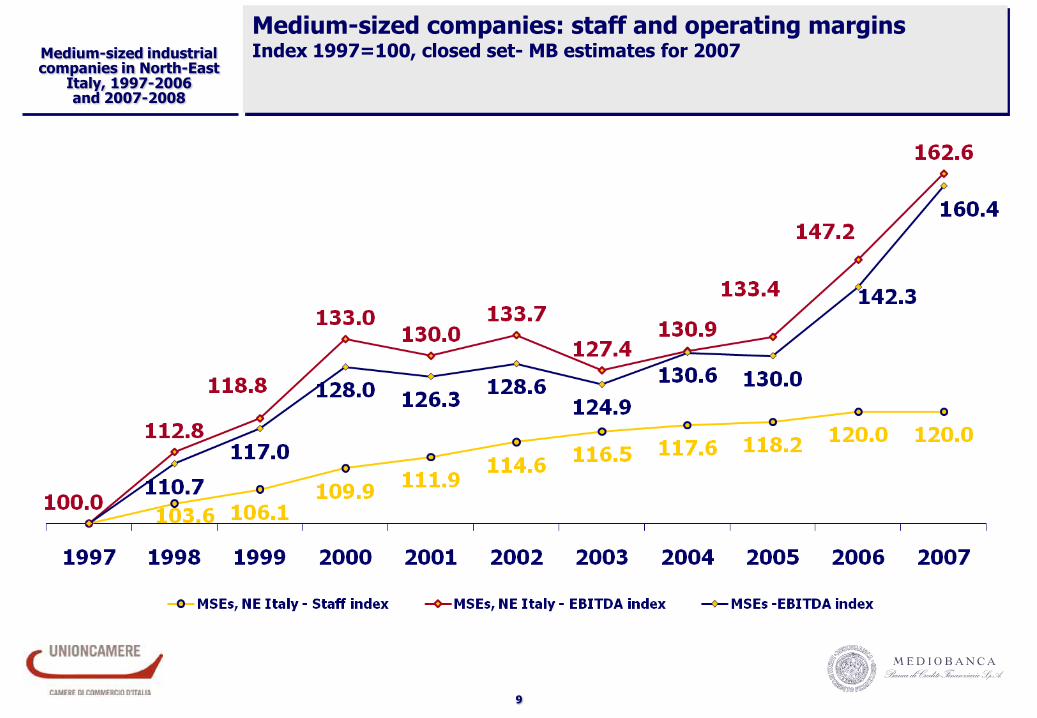
Medium-sized companies: staff and operating marginsIndex 1997=100, closed set- MB estimates for 2007
10
Medium-sized industrial companies in North-East
Italy, 1997-2006 and 2007-2008
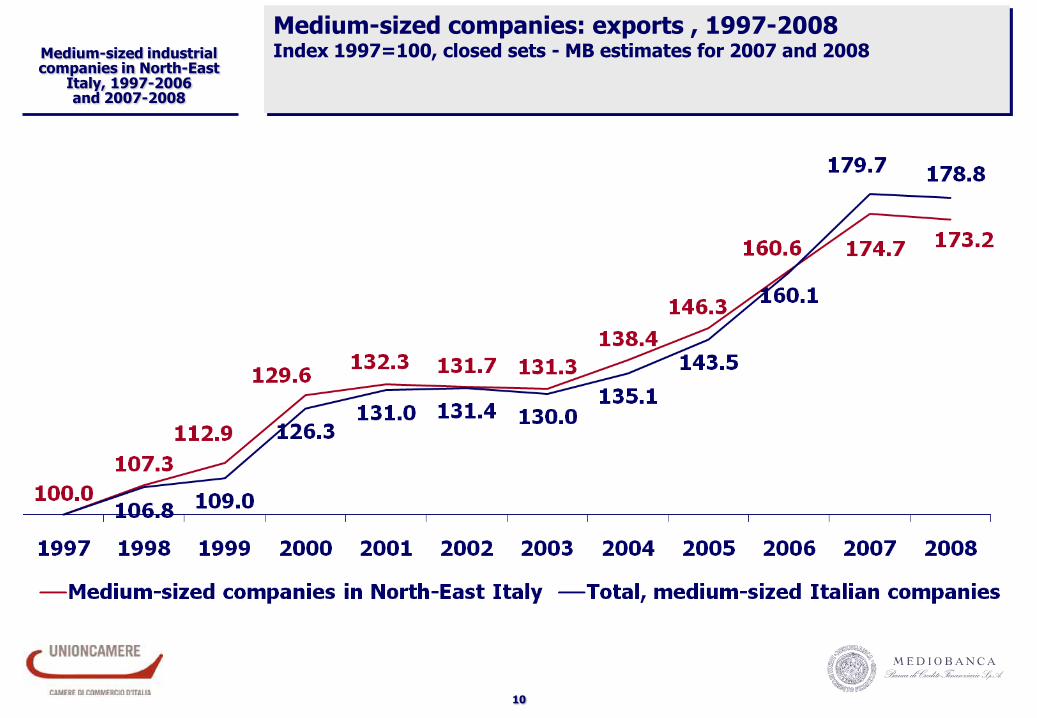
Medium-sized companies: exports , 1997-2008 Index 1997=100, closed sets - MB estimates for 2007 and 2008
Medium-sized industrial companies in North-East
Italy, 1997-2006 and 2007-2008
11
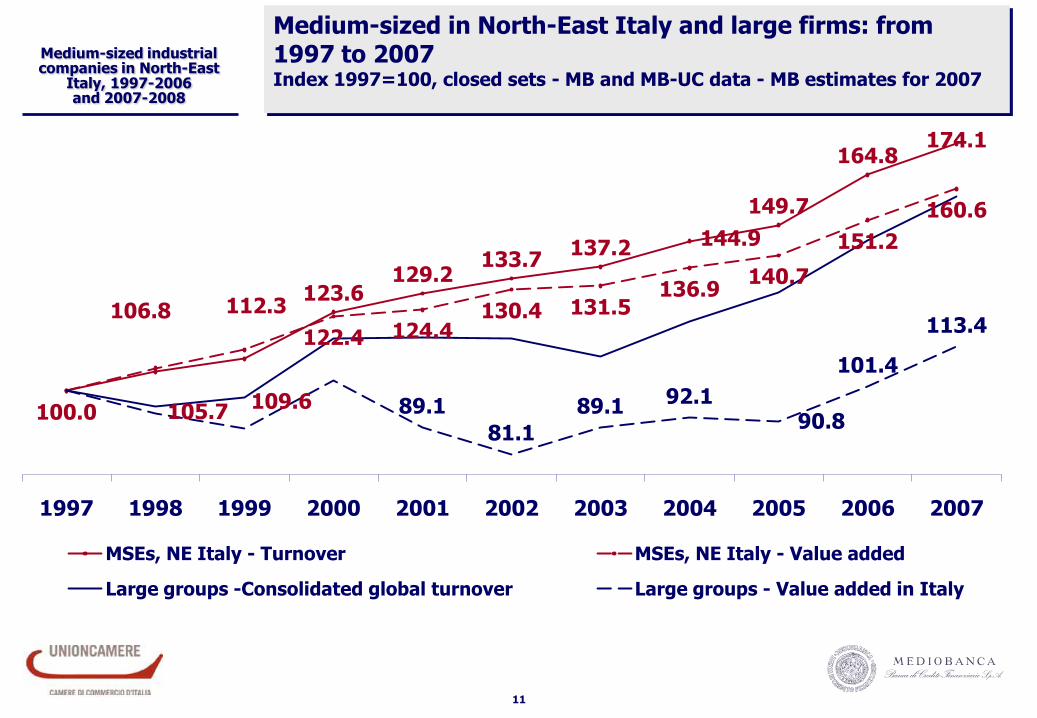
Medium-sized in North-East Italy and large firms: from1997 to 2007Index 1997=100, closed sets - MB and MB-UC data - MB estimates for 2007
105.7109.6
123.6129.2
133.7137.2 144.9
149.7
164.8174.1
100.0
106.8 112.3
122.4 124.4130.4 131.5
136.9140.7
151.2
160.6
89.1
81.1
89.1 92.190.8
101.4
113.4
1997 1998 1999 2000 2001 2002 2003 2004 2005 2006 2007
MSEs, NE Italy - Turnover MSEs, NE Italy - Value added
Large groups -Consolidated global turnover Large groups - Value added in Italy
Medium-sized industrial companies in North-East
Italy, 1997-2006 and 2007-2008
12
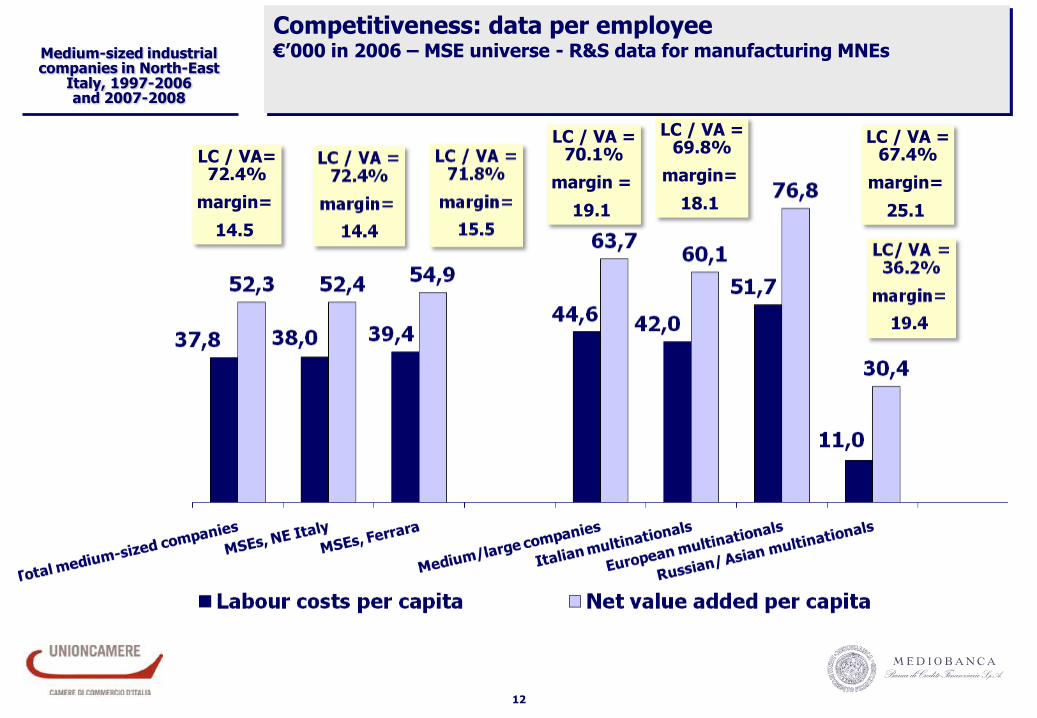
Competitiveness: data per employee€’000 in 2006 – MSE universe - R&S data for manufacturing MNEs
LC / VA=72.4%
margin=
14.5
LC / VA =70.1%
margin =
19.1
LC / VA =69.8%
margin=
18.1
LC / VA =67.4%
margin=
25.1
13
Medium-sized industrial companies in North-East
Italy, 1997-2006 and 2007-2008
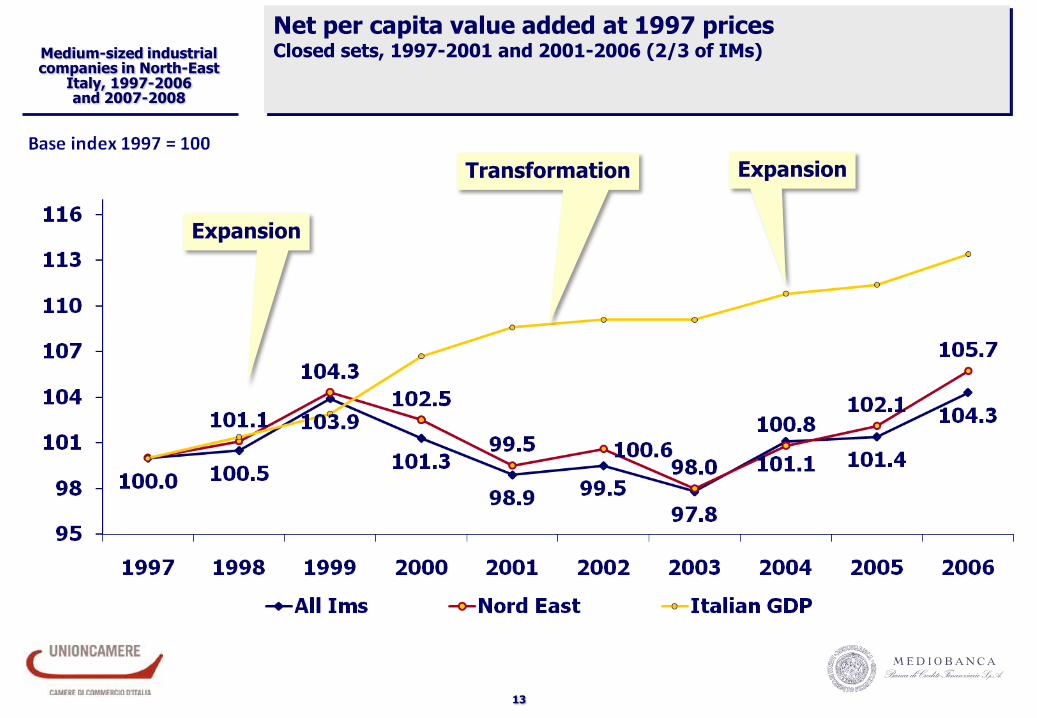
Net per capita value added at 1997 pricesClosed sets, 1997-2001 and 2001-2006 (2/3 of IMs)
Expansion
Transformation Expansion
14
Medium-sized industrial companies in North-East
Italy, 1997-2006 and 2007-2008
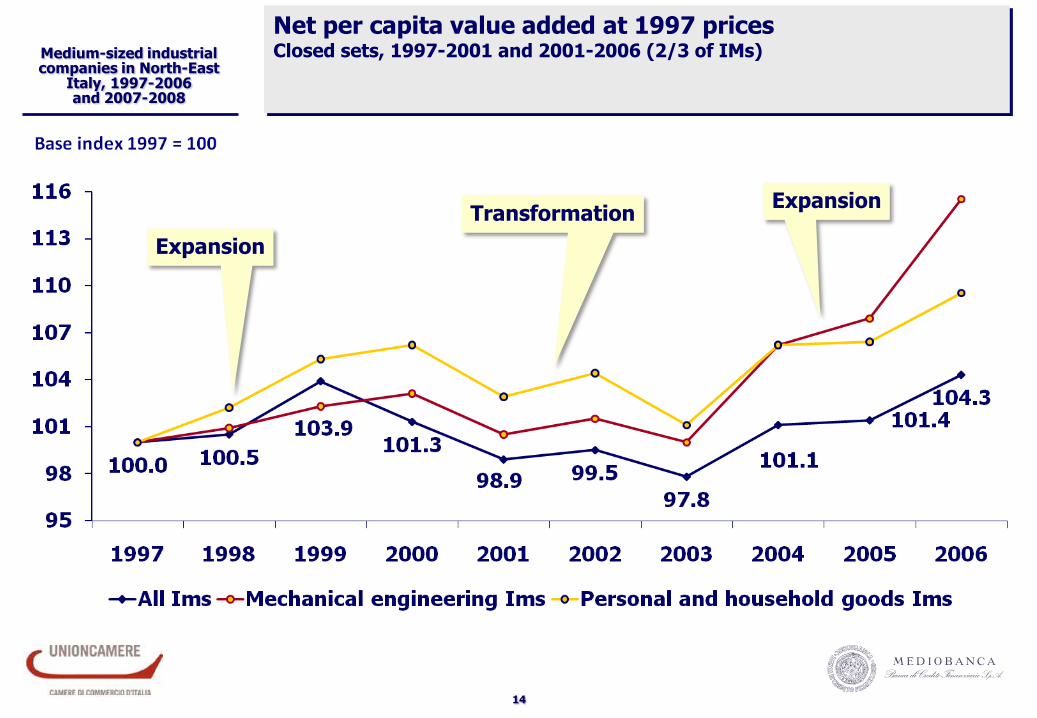
Net per capita value added at 1997 pricesClosed sets, 1997-2001 and 2001-2006 (2/3 of IMs)
Expansion
TransformationExpansion
15
Medium-sized industrial companies in North-East
Italy, 1997-2006 and 2007-2008
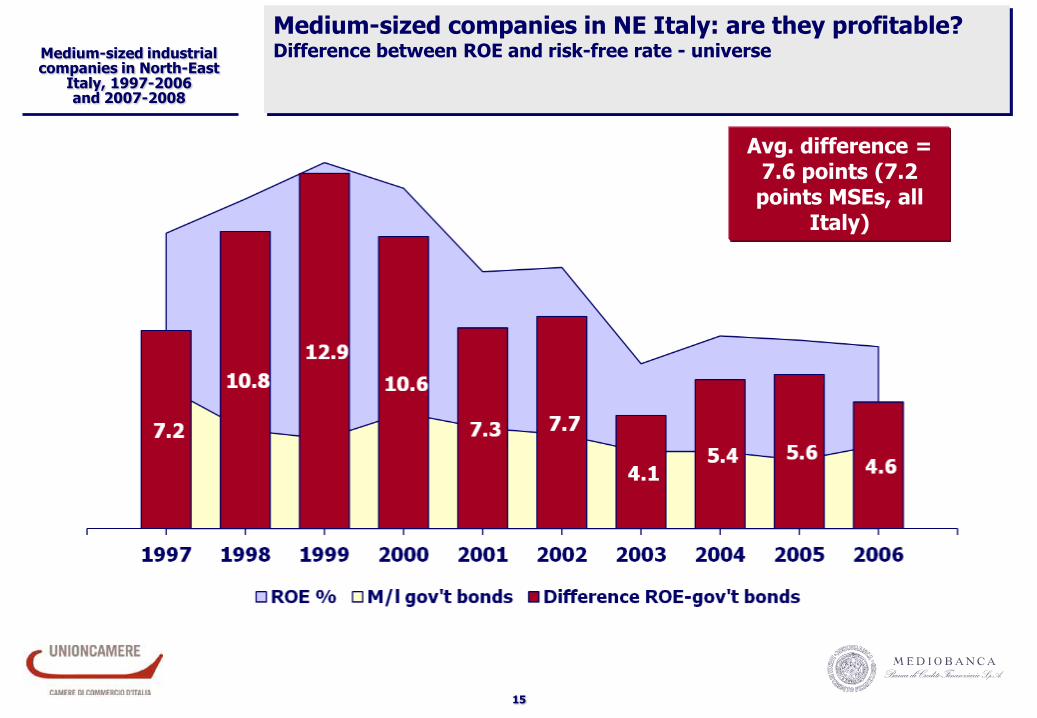
Medium-sized companies in NE Italy: are they profitable?Difference between ROE and risk-free rate - universe
Avg. difference = 7.6 points (7.2 points MSEs, all
Italy)
Medium-sized industrial companies in North-East
Italy, 1997-2006 and 2007-2008
16
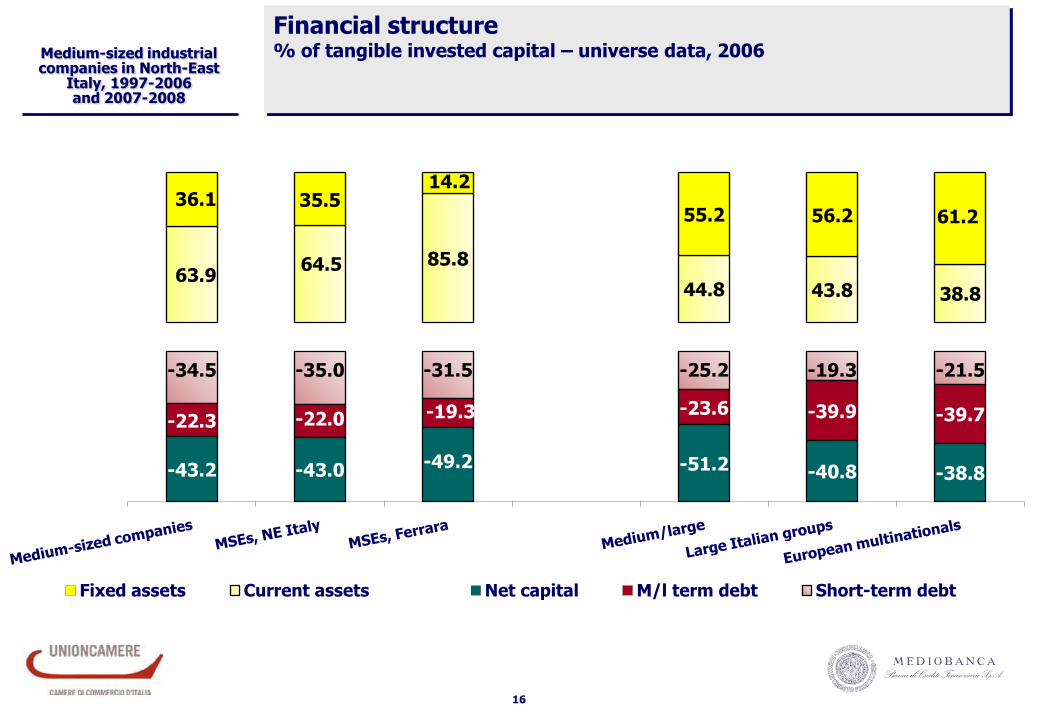
Financial structure% of tangible invested capital – universe data, 2006
-34.5 -35.0 -31.5 -25.2 -19.3 -21.5
-22.3 -22.0 -19.3 -23.6 -39.9 -39.7
-43.2 -43.0 -49.2 -51.2 -40.8 -38.8
63.964.5 85.8
44.8 43.8 38.8
36.1 35.514.2
55.2 56.2 61.2
Fixed assets Current assets Net capital M/l term debt Short-term debt
Medium-sized industrial companies in North-East
Italy, 1997-2006 and 2007-2008
17
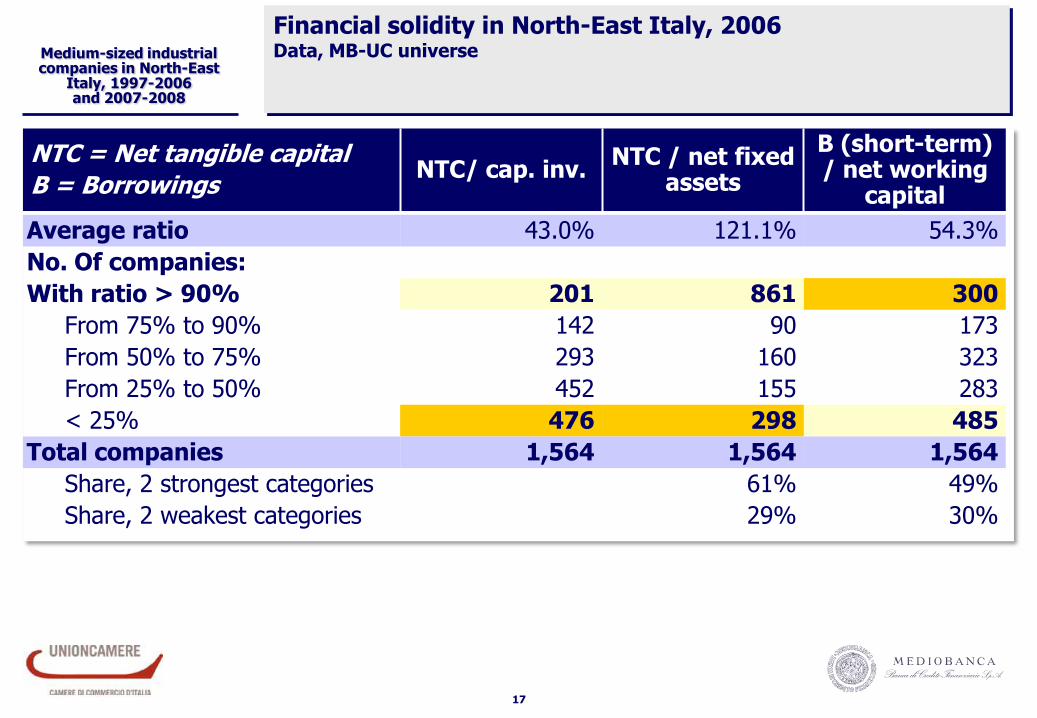
Financial solidity in North-East Italy, 2006Data, MB-UC universe
NTC = Net tangible capital
B = BorrowingsNTC/ cap. inv.
NTC / net fixedassets
B (short-term) / net working
capital
Average ratio 43.0% 121.1% 54.3%
No. Of companies:
With ratio > 90% 201 861 300
From 75% to 90% 142 90 173
From 50% to 75% 293 160 323
From 25% to 50% 452 155 283
< 25% 476 298 485
Total companies 1,564 1,564 1,564
Share, 2 strongest categories 61% 49%
Share, 2 weakest categories 29% 30%
Medium-sized industrial companies in North-East
Italy, 1997-2006 and 2007-2008
18
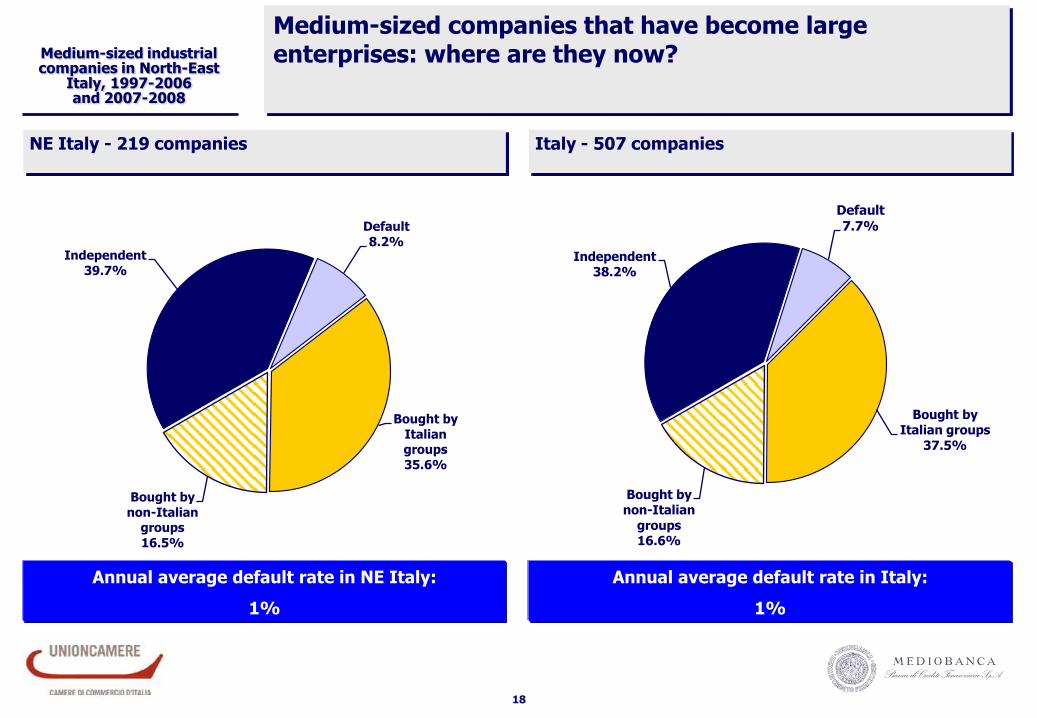
Independent
39.7%
Default
8.2%
Bought by
Italian groups
35.6%
Bought by
non-Italian groups
16.5%
Independent38.2%
Default
7.7%
Bought by Italian groups
37.5%
Bought by non-Italian
groups16.6%
Medium-sized companies that have become largeenterprises: where are they now?
NE Italy - 219 companies Italy - 507 companies
Annual average default rate in NE Italy:
1%
Annual average default rate in Italy:
1%
Medium-sized industrial companies in North-East
Italy, 1997-2006 and 2007-2008
19
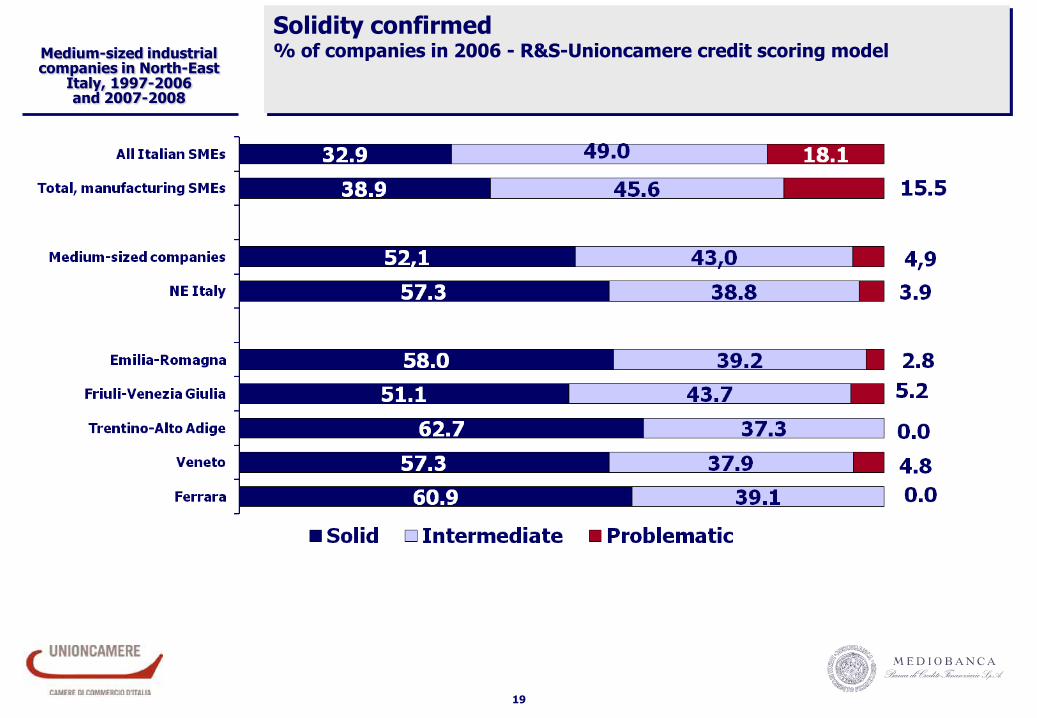
Solidity confirmed% of companies in 2006 - R&S-Unioncamere credit scoring model
Medium-sized industrial companies in North-East
Italy, 1997-2006 and 2007-2008
20
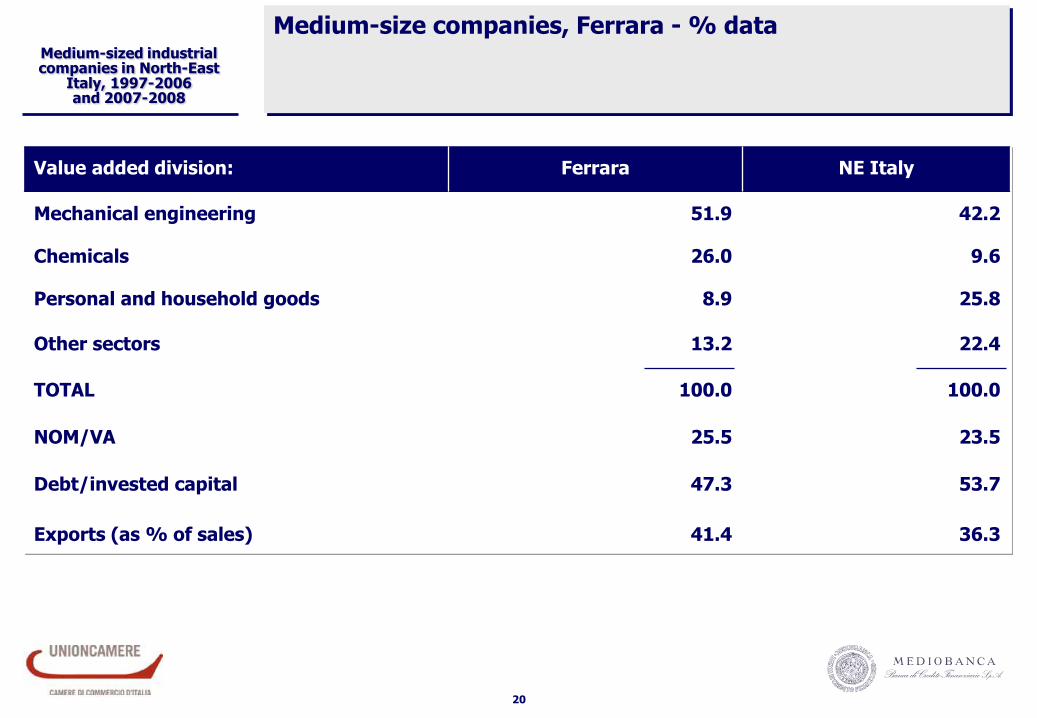
Medium-size companies, Ferrara - % data
Value added division: Ferrara NE Italy
Mechanical engineering 51.9 42.2
Chemicals 26.0 9.6
Personal and household goods 8.9 25.8
Other sectors 13.2 22.4
TOTAL 100.0 100.0
NOM/VA 25.5 23.5
Debt/invested capital 47.3 53.7
Exports (as % of sales) 41.4 36.3
Mediobanca Research Department
Piazzetta M. Bossi 1, Milan, Italy
Website: www.mbres.it