mechanical behavior of materials in manufacturing ... · pdf filematerial behavior of...
TRANSCRIPT

Material behavior of materials in manufacturing processes with material separation
1
Mechanical behavior of materials in manufacturing processes with material separation
João Pedro Rodrigues Cardoso
Abstract
In metal forming processes, the identification of material flow curve at the appropriate rates of loading is
one of the most important parameter for achieving a more realistic modelling of the manufacturing
process. However, a brief bibliographical review shows that there are certain disagreements. As the
following, this work presents an experimental study to identify and explain some of these discrepancies.
The evolution of the flow stress of the aluminium alloy AA 1050 is presented at different strain and strain
rate, taking into account the typical velocity evolution of different manufacturing processes, such as
blanking and metal cutting. The experiments were conducted in an innovative cam-driven electromagnetic
test machine at high strain rates, which allows to reproduces the typical velocity evolution for several
manufacturing processes. The present study also focused on separation processes such as blanking and
metal cutting, from the view of ductile fracture mechanics, where the key parameters, such as, the
maximum load and normal stress were evaluated. Input parameters such as the flow stress and the fracture
toughness, were utilized in a finite element analysis software (I-FORM) for modelling the separation
mechanism, which marks the blanking and metal cutting processes.
Keywords Mechanical behaviour of materials, Flow stress, Fracture toughness, Blanking, Orthogonal
metal cutting
1. Introduction
The mechanical behavior of the material is an input parameter of great importance for the modelling of
metal forming processes for industrial applications (for the project of tools and dies and the selection of
machine-tools) and for the research works directed for the comprehension of the fundamentals of the
manufacturing processes. However, despite the apparent success of the experimental tests have
demonstrated for quantifying the input parameters for metal forming processes, there are some processes
where there lacks an universal agreement. Discrepancies between the theoretical models and experiments
were pointed out by several authors (Tekkaya, 2009; Atkins, 2000), only seem to indicate that a review of
the quantification method of these input parameters should be taken into account.
In this context, this work is focused on the importance of ductile fracture mechanics in manufacturing
processes with material separation, such as blanking and metal cutting, where the key parameters, such as,
the maximum load and normal stress were evaluated. The flow curve at the appropriate rates of loading is very important to describe the hardening behaviour
during plastic deformation in terms of strain, strain-rate and temperature, to set-up the non-linear
constitutive equations of metal plasticity and to establish the feasibility window and effectiveness of
manufacturing processes. However, despite this importance, the flow curve is not always accessible in
conditions similar to real manufacturing due to difficulties in replicating the operative conditions, namely
the combined evolution and range of strains and strain-rates.
In case of strain-rates, for example, the widely available universal testing machines can only perform
mechanical characterization of materials at quasi-static or low rate loading conditions ( ~10-3
to 1 s-1
) and
commercially available drop weight testing systems are only adequate for medium rates of loading ( ~1
to 103 s
-1). Special purpose testing equipment based on split Hopkinson pressure bars, which is adequate
for high rates of loading ( > 103 s
-1), and Taylor impact or shock loading by plate impact systems, which
are necessary for even higher rates of loading ( > 104 s
-1), are not readily available or guaranteed to the
majority of researchers.
However, even if equipment for testing at high rates of loading is available, a frequently ignored and
mismanaged technical issue is the adequacy of testing conditions to the operational settings of the
machine-tools where manufacturing processes will take place. In fact, despite theoretical claims on
transferability of results often requiring mechanical testing of materials with different strain and strain-rate
loading profiles to provide the same stress response for a given value of strain and strain rate, it is known
that the flow curves obtained under different testing conditions do not coincide for the same material [1].
Not only time history of strain and strain-rate influences stress response [2] as it is relevant to determine
crystallographic textures resulting from manufacturing processes [3].
Material behavior of materials in manufacturing processes with material separation
2
Vc
w
B
E
VAB
Ve
AWorkpiece
Cutting ToolE
A' C
C
B' D
A
C
A'
A
t
ri
reBD
V
(a) (b)
h
hi
V
Eff
ective
Str
ain
Ra
te (
s-1
)
Effective Strain
Blanking
ForgingMeta
l Cuttin
g
(c) (d)
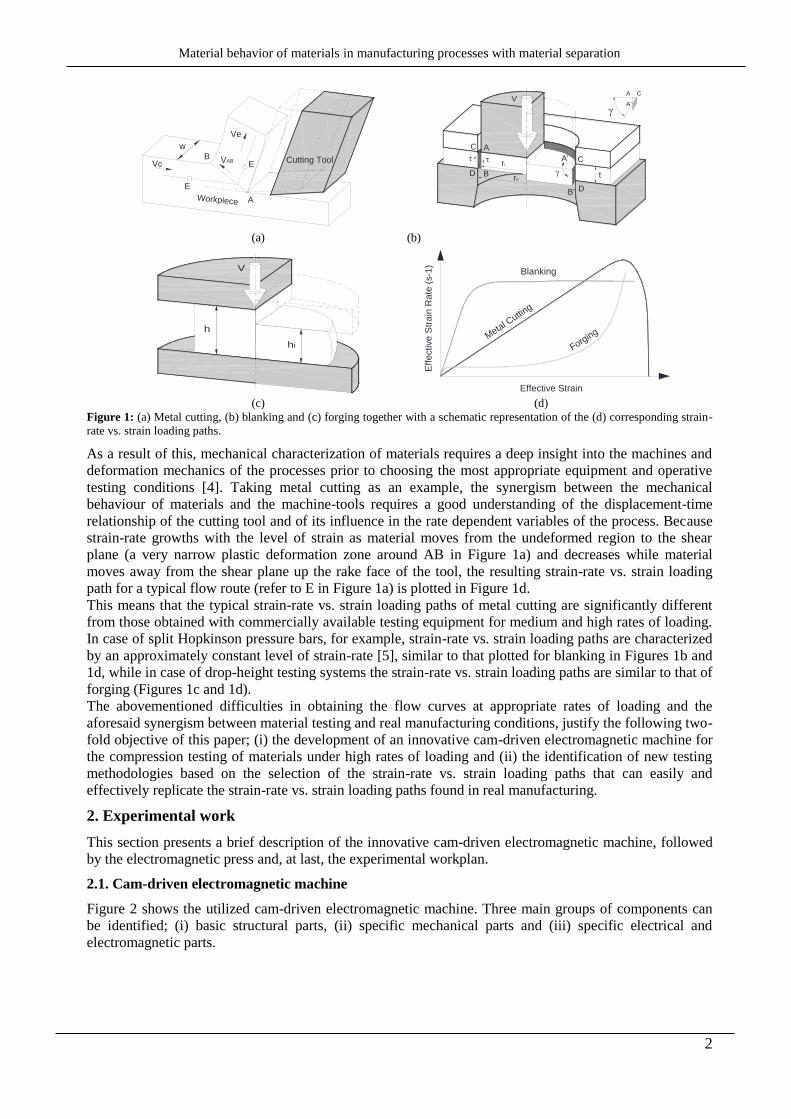
Figure 1: (a) Metal cutting, (b) blanking and (c) forging together with a schematic representation of the (d) corresponding strain-
rate vs. strain loading paths.
As a result of this, mechanical characterization of materials requires a deep insight into the machines and
deformation mechanics of the processes prior to choosing the most appropriate equipment and operative
testing conditions [4]. Taking metal cutting as an example, the synergism between the mechanical
behaviour of materials and the machine-tools requires a good understanding of the displacement-time
relationship of the cutting tool and of its influence in the rate dependent variables of the process. Because
strain-rate growths with the level of strain as material moves from the undeformed region to the shear
plane (a very narrow plastic deformation zone around AB in Figure 1a) and decreases while material
moves away from the shear plane up the rake face of the tool, the resulting strain-rate vs. strain loading
path for a typical flow route (refer to E in Figure 1a) is plotted in Figure 1d.
This means that the typical strain-rate vs. strain loading paths of metal cutting are significantly different
from those obtained with commercially available testing equipment for medium and high rates of loading.
In case of split Hopkinson pressure bars, for example, strain-rate vs. strain loading paths are characterized
by an approximately constant level of strain-rate [5], similar to that plotted for blanking in Figures 1b and
1d, while in case of drop-height testing systems the strain-rate vs. strain loading paths are similar to that of
forging (Figures 1c and 1d).
The abovementioned difficulties in obtaining the flow curves at appropriate rates of loading and the
aforesaid synergism between material testing and real manufacturing conditions, justify the following two-
fold objective of this paper; (i) the development of an innovative cam-driven electromagnetic machine for
the compression testing of materials under high rates of loading and (ii) the identification of new testing
methodologies based on the selection of the strain-rate vs. strain loading paths that can easily and
effectively replicate the strain-rate vs. strain loading paths found in real manufacturing.
2. Experimental work
This section presents a brief description of the innovative cam-driven electromagnetic machine, followed
by the electromagnetic press and, at last, the experimental workplan.
2.1. Cam-driven electromagnetic machine
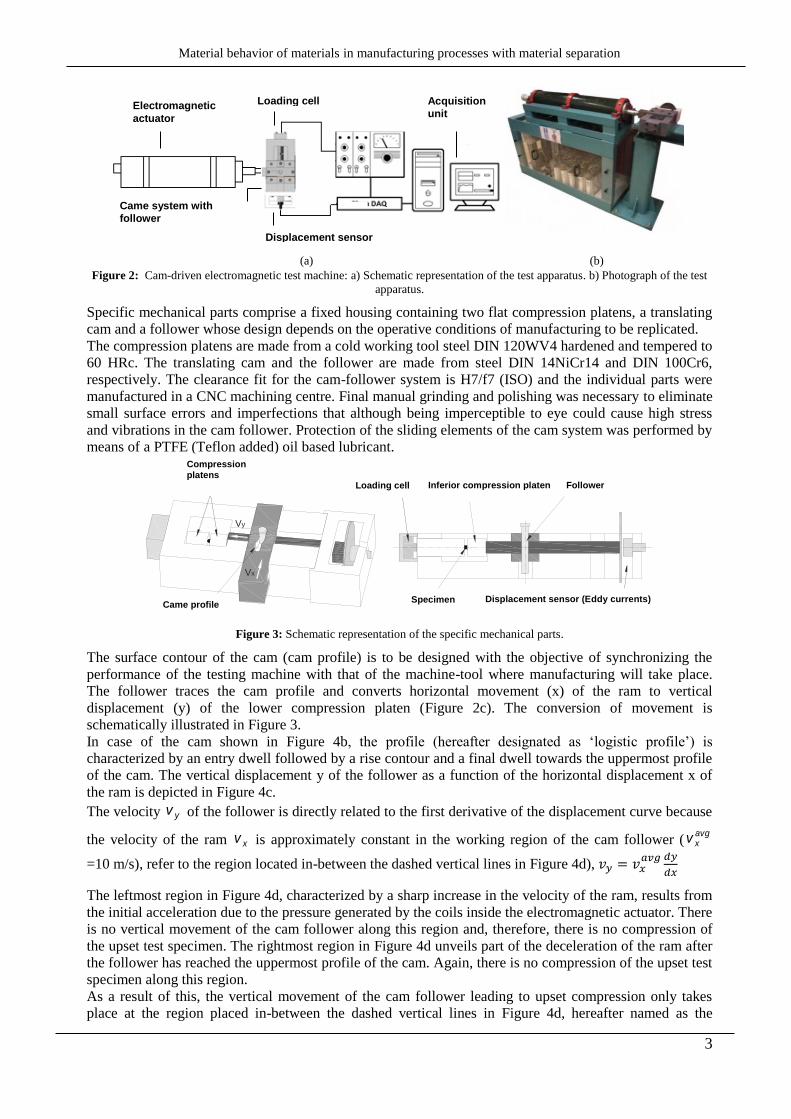
Figure 2 shows the utilized cam-driven electromagnetic machine. Three main groups of components can
be identified; (i) basic structural parts, (ii) specific mechanical parts and (iii) specific electrical and
electromagnetic parts.
Material behavior of materials in manufacturing processes with material separation
3
(a) (b)
Figure 2: Cam-driven electromagnetic test machine: a) Schematic representation of the test apparatus. b) Photograph of the test
apparatus.
Specific mechanical parts comprise a fixed housing containing two flat compression platens, a translating
cam and a follower whose design depends on the operative conditions of manufacturing to be replicated.
The compression platens are made from a cold working tool steel DIN 120WV4 hardened and tempered to
60 HRc. The translating cam and the follower are made from steel DIN 14NiCr14 and DIN 100Cr6,
respectively. The clearance fit for the cam-follower system is H7/f7 (ISO) and the individual parts were
manufactured in a CNC machining centre. Final manual grinding and polishing was necessary to eliminate
small surface errors and imperfections that although being imperceptible to eye could cause high stress
and vibrations in the cam follower. Protection of the sliding elements of the cam system was performed by
means of a PTFE (Teflon added) oil based lubricant.
SeguidorPratos de Compressão
Sensor de Deslocamento Correntes Eddy
Célula de Carga
Perfil da Came Provete
Vx
Vy
Prato de Compressão Inferior
Figure 3: Schematic representation of the specific mechanical parts.
The surface contour of the cam (cam profile) is to be designed with the objective of synchronizing the
performance of the testing machine with that of the machine-tool where manufacturing will take place.
The follower traces the cam profile and converts horizontal movement (x) of the ram to vertical
displacement (y) of the lower compression platen (Figure 2c). The conversion of movement is
schematically illustrated in Figure 3.
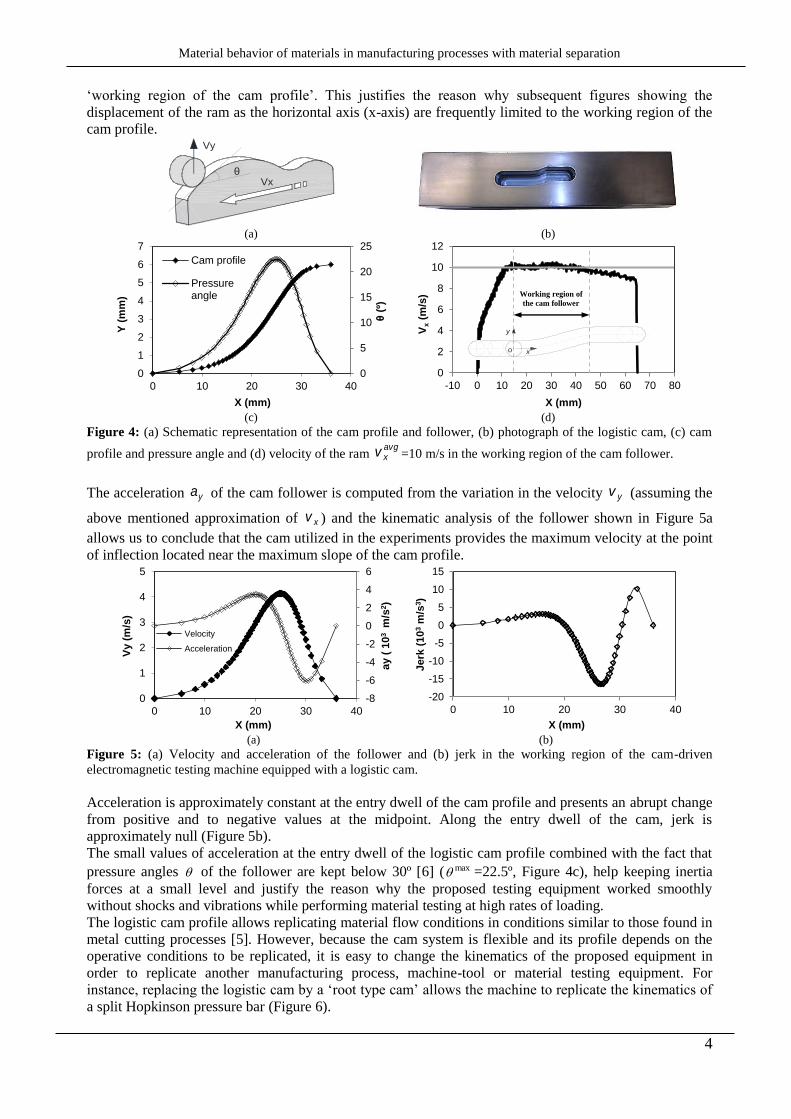
In case of the cam shown in Figure 4b, the profile (hereafter designated as ‘logistic profile’) is
characterized by an entry dwell followed by a rise contour and a final dwell towards the uppermost profile
of the cam. The vertical displacement y of the follower as a function of the horizontal displacement x of
the ram is depicted in Figure 4c.
The velocity yv of the follower is directly related to the first derivative of the displacement curve because
the velocity of the ram xv is approximately constant in the working region of the cam follower (avgxv
=10 m/s), refer to the region located in-between the dashed vertical lines in Figure 4d),
The leftmost region in Figure 4d, characterized by a sharp increase in the velocity of the ram, results from
the initial acceleration due to the pressure generated by the coils inside the electromagnetic actuator. There
is no vertical movement of the cam follower along this region and, therefore, there is no compression of
the upset test specimen. The rightmost region in Figure 4d unveils part of the deceleration of the ram after
the follower has reached the uppermost profile of the cam. Again, there is no compression of the upset test
specimen along this region.
As a result of this, the vertical movement of the cam follower leading to upset compression only takes
place at the region placed in-between the dashed vertical lines in Figure 4d, hereafter named as the
Electromagnetic
actuator
Came system with
follower
Loading cell
Displacement sensor
Acquisition
unit
Compression platens
Loading cell Inferior compression platen Follower
Specimen Displacement sensor (Eddy currents) Came profile
Material behavior of materials in manufacturing processes with material separation
4
‘working region of the cam profile’. This justifies the reason why subsequent figures showing the
displacement of the ram as the horizontal axis (x-axis) are frequently limited to the working region of the
cam profile. Vy
Vx
(a) (b)
(c) (d)
Figure 4: (a) Schematic representation of the cam profile and follower, (b) photograph of the logistic cam, (c) cam
profile and pressure angle and (d) velocity of the ram avgxv =10 m/s in the working region of the cam follower.
The acceleration ya of the cam follower is computed from the variation in the velocity yv (assuming the
above mentioned approximation of xv ) and the kinematic analysis of the follower shown in Figure 5a
allows us to conclude that the cam utilized in the experiments provides the maximum velocity at the point
of inflection located near the maximum slope of the cam profile.
(a) (b)
Figure 5: (a) Velocity and acceleration of the follower and (b) jerk in the working region of the cam-driven
electromagnetic testing machine equipped with a logistic cam.
Acceleration is approximately constant at the entry dwell of the cam profile and presents an abrupt change
from positive and to negative values at the midpoint. Along the entry dwell of the cam, jerk is
approximately null (Figure 5b).
The small values of acceleration at the entry dwell of the logistic cam profile combined with the fact that
pressure angles of the follower are kept below 30º [6] ( max =22.5º, Figure 4c), help keeping inertia
forces at a small level and justify the reason why the proposed testing equipment worked smoothly
without shocks and vibrations while performing material testing at high rates of loading.
The logistic cam profile allows replicating material flow conditions in conditions similar to those found in
metal cutting processes [5]. However, because the cam system is flexible and its profile depends on the
operative conditions to be replicated, it is easy to change the kinematics of the proposed equipment in
order to replicate another manufacturing process, machine-tool or material testing equipment. For
instance, replacing the logistic cam by a ‘root type cam’ allows the machine to replicate the kinematics of
a split Hopkinson pressure bar (Figure 6).
0
5
10
15
20
25
0
1
2
3
4
5
6
7
0 10 20 30 40θ (
º)
Y (
mm
)
X (mm)
Cam profile
Pressureangle
0
2
4
6
8
10
12
-10 0 10 20 30 40 50 60 70 80
Vx (
m/s
)
X (mm)
-8
-6
-4
-2
0
2
4
6
0
1
2
3
4
5
0 10 20 30 40
ay (
10
3 m
/s2)
Vy (
m/s
)
X (mm)
Velocity
Acceleration
-20
-15
-10
-5
0
5
10
15
0 10 20 30 40
Jerk
(10
3 m
/s3)
X (mm)
y
xo
Working region of
the cam follower
Material behavior of materials in manufacturing processes with material separation
5
(a)
(b) (c)
Figure 6: (a) Photograph of the root type cam, (b) cam profile and pressure angle and (c) velocity and acceleration of
the follower in the working region of the cam-driven electromagnetic testing machine equipped with a root type cam.
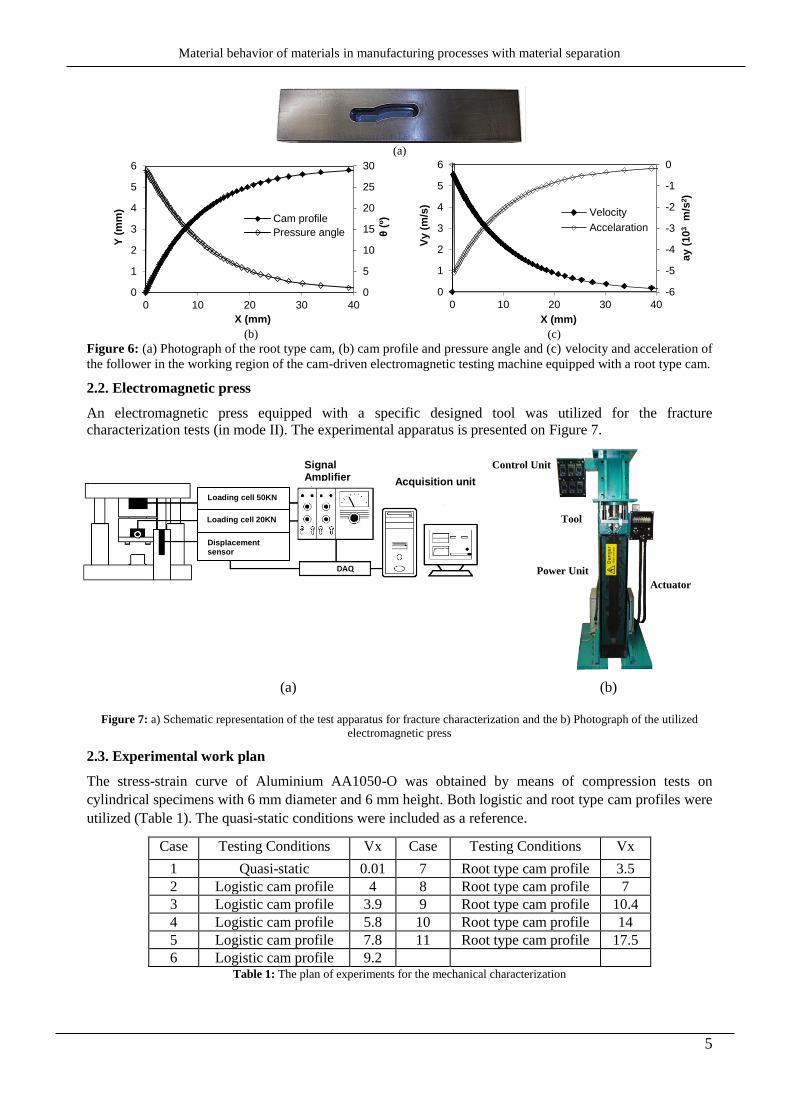
2.2. Electromagnetic press
An electromagnetic press equipped with a specific designed tool was utilized for the fracture
characterization tests (in mode II). The experimental apparatus is presented on Figure 7.
(a) (b)
Figure 7: a) Schematic representation of the test apparatus for fracture characterization and the b) Photograph of the utilized
electromagnetic press
2.3. Experimental work plan
The stress-strain curve of Aluminium AA1050-O was obtained by means of compression tests on
cylindrical specimens with 6 mm diameter and 6 mm height. Both logistic and root type cam profiles were
utilized (Table 1). The quasi-static conditions were included as a reference.
Case Testing Conditions Vx Case Testing Conditions Vx
1 Quasi-static 0.01 7 Root type cam profile 3.5
2 Logistic cam profile 4 8 Root type cam profile 7
3 Logistic cam profile 3.9 9 Root type cam profile 10.4
4 Logistic cam profile 5.8 10 Root type cam profile 14
5 Logistic cam profile 7.8 11 Root type cam profile 17.5
6 Logistic cam profile 9.2 Table 1: The plan of experiments for the mechanical characterization
0
5
10
15
20
25
30
0
1
2
3
4
5
6
0 10 20 30 40
θ (
º)
Y (
mm
)
X (mm)
Cam profile
Pressure angle
-6
-5
-4
-3
-2
-1
0
0
1
2
3
4
5
6
0 10 20 30 40
ay (
10
3
m/s
2)
Vy (
m/s
)
X (mm)
Velocity
Accelaration
Power Unit
Control Unit
Actuator
Tool
Signal Amplifier Acquisition unit
Loading cell 50KN
Loading cell 20KN
Displacement sensor

Material behavior of materials in manufacturing processes with material separation
6
In the case of fracture characterization, the specimens were obtained through conventional milling,
followed by electro-discharge machining. The geometry and dimensions of the specimens are presented in
Figure 8.
(a) (b)
Figure 8: Specimens used in fracture tests. a) Specimen dimension mm, b) Specimen Photograph
Table 2 presents the set of experiments for the fracture characterization with null normal stress, at
different testing velocities. The table repeats for others set of experiments with different applied normal
stresses of 30 MPa and 60 MPa.
Range of thickness (mm) Test velocity (m/s)
Quasi-static 2 3
0 – 1,5 1 e 2 6 e 7 12 e 13
1,5 – 2,5 3 e 4 8 e 9 14 e 15
2,5 – 3,5 4 e 5 10 e 11 16 e 17
Normal stress (MPa) 0
Table 2: The plan of experiments for the fracture characterization.
3. Results and discussion
The following sections present the results of the extensive experimental work developed as mentioned on
the previous section. This section can be divided in two parts: the first one, describe the mechanical
characterization of the Aluminium AA1050-O, utilizing the innovative cam-driven electromagnetic
machine; the second part is focused on the fracture characterization.
31. Mechanical characterization
Figure 9 shows the variation of force with displacement obtained from test cases 3 and 8 in Table 1.
Results show that on contrary to root type cam profiles (and split Hopkinson pressure bars), there are no
‘saw tooth’ oscillations when using a logistic cam profile (case 3). This is attributed to a smooth transition
between the entry dwell and the profile of the cam and to a low value of the maximum pressure angle (max = 22.5º, Figure 4c).
The oscillations in the root type cam profile are attributed to inertia forces and stress wave propagation
under impact loading as well as to an initial value of the maximum pressure angle very close to 30º (max
= 28º, Figure 5b).
Figure 9: Experimental evolution of the force vs. displacement for logistic and root type cam profiles.
The experimental strain-rate vs. strain loading paths for the selected testing conditions performed with the
cam-driven electromagnetic testing machine equipped with a logistic cam profile are plotted in Figure 10a.
0
10000
20000
30000
0 1 2 3 4 5
Fo
rce (
N)
Displacement (mm)
case 3
case 8
Material behavior of materials in manufacturing processes with material separation
7
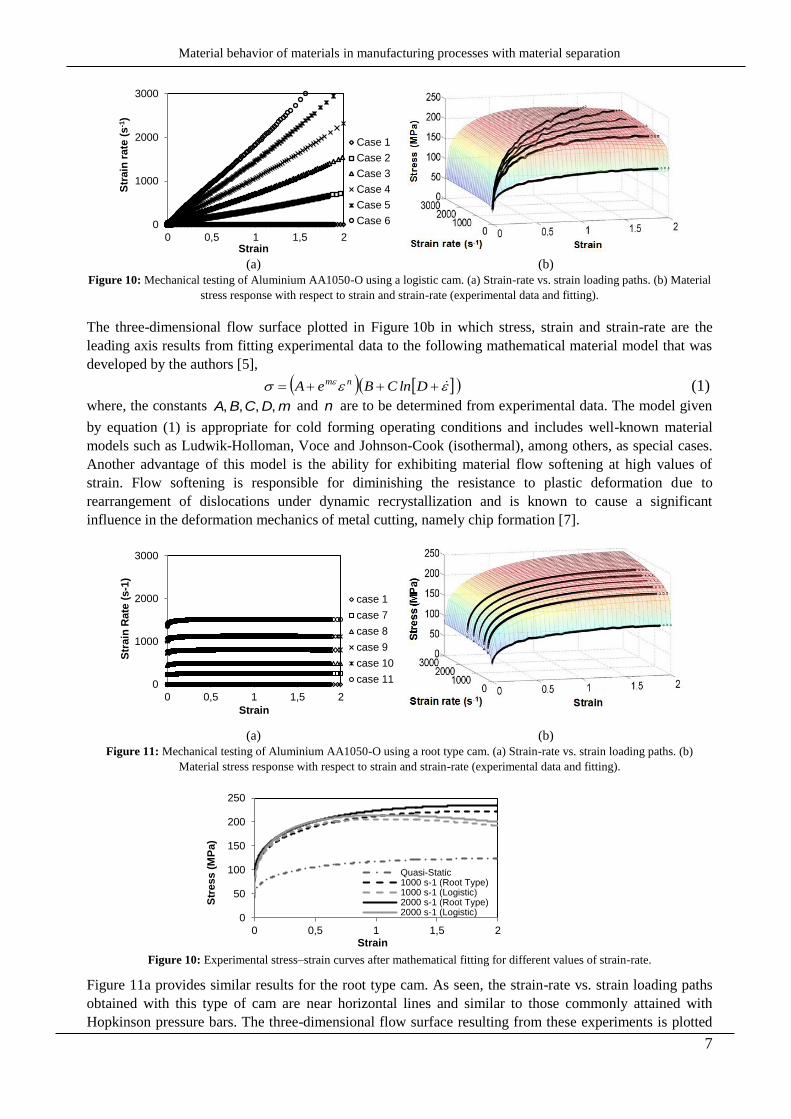
(a) (b)
Figure 10: Mechanical testing of Aluminium AA1050-O using a logistic cam. (a) Strain-rate vs. strain loading paths. (b) Material
stress response with respect to strain and strain-rate (experimental data and fitting).
The three-dimensional flow surface plotted in Figure 10b in which stress, strain and strain-rate are the
leading axis results from fitting experimental data to the following mathematical material model that was
developed by the authors [5],
DlnCBeA nm
(1)
where, the constants mDCBA ,,,, and n are to be determined from experimental data. The model given
by equation (1) is appropriate for cold forming operating conditions and includes well-known material
models such as Ludwik-Holloman, Voce and Johnson-Cook (isothermal), among others, as special cases.
Another advantage of this model is the ability for exhibiting material flow softening at high values of
strain. Flow softening is responsible for diminishing the resistance to plastic deformation due to
rearrangement of dislocations under dynamic recrystallization and is known to cause a significant
influence in the deformation mechanics of metal cutting, namely chip formation [7].
(a) (b)
Figure 11: Mechanical testing of Aluminium AA1050-O using a root type cam. (a) Strain-rate vs. strain loading paths. (b)
Material stress response with respect to strain and strain-rate (experimental data and fitting).
Figure 10: Experimental stress–strain curves after mathematical fitting for different values of strain-rate.
Figure 11a provides similar results for the root type cam. As seen, the strain-rate vs. strain loading paths
obtained with this type of cam are near horizontal lines and similar to those commonly attained with
Hopkinson pressure bars. The three-dimensional flow surface resulting from these experiments is plotted
0
1000
2000
3000
0 0,5 1 1,5 2
Str
ain
rate
(s
-1)
Strain
Case 1
Case 2
Case 3
Case 4
Case 5
Case 6
0
1000
2000
3000
0 0,5 1 1,5 2
Str
ain
Rate
(s-1
)
Strain
case 1
case 7
case 8
case 9
case 10
case 11
0
50
100
150
200
250
0 0,5 1 1,5 2
Str
ess (
MP
a)
Strain
Quasi-Static1000 s-1 (Root Type)1000 s-1 (Logistic)2000 s-1 (Root Type)2000 s-1 (Logistic)
Material behavior of materials in manufacturing processes with material separation
8
0
2000
4000
6000
8000
10000
12000
0 1 2 3
Fo
rce
(N
)
Displacement(mm)
c=2.4 c=1.7 c=1.3 c=0.8
50
60
70
80
90
100
110
0 1 2 3
w (
kJ
/m2
)
c (mm)
Quasi-estático 2 m/s 3 m/s
40
45
50
55
60
65
70
75
80
0 30 60
R (
KJ/m
2)
σ normal (MPa)
Quase-estático 2 m/s 3 m/s
0
2000
4000
6000
8000
10000
12000
0 1 2 3
Fo
rce
(N
)
Displacement (mm)
c=2.8 c=2 c=1.6 c=0.8
in Figure 11b. The differences between the flow surfaces obtained from material testing with logistic and
root type cams are made clear by analysing a selection of intersections of the three-dimensional flow
surfaces with constant strain-rate planes ( Cte ). The flow curves resulting from these intersections are
plotted in Figure 10 and indicate that major differences are due to flow softening in close agreement with
the aforementioned capability of the logistic cam profile to model metal cutting conditions.
3.2. Fracture characterization
The cracks initiate and grow when a required energy is applied. The common procedure in fracture
mechanics is to quantify the value of this critical energy by calculating the total energy W, from the
following equation,
∫
(2)
Fracture toughness, R, is the energy required for the formation of new surfaces, is defined per unit of area
confined by the length of the ligament between notches, [9].
( )
(
)
(
) (3)
These experiments were designed for determining the evolution of the force with displacement for
different velocities (quasi-static, 2m/s and 3m/s) and of the ligament remaining between the starting cracks
(Figure 11).
(a) (b)
Figura 11: Evolution of the force with the displacement for different values of ligament between notches for: a) quasi-static and
b) v = 3m/s
For the determination of the value of fracture toughness R, tests with different ligament between notches
were conducted, followed by the extrapolation of the experimental values for the limit as its values tend to
zero. The results are presented in Figure 12 a), and its evolution with the applied normal stress with
different test velocities is presented in Figure 12 b).
(a) (b)
Figure 12 a) Procedure for calculating R without applied normal stress. b) Evolution of R with different normal stresses and test
velocities.
Figure 4.8 show that fracture toughness increases with the test velocity. In the other hand, it is also
verified for all the tested velocities that, the value of the energy per area increases with the increase of the
value of the ligament between notches. Figure 12 b) shows that the value of the fracture toughness
increases with test velocity and the applied normal stress.
R R

Material behavior of materials in manufacturing processes with material separation
9
0
2000
4000
6000
8000
10000
12000
0 1 2 3
Fo
rça M
áx (
N)
c (mm)
Exp.
Iform
Analít.1
0
2000
4000
6000
8000
10000
12000
0 1 2 3
Fo
rça M
ax. (N
)
c (mm)
Exp.Iform
Another procedure for analyzing the experimental results were utilized, for determining the energy per
volume U, which is require for the formation of new surfaces. This value results in the subtraction of the
total energy from an experimental test with the supposed theoretical value (from plastic deformation).
However, there is no generalized consensus of the physical fundamentals behind this methodology, the
present research work demonstrates that this technique presents quite satisfactory results.
(4)
The theoretical value of the required energy for the plastic deformation of the material was calculated
from finite element methods (FEM), by in-house computer program I-FORM. Figure 13 presents the
obtained values for U for different ligament between notches and test velocities.
Figure 13: Evolution of the energy per volume U with the ligament between notches and test velocity.
It can be observed that U remains almost constant with the ligament between notches c, for a specific test
velocity. This result validates indirectly, the supposed plastic deformation is limited for the material near
the notches.
One of the most important parameter to preview in the modelling of this test is the maximum shear force
By taken into account the as the total energy is the sum of several parts, it is expected that the maximum
shear force can be also obtained by the sum of the plastic deformation, formation of new surfaces and the
friction between tool and specimen [8]..
(5) As this type of test does not present relative movement between tool and specimen, the part of the friction
can be ignored. The force required for the formation of the new surfaces is obtained by calculating the
specific R and U as showed in Equation 7:
or (6) For the determination of the force required for the plastic deformation of the material Fplast, it is admitted
that the separation of the material is caused by the shear stresses and the maximum shear force is
proportional to maximum shear stress across the cutting perimeter of the specimen. It is represented
in Equation 8, where the maximum shear stress is replaced by the value result from the Von Mises
plasticity criterion √ [10].
√ (7)
These force values associated to the plastic deformation of the material were alternatively counted by the
numeric simulation with FEM, by I-FORM. The differences obtained with these two methodologies are
almost inexistent as can be observed in Figure 13.
a) b)
22
26
30
34
38
42
46
50
0 0,5 1 1,5 2 2,5 3 3,5
U (
MJ/m
3)
c (mm)
Quase estático 2 m/s 3 m/s

Material behavior of materials in manufacturing processes with material separation
10
0
2000
4000
6000
8000
10000
12000
0,80 1,30 1,70 2,40
Fm
áx
(N
)
c (mm)
EXP.
R
U
0
2000
4000
6000
8000
10000
12000
0,8 1,6 2 2,8
Fm
áx
(N
)
c (mm)
EXP.
R
U
Figure 13: Comparison between the experimental results, theoretical and FEM results at a) quasi-static and b) v = 3m/s
conditions.
The evaluation of the determination of the maximum shear force based on the plasticity and fracture
analysis was conducted by comparing the experimental results with the sum of the force due to plastic
deformation and the force that was required for the formation of new surfaces (obtained from R and the
energy per volume U). The results are presented in Figure 14
(a) (b)
Figure 14: Experimental values and the calculated maximum shear force as a function of the value of ligament between notches at
a) quasi-static and b) 3 m/s.
5. Conclusions
The experimental results shows that the cam-driven electromagnetic testing machine is capable of
operating across a broad range of operative conditions found in real manufacturing processes. The results
also show that the proposed machine equipped with a logistic cam is capable of diminishing ‘saw tooth’
oscillations in the experimental recordings of force that are typical of split Hopkinson pressure bars and
root type cam profiles. Moreover logistic cam profiles in conjunction with the proposed material model
are able to successfully model flow softening that is commonly found in metal cutting applications. The
present work also demonstrates the impact of the velocity profiles on the material’s flow curve.
The experimental results also points out the important role of the ductile fracture mechanics in the
manufacturing processes where the formation of new surfaces takes place. It can be concluded that the
value of the fracture toughness R depends on the strain rate, and not the value of the ligament remaining
between the starting cracks (for the same strain rate). It also shows that the normal stress shows little influence on the
value of R, for the tested strain-rate. In conclusion, the experimental results of the present research work are
particularly important for the modelling of manufacturing processes where the formation of new surfaces
takes place.
References
[1] Banabic D., Bunge H.-J., Pöhlandt K., Tekkaya A. E., Formability of metallic materials, Springer-Verlag,
Berlin, 2000.
[2] Silva C. M. A., Rosa P. A. R. and Martins P. A. F., Mechanical characterization of materials for bulkf using a
drop weight testing machine, Journal of Mechanical Engineering Science, 2010, 224, p. 1795-1804.
[3] Guo Y., Saldana C., Mann J. B., Saoubi R. M., Chandrasek S, Deformation and microstructure in machining,
Advanced Materials Research, 2011, 223, p.325-331.
[4] Field J. E., Walley S. M., Proud W. G., Goldrein H. T., Siviour C. R., Review of experimental techniques for
high rate deformation and shock studies, International Journal of Impact Engineering, 2004, 30, p. 725–775.
[5] Silva C. M. A., Rosa P. A. R., Martins P. A. F., Electromagnetic cam driven compression testing equipment”,
Experimental Mechanics, 2011 (on-line first).
[6] Rothbart H. A., Cam design handbook. McGraw Hill, New York, 2004.
[7] Sima M., Özel T., Modified material constitutive models for serrated chip formation simulations and
experimental validation in machining of titanium alloy Ti-6Al-4V. International Journal of Machine Tools
and Manufacture, 2010, 50, p. 943–960.
[8] Turner CE., “A re-assessment of ductile tearing resistance (Part I and II)”. Fracture Behaviour and Design of
Materials and Structures. Proc ECF 8, vol. II. p. 933–49. and p. 951–68, 1990.
[9] Atkins A. G., “Modelling metal cutting using modern ductile fracture mechanics: quantitative explanations for
some longstanding problems”, Int. J. Mech. Sci., 45: 373-396, 2003.
[10] Rodrigues J.M.C. and Martins P.A.F., “Tecnologia da deformação plástica, Vol. I. Fundamentos teóricos”,
Escolar Editora, Portugal, (2005).