mechanical behavior of grouted sands - mobt3ath.com · mechanical behavior of grouted sands...
TRANSCRIPT

University of KentuckyUKnowledge
Theses and Dissertations--Civil Engineering Civil Engineering
2015
Mechanical Behavior of Grouted SandsRyan C. OrtizUniversity of Kentucky, [email protected]
This Master's Thesis is brought to you for free and open access by the Civil Engineering at UKnowledge. It has been accepted for inclusion in Thesesand Dissertations--Civil Engineering by an authorized administrator of UKnowledge. For more information, please contact [email protected].
Recommended CitationOrtiz, Ryan C., "Mechanical Behavior of Grouted Sands" (2015). Theses and Dissertations--Civil Engineering. Paper 26.http://uknowledge.uky.edu/ce_etds/26

STUDENT AGREEMENT:
I represent that my thesis or dissertation and abstract are my original work. Proper attribution has beengiven to all outside sources. I understand that I am solely responsible for obtaining any needed copyrightpermissions. I have obtained needed written permission statement(s) from the owner(s) of each third-party copyrighted matter to be included in my work, allowing electronic distribution (if such use is notpermitted by the fair use doctrine) which will be submitted to UKnowledge as Additional File.
I hereby grant to The University of Kentucky and its agents the irrevocable, non-exclusive, and royalty-free license to archive and make accessible my work in whole or in part in all forms of media, now orhereafter known. I agree that the document mentioned above may be made available immediately forworldwide access unless an embargo applies.
I retain all other ownership rights to the copyright of my work. I also retain the right to use in futureworks (such as articles or books) all or part of my work. I understand that I am free to register thecopyright to my work.
REVIEW, APPROVAL AND ACCEPTANCE
The document mentioned above has been reviewed and accepted by the student’s advisor, on behalf ofthe advisory committee, and by the Director of Graduate Studies (DGS), on behalf of the program; weverify that this is the final, approved version of the student’s thesis including all changes required by theadvisory committee. The undersigned agree to abide by the statements above.
Ryan C. Ortiz, Student
Dr. L. Sebastian Bryson, Major Professor
Dr. Y. T. Wang, Director of Graduate Studies

MECHANICAL BEHAVIOR OF GROUTED SANDS
________________________________
THESIS
________________________________
A thesis submitted in partial fulfillment of the
Requirements for the degree of Master of Science in Civil Engineering
in the College of Engineering
at the University of Kentucky
By
Ryan Christopher Ortiz
Lexington, KY
Director: Dr. L. Sebastian Bryson, Associate Professor of Civil Engineering
Lexington, KY
2015
Copyright © Ryan Christopher Ortiz 2015

ABSTRACT OF THESIS
MECHANICAL BEHAVIOR OF GROUTED SANDS
Grouting techniques have been in used for many years, but several new grout materials
have surfaced in recent decades that have re-defined the boundaries of the limitations of
grouting programs. Typically these applications are used for seepage control in earthen
impoundments, but strength of these earthen impoundments should be considered where
there is potential for movement in the grouted soil mass. This study investigated initial
conditions that could affect grout application effectiveness. The initial conditions in
question were soil grain size and in situ moisture content. Two grouts were used, ultrafine
and acrylate, and variations in pure grout properties were studied. An apparatus was
developed so that a uniform grout could penetrate the pore spaces of a soil specimen. The
rate of penetration of the grout into the soil was studied. The unconfined compressive
strength of the resulting grouted soil was then analyzed.
In testing neat ultrafine grout, it was shown that increased water-to-cement ratios had
negative effects on the stability of the grout. Increasing the water-to-cement ratio from
0.5 to 2.5 resulted in a decrease in strength by a factor of 100. An inhibitor chemical was
used to increase the time for reaction in the acrylate grout. During the chemical reaction,
the curing temperature and gel times were monitored. A grout mix was selected for the
acrylate grout that achieved appropriate gel times. In general, this study found that the
grout penetrations rates into the soil increased as the initial moisture was increased from
dry conditions to a gravimetric moisture content of nine percent. In each study, increased
initial moisture decreased the grouted soil strength, with decreases in strength exceeding
50 percent. Empirical relationships were realized when compared to the initial matric
suction of the soil. This suggests initial matric suction may be a useful initial condition
for estimating increases in soil strength upon implementation of a grouting program for
both the acrylate and ultrafine grouts.
KEYWORDS: Grouted sands, Acrylate, Ultrafine Cement, Grout Penetration, Strength.
A Ryan C. Ortiz .
A March 23, 2015 .

MECHANICAL BEHAVIOR OF GROUTED SANDS
By
Ryan Christopher Ortiz
Dr. L. Sebastian Bryson
Director of Thesis
Dr. Y.T. Wang
Director of Graduate Studies
March 23, 2015

iii
ACKNOWLEDGEMENTS
I would first like to acknowledge my advisor Dr. L. Sebastian Bryson. Dr. Bryson
was not simply my research advisor, but the teacher and mentor who guided me in
making crucial engineering career choices. He is the most inspiring teacher, and is
responsible for sparking an interest in learning that I would never have achieved without
his guidance. The time Dr. Bryson spent each and every day helping me realize and
achieve my goals will always be cherished, as it is rare to find such a distinguished
professional who is so devoted to ensuring that students succeed. His demonstration of
how to be a top class professional while have fun and learning is an inspiration that I will
carry with me the rest my life. I cannot express the depth of my appreciation for my four
years spent researching on Dr. Bryson’s research team and will be forever grateful.
I would also like to thank my professors at the University of Kentucky, who
allowed me to expand my knowledge and ability to learn in the classroom: Dr. Michael
Kalinski, Dr. Ed Woolery, Dr. Michael Kalinski, Dr. Y.T Wang, and Dr. Kyle Perry
along with other professors at UK who guided me through my undergraduate career as
well. I would also like to thank both Dr. L. Sebastian Bryson and Dr. Michael Kalinski
for encouraging me to pursue the geotechnical engineering field through my interest in
their courses and research experiences. I want to thank Dr. Kamyar Mahboub for my
nomination for the Lyman T. Johnson Scholar. Professor Samantha Wright has been great
mentor for my teaching assistantship and helped develop my graphical and spoken
communication skills. The positions she entrusted to me were monumental in reaching
my speaking and leadership aptitude, which will prove helpful ability as I transition into
the workforce. Shelia Williams was instrumental in providing general support and doing

iv
background work that made my research goals possible, and for that I am extremely
thankful. The Civil Engineering Department at the University of Kentucky could not
have been better for providing classes that kept me interested in engineering and
providing every resource possible for the guidance of my education. I am very grateful
for the education I have received at UK, and I appreciate the efforts by my professors in
helping me earn my education.
My completion of my Master’s degree would have not been possible without the
help of my colleagues at the University of Kentucky. I would like to thank Xu Zhang,
Corrie Walton-Macaulay, Ali Salehian, Isabel Gomez, Kirk Jenkins, Nishel’le Spencer,
Jaquez Leandre, Malinda Jean-Louis, Jordan Keeney, Raghava Aditya, Alfred Susilo,
Paul Smith and Kobina Sekyi for not only helping me with school related work but being
friends as well. I would especially like to thank the team Bryson doctoral students, Corrie
Walton-Macaulay, Ali Salehian, and Isabel Gomez, for providing support as student-
mentors and showing me how to properly use the lab instrumentation.
Most importantly, I want to thank my family and close friends for their support in
this journey. My parents, Ronald and Lisa Ortiz, provided constant support, without
which none of my aspirations would be accomplished. My parents could not have been
more supportive throughout my life, and luckily, new much better than I did about my
potential life choice. Their guidance in these choices has proven and will continue to help
me as I make my way. I want to thank my sister, Kaylee Ortiz, and uncle, Mike Ortiz, for
their constant laughter and support. I especially thank my friends, who are too numerous
to name, whose constant laugher and good times will continue throughout life. These
people have made my life experiences full of joy and I am truly grateful. My

v
grandparents, Florencio Ortiz, Ileta Ortiz, Jim Reesor, and Noreida Reesor, truly instilled
within me the desire to work hard, give back, love other people, and live life the right
way. Without these people none of my accomplishments would be possible.
I would like to thank the Avanti International for supplying the materials used in
the experimentation. I would like to thank U.S. Grout for manufacturing such chemicals
and allowing me to experiment with ultrafine cementitious grouts. I. B. Moore donated
the O-rings used in the experimentation, for which I am appreciative. I want to thank
Nugent Sand Company for donating some of the sand used in this study.
Lastly, but foremost, I would like to thank God for without him nothing is
possible. He has allowed us to decode minute portions of creation, in the form of physical
sciences, and for allowing me to continue exploring at a graduate level.
vi
TABLE OF CONTENTS
Table of Contents
ACKNOWLEDGEMENTS ............................................................................................... iii TABLE OF CONTENTS ................................................................................................... vi LIST OF TABLES ........................................................................................................... viii LIST OF FIGURES ........................................................................................................... ix CHAPTER 1 ....................................................................................................................... 1
1 Introduction ............................................................................................................. 1
1.1 Background ....................................................................................................... 1
1.2 Basis of Study ................................................................................................... 2
1.3 Objectives of Research ..................................................................................... 4
1.4 Contents of Thesis ............................................................................................ 5
CHAPTER 2 ....................................................................................................................... 7
2 Mechanical Behavior of Ultrafine Cement-Grouted Sands .................................... 7
2.1 Introduction ...................................................................................................... 7
2.2 Literature Review ............................................................................................. 9
2.3 Testing Materials ............................................................................................ 11
2.4 Grouting Apparatus ........................................................................................ 22
2.5 Hydraulic Characteristics ............................................................................... 24
2.6 Strength Testing and Analysis ........................................................................ 31
2.7 Conclusion ...................................................................................................... 38
CHAPTER 3 ..................................................................................................................... 40 3 Mechanical Behavior of Acrylate-Grouted Sands ................................................ 40
3.1 Introduction .................................................................................................... 40
3.2 Testing Materials ............................................................................................ 43
3.3 Grouting Apparatus ........................................................................................ 55
3.4 Hydraulic Characteristics ............................................................................... 57
3.5 Strength Testing and Analysis ........................................................................ 62
3.6 Conclusion ...................................................................................................... 67

vii
CHAPTER 4 ..................................................................................................................... 69
4 Conclusions ........................................................................................................... 69
4.1 Mechanical Behavior of Ultrafine-Grouted Sands ......................................... 69
4.2 Mechanical Behavior of Acrylate-Grout Sands .............................................. 70
4.3 Future Research .............................................................................................. 71
Appendix A ....................................................................................................................... 73 A.1 Grain Size Distribution .......................................................................................... 74 A.2 Specific Gravity Data ............................................................................................. 76 A.3 Hydraulic Conductivity Data ................................................................................. 78
Appendix B ....................................................................................................................... 80
B.1 Neat Ultrafine Cement Test Results ....................................................................... 81
B.2 Acrylate Gel Testing .............................................................................................. 82
Appendix C ....................................................................................................................... 95
C.1 Apparatus and Procedures ...................................................................................... 96 C.2 Ultrafine Flow Data .............................................................................................. 102 C.3 Acrylate Flow Data. ............................................................................................. 103
Appendix D ..................................................................................................................... 104 D.1 Ultrafine Grouted sand Unconfined Compressive Strength Data ........................ 105
D.2 Acrylate Grouted sand Unconfined Compressive Strength Data ........................ 107 Appendix E ..................................................................................................................... 109 References ....................................................................................................................... 111
Vita .................................................................................................................................. 117

viii
LIST OF TABLES
Table 2.1. Sand Data. ........................................................................................................ 12 Table 2.2. Saturated Hydraulic Conductivity. .................................................................. 13 Table 2.3. Soil Water Characteristics Curve Parameters. ................................................. 16 Table 3.1. General Mix Design for a Chemical Grout. ..................................................... 42
Table 3.2. Sand Data. ........................................................................................................ 44 Table 3.3. Hydraulic Conductivity.................................................................................... 44 Table 3.4. SWCC Data...................................................................................................... 47 Table 3.5. Typical Mix Design for Acrylate Grout, AV-160, with no KFe. .................... 50 Table 3.6. Mix Design for Prepared Grouted sand Specimens in this Study.................... 55

ix
LIST OF FIGURES
Figure 2.1. Grain Size Distribution. .................................................................................. 11 Figure 2.2. Hydraulic Conductivity versus Grain Size Factor, D10. ................................. 14 Figure 2.3. Fredlund and Xing (1994) Optimized Fit for Test Sand. ............................... 16 Figure 2.4. Fitting Paramter, a, versus D10. ...................................................................... 17 Figure 2.5. Relative Hydraulic Conductivity versus Volumetric Moisture Content. ....... 18
Figure 2.6. Effect of Water-to-Cement Ratio on Grout Bleed. ......................................... 20 Figure 2.7. Relationship between Unconfined Compressive Strength versus Water-to-
Cement Ratio. ................................................................................................................... 21 Figure 2.8. Schematic of Grouting Apparatus. ................................................................. 22 Figure 2.9. Groutability Factor versus Grain Size for 15 Percent Passing. ...................... 25
Figure 2.10. Normalized Penetration Rate versus Volumetric Water Content. ................ 27
Figure 2.11. Penetration Rate versus Suction. .................................................................. 28 Figure 2.12. Soil Penetration Rate versus Permeability Factor. ....................................... 30 Figure 2.13. Ultrafine Grout Stress-Strain. ....................................................................... 31
Figure 2.14. Effective of Specific Surface Area on the Unconfined Compressive Strength.
........................................................................................................................................... 33
Figure 2.15. Compressive Strength versus Volumetric Moisture Content. ..................... 35 Figure 2.16. Compressive Strength versus Volumetric Grout Ratio. ............................... 36 Figure 2.17. Compressive Strength versus Suction. ......................................................... 37
Figure 3.1. Grain Size Distribution. .................................................................................. 43 Figure 3.2. Fredlund and Xing (1994) Optimized Fit for Test Sand. ............................... 46
Figure 3.3. Fitting Parameter “a” versus D50. ................................................................... 47 Figure 3.4. Relative Hydraulic Conductivity versus Volumetric Moisture Content. ....... 48
Figure 3.5. Typical Temperature-Time Reaction for Polymerization Reactions.............. 49 Figure 3.6. Time-Temperature Curve during Acrylate Polymerization. .......................... 52
Figure 3.7. Normalized Maximum Temperature versus Inhibitor Concentration ............ 53 Figure 3.8. Effect of Inhibitor (KFe) Concentration on A) Gel Time and B) Maximum
Temperature. ..................................................................................................................... 54
Figure 3.9. Grouting Apparatus. ....................................................................................... 56 Figure 3.10. Hydraulic Conductivity Groutability Criterion. ........................................... 58
Figure 3.11. Effect of the Degree of Saturation on Grout Penetration Rate. .................... 59 Figure 3.12. Effect of the Permeability Factor on Penetration Rate. ................................ 61 Figure 3.13. Acrylate Grouted sand Stress-Strain Curves. ............................................... 62 Figure 3.14. Effect of Fines on the Grouted sand Compressive Strength. ........................ 64 Figure 3.15. Compressive Strength versus Degree of Saturation. .................................... 65
Figure 3.16. Modulus of Elasticity versus Normalized Matric Suction. .......................... 66

1
CHAPTER 1
1 Introduction
1.1 Background
Grouting has been utilized for the stabilization of earthen impoundments and foundations
where seepage conditions are problematic or weak soil may fail. For geotechnical
purposes, grouting programs have been used to stabilize weak soils, to contain hazardous
waste, to erect low permeability grout curtains, to seal seepage in mines, re-stabilize
tunnels, and to restore failing dams. In these stabilization applications, ordinary Portland
cement grouts are often appropriate and are typically the first option considered
(Babcock, 2013A). Ordinary Portland cement grouts have proven satisfactory in
geotechnical solutions, such as seepage cutoff applications, where the effective grain
sizes are greater than 1 millimeter (NAVFAC, 1983). In these applications, Portland
cement has decreased seepage and stabilized weak soils. However, due to large cement
particle sizes, ordinary Portland cement is ineffective for permeation grouting of medium
and fine-grained sands, along with soils with significant fines (Zebovitz el al., 1989). Due
to this ineffectiveness, several grouts have been developed that are capable of penetrating
soils with finer particle sizes.
To grout soils with finer grain size distributions, chemical grouts were developed. This
was because Portland cements are not applicable to conditions where fine sands exist.
Chemical grouts can have viscosities similar to that of water, which allows permeation
into some fine sands. Chemical grouted soils may exhibit satisfactory strength and
excellent seepage control, but several issues exist with chemical grouts, such as the costs
of such products are high and the longevity has been found to be less than that of cement.
Due to these issues with chemical grouts, cementitious grouts with smaller particle sizes
were developed to satisfy conditions where Portland cement may not be applicable.
While cement grouts are cheaper, they sometimes fail to lower permeability. In these
instances, chemical grouts may be applied after a cement grouting program, as critical
locations where seepage reduction has not taken place (Babcock, 2013B)
Various forms of such grouts have been in use in recent decades. Grouting programs have
shown to be effective in a variety of applications ranging from dam stabilization to
2
sealing mines (Soule and Henn, 2010). Also, several researchers have investigated the
applicability of a variety of grouting material used for ground improvement applications
(Karol, 2003; Warner, 2004; Powers et al., 2007). As grouts continue to be used for
stabilization and ground improvement, the properties of the different grouts that exist
should continue to be investigated, the factors affecting the mechanical behavior of the
grouted mass must be investigated. For grouting applications that involve earthen
impoundments, initial conditions of the soil, such as in situ moisture and density
conditions, should be examined. With the anticipated increase in usage of this product,
investigation into the effects that initial soil conditions may have on the strength of a
grouted mass in earthen impoundments can benefit industry and the public good by
contributing to sustainable design for infrastructure.
1.2 Basis of Study
1.2.1 Ultrafine Grout
Several useful studies involving cementitious grout materials have been published.
Researchers Zebovitz et al. (1989) determined the groutability of sands based on
variations of soil parameters, such as D15, and formulated soil-specific relationships for
ultrafine grouted sand permeability and unconfined compressive strength. However, the
study did not study injection penetration rates into soil or the effects of initial soil
conditions, such as in situ moisture and unit weight, in regard to grouted sand
permeability and strength. Researchers Schwarz and Chirumalla (2007) studied the extent
that constant, oscillating, and magnitudes of injection pressures affect the hydraulic
properties and the strength of ultrafine grouted sand samples. However, these researchers
did not evaluate any soil-specific initial conditions. Researchers Mollamahmutoglu and
Yilmaz (2011) compared predicted groutability criterion versus experimental results, but
did not present results of any experimentation of the resulting ultrafine grouted sand. The
study found that poorly-graded grain size distributions, with few fines, are typically
groutable. While a major benefit of ultrafine grout was its penetration ability into the
soils with low hydraulic conductivity, the strength of the grouted soil mass was not
thoroughly discussed.

3
While the primary consideration in design is that the earthen impoundment has adequate
seepage reduction, quantification of expected strength is also important in design. Several
researchers have investigated variation of strength parameters based on the grouting
processes and initial soil conditions. Researchers Dano at al. (2004) established
relationships in regard to unconfined compressive strength for various water-to-cement
ratios, for ultrafine cement, as a function of relative densities of sand at one water-to-
cement ratio. These researchers found a soil-specific cohesion and phi angle for two
grouted sands. The only initial condition studied was relative density. Researchers
Markou and Droudakis (2013) investigated unconfined compression data and grouted
sand permeability when alterations were made in the water-to-cement ratio of the
ultrafine grout and grain size of soil, having effective grain sizes ranging from 0.34 to
2.2. In regard to initial conditions, this study did not investigate initial soil unit weight
and in situ moisture.
1.2.2 Acrylate Grout
Han et al. (2004) performed an experimental study on the gel time of acrylate grout and
observed the chemical properties of the grout. A study performed by Krizek et al. (1980)
tested various engineering properties of acrylate grouted sand, but did not look at
variation in initial conditions of those properties. Additional research concerning acrylate
grout should be performed, as this product is commercially available and used in various
grouting applications (Avanti International, 2014A).
1.2.3 Unsaturated Initial Conditions
It is noted that the aforementioned studies typically assumed saturated conditions. While
these mechanical studies have investigated many important groutability, grouted sand
permeability, and strength relationships that exist for grouted sand, these studies have
also highlighted the need for further research. The most evident need for further research
are the effects of soil suction due and initial moisture conditions on grout penetration and
strength.
Researchers Perret et al. (2000) investigated the effects of the degree of saturation on the
ultrafine grout injection rate into sand along with the hydraulic conductivity of the
grouted sand. These researchers also investigated suction and the soil matrix, along with

4
the resulting behavior of a grouted sand mass due to capillary effects. These researchers
articulated and visually demonstrated the influence that the soil particle structure and
water within the structure has on the grout penetration.
The aforementioned study demonstrated a need for further understanding of grout
penetration into unsaturated media, the resulting strength, and quantification of strength
due to variation of initial moisture conditions. This need is due to effects of dilution of
the grout and effects of in situ suction on the resulting grouted sand. A major purpose of
this study was to expand such knowledge.
1.3 Objectives of Research
The objectives of the grout research are as follows:
1) Quantify the effect that the grout mix design has on the pure ultrafine grout product
This experimentation will verify what mix design is desired for the testing
program. The results may provide insight into what mix designs are undesirable
for select applications.
Determine the extent that ultrafine cement grout mix design affects the water
bleed of the grout
Develop relationships for variation in cement grout mix design and strength
Investigate the behavior that occurs in the chemical reactions that forms acrylate
cured grout.
Compare variations in grout chemicals and the resulting gel time and curing
temperature
Observe changes in gel time and curing temperature with variation in ambient
temperature
2) Develop an apparatus that can be used to grout cylindrical soil specimens
The important consideration of this portion is that the procurement of samples
simulates that of field processes. This was executed by extensive review of
previous research and applicable standards.
Use previous studies and appropriate standards to create a apparatus to transport
the grout through a porous medium

5
Develop procedures so that the grout is distributed evenly within the pore spaces
of the soil
3) Investigate the effect of initial conditions of soils and their effect on initial grout
penetration
Understanding grout penetration into soil will contribute to the degree of
effectiveness of grouting programs. This is because the success of the program is
directly dependent the grout penetrates the soil adequately, filling the volume of
soil desired by the project designer.
Determine the effects that grain size directly has on penetration into the pore
spaces and groutability
Investigate the effects of initial moisture on the grout penetration into the soil
specimen
Develop relationships in regard to penetration in regard to unsaturated soil
mechanics
4) Develop relationships between soil initial conditions and the resulting grouted sand
strength
The initial conditions of the soil could affect the strength of the grouted-mass. The
degree of these effects should be quantified, to ensure grouting operations
improve the soil to the necessary extent.
Explore the effects that different soil parameters have on strength of the grouted
soil
Determine the extent that initial soil moisture changes grouted soil strength
Use unsaturated soil mechanics as a tool to estimate the effects of initial soil
conditions on the grouted sand mechanical properties
1.4 Contents of Thesis
Chapter 2 presents a study concerning ultrafine grouts. Several properties of the grout
were quantified. In particular for the neat ultrafine grout, the effect of water-to-cement
ratio on engineering properties was investigated. Also, groutability data was presented
and compared the existing groutability criteria. Grout penetration was investigated in
regard to initial conditions. Properties of the in situ soil were related to the resulting
grouted sand properties.

6
Chapter 3 presents an investigation regarding an acrylate-based grout. This study studied
the pure grout, as it related to the curing of the grout. Specifically, a chemical was studied
that prolongs, or inhibits, the time for the grout to gel was studied. Quantities of this
inhibiting chemical were varied in the acrylate grout mix, and the gel time effects of this
variation were quantified. This study also investigated the effects of the initial conditions
on the acrylate grouted- sand. The effects studied were the grout penetration and ultrafine
compressive strength of the post-grouted conditions.
Chapter 4 contains conclusions of this research.
Appendix A presents additional data for the soil indices obtained for the soils used in this
study. This encompasses grain size distribution tables, specific gravity data, and
hydraulic conductivity data.
Appendix B shows data that pertains to pure grout testing. For the neat cement, this
pertains to bleed testing and unconfined strength testing. For the acrylate grout, the
curing temperature and gel time were observed.
Appendix C shows pictures and processes use to grout the soil specimens, and associated
grout penetration data. Pictures of the apparatus and associated procedures are outlined,
and pertinent pictures are presented. Additional data regarding the grout mix penetrating
the soil specimen is also shown.
Appendix D shows additional strength tables for the grouted sands.
Appendix E contains important information regarding product information for the
grouting apparatus.

7
CHAPTER 2
2 Mechanical Behavior of Ultrafine Cement-Grouted Sands
2.1 Introduction
2.1.1 Grouting Introduction
Cementitous grout is used in the stabilization of foundations where weak soils exhibit
behavior indicative of failure. Ordinary Portland cement grouts can be the appropriate
solution for soil stabilization (Babcock, 2013A). In specialized geotechnical applications,
such as in seepage cutoff, Portland cement grout has been shown to be effective for
penetrating soils with effective grain sizes greater than 1 millimeter (NAVFAC, 1983).
Due to grain sized limitations associated with Portland cement grout, previously
described, requires the development of grouts with enhanced rheological properties.
Ordinary Portland cement has proven ineffective for permeation grouting of medium and
fine-grained sands, along with soils with significant fines. This is due to large cement
particle sizes associated with ordinary Portland cement, in relation to the pore spaces in
medium and fine-grained sands (Zebovitz el al., 1989). In order to grout soils with finer
grain size distributions, chemical grouts were developed. Chemical grouts have similar
viscosities as water, which allows permeation into some fine sands. Chemical grouted
soils may exhibit satisfactory strength and excellent seepage control, but the costs of such
products are high and the longevity has been found to be less than that of cement. Also,
some of these chemical grouts were banned in the past due to toxicity (Dano et al., 2004).
Safety procedures in relation to toxicity have since been improved, but grout toxicity
itself remains a sensitive design factor in the selection of a grouting program. Due to
problems associated with cost and toxicity of chemical grouts, various cementitious
grouts were developed that behave similarly to chemical grouts. One such cementitious
grout is ultrafine cement grout.
2.1.2 Ultrafine Cement Grout Background
Ultrafine cement grout was developed to expand the limitations of grain and crack sizes
that may be penetrated, while avoiding the cost, toxicity, and longevity issues associated
with chemical grouts (U.S. Grout, 1999). Babcock (2013B) defines ultrafine cements as
having a particle sizes ranging from three to five microns, while the particle size for

8
microfine cements have a particle size of six to ten microns (Backcock, 2013B). Ultrafine
grout has enhanced rheological properties, better bleed properties, and sets in less time
than ordinary Portland cement grouts (Henn, 2010). While academic studies and some in
industry have distinguished between ultrafine and microfine grout, no industry or
government standard has been formally developed (Babcock, 2014B). Due to the known
effects of cement particle size on strength, a distinction has been made in this thesis
between the terms microfine and ultrafine. In this study, ultrafine grout was selected,
rather than a microfine grout.
For geotechnical purposes, ultrafine grout has been used to stabilize weak soils, to
contain hazardous waste, to erect low permeability grout curtains, to eliminate seepage in
mines, to control seepage in tunnels, and mitigate failing dams by forming seepage
barriers. Several specific examples have shown benefit and applicability of ultrafine
grout. In San Francisco, California, a team of engineers designed a permeation grouting
operation to fortify the foundation of a historical church using ultrafine cement (Geo-
Grout, 2008). In this application, the in situ soil was loose sand. Without geotechnical
engineering intervention, the church’s foundation would fail under seismic loading
common in the area. The ultrafine grout was used to upgrade the foundations ability to
withstand seismic forces. At a hazardous waste facility in Niagara Falls, New York,
hydrologic evaluation showed that in order to protect public drinking water from toxic
pollution, the existing natural waterways would need to be diverted from the facility to
avoid contamination (Gazaway, 1991). A 26-meter deep by 820-meter long grout curtain
was constructed, using ultrafine cement, in the path of the polluted waterway. The grout
curtain successfully stopped the contaminant migration into the waterways. Grout
curtains have commonly been used to reduce seepage and induce mechanical stability in
dams. Ultrafine grout curtains were implemented at Rocky Reach Dam in Washington,
United States, at a dam with silty sand foundation in Taiwan, and a dam protecting a
mining operation in Argentina (American, 1960; Soule and Henn, 2010; Gentry and
Magill, 2012). Furthermore, ultrafine grout has been shown to be effective in sealing
tunnels and mines that have been compromised by significant amount of seepage, often in
excess of 3000 liters per minute (Soule and Henn, 2010). It has been noted that the most
common purpose of ultrafine grouting application is to reduce seepage. However,

9
mechanical behavior may continue to be studied, due to potential settlement and lateral
movement of earthen impoundments. With the anticipated increase in usage of ultrafine
cement, investigation into the effects that initial soil conditions have on the strength of a
grouted mass in earthen impoundments can benefit industry and the public good by
contributing to sustainable design for infrastructure.
2.2 Literature Review
2.2.1 Ultrafine Cement Grouted Soils
Previous studies have investigated grouting cylindrical soil specimens to quantify
geotechnical characteristics of ultrafine cement grout, based on variation in grouting
procedures and in situ conditions. The major convenience of ultrafine grout, as
previously noted, was its lack of toxicity, cost, and ability to permeate (groutability) finer
soils. Several studies analyzed the groutability and quantified the types of soils that can
be grouted based on grain size.
Several useful studies involving groutability have been published. Researchers Zebovitz
et al. (1989) determined the groutability of sands based on variations of soil parameters,
such as the particle size corresponding to fifteen percent passing, and formulated a soil-
specific relationship for grouted sand permeability and unconfined compression data of a
grouted sand. However, these researchers did not study grout injection rates into soil and
effects of initial conditions of the in situ soil, such as unit weight or moisture content.
Researchers Schwarz and Chirumalla (2007) used variable injection pressures. In
particular, these researchers used constant and oscillation injection pressures, and also
varied the magnitude of the injection pressure. These researchers investigated the grout
penetration properties along with the strength of grouted sand samples, in comparison to
variable injection pressure types and magnitudes. However, these researchers did not
look at any soil-specific initial conditions. Researchers Mollamahmutoglu and Yilmaz
(2011) examined predicted groutability criterion versus experimental results, but did not
inspect the resulting grouted sand. These researchers concluded that poorly-graded grain
size distributions, with few fines, are typically groutable. While a major benefit of this
grout, in improvement of weak soils, is its penetration ability into the soil and low
10
hydraulic conductivity, the strength of the grouted soil will continue to be an important
design consideration.
While the primary consideration in design is that the underground structure has adequate
seepage reduction, quantification of expected strength will be important in design. This is
because settlement and lateral movement are possible in earthen impoundments, such as
dams. Several researchers have investigated variation of strength parameters based on the
grouting processes and initial soil conditions. Most studies tested specimens at saturated
conditions. Researchers Dano at al. (2004) established relationships in regard to
unconfined compression for water-to-cement ratio, relative density at one water-to-
cement ratio, and have found a soil-specific cohesion and phi angle for two grouted
sands. However, the only initial condition studied was relative density. Researchers
Markou and Droudakis (2013) investigated unconfined compression and grouted sand
permeability when alterations were made in the water-to-cement ratio of the grout and
grain size of soil; for initial conditions, this study investigated a range of grain sizes. This
study investigated soils with D15 values ranging from 0.13 to 0.43 mm, but did not
present any relationships in pertaining to grain size. The range of grain sizes explored can
be expanded. These mechanical studies have extensively verified many important
groutability, grouted sand permeability, and strength relationships that exist for grouted
sand; these have also sparked the need for further research.
2.2.2 Importance of Specific Research
As has been presented, several studies attempted to quantify some of the relationships
between engineering properties and grout injection, soil types, and conditions. Still, there
are some conditions yet to be investigated. Most notably are the effects of soil suction
due to initial moisture conditions on grout penetration and strength. Researchers Perret et
al. (2000) investigated the effects of the degree of saturation on the injection rate into
sand along with the grouted sand permeability; these researchers investigated suction and
the soil matrix, along with the resulting behavior of a grouted sand mass due to capillary
effects. These researchers articulated and visually demonstrated the influence of the soil
particle structure and the water content within the structure has on the grout penetration.
However, no specific relationships were developed and insufficient testing was

11
performed in order to develop such relationships. While the study did look at initial
moisture characteristics, it did not directly measure suction. The aforementioned study
demonstrates a severe need for further understanding of grout permeation into
unsaturated media, the resulting strength, and quantification of strength due to variation
of initial moisture conditions.
2.3 Testing Materials
2.3.1 Test Sands
2.3.1.1 Index Properties
A test program was developed to provide a basic understanding of the role of unsaturated
soil mechanics on engineering properties of grouted sands. To achieve this objective, five
different sands with varying grain size characteristics were tested. The grout injection
into the sands was monitored and the grouted sand strength was tested after the specimen
cured. The grain size distribution curves for the sands selected for use in this study are
shown in Figure 2.1. As discussed earlier, previous studies developed relationships for
various grain size parameters.
Figure 2.1. Grain Size Distribution.
In previous research conducted by Markou and Droudakis (2013), effective grain size
(D10) values ranging from about 0.34 to 2.15 millimeters were analyzed. To compliment
previous research, soils with finer grain sizes were selected for investigation in this study.
The range of D10 values in this study range from 0.18 to 0.28 millimeters. The specific
gravity values, presented in Table 2.1, are typical values for sands. Kentucky River sand
is naturally occurring sand. This sand is classified as fine grained and has a substantial
0
10
20
30
40
50
60
70
80
90
100
0.0100.1001.00010.000
Percen
t F
iner (%
)
Particle Diameter (mm)
Hardscapes Sand
Ohio River Sand
Trimble County Sand
Medium Sand
Kentucky River Sand

12
amount of fines, which may be responsible for its high specific gravity. Ohio River sand
is also naturally occurring sand. However, this is coarse sand. Hardscapes sand is
mechanically altered manufactured sand and is commercially available. This sand has a
medium grain size. Medium sand is naturally occurring and was mechanically altered.
Trimble county sand is naturally occurring. Relevant grain size data is presented in Table
2.1.
Table 2.1. Sand Data.
Sand Name Specific Gravity,
Gs
D60 (mm)
D30 (mm)
D10 (mm)
Coefficient of Curvature, Cc
Specific Surface Area, Ss (mm-1)
Kentucky River Sand 2.69 0.18 0.13 0.07 1.3 38.1 Ohio River Sand 2.66 0.73 0.42 0.36 0.7 15.1 Hardscapes Sand 2.65 0.48 0.31 0.22 0.9 19.1
Medium Sand 2.66 0.4 0.28 0.18 1.1 20.7
Trimble County Sand 2.66 0.5 0.32 0.22 0.9 17.8
Coefficient of curvature (Cc) and specific surface area (Ss) values have been presented in
Table 2.1. The coefficient of curvature is used to provide an index of the gradation, or the
distribution of particle sizes within the sample. Coefficient of curvature is defined as
6010
2
30c
DD
DC
(1)
where D10 is the particle size corresponding to 10 percent passing, D30 refers to the
particle size corresponding to 30 percent passing, and D60 is the grain size corresponding
to 60 percent passing. Specific surface area is a index of the surface area of the particles
in a soil specimen.
eff
sD
SFS (2)
where SF is a shape factor, commonly 6 for round-grained soils, and Deff is the effective
diameter. The effective diameter is

13
imin,imax,
ieff
DD
ΔF
100%D (3)
where Dmin,i is the minimum grain size for a selected interval, Dmax,i is the maximum
grain size in a selected interval, and ΔFi is the percentage correspond to the selected grain
size interval.
2.3.1.2 Hydraulic Properties
Saturated hydraulic conductivity testing was performed to understand the characteristics
of the soil. All tests were performed in accordance to ASTM D4234. The saturated
hydraulic conductivity values of the soils used in the study are shown in Table 2.2.
Table 2.2. Saturated Hydraulic Conductivity.
Sand Name Saturated Hydraulic
Conductivity, ks (m/s)
Kentucky River Sand 2.5E-06
Ohio River Sand 4.4E-04
Hardscapes Sand 3.5E-04
Medium Sand 2.6E-04
Trimble County Sand 3.8E-04
The unit weight of the specimens was 15.7 kN/m3, which was constant throughout this
study. These hydraulic conductivities are similar to those found in other studies (Markou
and Droudakis, 2013; Perret et al., 2004). Common tests for hydraulic conductivity are
limited to saturated soils. A study by Hazen (1892) found that hydraulic conductivity was
highly correlated to effective grain size squared, D102. The results, in this study, between
hydraulic conductivity versus a grain size factor squared, D102
, are shown in Figure 2.2.
The Hazen (1892) equation is
2
10s CDk (4)
where ks is hydraulic conductivity and D10 is effective grain size, or the grain size that 10
percent of the particle size distribution is finer than. Emperical coefficient “C” is an
empirical coefficient equal to 0.5. The empirical coefficient is unique to the data and
specific to the range of effective grain sizes presented.

14
Figure 2.2. Hydraulic Conductivity versus Grain Size Factor, D10.
Coefficient “C” represents the rate of increase per unit D10 increase, where hydraulic
conductivity increase 0.5 cm/s per 1 mm effective grain size increase. The high
correlation coefficient for this empirical equation of hydraulic conductivity with effective
grain size shows why grain sizes are often attributed to groutability of soil. It should be
noted that while a constant dry unit weight was used in this study, the dry unit weight
corresponding to data in other studies may vary.
2.3.1.3 Soil-Water Characteristics Curves
Due to variability with in situ moisture content, unsaturated soil mechanics was a major
interest for this study. Unsaturated soil mechanics quantifies the effects of soil moisture
on matric suction, which provides insight into other engineering properties. Specific to
this study, unsaturated soil mechanics provided insight into grout penetration rates during
the grout injection phase of the experimentation and provided insight into the mechanical
behavior of grouted sands.
The soil-water characteristics curve (SWCC) is the fundamental interpretive tool to
analyze effects of water in the soil skeleton (Fredlund et al., 2012). SWCCs are soil-
specific relationships between suction and moisture. These curves are non-unique
solutions and have variability based upon initial unit weight, wetting versus drying, and
the type of pore fluid. The Fredlund and Xing (1994) expression was used to interpret
volumetric water content and suction data in order to develop a SWCC curve. The
expression utilizes a parameter optimization procedure that gives non-unique solutions,
which are highly dependent upon the input data and the optimization constraints. Two
y = 0.5x
R² = 0.99
1.0E-04
1.0E-03
1.0E-02
1.0E-01
1.0E+00
1.0E+01
0.001 0.01 0.1 1 10
k (cm
/s)
D102 (mm2)
Perret et al. (2004)
Markou and Droudakis (2013)
This Study

15
equations are used in the optimization procedure. One equation is used to estimate the
volumetric water content
mn
s
a
ψeln
θψCθ (5)
where θ is volumetric water content, θs is volumetric water content at saturation, and e is
2.718. Variables a, n, and m are fitting parameters obtained by the SWCC optimization
method. Volumetric water content is
w
d
γ
γwθ (6)
where w is gravimetric moisture content, d is the dry unit weight, and w is the moist unit
weight. The second equation, C(), is a correction function. This function is
r
r
ψ
ψ1ln
ψ
ψ1ln
1ψCd
(7)
where is matric suction, r is the residual matric suction, and d is dry matric suction.
The dry suction, d, was a constant, and is 1,000,000 kPa. The resulting SWCCs, shown
in Figure 2.3, were obtained using a Microsoft Excel Equation Solver and direct
volumetric water content measurements using a Tempe cell. Parameters obtained from
the analysis are presented in Table 2.3. The residual suction, r, was held constant at 100
kPa for coarse grain graded soils, as suggest by the Fredlund (1999) for initial conditions.
Fitting parameters “a”, “n”, and “m” were bound between 1 to 15150, 1 to 20, and 0.5 to
4, as recommended by Fredlund and Xing (1994).

16
Figure 2.3. Fredlund and Xing (1994) Optimized Fit for Test Sand.
Several researchers have shown that the SWCC parameters correspond to grain size
indeces. Torres (2011) showed that the Fredlund and Xing (1994) a-parameter correlated
to D10. The relationship in this study between “a” and D10 is shown in Figure 2.4.
Table 2.3. Soil Water Characteristics Curve Parameters.
Sand Name Saturated
Volumetric Water Content, θ (%)
Air Entry
Value, aev
(kPa)
Fitting
Parameter,
a
Fitting
Parameter,
n
Fitting
Parameter,
m
Medium Sand 39.8 0.7 1.0 1.2 0.5
Ohio River Sand 39.8 1.4 2.1 3.2 0.5
Trimble County Sand 39.8 1.4 2.6 1.4 0.5
Hardscapes Sand 39.5 13 2.6 1.0 1.3
0
5
10
15
20
25
30
35
40
45
0.1 1 10 100 1000 10000 1000001000000
Volu
metr
ic M
ois
ture (
%)
Suction (kPa)
Medium Sand
Ohio River Sand
Hardscapes Sand
Trimble County Sand
Medium Sand Data
Ohio River Sand Data
Hardscapes Sand Data
Trimble County Sand Data
17
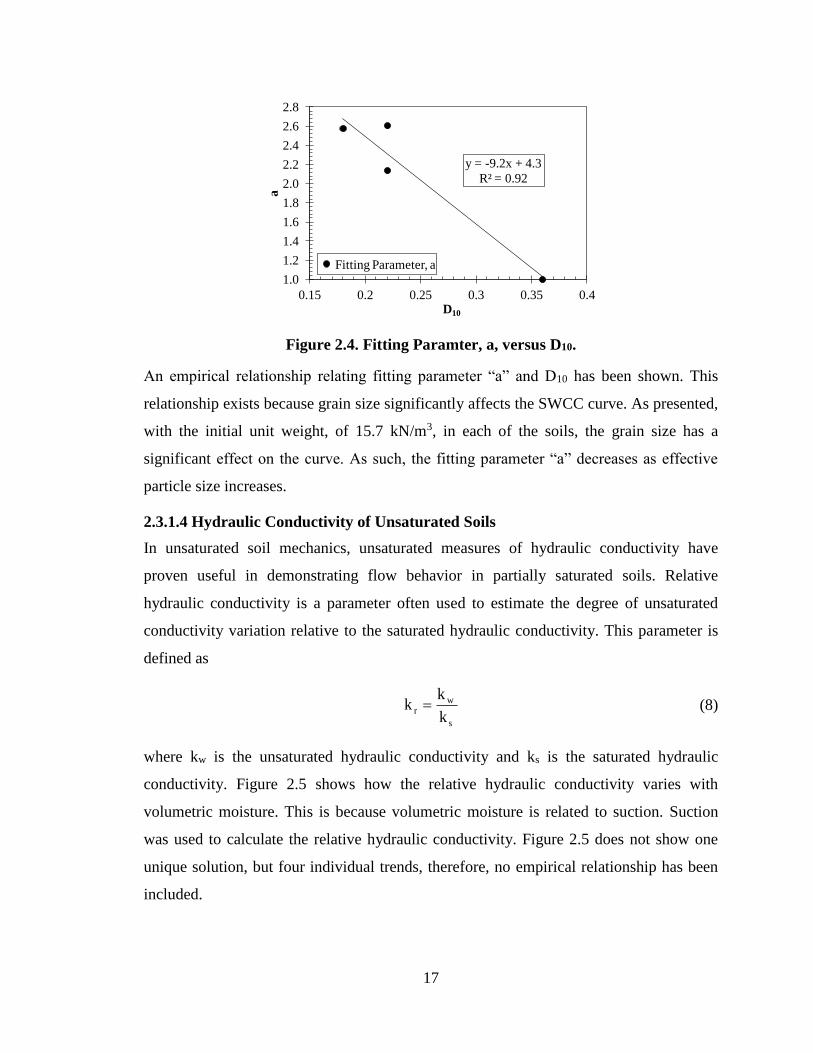
Figure 2.4. Fitting Paramter, a, versus D10.
An empirical relationship relating fitting parameter “a” and D10 has been shown. This
relationship exists because grain size significantly affects the SWCC curve. As presented,
with the initial unit weight, of 15.7 kN/m3, in each of the soils, the grain size has a
significant effect on the curve. As such, the fitting parameter “a” decreases as effective
particle size increases.
2.3.1.4 Hydraulic Conductivity of Unsaturated Soils
In unsaturated soil mechanics, unsaturated measures of hydraulic conductivity have
proven useful in demonstrating flow behavior in partially saturated soils. Relative
hydraulic conductivity is a parameter often used to estimate the degree of unsaturated
conductivity variation relative to the saturated hydraulic conductivity. This parameter is
defined as
s
wr
k
kk (8)
where kw is the unsaturated hydraulic conductivity and ks is the saturated hydraulic
conductivity. Figure 2.5 shows how the relative hydraulic conductivity varies with
volumetric moisture. This is because volumetric moisture is related to suction. Suction
was used to calculate the relative hydraulic conductivity. Figure 2.5 does not show one
unique solution, but four individual trends, therefore, no empirical relationship has been
included.
y = -9.2x + 4.3
R² = 0.92
1.0
1.2
1.4
1.6
1.8
2.0
2.2
2.4
2.6
2.8
0.15 0.2 0.25 0.3 0.35 0.4
a
D10
Fitting Parameter, a
18
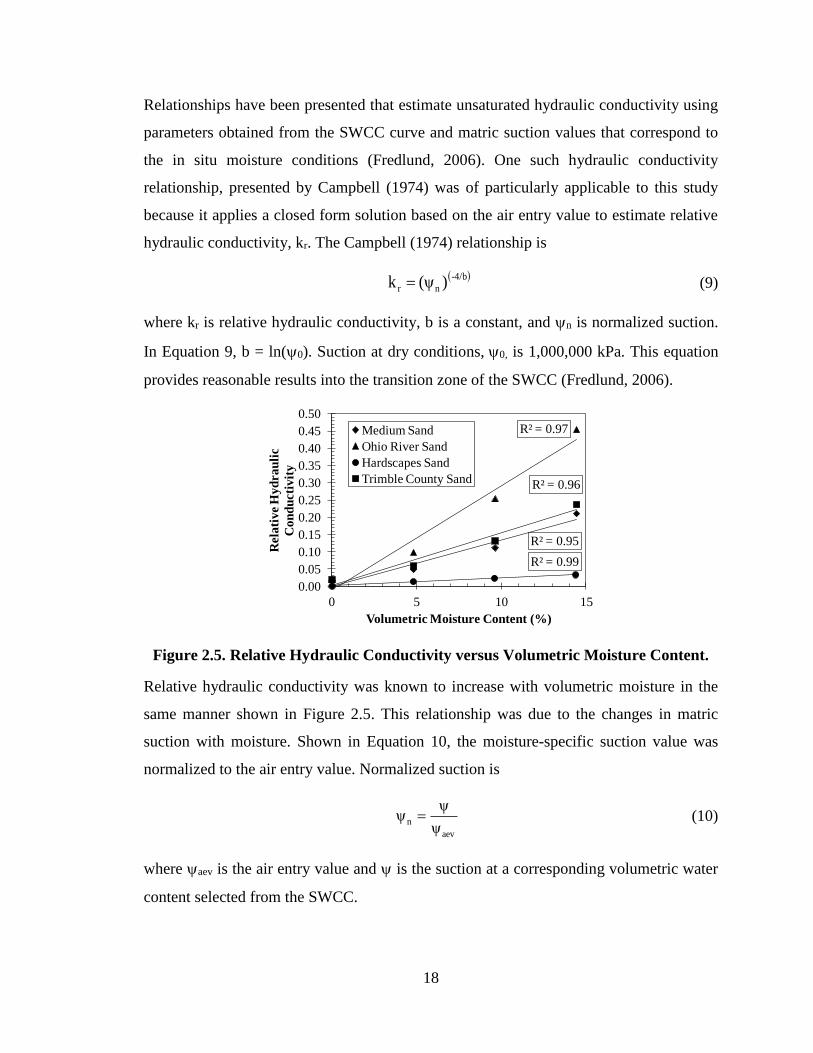
Relationships have been presented that estimate unsaturated hydraulic conductivity using
parameters obtained from the SWCC curve and matric suction values that correspond to
the in situ moisture conditions (Fredlund, 2006). One such hydraulic conductivity
relationship, presented by Campbell (1974) was of particularly applicable to this study
because it applies a closed form solution based on the air entry value to estimate relative
hydraulic conductivity, kr. The Campbell (1974) relationship is
-4/b
nr )(ψk (9)
where kr is relative hydraulic conductivity, b is a constant, and n is normalized suction.
In Equation 9, b = ln(0). Suction at dry conditions,0, is 1,000,000 kPa. This equation
provides reasonable results into the transition zone of the SWCC (Fredlund, 2006).
Figure 2.5. Relative Hydraulic Conductivity versus Volumetric Moisture Content.
Relative hydraulic conductivity was known to increase with volumetric moisture in the
same manner shown in Figure 2.5. This relationship was due to the changes in matric
suction with moisture. Shown in Equation 10, the moisture-specific suction value was
normalized to the air entry value. Normalized suction is
aev
nψ
ψψ (10)
where aev is the air entry value and is the suction at a corresponding volumetric water
content selected from the SWCC.
R² = 0.95
R² = 0.97
R² = 0.99
R² = 0.96
0.00
0.05
0.10
0.15
0.20
0.25
0.30
0.35
0.40
0.45
0.50
0 5 10 15
Rela
tive H
yd
rau
lic
Con
du
cti
vit
y
Volumetric Moisture Content (%)
Medium Sand
Ohio River Sand
Hardscapes Sand
Trimble County Sand

19
2.3.2 Ultrafine Grout
2.3.2.1 Ultrafine Grout Properties
The ultrafine grout used in this study was Type V Standard Grout. The grout was
manufactured by U.S. Grout, LLC and distributed by Avanti International. By weight, the
ultrafine cement grout contained 55 percent pumice, 45 percent Portland cement, and
0.09 to 0.12 percent modified polymer powder. In the ultrafine cement, 90 percent of the
particles sizes are distributed below 8 microns and the average particle size was 4
microns. The ultrafine cement mixing instructions include a 0.6 water-to-cement ratio by
weight. For this water-to-cement ratio, the initial gel and workability ranges from 2.5 to 5
hours and the set time ranges from 4.5 to 7 hours. This ultrafine cement grout yielded
optimum properties in regard to the penetration ability, cement setting times, groutability,
and workability for the purpose of grouting sands.
2.3.2.2 Neat Grout Testing
In cement suspensions, water has a tendency to segregate from the mix. This tendency is
termed bleed. Often, the bleed is referred to as stability, because the bleed has a direct
effect on the stability of grout. Several factors that affect water segregation are the grout
properties, such as the cement particle specific surface area and the water-to-cement ratio.
Increasing the water-to-cement ratio will increase the amount of bleed from the
suspension. Typically, in construction applications the highest water-to-cement ratio used
is two, due to the increased bleed characteristics and decrease in strength properties
(Henn, 2010). Ultrafine cements have a reduced tendency for water separation than other
cement grouts. The fine grained particles in ultrafine cement react with the water fast and
have lower potential for gravitational settlement. Thus, ultrafine grout mixtures with
significantly higher water-to-cement ratios, than that of grouts with larger particle sizes
(ie. ordinary Portland cement), have been used to grout underground formations and in
academic studies (Zebovitz et al., 1989; Dano et al., 2004; Saada at al., 2006; Schwarz
and Chirumalla, 2007; Kim and Whittle, 2009 Markou and Droudakis, 2013).
A neat grout testing program was implemented to observe bleed and test neat grout
samples in unconfined compression. The samples were formed in split-molds, and
allowed to set for 24 hours. The original testing program observed the bleed for four

20
samples, containing water-to-cement ratios of 1, 2, 3, and 4. For verification of the bleed
characteristics, the testing program was repeated at the same water to cement ratios. As
such, the bleed data corresponding to the water-to-cement ratios was repeated. This can
be seen in Figure 2.6, where there are two data points corresponding to water-to-cement
ratios of 1, 2, 3, and 4, yet the corresponding data points plot at nearly the same point. To
further verify the results of this experiment, Henn (2010) data has also been included in
the relationship. The Henn (2010) contained Nittetsu Superfine grouting mixed at a water
–to-cement ratio of 3 and DeNeef MC=500 grout mixed at water to cement ratio of 4.
Figure 2.6. Effect of Water-to-Cement Ratio on Grout Bleed.
The equation relating percent bleed to variation in water-to-cement ratios is
21 cC
Wcβ
(11)
where is the percent bleed, W/C represent the water-to-cement ratio, c1 = 17.7, and c2 =
-20.4. The constants c1 and c2 are empirical constant based on these experimental results.
Empirical constant c1 was the rate at which the water separates from the mix for different
samples with variable water-to-cement ratio. As the water-to-cement ratio was decreased,
a point was reached where no bleed takes place. This was where the line intercepts the x-
axis. The water-to-cement ratio where no bleed takes place, estimated from Equation 11,
is 1.2. As previously described, a water-to-cement ratio equal to two is commonly used in
applications and in laboratory experiments (Henn, 2010). This is why this ratio is
y = 17.7x - 20.4
R² = 0.95
0
10
20
30
40
50
60
1 1.5 2 2.5 3 3.5 4
Percen
t B
leed
(%
)
Water-to-Cement Ratio
This Study
Henn (2010)

21
commonly used in the field. Figure 2.6 shows data that correspond to a water-cement
ratio of 2 was at approximated 7.5 percent bleed.
Unconfined compression tests were performed on the neat grout samples. The tests were
performed in accordance to ASTM D4320, as were all unconfined tests performed in this
study. Unconfined compressive strength as a function of water-to-cement ratio is shown
in Figure 2.7. In the figure, water-to-cement ratios from 0.5 to 2.5 are shown.
Figure 2.7. Relationship between Unconfined Compressive Strength versus Water-
to-Cement Ratio.
Dano et al. (2004) proposed an equation that related the unconfined compressive strength
of neat grout to water-to-cement ratio as a power function. The equation found in this
study is also a power function. However, a different grout was used and the parameters
found were different. This equation found in this study for the unconfined compressive
strength with variation in water-to-cement ratio for the ultrafine cement grout used is
N
0u(ng)C
WAq
(12)
where qu,(ng) is the unconfined compressive strength of the neat grout, W/C is the water-
to-cement ratio, and A0 and N are empirical constants based on the experimental data. For
the grout used in this study, A0 = 3832.4 and N = 3.5. Henn (2010) data was included in
the relationship, as the data was obtained using the same type of grout used in this study.
In Figure 2.7, a power function was used to describe the relationship for strength with
variations in the water-to-cement ratio of the grout. The empirical constants describe the
y = 3832.4x-3.5
R² = 0.92
10
100
1000
10000
100000
0.5 1 1.5 2 2.5
Com
press
ive S
tren
gth
(k
Pa)
Water-to-Cement Ratio
This Study
Henn (2010)

22
behavior of the grout strength with this variation. Empirical constant A0 simply
represents the compressive strength when the water-to-cement ratio is one. This is
because when you sub a water-to-cement ratio into Equation 12, you get the same value
as parameter A0. Empirical constant N represents the power function rate of decrease in
strength as the water-to-cement ratio decreases.
2.4 Grouting Apparatus
A grouting procedure was developed so that a uniform grout could permeate cylindrical
soil samples. In this procedure, the grout was allowed to set within the sample and to
ensure the sample was undisturbed. The apparatus used in the procedure was constructed
based on specifications in ASTM D4320. Any variances from this ASTM will be noted.
A schematic of the apparatus is given in Figure 2.8.
Figure 2.8. Schematic of Grouting Apparatus.
A DurhamGeo 152.4 millimeter constant/falling head permeameter was used as a
pressure chamber. No stirring mechanism was utilized in the grout tank, as sample
penetration occurred quickly upon pressurization. The grout tank was pressurized at the
top and the grout flowed from the bottom to the influent of the sample. A two-way valve
was attached to the bottom of the tank, so that the liquid ultrafine cement suspension
could be held in the tank as pressure was initiated. This was important, because the
regulated air pressure supply decreased as the influent air pressure was turned on. The
regulated air pressure supply was allowed to increase to the appropriate pressure prior to
23
opening the two-way valve. Upon engagement of the two-way valve, the grout instantly
permeated through the soil.
The apparatus utilized an appropriately sized acrylic tube and acrylic sheet as the grout
column and bases for the column. The bases were threaded to accommodate appropriate
fittings. The bases contained machined, circular grooves so that o-rings could be inserted
into the bases. The bases were machine threaded, in order for the effluent and influent
fittings to be attached. The cylindrical acrylic-mold had a 50.8 millimeter diameter and
201.6 millimeter length. However, the total sample length was 196.8 millimeters, because
the molds fit 3.2 millimeters into the bases.
Wax paper was placed around the sample directly inside the cylindrical acrylic mold. The
sand samples, as placed in the mold, had a length of 127 millimeters. Situated on the top
and bottom of the samples was 34.9 millimeters of gravel, directly above the influent and
below the effluent. This gravel layer was used as filter media so the sand sample did not
clog the influent and so that sand did not travel with the grout through the effluent. A
constant dry unit weight of 15.7 kN/m3 was used for the sand samples throughout this
study. For Ohio River sand, Trimble County sand, and Hardscapes sand, no compaction
was required for dry samples. In the moist samples, ranging from three to nine percent
gravimetric moisture, ten tamps were used per layer for three layers. In the medium sand,
the dry sand was compacted in four layers with ten tamps each, tapping the sides of the
mold ten times per layer. In the moist samples for the medium sand, the samples were
compacted in eight layers with twenty tamp on each layer and twenty taps on the side of
the mold for every other layer. Wire mesh was placed in between the gravel and influent,
the gravel and sand sample, and in between the gravel and effluent.
As the grout exits the sample effluent, the ultrafine grout flows into a graduated cylinder
for discharge measurements. Grouting was continued to 200 milliliters or until refusal.
Refusal occurred when no flow was apparent from into the effluent graduated cylinder.
The cylinder, filled with the uncured grouted sand, was transported and placed between
two rubber mats to ensure no grout leaks occurred. The sample was allowed to set for 24
± 6 hours then was placed in a humidity curing chamber. The samples were extracted by
pushing the samples out using a hydraulic press. The wax paper surrounding the sample,

24
which was previously described, was used to eliminate side friction upon extraction.
Cured grouted samples were capped using a sulfur compound to create a smooth contact
surface between the compression platens. The samples were strength tested seven days
from the date of mixing.
2.5 Hydraulic Characteristics
2.5.1 Groutability Criteria
For a sample to be groutable, the void space of the soil specimen must accept the grout
suspension. Several factors that govern grout penetration behavior are widely accepted in
the grouting community. The percentage of fines has been shown to cause the soil to
refuse grout. It has been widely noted that soils with ten percent or more fines may be
problematic when grouting attempts are made. Problems grouting soils with as low as
five percent fines have also been noted in academic studies (Zebovitz et al, 1989).
Another major factor in groutability is the cement-soil particle size ratio, or the ratio of
the cements largest particles to the soil’s smallest particles. Past studies have shown that
grout penetration in soil is highly dependent on the smaller voids in a soil formation and
the larger particles in the grout material (Johnson, 1958; Scott, 1963; Mitchell, 1970).
One of the more commonly accepted criterion, that takes particle sizes of the cement and
soil into consideration, is the groutability ratio (Axelsson and Gustafson, 2007; Henn,
2010; Mollamahmutoglu and Yilmaz, 2011). The most common criterion has been
suggested by Henn (2010). This equation is
grout85
soil15
)(D
)(DN (13)
where N is the groutability ratio, (D15)soil is the grain size corresponding to 15 percent
finer by weight of the soil, and (D85)grout is the grain size corresponding to 85 percent
finer by weight of the grout. For this criterion, if N is greater than 24, grouting should be
possible. If N is between 11 and 24 grouting may be possible. If N is less than 11,
grouting will not likely be possible. For the material used in this study, the manufacturer
designates 8 microns as the cement grain size corresponding to 90 percent finer by
weight. This grain size value will be used for (D85)grout, since this will provide a

25
conservative estimate of groutability. Figure 2.9 shows the calculated N value for each
soil, and what groutability designation it corresponds to.
Figure 2.9. Groutability Factor versus Grain Size for 15 Percent Passing.
Kentucky River sand has a groutability ratio of 12.3. This groutability ratio indicates
grouting may be possible. The groutability ratio for Kentucky River sand indicates this
soil was much closer to classification “not likely groutable” than classification as “likely
groutable”. While no distinct criteria exists that relates ultrafine cement groutability and
fines, various predictive measures for determination of groutability exist for chemical
grout and fines. These measures have designated soils with less than ten percent sands
groutable, and soils with ten to twenty percent fines moderately groutable (Powers,
2007; Henn, 2010). Using the fines criteria for groutability using chemical grouts,
Kentucky River Sand was moderately groutable. The remaining sands are considered
groutable, similar to the results for groutability ratio. These predictive measures are for
chemical grout, but can be used to predict behavior for cement grouts with caution.
Various criteria based on grain size exist that give indications of groutability, but none
give a decisive indication of groutability.
2.5.2 Grout Injection
2.5.2.1 Test Setup
In order to assure that soils are mechanically improved to satisfy design
recommendations in the field, laboratory tests are commonly carried out to predict the
strength. A major consideration for laboratory testing was that grouting material must be
uniform throughout the sample specimen in question, such as is assumed to be the case in
0
5
10
15
20
25
30
35
40
45
0 0.1 0.2 0.3 0.4
N
D15
Kentucky River Sand
Ohio River Sand
Hardscapes Sand
Medium Sand
Trimble County Sand
Not Likely Groutable
May Be Groutable
Likely Groutable

26
field applications. Typically this has been performed by pumping, or injecting, a grout
through a soil sample. The apparatus and procedure previously described were used to
meet these requirements. During injection of the grout into the soil specimen,
measurements were used to quantify penetration effects in the test soils with the intent
that they may be able to be related to field techniques through the progression of grout
research.
2.5.2.2 Test Results
Grout injection theory has been reviewed in detail by various sources (Bell, 1993; Karol,
2003). Very little research has been performed to develop relationships based on this
theory. In uniform, isotropic soils, grout has typically been injected from a perforated,
pressurized column and permeates laterally (Littlejohn, 1985; Xanthakos et al., 1994).
The initial injection rate, or penetration rate, was the major concern of this study, because
in the field this will have a significant effect on penetration radius. In this study, the
penetration rate was the time it took the grout to permeate through the length sample
from influent to effluent. This time for this permeation is presented as length over time. If
the factors effecting grout penetration in a porous medium can be determined, these same
factors will affect lateral penetration in the field. In this study, the initial moisture content
of the soil samples were varied prior to grouting. Perret et al. (2000) performed a case
study looking at effects of moisture on grout permeation. The penetration in these soils
increased with as moisture in the soil increased. The cause of the increased rates of
penetration with increased moisture was attributed to mixing of grout with the in situ
water and changes in the suction of the soil. Adsorption associated with dry soils causes
penetration rates to be low, as has been seen in previous research (Abraham, 2006).
These trends for grout penetration rates at various volumetric moisture contents are seen
in Figure 2.10. It was noted that some of the soil specific trends intersected, just after dry
conditions. This may be due to the adsorption characteristics of specific soil particles,
where a more adsorbent soil exhibits lower penetration rates. As the moisture was
increased, the soil specific suction controlled behavior.

27
Figure 2.10. Normalized Penetration Rate versus Volumetric Water Content.
As previously described, soil suction varies as the in situ volumetric moisture content is
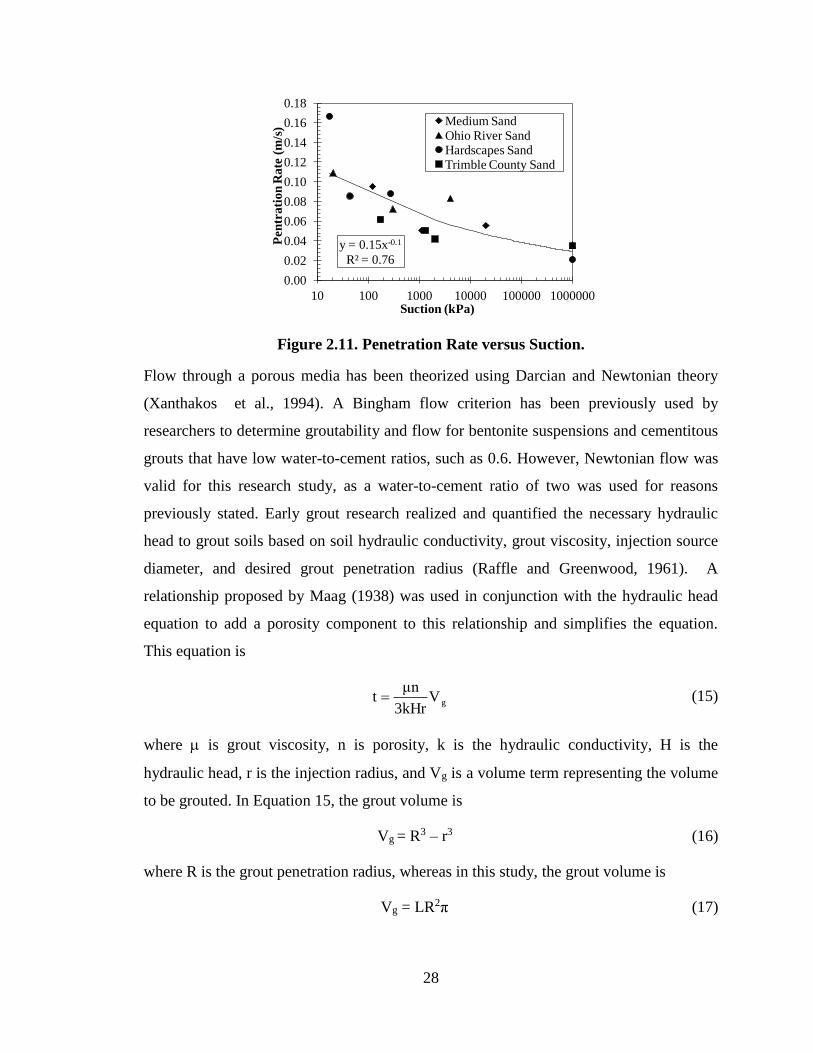
changed. Figure 2.11 shows the relationship between penetration rate and suction in this
study. This relationship yields empirical equations. In this empirical equation, penetration
is
2b
1R ψbP (14)
where is suction and b1 and b2 are empirical constants equal to 0.15 and -0.1. Parameter
a1 corresponds to a suction value of 1, as subbing in 1 for the suction value results in a PR
that is equivalent to b1. Parameter b1, physically, is the rate of change in penetration per
unit suction. Suction is related to the penetration rate because suction takes in situ soil
characteristics, such as unit weight, moisture content, and grain size, as previously
discussed. While suction may be a useful tool in predicting grout penetration, additional
influences from the grouting program, such as injection pressure and the grout viscosity,
should also be considered when developing relationships in regard to grout penetration of
soils.
R² = 0.89
R² = 0.79
R² = 0.66
R² = 0.99
0.00
0.02
0.04
0.06
0.08
0.10
0.12
0.14
0.16
0.0 5.0 10.0 15.0
Pen
trati
on
Rate
(m
/s)
Volumetric Water Content(%)
Hardscapes SandOhio River SandMedium SandTrimble County
28
Figure 2.11. Penetration Rate versus Suction.
Flow through a porous media has been theorized using Darcian and Newtonian theory
(Xanthakos et al., 1994). A Bingham flow criterion has been previously used by
researchers to determine groutability and flow for bentonite suspensions and cementitous
grouts that have low water-to-cement ratios, such as 0.6. However, Newtonian flow was
valid for this research study, as a water-to-cement ratio of two was used for reasons
previously stated. Early grout research realized and quantified the necessary hydraulic
head to grout soils based on soil hydraulic conductivity, grout viscosity, injection source
diameter, and desired grout penetration radius (Raffle and Greenwood, 1961). A
relationship proposed by Maag (1938) was used in conjunction with the hydraulic head
equation to add a porosity component to this relationship and simplifies the equation.
This equation is
gV3kHr
μnt (15)
where is grout viscosity, n is porosity, k is the hydraulic conductivity, H is the
hydraulic head, r is the injection radius, and Vg is a volume term representing the volume
to be grouted. In Equation 15, the grout volume is
Vg = R3 – r3 (16)
where R is the grout penetration radius, whereas in this study, the grout volume is
Vg = LR2π (17)
y = 0.15x-0.1
R² = 0.76
0.00
0.02
0.04
0.06
0.08
0.10
0.12
0.14
0.16
0.18
10 100 1000 10000 100000 1000000
Pen
tra
tio
n R
ate
(m
/s)
Suction (kPa)
Medium SandOhio River SandHardscapes SandTrimble County Sand

29
For the samples in this study, the volume component of the equation was the volume of a
cylinder. As indicated, components of Equation 15 were used to develop a factor used to
quantify a relationship between grout penetration and initial conditions of the soil. The
length and time terms were isolated on one side, and the viscosity and hydraulic
conductivity were normalized. The resulting parameter is
nπRμ
μ
HrkK
2
w
g
rF
(18)
where kr is relative hydraulic conductivity, H is pressure head, r is the injection radius, g
is grout viscosity, w is water viscosity, R is the radius the grout permeates through the
soil, and n is porosity. In this equation, the time, length and viscosity are consistent and
cancel out, causing KF to be unitless. Several of these parameters are held constant in this
study. For example, grout viscosity, g, was equal to 11 centipoise at a water-to-cement
ratio of 2 (Gallagher, 2000), H is 14.1 meters, r is 0.005 meters, R is 0.025 meters, and w
is 1 centipoise. The result of the penetration rate versus the permeability factor is shown
in Figure 2.12. The data in the figure is representative of four soils with four volumetric
water contents, ranging from 0 to 14.4 percent. Relative hydraulic conductivity, used in
Equation 15, was found using the Campbell (1974) equation as previously discussed.
The results for the penetration rate versus the effective permeability factor are shown in
Figure 2.12. The relationship between penetration rate and the permeability factor is
2α
F1R KαP (19)
where PR is the penetration rate, KF is a unitless permeability factor, 1 = 0.06, and

30
Figure 2.12. Soil Penetration Rate versus Permeability Factor.
As previously discussed, the rate of injection was greater in partially saturated sand than
that of dry sand. This is was previously described in Figure 2.10. However, the major
influence on the permeability factor was the unsaturated hydraulic conductivity, which
was calculated directly from suction values obtained from the SWCC. The trend between
penetration rate and the permeability factor existed for several reasons. As the amount of
water in a soil was decreased, the soil particles absorbed more of the grout moisture,
decreasing the amount of penetration as the suspension propagates through the soil
(Perret et al., 2004). Another major factor in this relationship was the suction of the soil,
as shown in Figure 2.11. The increasing suction associated with partially saturated soils
can cause increased flow rates from dry conditions. This can be physically described
from typical unsaturated soil mechanics testing, in a drying curve, where it takes more
pressure to extract water from the pore spaces of the soil as moisture decreases. The
same observation can be seen in grout flow in unsaturated soils, as sands with more
moisture accepted exhibited higher flow rates and drier soils received the grout at lower
rates at the same pressure. Another major factor, related to the suction, was the non-
continuous arrangement of moisture within the pore spaces of the soil skeleton. Whereas
the pore water in saturated soils tend to be replaced by injected grout, the pore water in
non-continuous, unsaturated condition mix with the grout, creating an grout-water mixing
zone with significantly higher unmixed water-to-cement ratio. This was dissimilar from
dry soils, where no water exists, and saturated soils, where a relatively small grout-water
mixing zone exists.
y = 0.06x0.4
R² = 0.74
0.00
0.02
0.04
0.06
0.08
0.10
0.12
0.14
0.16
0.18
0.0 2.0 4.0 6.0 8.0 10.0
Pen
tra
tio
n R
ate
(m
/s)
Suction (kPa)
Medium Sand
Ohio River Sand
Hardscapes Sand
Trimble County
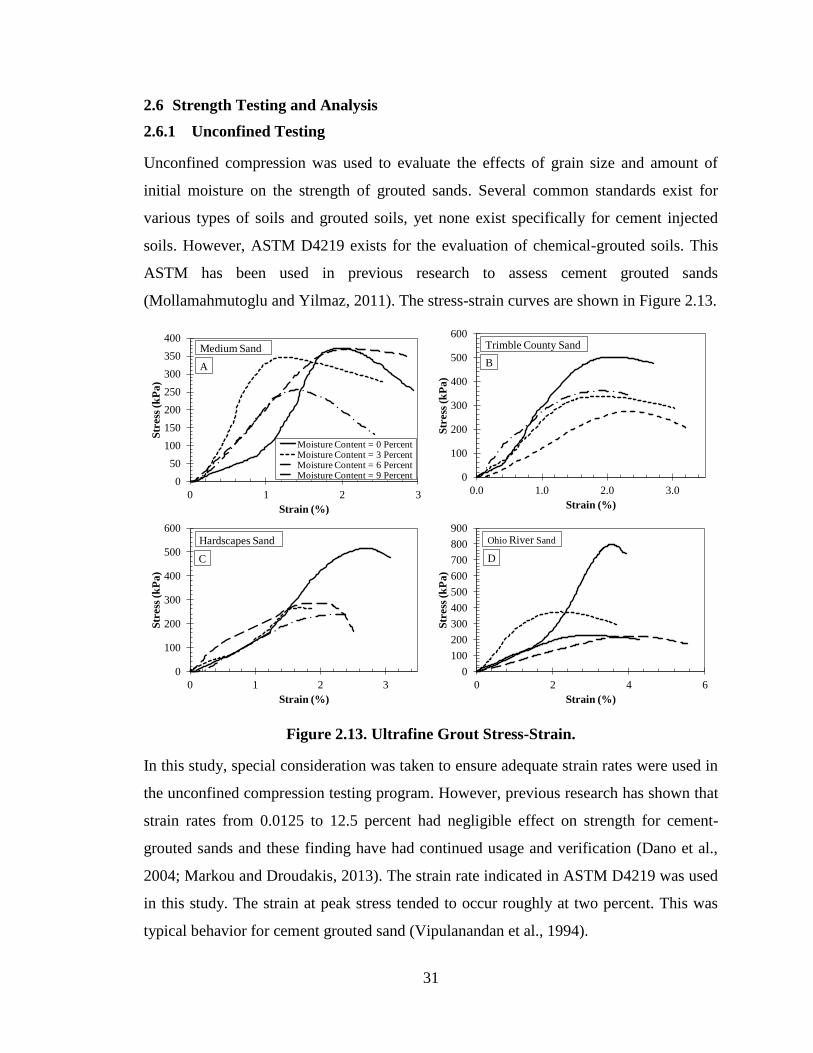
31
2.6 Strength Testing and Analysis
2.6.1 Unconfined Testing
Unconfined compression was used to evaluate the effects of grain size and amount of
initial moisture on the strength of grouted sands. Several common standards exist for
various types of soils and grouted soils, yet none exist specifically for cement injected
soils. However, ASTM D4219 exists for the evaluation of chemical-grouted soils. This
ASTM has been used in previous research to assess cement grouted sands
(Mollamahmutoglu and Yilmaz, 2011). The stress-strain curves are shown in Figure 2.13.
Figure 2.13. Ultrafine Grout Stress-Strain.
In this study, special consideration was taken to ensure adequate strain rates were used in
the unconfined compression testing program. However, previous research has shown that
strain rates from 0.0125 to 12.5 percent had negligible effect on strength for cement-
grouted sands and these finding have had continued usage and verification (Dano et al.,
2004; Markou and Droudakis, 2013). The strain rate indicated in ASTM D4219 was used
in this study. The strain at peak stress tended to occur roughly at two percent. This was
typical behavior for cement grouted sand (Vipulanandan et al., 1994).
0
50
100
150
200
250
300
350
400
0 1 2 3
Str
ess
(k
Pa)
Strain (%)
Moisture Content = 0 PercentMoisture Content = 3 PercentMoisture Content = 6 PercentMoisture Content = 9 Percent
Medium Sand
A
0
100
200
300
400
500
600
0.0 1.0 2.0 3.0
Str
ess
(k
Pa)
Strain (%)
Trimble County Sand
B
0
100
200
300
400
500
600
0 1 2 3
Str
ess
(k
Pa)
Strain (%)
Hardscapes Sand
C
0
100
200
300
400
500
600
700
800
900
0 2 4 6
Str
ess
(k
Pa)
Strain (%)
Ohio River Sand
D
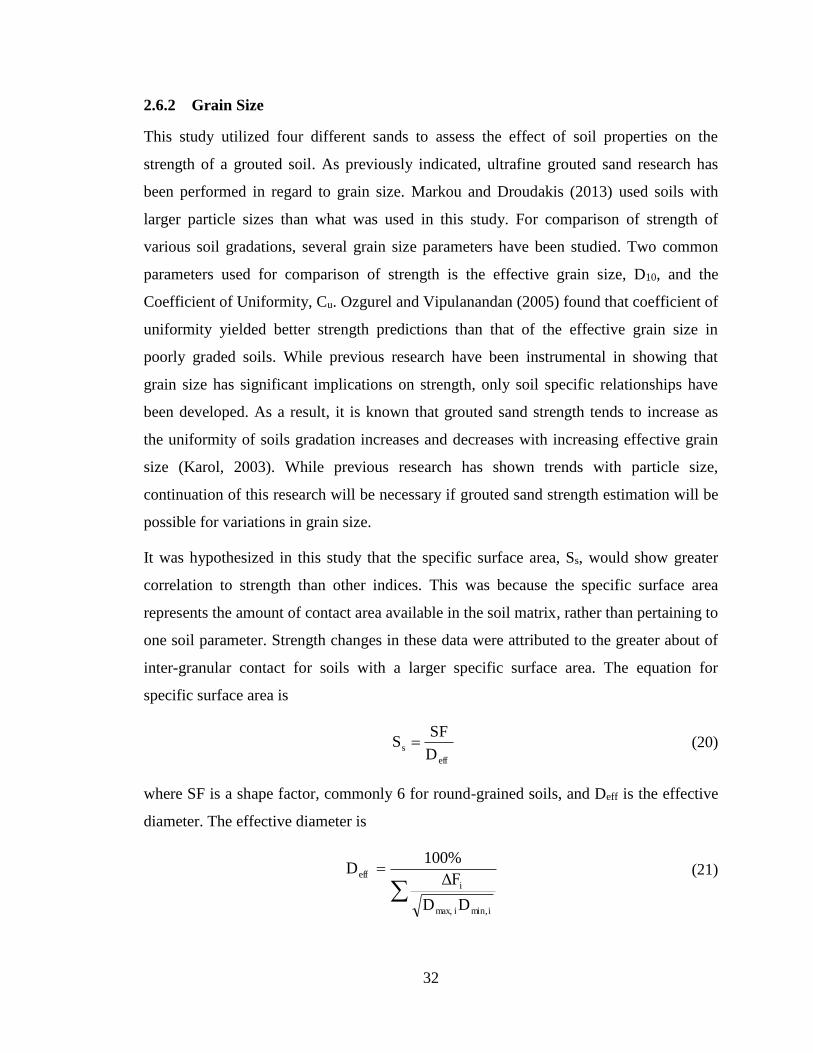
32
2.6.2 Grain Size
This study utilized four different sands to assess the effect of soil properties on the
strength of a grouted soil. As previously indicated, ultrafine grouted sand research has
been performed in regard to grain size. Markou and Droudakis (2013) used soils with
larger particle sizes than what was used in this study. For comparison of strength of
various soil gradations, several grain size parameters have been studied. Two common
parameters used for comparison of strength is the effective grain size, D10, and the
Coefficient of Uniformity, Cu. Ozgurel and Vipulanandan (2005) found that coefficient of
uniformity yielded better strength predictions than that of the effective grain size in
poorly graded soils. While previous research have been instrumental in showing that
grain size has significant implications on strength, only soil specific relationships have
been developed. As a result, it is known that grouted sand strength tends to increase as
the uniformity of soils gradation increases and decreases with increasing effective grain
size (Karol, 2003). While previous research has shown trends with particle size,
continuation of this research will be necessary if grouted sand strength estimation will be
possible for variations in grain size.
It was hypothesized in this study that the specific surface area, Ss, would show greater
correlation to strength than other indices. This was because the specific surface area
represents the amount of contact area available in the soil matrix, rather than pertaining to
one soil parameter. Strength changes in these data were attributed to the greater about of
inter-granular contact for soils with a larger specific surface area. The equation for
specific surface area is
eff
sD
SFS (20)
where SF is a shape factor, commonly 6 for round-grained soils, and Deff is the effective
diameter. The effective diameter is
imin,imax,
i
eff
DD
ΔF
100%D (21)
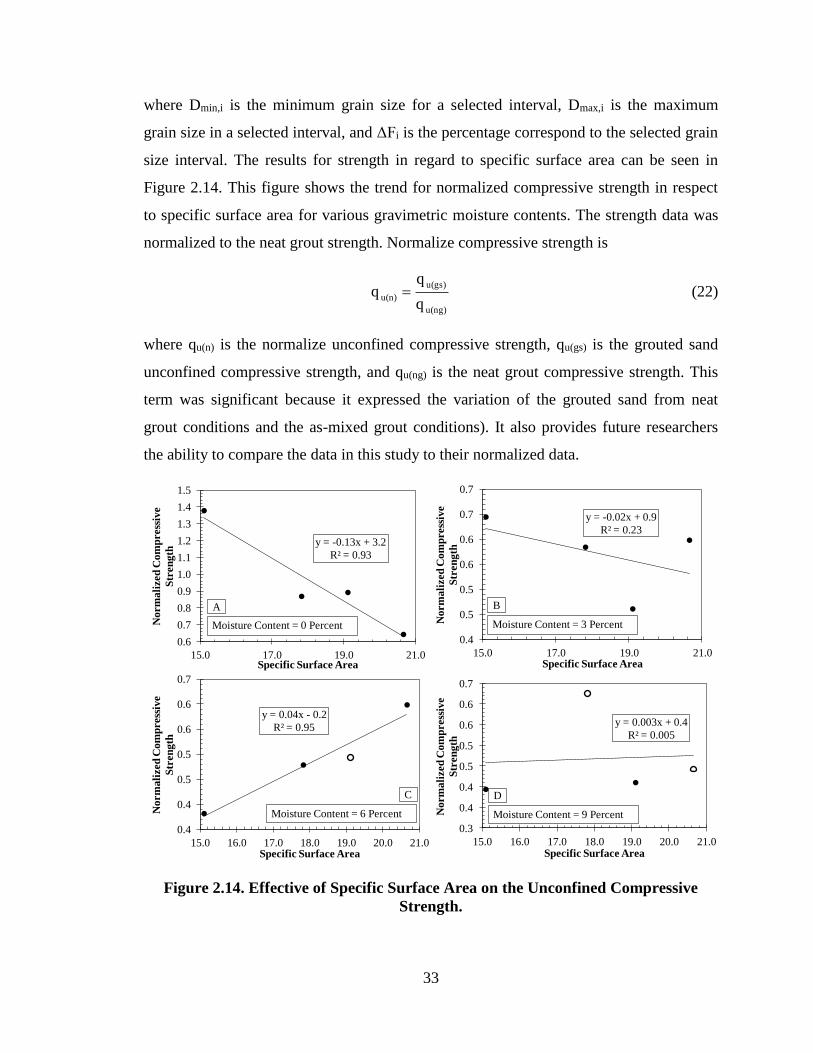
33
where Dmin,i is the minimum grain size for a selected interval, Dmax,i is the maximum
grain size in a selected interval, and ΔFi is the percentage correspond to the selected grain
size interval. The results for strength in regard to specific surface area can be seen in
Figure 2.14. This figure shows the trend for normalized compressive strength in respect
to specific surface area for various gravimetric moisture contents. The strength data was
normalized to the neat grout strength. Normalize compressive strength is
u(ng)
u(gs)
u(n)q
qq (22)
where qu(n) is the normalize unconfined compressive strength, qu(gs) is the grouted sand
unconfined compressive strength, and qu(ng) is the neat grout compressive strength. This
term was significant because it expressed the variation of the grouted sand from neat
grout conditions and the as-mixed grout conditions). It also provides future researchers
the ability to compare the data in this study to their normalized data.
Figure 2.14. Effective of Specific Surface Area on the Unconfined Compressive
Strength.
y = -0.13x + 3.2
R² = 0.93
0.6
0.7
0.8
0.9
1.0
1.1
1.2
1.3
1.4
1.5
15.0 17.0 19.0 21.0
No
rm
ali
zed
Co
mp
ress
ive
Str
en
gth
Specific Surface Area
Moisture Content = 0 Percent
A
y = 0.003x + 0.4
R² = 0.005
0.3
0.4
0.4
0.5
0.5
0.6
0.6
0.7
15.0 16.0 17.0 18.0 19.0 20.0 21.0
No
rm
ali
zed
Co
mp
ress
ive
Str
en
gth
Specific Surface Area
Moisture Content = 9 Percent
D
y = -0.02x + 0.9
R² = 0.23
0.4
0.5
0.5
0.6
0.6
0.7
0.7
15.0 17.0 19.0 21.0
No
rm
ali
zed
Co
mp
ress
ive
Str
en
gth
Specific Surface Area
Moisture Content = 3 Percent
B
y = 0.04x - 0.2
R² = 0.95
0.4
0.4
0.5
0.5
0.6
0.6
0.7
15.0 16.0 17.0 18.0 19.0 20.0 21.0
No
rm
ali
zed
Co
mp
ress
ive
Str
en
gth
Specific Surface Area
Moisture Content = 6 Percent
C

34
Figure 2.14 has interesting features that are due to several factors. For the zero and three
percent moisture content samples, the strength tends to decrease with specific surface
area. This was due to the inverse relationship between specific surface area and particle
volume (Jury and Horton, 2004). The adsorption in the higher volume, lower specific
surface area, samples cause increases in strength (Perret et al., 2004). The particles
adsorb water from the cement mix, decreasing the water-to-cement ratio, and increasing
strength. The nine percent data did not correlate. This was because the unconfined testing
did not satisfy ASTM standards, as they failed at two minutes or less. One sample in the
six percent moisture content data also failed this criterion. Adsorption behavior appears
not to exist in the six percent moisture content samples, which increase with specific
surface area. This strength increase was attributed to the inter-granular forces are
increased with more particle interaction with greater particle surface areas. The high data
correlation affirms that specific grain size may be a useful tool in the understanding of
the effects of grain size on grouted sand strength. These data for samples with zero, six,
and nine percent moisture were not included because the data did not exhibit known
behavior. The shown trend provides evidence that additional research may provide a
relationship between specific grain size and strength.
2.6.3 Volumetric Moisture Content
Typically, grout research has been performed on saturated soils to model behavior below
the ground water table. Due to the high interest of strength behavior below the ground
water table, the majority of previous research and known behavior has been developed
for saturated in situ conditions (Karol, 2003). However, it has been shown that soils
exhibiting moisture contents short of saturation behave much differently than saturated
soils. In saturated conditions, the soil displaces the initial water in the pore spaces of a
soil (Xanthako et al., 1994). In unsaturated conditions, initial water does not get replaced.
Instead, it mixes the grout mix and dilutes the grout that settles in the soil pore space.
These effects could be detrimental, as grouts become unstable with dilution.

35
Figure 2.15. Compressive Strength versus Volumetric Moisture Content.
The effects of water on the stability and strength of grout mixes have been previously
discussed in this study. In this study, the effect of initial moisture on the resulting
strength of grouted sand was investigated. Trends can be seen between volumetric water
content and strength in Figure 2.15. Simply analyzing the behavior of the grout based on
moisture does not yield relationships that encompass each soil; ergo, investigations into
other measures involving the initial soil and grout should provide relationships that
encompass multiple soil types and volumetric considerations.
One measure used to evaluate the strength of grouted sands was the volumetric grout
ratio, ΔV/Vi. This was the ratio of the grout mix injected into the sample to the
components of the grouted sand initially in the sample. Similar volume relationships have
been developed for soils that have solidified by means of freezing. This was a ratio of
changes volumetric conditions to initial volumetric conditions. Since we know water and
soil solids are incompressible, we can assume the two percent strain change occurs in the
grout volume. This parameter may also provide insight as it compares the compressible
grout component to the incompressible initial components. This parameter is defined as
y = -0.02x + 0.8
R² = 0.43
0.40
0.45
0.50
0.55
0.60
0.65
0.70
0.75
0.80
0.85
0.90
0 5 10 15
No
rm
ali
zed
Co
mp
ress
ive
Str
en
gth
Volumetric Moisture Content (%)
Trimble County Sand
A
y = -0.01x + 0.7
R² = 0.58
0.00
0.10
0.20
0.30
0.40
0.50
0.60
0.70
0 5 10 15
Norm
ali
zed
Com
press
ive
Str
en
gth
Volumetric Moisture Content (%)
Medium Sand
B
y = -0.07x + 1.2
R² = 0.79
0.00
0.20
0.40
0.60
0.80
1.00
1.20
1.40
1.60
0 5 10 15
No
rm
ali
zed
Co
mp
ress
ive
Str
en
gth
Volumetric Moisture Content (%)
Ohio River Sand
C
y = -0.03x + 0.8
R² = 0.68
0.00
0.10
0.20
0.30
0.40
0.50
0.60
0.70
0.80
0.90
1.00
0 5 10 15
Norm
ali
zed
Com
press
ive
Str
en
gth
Volumetric Moisture Content, θ (%)
Hardscapes Sand
D

36
ws
g
i VV
V
V
ΔV
(23)
where Vg is the volume of the grout, Vs is the volume of the soil solids, and Vw is the
volume of the initial water in the sample. The results of the plot of volumetric moisture
content can be found in Figure 2.16. The figure shows a trend as the volume of the grout
in the sample increases. D4219 suggests that samples should fail above two minutes.
Three samples in this study failed at or below two minutes. These samples have been
presented, but have not been included in the relationship. While the data seems to trend
with the volumetric grout content, the resulting correlation coefficient was insufficient to
suggest a relationship exists. This was likely because the parameters fail to take the
different particle sizes into effect. An initial parameter influenced by the moisture, unit
weight, and grain size may yield a relationship for the grouted sand strength.
Figure 2.16. Compressive Strength versus Volumetric Grout Ratio.
2.6.4 Unsaturated Soil Mechanics
As previously described, the soil-water characteristics curve relates soil moisture and
matric suction. The distinction of the values obtained from the curve was that they are
soil-state specific. This becomes a useful parameter for this study, because the grain size
parameters vary between the different soils. Soil strength has commonly been
investigated directly in comparison to matric suction (Fredlund and Xing, 1994). The
reason for this correlation was expected, because the matric suction values obtained from
the SWCC are soil-specific and dependent upon the initial moisture in the sample. The
R² = 0.61
0.3
0.5
0.7
0.9
1.1
1.3
1.5
0.3 0.4 0.5 0.6 0.7
No
rm
ali
zed
Co
mp
ress
ive
Str
en
gth
Volumetric Grout Ratio
Data Points Excluded
Medium Sand
Ohio River Sand
Hardscapes Sand
Trimble County Sand

37
correlation between moisture content and matric suction can be seen in Figure 2.17.
Matric suction was normalized to the air entry values specific to each SWCC curve. The
same samples have been excluded in Figure 2.17 as were excluded in Figure 2.16. The
relationship between normalized unconfined compressive strength and normalized
suction is
2n
n1u(n) )(ψnq (24)
where n is the normalized soil suction. The equation for normalized soil suction is
aev
nψ
ψψ (25)
where is the matric suction corresponding to the in situ volumetric moisture content
and aev was the matric suction air entry value. For the power function constants, n1 = 0.9
and n2 = 0.08. Equation 24 is valid for the initial soil conditions, grout mix, and
procedures used in this study. It should be noted, that this was the initial matric suction of
the in situ soil, used to predict strength of the resulting grouted sand. This was not the
matric suction of the grouted sand sample itself. Additional research will be necessary to
continue developing these relationships.
Figure 2.17. Compressive Strength versus Suction.
The power function empirical parameters have significant relevance in this study.
Constant, n1, signifies the normalized compressive strength of the sample when the
normalized suction was equivalent to one. The exponential constant of the power
y = 0.3x0.08
R² = 0.74
0.3
0.4
0.5
0.6
0.7
0.8
0.9
10 100 1000 10000 100000100000010000000
No
rm
ali
zed
Co
mp
ress
ive
Str
en
gth
Normalized Suction
Data ExcludedMedium SandOhio River SandHardscapes SandTrimble County Sand

38
function was positive but below zero. Since this was positive, the strength continually
increased with increasing suction. However, since the exponent was below one, the
increase of one normalized suction results in a decrease in the rate of increase by a factor
of 0.08. This means the strength values will be close to that of dry suction conditions as
the initial soil suction approaches that of dry conditions. This was dissimilar to low
suction conditions, where small changes in initial suction will significantly affect
strength.
2.7 Conclusion
The influence of initial conditions on grouted sand properties, such as moisture content
and variation in grain size, were evaluated. The grouted sand properties were investigated
how these aspects influences grout penetration into the soil and the resulting grouted sand
strength. Also, influent of water-to-cement ratios were investigated in respect to neat
grout specimens. The conclusion drawn from this study are as follows:
Unsaturated hydraulic conductivity increases (ie. from 8.9×10⁻⁴ cm/s to 2.0×10⁻²)
with changes in graviemtric moisture from zero to nine percent. Matric suction
was used to estimate the unsaturated moisture content.
Increases in water-to-cement ratio have a significant effect on bleed. Increasing
the water-to-cement ratio from one to four increased bleed from zero percent to
50 percent, causing the grout to be unstable. Similar changes in the water-to-
cement ratio decreased the unconfined compressive strength by a factor of ten.
As discussed, previous studies have shown that soils with five percent fines can
be ungroutable. In this study, fine sand with eleven percent fines was investigated.
This particular sand was not groutable. By all groutability criteria, this sand was
considered moderately groutable. These results affirm assertions of previous
studies that sand considered moderately groutable may not be groutable.
Grout penetration rates through the sample increased, by as much as a factor of
eight, as volumetric moisture increased from dry conditions to nine percent
moisture. The observed grout penetration increase was directly related to
unsaturated hydraulic conductivity. Relationships regarding injection and soil
properties can be used in conjunction with hydraulic conductivity to develop
relationships in initial penetration rates.

39
Grouted sand strength decreased as moisture increased. A 50 percent decrease in
strength was observed with an increase of nine percent gravimetric moisture. This
was likely due to mixing of pore water and the grout suspension.
With greater proportions of grout to initial soil and water, strength increases were
seen. As the initial suction increased from about 50 to 1,000,000 kPa, the grouted
sand strength increased by 150 percent. The soil-water characteristic curves are
dependent upon the unit weight and soil-specific particle sizes. The specific soil
suctions were selected from the appropriate initial moisture of the soil. This
allows for grouted sand strength relationships based on soil matric suction.

40
CHAPTER 3
3 Mechanical Behavior of Acrylate-Grouted Sands
3.1 Introduction
3.1.1 Grouting Introduction
Chemical grouts have shown effectiveness for geotechnical engineering solutions where
seepage control is needed. In particular, chemical grouts are beneficial for stopping water
infiltration into underground structures, such as tunnels and mines. In cured form
chemical grouts, due to the low permeability, have also been beneficial in providing
sustainable solutions for earthen impoundments in need of mitigation due to high seepage
rates. Several studies have been implemented to investigate factors contributing to the
modification of soils using chemical grouts. These studied have shown the general
efficacy of chemically modified soils, investigated properties of the grout in question, and
the effects of initial conditions of the soil in the resulting grouted soil (Vipulanandan and
Krizek; 1986; Persoff et al., 1999; Karol, 2003; Ozgurel and Vipulanandan, 2005). As
various chemical grouts continue to be used for field applications, investigation
concerning the impacts of in situ conditions on penetration of the grout into the soil and
the resulting grouted soil strength will be beneficial, if not necessary, for improved
grouting techniques and design.
In grouting applications, chemical grouts are implemented where cement-based grouts
have demonstrated ineffective results, such as failing to reach target seepage reductions.
Situations involving seepage reduction measures, where features such as fine cracks in
underground concrete structures, earthen impoundments, such as dams, with fine or silty-
sands, and situations requiring extraordinarily low permeability seepage barriers, may
likely require chemical grouting. In many projects, the need for chemical grouting may
not be realized until target seepage reduction with cementitous grouts has been
insufficient. Commonly, the least expensive, higher permeability grout material will be
applied first. If target seepage reduction has not been achieved, then more expensive,
lower permeability grout material is used (Babcock, 2013b). However, for underground
structures and grouting of soils in earthen impoundments, a general understanding of the
applicability of various grouts to crack sizes or soil grain sizes has begun to surface

41
(Karol, 2003; Powers et al., 2007; Henn, 2010). General criteria exists which determines
applicability of grout to specific soil hydraulic conductivities. It will continue to be
important that the variety of grout properties, along with the effects of initial conditions
on grouted soils, is understood so that an appropriate grouting effectiveness measures,
such as initial soil conditions and injections methods, can be understood and quantified.
3.1.2 Chemical Grout Properties
Commercially available grouts may be composed of a variety of materials that influence
the grout properties. The base chemical responsible for the material reaction can vary.
Examples of some of the base chemicals are sodium silicate, colloidal silica, urethane,
acrylic, acrylamide, and acrylate. These grouts typically have an accompanying chemical
that initiates a chemical reaction. This chemical reaction, when only including these two
components, hardens to form a gel. Chemical grouts generally have controllable gel times
and very low viscosities, which allows adequate permeation into soil for earthen
improvement techniques. In field applications, the major use of these grouts has been to
serve as an impermeable seepage control barrier. A secondary benefit is increased
stability by increasing strength. It is beneficial to be able to estimate a reasonable rate of
grout penetration, extent of penetration, and time of gel when permeation will no longer
be possible. The accuracy of such estimation contributes to the determination of whether
permeability and strength requirements are achieved. Acrylamide-based solutions have
been considered the most successful and effective of chemical grouts; however, these
grouts are toxic (Zebovitz et al., 1998). In past decades, acrylamide was removed from
the market due to toxicity issues, but has since been reinstated due to increased safety
technology and understanding proper handling of the product (Krizek et al., 1992;
Ozgurel and Vipulanandan, 2005). Acrylate-based grout products offer a non-toxic
alternative to acrylamide, and may be the grout of choice where environmental
considerations are critical.
Acrylate grout has a viscosity similar to water and has controllable gel times (ranging
from several seconds to twelve hours). In cured form, acrylate grout has a low
permeability and adds strength to soil. This type of grout consists of three chemical
components combined into two mixing tanks. The first tank, Tank A, contains the

42
monomer and activator. A monomer is a chemical capable of a chemical reaction, or
polymerization. The activator aids in the propagation of the reaction and assists the
initiator to form a more quality gel, but does not initiate a reaction. The second tank,
Tank B, consists of an initiator. The initiator is responsible for the start of the reaction, by
decomposing into free radicals when coming in contact with the monomer. The initiator
has often been referred to as a catalyst. For a reaction to take place, the monomer and
catalyst must be combined. A typical mix design for the monomer, initiator, and catalyst
can be found in Table 3.1. Polymerization is the reaction necessary for the hardening of
the grout solutions to occur. Acrylate grout is non-toxic, not reversible, and non-
degradable in cured form. The grout has the appropriate properties for use as a chemical
grout and acrylate grout’s efficacy has been shown in various applications.
Table 3.1. General Mix Design for a Chemical Grout.
TANK A TANK B
Add 37.8 Liters of Water Add 37.8 Liters of Water
Add Drum (51.1 L) of Monomer 4.54 kilograms of Catalyst
Add 3.8 Liters of Initiator Bring to 113.5 Liters with Water
Add 20.8 Liters of Water
3.1.3 Chemical Grout Studies and Applications
Several case histories and studies investigated acrylate specifically. A study by Han
(2004) looked at gel time characteristics of the grout only. This researcher did not
investigate any properties of the grout, other than gel times and chemical properties.
Krizek et al. (1980) tested various engineering properties of acrylate grouted sand, but
did not look at variation in initial conditions of those properties. These studies have
demonstrated a need for increased investigation into acrylate grout.
Several case histories have shown successful uses of acrylate-based grouts as acceptable
grouting materials for earthen embankments. One of which was a fly ash pond, where a
mixture of cement grout and acrylate grout was used to provide seepage control and
increase shear strength for the impoundment (Bruce, 1992). Acrylate grout has been
utilized to stop seepage in a mining application (ECO, 2014). Also, several texts cite the
applicability of acrylate and its acceptance for use as a grouting material (Karol, 2003;
Warner, 2004; Powers et al., 2007). As chemical grouts continue to be used for

43
stabilization, the properties of such grouts should continue to be investigated. For
grouting applications that involve earthen impoundments, initial conditions of the soils to
become grouted should be extensively examined.
3.2 Testing Materials
3.2.1 Test Sands
3.2.1.1 Index Properties
In this study, several natural and mechanically manufactured sands have been selected.
These sands were selected to investigate how various grain size indices affect penetration
of the grout into the pore spaces of soil. Various sand types were also selected to
investigate strength of grouted sand, after the grout had cured in the pore spaces. These
sands were not mechanically modified in the experimentation; however, several of the
sands may have been modified prior to obtainment in this study. The specific gravity
values, presented in Table 3.2, are typical values for other sands used in chemical grout
studies (Delfosse-Ribay et al., 2006). Specific gravity values were obtained in accordance
to ASTM D854. The grain-size distribution for the sands selected for use in this study is
shown in Figure 3.1.
Figure 3.1. Grain Size Distribution.
The five sands investigated in this study were comprised of both natural and
mechanically altered sands. Kentucky River sand, Ohio River sand, and Trimble County
sand, were obtained from sand mining companies who distribute the sand. These sands
are naturally occurring river sands. Two sands, Hardscapes sand and medium sand were
manufactured sands. Hardscapes sand was commercially available. Medium sand was
0
10
20
30
40
50
60
70
80
90
100
0.0100.1001.00010.000
Percen
t P
ass
ing (
%)
Particle Diameter (mm)
Hardscapes Sand
Ohio River Sand
Trimble County Sand
Medium Sand
Kentucky River Sand

44
natural sand that was mechanically altered. Relevant properties of these sands can be
found in Table 3.2.
Table 3.2. Sand Data.
Sand Name
Specific Gravity,
Gs
% Pass #10
Seive
% Pass #10
Seive
% Pass #60
Seive Fines (%)
Coefficient of Uniformity,
Cu
Kentucky River Sand 2.69 0.15 100.0 88.7 11.0 2.5
Ohio River Sand 2.66 0.6 86.85 9.25 4.3 2.0
Hardscapes Sand 2.65 0.41 99.84 15.86 1.0 2.2
Medium Sand 2.66 0.36 99.8 18.2 3.9 2.2
Trimble County Sand 2.66 0.42 95.96 15.22 3.0 2.3
3.2.1.2 Hydraulic Properties
Saturated hydraulic conductivity testing was performed in respect to ASTM D4234. The
hydraulic conductivity values obtained in this study was of similar to that of sands in
other studies (Anagnostopoulos and Hadjispyrou, 2004; Ozgurel and Vipulanandan,
2005; Bolisetti et al., 2009). The samples in this study had a constant target dry unit
weight of 15.7 kN/m3. The saturated hydraulic conductivities of the soils investigated in
the study are shown in Table 3.3.
Table 3.3. Hydraulic Conductivity.
Sand Name Saturated Hydraulic
Conductivity, ks (cm/s)
Kentucky River Sand 2.5E-04
Ohio River Sand 4.4E-02
Hardscapes Sand 3.5E-02
Medium Sand 2.6E-02
Trimble County Sand 3.8E-02
Due to variability of in situ moisture content in field applications, unsaturated soil
mechanics was investigated. A fundamental principle of unsaturated soils is that the soils
exhibit suction due to partial saturation. Unsaturated soil mechanics may provide insight
into penetration rates, during the grout injection phase of the experiment, in soils that
vary from saturated conditions. The phenomena of changes in soil hydraulic properties
with changes in moisture moisture have previously been analyzed and the theory has

45
been presented. Unsaturated soils are also expected to influence grout penetrability and
strength of the grouted soil.
3.2.1.3 Soil-Water Characteristics Curves
The soil-water characteristic curve (SWCC) found in this study is shown in Figure 3.2.
The SWCC was used to investigate the initial soil moisture for this study. Unsaturated
soil mechanics may be a beneficial consideration where grouting takes place in
unsaturated soils that are encountered above the water table. The SWCC in the figure
were obtained using a parameter optimization method, proposed by Fredlund and Xing
(1994).
The value typical for quantifying moisture to formulate equations used for SWCC
analysis is the volumetric water content. The volumetric water content can be easily be
obtained using degree of saturation, S, and porosity, n; two common parameters used in
engineering practice. The equation for volumetric moisture content is
n
Sθ (18)
for the volumetric water content. For the optimization procedure, proposed by Fredlund
and Xing (1994), is
mn
s
a
ψeln
θψCθ (19)
where θ is volumetric water content, θs is volumetric water content at saturation, and e is
2.718. There are also several variables obtained from the methods. These are fitting
parameters a, n, and m. These can be found in Table 3.4
A second equation is needed for correction of Equation 19. This function is
r
r
ψ
ψ1ln
ψ
ψ1ln
1ψCd
(20)

46
where is matric suction, r is the residual matric suction, and d is dry matric suction.
The dry suction, d, was a constant, and is 1,000,000 kPa. The last step in the procedure
was using Microsoft equation solver to solve the solution. These solutions are non-unique
and are material dependent.
Figure 3.2. Fredlund and Xing (1994) Optimized Fit for Test Sand.
It is known that finer soils have lower hydraulic conductivities. This can be observed in
the Kentucky River sand, which had the finest grain sizes and also the lowest hydraulic
conductivity. This is attributed to smaller pore spaces for water to travel through in finer
soils. In particular, Zapata (1999) showed that the Fredlund and Xing (1994) a-parameter
correlated with D60. In this study, the data also correlated with “a”. A relationship
between “a” and D50 can be found in Figure 3.3. Mean grain size, D50, was used because
it is a more commonly used parameter. The linear relationship proposed in the figure is
2501 kDka (21)
where D50 is the median grain size. Parameters k1 and k2 are equal to -6.8 and 5.1. The
residual suction, r, was held constant at 100 kPa for coarse grain graded soils, as
suggest by the Fredlund (1999) for initial conditions. Fitting parameters “a”, “n”, and
“m” were bound between 1 to 15150, 1 to 20, and 0.5 to 4, as recommended by Fredlund
and Xing (1994). The data for the SWCC curves can be found in Table 3.4.
0
20
40
60
80
100
120
0.1 1 10 100 1000 10000 1000001000000
Deg
ree o
f S
atu
ra
tio
n (
%)
Suction (kPa)
Medium Sand
Ohio River Sand
Trimble County Sand
Hardscapes Sand
Medium Sand Data
Ohio River Sand Data
Trimble County Sand Data
Hardscapes Sand Data

47
Table 3.4. SWCC Data.
Sand Name Saturated
Volumetric Water Content, θ (%)
Air Entry
Value, aev
(kPa)
Fitting
Parameter,
a
Fitting
Parameter,
n
Fitting
Parameter,
m
Medium Sand 39.8 0.7 1.0 1.2 0.5
Ohio River Sand 39.8 1.4 2.1 3.2 0.5
Trimble County Sand 39.8 1.4 2.6 1.4 0.5
Hardscapes Sand 39.5 13 2.6 1.0 1.3
Figure 3.3. Fitting Parameter “a” versus D50.
3.2.1.4 Hydraulic Conductivity of Unsaturated Soils
In geotechnical engineering, saturated hydraulic conductivity have been used for seepage
considerations. However, hydraulic conductivity is also dependent on the soil moisture
state (Fredlund et al., 2012). In order to estimate a quantification of the change in
hydraulic conductivity due to moisture, a unitless parameter called relative hydraulic
conductivity has often been used. Relative hydraulic conductivity is defined as
s
wr
k
kk (22)
where kw is the unsaturated hydraulic conductivity and ks is the saturated hydraulic
conductivity. Figure 3.4 shows relative hydraulic conductivity versus degree of
saturation.
Fredlund (2006) presented numerous methods for estimating hydraulic conductivity. One
in particular was selected for used in this study, is the Campbell (1974) relationship,
which is a power function defined as
y = -6.8x + 5.1
R² = 0.90
1.0
1.2
1.4
1.6
1.8
2.0
2.2
2.4
2.6
2.8
0.3 0.4 0.5 0.6
a
D50
Fitting Parameter, a

48
4/b
nr )(ψk (23)
where kr is relative hydraulic conductivity, b is a constant, and n is normalized suction.
In Equation 23, b = ln(0). This equation is reasonable for engineering practice
(Fredlund, 2006). Suction at dry conditions,0, is 1000000 kPa. Normalized suction is a
unitless parameter defined as
aev
nψ
ψψ (24)
where aev is the air entry value and is the suction at a corresponding volumetric water
content selected from the SWCC. The air entry values, along with other relevant
parameters and values, can be found in Table 3.4.
Figure 3.4. Relative Hydraulic Conductivity versus Volumetric Moisture Content.
3.2.2 Acrylate Grout
3.2.2.1 Grout Properties
In a polymer reaction, two chemicals combine initiating a free radical polymerization
reaction, causing a series of long molecular chains to bond together continuously,
resulting in a polymer gel. The stages in this exothermic reaction are initiation,
propagation, and termination (Han, 2004). Initiation was the point where the first free
radical attaches to the first monomer particle. The chain reaction continues as free
radicals continue to combine with the monomer. This is called propagation. As
propagation continues the reaction comes to the point where the free radicals terminate
R² = 0.95
R² = 0.97
R² = 0.99
R² = 0.96
0.00
0.05
0.10
0.15
0.20
0.25
0.30
0.35
0.40
0.45
0.50
0 10 20 30 40
Rela
tive H
yd
rau
lic
Con
du
cti
vit
y
Degree of Saturation (%)
Medium Sand
Ohio River Sand
Hardscapes Sand
Trimble County Sand

49
and the molecular monomer chain reaction stops. This is called termination. The process
is an exothermic reaction, meaning heat was a byproduct of the reaction. By definition of
the reaction stages, the propagation phase will be accompanied by temperature increase.
Upon termination, the temperature will begin to decrease because free radicals are no
longer creating reactions with the monomer molecules. Figure 3.5 shows a typical
temperature-time reaction curve for polymer grouts, with the polymerization stages
labeled.
Figure 3.5. Typical Temperature-Time Reaction for Polymerization Reactions.
3.2.2.2 Mix Design
The acrylate grout used in this study, provided by Avanti International, has two primary
components: a monomer and a catalyst. The trade name of the base chemical for this
study is AV-160 Supergel, which a magnesium acrylate based grout. The viscosity of the
grout can be as low as 1-2 centipoise, compared to 1 centipoise for water. The low
viscosity makes this grout ideal for pressurization and injection into fine pore spaces.
Acrylate grout has an orange tint in uncured form. In cured form the permeability can be
at low as 10-8 cm/s and exhibits strengths of 827 kPa in sand (Avanti International,
2014A). A component premixed with AV-160, prior to mixing with the catalyst, was the
AV-101 Catalyst T+, an activator. This clear liquid was pre-mixed with the catalyst, with
water, in equal proportions to the catalyst in Tank A. The catalyst used in this study was
AV-103 Catalyst SP, which was the initiator in the reaction. The catalyst was composed
of sodium persulfate. Acrylate can be catalyzed by ammonium persulfate or sodium
persulfate. Sodium persulfate was chosen for this study because it has less oxidation
Tem
peratu
re
Time
Initiation (Start of Propagation)
Termination (End of Propagation)
Propagation

50
potential than ammonium persulfate, and the lowest hazard products were chosen for this
study. AV-103 was mixed in another tank, Tank B. As previously stated, the activator,
AV-101, and the initiator, AV-103, must be mixed in equal proportions. The typical
concentration range for the activator and inhibitor, each, is one to three percent. When
percentages are referred to in solutions, this pertains to a measurement of the part of the
chemical component to 100 parts of the total solution. For example, this can be measured
and reported as the mass in grams granular, chemical component to 100 milliliters of the
total solution. A two percent catalyst solution was chosen for this study, as the median
percentage recommended by Avanti’s product sheets. In Table 3.5 a typical mix design
used in the field can be seen. This design gives a two percent catalyst mix with no
additives. However, in chemical grouting applications longer gel times are necessary to
allow grout to permeate through the soil. There are several ways to elongate the time of
reaction upon mixing, allowing longer gel times for pumping and permeation of the grout
through the soil.
Table 3.5. Typical Mix Design for Acrylate Grout, AV-160, with no KFe.
TANK A TANK B
Add 37.8 Liters of Water Add 37.8 Liters of Water
Add Drum (51.1 L) of AV-160 4.54 kilograms of AV-103
Add 3.8 Liters of AV-101 Bring to 113.5 Liters with Water
Add 20.8 Liters of Water
3.2.2.3 Grout Gel Testing
There are several factors that affect chemical grout gel. The initial conditions of the
uncured grout, such as dilution and catalyst concentration, severely alter the gel time.
However, controlled water volumes and catalyst concentrations are easily achievable.
While the mix design may be used to control gel, daily changes in temperature can be a
major obstacle for gel time control in field grouting.
In the exothermic reaction, excess heat was given off from the reaction change from
liquid to semi-solid. Therefore, the maximum curing temperature has a direct correlation
to the gel time. Therefore, ambient temperature is a major external condition that has
been shown to alter the maximum curing temperature. As the initial grout temperature
was changed, the final temperature and cure time was effected. Temperature may

51
potentially be managed by putting bags of ice in the grout when the temperature becomes
hot and by add warm water to the mix when the external temperature becomes cold. Gel
times may be managed by temperature control and catalyst control, but with these there
are limitations to the length of extension.
By varying parameters such as catalyst concentrations, maximum gel times of several
minutes can be achieved. Grouting text books and case studies indicate that extended gel
times are necessary for geotechnical applications (American Cyanide, 1960; Nonveiller,
1989; Bell, 1993; Bruce et al., 1997; Karol, 2003). Potassium Ferricyanide (KFe) is a
chemical compound used in small quantities for extending gel times in chemical
reactions, as much as several hours. KFe acts a reducing agent that retards free radical
generation, necessary to start the reaction (Avanti International, 2014B).
In this study, four KFe concentrations were tested at three different temperatures. Figure
3.6 shows the temperature changes with time as an acrylate polymerization exothermic
reaction progresses. In this figure both temperature and time were normalized.
Normalized time is
max
nt
tt (25)
where t the time and tmax is the time corresponding to the maximum temperature, also
known as curing temperature. Normalize temperature is
0
nT
TT (26)
where T is temperature, in degrees Celcius, and T0 is ambient temperature. As previously
mentioned, KFe extends gel times by retarding free radical generation. Free radicals are
necessary for the reaction to initiate.

52
Figure 3.6. Time-Temperature Curve during Acrylate Polymerization.
In Figure 3.6, it was apparent that as more KFe is added to the solution the point of
initiation was prolonged. Also apparent in the figure, samples with larger proportions of
KFe exhibit lower maximum temperatures. This may be because some free radicals are
lost as KFe retards free radical general. Curing Temperature variations can also be seen
in Figure 3.7.
1
1.2
1.4
1.6
1.8
2
2.2
0 0.5 1 1.5
No
rm
ali
zed
Tem
pera
ture
Normalized Time
0.0 % KFe
0.05 % KFe
0.1 % KFe
0.15 % KFe
15 Degrees Celcius
A
1
1.1
1.2
1.3
1.4
1.5
1.6
1.7
1.8
1.9
2
0 0.5 1 1.5
No
rm
ali
zed
Tem
pera
ture
Normalized Time
0.0 % KFe
0.05 % KFe
0.1 % KFe
0.15 % KFe
20 Degrees Celcius
B
1
1.1
1.2
1.3
1.4
1.5
1.6
1.7
0 0.5 1 1.5
No
rm
ali
zed
Tem
pera
ture
Normalized Time
0.0 % KFe
0.05 % KFe
0.1 % KFe
0.15 % KFe
25 Degrees Celcius
C

53
Figure 3.7. Normalized Maximum Temperature versus Inhibitor Concentration
The inhibitor chemical, KFe, extends the time for reaction initiation by retarding
monomer free radicals, which results in a decreased temperature. The maximum reaction
temperature was normalized by the ambient temperature for analysis in this study. The
associated ambient temperature has been presented in the data label, seen in Figure 3.7.
The equation for normalized maximum temperature time is
0
maxmn,
T
TT (27)
where Tmax is the maximum temperature and T0 is the ambient temperature. The samples
tested at 15 degrees Celsius have the highest increase in temperature from ambient
temperature, but display the lowest temperature overall. The opposite was true for the
samples tested at 25 degrees Celsius.
While the samples tested at lower ambient temperature had higher normalized maximum
temperature, the samples tested at higher ambient temperature reached the higher
maximum temperatures overall. The samples that reached the highest maximum
temperatures had faster gel times. Figure 3.8 shows the effect of KFe on gel time of the
grout. Gel time of the acrylate grout was quantified as the time where the grout became
sticky enough to stick to a stirring rod, forming a string at the end of the stirring rod
rather than a droplet (Krizek, 1992). This gel time method was indicative of changes in
grout properties (ie. stickiness) and viscosity increases.
R² = 0.97
R² = 0.81
R² = 0.91
1.4
1.5
1.6
1.7
1.8
1.9
2
2.1
2.2
0 0.05 0.1 0.15
No
rm
ali
zed
Ma
x T
em
pera
ture
Inhibitor Concentration (%)
15 Degrees Celcius
19 Degrees Celcius
25 Degrees Celcius

54
Figure 3.8. Effect of Inhibitor (KFe) Concentration on A) Gel Time and B)
Maximum Temperature.
Gel time was of particular importance for a variety of reasons. One imminent reason was
for the preservation of equipment. Imperative in the field and in this laboratory study was
that the gel does not react in the mixing tank, potentially forming a gel and damaging
equipment. Furthermore, gel time has a crucial role in the effectiveness of the grouting
program. In field grouting, grouting typically takes place by drilling vertically into the
ground, inserting an injection sourced into the drilling hole, and injecting grout laterally
while pulling the injection source to the ground surface. For the flow from the injection
source, the length that the grout is able to penetrate from the center of the injection source
is called the grout radius of penetration. For a grouting program to be effective, the grout
must be able to permeate through the soil to achieve the designed grouted sand radius. If
the grout gels before penetrating the appropriate radius, the seepage barrier may be non-
continuous. This may cause mechanical instability and potential areas for water flow to
bypass the seepage barrier. For controlling gel time the inhibitor, potassium ferricyanide,
was added to achieve the proper gel time.
Selection of a mix design for controlling gel times varies by application and specific
grout design. In chemical grouting for grout curtain applications, several textbooks have
proposed that ranges from 15 minutes to several hours may be acceptable (Bell, 1993;
Bruce et al., 1997). Case history data has been presented that verifies these ranges are
appropriate in field grout curtain applications (American Cyanide, 1960; Nonveiller,
1989; Karol, 2003). For the purpose of this study, a potassium ferricyanide concentration
R² = 0.94
R² = 0.99
R² = 0.99
0.0
5.0
10.0
15.0
20.0
25.0
30.0
35.0
40.0
45.0
50.0
0 0.05 0.1 0.15
Gel T
ime (m
in)
Inhibitor Concentration (%)
15 Degrees Celsius
19 Degrees Celsius
25 Degrees Celsius

55
of 0.15 percent was selected, with a gel times of 20.5 minutes. The mix design selected
for this grouting program is shown in Table 3.6. It should be noted that more water was
added, to Tank A, than shown in Table 3.5. Table 3.5 shows a typical mix design for
acrylate grout per Avanti’s Technical Data sheet. Table 3.6 shows a mix design that was
provided with the grouting material, along with the amount of KFe to obtain the desired
gel time for this study. This gel time itself was acceptable because it fits in the range used
in field applications of chemical grouting for grout curtains.
Table 3.6. Mix Design for Prepared Grouted sand Specimens in this Study
TANK A TANK B
Add 37.8 Liters of Water Add 37.8 Liters of Water
Add Drum (51.1 L) of AV-160 4.54 kilograms of AV-103
Add 3.8 Liters of AV-101 Bring to 113.5 Liters with Water
Add 20.8 Liters of Water
0.34 kilograms of KFe
3.3 Grouting Apparatus
In grouting applications, the grout must permeate through the pore spaces of the soil in
question, distributing a uniform mix to the pore spaces. Laboratory techniques must
mimic such procedures in order to be applicable to field samples. Therefore, the
apparatus used in the procedure was developed with the field application in mind. In
order to execute the creation of such an apparatus, previous studies were investigated to
supplement applicable standards, such as ASTM D4320. The apparatus is shown in
Figure 3.9. Any variations from pertinent ASTMs will be noted.

56
Figure 3.9. Grouting Apparatus.
A major component of the study was that a cylindrical column, for the soils sample, was
formed so that the grout could permeate through the porous medium. For this procedure
to occur the grout must not leak and the sample soil particles should be stationary through
the grouting process. The soil should be stationary so permeation may take place in the
soil pore space, without significantly altering the soil skeleton. A 50.8 diameter, 201.6
long acrylic tube was used for the cylindrical mold. The soil sample length was 196.8
millimeters, because the mold fit 3.2 millimeters into the influent and effluent bases,
where O-rings were located for leakage prevention. These bases were located at the
bottom and top of the sample, and were made from acrylic sheet.
No compaction was needed for the Ohio River Sand, Trimble County Sand, and
Hardscapes Sand qat dry conditions. Ten tamps were required for the Medium Sand at
dry conditions, in four layers. Moist samples were made, and specifically were
compacted at three, six, and nine percent moisture. Ohio River Sand, Trimble County
Sand, and Medium Sand ten tamps were required each layer for three layers. In the
Effluent
Air Pressure
Pressure Board
Soil
SampleGrout Chamber

57
Medium Sand, eight layers was required with twenty tamps each layer. In addition to the
tamping, twenty taps on the side of the mold were required on every other layer. The
tamping rod had a weight of 9.9 Newtons. The sand samples throughout this study were
compacted at constant unit weight of 15.7 kN/m3.
Paper filters were placed at the influent prior to compaction. A wire mesh and filter were
situated between the sample and effluent after compaction. The wire mesh was required
in the effluent to keep the paper filter from breaking. Also prior to compaction, wax
paper was situated around the soil sample, to reduce side friction upon extraction of the
sample once it was grouted.
Upon proper compaction and assembling of the mold containing the soil sample, the
grouting process was allowed to initiate. An influent air pressure was situated at the top
of the grout chamber, extending from the pressure board, as depicted. The grout chamber
was a DurhamGeo 152.4 millimeter permeameter. Once the appropriate air pressure
magnitude was reached a two-way valve, at the bottom of the grout chamber, was
opened. This initiated pressurization of the grout. The grout near-instantaneously began
to permeate the soil sample. The grout was allowed to flow to 50 milliliters or until
refusal. The grouted sample was paced between two rubber mats to cure, roughly 24 ± 6
hours and extracted using a hydraulic press. The sample was then placed in a Ziplok bag,
in accordance with associated ASTM standards previously noted. Upon seven day curing
the sample was tested.
3.4 Hydraulic Characteristics
3.4.1 Groutability
Hydraulic conductivity gives strong indications of groutability. Several tests have
presented conductivity criterion, commonly applied to chemical grouts (Karol, 2003;
Powers et al., 2007: Henn, 2010). Powers et al. (2007) considers soils with hydraulic
conductivities between 10-1 to 10-3 cm/s groutable. Soils with hydraulic conductivities
between 10-3 and 10-5 cm/s are considered marginally groutable. Soils that have hydraulic
conductivities lower than 10-5 cm/s are typically not groutable. The hydraulic
conductivity criterion in graphically depicted in Figure 3.10, and these associated data is
presented.

58
Figure 3.10. Hydraulic Conductivity Groutability Criterion.
By these criteria Kentucky River Sand has a designation of marginally groutable, as its
saturated hydraulic conductivity was between of 10-3 and 10-5 cm/s, while the remaining
sands are groutable based on this criterion. This can be observed in Figure 3.10, where
Kentucky River sand lies in the marginally groutable region. Once the groutability of the
sands was determined, injection of the groutable sands was initiated.
3.4.2 Grout Penetration
Grout penetration was measured in this study. This was considered the time the grout
penetrated the cylindrical soil sample, influent to effluent. An important factor in
grouting effectiveness in the field is the radius of penetration, which is directly affected
by the grout penetration of the soil (Xanthakos et al., 1994). As can be seen in Figure
3.11, grout penetration increased as the soil moisture was increased. Field variation of
grout penetration with initial moisture has been noted in a study on cement grout by
Perret et al. (2000). One reason for this behavior is adsorption in dry soils. In a dry sand
sample, dry particles adsorbed water, which impeded penetration. In soils where these
particles contain water, less adsorption takes place and the liquid flowed through the pore
spaces freely. Increases in partial saturation increased the penetration rate.
1.0E-06
1.0E-05
1.0E-04
1.0E-03
1.0E-02
1.0E-01
1.0E+00
0 0.1 0.2 0.3k
(cm
/s)
D10
Kentucky River Sand
Ohio River Sand
Hardscapes Sand
Medium Sand
Trimble County Sand
Not Groutable
Marginally Groutable
Likely Groutable
59
Figure 3.11. Effect of the Degree of Saturation on Grout Penetration Rate.
A common tool used to interpret behavior in unsaturated soils is the soil water
characteristics curve, as previously discussed. The penetration relationships, seen in
Figure 3.11, can also be understood by sample obtainment processes used to obtain
SWCC data. In SWCC testing, as the sample becomes less saturated it takes more
pressure to get the remaining water out of the sample, due to the suction of the soil. This
relationship for unsaturated soils is applicable to the grout penetration rates observed in
Figure 3.11. This was because as the soil moisture content decreased, penetration rates
through the sample decreased. While four groutable sands were used in this study,
complete penetration rate data was only obtained for Ohio River sand and Hardscapes
Sand. Penetration data was obtained for Medium sand and Trimble County sand, but
insufficient data was available to suggest trends for these sands.
As previously noted, grout penetration in the field is emitted from an injection source,
and penetrates laterally from the point of injection (Xanthakos et al., 1994). Early grout
research realized and quantified the necessary hydraulic head to grout soils based on soil
hydraulic conductivity, grout viscosity, injection source diameter, and desired grout
penetration radius (Raffle and Greenwood, 1961). Flow through a porous media has been
theorized using Darcian and Newtonian theory, as applicable for chemical grouts. A
relationship previously proposed by Maag (1938) was used in conjunction with previous
theory and relationships to add a porosity equation. The resulting equation is
gVkHr
nt
3
(28)
R² = 0.60
R² = 0.77
0.00
0.01
0.02
0.03
0.04
0.05
0.06
0.07
0 10 20 30 40
Pen
etr
ati
on
Ra
te (
m/s
)
Volumetric Water Content
Hardscapes Sand
Ohio River Sand

60
where is grout viscosity, n is porosity, k is the hydraulic conductivity, H is the
hydraulic head, r is the injection radius, and Vg is a volume term representing the volume
to be grouted. For field applications in Equation 28, the volumetric parameter is
Vg = R3 – r3 (29)
where R is the grout penetration radius, whereas in this study, the volume to be grouted is
Vg = LR2π (30)
where R is the sample radius and L is the sample length. In this study, grout permeates
from an injection source into a cylindrical column, which will result in changes in
volumes used in the equations. This study chose to develop a parameter based on known
criteria that effects grouting flow. This equation isolated all terms on one side, except the
length and time. The resulting parameter, which was the result of the combination of
terms other than length and time, is
nπRμ
HrkK
2
r
rF (31)
where kr is relative hydraulic conductivity, H is pressure head, r is the injection radius, r
is grout viscosity, R is the radius the grout permeates through the soil, and n is porosity.
As previously discussed, relative hydraulic conductivity is the unsaturated hydraulic
conductivity normalized by saturated hydraulic conductivity. The unsaturated hydraulic
conductivity is a function of the suction values selected using the SWCC and the in situ
degree of saturation. With the appropriate suction, unsaturated hydraulic conductivity
was calculated using the equation proposed by Campbell (1974). In this equation, the
units cancel out, causing KF to be unitless. In Equation 31, the relative viscosity is
wu
gu
rμ (32)
where g is grout viscosity and w is the water viscosity. Several of these parameters are
held constant in this study. These parameters are r = 0.005 meters, R = 0.025 meters, g =
1 centipoise, and w = 1 centipoise. Length and time were not included in the
permeability factor, Equation 31, because these were the parameters recorded in the

61
experimentation. The graphical results of the permeability factor and penetration rate can
be found in Figure 3.12.
Figure 3.12. Effect of the Permeability Factor on Penetration Rate.
An empirical relationship was developed for the created parameter and flow. This
relationship is
2F1R βKβP (33)
where PR is the penetration rate, KF is a unitless permeability factor, 1 = 0.003, and
The slope in the relationship signifies a change in penetration rate per change in
permeability factor. The y-intercept was indicative of behavior for dry samples. In this
study, a major influent was the calculated unsaturated hydraulic conductivity.
Unsaturated hydraulic conductivity was calculated using the Campbell (1974) equation as
previously described. This equation used suction and the air entry value, obtained from
the SWCC, to estimate unsaturated hydraulic conductivity. Unsaturated hydraulic
conductivity was dependent on the soil unit weight, moisture, and grain size. While this
factor combines components of these initial conditions, along with associated injection
parameters, specific variations in this are responsible for the observed behavior. The
major variation was moisture. The lowest permeability factor, indicative of dry samples
with low hydraulic conductivity, had low penetration rates due to adsorption (Perret et al.,
2000). In the samples with higher permeability factors, the grout penetrated at higher
y = 0.003x + 0.02
R² = 0.72
0.00
0.01
0.02
0.03
0.04
0.05
0.06
0.07
0.0 5.0 10.0 15.0 20.0
Pen
etr
ati
on
Rate
(m
/s)
Permeability Factor
Data ExcludedMedium SandOhio River SandTrimble CountyHardscapes Sand

62
rates due to higher hydraulic conductivity. Also, there was less air volume for the grout to
fill in the pore space, because the water takes up a portion of the pore volume.
3.5 Strength Testing and Analysis
3.5.1 Unconfined Compression
The samples were tested in unconfined compression at a rate of 1 mm/min. The testing
machine was allowed to run until failure or until a minimum of twenty percent strain,
depending on which occurred first. These tests were performed in accordance to ASTM
D5219. Four sands at four different moisture contents were prepared. However, two of
the grouted-samples were unstable for testing. Figure 3.13 shows the results of the
unconfined compression tests.
Figure 3.13. Acrylate Grouted sand Stress-Strain Curves.
3.5.2 Relationships
It has been shown in previous studies that grain size has a significant effect on the
strength of chemically grouted sands (Schiffman and Wilson 1958; Clough et al. 1979;
Christopher et al. 1989). Ozgurel and Vipulanandan (2005) developed an equation to that
0
10
20
30
40
50
60
70
80
90
100
0 5 10 15 20 25
Str
ess
(k
Pa)
Strain (%)
Medium Sand
C
0
10
20
30
40
50
60
0 10 20 30
Str
ess
(k
Pa)
Strain (%)
Ohio River Sand
B
0
5
10
15
20
25
30
35
40
0 5 10 15 20 25
Str
ess
(k
Pa)
Strain (%)
Moisture Content = 0 Percent
Moisture Content = 3 Percent
Moisture Content = 6 Percent
Moisture Content = 9 Percent
Hardscapes Sand
A
0
20
40
60
80
100
120
140
160
180
0 10 20 30 40
Str
ess
(kP
a)
Strain (%)
Trimble County Sand
D

63
empirically gave indication of strength change with grain size and looked at the effects of
variation in fines on strength. Common indices of grain size that have been used to
evaluate grouted sands are based on grain size and coefficients that give an indication of
the soils gradation. While these data does not yield significant correlations, trends in
behavior for the grain size of grouted sands can be observed. Further investigation into
such relationships should continue to be developed where natural sands are investigated.
Furthermore, no data presently exists in regard to initial conditions, such as grain size, for
acrylate. Trends between strength and fines content may be observed in Figure 3.14. It
should be noted in these results the fines were not incrementally added to one sand. The
amount of fines in three natural sands and one manufactured sand was observed. These
sands varied in regard to other grain size indices, yet the most apparent observed
relationship was in regard to fines content. It should be noted that several of the samples
were grouted at variable injection pressures. These samples were included in this figure,
but may be omitted in later figures. More research will be necessary to relate grain size
properties to strength, and to quantify the role of fines in strength of chemical grouted
sands.

64
Figure 3.14. Effect of Fines on the Grouted sand Compressive Strength.
Figure 3.14 verifies previous research, that increasing fines content, in this range of fines,
increased the grouted sand strength (Ozgurel and Vipulanandan, 2005). In the zero
moisture content data set, a sample was excluded because some of the sample was lost
through the effluent, as the effluent filter paper broke.
Figure 3.15 shows the direct correlation between soil suction and its effect on strength.
The figure shows an increase in strength with suction. Increases in strength with suction,
in the figure, were influenced by dilution of the grout upon entering the sample in the low
suction samples. This is because low suction soils contain the most water. However, other
factors also influenced the grouted sand strength. It should be noted that in the Ohio
River sand data the dry sample, having a suction of 1,000,000 kPa, is responsible for the
poor correlation coefficient in Figure 3.15B. In this sample, the filter paper broke at the
top of the sample. This allowed soil to flow from the sample and is responsible for the
poor strength correlation for the Ohio River sand data. All other samples in this study had
a wire screen attached, above the filter paper, which further prevented this from
happening.
y = 1.9x0.95
R² = 0.88
0
1
2
3
4
5
6
7
8
0.0 1.0 2.0 3.0 4.0 5.0
Mod
ulu
s of
Ela
stic
ity (
kP
a)
Fines (%)
Moisture Content = 0 %
Data Point Excluded
A
y = 0.8x0.9
R² = 0.99
0
1
1
2
2
3
3
4
0.2 1.2 2.2 3.2 4.2 5.2
Mod
ulu
s of
Ela
stic
ity (
kP
a)
Fines (%)
Moisture Content = 3 %
B
y = 0.8x0.8
R² = 0.63
0
1
1
2
2
3
3
4
4
5
0.2 1.2 2.2 3.2 4.2 5.2
Mod
ulu
s of
Ela
stic
ity (
kP
a)
Fines (%)
Moisture Content = 6 %
C
y = 0.8x0.97
R² = 0.65
0
1
2
3
4
5
6
0.0 1.0 2.0 3.0 4.0 5.0M
od
ulu
s of
Ela
stic
ity (
kP
a)
Fines (%)
Moisture Content = 9 %
D

65
Figure 3.15. Compressive Strength versus Degree of Saturation.
In situ moisture, and in this case the suction due to moisture, affected grouted sand
modulus of elasticity for several of reasons. Dry soil samples have a matric suction of
1,000,000 kPa. In these dry soils, the sand particles may have a tendency to adsorb grout
moisture. This will result in a grout with decreased water in the pore space. As it applied
to the modulus of elasticity, this will result in larger strength increases with strain.
Furthermore, partially saturated soils will cause dilution of the grout. Indicative of lower
modulus of elasticity values, increased dilution due to moisture will negatively affect the
grout strength, (Perret et al., 2000). While initial moisture can play a crucial role in grout
strength, an index that takes initial soil properties, density components, and moisture into
effect may be useful in prediction of grouted sand strength. This is why suction is a
beneficial indicator of strength in grout sands with variable initial moisture.
Matric suction has commonly been plotted versus the soil strength for analysis (Fredlund
and Xing, 1994). However, Figure 3.16 shows that the initial soil suction in this
experiment can be used to estimate strength of grouted sand specimens. Several samples
were excluded in Figure 3.16. One sample, as previously described, was omitted because
y = 3.9x0.03
R² = 0.61
3.0
3.5
4.0
4.5
5.0
5.5
6.0
100 1000 10000 100000 1000000
Mo
du
lus
of
Ela
stic
ity
(k
Pa
)
Suction (kPa)
Medium Sand
A
y = 1.9x0.02
R² = 0.08
1.6
1.8
2.0
2.2
2.4
2.6
2.8
3.0
1 100 10000 1000000
Mo
du
lus
of
Ela
stic
ity
(k
Pa
)
Suction (kPa)
Ohio River Sand
B
y = 0.6x0.08
R² = 0.92
0.6
0.8
1.0
1.2
1.4
1.6
1.8
2.0
10 100 1000 10000 100000 1000000
Mod
ulu
s of
Ela
stic
ity
(k
Pa)
Suction (kPa)
Hardscapes Sand
C
y = 0.43x0.2
R² = 0.97
0.0
1.0
2.0
3.0
4.0
5.0
6.0
7.0
8.0
100 1000 10000 100000 1000000
Mo
du
lus
of
Ela
stic
ity
(k
Pa
)
Suction (kPa)
Trimble County Sand
D

66
the effluent filter broke. ASTM D4219 recommends injection pressures lower than 68.9
kilopascals for chemical grouted sands. The remaining samples were excluded from the
relationship because to variable injection pressures, higher than desired, were necessary
to grout the samples. This may have been due to the high compaction effort needed to
compact the sample to the constant unit weight used in this study. The samples included
in the relationship were obtained using without any malfunction or change in injection
pressure, and were strictly in accordance to ASTM procedures.
Figure 3.16. Modulus of Elasticity versus Normalized Matric Suction.
The relationship between normalized unconfined compressive strength and normalized
suction is
2a
n1 )(ψaE (34)
where E is the grouted sand elastic modulus, e is the effective soil suction, and a1 and a2
are empirical constants for the power function. In the power function constants, a1 = 0.69
and a2 = 0.15. Constant a1 was an empirically estimated modulus at dry conditions. This
represents dry conditions because the suction was normalized to the dry suction. Since a2
was below one and negative, the power function increased at a decreasing rate of
increase. There are several factors that governed this behavior. One was that the dry
samples exert some adsorption on the grout mix and adsorbs some of the grout water.
This causes the grout in dry conditions to have less moisture than in the initial mix. In the
sand samples with partially saturated initial conditions, non-continuous water and air
voids were in the pore space. This results in some mixing. This differs from to saturated
y = 0.69x0.15
R² = 0.85
0.1
1.0
10.0
1 100 10000 1000000
Mo
du
lus
of
Ela
stic
ity
(k
Pa
)
Normalized Matric Suction
Data ExcludedMedium SandOhio River SandTrimble County SandHardscapes Sand
67
conditions where the pore space water gets replaced, nearly completely, by grout. This
occurs because, under pressure, the water in the pores completely exits as the grout enters
the pore space. A third reason was the capillary effects due to matric suction. It has been
observed that as sands become less saturated they exhibit higher matric suction values,
which results in higher strength. This initial condition of the grout likely applies to a
resulting grouted sand, which this study provided evidence through this equation
Equation 32 contains an effective suction. This value was normalized in order to allow
different units to be compared to this research, and so that the constant, a1 pertains to
pertinent dry conditions. Normalized suction is
aev
nψ
ψψ (35)
where is the matric suction corresponding to the initial volumetric moisture content and
aev is the matric suction air entry value. Both suction and air entry value was obtained
from the SWCC, as previously described. Equation 32 is valid for the conditions in this
study. Additional research will be necessary to continue developing these relations for all
initial conditions possible in the field.
3.6 Conclusion
The influence of initial conditions on grouted sand properties, such as moisture content
and variation in grain size, were evaluated. The grouted sand properties were investigated
how these aspects influences grout penetration into the soil and the resulting grouted sand
strength. Also, of grout mix ratios were investigated in respect to acrylate grout gel times.
The conclusion drawn from this study are as follows:
Unsaturated hydraulic conductivity increases with volumetric moisture and
decreases with normalized suction.
Normalized temperature decreased, by as much as 20 perent, as inhibitor
concentrations are increased to only 0.15 percent of the total grout mix.
The normalized temperature was largest at low ambient temperatures. This was
indicative of a higher amount of increase from the ambient temperature. However,
the maximum temperature was higher at higher ambient temperatures.

68
At an inhibitor concentration of 0.15 percent, gel times increased from about 15 to
45 minutes as temperature increased from 15 to 25 degrees Celsius.
Gel times decreased as inhibitor concentrations increased. With no inhibitor, the
reaction only took seconds to take place. With only small amounts of inhibitor (ie.
0.15 percent) the gel time increased to as much as 45 minutes.
Sands on the order of 10-4 cm/s are considered moderately groutable. One sand
investigated in this study, with a hydraulic conductivity of 2.5×10⁻⁴ cm/s, was not
groutable. This may be the case, circumstantially, for soils considered moderately
groutable.
Grout penetration increased by a factor of 2 as volumetric water content increased
from dry conditions to a gravimetric moisture content of nine percent. This trend
was expected, as soils with lower volumetric contents had lower hydraulic
conductivities.
Initial penetration rate relationships were developed for the soils used in this
study. The factor used to form this relationship was comprised of grout properties,
soil properties, and hydraulic conductivities. As an increased range of soil
conditions are tested, this relationship may be expanded.
Grouted sand modulus of elasticity decreased by as much as 80 percent as the
fines content decreased from 4 to 1 percent.
Increases in volumetric moisture content caused the grouted sand modulus of
elasticity to decrease, in general. This was due to adsorption at near-dry
conditions and dilution at partially saturated conditions.
The elastic modulus of the grouted sands increased by about 7 kPa as normalized
matric suction increased from 17 to 1,000,000 kPa. An empirical relationship was
developed from the data investigated. This relationship was specific for the ranges
of suction in this study, and has potential for expansion with additional data for
additional in situ initial conditions.

69
CHAPTER 4
4 Conclusions
4.1 Mechanical Behavior of Ultrafine-Grouted Sands
The influence of initial conditions on grouted sand properties, such as moisture content
and variation in grain size, were evaluated. The grouted sand properties were investigated
how these aspects influences grout penetration into the soil and the resulting grouted sand
strength. Also, influent of water-to-cement ratios were investigated in respect to neat
grout specimens. The conclusions drawn from this study are as follows:
Unsaturated hydraulic conductivity increases (ie. from 8.9×10⁻⁴ cm/s to 2.0×10⁻²)
with changes in graviemtric moisture from zero to nine percent. Matric suction
was used to estimate the unsaturated moisture content.
Increases in water-to-cement ratio have a significant effect on bleed. Increasing
the water-to-cement ratio from one to four increased bleed from zero percent to
50 percent, causing the grout to be unstable. Similar changes in the water-to-
cement ratio decreased the unconfined compressive strength by a factor of ten.
As discussed, previous studies have shown that soils with five percent fines can
be ungroutable. In this study, fine sand with eleven percent fines was investigated.
This particular sand was not groutable. By all groutability criteria, this sand was
considered moderately groutable. These results affirm assertions of previous
studies that sand considered moderately groutable may not be groutable.
Grout penetration rates through the sample increased, by as much as a factor of
eight, as volumetric moisture increased from dry conditions to nine percent
moisture. The observed grout penetration increase was directly related to
unsaturated hydraulic conductivity. Relationships regarding injection and soil
properties can be used in conjunction with hydraulic conductivity to develop
relationships in initial penetration rates.
Grouted sand strength decreased as moisture increased. A 50 percent decrease in
strength was observed with an increase of nine percent gravimetric moisture. This
was likely due to mixing of pore water and the grout suspension.

70
With greater proportions of grout to initial soil and water, strength increases were
seen. As the initial suction increased from about 50 to 1,000,000 kPa, the grouted
sand strength increased by 150 percent. The soil-water characteristic curves are
dependent upon the unit weight and soil-specific particle sizes. The specific soil
suctions were selected from the appropriate initial moisture of the soil. This
allows for grouted sand strength relationships based on soil matric suction.
4.2 Mechanical Behavior of Acrylate-Grout Sands
The influence of initial conditions on grouted sand properties, such as moisture content
and variation in grain size, were evaluated. The grouted sand properties were investigated
how these aspects influences grout penetration into the soil and the resulting grouted sand
strength. Also, of grout mix ratios were investigated in respect to acrylate grout gel times.
The conclusions drawn from this study are as follows:
Unsaturated hydraulic conductivity increases with volumetric moisture and
decreases with normalized suction.
Normalized temperature decreased, by as much as 20 perent, as inhibitor
concentrations are increased to only 0.15 percent of the total grout mix.
The normalized temperature was largest at low ambient temperatures. This was
indicative of a higher amount of increase from the ambient temperature. However,
the maximum temperature was higher at higher ambient temperatures.
At an inhibitor concentration of 0.15 percent, gel times increased from about 15 to
45 minutes as temperature increased from 15 to 25 degrees Celsius.
Gel times decreased as inhibitor concentrations increased. With no inhibitor, the
reaction only took seconds to take place. With only small amounts of inhibitor (ie.
0.15 percent) the gel time increased to as much as 45 minutes.
Sands on the order of 10-4 cm/s are considered moderately groutable. One sand
investigated in this study, with a hydraulic conductivity of 2.5×10⁻⁴ cm/s, was not
groutable. This may be the case, circumstantially, for soils considered moderately
groutable.
Grout penetration increased by a factor of 2 as volumetric water content increased
from dry conditions to a gravimetric moisture content of nine percent. This trend
71
was expected, as soils with lower volumetric contents had lower hydraulic
conductivities.
Initial penetration rate relationships were developed for the soils used in this
study. The factor used to form this relationship was comprised of grout properties,
soil properties, and hydraulic conductivities. As an increased range of soil
conditions are tested, this relationship may be expanded.
Grouted sand modulus of elasticity decreased by as much as 80 percent as the
fines content decreased from 4 to 1 percent.
Increases in volumetric moisture content caused the grouted sand modulus of
elasticity to decrease, in general. This was due to adsorption at near-dry
conditions and dilution at partially saturated conditions.
The elastic modulus of the grouted sands increased by about 7 kPa as normalized
matric suction increased from 17 to 1,000,000 kPa. An empirical relationship was
developed from the data investigated. This relationship was specific for the ranges
of suction in this study, and has potential for expansion with additional data for
additional in situ initial conditions.
4.3 Future Research
Future work in this area should expand the limitations of initial conditions investigated
and should be geared towards practical applications. Even if the general effects of initial
conditions are understood, future research will be beneficial to grouting in that it can
quantify grout flow distances and the resulting grouted sand permeability and strength.
Studies involving grout mix design may also be beneficial to grouting procedures and
implementation. Investigation into the effects of various additives on the grout
effectiveness measures may be beneficial. Additives may be useful if the cost of the
additive can be offset by benefits the additive may provide. While studies on the initial
conditions will help with strength and considerations, they also may be helpful in
predicting the effectiveness of field techniques and procedures.
Research concerning grouting techniques involving laboratory scale models will likely
depict problems to be encountered in the field. This research may also provide
quantification techniques to predict grout flow characteristics, permeability, and strength.

72
There should be investigations regarding correlations between grouted cylinder sample
testing and application techniques. A laboratory study involving grouting cylinders, as
performed in this study, and performing laboratory scale modeling of field applications
may begin to provide relationships between testing procedures and laboratory
implementation.

73
Appendix A
Soil Test Data

74
A.1 Grain Size Distribution
Table A.1. Grain Size Distribution for Kentucky River Sand.
Kentucky River Sand
Sieve #
Sieve
size
(mm)
Weight-sieve+soil (grams)
Weight - Sieve (grams)
Weight - Soil
(grams) Percent
Retained
Cumulative Percent
Retained Percent
Finer
3/8" 9.50
No. 4 4.75 517.1 517.1 0.0 0.00 0.00 100.0
No. 10 2.00 481.2 481.3 0.0 0.00 0.00 100.0
No. 20 0.85 428.5 428.2 0.3 0.06 0.06 99.9
No. 40 0.43 396.8 395.5 1.3 0.26 0.32 99.7
No. 60 0.25 592.9 537.9 55.0 10.98 11.30 88.7
No. 100 0.15 792.3 512.3 280.0 55.91 67.21 32.8
No. 140 0.11 539.3 463 76.3 15.24 82.45 17.6
No. 200 0.08 358.4 326.5 31.9 6.37 88.82 11.2
Pan 0.0 56.0 11.18 100.00
Table A.2. Grain Size Distribution for Hardscapes Sand.
Hardscapes Sand
Sieve #
Sieve
size
(mm)
Weight-sieve+soil (grams)
Weight - Sieve (grams)
Weight - Soil
(grams) Percent
Retained
Cumulative Percent
Retained Percent
Finer
3/8" 9.500
No. 4 4.750 517.1 517.1 0.0 0.00 0.00 100.00
No. 10 2.000 482.1 481.3 0.8 0.16 0.16 99.84
No. 20 0.850 487.2 428.2 59.0 11.76 11.92 88.08
No. 40 0.425 586.3 395.5 190.8 38.03 49.95 50.05
No. 60 0.250 709.4 537.9 171.5 34.19 84.14 15.86
No. 100 0.150 576.7 512.3 64.4 12.84 96.98 3.02
No. 140 0.106 471 463 8.0 1.59 98.57 1.43
No. 200 0.075 328.4 326.5 1.9 0.38 98.95 1.05
Pan 0.000 5.3 1.05 100.00

75
Table A.3. Grain Size Distribution for Ohio River Sand.
Ohio River Sand
Sieve #
Sieve
size
(mm)
Weight-sieve+soil (grams)
Weight - Sieve (grams)
Weight - Soil
(grams) Percent
Retained
Cumulative Percent
Retained Percent
Finer
3/8" 9.500
No. 4 4.750 522.3 517.1 5.2 1.04 1.04 100.00
No. 10 2.000 541.5 481 60.5 12.11 13.15 86.85
No. 20 0.850 534.1 428.2 105.9 21.19 34.34 65.66
No. 40 0.425 579.3 395.5 183.8 36.78 71.12 28.88
No. 60 0.250 635.2 537.1 98.1 19.63 90.75 9.25
No. 100 0.150 532.3 512.3 20.0 4.00 94.75 5.25
No. 140 0.106 465.9 462.6 3.3 0.66 95.41 4.59
No. 200 0.075 328.1 326.5 1.6 0.32 95.73 4.27
Pan 0.000
21.3 4.27 100.00
Table A.4. Grain Size Distribution for Trimble County Sand.
Trimble County Sand
Sieve #
Sieve
size
(mm)
Weight-sieve+soil (grams)
Weight - Sieve (grams)
Weight - Soil
(grams) Percent
Retained
Cumulative Percent
Retained Percent
Finer
3/8" 9.500
No. 4 4.750 517.1 517.1 0.0 0.00 0.00 100.00
No. 10 2.000 500.3 480 20.3 4.04 4.04 95.96
No. 20 0.850 504.7 428.5 76.2 15.18 19.23 80.77
No. 40 0.425 558.9 395.8 163.1 32.50 51.72 48.28
No. 60 0.250 702.9 537 165.9 33.06 84.78 15.22
No. 100 0.150 564 512.3 51.7 10.30 95.08 4.92
No. 140 0.106 469.2 463.1 6.1 1.22 96.30 3.70
No. 200 0.075 330.2 326.7 3.5 0.70 96.99 3.01
Pan 0.000 15.1 3.01 100.00

76
Table A.5. Grain Size Distribution for Medium Sand.
Medium Sand
Sieve #
Sieve
size
(mm)
Weight-sieve+soil (grams)
Weight - Sieve (grams)
Weight - Soil
(grams) Percent
Retained
Cumulative Percent
Retained Percent
Finer
3/8" 9.50
No. 4 4.75 517.1 517.1 0.0 0.00 0.00 100.0
No. 10 2.00 481 480 1.0 0.20 0.20 99.8
No. 20 0.85 447.91 428.13 19.8 3.96 4.16 95.8
No. 40 0.43 554.95 373.5 181.5 36.29 40.45 59.6
No. 60 0.25 745.51 538.6 206.9 41.38 81.83 18.2
No. 100 0.15 575.01 512.18 62.8 12.57 94.39 5.6
No. 140 0.11 468.8 462.31 6.5 1.30 95.69 4.3
No. 200 0.08 375.59 373.31 2.3 0.46 96.15 3.9
Pan 0.0 19.3 3.86 100.01
A.2 Specific Gravity Data
Table A.6. Trimble County Sand Specific Gravity.
Soil Description Trimble County Sand
Pecometer Number 1 2 3
Nominal Pycometer Volume 500 ml 500 ml 500 ml
Oven Dry Weight of Soil 100 g 100 g 100 g
Weight of Pycometer+ Water 663.57 g 659.61 g 661.2 g Weight of Pycometer+
Water+Soil 725.99 g 722.02 g 723.75 g
Temperature 20 deg. Cels 20
deg. Cels 20
deg. Cels
Correction Factor K 1 1 1
Specific Gravity 2.64 2.67 2.66
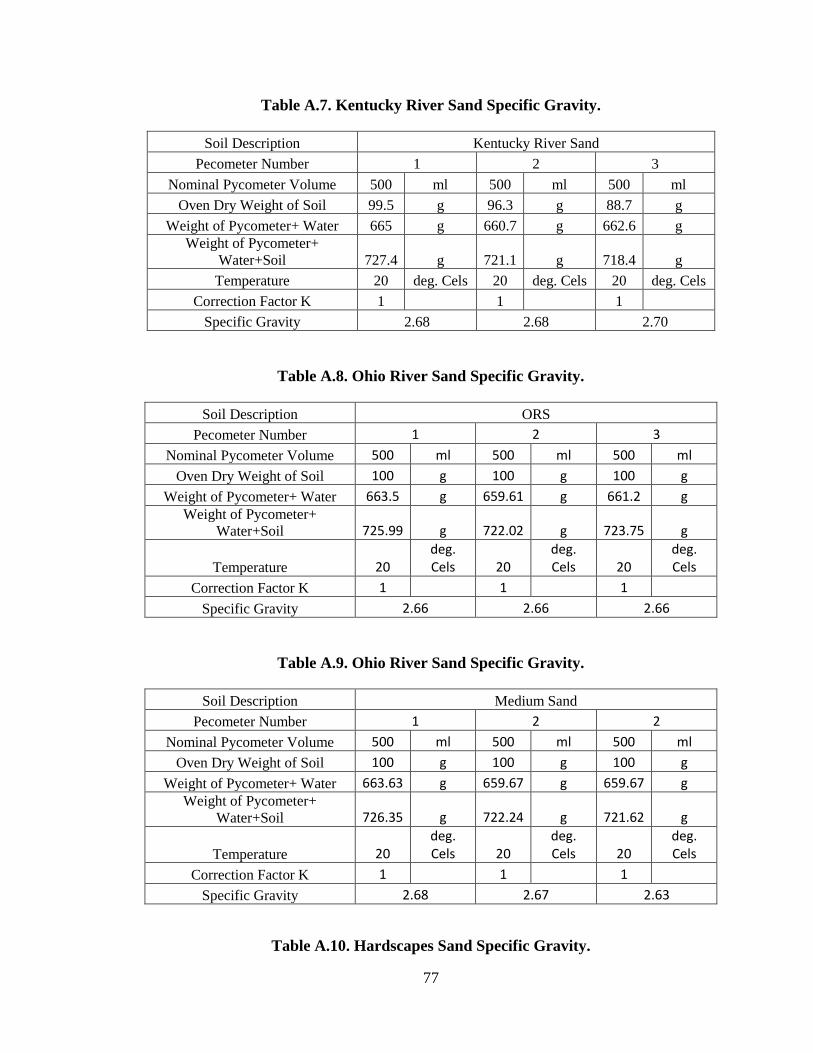
77
Table A.7. Kentucky River Sand Specific Gravity.
Soil Description Kentucky River Sand
Pecometer Number 1 2 3
Nominal Pycometer Volume 500 ml 500 ml 500 ml
Oven Dry Weight of Soil 99.5 g 96.3 g 88.7 g
Weight of Pycometer+ Water 665 g 660.7 g 662.6 g Weight of Pycometer+
Water+Soil 727.4 g 721.1 g 718.4 g
Temperature 20 deg. Cels 20 deg. Cels 20 deg. Cels
Correction Factor K 1 1 1
Specific Gravity 2.68 2.68 2.70
Table A.8. Ohio River Sand Specific Gravity.
Soil Description ORS
Pecometer Number 1 2 3
Nominal Pycometer Volume 500 ml 500 ml 500 ml
Oven Dry Weight of Soil 100 g 100 g 100 g
Weight of Pycometer+ Water 663.5 g 659.61 g 661.2 g Weight of Pycometer+
Water+Soil 725.99 g 722.02 g 723.75 g
Temperature 20 deg. Cels 20
deg. Cels 20
deg. Cels
Correction Factor K 1 1 1
Specific Gravity 2.66 2.66 2.66
Table A.9. Ohio River Sand Specific Gravity.
Soil Description Medium Sand
Pecometer Number 1 2 2
Nominal Pycometer Volume 500 ml 500 ml 500 ml
Oven Dry Weight of Soil 100 g 100 g 100 g
Weight of Pycometer+ Water 663.63 g 659.67 g 659.67 g Weight of Pycometer+
Water+Soil 726.35 g 722.24 g 721.62 g
Temperature 20 deg. Cels 20
deg. Cels 20
deg. Cels
Correction Factor K 1 1 1
Specific Gravity 2.68 2.67 2.63
Table A.10. Hardscapes Sand Specific Gravity.
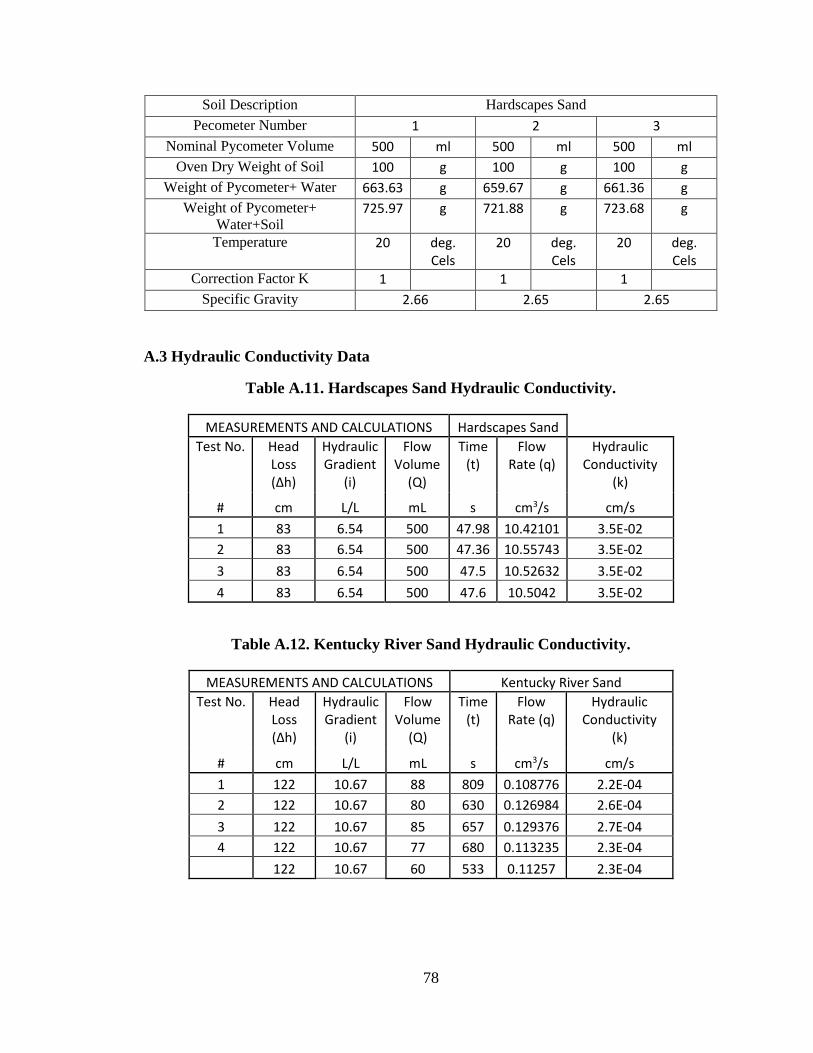
78
Soil Description Hardscapes Sand
Pecometer Number 1 2 3
Nominal Pycometer Volume 500 ml 500 ml 500 ml
Oven Dry Weight of Soil 100 g 100 g 100 g
Weight of Pycometer+ Water 663.63 g 659.67 g 661.36 g
Weight of Pycometer+
Water+Soil 725.97 g 721.88 g 723.68 g
Temperature 20 deg. Cels
20 deg. Cels
20 deg. Cels
Correction Factor K 1 1 1
Specific Gravity 2.66 2.65 2.65
A.3 Hydraulic Conductivity Data
Table A.11. Hardscapes Sand Hydraulic Conductivity.
MEASUREMENTS AND CALCULATIONS Hardscapes Sand Test No. Head
Loss (Δh)
Hydraulic Gradient
(i)
Flow Volume
(Q)
Time (t)
Flow Rate (q)
Hydraulic Conductivity
(k)
# cm L/L mL s cm3/s cm/s
1 83 6.54 500 47.98 10.42101 3.5E-02
2 83 6.54 500 47.36 10.55743 3.5E-02
3 83 6.54 500 47.5 10.52632 3.5E-02
4 83 6.54 500 47.6 10.5042 3.5E-02
Table A.12. Kentucky River Sand Hydraulic Conductivity.
MEASUREMENTS AND CALCULATIONS Kentucky River Sand Test No. Head
Loss (Δh)
Hydraulic Gradient
(i)
Flow Volume
(Q)
Time (t)
Flow Rate (q)
Hydraulic Conductivity
(k)
# cm L/L mL s cm3/s cm/s
1 122 10.67 88 809 0.108776 2.2E-04
2 122 10.67 80 630 0.126984 2.6E-04
3 122 10.67 85 657 0.129376 2.7E-04
4 122 10.67 77 680 0.113235 2.3E-04
122 10.67 60 533 0.11257 2.3E-04

79
Table A.13. Trimble County Sand Hydraulic Conductivity.
MEASUREMENTS AND CALCULATIONS Trimble County Sand Test No. Head
Loss (Δh)
Hydraulic Gradient
(i)
Flow Volume
(Q)
Time (t)
Flow Rate (q)
Hydraulic Conductivity
(k)
# cm L/L mL s cm3/s cm/s
1 106 8.42 1000 68.88 14.518 3.8E-02
2 106 8.42 1000 68.8 14.53488 3.8E-02
3 106 8.42 1000 68.65 14.56664 3.8E-02
4 106 8.42 1000 68.5 14.59854 3.8E-02
5 106 8.42 1000 69.38 14.41338 3.7E-02
Table A.14. Ohio River Sand Hydraulic Conductivity.
MEASUREMENTS AND CALCULATIONS Ohio River Sand Test No. Head
Loss (Δh)
Hydraulic Gradient
(i)
Flow Volume
(Q)
Time (t)
Flow Rate (q)
Hydraulic Conductivity
(k)
# cm L/L mL s cm3/s cm/s
1 106 8.42 1000 58.81 17.00391 4.4E-02
2 106 8.42 1000 59.93 16.68613 4.3E-02
3 106 8.42 1000 58.45 17.10864 4.4E-02
4 106 8.42 1000 59.05 16.9348 4.4E-02
Table A.15. Medium Sand Hydraulic Conductivity.
MEASUREMENTS AND CALCULATIONS Medium Sand Test No. Head
Loss (Δh)
Hydraulic Gradient
(i)
Flow Volume
(Q)
Time (t)
Flow Rate (q)
Hydraulic Conductivity
(k)
# cm L/L mL s cm3/s cm/s
1 108.4 8.61 1000 101 9.90099 2.5E-02
2 108.4 8.61 1000 101 9.90099 2.5E-02
3 108.4 8.61 1000 102 9.803922 2.5E-02

80
Appendix B
Pure Grout Testing

81
B.1 Neat Ultrafine Cement Test Results
Table B.1. Neat Grout Bleed Test Results
Water-to Cement Ratio
Cement +Water Height (in)
Cement Height (in)
Percent Bleed (%)
Study
1 6 6 0 This Study
2 5.4375 5 8 This Study
3 6.4375 4.0625 37 This Study
4 6.75 3.5625 47 This Study
1 5.0625 5.0625 0 This Study
2 6.125 5.6875 7 This Study
3 6.4375 4.125 36 This Study
4 7.3125 3.75 49 This Study
3 11.76 7.27 38 Henn (2010)
4 11.76 5.75 51 Henn (2010)
Table B.2. Neat Grout Unconfined Compressive Strength Results.
Water-to-
Cement
Ratio
Compressive
Strength
(kPa)
Study
1 5709 This Study
1.5 1323 This Study
2 577 This Study
2.5 74 This Study
0.6 14200 Henn (2010)

82
B.2 Acrylate Gel Testing
Table B.3. Temperature-Time Data at 15 Degrees Celsius and 0 Percent KFe
0.0 % KFe
Time (s)
t/tmax Temp (deg
Cels) T/T0
0 0.0 15 1.0
35 0.1 15 1.0
50 0.1 16 1.1
65 0.1 17 1.1
75 0.2 18 1.2
90 0.2 19 1.3
105 0.2 20 1.3
135 0.3 22 1.5
150 0.3 23 1.5
163 0.4 24 1.6
178 0.4 25 1.7
195 0.4 26 1.7
210 0.5 27 1.8
230 0.5 28 1.9
250 0.6 29 1.9
275 0.6 30 2.0
305 0.7 30.5 2.0
325 0.7 31 2.1
350 0.8 31.5 2.1
440 1.0 32 2.1
555 1.3 31.5 2.1
630 1.4 31 2.1

83
Table B.4. Temperature-Time Data at 15 Degrees Celsius and 0.05 Percent KFe
0.05 % KFe
Time (s)
t/tmax Temp (deg Cels)
T/T0
0 0 15 1
540 0.514286 15 1
600 0.571429 16 1.066667
620 0.590476 17 1.133333
640 0.609524 18 1.2
680 0.647619 20 1.333333
700 0.666667 21 1.4
720 0.685714 22 1.466667
740 0.704762 23 1.533333
785 0.747619 24 1.6
810 0.771429 25 1.666667
840 0.8 26 1.733333
890 0.847619 27 1.8
920 0.87619 28 1.866667
960 0.914286 29 1.933333
1050 1 29.5 1.966667
1275 1.214286 29 1.933333
1395 1.328571 28.5 1.9

84
Table B.5. Temperature-Time Data at 15 Degrees Celsius and 0.10 Percent KFe
0.1 % KFe Time
(s) t/tmax
Temp (deg Cels)
T/T0
0 0 15 1
1050 0.664557 16 1.066667
1090 0.689873 17 1.133333
1120 0.708861 18 1.2
1150 0.727848 19 1.266667
1180 0.746835 20 1.333333
1210 0.765823 21 1.4
1230 0.778481 22 1.466667
1260 0.797468 23 1.533333
1350 0.85443 26 1.733333
1400 0.886076 27 1.8
1435 0.908228 27.5 1.833333
1480 0.936709 28 1.866667
1580 1 28.5 1.9
1800 1.139241 28 1.866667
1940 1.227848 27.5 1.833333

85
Table B.6. Temperature-Time Data at 15 Degrees Celsius and 0.15 Percent KFe
0.15 % KFe
Time (s)
t/tmax Temp (deg
Cels) T/T0
0 0 15 1
1970 0.691228 15 1
2190 0.768421 15 1
2245 0.787719 16 1.066667
2310 0.810526 17 1.133333
2350 0.824561 18 1.2
2420 0.849123 19 1.266667
2460 0.863158 20 1.333333
2565 0.9 22 1.466667
2625 0.921053 23 1.533333
2715 0.952632 24.5 1.633333
2745 0.963158 25 1.666667
2850 1 25.5 1.7
3240 1.136842 25 1.666667
3435 1.205263 24.5 1.633333

86
Table B.7. Temperature-Time Data at 20 Degrees Celsius and 0 Percent KFe
0.0 % KFe
Time (s) t/tmax Temp (deg
Cels) T/T0
0 0.0 19 1.0
15 0.0 19 1.0
20 0.1 19 1.0
40 0.1 21 1.1
50 0.2 22 1.2
55 0.2 23 1.2
70 0.2 24 1.3
80 0.2 25 1.3
90 0.3 26 1.4
105 0.3 27 1.4
115 0.3 28 1.5
125 0.4 29 1.5
140 0.4 30 1.6
150 0.5 31 1.6
160 0.5 32 1.7
180 0.5 33 1.7
200 0.6 34 1.8
240 0.7 35 1.8
280 0.8 35.5 1.9
330 1.0 36 1.9
420 1.3 36 1.9
480 1.5 35.5 1.9
600 1.8 35 1.8

87
Table B.8. Temperature-Time Data at 20 Degrees Celsius and 0.05 Percent KFe
0.05 % KFe
Time (s) t/tmax Temp (deg
Cels) T/T0
0 0.0 19 1.0
210 0.3 19.5 1.0
300 0.4 20 1.1
345 0.5 21 1.1
360 0.5 22 1.2
365 0.5 23 1.2
375 0.5 24 1.3
385 0.6 25 1.3
410 0.6 27 1.4
425 0.6 28 1.5
440 0.6 29 1.5
460 0.7 31 1.6
480 0.7 32 1.7
500 0.7 33 1.7
520 0.8 33.5 1.8
540 0.8 34 1.8
600 0.9 35 1.8
690 1.0 35.5 1.9
840 1.2 35 1.8
960 1.4 34 1.8

88
Table B.9. Temperature-Time Data at 20 Degrees Celsius and 0.1 Percent KFe
0.1 % KFe
Time (s) t/tmax Temp
(deg Cels) T/T0
0 0.0 19 1.0
480 0.4 19.5 1.0
570 0.5 20 1.1
800 0.7 21 1.1
820 0.7 22 1.2
830 0.7 23 1.2
845 0.7 24 1.3
860 0.7 25 1.3
870 0.8 26 1.4
905 0.8 28 1.5
925 0.8 29 1.5
940 0.8 30 1.6
960 0.8 31 1.6
985 0.9 32 1.7
1015 0.9 33 1.7
1065 0.9 34 1.8
1155 1.0 35 1.8
1470 1.3 34 1.8
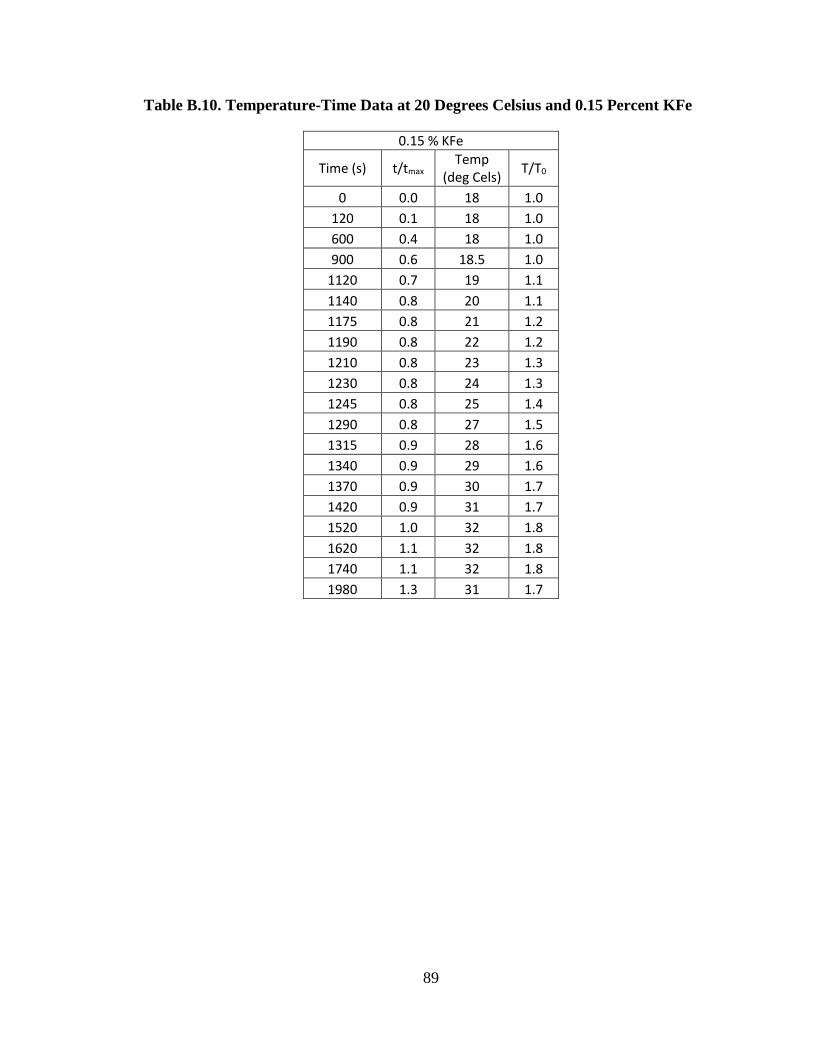
89
Table B.10. Temperature-Time Data at 20 Degrees Celsius and 0.15 Percent KFe
0.15 % KFe
Time (s) t/tmax Temp
(deg Cels) T/T0
0 0.0 18 1.0
120 0.1 18 1.0
600 0.4 18 1.0
900 0.6 18.5 1.0
1120 0.7 19 1.1
1140 0.8 20 1.1
1175 0.8 21 1.2
1190 0.8 22 1.2
1210 0.8 23 1.3
1230 0.8 24 1.3
1245 0.8 25 1.4
1290 0.8 27 1.5
1315 0.9 28 1.6
1340 0.9 29 1.6
1370 0.9 30 1.7
1420 0.9 31 1.7
1520 1.0 32 1.8
1620 1.1 32 1.8
1740 1.1 32 1.8
1980 1.3 31 1.7

90
Table B.11. Temperature-Time Data at 25 Degrees Celsius and 0 Percent KFe
0.0 % KFe
Time (s) t/tmax Temp
(deg Cels) T/T0
0 0.0 25 1.0
25 0.1 26 1.0
30 0.1 27 1.1
40 0.2 28 1.1
50 0.2 29 1.2
58 0.3 30 1.2
110 0.5 36 1.4
150 0.7 39 1.6
185 0.8 40 1.6
230 1.0 41 1.6
405 1.8 40.5 1.6
450 2.0 40 1.6

91
Table B.12. Temperature-Time Data at 25 Degrees Celsius and 0.05 Percent KFe
0.05 % KFe
Time (s) t/tmax Temp (deg
Cels) T/T0
0 0.0 25 1.0
80 0.2 25 1.0
180 0.4 25.5 1.0
240 0.5 26 1.0
250 0.5 27 1.1
265 0.6 28 1.1
325 0.7 33 1.3
350 0.7 35 1.4
365 0.8 36 1.4
380 0.8 37 1.5
405 0.8 38 1.5
435 0.9 39 1.6
450 0.9 39.5 1.6
480 1.0 40 1.6
600 1.3 40 1.6
720 1.5 40 1.6
780 1.6 39.5 1.6
820 1.7 39 1.6

92
Table B.13. Temperature-Time Data at 25 Degrees Celsius and 0.1 Percent KFe
0.1 % KFe
Time (s) t/tmax Temp (deg
Cels) T/T0
0 0.0 25 1
10 0.0 25.5 1.02
30 0.0 26 1.04
405 0.5 26.5 1.06
555 0.6 27 1.08
585 0.7 28 1.12
600 0.7 29 1.16
615 0.7 30 1.2
630 0.7 31 1.24
690 0.8 34 1.36
700 0.8 35 1.4
735 0.8 36 1.44
755 0.9 37 1.48
775 0.9 37.5 1.5
795 0.9 38 1.52
825 0.9 38.5 1.54
885 1.0 39 1.56
960 1.1 38.5 1.54
1000 1.1 38 1.52

93
Table B.14. Temperature-Time Data at 25 Degrees Celsius and 0.15 Percent KFe
0.15 % KFe
Time (s) t/tmax Temp (deg
Cels) T/T0
0 0.000 24 1.0
20 0.015 24.5 1.0
120 0.091 25 1.0
900 0.682 26 1.1
920 0.697 27 1.1
950 0.720 28 1.2
975 0.739 29 1.2
995 0.754 30 1.3
1015 0.769 31 1.3
1070 0.811 33 1.4
1120 0.848 34 1.4
1155 0.875 35 1.5
1320 1.000 36 1.5
1440 1.091 35.5 1.5
1500 1.136 35 1.5
Table B.15. Gel and Maximum Temperature Data at 15 Degrees Celsius.
15 Degrees Celsius
Concentration (%)
Starting, Atmospheric Temperature,
T0 (± 1)
Time to Reach Max Temp, tmax
Max Temp,
Deg Celc
Gel Time (min)
Gel Time (min)
Tmax/T0
0 15 440 32.0 150 2.5 2.1
0.05 15 1050 29.5 740 12.3 2.0
0.1 15 1580 28.5 1260 21.0 1.9
0.15 15 2850 27.0 2655 44.3 1.8

94
Table B.16. Gel and Maximum Temperature Data at 20 Degrees Celsius.
19 Degrees Celsius
Concentration (%)
Starting, Atmospheric Temperature,
T0 (± 1)
Time to Reach Max Temp, tmax
Max Temp,
Deg Celc
Gel Time (sec)
Gel Time (min)
Tmax/T0
0 19 330 36.0 120 2.0 1.9
0.05 19 690 35.5 380 6.3 1.9
0.1 19 1155 35.0 870 14.5 1.8
0.15 18 1520 32.0 1230 20.5 1.7
Table B.17. Gel and Maximum Temperature Data at 25 Degrees Celsius.
25 Degrees Celsius
Concentration (%)
Starting, Atmospheric Temperature,
T0 (± 1)
Time to Reach Max Temp, tmax
Max Temp,
Deg Celc
Gel Time (sec)
Gel Time (min)
Tmax/T0
0 25 230 41.0 80 1.3 1.6
0.05 25 480 40.0 315 5.3 1.6
0.1 25 885 39.0 660 11.0 1.6
0.15 24 1320 36.0 1005 16.8 1.4

95
Appendix C
Grout Procedure and Penetration Data

96
C.1 Apparatus and Procedures
The sample was transferred from apparatus to rubber sheets. To do this, first the top base
of the grout holding cell was removed. During this removal, hand pressure was used to
keep pressure adequate between the mold and o-ring on the base. Vacuum grease was
applied to the top of the mold once the top was removed. A rubber sheet was put on top
of the mold, which was supported by a piece of wood the mold was then flipped to a
position where the wood and rubber sheet are on bottom. To avoid losing grout, pressure
must be applied to the piece of wood and mold to keep contact between the mold and
rubber sheet. Typically, one hand was used to apply pressure on wood while the other
was pushing the mold into the rubber sheet. Once the mold was flipped, pressure was
kept on the mold and a rubber sheet and weight were place on top. This allowed the
sample to set.

97
Figure C.1. Grout Setting Conditions.
Capping Compound Application
Step 1: Plug in sulfur heating pot. The electrical outlet was located to the right of the pot.

98
Figure C.2. Plug in Pot.
Step 2: Turn the temperature gauge to appropriate temperature. This was located on the
side of the sulfur melting pot.
Figure C.3. Set Pot Temperature.

99
Step 3: Wait about an hour for sulfur capping compound to melt.
Figure C.4. Allow Compound to Melt.
Step 4: Assemble the mold.
Step 5: Insert the capping compound into the mold. Using the guide to keep the sample
level, place the sample into the compound. To transport the compound from the pot to the
mold, a pan can be used to keep the floor free from dripping sulfur compound. The pan
can then be cleaned by using hammering the end scraper or screw driver into the bottom
of the sulfer compound that was stuck to the pan.
Figure C.5. Pan, Hammer, and Scraper.

100
The mold will begin to set within fifteen seconds, so this must be a very smooth process.
Since it was very time-dependent, errors may be common. In case of inadequate capping,
trim the sample and do it again. Hardened excess mix was to be inserted back into pot to
be melted. The hammer and chisel can also be used to softly tap the compound to be
removed from the mold.
Figure C.6. Image of Sample Molding.
Step 5: Capping the opposite end of a cylindrical specimen may not be as
straightforward, depending on sample length. For my samples the length was not more
than the length of the guide. This can be observed in the above picture. This means the
guide cannot be used for the second end. Instead, a level was used to keep the other end
of the sample parallel to the end that was capped first.
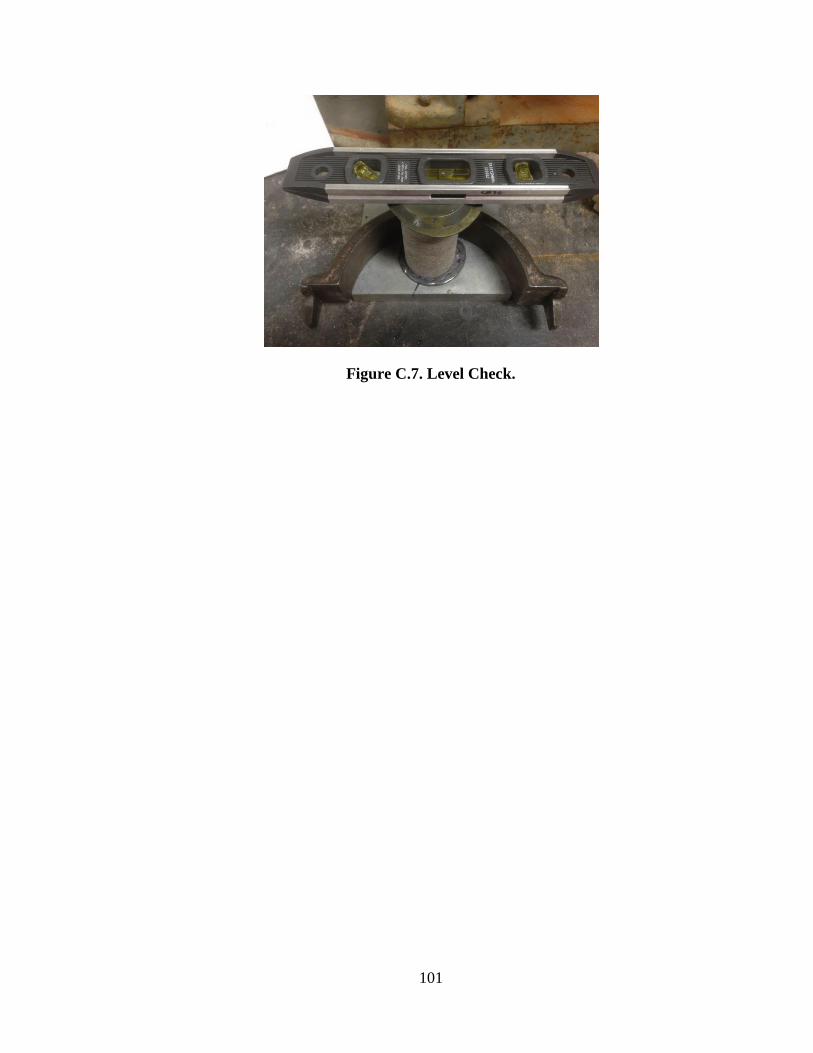
101
Figure C.7. Level Check.

102
C.2 Ultrafine Flow Data
Table C.1. Ultrafine Grout Flow Data and Associated Parameters.
Sand Name Porosity,
n
Volumetric Water
Content, θ (%)
Saturated Hydraulic
Conductivity, ksat (cm/s)
Unsaturated Hydraulic
Conductivity, kw (cm/s)
Grout Permeability
Factor
Penetration Rate (m/s)
Medium Sand 4.0E-04
Medium Sand 0.40 4.8 2.5E-02 1.2E-03 0.39 0.06
Medium Sand 0.40 9.6 2.5E-02 2.7E-03 0.90 0.05
Medium Sand 0.40 14.4 2.5E-02 5.1E-03 1.69 0.10 Ohio River
Sand 0.40 0.0 4.4E-02 8.9E-04 0.17 0.04 Ohio River
Sand 0.40 4.8 4.4E-02 4.4E-03 0.82 0.08 Ohio River
Sand 0.40 9.6 4.4E-02 1.1E-02 2.09 0.07 Ohio River
Sand 0.40 14.4 4.4E-02 2.0E-02 3.74 0.11 Hardscapes
Sand 0.40 0.0 3.5E-02 1.4E-03 0.32 0.02 Hardscapes
Sand 0.40 4.8 3.5E-02 1.4E-02 3.36 0.09 Hardscapes
Sand 0.40 9.6 3.5E-02 2.4E-02 5.68 0.09 Hardscapes
Sand 0.40 14.4 3.5E-02 3.4E-02 8.03 0.17
Trimble County 0.40 0.0 3.8E-02 7.6E-04 0.17 0.04
Trimble County 0.40 5.1 3.8E-02 2.3E-03 0.49 0.04
Trimble County 0.40 9.6 3.8E-02 5.0E-03 1.09 0.05
Trimble County 0.40 14.4 3.8E-02 9.0E-03 1.96 0.06

103
C.3 Acrylate Flow Data.
Table C.2. Acrylate Flow Data and Associated Parameters.
Sand Name
Volumetric Water
Content, θ (%)
Saturated Hydraulic
Conductivity, ksat (cm/s)
Unsaturated Hydraulic
Conductivity, kw (cm/s)
Pressure Head
(cm)
Permeability Factor
Penetration Rate (m/s)
Medium Sand 0.0 2.4E-02 4.9E-06 1055.1 0.0 0.01
Medium Sand 4.8 2.4E-02 5.3E-05
Medium Sand 9.6 2.4E-02 2.9E-04 1758.5 2.6 0.03
Medium Sand 14.4 2.4E-02 9.1E-04 1406.8 6.7 Ohio River
Sand 0.0 4.4E-02 1.4E-04 703.4 0.3 0.02
Ohio River Sand
4.8 4.4E-02 1.2E-03 703.4 2.5 0.01
Ohio River Sand
9.6 4.4E-02 3.3E-03 703.4 6.8 0.03
Ohio River Sand
14.4 4.4E-02 8.0E-03 703.4 16.5 0.04
Hardscapes Sand
0.0 3.5E-02 2.2E-05 703.4 0.1 0.03
Hardscapes Sand
4.8 3.5E-02 1.4E-03 703.4 3.5 0.02
Hardscapes Sand
9.6 3.5E-02 3.4E-03 703.4 8.7 0.03
Hardscapes Sand
14.4 3.5E-02 5.2E-03 703.4 13.5 0.07
Trimble County
0.0 3.8E-02 1.7E-06 703.4 0.0 0.02
Trimble County
4.8 3.8E-02 1.0E-04 703.4 0.2 0.01
Trimble County
9.6 3.8E-02 1.4E-04 703.4 0.3
Trimble County
14.4 3.8E-02 4.6E-04 703.4 1.1

104
Appendix D
Unconfined Compressive Strength Data

105
D.1 Ultrafine Grouted sand Unconfined Compressive Strength Data
Table D.1. Ultrafine Grouted sand Strength and Associated Data.
Sand Name Specific Surface
Area Fines
Volumetric Moisture Content
Max Strength
Normalized Compressive
Strength, qgs/qg
Name mm-1 $ θ PSI
Medium Sand 20.7 3.9 0.0 53.9 0.6
Ohio River Sand 15.1 4.3 0.0 115.5 1.4
Trimble County Sand 17.8 3.0 0.0 72.8 0.9
Hardscapes Sand 19.1 1.0 0.0 74.8 0.9
Trimble County Sand 17.8 3.0 4.8 49.0 0.6
Hardscapes Sand 19.1 1.0 4.8 38.6 0.5
Ohio River Sand 15.1 4.3 4.8 54.0 0.6
Medium Sand 20.7 3.9 4.8 50.1 0.6
Hardscapes Sand 19.1 1.0 9.6 41.4 0.5
Trimble County Sand 17.8 3.0 9.6 40.1 0.5
Ohio River Sand 15.1 4.3 9.6 31.9 0.4
Medium Sand 20.7 3.9 9.6 53.7 0.6
Medium Sand 20.7 3.9 14.4 37.0 0.4
Ohio River Sand 15.1 4.3 14.4 33.0 0.4
Hardscapes Sand 19.1 1.0 14.4 34.4 0.4
Trimble County Sand 17.8 3.0 14.4 52.4 0.6

106
Table D.2. Ultrafine Grouted sand Strength and Suction Data.
Sand Moisture Suction,Normalized
Matric Suction
Compressive Strength
Normalized Compressive
Strength
Name % kPa PSI
Medium Sand 0 1000000 1 53.9 0.6
Medium Sand 3 20000 0.02 50.1 0.6
Medium Sand 6 1100 0.0011 53.7 0.6
Medium Sand 9 120 0.00012 37.0 0.4
Trimble County Sand 0 1000000 1 72.8 0.9
Trimble County Sand 3 2000 0.002 52.3 0.6
Trimble County Sand 6 1300 0.0013 40.1 0.5
Trimble County Sand 9 170 0.00017 52.4 0.6
Ohio River Sand 0 1000000 1 115.5 1.4
Ohio River Sand 3 4000 0.004 54.0 0.6
Ohio River Sand 6 300 0.0003 31.9 0.4
Ohio River Sand 9 20 0.00002 33.0 0.4
Hardscapes Sand 0 1000000 1 75.4 0.9
Hardscapes Sand 3 270 0.00027 38.6 0.5
Hardscapes Sand 6 43 0.000043 41.4 0.5
Hardscapes Sand 9 17 0.000017 34.4 0.4

107
D.2 Acrylate Grouted sand Unconfined Compressive Strength Data
Table D.3. Acrylate Grouted sand Strength and Associated Data.
Sand Specific Surface
Area Fines
Volumetric Moisture Content
Modulus of
Elasticity
Name mm-1 $ % kPa
Medium Sand 20.66 3.9 0.0 6
Hardscapes Sand 19.11 1.0 0.0 2
Trimble County Sand 17.82 3.0 0.0 7
Ohio River Sand 15.1 4.3 0.0 2
Medium Sand 20.66 3.9 4.8
Ohio River Sand 15.1 4.3 4.8 3
Hardscapes Sand 19.11 1.0 4.8 1
Trimble County Sand 17.82 3.0 4.8 2
Medium Sand 20.66 3.9 9.6 4
Hardscapes Sand 19.11 1.0 9.6 1
Trimble County Sand 17.82 3.0 9.6 2
Ohio River Sand 15.1 4.3 9.6 2
Ohio River Sand 15.1 4.3 14.4
Hardscapes Sand 19.11 1.0 14.4 1
Trimble County Sand 17.82 3.0 14.4 1
Medium Sand 20.66 3.9 14.4 5

108
Table D.4. Ultrafine Grouted sand Strength and Suction Data.
Sand Moisture Volumetric
Water Content
Suction, Normalized
Matric Suction
Modulus of Elasticity
Name % % kPa kPa
Medium Sand 0 0.0 1000000 1 5.7
Medium Sand 3 4.8 20000 0.02
Medium Sand 6 9.6 1100 0.0011 4.2
Medium Sand 9 14.4 120 0.00012 4.8
Trimble County Sand 0 0.0 1000000 1 2.2
Trimble County Sand 3 4.8 4000 0.004 2.9
Trimble County Sand 6 9.6 300 0.0003 1.8
Trimble County Sand 9 14.4 20 0.00002
Hardscapes Sand 0 0.0 1000000 1 1.8
Hardscapes Sand 3 4.8 270 0.00027 0.8
Hardscapes Sand 6 9.6 43 0.000043 0.9
Hardscapes Sand 9 14.4 17 0.000017 0.8
Trimble County Sand 0 0.0 1000000 1 7.2
Trimble County Sand 3 4.8 2000 0.002 2.2
Trimble County Sand 6 9.6 1300 0.0013 1.5
Trimble County Sand 9 14.4 170 0.00017 1.3

109
Appendix E
Additional Information
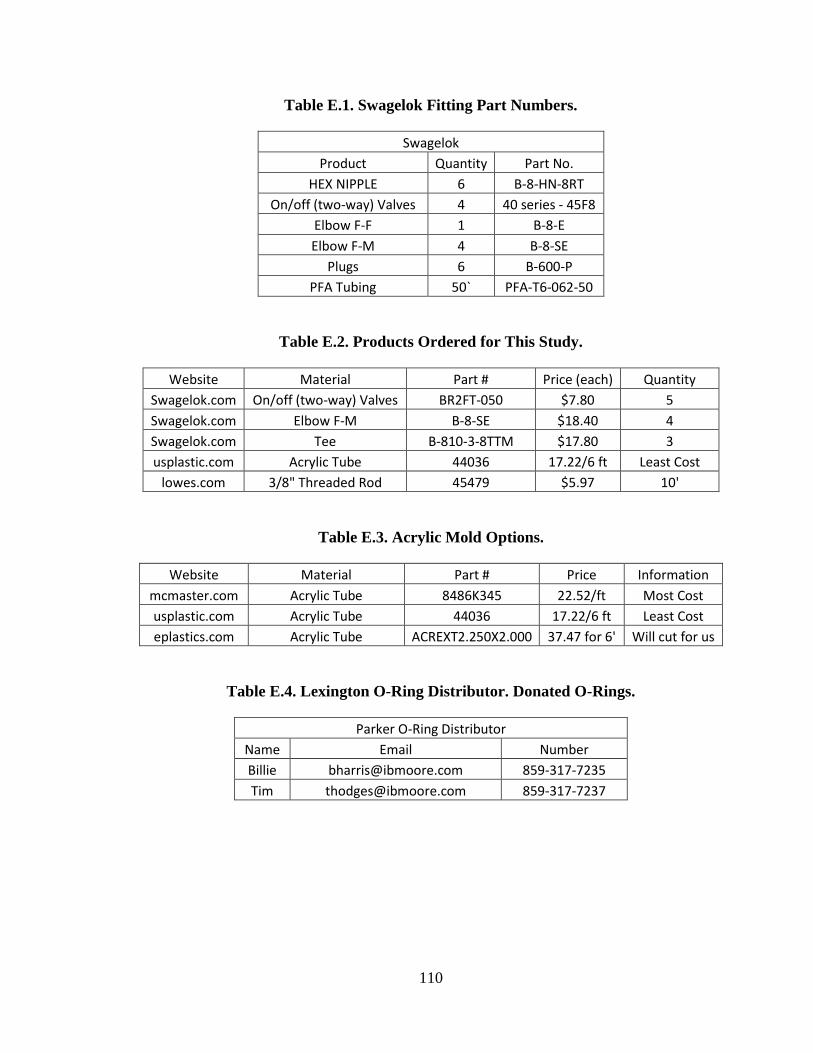
110
Table E.1. Swagelok Fitting Part Numbers.
Swagelok
Product Quantity Part No.
HEX NIPPLE 6 B-8-HN-8RT
On/off (two-way) Valves 4 40 series - 45F8
Elbow F-F 1 B-8-E
Elbow F-M 4 B-8-SE
Plugs 6 B-600-P
PFA Tubing 50` PFA-T6-062-50
Table E.2. Products Ordered for This Study.
Website Material Part # Price (each) Quantity
Swagelok.com On/off (two-way) Valves BR2FT-050 $7.80 5
Swagelok.com Elbow F-M B-8-SE $18.40 4
Swagelok.com Tee B-810-3-8TTM $17.80 3
usplastic.com Acrylic Tube 44036 17.22/6 ft Least Cost
lowes.com 3/8" Threaded Rod 45479 $5.97 10'
Table E.3. Acrylic Mold Options.
Website Material Part # Price Information
mcmaster.com Acrylic Tube 8486K345 22.52/ft Most Cost
usplastic.com Acrylic Tube 44036 17.22/6 ft Least Cost
eplastics.com Acrylic Tube ACREXT2.250X2.000 37.47 for 6' Will cut for us
Table E.4. Lexington O-Ring Distributor. Donated O-Rings.
Parker O-Ring Distributor
Name Email Number
Billie [email protected] 859-317-7235
Tim [email protected] 859-317-7237
111
References
Abraham, A. (2006). “Effect of Initial Moisture State on the Engineering Properties of
Microfine Cement Grouted Sands.” Master’s thesis, presented to University of
Alabama at Huntsville, AL in partial fulfillment of the requirements of Master of
Science
American Cyanamid. (1960). “Constructing Grout Curtain for Dam.” Technical Brief
Avanti International, Webster, TX.
Anagnostopoulos, C., and Hadjispyrou, S. (2004). “Laboratory Study of an Epoxy Resin
Grouted Sand.” Ground Improvement, 8(1), 39-45.
Avanti International. (2014A). “AV-160 SuperGel Technical Data Sheet.” AVANI
International, Webster, TX.
Avanti International. (2014B). “Potassium Ferricyanide Technical Data Sheet.” AVANI
International, Webster, TX.
Avanti Staff. (2014C). “Ultrafine Standard Technical Data Sheet.” AVANI International,
Webster, TX.
Axelsson, M. and Gustafson, G. (2007). “Grouting With High Water-Cement Ratios.”
Report No. 2007:5, Department of Civil and Environmental Engineering, Chalmers
University of Technology, Gothenburg, Sweden.
Babcock, B. (2013A). “Cement Grout vs. Chemical Grout.” Geotechnical Division World
Tunneling, June 2013, 20-21.
Babcock, B. (2013B). “Sorting Out the Grout.” Geotechnical Division World Tunneling,
June 2013, 20-21.
Bell, F. (1993). Engineering Treatment of Soils. E and F N Spon. Boundary Row,
London, UK.
Bolisetti, T., Reitsma, S., and Balachanar, R. (2009). “Experimental Investigations of
Colloidal Silica Grouting in Porous Media.” Journal of Geotechnical and
Geoenvironmental Engineering, ASCE, 135 (5) 697-700

112
Bruce, D. (1992). “Progress and Developments in Dam Rehabilitation by Grouting.”
Proc,. ASCE Special Proceedings: Grouting, Soil Improvement, and Geosynthetics.
New Orleans, LA, February 25-28 601-613
Campbell, G. (1974). “A Simple Method for Determining Unsaturated Conductivity from
Moisture Retention Data.” Soil Science, 117 (6), 311-314.
Christopher, B. R., Atmatzidis, D. K., and Krizek, R. J. (1989). “Laboratory testing of
chemically grouted sand.” Geotechnical Testing Journal, ASCE, 12(2), 109-118.
Clough, G. W., Kasali, G., and Kuck, W. (1979). “Silicate-stabilized sands.” Journal of
the Soil Mechanics and Foundations Division, 105(1), 65-82.
Dano, C., Hicher, P., and Tailliez, S. (2004). “Engineering Properties of Grouted Sands.”
Journal of Geotechnical and Geoenvironmental Engineering, ASCE, 130 (3) 38-338.
Delfosse-Ribay, E., Djeran-Maigre, I., Cabrillac, R., and Gouvenot, D. (2006). “Factors
Affecting the Creep Behavior of Grouted Sands.” Journal of Geotechnical and
Geoenvironmental Engineering, ASCE, 132(4) 488-500.
ECO. (2014). “Mount Isa Mines: Stopping Water Inflow Into Pilot Holes for Raised Bore
Using Acrylate.” ECO Grouting Specialists, Inc. Amaranth, Ontario, Canada.
Fredlund, D.G. and Xing, A. (1994). “Equations for the Soil-Water Characteristic
Curve.” Canadian Geotechnical Journal, 31(4), 521-532.
Fredlund, M. (1999). “The Role of Unsaturated Soil Property Functions in the Practice of
Unsaturated Soil Mechanics.” Doctoral Dissertation, University of Saskatchewan,
Saskatoon, Canada.
Fredlund, D. (2006). “Unsaturated Soil Mechanics in Engineering Practice.” Journal of
Geotechnical and Geoenvironmental Engineering, ASCE, 132 (3) 286-321
Fredlund, D., Rahardjo, H., and Fredlund, M. (2012). Unsaturated Soil Mechanics in
Engineering Practice. John Wiley & Sons, Inc. Hoboken, NJ.
Gallagher, P. (2000). “Passive Site Remediation for Mitigation of Liquefaction Risk.”
Doctoral Dissertation, Virginia Polytechnic Institute and State University,
Blacksburg, VA.

113
Gazaway, H., Coad, R., and Andromalos, K. (1991). “Installation of a Grout Curtain at a
Hazardous Waste Landfill.” Proc., Engineering Congress 1991, ASCE, June 10 to
12, Boulder, CO.
Gentry, J. and Magill, D. (2012). “Acrylamide Grouting: Successfully Controlling
Groundwater from Canada to South America.” Proc., Fourth International
Conference of Grouting and Deep Mixing, ASCE, February 15-18, 1562-1568
Geo-Grout. (2008). “Permeation Grouting.” San Francisco, CA
< http://www.geogroutinc.com/permeation_grouting.php>
Han, T. (2004). “Gel Time of Calcium Acrylate Grouting Material.” Journal of Zhejiang
University Science. 5 (8) 928-931.
Hazen, A. (1892) ‘‘Some physical properties of sands and gravels, with special reference
to their use in filtration.’’ 24th Annual Rep., Massachusetts State Board of Health,
Pub. Doc. No. 34, 539–556.
Henn, R. (2010) Ultrafine Cement in Pressure Grouting. American Society of Civil
Engineers, Reston, VA .
Johnson, S. J. (1958). "Cement and Clay Grouting of Foundations: Grouting with Clay
Cement.” Journal of the Soil Mechanics and Foundation Engineering Division,
ASCE, (1545), 1-12.
Jury, W. and Horton, R. (2004). Soil Physics: Sixth Addition. John Wiley & Sons, Inc.
Hobokan, NJ.
Karol, R. (2003). Chemical Grouting and Soil Stabilization: Third Edition, Revised and
Expanded. Marcel Dekker, Inc. Basel, Switzerland.
Kim, Y. and Whittle, A. (2009). “Particle Network Model for Simulating the Filtration of
a Microfine Cement Grout in Sand.” Journal of Geotechnical and Geoenvironmental
Engineering, ASCE, 135 (2), 224-236.
Krizek, R., Michel, D., Helal, M., and Borden, R. (1992). “Engineering Properties of
Acrylate Polymer Grout.” Geotechnical Special Publication, (30) 712-724.

114
Littlejohn, G. (1985). “Chemical Grouting.” Ground Engineering, 18 (2) 13-16; 18 (3)
23-28; 18 (4) 29-34.
Markou, N. and Droudakis, A. (2013). “Factors Affecting Engineering Properties of
Microfine Cement Grouted Sands.” Geotechnical and Geological Engineering, 31
(4), 1041-1058.
Mitchell, J. K. (1970). "In-place Treatment of Foundation Soils." Journal of the Soil
Mechanics and Foundation Engineering Division, ASCE, 96(1), 73-110.
Mollamahmutoglu, M. and Yilmaz, Y. (2011). “Engineering Properties of Medium-to-
Fine Sands Injected with Microfine Cement Grout.” Marine Georesources and
Geotechnology, (29) 95-109.
NAVFAC. (1983). “Dewatering and Ground Control.” P-148 Navy Facilities
Engineering Command, Washington, D. C.
Nonveiller, E. (1989). Grouting Theory and Practice. Elsevier Science Publishing
Company, Inc. New York, NY
Ozgurel, H. and Vipulanandan, C. (2005). “Effect of Grain Size and Distribution on
Permeability and Mechanical Behavior of Acrylamide Grouted Sand.” Journal of
Geotechnical and Geoenvironmental Engineering, ASCE, 131 (12), 1457-1465.
Perret, S., Khayat, K., and Ballivy, G. (2000). “The Effect of Degree of Saturation of
Sand on Groutability-Experimental Simulation.” Ground Improvement, (4), 13-22.
Persoff, P., Apps, J., Moridis, G., and Whang, J. (1999). “Effect of Dilution and
Contaminants on Sand Grouted with Colloidal Silica.” Journal of Geotechnical and
Geoenvironmental Engineering, ASCE, 125 (6), 461-469
Powers, J, Corwin, A., Schmall, P., and Kaeck, W. (2007). Construction Dewatering
and Groundwater Control, New Methods and Applications, Third edition. Wiley,
New York, NY.
Saada, C., Canou, J., Dormieux, L., and Dupla, J. (2006). “Evaluation of Elementary
Filtration Properties of Cement Grout Injected in a Sand.” Canadian Geotechnical
Journal, NRC Canada, 43 (1), 1273-1289.

115
Schiffman, R.L. and Wilson, C.R., (1958). “The Mechanical Behavior of Chemically
Treated Grouted Soils.” Conference for grout and drilling method in engineering
practice, Butterwoths, London, UK, 29-35.
Schwarz, L. and Chirumalla, M. (2007). “Effect of Injection Pressure on Permability and
Strength of Microfine Cement Grouted Sand.” Grouting for Ground Improvement
GeoDenver: 2007: New Peaks in Geotechnics. Denver, CO, February 18-21, 1-15
Scott, R. A. (1963). Grouts and drilling muds in engineering practice. Butterworths,
London, England.
Soule, N. and Henn, R. (2010). Ultrafine Cement in Pressure Grouting. American
Society of Civil Engineers Press, Reston, VA.
U.S Grout. (1999). “Ultrafine Cement Grout Seals Fissures in Salt Caverns.” Case
History, U.S.Grout, Webster, TX.
Uchikawa, H. (1994). “Ultra-Fine Cements for Special Applications.” Advanced Cement
Based Materials, 1(3) 150-154.
Vipulanandan, C. and Krizek, J. (1986). “Mechanical Behavior of Chemically Grouted
Sands.” Journal of Geotechnical Engineering, ASCE, 112 (9) 869-887
Vipulanandan, C., Ata, A., and Mebarkia, S. (1994). “Fracture Behavior of Cement
Grouted Sand.” Proc., Specialty Conference on Grouting, Soil Improvement and
Geosynthetics, ASCE, (43) 147-159.
Warner, J. (2004). Practical Handbook of Grouting: Soil, Rock, and Structures. John
Wiley & Sons, Inc. Hobokan, NJ.
Xanthakos, P., Abramson, L., and Bruce, D. (1994). Ground Control and Improvement.
John Wiley & Sons, Inc. New York, NY
Zapata, C., Houston, W., Houston, S., and Walsh, K. (1999). “Soil-Water Characteristics
Curve Variability.” Doctoral Disseration, Arizona State University, Tempe, Arizona
Zapata, C.E., Houston, W.N., Houston, S.L., & Walsh, K.D. (1999). “Soil–Water
Characteristic Curve Variability”, Department of Civil and Environmental
Engineering, Arizona State University.

116
Zebovitz, S., Krizek, R., and Atmatzidis, D. (1989). “Injection of Fine Sands with Very
Fine Cement Grout.” Journal of Geotechnical Engineering, ASCE, 115(12), 1717-
1733.

117
Vita
Ryan Ortiz was born and raised in Elizabethtown, Kentucky. He graduated from Central
Hardin High School in 2009. Ryan attended the University of Kentucky and graduated
with a Bachelor’s of Science in Civil Engineering in 2013. He obtained his Engineering
in Training (EIT) Certificate in May of 2013 in the State of Kentucky. He received
Dean’s List honors several semesters. Ryan was the recipient of the Presidential
Scholarship and the William T. Parker Scholarship. During Graduate School at UK, he
also received the Lyman T. Johnson Scholarship. Ryan is a co-author on two
publications:
Bryson, L. and Ortiz, R. (2014). “Lab-Scale Study of Ultrafine Cement Grout Curtains
Using a Physical Model.” Proc., Of Geo-Congress 2014, ASCE, Va., 3252-3261.
Bryson, L., Ortiz, R., and Leandre, J. (2014). “Effects of a Grout Curtain on Hydraulic
and Electrical Conductivity in a Laboratory-Scale Seepage Model.” Proc., Of Geo-
Congress 2014, ASCE, Va., 3233-3242.