measuring user behavior in online social networks
TRANSCRIPT

nline social networks (OSNs) change the wayhumans connect, get in touch with each other.Novel OSNs are created almost every day, butonly a few of them become popular worldwide;
most of them vanish. The success of a social network, bothshort-term and long-term, depends on the behavior of itsusers; in particular, the users’ activity has an important effecton the services.
However, users’ behavior in social networks has received littleattention so far. In particular, the activity of users and timespent on the OSN are important aspects if the value of thesocial network has to be expressed. Only the operators of theOSNs and access network operators have these data, althoughinvestors, seeding firms, and advertisers would appreciate andutilize this knowledge. In addition, developers of new social net-works can build their systems with more incentives if they mergethe properties of successful OSNs.
Based on the arguments above, understanding user behav-ior is crucial for the success of OSNs. This motivates us tocarry out an in-depth analysis to gain insights on user activityand explore the hidden properties that cause the observedbehavior. To that end, we decided to use data gathered byperforming Internet-scale measurements of some popularOSNs: MySpace, Bebo, Netlog, and Tagged. The data isobtained by processing publicly accessible user profiles with aminute as sampling time over more than six weeks. Theapplied measurement methodology has a crucial property: itdoes not require having access to the databases of the OSNoperators or being able to dump IP packets in an access net-work. Thus, our measurement settings can be named the poorman’s OSN user behavior monitor as it does not require thecooperation of an operator.
Measurement studies of online social networks have startedto build up in the last few years. Nazir et al. [1] characterize
the usage of social -network-based applications; in particular,the dynamics of number of users of three Facebook applica-tions has been analyzed. Gjoka et al. [2] analyze the usageproperties of available Facebook applications based on dailyactive users. Chun et al. [3] propose an in-depth analysis ofuser activity on Cyworld based on the number of messages lefton profile pages. In addition, they compared the graph ofinteractions with the graph of established social connections.Cha et al. [4] study user behavior in user generated contentvideo systems as the popularity of the videos and their dynam-ics are analyzed. Mislove et al. [5] analyze the topologicalproperties of OSNs based on real world measurements.Degrees of friends are studied, including verifying the scale-free metrics; furthermore, the core of the network is identi-fied, where the users are densely connected with each other.
These studies improve understanding the characteristics ofOSNs; however, the measurement of user activity on OSNshas received little attention so far. The authors of [6] argue intheir position paper that OSN research has to be user-centricand analyze the dynamic nature of OSNs. Moreover, theyrequest non-traditional OSN measurements that are able togo beyond the friendship graphs of OSNs (i.e., measurementsthat provide timing information of active users). A recentpublication presents user activity of several OSNs based onstream data of a social network aggregation site in Brazil [7].This work presents interesting results about the session timesof users based on a traditional measurement setting (i.e.,packet level traces). Using the packet traces, the authors pro-pose a clickstream model, where the behavior of users is mod-eled with a first order Markov chain. Although themeasurement is carried out using a network aggregation serv-er, the time duration of the measurement is short (i.e., only aweek). Furthermore, the users of OSNs can be classified intoseveral groups based on their usage patterns [8]. The authors
IEEE Network • September/October 201026 0890-8044/10/$25.00 © 2010 IEEE
OO
László Gyarmati and Tuan Anh Trinh, Network Economics Group, Budapest University of Technology and Economics
AbstractThe users’ role is crucial in the development, deployment and the success of onlinesocial networks. Despite this fact, little is known and even less has been publishedabout user activities in operating OSNs. In this article we present a large-scalemeasurement analysis of user behavior in some popular OSNs: Bebo, MySpace,Netlog, and Tagged. A measurement framework has been created in order toobserve user activity: more than 500 PlanetLab nodes across the globe have beenused for our measurement, monitoring more than 80,000 users for six weeks bydownloading more than 100 million profile pages. Based on the measurements,we address two key issues of online social networks: characterization of user activ-ities and usage patterns in the examined OSNs. The main findings of the articleinclude that users’ online time spending can be modeled with Weibull distributions;soon after subscribing, a fraction of users tend to lose interest surprisingly fast; andthe duration of OSN users’ online sessions shows power law distribution character-istics.
Measuring User Behavior inOnline Social Networks
GYARMATI LAYOUT 9/9/10 11:15 AM Page 26

IEEE Network • September/October 2010 27
of [9] analyzed the activity of MySpace users in terms of thetime of their last logins. The session duration and its impactsare investigated in [10, 11], where the session times of OSNslike Facebook and YouTube are analyzed based on networktraces.
The article is structured as follows. First, we describe thegoals and challenges of our measurement, and the methodolo-gy for crawling and processing the social networks. Afterward,we present an in-depth statistical analysis of user activity onOSNs. In particular, after revealing high-level statistics wepresent not only individual usage patterns but also suggestprobability distributions that approximate the session lengthsand their duration in OSN systems. Finally, we conclude thearticle.
Measurement MethodologyThis section describes the goals of our measurement by identi-fying the main challenges of Internet-scale user monitoring. Inaddition, we present what types of data have been obtained,and how we have collected and processed them.
First, we describe the non-technology-related aspects of ourmeasurement. Our research focus is the user activity on onlinesocial networks; therefore datasets that contain individual, notaggregated, online status information of OSNs’ users arerequired. The most authentic data sources are the operatorsof the OSNs as their servers log everything about the usersbehavior. Due to at least two main factors we were not able toobtain data directly from the operators of the OSNs. On theone hand, the usage patterns are very sensitive information;making them public would cause drawbacks for the companyin the competition of the OSNs. On the other hand, privacyissues may arise if an OSN operator would share the usageinformation of its subscribers. The OSNs only referred to themeasurements of comScore, which contains only averagemonthly usage data; neither individual nor dynamic user activ-ity metrics are presented in it.
Accordingly, in order to analyze the behavior of users wehad to create a measurement framework. As we do not haveaccess to network equipment where the traffic of OSN userscan be passively analyzed, we crawled the public part of users’profile pages. These profiles contain online status informa-tion; therefore, real world usage datasets are collected,instead of carrying out a survey by asking users of OSNsabout their usage habits.
The online status of users is handled differently by OSNs:some OSNs do not display status information, some OSNs dis-play it for authorized members (e.g., friends, group members,or logged-in users), and others handle it publicly if this isallowed by the user. We selected four OSNs, Bebo, MySpace,Netlog, and Tagged, where the status information is publiclyavailable. In order to create a statistical analysis of user activi-ty, the size of the sample (the monitored users) has to beselected appropriately. Furthermore, the sampling time of themeasurement has to be selected carefully because of feasibilityproblems as the time of downloading and processing a singleuser is not negligible. Because the proposed measurementmethod is an active measurement, the resources necessary toconduct the measurement are proportional to the number ofmonitored users and sampling time. On one hand, short sam-pling time results in a fine-grained dataset; however, in thiscase the number of monitored users is limited. On the otherhand, more users can be monitored applying larger samplingtimes; however, some of the behavior of the users may not bemonitored. Accordingly, we decided to monitor more than1000 users per OSN site at one-minute intervals as a trade-offof accuracy and feasibility. If a user spends less than a minute
online, it might not be identified as an online user; however,we believe this is only a minor limitation of our measurement.By monitoring users of four OSNs, common usage patternscan be discovered, and the differences of OSNs can be high-lighted.
The monitored users of the OSNs were selected randomly;the user search feature of the OSNs was used the get the useridentifiers to monitor. As several additional properties mayhave an effect on the activity of the users, we extracted notonly the uptime of the users and the time duration the userswere online, but also the number of friends, number ofembedded objects (like videos, music, and photos), and mem-bership history of the users if these were presented on theirprofile pages. Other non-measurable factors may have impactson user activity, including uncertainties of human decisions,weather, or professional activities, which we do not and can-not incorporate into our measurements.
For MySpace two kinds of measurement datasets areextracted from the profile pages. First, a detailed user activitydataset is created where the above mentioned properties aremonitored, not only the session times. This dataset containsinformation about the usage patterns of newly subscribedmembers as in MySpace random users can be searched whohave recently joined the OSN. Accordingly, for this group thebehavior of users can be monitored in a crucial time period(the first weeks). The other dataset contains only the uptimeperiods of MySpace users, but the number of monitored usersis much larger than in the other OSNs by more than an orderof magnitude. For measuring the session times of this largegroup of users we found a service of MySpace extremely use-ful: the online status of a user’s friends can be displayed on asingle page. Thus, by downloading a single page, numeroususers’ behavior can be monitored. We note that in the largerdataset the monitored users are random (i.e. not only recentlyjoined members are monitored).
We now discuss the technical aspects of our measurement,including site crawling and processing, and present our moni-toring tool. We created a profile page processing script thatrequests the profile page for a user identifier (the parameterof the script); after that it downloads the HTML source of thepage, and finally we process the tags and data in it to extractthe online status of the user and additional behavioral details.Due to the fact that each OSN site has its own uniquelydesigned profile page, site-specific profile page processingscripts had to be created. The scripts are implemented inPython programming language.
As mentioned above, 1 min was selected as sampling timein our measurement. The size of an average user profile on asocial network is around 500 kbytes, without photos and wid-gets of other Web 2.0 services. Based on our experiences, westate that the average download time of a profile page is sec-onds.
Accordingly, the monitoring of thousands of users cannotbe carried out from a single standalone machine. The volumeof the network traffic is the most important limitation factorof the methodology. Therefore, for scalability reasons we usedmore than 500 nodes of PlanetLab [12], a cluster of morethan 1000 machines, to carry out the measurement. Themachines of PlanetLab executed the processing scripts auto-matically at 1-min intervals. As PlanetLab is a global network,each Planetlab machine saved the results in GMT time formatfor consistency.
Any PlanetLab node can be out of order at any time; there-fore, we evenly distributed the users to be monitored betweenthe nodes in order to minimize the damage of an out-of-ordermachine. As a consequence, we managed to monitor the vastmajority of the selected users of the OSNs during our mea-
GYARMATI LAYOUT 9/9/10 11:15 AM Page 27

IEEE Network • September/October 201028
surement continually. To reduce the size of the datasets, westored the data of a user only if the user was online.
We illustrate the whole measurement framework in Fig. 1.First, the monitoring scripts are deployed to the PlanetLabnodes with the appropriate user identifiers. These scripts iter-atively check whether the monitored users are online. If amonitored OSN user signs in to the OSN server from its ownmachine, the OSN server displays the user’s online status onthe profile page. Therefore, the monitoring script will noticein the next minute that the user is online and save the pro-cessed usage information. Finally, at the end of the measure-ment the usage datasets are downloaded from the PlanetLabnodes and analyzed on a local machine.
The measured online times are affected by the method bywhich a user left the OSN after using it. A user can leave theOSN two different ways: sign out properly by clicking theappropriate button or simply closing its Internet browser. Inthe latter case, the session remains active until the time-outperiod of the OSN expires. Bebo applies a 30-min timeoutsession regardless of the signout method. Contrarily, MySpaceand Tagged notice immediately if a user signs out; however,they have a 20-minute session period. Netlog has the longest
session timeout (60 min); however,it displays a user logged out imme-diately if the user signs out proper-ly.
Using the described measure-ment framework, we monitoredmore than 80,000 users of fourOSNs at 1-min intervals. The mea-surement was carried out from 15March to 2 May, 2009. The pro-posed measurement methodologyhas several advantages over theusual trace-based measurements.User behavior can be monitoredwithout having access to networkequipment; thus, small researchgroups who cannot have coopera-tion with large network operatorscan carry out measurement too. Inaddition, based on the proposedframework, whole groups of userscan be monitored; if some of theusers do not access the OSNthrough the server where packet-based measurement is carried out,
the behavior of the group cannot be analyzed. The drawbackof the method is that it can only moderately measure theexact behavior of users (e.g., which page was viewed mostoften).
Measurement ResultsBased on the above mentioned measurement setup, we wereable to monitor users’ activity in OSNs. Our datasets containindividual user behavior data of more than 80,000 users; thesepersons were observed for more than six weeks. We make themeasurement datasets publicly available at [13]. We presentthe high-level statistics of the datasets in Table 1. Individualswho never logged on during the measurement are excludedfrom the current analyses.
In the four moderate sized datasets, we have observed notonly the online time periods of users but also additional indi-vidual usage patterns like the number of friends and embed-ded objects. The dataset obtained using the friends’ statusdisplaying feature of MySpace contains usage patterns of76,697 individuals (dataset called MySpace friends).
The users of MySpace were the most active, in terms of
Figure 2. Cumulative distribution function of total time.
Total time spent online (min)103100
0.25
0
Cum
ulat
ive
dist
ribu
tion
fun
ctio
n
0.5
0.75
1
104102101 105
Observed cumulative probability
Weibull P-P plot of total time spent online (MySpace)
0.0
0.2
0.0
Expe
cted
cum
ulat
ive
prob
abili
ty
0.4
0.6
0.8
1.0
0.2 0.4 0.6 0.8 1.0
BeboMySpaceNetlogTagged
Figure 1. The measurement setup.
Internet
PlanetLab node
OSN user OSN server
Measurement local machine
Post-processing script
Monitoring script
Uses the OSN
Download profile Process profile
Operates the OSN
Deploys scripts, parameters Retrieves usage data
GYARMATI LAYOUT 9/9/10 11:15 AM Page 28

IEEE Network • September/October 2010 29
average number of daily logins; however, the users of othersites have longer session times. The users in the MySpacedataset joined the OSN mainly recently. Their friends use thesite for longer times too; therefore, the behaviors of thegroups slightly diverse.
Based on the individual usage data we present the cumula-tive distribution function of time that the users have spentonline in total during the measurement (Fig. 2). We note that,for better visualization, the horizontal axis of the figure is log-arithmic. The plots of the OSN sites have similar characteris-tics; the majority of the users spent no more than a fewthousand minutes online (less than an hour daily) during thesix-week measurement period. The implication of the resultsis that human behavior can be predicted in advance; this iscrucial in terms of system design. Although the monitoredOSNs offer diverse services to their users, the usage charac-teristics are similar to each other. The engineers of newonline social networks are able to estimate the performanceof the architecture based on the revealed human usage pat-terns; therefore, the performance of the developed system willmeet the load caused by the users.
We investigated the distribution of the time usage in moredetail. We found out that Weibull distribution appropriatelydescribes the behavior of users. In particular, the online activi-ty of the so-called typical users (80 percent of users) can bedescribed realistically with Weibull distribution. In order tovisualize that the measured online times follow Weibull distri-bution, we present the PP-plot of the data in Fig. 2. The mea-surement data and the line of the Weibull distribution overlap;this implies that the performance evaluation of OSNs can bebased on Weibull distributions.
The cumulative distribution function of the OSNs revealsthe value of the server session timeouts. The vertical jumps ofthe plots shows the timeout periods, as several people usedthe OSNs only once, and hence had spent only a short timeonline. The session timeout periods of Bebo and MySpace are30 and 20 min, while at Netlog the double of the session dura-tion causes this to jump to 120 min. The implication of thisresult is that by monitoring individual users, we can reveal theknow-how of operating OSNs (i.e., the server timeout dura-tions); developers of new sites are able to deploy their infras-tructures based on these feasible parameters.
The proposed measurement framework is able to monitorthe individual behavior of users; not only aggregated resultscan be revealed with it. In order to illustrate the depth of thedatasets, we present the online activity of a selected OSN userin Fig. 3. The solid line shows the daily online time of the user(in minutes), while the dotted line illustrates the dynamics ofthe number of the user’s friends.
The user was more active in the first two weeks of measure-
ment. The fluctuation in daily usage might be an effect of thetime zones; despite the dataset using GMT times, the user isnot necessarily a resident of Europe or Africa, so continuoususage may be split into two days in the figure. Larger inter-session periods are also observed; for example the user didnot use the OSN for more than a week (around day 20); thismay be due to a long Easter holiday.
The observed individual created new friendships duringthe measurement periods. The change in the number offriends corresponds to the online activity times. Althoughthe behavior of a single user is not a representative descrip-tion of a whole system, it is surprising that, using the pro-posed simple measurement setting, quite sensitive individualinformation can be revealed. We believe that this examplehighlights that users have to be aware when they decidewhat personal information they publish on their profilepages. Moreover, the operators of OSNs have to provide athorough description of privacy issues that may arise usingtheir services.
Companies, including OSNs, are well aware of the impor-tance of customers’ loyalty regardless of the specific product.An OSN is more valuable if its users are loyal (i.e. they usethe site frequently). However, it is not always the reality. Forexample, a new user tries to use a new social network for afew days, then loses interest in it, evoking the Hungarianproverb, “Every miracle lasts three days.” This user does notgenerate profit for the OSN operators in the long term.
The loyalty of users is captured in the MySpace dataset asnewly joined individuals were observed. Figure 4 presents the
Table 1. High-level statistics of the datasets.
Dataset Bebo MySpace MySpace friends Netlog Tagged
Number of active users 706 1723 76697 1500 1657
Uptime, mean (min) 106.07 14.98 16.75 82.46 34.87
Uptime std. dev. 1475.78 9.58 10.95 67.67 22.32
Daily usage, mean (min) 30.48 26.37 53.13 68.28 77.31
Daily usage, std. dev. 79.38 51.32 208.76 136.26 95.86
Daily logins, mean 0.68 1.34 2.67 0.85 2.21
Daily logins, std. dev. 1.04 2.07 8.75 2.68 2.69
Figure 3. Individual behavior of a selected user (MySpace).
Day0
50 33
Tim
e sp
ent
onlin
e (m
in)
Num
ber of friends
100
150
0
35
38
40
30
10 20 30 40 50
GYARMATI LAYOUT 9/9/10 11:15 AM Page 29

IEEE Network • September/October 201030
number of users logged in to the OSN on a daily basis(squares). At the beginning of the measurement more than800 users were active daily; however, a fraction of them losttheir enthusiasm, the number of active users steadilydecreased, and at the end of our measurements less than 500users used the OSN daily.
There was some controversy in the measurement data ofday 31, when the number of active users suddenly raised foronly one day. This phenomena was site-specific; therefore, wedo not believe this is an effect of user behavior. However, thisjitter does not alter the usage trends.
The total daily online time of the observed population fol-lows the same trend as the number of active users: the userswho get to like the services of the OSN spent the same timeonline. The total daily usage time of the population droppedbelow 600 min from more than 1200 min. The average dailyonline time analysis affirms this observation.
The figure presents the average number of friends of theonline users too. Recently joined members of the OSNincreased the number of their friends; during our measure-ment, the average number of friends doubled over the sixweeks. Although the number of online users had an impact onthe number of friends, as can be seen on the jitter day, thetrend is obvious (e.g. comparing the data of days 20 and 42,
where almost the same number of users were online). Theimplication of the results is that operators have to developmethods that are able to maintain the curiosity of users whootherwise would not use the OSNs after a short period oftime. Without incentives a significant fraction of new usersleave the OSNs; accordingly, the revenue of OSN operatorsdecreases notably.
Although the analyzed OSNs offer diverse services to theirmembers, the behaviors of users are similar regardless of thespecific system. The session time of the users follows the samedistribution for the OSNs. The frequency of session times ispresented in Fig. 5 where both axes are logarithmic. The plotsshow the characteristics of user behavior in Tagged and MyS-pace.
The session lengths follow power law distributions, as bothplots are linear on the log-log scale. More specifically, the fig-ures show the sum of two power law distributions (i.e., thereare two straight lines in the figure).
The change between the distributions is an effect of thesession timeout settings of the servers. The settings of theservers can be seen on the plots: the jump in the middle per-fectly matches the measured session timeouts. The users whoproperly sign out from the OSNs can have sessions that areshorter than the timeout period. These logins create the firstpower law distribution, while the remaining sessions are thesum of the two different signout methods. The tail of the dis-tributions can be modeled with power law distributions withR-square values of 0.9402 and 0.9619 (95 percent of confi-dence bounds).
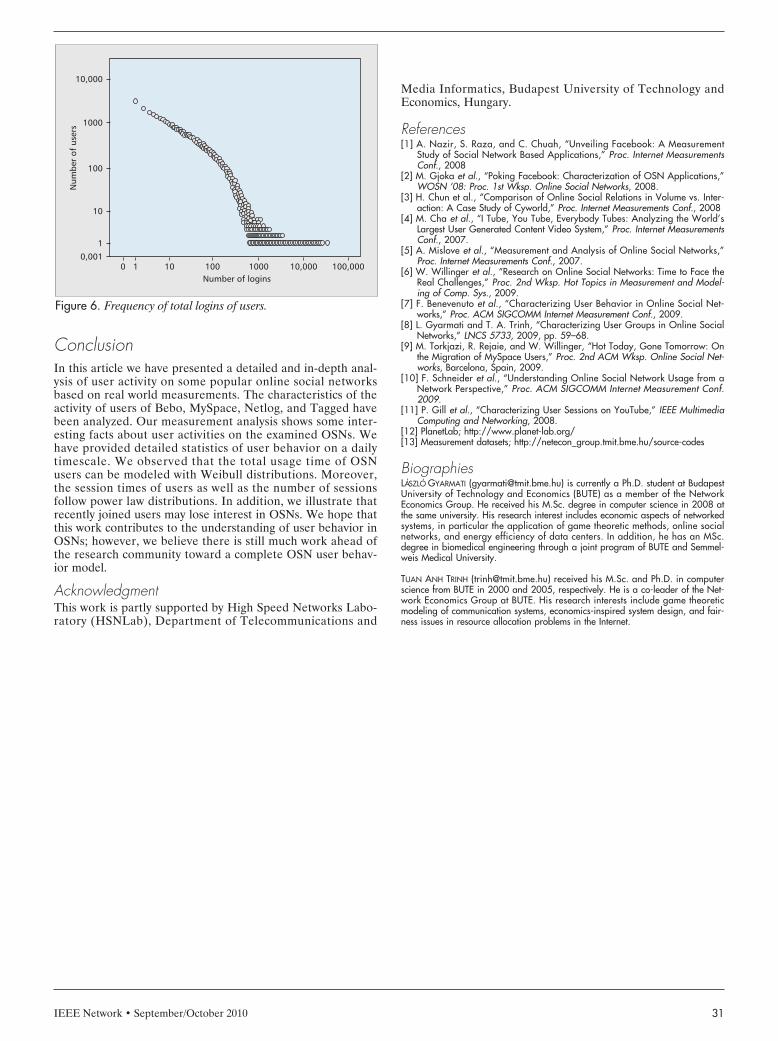
Finally, we present findings about the login behavior ofusers. We present the total number of logins of the users inFig. 6. The figure has logarithmic axes; therefore, the loginintensity shows power law characteristics. Similarly to the ses-sion length, the distribution of the number of logins is a sumof two power law distributions. As a consequence, it has twostrait lines connected by a slope in the logarithmic scaled fig-ure. The R-square value of the fitting is 0.9058 with 95 per-cent confidence bounds; therefore, power law distributiondescribes the measured data well.
Understanding the distribution of login intensity as well assession periods has a significant impact on the design andoperation methods of OSNs. Based on the findings, the ser-vices can be offered efficiently from both the economic andtechnical points of view.
Figure 4. Trends in user behavior.
Day0
40
Ave
rage
num
ber
of f
rien
ds Num
ber of online users
30 400
50
60
70
80
500
600
700
800
900
10 20 30 40 50
Figure 5. Frequency of session periods: a) Tagged; b) MySpace.
Time spent online (min)
(a)
1
1
Num
ber
of c
ases
0
10
100
1000
10,000
100,000
00 10 100 1000 10,000Time spent online (min)
(b)
1
1
Num
ber
of c
ases
0
10
100
1000
10,000
100,000
10 100 1000 10,0000 0
GYARMATI LAYOUT 9/9/10 11:15 AM Page 30
IEEE Network • September/October 2010 31
ConclusionIn this article we have presented a detailed and in-depth anal-ysis of user activity on some popular online social networksbased on real world measurements. The characteristics of theactivity of users of Bebo, MySpace, Netlog, and Tagged havebeen analyzed. Our measurement analysis shows some inter-esting facts about user activities on the examined OSNs. Wehave provided detailed statistics of user behavior on a dailytimescale. We observed that the total usage time of OSNusers can be modeled with Weibull distributions. Moreover,the session times of users as well as the number of sessionsfollow power law distributions. In addition, we illustrate thatrecently joined users may lose interest in OSNs. We hope thatthis work contributes to the understanding of user behavior inOSNs; however, we believe there is still much work ahead ofthe research community toward a complete OSN user behav-ior model.
AcknowledgmentThis work is partly supported by High Speed Networks Labo-ratory (HSNLab), Department of Telecommunications and
Media Informatics, Budapest University of Technology andEconomics, Hungary.
References[1] A. Nazir, S. Raza, and C. Chuah, “Unveiling Facebook: A Measurement
Study of Social Network Based Applications,” Proc. Internet MeasurementsConf., 2008
[2] M. Gjoka et al., “Poking Facebook: Characterization of OSN Applications,”WOSN ’08: Proc. 1st Wksp. Online Social Networks, 2008.
[3] H. Chun et al., “Comparison of Online Social Relations in Volume vs. Inter-action: A Case Study of Cyworld,” Proc. Internet Measurements Conf., 2008
[4] M. Cha et al., “I Tube, You Tube, Everybody Tubes: Analyzing the World’sLargest User Generated Content Video System,” Proc. Internet MeasurementsConf., 2007.
[5] A. Mislove et al., “Measurement and Analysis of Online Social Networks,”Proc. Internet Measurements Conf., 2007.
[6] W. Willinger et al., “Research on Online Social Networks: Time to Face theReal Challenges,” Proc. 2nd Wksp. Hot Topics in Measurement and Model-ing of Comp. Sys., 2009.
[7] F. Benevenuto et al., “Characterizing User Behavior in Online Social Net-works,” Proc. ACM SIGCOMM Internet Measurement Conf., 2009.
[8] L. Gyarmati and T. A. Trinh, “Characterizing User Groups in Online SocialNetworks,” LNCS 5733, 2009, pp. 59–68.
[9] M. Torkjazi, R. Rejaie, and W. Willinger, “Hot Today, Gone Tomorrow: Onthe Migration of MySpace Users,” Proc. 2nd ACM Wksp. Online Social Net-works, Barcelona, Spain, 2009.
[10] F. Schneider et al., “Understanding Online Social Network Usage from aNetwork Perspective,” Proc. ACM SIGCOMM Internet Measurement Conf.2009.
[11] P. Gill et al., “Characterizing User Sessions on YouTube,” IEEE MultimediaComputing and Networking, 2008.
[12] PlanetLab; http://www.planet-lab.org/[13] Measurement datasets; http://netecon_group.tmit.bme.hu/source-codes
BiographiesLA’SZLO’ GYARMATI ([email protected]) is currently a Ph.D. student at BudapestUniversity of Technology and Economics (BUTE) as a member of the NetworkEconomics Group. He received his M.Sc. degree in computer science in 2008 atthe same university. His research interest includes economic aspects of networkedsystems, in particular the application of game theoretic methods, online socialnetworks, and energy efficiency of data centers. In addition, he has an MSc.degree in biomedical engineering through a joint program of BUTE and Semmel-weis Medical University.
TUAN ANH TRINH ([email protected]) received his M.Sc. and Ph.D. in computerscience from BUTE in 2000 and 2005, respectively. He is a co-leader of the Net-work Economics Group at BUTE. His research interests include game theoreticmodeling of communication systems, economics-inspired system design, and fair-ness issues in resource allocation problems in the Internet.
Figure 6. Frequency of total logins of users.
Number of logins1
1
Num
ber
of u
sers
0,001
10
100
1000
10,000
0 10 100 1000 100,00010,000
GYARMATI LAYOUT 9/9/10 11:15 AM Page 31