measuring sub‐seabottom seismic velocities — some unusual
TRANSCRIPT

MEASURING SUB-SEABOTTOM SEISMIC VELOCITIES - SOME UNUSUAL EXPERIMENTS
James A. Hunter, Geological Survey of Canada, Ottawa, Ontario, Canada SusanE. Pullan, Geological Survey of Canada, Ottawa, Ontario, Canada
Ron L.Good, Geological Survey of Canada, Ottawa, Ontario, Canada Robert A. Burns, Geological Survey of Canada, Ottawa, Ontario, Canada Marten Douma, Geological Survey of Canada, Ottawa, Ontario, Canada
Richard D. Miller, Kansas Geological Survey, Lawrence, KS Choon B. Park, Kansas Geological Survey, Lawrence, KS
Jianghai Xia, Kansas Geological Survey, Lawrence, KS
Abstract During the last 30 years, we have performed a number of unusual experiments to measure P- and S-
wave velocity structure of unconsolidated sediments below the seafloor at sites to water depths of 700 m. These experiments were designed to aid in specific geotechnical problems related to soil stability along pipeline routes or beneath bottom-founded structures as well as to provide regional information for military purposes. Some of these experiments were done in open-water conditions, but many were performed beneath ice-cover.
Early testing was directed towards mapping sub-seafloor ice-bonded permafrost in the Beaufort Sea and elsewhere in the Arctic Archipelago, mainly using dynamite sources. Continuous ice-cover at high latitudes presented specific challenges for refraction methods and various devices and hydrophone arrays were designed for deployment beneath the sea-ice through open leads or drilled holes. Later testing evolved from seabottom-laid hydrophones to towed, near-bottom arrays and non-dynamite sources. As well, mapping of shear wave velocity structure was tested using seabottom coupled interface waves.
All of these experiments (successful or otherwise) were learning experiences in one form or other, and it is hoped that documentation of these experiments herein will be of some future research value.
First Attempts
The Terrain Geophysics group of the Geological Survey of Canada (GSC) first began making
measurements of seabottom sediments as part of a program to study the seismic properties of permafrost in the early 1970s. The program was focussed on the Mackenzie River and Delta areas of the western Beaufort Sea. At that time, it was thought that ice-bearing permafrost extended beneath the shores of the Arctic Ocean only for a short distance offshore, since the seabottom was under the influence of warm Mackenzie River water. Indeed, the prevailing thought was that near-shore shallow waters throughout the Canadian Arctic Archipelago would not promote the growth or preservation of ice-bearing permafrost. Even where near-shore waters were below 0 degrees Centigrade in summer time along shorelines not under the influence of surface runoff, seawater salinity would preclude the formation of ice in the bottom sediments. Onshore in the western Arctic, we had applied standard refraction profiling techniques to measure the P-wave velocity variations of ice-bearing Pleistocene-age sediments, using the velocity values to attempt estimates of ice content (Hunter, 1973a). Our first attempts at velocity measurements in the
370
Dow
nloa
ded
07/0
3/14
to 1
29.2
37.1
43.1
6. R
edis
trib
utio
n su
bjec
t to
SEG
lice
nse
or c
opyr
ight
; see
Ter
ms
of U
se a
t http
://lib
rary
.seg
.org
/

offshore, were, in a sense, nothing more than extending our existing seismic refraction technology to the shallow water areas (Hunter and Hobson, 1974a,b).
To do that, we replaced our geophones with individual hydrophones connected to a so-called ‘bay’ cable, a double-jacketed, multi-strand seismic cable with water-tight connectors at 50 ft (15 m) spacings. The hydrophones were attached to 1.5 meter leads so that they could dangle at a set distance below the cable and would have sufficient water pressure for full response. To float the cable, and to insure that the hydrophones were at the same level, we used small buoys, one per channel. In some cases, where the water depth was quite shallow, the hydrophones were taped back to the bay cable and the array was laid on the seabottom (Hunter 1973b).
In those days, engineering seismographs were 12 channel analog units with paper records as the only hard copy of the seismic traces. As you can imagine, these paper records were mini-treasures and were carefully documented and stored for transport.
The seismic sources used for such near-shore work were exclusively small dynamite charges, floated at the same depth as the hydrophones. Fortunately onshore seismic exploration was being undertaken at that time in the Mackenzie River Delta, and there was no lack of supply of seismic explosives or seismocaps in this relatively remote arctic area. The one drawback was the minimum size of the available dynamite sticks, usually 5 or 10 lbs; since our refraction work required usually a charge of only 0.5 to 1 lb, cutting and dicing of large sticks of dynamite was a daily occurrence, with the usual ‘powder-head’ headaches associated with handling nitro-glycerine gel.
Figure 1a shows a schematic of the near shore refraction operations, along with an example single-ended seismic refraction record (Fig. 1b) showing a break-over to a high velocity layer beneath the seabottom. Indeed, as predicted, these refraction results showed the ice-bearing permafrost surface to be dropping off to considerable depths at some distance offshore (Fig. 1c). Finally there would be a point where the refractor could no longer be identified within the limitations of the array geometry (Fig 1c).
Figure 1. a) Single-ended reconnaissance refraction survey using a floating bay cable to map the top of permafrost in the Mackenzie Delta - Beaufort Sea coastal zone.
371
Dow
nloa
ded
07/0
3/14
to 1
29.2
37.1
43.1
6. R
edis
trib
utio
n su
bjec
t to
SEG
lice
nse
or c
opyr
ight
; see
Ter
ms
of U
se a
t http
://lib
rary
.seg
.org
/
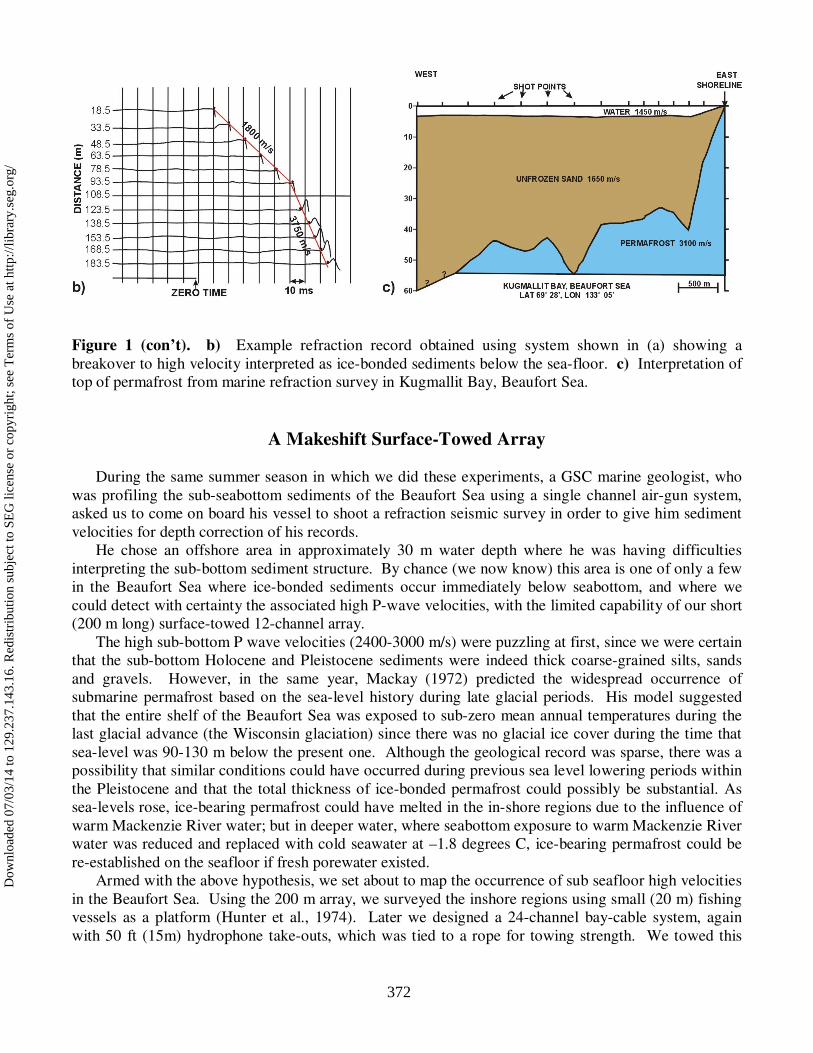
Figure 1 (con’t). b) Example refraction record obtained using system shown in (a) showing a breakover to high velocity interpreted as ice-bonded sediments below the sea-floor. c) Interpretation of top of permafrost from marine refraction survey in Kugmallit Bay, Beaufort Sea.
A Makeshift Surface-Towed Array
During the same summer season in which we did these experiments, a GSC marine geologist, who was profiling the sub-seabottom sediments of the Beaufort Sea using a single channel air-gun system, asked us to come on board his vessel to shoot a refraction seismic survey in order to give him sediment velocities for depth correction of his records.
He chose an offshore area in approximately 30 m water depth where he was having difficulties interpreting the sub-bottom sediment structure. By chance (we now know) this area is one of only a few in the Beaufort Sea where ice-bonded sediments occur immediately below seabottom, and where we could detect with certainty the associated high P-wave velocities, with the limited capability of our short (200 m long) surface-towed 12-channel array.
The high sub-bottom P wave velocities (2400-3000 m/s) were puzzling at first, since we were certain that the sub-bottom Holocene and Pleistocene sediments were indeed thick coarse-grained silts, sands and gravels. However, in the same year, Mackay (1972) predicted the widespread occurrence of submarine permafrost based on the sea-level history during late glacial periods. His model suggested that the entire shelf of the Beaufort Sea was exposed to sub-zero mean annual temperatures during the last glacial advance (the Wisconsin glaciation) since there was no glacial ice cover during the time that sea-level was 90-130 m below the present one. Although the geological record was sparse, there was a possibility that similar conditions could have occurred during previous sea level lowering periods within the Pleistocene and that the total thickness of ice-bonded permafrost could possibly be substantial. As sea-levels rose, ice-bearing permafrost could have melted in the in-shore regions due to the influence of warm Mackenzie River water; but in deeper water, where seabottom exposure to warm Mackenzie River water was reduced and replaced with cold seawater at –1.8 degrees C, ice-bearing permafrost could be re-established on the seafloor if fresh porewater existed.
Armed with the above hypothesis, we set about to map the occurrence of sub seafloor high velocities in the Beaufort Sea. Using the 200 m array, we surveyed the inshore regions using small (20 m) fishing vessels as a platform (Hunter et al., 1974). Later we designed a 24-channel bay-cable system, again with 50 ft (15m) hydrophone take-outs, which was tied to a rope for towing strength. We towed this
372
Dow
nloa
ded
07/0
3/14
to 1
29.2
37.1
43.1
6. R
edis
trib
utio
n su
bjec
t to
SEG
lice
nse
or c
opyr
ight
; see
Ter
ms
of U
se a
t http
://lib
rary
.seg
.org
/
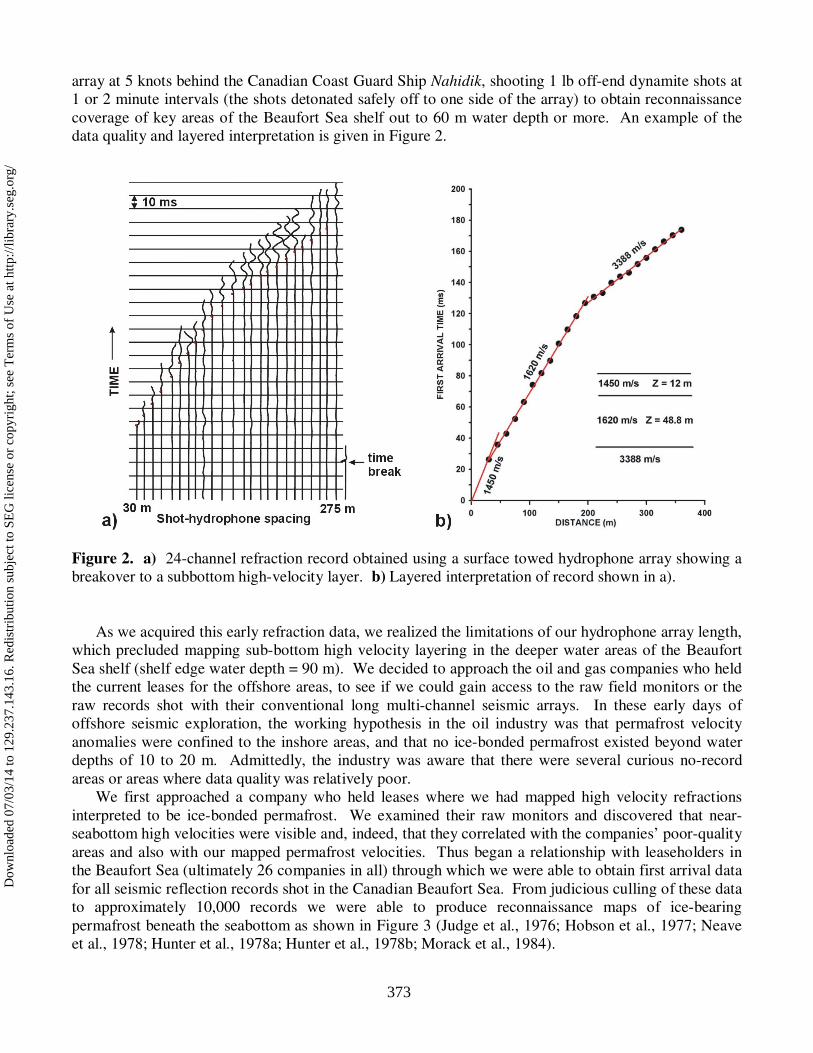
array at 5 knots behind the Canadian Coast Guard Ship Nahidik, shooting 1 lb off-end dynamite shots at 1 or 2 minute intervals (the shots detonated safely off to one side of the array) to obtain reconnaissance coverage of key areas of the Beaufort Sea shelf out to 60 m water depth or more. An example of the data quality and layered interpretation is given in Figure 2.
Figure 2. a) 24-channel refraction record obtained using a surface towed hydrophone array showing a breakover to a subbottom high-velocity layer. b) Layered interpretation of record shown in a).
As we acquired this early refraction data, we realized the limitations of our hydrophone array length, which precluded mapping sub-bottom high velocity layering in the deeper water areas of the Beaufort Sea shelf (shelf edge water depth = 90 m). We decided to approach the oil and gas companies who held the current leases for the offshore areas, to see if we could gain access to the raw field monitors or the raw records shot with their conventional long multi-channel seismic arrays. In these early days of offshore seismic exploration, the working hypothesis in the oil industry was that permafrost velocity anomalies were confined to the inshore areas, and that no ice-bonded permafrost existed beyond water depths of 10 to 20 m. Admittedly, the industry was aware that there were several curious no-record areas or areas where data quality was relatively poor.
We first approached a company who held leases where we had mapped high velocity refractions interpreted to be ice-bonded permafrost. We examined their raw monitors and discovered that near-seabottom high velocities were visible and, indeed, that they correlated with the companies’ poor-quality areas and also with our mapped permafrost velocities. Thus began a relationship with leaseholders in the Beaufort Sea (ultimately 26 companies in all) through which we were able to obtain first arrival data for all seismic reflection records shot in the Canadian Beaufort Sea. From judicious culling of these data to approximately 10,000 records we were able to produce reconnaissance maps of ice-bearing permafrost beneath the seabottom as shown in Figure 3 (Judge et al., 1976; Hobson et al., 1977; Neave et al., 1978; Hunter et al., 1978a; Hunter et al., 1978b; Morack et al., 1984).
373
Dow
nloa
ded
07/0
3/14
to 1
29.2
37.1
43.1
6. R
edis
trib
utio
n su
bjec
t to
SEG
lice
nse
or c
opyr
ight
; see
Ter
ms
of U
se a
t http
://lib
rary
.seg
.org
/
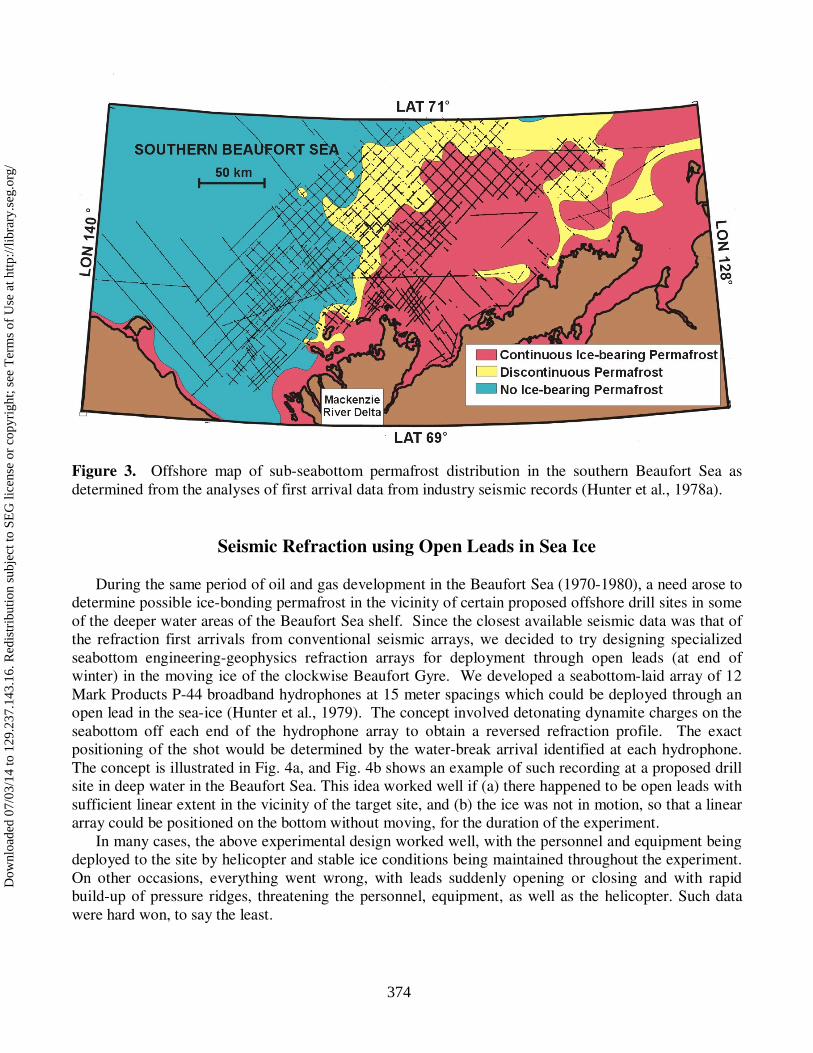
Figure 3. Offshore map of sub-seabottom permafrost distribution in the southern Beaufort Sea as determined from the analyses of first arrival data from industry seismic records (Hunter et al., 1978a).
Seismic Refraction using Open Leads in Sea Ice
During the same period of oil and gas development in the Beaufort Sea (1970-1980), a need arose to determine possible ice-bonding permafrost in the vicinity of certain proposed offshore drill sites in some of the deeper water areas of the Beaufort Sea shelf. Since the closest available seismic data was that of the refraction first arrivals from conventional seismic arrays, we decided to try designing specialized seabottom engineering-geophysics refraction arrays for deployment through open leads (at end of winter) in the moving ice of the clockwise Beaufort Gyre. We developed a seabottom-laid array of 12 Mark Products P-44 broadband hydrophones at 15 meter spacings which could be deployed through an open lead in the sea-ice (Hunter et al., 1979). The concept involved detonating dynamite charges on the seabottom off each end of the hydrophone array to obtain a reversed refraction profile. The exact positioning of the shot would be determined by the water-break arrival identified at each hydrophone. The concept is illustrated in Fig. 4a, and Fig. 4b shows an example of such recording at a proposed drill site in deep water in the Beaufort Sea. This idea worked well if (a) there happened to be open leads with sufficient linear extent in the vicinity of the target site, and (b) the ice was not in motion, so that a linear array could be positioned on the bottom without moving, for the duration of the experiment.
In many cases, the above experimental design worked well, with the personnel and equipment being deployed to the site by helicopter and stable ice conditions being maintained throughout the experiment. On other occasions, everything went wrong, with leads suddenly opening or closing and with rapid build-up of pressure ridges, threatening the personnel, equipment, as well as the helicopter. Such data were hard won, to say the least.
374
Dow
nloa
ded
07/0
3/14
to 1
29.2
37.1
43.1
6. R
edis
trib
utio
n su
bjec
t to
SEG
lice
nse
or c
opyr
ight
; see
Ter
ms
of U
se a
t http
://lib
rary
.seg
.org
/
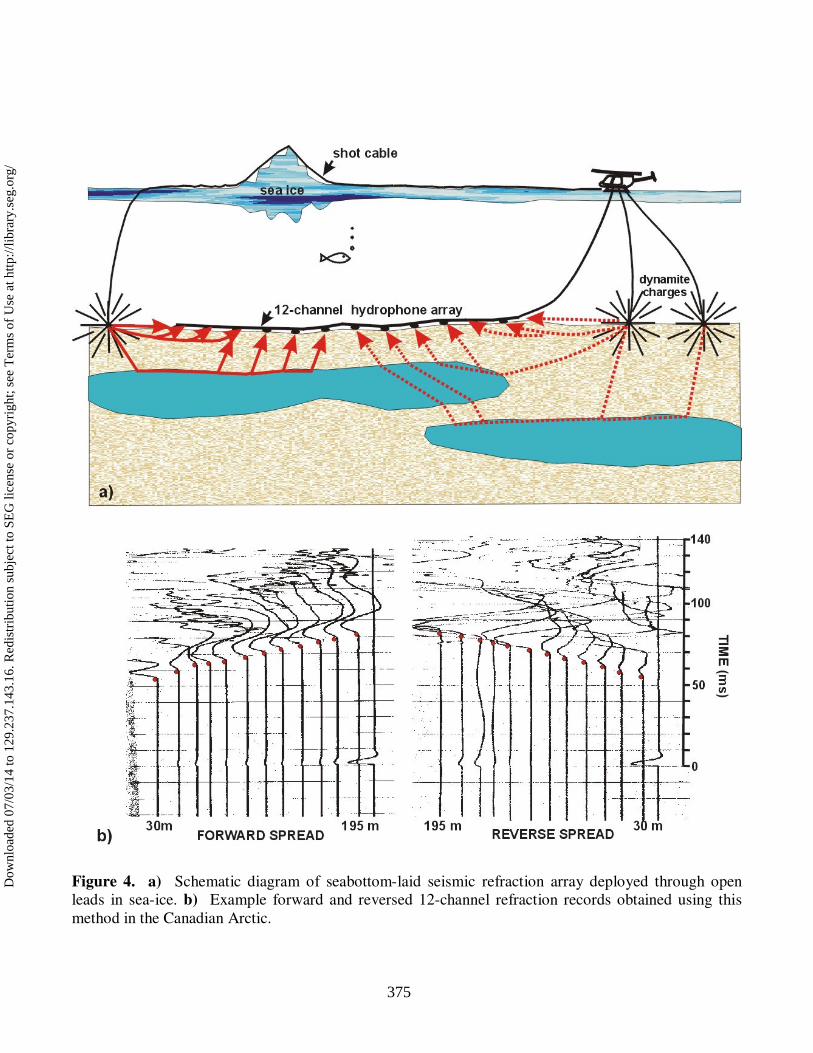
Figure 4. a) Schematic diagram of seabottom-laid seismic refraction array deployed through open leads in sea-ice. b) Example forward and reversed 12-channel refraction records obtained using this method in the Canadian Arctic.
375
Dow
nloa
ded
07/0
3/14
to 1
29.2
37.1
43.1
6. R
edis
trib
utio
n su
bjec
t to
SEG
lice
nse
or c
opyr
ight
; see
Ter
ms
of U
se a
t http
://lib
rary
.seg
.org
/
Seabottom Measurements through Thick Ice Cover
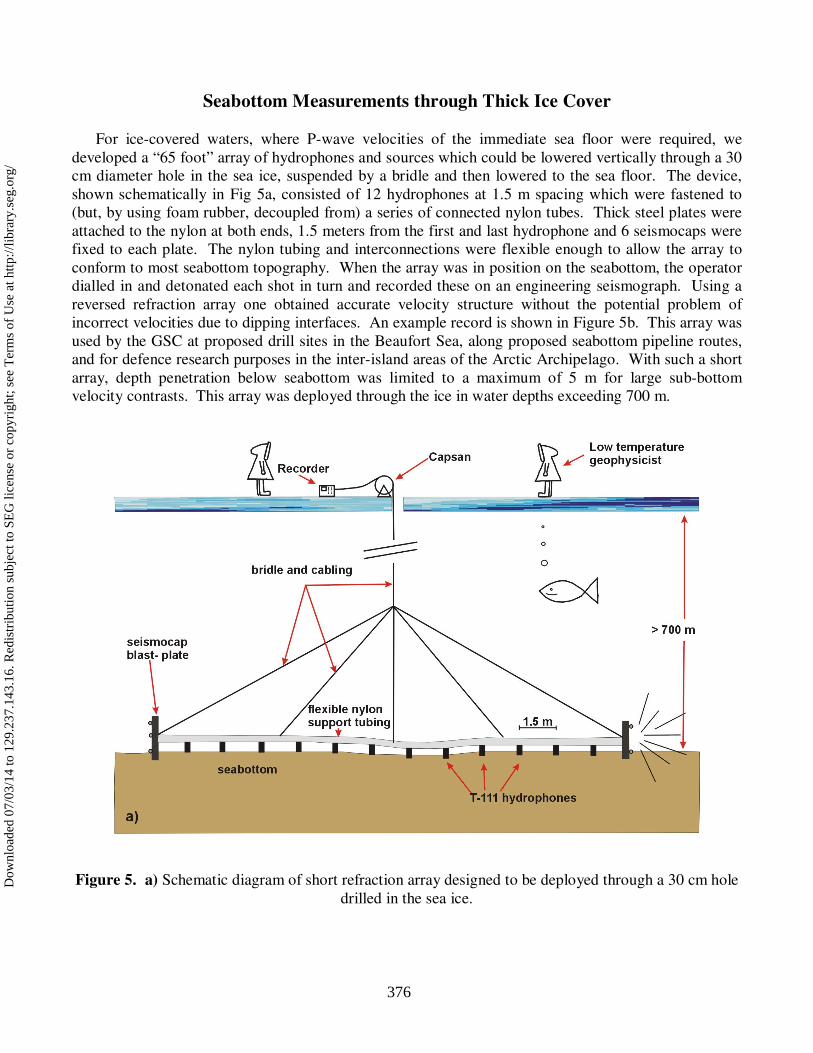
For ice-covered waters, where P-wave velocities of the immediate sea floor were required, we
developed a “65 foot” array of hydrophones and sources which could be lowered vertically through a 30 cm diameter hole in the sea ice, suspended by a bridle and then lowered to the sea floor. The device, shown schematically in Fig 5a, consisted of 12 hydrophones at 1.5 m spacing which were fastened to (but, by using foam rubber, decoupled from) a series of connected nylon tubes. Thick steel plates were attached to the nylon at both ends, 1.5 meters from the first and last hydrophone and 6 seismocaps were fixed to each plate. The nylon tubing and interconnections were flexible enough to allow the array to conform to most seabottom topography. When the array was in position on the seabottom, the operator dialled in and detonated each shot in turn and recorded these on an engineering seismograph. Using a reversed refraction array one obtained accurate velocity structure without the potential problem of incorrect velocities due to dipping interfaces. An example record is shown in Figure 5b. This array was used by the GSC at proposed drill sites in the Beaufort Sea, along proposed seabottom pipeline routes, and for defence research purposes in the inter-island areas of the Arctic Archipelago. With such a short array, depth penetration below seabottom was limited to a maximum of 5 m for large sub-bottom velocity contrasts. This array was deployed through the ice in water depths exceeding 700 m.
Figure 5. a) Schematic diagram of short refraction array designed to be deployed through a 30 cm hole
drilled in the sea ice.
376
Dow
nloa
ded
07/0
3/14
to 1
29.2
37.1
43.1
6. R
edis
trib
utio
n su
bjec
t to
SEG
lice
nse
or c
opyr
ight
; see
Ter
ms
of U
se a
t http
://lib
rary
.seg
.org
/
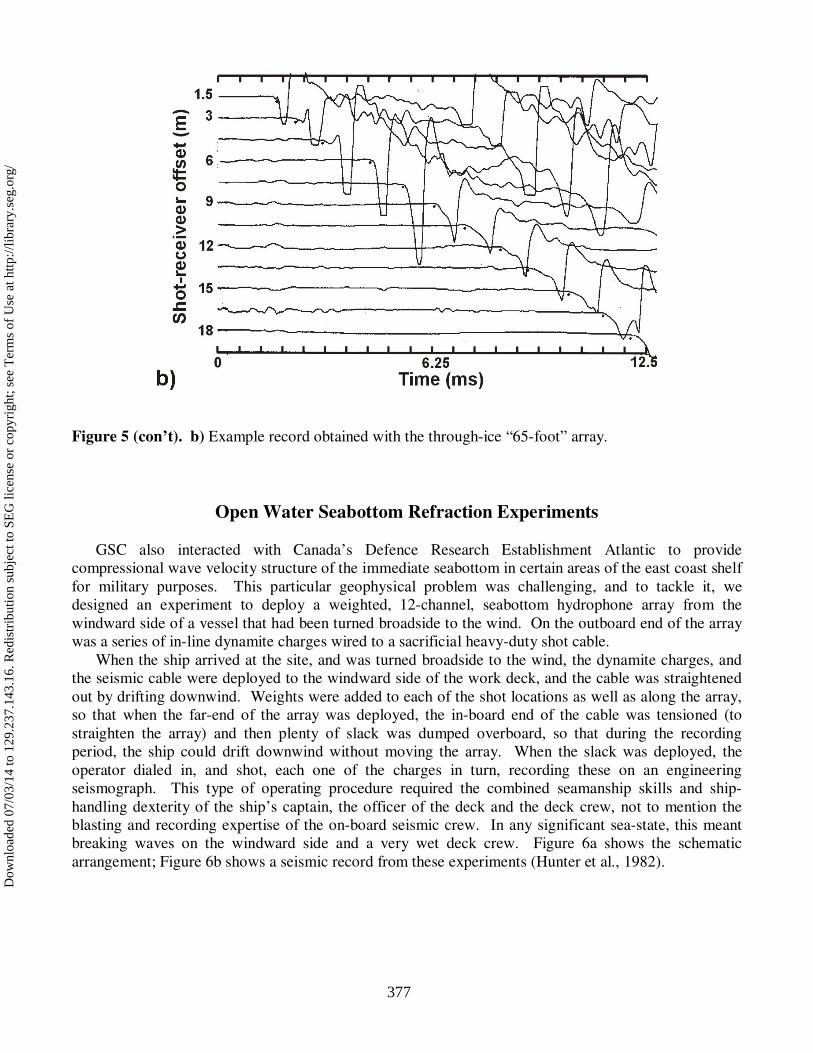
Figure 5 (con’t). b) Example record obtained with the through-ice “65-foot” array.
Open Water Seabottom Refraction Experiments
GSC also interacted with Canada’s Defence Research Establishment Atlantic to provide compressional wave velocity structure of the immediate seabottom in certain areas of the east coast shelf for military purposes. This particular geophysical problem was challenging, and to tackle it, we designed an experiment to deploy a weighted, 12-channel, seabottom hydrophone array from the windward side of a vessel that had been turned broadside to the wind. On the outboard end of the array was a series of in-line dynamite charges wired to a sacrificial heavy-duty shot cable.
When the ship arrived at the site, and was turned broadside to the wind, the dynamite charges, and the seismic cable were deployed to the windward side of the work deck, and the cable was straightened out by drifting downwind. Weights were added to each of the shot locations as well as along the array, so that when the far-end of the array was deployed, the in-board end of the cable was tensioned (to straighten the array) and then plenty of slack was dumped overboard, so that during the recording period, the ship could drift downwind without moving the array. When the slack was deployed, the operator dialed in, and shot, each one of the charges in turn, recording these on an engineering seismograph. This type of operating procedure required the combined seamanship skills and ship-handling dexterity of the ship’s captain, the officer of the deck and the deck crew, not to mention the blasting and recording expertise of the on-board seismic crew. In any significant sea-state, this meant breaking waves on the windward side and a very wet deck crew. Figure 6a shows the schematic arrangement; Figure 6b shows a seismic record from these experiments (Hunter et al., 1982).
377
Dow
nloa
ded
07/0
3/14
to 1
29.2
37.1
43.1
6. R
edis
trib
utio
n su
bjec
t to
SEG
lice
nse
or c
opyr
ight
; see
Ter
ms
of U
se a
t http
://lib
rary
.seg
.org
/
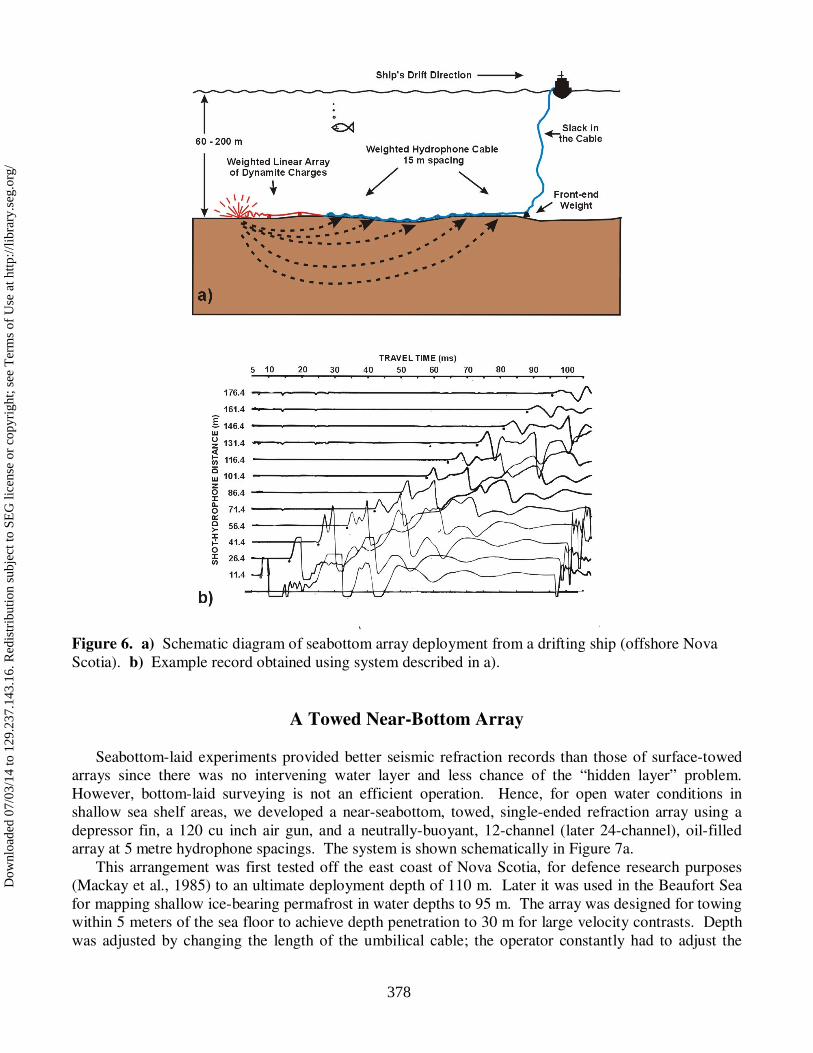
Figure 6. a) Schematic diagram of seabottom array deployment from a drifting ship (offshore Nova Scotia). b) Example record obtained using system described in a).
A Towed Near-Bottom Array
Seabottom-laid experiments provided better seismic refraction records than those of surface-towed arrays since there was no intervening water layer and less chance of the “hidden layer” problem. However, bottom-laid surveying is not an efficient operation. Hence, for open water conditions in shallow sea shelf areas, we developed a near-seabottom, towed, single-ended refraction array using a depressor fin, a 120 cu inch air gun, and a neutrally-buoyant, 12-channel (later 24-channel), oil-filled array at 5 metre hydrophone spacings. The system is shown schematically in Figure 7a.
This arrangement was first tested off the east coast of Nova Scotia, for defence research purposes (Mackay et al., 1985) to an ultimate deployment depth of 110 m. Later it was used in the Beaufort Sea for mapping shallow ice-bearing permafrost in water depths to 95 m. The array was designed for towing within 5 meters of the sea floor to achieve depth penetration to 30 m for large velocity contrasts. Depth was adjusted by changing the length of the umbilical cable; the operator constantly had to adjust the
378
Dow
nloa
ded
07/0
3/14
to 1
29.2
37.1
43.1
6. R
edis
trib
utio
n su
bjec
t to
SEG
lice
nse
or c
opyr
ight
; see
Ter
ms
of U
se a
t http
://lib
rary
.seg
.org
/

height by monitoring the sounder mounted on the depressor fin and winching the umbilical in or out. Where ships’ speed and bottom contours were relatively constant, we found that we could fly the eel to within 0.5 m depressor height above the bottom, with only occasional inadvertent sampling of the sea-floor materials. Operators likened this to hand-flying a supersonic jet at tree-top level, and constant attention was necessary throughout the 12 hour watches on board ship. Example records and interpretations are shown in Figure 7b and 7c respectively. Reports on data obtained using the 12-channel version of this array are given in Mackay et al. (1985) and Fortin et al. (1987).
Figure 7. a) Schematic diagram of a 12-channel deep-towed refraction array (detail of bridle and airgun shown in oval). b) Series of records obtained with this system plotted in reduced travel time format (Tr=T-x/Vr) to enhance the high velocity breakovers. c) Interpretation of sub-seabottom permafrost in the Beaufort Sea from a line surveyed with the deep-towed array.
379
Dow
nloa
ded
07/0
3/14
to 1
29.2
37.1
43.1
6. R
edis
trib
utio
n su
bjec
t to
SEG
lice
nse
or c
opyr
ight
; see
Ter
ms
of U
se a
t http
://lib
rary
.seg
.org
/

A Vertical Hydrophone Array
With support from Canada’s Defence Research Establishment Pacific, the GSC developed a vertical array to be deployed through a 30 cm hole in sea-ice for use in depths of +700 m. This arrangement was designed to be altered to meet variable requirements for compressional wave velocity-depth functions at any particular seabottom site. Hence, explosive charges could be detonated in the water column or on the seabottom at various offsets, depending on the particular need. The schematic diagram of such an array is shown in Figure 8a. We found by modelling the first arrival refraction arrivals from a vertical array, these yielded higher sensitivities to dt/dx than a similar array lying in the same plane on the seabottom (Hunter and Pullan, 1990).
Our first experience with this array took place in the high Arctic Ocean north of Ellesmere Island in water depths between 600 and 700 m (Hunter et al., 1988). We detonated high-velocity dynamite charge weights between 1 and 5 lbs at 100 m intervals on the seabottom out to 1000 meters from the vertical array. Figure 8b shows a typical record suite taken with the array, and Figure 8c shows an interpretation of the first arrival data.
We have also used this array for non-military purposes to examine seafloor velocities in the Beaufort Sea slope where the presence of gas-hydrate bearing sediments had been indicated by BSRs (Bottom Simulating Reflectors) from conventional marine seismic reflection surveying (Hunter et al., 1991).
Figure 8. a) Vertical array for under-ice seabottom refraction surveys.
380
Dow
nloa
ded
07/0
3/14
to 1
29.2
37.1
43.1
6. R
edis
trib
utio
n su
bjec
t to
SEG
lice
nse
or c
opyr
ight
; see
Ter
ms
of U
se a
t http
://lib
rary
.seg
.org
/
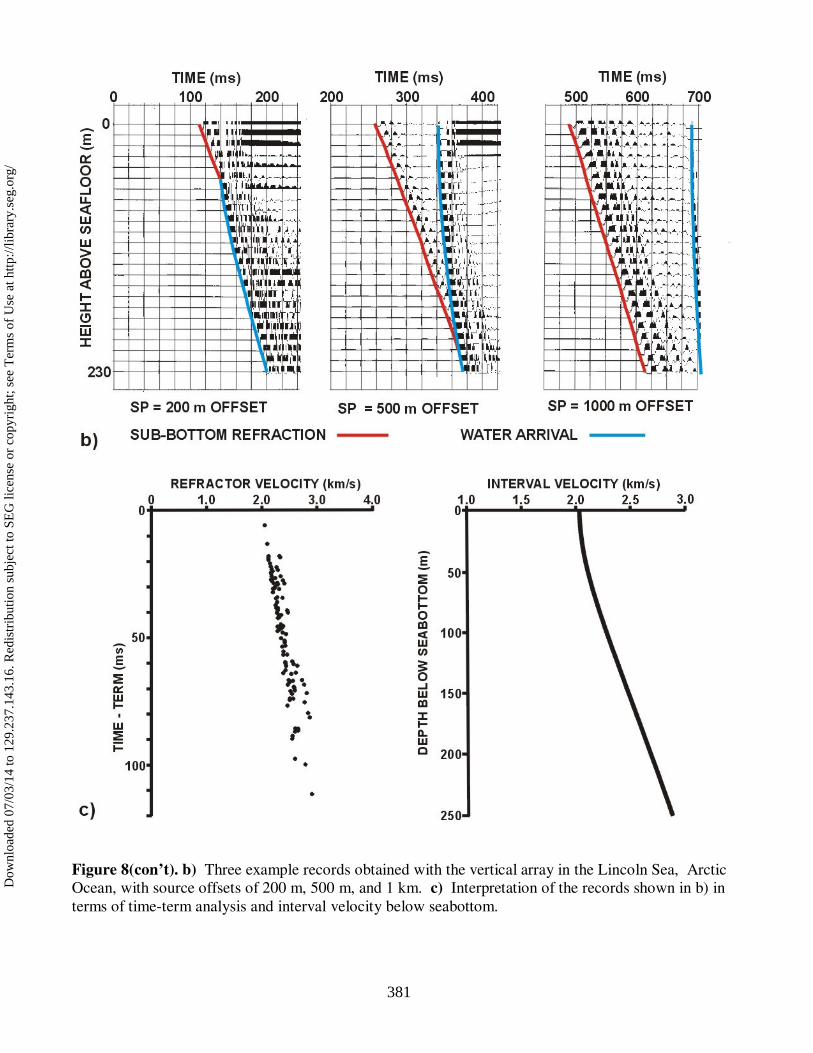
Figure 8(con’t). b) Three example records obtained with the vertical array in the Lincoln Sea, Arctic Ocean, with source offsets of 200 m, 500 m, and 1 km. c) Interpretation of the records shown in b) in terms of time-term analysis and interval velocity below seabottom.
381
Dow
nloa
ded
07/0
3/14
to 1
29.2
37.1
43.1
6. R
edis
trib
utio
n su
bjec
t to
SEG
lice
nse
or c
opyr
ight
; see
Ter
ms
of U
se a
t http
://lib
rary
.seg
.org
/
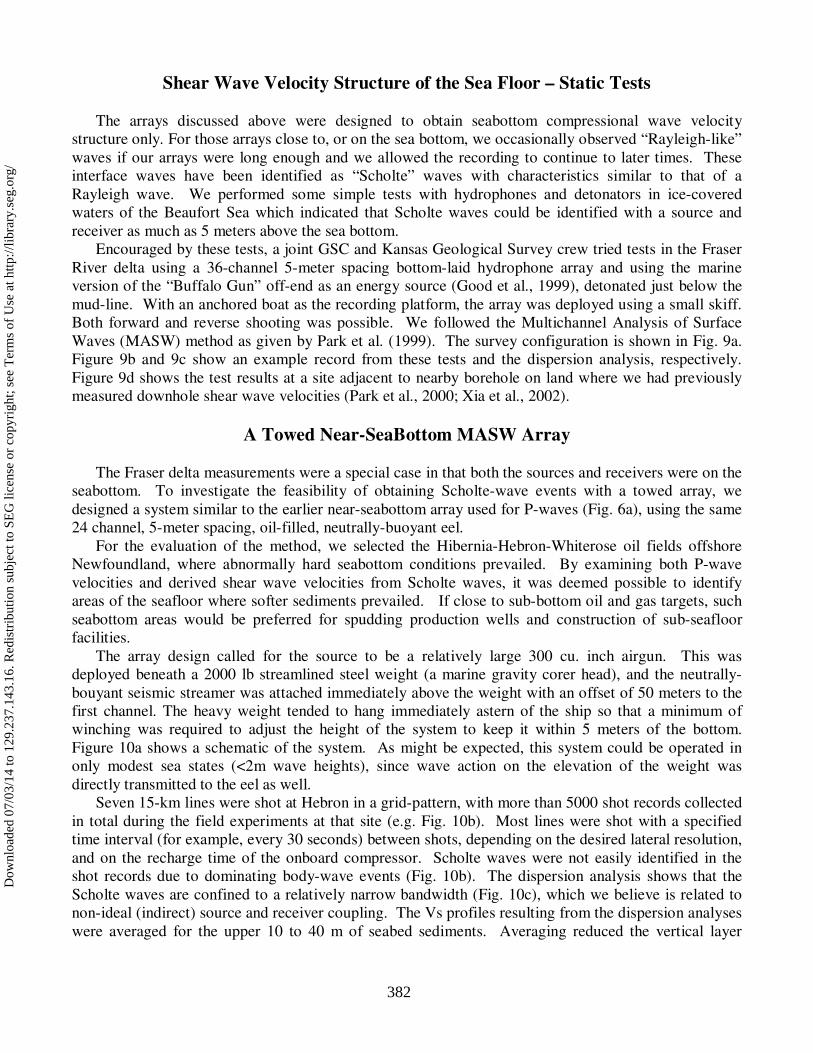
Shear Wave Velocity Structure of the Sea Floor – Static Tests
The arrays discussed above were designed to obtain seabottom compressional wave velocity structure only. For those arrays close to, or on the sea bottom, we occasionally observed “Rayleigh-like” waves if our arrays were long enough and we allowed the recording to continue to later times. These interface waves have been identified as “Scholte” waves with characteristics similar to that of a Rayleigh wave. We performed some simple tests with hydrophones and detonators in ice-covered waters of the Beaufort Sea which indicated that Scholte waves could be identified with a source and receiver as much as 5 meters above the sea bottom.
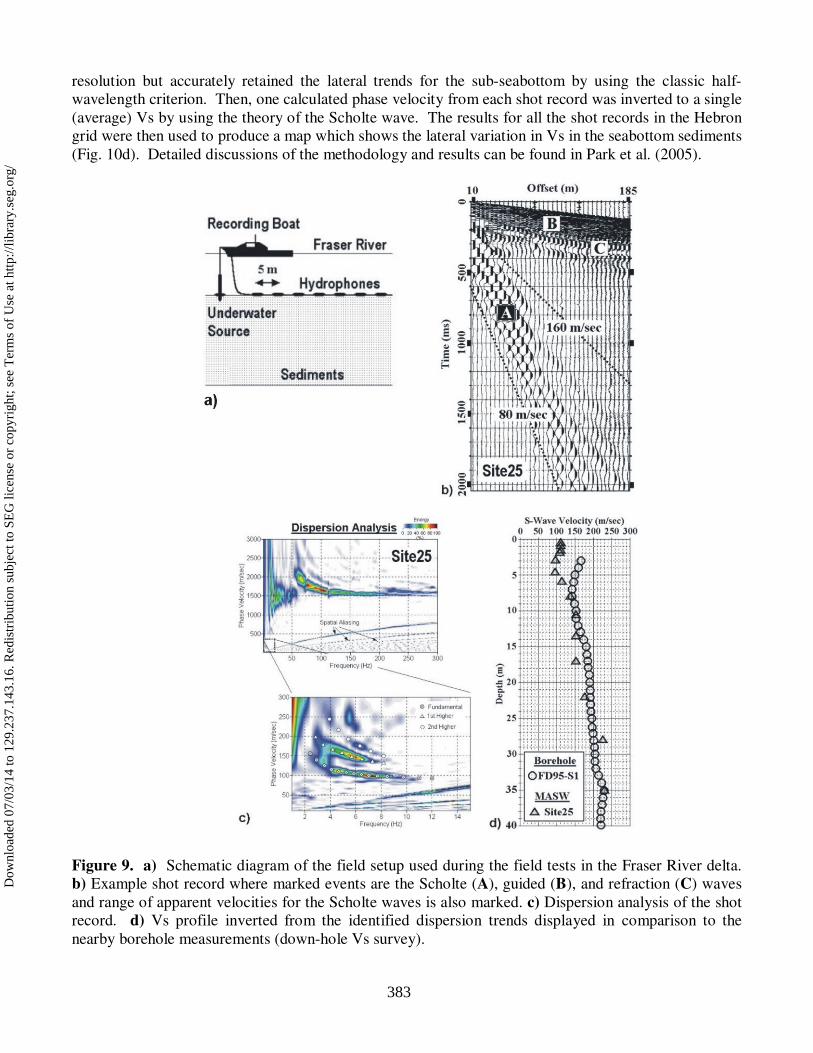
Encouraged by these tests, a joint GSC and Kansas Geological Survey crew tried tests in the Fraser River delta using a 36-channel 5-meter spacing bottom-laid hydrophone array and using the marine version of the “Buffalo Gun” off-end as an energy source (Good et al., 1999), detonated just below the mud-line. With an anchored boat as the recording platform, the array was deployed using a small skiff. Both forward and reverse shooting was possible. We followed the Multichannel Analysis of Surface Waves (MASW) method as given by Park et al. (1999). The survey configuration is shown in Fig. 9a. Figure 9b and 9c show an example record from these tests and the dispersion analysis, respectively. Figure 9d shows the test results at a site adjacent to nearby borehole on land where we had previously measured downhole shear wave velocities (Park et al., 2000; Xia et al., 2002).
A Towed Near-SeaBottom MASW Array
The Fraser delta measurements were a special case in that both the sources and receivers were on the seabottom. To investigate the feasibility of obtaining Scholte-wave events with a towed array, we designed a system similar to the earlier near-seabottom array used for P-waves (Fig. 6a), using the same 24 channel, 5-meter spacing, oil-filled, neutrally-buoyant eel.
For the evaluation of the method, we selected the Hibernia-Hebron-Whiterose oil fields offshore Newfoundland, where abnormally hard seabottom conditions prevailed. By examining both P-wave velocities and derived shear wave velocities from Scholte waves, it was deemed possible to identify areas of the seafloor where softer sediments prevailed. If close to sub-bottom oil and gas targets, such seabottom areas would be preferred for spudding production wells and construction of sub-seafloor facilities.
The array design called for the source to be a relatively large 300 cu. inch airgun. This was deployed beneath a 2000 lb streamlined steel weight (a marine gravity corer head), and the neutrally-bouyant seismic streamer was attached immediately above the weight with an offset of 50 meters to the first channel. The heavy weight tended to hang immediately astern of the ship so that a minimum of winching was required to adjust the height of the system to keep it within 5 meters of the bottom. Figure 10a shows a schematic of the system. As might be expected, this system could be operated in only modest sea states (<2m wave heights), since wave action on the elevation of the weight was directly transmitted to the eel as well.
Seven 15-km lines were shot at Hebron in a grid-pattern, with more than 5000 shot records collected in total during the field experiments at that site (e.g. Fig. 10b). Most lines were shot with a specified time interval (for example, every 30 seconds) between shots, depending on the desired lateral resolution, and on the recharge time of the onboard compressor. Scholte waves were not easily identified in the shot records due to dominating body-wave events (Fig. 10b). The dispersion analysis shows that the Scholte waves are confined to a relatively narrow bandwidth (Fig. 10c), which we believe is related to non-ideal (indirect) source and receiver coupling. The Vs profiles resulting from the dispersion analyses were averaged for the upper 10 to 40 m of seabed sediments. Averaging reduced the vertical layer
382
Dow
nloa
ded
07/0
3/14
to 1
29.2
37.1
43.1
6. R
edis
trib
utio
n su
bjec
t to
SEG
lice
nse
or c
opyr
ight
; see
Ter
ms
of U
se a
t http
://lib
rary
.seg
.org
/
resolution but accurately retained the lateral trends for the sub-seabottom by using the classic half-wavelength criterion. Then, one calculated phase velocity from each shot record was inverted to a single (average) Vs by using the theory of the Scholte wave. The results for all the shot records in the Hebron grid were then used to produce a map which shows the lateral variation in Vs in the seabottom sediments (Fig. 10d). Detailed discussions of the methodology and results can be found in Park et al. (2005).
Figure 9. a) Schematic diagram of the field setup used during the field tests in the Fraser River delta. b) Example shot record where marked events are the Scholte (A), guided (B), and refraction (C) waves and range of apparent velocities for the Scholte waves is also marked. c) Dispersion analysis of the shot record. d) Vs profile inverted from the identified dispersion trends displayed in comparison to the nearby borehole measurements (down-hole Vs survey).
383
Dow
nloa
ded
07/0
3/14
to 1
29.2
37.1
43.1
6. R
edis
trib
utio
n su
bjec
t to
SEG
lice
nse
or c
opyr
ight
; see
Ter
ms
of U
se a
t http
://lib
rary
.seg
.org
/
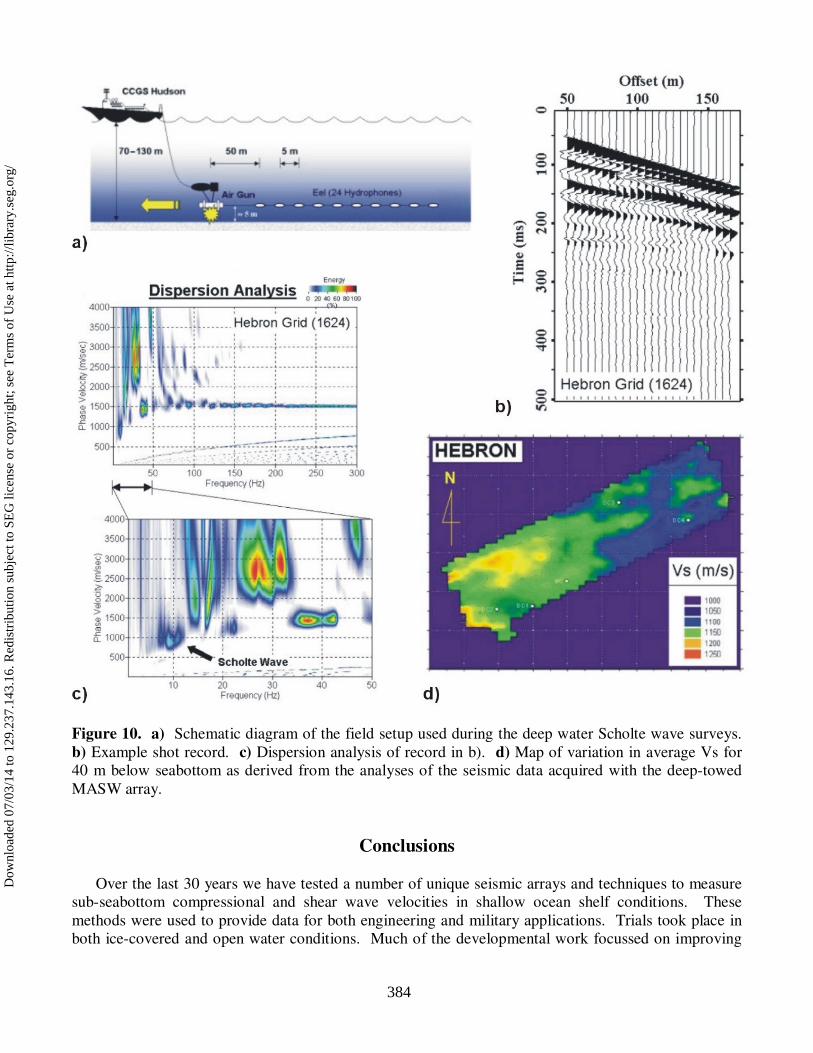
Figure 10. a) Schematic diagram of the field setup used during the deep water Scholte wave surveys. b) Example shot record. c) Dispersion analysis of record in b). d) Map of variation in average Vs for 40 m below seabottom as derived from the analyses of the seismic data acquired with the deep-towed MASW array.
Conclusions
Over the last 30 years we have tested a number of unique seismic arrays and techniques to measure sub-seabottom compressional and shear wave velocities in shallow ocean shelf conditions. These methods were used to provide data for both engineering and military applications. Trials took place in both ice-covered and open water conditions. Much of the developmental work focussed on improving
384
Dow
nloa
ded
07/0
3/14
to 1
29.2
37.1
43.1
6. R
edis
trib
utio
n su
bjec
t to
SEG
lice
nse
or c
opyr
ight
; see
Ter
ms
of U
se a
t http
://lib
rary
.seg
.org
/
the efficiency of collecting data related to the shallow sub-seabottom seismic velocities. While, the ‘ideal’ way to collect this information is with bottom-laid refraction arrays, the difficulties in getting an array with known geometry on the seabottom can be severe. The resulting expense and time involved in such surveys means that only limited data can be collected. For these reasons, the deep-towed and vertical arrays were developed. These arrays have greatly improved the efficiency of data collection, and can be used to collect substantial information of sub-seabottom conditions over relatively large areas at a reasonable cost. Without a doubt, we have collected orders of magnitude more data with the deep-towed array than would ever have been possible using bottom-laid arrays. We have shown that it is possible to use the deep-towed array effectively in ice-free water with water depths up to 100 m. Care must be taken to minimize the height above seabottom in order to obtain shallow seabottom velocities, so the applicability of this technique is limited in areas of extreme seabottom topography, or where there are other hazards on the seabottom. In deeper water, or in ice-covered conditions, the vertical array can be used very effectively from the sea-ice surface or with a two-boat operation, without rigid requirements for a set source-array geometry.
All the experiments discussed in this paper were valuable learning experiences. It is hoped that documentation of these methodologies will be of value to other workers who need to measure sub-seabottom seismic velocities.
References Fortin, G., Good, R.L., Norminton, E.J., and Hunter, J.A., 1987, The use of a 12-channel eel for shallow
refraction surveying of ice-bearing sediments in the Canadian Beaufort Sea; in Proceedings of the 19th Annual Offshore Technology Conference, Houston, TX, April 27-30, 1987, p. 281-287.
Good, R.L., Burns, R.A., and Hunter, J.A., 1999, A seabottom seismic energy source for shallow water engineering; in Proceedings, SAGEEP’99, Symposium on the Application of Geophysics to Environmental and Engineering Problems, March 14-18, 1999, Oakland, CA, p. 153-161.
Hobson, G.D., Neave, K.G., MacAulay, H.A., and Hunter, J.A., 1977, Permafrost distribution in the southern Beaufort Sea as determined from seismic measurements; in Proceedings of a Symposium on Permafrost Geophysics, 12 October 1976. Prepared by W.J. Scott and R.J.E. Brown, NRC Technical Memorandum No. 19.
Hunter, J.A., 1973b, Shallow marine refraction surveying in the Mackenzie Delta and Beaufort Sea; in Current Research, Part B, Geological Survey of Canada, Paper 73-1B, p. 59-66.
Hunter, J.A., 1973, The application of shallow seismic methods to mapping frozen surficial materials; in Proceedings of II International Conference on Permafrost, Yakutsk, U.S.S.R., North American contribution, p. 527-534.
Hunter, J.A. and Hobson, G.D., 1974a, A seismic refraction method to detect sub-seabottom permafrost; in Proceedings of Symposium on Permafrost Geophysics, NRC Technical Memorandum No. 113, p. 65-66.
Hunter, J.A. and Hobson, G.D., 1974b, A seismic refraction method to detect sub-seabottom permafrost; given at the Beaufort Sea Coastal and Shelf Research Symposium, San Francisco, January 8, 1974, Arctic Institute of North America, p. 401-416.
Hunter, J.A. and Pullan, S.E., 1990. A vertical array method for shallow seismic refraction surveying of the seafloor; Geophysics, v. 55, no. 1, p. 92-96.
Hunter, J.A., Good, R.L. and Hobson, G.D., 1974, Mapping the occurrence of sub-seabottom permafrost in the Beaufort Sea by shallow refraction techniques; in Current Research, Part B, Geological Survey of Canada, Paper 74-1B, p. 91-94.
385
Dow
nloa
ded
07/0
3/14
to 1
29.2
37.1
43.1
6. R
edis
trib
utio
n su
bjec
t to
SEG
lice
nse
or c
opyr
ight
; see
Ter
ms
of U
se a
t http
://lib
rary
.seg
.org
/
Hunter, J.A., Neave, K.G., MacAulay, H.A. and Hobson, G.D., 1978a, Interpretation of sub-bottom permafrost in the Beaufort Sea by seismic methods. Part I - seismic refraction methods; in Proceedings of III International Permafrost Conference, Edmonton, Alberta, July 10-13, 1978, v. 1, p. 515-520.
Hunter, J.A., Neave, K.G., MacAulay, H.A. and Hobson, G.D., 1978b, Interpretation of sub-bottom permafrost in Beaufort Sea by seismic methods. Part II - estimating the thickness of the high-velocity layer; in Proceedings of the III International Permafrost Conference, Edmonton, Alberta, July 10-13, 1978, v. 1, p. 521-526.
Hunter, J.A., Burns, R.A., Good, R.L. and Harrison, T.E., 1979, Seabottom seismic refraction array designs; in Current Research, Part C, Geological Survey of Canada, Paper 79-1C, p. 101-102.
Hunter, J.A., MacAulay, H.A., Burns, R.A., and Good, R.L., 1982, Some measurements of seabottom sediment velocities on the Scotian shelf; in Current Research, Part B, Geological Survey of Canada, Paper 82-1B, p. 293-296.
Hunter, J.A., Pullan, S.E. and Lockhard, M.A., 1988, A Vertical Seismic Array Method for Shallow Seismic Refraction Surveying of the Seafloor; in Expanded Abstracts with Biographies, 1988 Technical Program, 58th Annual International Society of Exploration Geophysicists, October 30-November 3, 1988, Anaheim, California, v. 1, p. 277-279.
Hunter, J.A., Burns, R.A., Good, R.L., and Pullan, S.E., 1991, Refraction velocity measurements of sub-seabottom sediments using a vertical array in Arctic ocean waters; in Expanded Abstracts with Biographies, 1991 Technical Program, 61st Annual International Meeting of the Society of Exploration Geophysicists, November 10-14, 1991, Houston, Tx., v. 1, p. 580-583.
Judge, A.S., MacAulay, H.A. and Hunter, J.A., 1976, Anomalous shallow seismic velocities in Mackenzie Bay, N.W.T.; in Current Research, Part A, Geological Survey of Canada, Paper 76-1A, p. 481-484.
Mackay, A.G., Hunter, J.A., Good, R.L. and Chapman, D.M.F., 1985. 12-channel marine eel for shallow refraction surveying of the seabottom in coastal waters; to appear in Proceedings of the Symposium on Ocean Seismo-Acoustics, June 10-14, 1985, La Spezia, Italy.
Mackay, J.R., 1972, Offshore permafrost and ground ice, southern Beaufort Sea; Can. J. Earth Sciences, 9, 1550-1561.
Morack, J.L., MacAulay, H.A., and Hunter, J.A., 1984, Geophysical measurements of sub-bottom permafrost in the Canadian Beaufort Sea; in Proceedings of the 4th International Conference on Permafrost, Fairbanks, Alaska, 1983, p. 866.
Neave , K.G., Judge, A.S., Hunter, J.A. and MacAulay, H.A., 1978, Offshore permafrost distribution in the Beaufort Sea as determined from temperature and seismic observations; in Current Research, Part C, Geological Survey of Canada, Paper 78-1C, p. 13-18.
Park, C.B., Miller, R.D., Xia, J., Sonnichsen, G.V., Hunter, J.A., Good, R.L., and Burns, R.A., 2005, Underwater MASW to evaluate stiffness of water-bottom sediments; Leading Edge (publication scheduled for summer, 2005)
Park, C.B., R.D. Miller, J. Xia, J. Ivanov, J.A. Hunter, R.L. Good, and R.A. Burns, 2000, Multichannel analysis of underwater surface waves near Vancouver, B.C. Canada; [Exp. Abs.]: Soc. Expl. Geophys., p. 1303-1306.
Park, C.B., Miller, R.D., and Xia, J., 1999, Multi-channel analysis of surface waves (MASW); Geophysics, v. 64, no. 3, p. 800-808.
Xia, J., Miller, R.D., Park, C.B., Hunter, J.A., Harris, J.B., and Ivannov, J., 2002, Comparing shear-wave velocity profiles from multichannel analysis of surface wave with borehole measurements; Soil Dynamics and Earthquake Engineering, 22 (3), 181-190.
386
Dow
nloa
ded
07/0
3/14
to 1
29.2
37.1
43.1
6. R
edis
trib
utio
n su
bjec
t to
SEG
lice
nse
or c
opyr
ight
; see
Ter
ms
of U
se a
t http
://lib
rary
.seg
.org
/