measuring policy coherence for development - oecd.org paper_ annexes.pdf · measuring policy...
TRANSCRIPT
1
Measuring Policy Coherence for
Development
May 2012
Draft Final Report
Volume II: annexes
Study commissioned by The Netherlands Ministry of Foreign Affairs and the German Federal Ministry for Economic Cooperation and Development Authors: Michael King, Niels Keijzer, Eunike Spierings, Alan Matthews European Centre for Development Policy Management (ECDPM), Maastricht and Institute for International Integration Studies, Trinity College Dublin. The views expressed in this report are those of the authors only and should not be attributed to any other person or institution.
2
About volume II, annexes to the final report
In September 2011, The Netherlands Ministry of Foreign Affairs and the German Federal Ministry for Economic Cooperation and Development jointly commissioned two complementary studies under the heading ‗Modernising the Comparability of Donor Contributions Post-2015‘. The studies respectively aim to (1) look into scenarios of how development-related financial contributions can be associated to Official Development Assistance reporting and (2) examine the feasibility and potential design of a ‗development-friendliness‘ index to evaluate donor policies beyond their quantitative ODA contributions.
As a separate document, this volume brings together the annexes produced for the second study. Annexes 1 to 6 present the results of a focused literature review aiming to gain insights from existing (attempts to) formulate and institutionalise performance indicator-driven processes allowing for the comparison of countries. Annex 6 was contributed by Carmel Cahill, senior Counsellor in OECD‘s Directorate for Trade and Agriculture. Annex 7 presents a case of policies on food security to further illustrate some of the general analysis presented in Volume 1. Annex 8 presents the consultation note that was distributed to those experts that were invited for an interview. The note presents the questions that guided the semi-structured interviews and as such can give interested readers more information on the methodology used for this study. Please note that a list of acronyms used in this Volume is found in Volume 1.

3
Table of contents
Annex 1: Millennium Development Goals ................................................................................. 4 1.1. The development of the monitoring system ....................................................................................................... 4 1.2. The approach of the monitoring system ............................................................................................................... 7 1.3. Application of the monitoring system.................................................................................................................... 9 1.4. Conclusion ...................................................................................................................................................................... 11 1.5. Sources ............................................................................................................................................................................. 12
Annex 2: Sustainable Development Goals............................................................................... 14 1.1. The development of the sustainable development indicators .................................................................. 14 1.2. The approach of the monitoring system ............................................................................................................ 17 1.3. MDG versus Sustainable Development indicators ......................................................................................... 19 1.4. Conclusion ...................................................................................................................................................................... 20 1.5. Sources ............................................................................................................................................................................. 21
Annex 3: Monitoring aid effectiveness (Paris, Accra, Busan) ................................................... 22 1.1. The development of the monitoring system .................................................................................................... 22 1.2. The approach of the monitoring system ............................................................................................................ 23 1.3. The application of the monitoring system ........................................................................................................ 25 1.4. Conclusion ...................................................................................................................................................................... 27 1.5. Sources ............................................................................................................................................................................. 28
Annex 4: Programme for International Student Assessment (PISA) ......................................... 29 1.1. The development of the monitoring system .................................................................................................... 29 1.2. The approach of the monitoring system ............................................................................................................ 30 1.3. The application of the monitoring system ........................................................................................................ 31 1.4. Conclusion ...................................................................................................................................................................... 32 1.5. Sources ............................................................................................................................................................................. 33
Annex 5: Commitment to Development Index (CDI)................................................................ 34 1.1. Introducing the CDI .................................................................................................................................................... 34 1.2. Criticism and discussion areas ............................................................................................................................... 35 1.3. Conclusion ...................................................................................................................................................................... 38 1.4. Sources ............................................................................................................................................................................. 39
Annex 6: Measuring support and protection in agriculture – the political economy of OECD’s PSE indicator .......................................................................................................................... 41 1.1. Impetus ............................................................................................................................................................................ 41 1.2. Buy-in ............................................................................................................................................................................... 41 1.3. The Producer Support Estimates (PSEs) and related indicators ............................................................. 42
Annex 7: Issues in establishing PCD causal chains – the case of food security .......................... 44 1.1. Not all developing countries are affected in the same way ........................................................................ 44 1.2. Producers versus consumers ................................................................................................................................. 44 1.3. ‘Whole-of-government’ approach ......................................................................................................................... 45 1.4. Policy change in a world of distortions .............................................................................................................. 46 1.5. Impact on ‘development’, not ‘developing countries’ ................................................................................... 47
Annex 8: Consultation note used for the interviews................................................................ 49

4
Annex 1: Millennium Development Goals
The eight Millennium Development Goals (MDGs) originate from the Millennium
Declaration of the United Nations. They are agreed upon by all 193 United Nations
member states and at least 23 international organizations with the intention that they
should be achieved by the year 2015. They are politically very influential, substantially
shaping development dialogue and investment; while some development agencies judge
all their activities on their contribution to the achievement of the MDGs (Waage et al.
2010).
1.1. The development of the monitoring system
Many of the goals were originally formulated in a series of United Nations conferences
addressing subjects important to developmenteducation (Jomtien, 1990), children (New
York, 1990), the environment (Rio de Janeiro, 1992), human rights (Vienna, 1993),
population (Cairo, 1994), social development (Copenhagen, 1995), and women (Beijing,
1995). In 1996, the EU (under the French presidency) set up a Groupe de Reflexion to
review the future of development aid and the role of the DAC. DAC staff drew up a list of
recommendations contained in UN summit declarations (Hulme 2007). The list
summarised a number of targets identified in these conferences to measure the progress
of development in particular fields (DAC 1996).
We believe that a few specific goals will help to clarify the vision of a higher quality
of life for all people, and will provide guideposts against which progress toward
that vision can be measured. … The selection of an integrated set of goals, based
on these agreed targets, could provide valuable indicators of progress. …
While expressed in terms of their global impact, these goals must be pursued
country by country through individual approaches that reflect local conditions and
locally-owned development strategies (DAC 1996).
In this way, DAC took the lead in discussing concrete development objectives (while
referring to many UN Summit agreements) that could be measured and monitored over
time. The drawing up of lists of targets had become a common device in the public
services of OECD members, as their governments had adopted result-based
management (RBM) principles (Hulme 2007, see the box below).
This document entitled ‗Shaping the 21st century: the contribution of development co-
operation‘ (1996), enumerated seven International Development Goals (IDGs). These
goals were endorsed at several OECD ministerial meetings and by the G7 in 1996, 1997
and 1998 (Bradford 2002 in Hulme 2007). But except for the ‗like minded‘ group of
5
donors (Denmark, the Netherlands, Norway and Sweden), the document did not appear
to have much traction in OECD member countries and also in developing countries it had
little or no resonance (Hulme 2007).
In the next years the UN and the DAC both worked on formulating a global policy for their
own, overlapping but different, member countries. The UN Millennium Assembly
Declaration poverty reduction goals had to satisfy, or at least not annoy, a broad
constituency, which meant applying the RBM principles was constrained (see the box
below). The IDGs of the OECD were supported by the IFI‘s because these were shorter,
more coherent and had detailed, technically-sound ‗indicators‘ that would show progress.
These were again refined into a hierarchy of goals, targets and indicators. This twin track
process resulted in an OECD list and a UN list – with two different sets of global poverty
reduction goals.
Result Based Management and the MDGs
Result-based management (RBM), or performance management has been central to efforts to improve public service delivery since the 1980s. The strategy aims to achieve better results by objectively measuring how well stated objectives are achieved, by identifying and continuously monitoring goals, targets and indicators (Binnendijk 2001 in Hulme 2007). RBM and particularly the SMART measures (stretching, measurable, agreed, realistic and time-limited) influenced the MDGs in three main ways. First, it determined the structure of the MDGs and explains why they are a nested hierarchy of goals, targets and indicators focused on time-bound policy ‗outcomes‘. Second, it shaped the specification of goals. While determining exactly what is ‗stretching‘ but also ‗realistic‘ is not an exact science one sees this tenet in operation with the $1 a day poverty target. At Copenhagen this was set as ‗eradicating‘ extreme poverty by 2015. When the DAC applied its RBM thinking to this target it was reduced to the more achievable ‗halve the proportion‘ of the extreme poor by 2015. Finally, the idea of RBM meant that the MDGs avoided potentially difficult to measure goals like human rights and participation. These could be placed in the introductions and conclusions of documents such as ―Shaping the 21st Century‖ and the Road Map, but not in the lists that are to guide action. As a result the understanding of human development that impacted on the MDGs was more derived from basic needs than
human rights. Political interests moderated the full application of RBM. This is most obvious for Goal 8. The idea of RBM was rigorously pursued for goals 1 to 6 and partially applied to Goal 7. However, it was systematically avoided for Goal 8.
From: Hulme 2007.
A reconciliation of the two sets of goals was achieved by an agreement that the UN
accepted IFI authority over national poverty reduction strategies (PRSPs) and in return
6
the IFIs would support a list of targets and indicators derived from the Millennium
Declaration by the UN Secretariat (Hulme 2007: 13). A task force with members from the
DAC (representing OECD), World Bank, IMF and UNDP, reached agreement on the two
sets of goals, in what was claimed to be a purely technical exercise (ibid.).
Thus, according to Hulme (2009), the political context for the MDGs is the integration of
different international development strategies and initiatives emerging over recent
decades. These were, on the one hand neo-liberal ideology promoting economic growth
based on free trade and markets linked to results-based management and, on the other
hand, a development approach favoured by some donor countries, multilaterals, and
non-governmental organisation (NGOs) that focused on multidimensional human
development— e.g. health, education, and gender equity, treating these as both
development goals and development means.
The emerging goals are biased towards a human development approach — ―five and a
half of the eight MDGs are about enhancing human capabilities‖ (Hulme 2009) — and
there is a strong emphasis on basic needs. However, the MDGs also incorporate neo-
liberal thinking about economic growth into the poverty goal (MDG 1), focussing on
personal income growth, which means poverty is narrowly conceived as income-based.
The early neo-liberal leanings of the goals were tempered by recognition of the need for
buy-in by developing countries and by NGOs, leading to the inclusion of goals more
focused on human welfare and development, such as health and education (Waage et al.
2010).
There is a qualitative difference between Goals 1 to 7 and Goal 8. While Goals 1 to 7 are
time specific there are no concrete dates set for any goal 8 indicators and most of the
indicators lack a quantitative target (Fukuda-Parr 2006 in Hulme 2007).
The MDGs are a novelty in that they are a target-oriented framework for the international
development community (in contrast to setting rules and standards). States joined
together in a cooperative venture to promote common ends (Gore 2009). The MDGs
were not based on the idea that poor countries should catch up with the position of rich
countries, but instead minimal standards were set. Furthermore, the goals were not set in
terms of national level objectives but reflected changes for individuals within states.
Finally, it narrowed the development agenda and placed particular responsibilities on
developing country governments (Waage et al. 2010).
The UN developed a plan for implementing the Millennium Declaration which itself
consisted of a variety of resolutions, scattered around four different paragraphs, but not a
precise statement in RBM terms. The MDGs operationalised these ideas by setting
targets and indicators for poverty reduction in order to achieve the rights set forth in the
Declaration on an agreed fifteen-year timeline. The ‗Road map towards the
implementation of the United Nations Millennium Declaration‘ (UN 2001: 55) describes

7
how the world would achieve global poverty reduction, specifying what the exact goals
and targets would be.
UN statisticians liaised with the DAC about indicators and sources of data, and organised
a mechanism for a global plan and for national plans. The targets were linked post hoc
with indicators, for the purposes of measurement, and with goals, for the purpose of
conceptual simplicity. The goals and targets are thus interrelated and should be seen as
a whole. By 2001 the MDG framework comprised eight goals, 18 targets, and 48
indicators. Some goals on the Millennium Declaration list were demoted for reasons
derived from RBM principles. The AIDS orphans goal was converted into an MDG
indicator for halting the spread of HIV/AIDS. Similarly, the Declaration‘s ‗safe drinking
water‘ goal was demoted to MDG indicator status. The goal of improving the lives of 100
million slum dwellers was downgraded to an MDG target. A few more targets and
indicators were added later (Waage et al. 2010 and UN 2001). But, the efforts to improve
MDGs by adding new targets at a later date have not been very successful according to
Waage et al., ―owing to the complexity of these targets and their indicators or to limited
ownership, or both‖ (2010: 5).
1.2. The approach of the monitoring system
MDG monitoring is taking place globally, through annual reports of the United Nations
Secretary General to the General Assembly, and through periodic country reporting. For
global reporting, use is made of indicators compiled by international organizations.
Internationally compiled indicators, based on standard concepts, definitions and
methodologies more readily facilitate cross-country comparisons. For country reporting,
use is generally made of indicators compiled from national sources, generally by the
national statistical system. The metadata sheets reflect national and international
standards.
The Millennium Development Goals Indicators originally consisted of 48 indicators linked
to the eight goals derived from the United Nations Millennium Declaration. The MDG
monitoring framework was revised in 2007 and now consists of 58 indicators, as four new
targets were included to reflect commitments made at the 2005 World Summit (United
Nations 2006: 6):
―I am therefore recommending the incorporation of these commitments into the set
of targets used to follow up on the Millennium Declaration. This includes: a new
target under Millennium Development Goal 1: to make the goals of full and
productive employment and decent work for all, including for women and young
people, a central objective of our relevant national and international policies and
our national development strategies; a new target under Goal 5: to achieve
universal access to reproductive health by 2015; a new target under Goal 6: to
8
come as close as possible to universal access to treatment for HIV/AIDS by 2010
for all those who need it; and a new target under Goal 7: to significantly reduce the
rate of loss of biodiversity by 2010. The existing target on developing decent and
productive work for youth, now under Millennium Development Goal 8, would be
encompassed by the new target (under Goal 1). Technical work to select the
appropriate indicators would be undertaken by the Inter-agency and Expert Group
on Millennium Development Goal Indicators. In this work, the system will be able
to build on the Ministerial Declaration on Employment Generation and Decent
Work adopted at the 2006 session of the Economic and Social Council, which
calls for the development of 10-year action plans and assigns the Council a clear
role in monitoring progress in its implementation.‖
The 8 MDGs are subdivided into 18 targets, these are monitored with several indicators.
The list of indicators, developed using several criteria, is not intended to be prescriptive
but to take into account the country setting and the views of various stakeholders in
preparing country-level reports. ―The indicator list is dynamic and will necessarily evolve
in response to changing national situations, so will the metadata change over time as
concepts, definitions and methodologies change.‖ (UN 2003: viii).
The UN applies 5 criteria in its indictor selection:
Provide relevant and robust measures of progress towards the MDG targets
Be clear and straightforward to interpret and be internationally comparable
Be broadly consistent with other global lists and avoid imposing an unnecessary
burden on countries, governments, other parties.
Be based to the greatest extent possible on international standards,
recommendations and best practices.
Be constructed from well-established data sources, be quantifiable and consistent
to enable measurement over time.
The indicators are presented as a portfolio and provide an editorial commentary for each policy area that combines information from each indicator and an understanding of its limitations.
The Inter-Agency and Expert Group (IAEG) on MDG Indicators is responsible for the
preparation of data and analysis to monitor progress towards the MDGs. The Group also
reviews and defines methodologies and technical issues in relation to the indicators,
produces guidelines, and helps define priorities and strategies to support countries in
data collection, analysis and reporting on MDGs. IAEG includes various Departments
within the United Nations Secretariat, a number of UN agencies from within the United
Nations system and outside, various government agencies and national statisticians, and
other organisations concerned with the development of MDG data at the national and
international levels including donors and expert advisers (Millennium Development Goals
indicators website). One of the founding members of the Inter-Agency Expert Group is
9
the OECD, that tested and refined the MDG indicators, and has contributed to the UN‘s
annual MDG progress reports and the MDG ‗gap‘ reports devoted to Goal 8, which tracks
global partnership efforts in support of the MDGs. An important part of this work has been
to supply statistics and commentary on aid flows (OECD website).
The indicators are monitored country by country by the national statistical system, jointly
with the UN teams and other national and international stakeholders. These teams
decide by consensus in a consultation process the selection and compilation of the
country-specific indicators. The MDG framework contains specific indicators for donors
on the OECD/DAC list, and recipients from least developed countries, landlocked
developing countries and smallisland developing states.
1.3. Application of the monitoring system
In general assessing whether the MDGs are being achieved is an exceptionally complex
statistical task that generates many annual reports (UNDP, WB, UNESCO). The
accuracy of these reports is unclear because of the poor quality of much of the
underlying data and problems of estimation. Assessing whether the formulation and
promotion of the MDGs has contributed to these uncertain changes in levels of human
development is even more difficult – as this would require isolating the contribution that
the existence of the MDGs makes to poverty reduction from that of other factors (such as
economic growth in Asia, global warming, the war in the DRC, bio-fuel policies, rainfall in
Asia and Africa, the global financial collapse of 2008, etc.) (Hulme 2009).
Following Waage et al. (2010) the monitoring of the MDGs has had some important
positive effects: it encouraged global political consensus, it provided a focus for
advocacy, improved the targeting and flow of aid, and improved the monitoring of
development projects. The use of a results-based framework is regarded as one of the
strengths of the MDGs, and has certainly appealed in an aid context with the desire of
donors to see measurable returns on investment. Indicators have proven useful in
measuring progress on the MDGs. The monitoring of MDGs facilitates tracking progress
towards poverty reduction, but does not track the Millennium Declaration as such, lacking
indicators for equality and sustainability for example.
Problems with the conceptualisation and execution of the MDGs arise at the goal, target,
and indicator levels. This feature is shared by different MDGs, and some goals have
problems at more than one level (based on Waage et al. 2010).
Broadly speaking, problems associated with the goals relate to their being too narrow
and fragmented, leaving gaps so that other important development objectives are
missing. The limited number of MDGs facilitated their acceptance and use, but meant at
the same time that they are limited in scope. Goals were never developed for several key

10
objectives of the Declaration, including peace, security and disarmament, and human
rights. The elements taken into the MDGs were in fact the specific targets associated
with only one objective of the Declaration, that of development and poverty eradication.
Some goals were very narrow in conception: for example, education goals focused
mainly on primary education. For goals that were more broadly defined, such as poverty
reduction, gender, or environmental sustainability, the few targets assigned to them did
not capture their breadth.
The fragmentation of the MDGs has probably resulted in several lost opportunities to
improve development outcomes. This fragmentation is clear with the ‗silos‘ of health,
education and environment. Given this the MDGs will not achieve an integrated approach
to the complex problems in international development. Even worse, the MDGs may have
reinforced the isolation of the different sectors.
Problems at the target level relate to their being incomplete or partial relative to the
ambition of the goal, imprecise, or without a process of delivery. The targets are often so
narrow as to neglect important development issues in the same sector like tertiary
education, reproductive health, and a range of gender issues.
A feature of MDG targets that has often been seen as a virtue is their caution not to
prescribe how a target or its indicators should be achieved. However, too little detail has
proven to be a problem for some MDGs. MDG 1, for example, with its goal of halving
poverty and hunger, does not have any indicators concerned with service access or with
policy interventions. Thus, the goals have results-based outcome targets, but no targets
for mechanisms contributing to these outcomes, i.e. output targets.
Problems with indicators tend to be associated with measurement, ownership, or
leadership. Also the indicators often fail to capture some crucial elements of goal
achievement. The focus on measurable MDG results means that many of the indicators
selected do not capture the complexity of the target, nor the qualitative nature of much
development progress. The results-based nature of the MDG framework means that
availability of good quality data is required for the use of specific indicators that monitor
progress towards targets and goals. But national information systems are still weak in
many countries, and data, if available, are likely to be of poor quality. This problem is
compounded by technical difficulties for some of the MDGs‘ indicators that might not be
easy to measure yearly.
Attention and monitoring for individual goals has usually focused on a subset of the
targets and indicators, sometimes only one. This narrowing process could be an
indication of differences in ease of target implementation and monitoring, and in the level
of ownership by international and other institutions, with little ownership or overlap in
ownership reducing progress. Finally, the involvement of developing countries in the
initial development of the monitoring framework was small.

11
Over the past few years, the IAEG has worked to promote improvement and better
documentation on the standards and methods used in compiling and analyzing MDG
indicators, including finding ways to aggregate country data in a meaningful way,
overcoming problems of comparability and, even more importantly, providing a
meaningful analysis of the aggregate figures that represents the local situation. This work
is undertaken through thematic sub-groups established within IAEG and through other
inter-agency mechanisms bringing together specialized agencies in the various fields
covered by the MDGs.
1.4. Conclusion
The process to agree on the MDGs was a multi-actor negotiation process with several
trade-offs. In 1996 the DAC took the lead in drawing up a list to measure the progress of
recommendations contained in several UN summit declarations. The list mainly got
traction among OECD members, and much less beyond this group. In the meantime, the
UN worked on the poverty reduction goals for the UN Millennium Assembly Declaration,
which had to satisfy a broader constituency. The two sets of goals were reconciled when
the UN accepted IFI leadership in the development of national poverty reduction
strategies (PRSPs), in exchange for IFIs‘ support for a listing of targets and indicators
derived from the Millennium Declaration by the UN Secretariat.
Thus, first a political mandate was sought, before to proceed with more technical
considerations of the Millennium Development Goals assessment process. The DAC
already refined their initial list of recommendations summarising a number of targets
discussing concrete development objectives in a hierarchy of goals, targets and
technically sound indicators. The UN list was longer, less coherent, and less based on
results-based management (RBM) principles. A task force with members from the DAC
(representing OECD, World Bank, IMF and UNDP), reached concordance on the two
sets of goals in what was claimed to be a purely technical exercise.
The process highlights the importance of cooperation between different multilateral
agencies to achieving agreement on globally acceptable indicators and the sequencing of
policy efforts involved. The UN developed the ‗Road map towards the implementation of
the United Nations Millennium Declaration‘. UN statisticians liaised with the OECD/DAC
about indicators and sources of data, tested and refined the MDG indicators and
organised a mechanism for global and national plans and the Inter-Agency and Expert
Group (IAEG) on MDG Indicators was founded; preparing data and analysis to monitor
progress towards the MDGs.
MDG monitoring is taking place globally and through periodic country reporting. The
monitoring has had important positive effects and the use of a results-based framework is
12
regarded as one of the strengths of the MDGs. However, problems with the
conceptualisation and execution of the MDGs arise at the goal, target, and indicator
levels.
All in all, the MDGs were not a plan derived bottom-up from a broad conceptualisation of
development and prioritisation of development needs. Rather, ―…the MDGs constitute an
assembly of often very narrowly focused and sector-specific development ideas and
campaigns from the 1980s and 1990s. Their targets are often so narrow as to neglect
important development issues in the same sector, for example tertiary education and
reproductive health‖ (Waage et al. 2010: 4-5).
See Waage et al. 2010 for a more elaborate analysis of the challenges with the MDGs,
and a chapter on the framing of future development goals. This analysis was done by a
Commission undertaken at the request of The Lancet by the London International
Development Centre (LIDC)—a consortium of six University of London colleges
(Birkbeck, Institute of Education, London School of Hygiene and Tropical Medicine,
School of Oriental and African Studies, Royal Veterinary College, and the School of
Pharmacy).
1.5. Sources
BWFA 2000. A Better World for All: Progress towards the International Development
Goals. Washington DC: Published by the IMF, OECD, UN and World Bank.
http://www.paris21.org/betterworld/
DAC (1996) Shaping the 21st century: the contribution of development co-operation.
OECD, Paris.
Gore, C. 2009. The global development cycle: MDGs and the future of poverty reduction.
Paper presented at After 2015: promoting pro- poor policy after the MDGs. Brussels;
June, 2009. http://www.eadi. org/fileadmin/MDG_2015_Publications/Gore_PAPER.pdf.
Hulme, D. (2007) The making of the Millennium Development Goals: Human
Development meets result-based management in an imperfect world. Brooks World
Poverty Institute, BWPI Working Paper 16, Manchester.
Hulme, D. (2009) Governing Global Poverty? Global Ambivalence and the Millennium
Development Goals. Brooks World Poverty Institute, Manchester.
Millennium Development Goals indicators: http://millenniumindicators.un.org/unsd/mdg/
Default.aspx
MDG monitor: http://www.mdgmonitor.org/aboutMDG.cfm
Organisation for Economic Co-operation and Development website (n.d.) The OECD and
the Millennium Development Goals. From: http://www.oecd.org/document/
37/0,3746,en_2649_33721_34087845_1_1_1_1,00.html
Organisation for Economic Co-operation and Development/Development Assistance
Committee, www1.oecd.org/dac/indicators

13
United Nations (2001), Road Map Towards the Implementation of the United Nations
Millennium Declaration: Report of the Secretary-General, Document A/56/326, New
York: United Nations.
United Nations (2003) Indicators for monitoring the Millennium Development Goals.
Definitions, Rationale, Concepts and Sources. United Nations Development Group,
New York.
United Nations Millennium Development Goals, www.un.org/millenniumgoals
United Nations (2006) Report of the Secretary- General on the work of the Organization,
New York.
United Nations Statistics Division, www.unstats.un.org/unsd
Waage, J. et al. (2010) The Millennium Development Goals: a cross-sectoral analysis
and principles for goal setting after 2015. The Lancet and London International
Development Centre Commission, September 13, 2010.
World Bank Millennium Development Goals, www.developmentgoals.org

14
Annex 2: Sustainable Development Goals
For the upcoming Conference on Sustainable Development in Rio de Janeiro in 2012,
support is growing to develop Sustainable Development Goals (SDGs). The
Governments of Colombia and Guatemala and the world‘s civil society organisations
have suggested that a key outcome of the Rio+20-process should be the definition and
agreement of SDGs. The SDGs could become the new basis for redefining the MDGs,
building on the experience with the MDGs or could be seen as complementary to the
MDGs.
Sustainable development indicators and composite indicators are considered to be a
good vehicle in helping to measure sustainable development and progress achieved in it.
Currently there is no single, universally accepted definition nor are there internationally
agreed sustainable development indicators to monitor progress towards these suggested
Sustainable Development Goals (UNCSD 2011). The Agenda 21 Action Plan (1992) and
the Johannesburg Plan of Implementation (2002) encouraged further work on indicators
for sustainable development by countries, and the UN Commission on Sustainable
Development (CSD) has done further work to develop these indicators (see description
below), though these are to be country specific.
1.1. The development of the sustainable development indicators
The 1992 Earth Summit recognised the important role that indicators can play in helping
countries to make informed decisions concerning sustainable development.1 The Agenda
21 Action Plan adopted in Rio de Janeiro specifically calls for the harmonisation of efforts
to develop sustainable development indicators at the national, regional and global levels,
including the incorporation of a suitable set of these indicators in common, regularly
updated and widely accessible reports and databases.
In response to this call, the UN Commission on Sustainable Development (CSD)
approved in 1995 the Programme of Work on Indicators of Sustainable Development,
which main objective was to make indicators of sustainable development accessible to
decision-makers at the national level, by defining them, elucidating their methodologies
and providing training and other capacity-building activities. Also, indicators used in
national policies could be used in the national reports to the Commission and other
intergovernmental bodies. As a consequence, the CSD indicators are deeply rooted in
Agenda 21, where their development is mandated. With the update of 2007, some of the
1 This recognition is articulated in Chapter 40 of Agenda 21 which calls on countries at the national level, as well as international, governmental and non-governmental organisations, to develop and identify indicators of sustainable development that can provide a solid basis for decision-making at all levels.

15
indicators specifically address objectives or activities described in the Johannesburg Plan
of Implementation, adopted in 2002 at the World Summit of Sustainable Development in
Johannesburg.
In the 2001 report of the United Nations Department of Economic and Social Affairs (UN
DESA) the key sustainable development themes and the approach to the development of
indicators of sustainable development for use at the national level is presented. Also, for
each of the indicators, a methodology sheet summarises the main information, to assist
member countries in their efforts to measure progress toward sustainable development
(UN DESA, 2001).
Methodology sheets for Indicators of Sustainable Development
In the 2001 report of the United Nations Department of Economic and Social Affairs (UN DESA) the key sustainable development themes and the approach to the development of indicators of sustainable development for use at the national level is presented. Also, for each of the indicators, a methodology sheet summarises the main information, to assist member countries in their efforts to measure progress toward sustainable development, including:
Basic information on the indicator, including its definition and the unit of measurement;
Purpose and usefulness of the indicator for sustainable development decision-making (i.e., policy relevance); international targets where these are available; and the relevant international conventions, if the indicator is primarily of global significance;
Conceptual underpinnings and methodologies associated with the indicator, including the underlying definitions, measurement methods, and a summary of its limitations and alternative definitions;
Data availability to illustrate the importance of regular data collection and updating to support systematic reporting;
Listing of the agency(ies) (lead and cooperating) involved in the preparation of the methodology sheets; and
Other information (e.g., contact points, other references and readings). These methodology sheets are available on the indicators section of the webpage of the United Nations Division for Sustainable Development (http://www.un.org/esa/sustdev/) and are regularly updated.
Sources: UN DESA, 2001: 4 and UN DESA 2007.
16
Main phases and approaches to implementation 1995-2001 This section draws on UN DESA 2001 and 2007.
Development of the methodology indicator sheets;
a. The Division for Sustainable Development (DSD) took a consultative and
collaborative approach to produce the methodology sheets. More than 30
organisations of the United Nations and other inter-governmental, non-
governmental supported the process, including drafting of methodology
sheets appropriate to their mandate and experience.
b. An Expert Group with 45 members from non-governmental organisations
and United Nations agencies guided the process, and several international
expert workshops were held.
c. The collection of methodology sheets was published in 1996, ‗Indicators of
Sustainable Development: Framework and Methodologies‘ and distributed
to all governments with the invitation to use and test the indicators, and to
provide feedback on the results.
Training and capacity building;
A series of briefing and training workshops provided an introduction and training in
the use of indicators as tools for national decision-making and to explore related
methodologies for indicator development.
National testing;
To gain experience with the use of indicators, to assess their applicability according
to national goals and priorities of sustainable development, and to propose changes
to the set and its organizational framework 22 countries participated in the testing
process of the proposed initial set of indicators and related methodologies over a 2-
3 year period.
Evaluation of the testing and indicator set;
Guided by the reports from the testing countries and continuing expert discussions
on the indicators and the framework, the DSD revised the framework and indicator
list and published it in 2001.
Review of the indicator set;
In response to the World Summit on Sustainable Development in 2002,
encouraging further work on indicators at country level, in 2005 the DSD started a
review process. Perspectives on indicators had evolved and experience in applying
indicators of sustainable development at the country level had grown considerably.
Since much attention had been given to the development and use of indicators to
measure process on the MDGs, the DSD also assessed the coherence between the
17
CSD and MDG indicators. In 2007 a third set of Indicators of Sustainable
Development was presented, including suggestions on how to adapt them to
national conditions and priorities.
Lessons learned on the overall process The participatory approach adopted by countries in the testing exercise not only
heightened awareness of the value and importance of indicators but also increased
levels of understanding on sustainable development issues.
The testing has reportedly inspired the launching of other indicator initiatives and
has tied many players together.
Making use of existing structures, such as national committees or councils for
sustainable development was seen as useful in organising the national coordinating
mechanism.
In some countries, the testing of indicators acted as a positive catalyst in the
establishment of new mechanisms for coordinating both the indicators programmes
and the formulation of sustainable development strategies.
Several institutional constraints affected the implementation of the testing, such as,
limitations on the availability of financial and human resources, difficulty in
mobilizing the relevant experts and stakeholders, lack of coordination between
statistical agencies and the indicator focal point, low level of awareness among
stakeholders, low level of commitment on the part of participating institutions, and
competing work demands and government leadership transitions that resulted in
discontinuities in the implementation of the indicator process. This called for beefing
up capacity-building programs in the form of human resource and organizational
development. A strong human resource base is central to the multi-stakeholder
process as are properly coordinated and highly committed institutional mechanisms.
To be more successful, it was also felt that the indicator programme should be
viewed and treated as a more permanent programme that is closely linked with
national reporting to the CSD and integrated with the development of national
policy.
1.2. The approach of the monitoring system
The organisational framework was an important starting point for the identification and
selection of indicators. The early indicator work organised the chapters of Agenda 21
under the four primary dimensions of sustainable development; social, economic,
environmental and institutional. Within these categories, indicators were classified
according to their driving force, state and response (DSR) characteristics, adopting a
conceptual approach widely used for environmental indicator development:
Driving force indicators represent human activities, processes, and patterns that
impact on sustainable development either positively or negatively.
State indicators provide a reading on the condition of sustainable development,

18
Response indicators represent societal actions aimed at moving towards
sustainable development.
Using this framework, methodology sheets for 134 indicators were initially developed by
UN lead agencies and others as a preliminary working list for testing at the national level.
Already in 2001 the DSD did not use the DSR framework since it was not suited to
addressing the complex interlinkages among issues; the classification of indictors was
ambiguous; there were uncertainties over causal linkages; and it did not adequately
highlight the relationship between the indicators and policy issues.
The 2007 framework consists of 14 themes, 44 sub-themes, 50 core indicators and 96
indicators of sustainable development to guide national indicator development. The
division of indicators along the lines of four ‗pillars‘ (social, economic, environmental and
institutional) is no longer explicit in the newly revised set. This change emphasises the
multi-dimensional nature of sustainable development and reflects the importance of
integrating its pillars. Consequently, new cross-cutting themes such as poverty and
natural hazards were introduced and existing cross-cutting themes such as consumption
and production patterns are better represented.
A framework for organizing the selection and development of indicators is essential. But,
any framework is imperfect in terms of its ability to organise and represent the
complexities and interrelationships of sustainable development (UN DESA 2001). The
UN DESA decided that the framework and indicators should meet the needs and
priorities of users, in this case national experts, civil society groups and decision-makers
responsible for the development and use of indicators to monitor progress towards
sustainable development. Furthermore, each country using the indicators has to develop
its own programme drawing on the resources currently available, for which these
indicators provide a good starting point.
From their inception, the overarching purpose of the CSD indicators has been to inform
policy at the national level. In addition to using indicators to assess overall progress
towards sustainable development, many countries successfully use them to measure
success within the framework of their national sustainable development strategy.
The CSD indicators are useful for measuring the outcome of policies to achieve
sustainable development goals. However, they are not suited for measuring the
implementation of specific actions contained in these major agreements on sustainable
development.
19
1.3. MDG versus Sustainable Development indicators
Thought has been given to the relationship between SDGs and MDGs in the post-2015
development agenda. The Millennium Declaration will still be relevant beyond 2015, while
sustainable development requires additional efforts in all areas, including those not
adequately reflected in the original MDGs.
Both the sustainable development (CSD) indicators and the MDG Indicators were
developed through a collaborative process involving various Departments within the
United Nations Secretariat, a number of specialized agencies from within the United
Nations system as well as external international organizations, various government
agencies and national statisticians. Both indicator sets are driven by policy relevance,
rooted in major inter-governmental development summits and frequently applied at the
national level.
The overall purpose is different: the CSD indicators are intended solely to provide a
reference, or sample set, for use by countries to track progress towards nationally-
defined goals, in particular, and sustainable development, in general. The MDG
Indicators, on the other hand, were developed to permit the global monitoring of progress
toward meeting internationally established goals.
In addition, the CSD indicators cover a broad range of issues intrinsic to all pillars of
sustainable development — economic development, social development and
environmental protection. The MDG indicators are specific to the eight MDGs. The MDGs
constitute an important subset of the sustainable development agenda. They have a
more limited coverage, with a strong focus on issues related to the poverty- health nexus.
Sustainable development issues that are not covered by the MDG Indicators include
demographics, natural hazards, governance and macroeconomics. The area of
consumption and production patterns, one of the three overarching objectives and
essential requirements of sustainable development, is covered by one single MDG
indicator (energy intensity).
The focus of the MDG Indicators on global monitoring also imposes some selection
criteria that are less relevant for nationally oriented sets. For example, since the MDG
Indicators need to allow for meaningful regional and global aggregation, they require data
that are internationally available and comparable. Moreover, the use of single-value
indicators predominates since this allows for easier presentation across time and
countries or country groups. Nationally-oriented sets, such as the CSD indicators, may
easily include multiple dimensions, such as population groups, gender and sectoral
breakdowns. The CSD indicators can also include indicators which lack accepted

20
adjustment methods for cross-country comparisons or indicators for which countries have
no time-series data dating back to the 1990s.
The review of the MDG Indicators led to the inclusion of selected CSD indicators into the
revised MDG framework, especially in the areas of natural resources, biodiversity and
employment. UNDESA, 2007 includes a table comparing the CSD and MDG Indicators.
1.4. Conclusion
Following the encouragement from the Agenda 21 Action Plan (Earth Summit 1992) and
the Johannesburg Plan of Implementation (2002) to further work on indicators for
sustainable development by countries, the UN Commission on Sustainable Development
(CSD) has been developing country specific indicators. The CSD‘s main objective was to
make indicators of sustainable development accessible to decision-makers at the
national level, by defining them, elucidating their methodologies and providing training
and other capacity-building activities.
The development of sustainable development goals (SDGs) and indicators is likely to
have the best development impact and ownership if they emerge from a transparent,
participatory, and consultative process. The development of methodological guidance on
the indicators, implementation guidelines on indicators, baselines and an effective
reporting framework is equally important. There is merit in using an internationally agreed
statistical framework as the basis for indicators. The challenge is to develop sustainable
development goals that have a wide political and policy appeal and will help focus
attention, particularly in the post Rio+20 phase, on monitoring the implementation of
Rio+20 outcomes. At the same time these goals need to be sufficiently rigorous to
provide a valuable basis for decision-making, especially at the national level, and be of
use to the national policy community (UNCSD 2011).
When comparing the SDGs and MDGs, they are both developed in a collaborative
process. While the MDG indicators are specifically developed to monitor the eights goals,
the SDGs indicators provide a sample set from which countries can draw to track
progress towards national sustainable development goals. The CSD indicators cover a
broad range of topics concerning sustainable development, of which the MDGs just form
a subset. The different purposes of both indicator sets also mean that the MDG indicators
need to allow for meaningful global aggregation, requiring internationally comparable
data, while the SDG indicators can be country specific and can easily include multiple
dimensions, such as population groups, gender and sectoral breakdowns.
21
1.5. Sources
United Nations Conference on Sustainable Development (2011) Current ideas on
Sustainable Development Goals and Indicators. Rio 2012 Issues Briefs, number 6.
United Nations Department of Economic and Social Affairs, UN DESA (2001) Indicators
of sustainable development: framework and methodologies. Background paper no.3.
Commission on sustainable development. Ninth session, 16-27 April 2001, New York.
United Nations Department of Economic and Social Affairs, UN DESA (2007) Indicators
of Sustainable Development: guidelines and methodologies. October 2007, third
edition.

22
Annex 3: Monitoring aid effectiveness (Paris, Accra,
Busan)
In 2005, Ministers from developed and developing countries together with heads of
international organisations endorsed an agreement to make development aid more
effective: the Paris Declaration on Aid Effectiveness. The countries committed
themselves to the 2005 Paris Declaration principles for achieving more effective aid, and
also to meeting a set of measurable targets by 2010. This is an important feature of the
Paris Declaration, providing a tool for donors and developing countries to hold each other
to account. The Paris Declaration on Aid Effectiveness aimed to take monitorable actions
to reform the ways aid is delivered and managed. It argues in its section about the
monitoring and evaluating of its implementation that: ―... demonstrating real progress at
country level is critical‖ (Paris Declaration 2005: 2).
1.1. The development of the monitoring system
In the Paris Declaration the partnership of donors and partner countries, comprising
OECD/DAC members, partner countries and multilateral institutions, commit to
implement the Partnership Commitments presented in Section II and to measure
progress against 12 specific indicators, set out in Section III of this Declaration: ―…under
the leadership of the partner country we will periodically assess, qualitatively as well as
quantitatively, our mutual progress at country level in implementing agreed commitments
on aid effectiveness. In doing so, we will make use of appropriate country level
mechanisms.‖ (ibid.).
In paragraph 9 the Declaration states that the partnership of donors and partner countries
should propose arrangements for monitoring its commitments by the end of 2005. Five
preliminary targets against indicators were set for the year 2010 to track progress at the
global level among the countries and agencies that have agreed to this Declaration.
Hosted by the DAC Working Party on Aid Effectiveness, two meetings were held in 2005
―to refine targets as necessary; to provide appropriate guidance to establish baselines;
and to enable consistent aggregation of information across a range of countries to be
summed up.‖ (Paris Declaration 2005: 2). The agreement reached on the targets
presented under Section III of the Paris Declaration was subject to reservations by one
donor on the methodology for assessing the quality of locally-managed procurement
systems (relating to targets 2b and 5b) and the acceptable quality of public financial
management reform programmes (relating to target 5a.ii).
The Declaration also announced the intention to use existing peer review mechanisms
and regional reviews to support progress in this agenda and to explore independent
23
cross-country monitoring and evaluation processes – which should be applied without
imposing additional burdens on partners – to provide a more comprehensive
understanding of how increased aid effectiveness contributes to meeting development
objectives.
The Accra Agenda for Action (AAA) of 2008 built on the Paris commitments. The AAA
reaffirms the commitments made in the Paris Declaration and agrees on concrete and
monitorable actions to accelerate progress to meet those commitments by 2010. Again,
the countries commit to continue efforts in monitoring and evaluation that will assess
whether commitments agreed in the Paris Declaration and the Accra Agenda for Action
have been achieved, and to what extent aid effectiveness is improving and generating
greater development impact. In the AAA it is recognised that additional work is required
to improve the methodology and indicators of progress of aid effectiveness.
In Busan the 4th High level forum on aid effectiveness again commits to agree, by June
2012, on a selective and relevant set of indicators and targets through which progress
will be monitored on a rolling basis, supporting international and regional accountability
for the implementation of its commitments: ―We will build on the initiatives led by
developing countries and learn from existing international efforts to monitor aid
effectiveness. We will review these arrangements in the context of the post-MDG
framework. We will periodically publish the results of these exercises‖ (Busan, 2011).
In addition, the implementation of the Paris Declaration and the Accra Agenda for Action
was evaluated (see: http://pd-website.inforce.dk/P).
1.2. The approach of the monitoring system
The monitoring of the Paris Declaration on Aid Effectiveness and the Accra Agenda for
Action is done via surveys, with separate surveys for countries receiving aid and for
donors. Within the Working Party on Aid Effectiveness, the Joint Venture on Monitoring
the Paris Declaration is responsible for the monitoring and follow-up of the Paris
Declaration. It is supported by the OECD, which coordinates the surveys in partnership
with the World Bank and UNDP.
Three surveys were carried out in developing countries that opted to participate, in 2006,
2008 and 2011. In the Paris Declaration, donors and partners committed to monitoring
their progress in improving aid effectiveness against 56 specific actions, from which 12
indicators were established and targets set for 2010, covering all five pillars of the Paris
Declaration:
Ownership;
Alignment;
Harmonisation;

24
Mutual Accountability; and
Managing for Results.
The first 2006 survey formed the baseline on Monitoring the Paris Declaration covering
34 self-selected partner countries with data from 60 donors, covering 37% of aid
programmed across the world in 2005. This was no representative sample and probably
included a disproportionate number of countries with an active interest in the Paris
Declaration process. At the country level, the survey was organised to spark dialogue
among government, donors and other in-country stakeholders, while collecting useful
information. This was reflected in the co-ordination of the survey, the method for putting
together the information required, the guidance provided and the process of drafting the
chapters on the countries (OECD 2007). Beyond the survey, a medium-term monitoring
plan was developed for regional and national integration of ongoing monitoring efforts,
planned evaluations, donor self-reporting and DAC peer reviews. The medium-term
monitoring plan suggested what strategic use could be made of the survey results at the
country, regional or international levels (Ibid.).
Following this first survey, the 2008 interim progress survey presents the findings of both
2006 and 2008, in preparation of the Accra High Level Forum. Besides, the Progress
report on Aid Effectiveness and the first phase of the evaluation of the Paris Declaration
form qualitative complementary sources of information. For this second round, 54
countries volunteered to organise the survey in their country (OECD 2008).
The 2011 Survey is the latest survey to determine whether the 2010 targets of the Paris
Declaration were met. This survey also provided two optional survey modules regarding
some specific commitments – relating to inclusive ownership and gender – contained in
the Paris Declaration and Accra Agenda for Action. The OECD/DAC 2011 Survey on
Monitoring the Paris Declaration provides an established methodology for assessing
progress against the 12 indicators agreed in 2005. The purpose and design of the
indicators in the 2011 Survey remained the same as those in the 2006 and 2008 Surveys
in order to ensure comparability. The global synthesis report and the detailed country
chapters set out the progress made and challenges faced in making aid more effective in
each of these countries.
The surveys were supposed to:
Provide evidence of progress and signal obstacles and opportunities for further
progress at the partner country level.
Stimulate broad-based dialogue at both country and international levels on how to
make aid more effective.
Promote agreements on specific actions that contribute to the successful
implementation of the Paris agenda at the partner country level.
25
Generate an accurate description of how aid is managed in countries taking part in
the survey.
The scope and limits of the survey include:
Conclusions are drawn from an inevitably imperfect body of information, given the
complexity and diversity of the aid relationships.
It does not give undue weight to any single statistic, but examines trends indicated
by the combined evidence that can be assembled.
For most indicators the major findings are based on analysis of quantitative
information and qualitative comments from the national coordinators.
Conclusions are based on careful consideration of the information reported from
each country and the aggregated statistical data.
The 2008 survey report is based on more qualitative analysis that was not available
in 2005.
The 12 agreed upon indicators are proxy measures that do not capture the full
depth of the 56 specific actions included in the Paris Declaration.
There is a concern that the indicators and targets assume importance in their own
right and then become a barrier to rigorous thinking and innovative practices to
meet the broader objective of aid effectiveness.
It may not be reasonable to expect that progress over the years is linear, or that the
pace of change will remain the same.
1.3. The application of the monitoring system
The survey of the Paris Declaration is the first attempt to put in place at an international
level a monitoring framework for the commitments made by both donors and developing
country governments.
A growing number of countries have participated in the subsequent monitoring surveys.
In the 2011 Survey on Monitoring the Paris Declaration 78 countries participated, while in
2008 55 countries participated, and in 2006 only 34. Over the years participation has
grown to 80 per cent of the developing countries that endorsed the Paris Declaration
(OECD, 2011).
The Paris Declaration, through the emphasis it places on monitoring and evaluation, has
helped to generate more and better information, establishing the foundations for
improved accountability. The High Level Fora following Paris were clearly informed by
the monitoring surveys. The Accra Agenda for Action (AAA) notes, on the basis of the
monitoring surveys of the Paris Declaration in 2006 and 2008, that progress has been
made, but without further reform and faster action the 2010 commitments and targets for
improving the quality of aid would not be met. The assessment of progress and the
challenges of the 2008 survey underpin the AAA. Also the Busan meeting on Partnership

26
for effective development co-operation drew on the evidence generated through periodic
monitoring.
The surveys are seen as instrumental to pushing forward commitments agreed in the
Paris Declaration. According to the 2008 survey report, this is mainly because:
The participation in the survey is strictly on a voluntarily basis;
The survey is managed at country level by a senior governmental official, the
National Coordinator; and
Because the survey is based on, and stimulates broad-based dialogue at country
level (OECD 2008: 7-8 and OECD 2011).
Still, the relatively strong foundations for accountability do not lead to better
implementation. At the global level, only one out of the 13 targets established for 2010
has been met: coordination of technical co-operation. Although, according to Abdel-
Malek and Koenders (2011: 2) considerable progress has been made towards many of
the remaining 12 targets. The survey results show that significant progress has been
made with the indicators where responsibility for change lies primarily with developing
country governments. But globally, donors and developing countries have fallen short of
the goals that they set themselves for 2010:
―The findings from monitoring and evaluating the implementation of the Paris
Declaration make for sobering reading. Although the Accra Agenda for Action was
adopted in 2008 to accelerate progress with a call for heightened focus on country
ownership, more inclusive partnerships, and increased accountability for and
transparency about development results, progress in 2010 was still lagging on the
majority of the Paris Declaration commitments‖ (Abdel-Malek and Koenders 2011:
1).
The 2011 monitoring report draws some lessons learned:
Global norms and benchmarks can offer a helpful starting point for the development
of more detailed monitoring frameworks within partner countries and donor
organisations. Monitoring commitments should balance the need for both a degree
of standardisation to support international comparability and accountability with the
need for sufficient flexibility to be country and context specific.
In the selection of appropriate indicators and targets, lessons can be learned on
which ones offer more relevant insights.
Broader participation at the country level of parliamentarians and civil-society
organisations, of emerging donors and south-south cooperation actors, also in the
design of future monitoring initiatives should support the development of better
information on development at country level.
The 12 selected indicators for progress ―were not sufficiently representative, or in
some cases reliable, and in practice became too much the focus of attention and

27
action. This narrowed the reform agenda while demanding enormous national and
international efforts for monitoring‖ (Wood 2011: 59).
1.4. Conclusion
In the Paris Declaration, both developed and developing countries agreed on aid
effectiveness principles, and on actions, which would be monitored so that they could
hold each other accountable. The Paris Declaration used the experiences of five decades
of development cooperation to produce principles and procedures for making
international development cooperation more effective. As such it was a fundamental
breakthrough that resulted in a relatively strong accountability framework.
The monitoring started with a baseline survey in 2006, followed by a mid-term survey in
2008 and in 2011 a final survey was undertaken to see if the 2005 targets were met. The
surveys, one for donors and one for governments of developing counties, were intended
to measure progress in improving aid effectiveness against 56 specific actions, from
which 12 indicators were established and targets set for 2010, covering all five pillars of
the Paris Declaration: ownership, alignment, harmonisation, mutual accountability and
managing for results.
However, the strong foundation for monitoring did not lead to better implementation. At
the global level, only 1 of the targets established for 2010 has been met: coordination of
technical co-operation. The surveys were seen more as bureaucratic arrangements than
as instrumental to pushing forward commitments agreed in the Paris Declaration. Some
important lessons learned include:
Monitoring commitments should balance the need for both a degree of
standardisation to support international comparability and accountability with the
need for sufficient flexibility to be country and context specific.
Broader participation at the country level of parliamentarians and civil-society
organisations, of emerging donors and south-south cooperation actors, also in the
design of future monitoring initiatives should support the development of better
information on development at country level.
The 12 selected indicators for progress were not sufficiently representative, or in
some cases reliable, and in practice became too much the focus of attention and
action. This narrowed the reform agenda while demanding enormous national and
international efforts for monitoring (Wood 2011: 59).
28
1.5. Sources
Abdel-Malek, T. and Koenders, B. 2011. Progress towards more effective aid: what does
the evidence show? Co-chairs, working party on aid effectiveness, October 2011.
http://www.oecd.org/document/1/0,3746,en_2649_3236398_48725569_1_1_1_1,00.ht
ml
Busan partnership for effective development cooperation. 2011 http://www.busanhlf4.org
OECD 2007. 2006 survey on Monitoring the Paris Declaration. Overview of the results.
Paris, OECD.
OECD 2008. 2008 survey on Monitoring the Paris Declaration. Effective aid by 2010?
What it will take. Paris, OECD.
OECD 2008b. Improving the ways of working for aid effectiveness: a progress report on
implementing the Paris Declaration. Paris, OECD.
OECD 2011. Aid effectiveness 2005-10: Progress in implementing the Paris Declaration.
Paris, OECD. http://www.oecd.org/dac/pdsurvey
The Paris Declaration on aid effectiveness and the Accra Agenda for Action 2005/2008.
OECD.
Wood, B. Et al. 2008. Phase 1 evaluation of the implementation of the Paris Declaration:
Synthesis report. Denmark: Kabell Konsulting.
Wood, B. et al. 2011. Evaluation of the Paris Declaration, Final Report, Phase 2, The Danish Institute for International Studies, Copenhagen. (http://pd-website.inforce.dk)

29
Annex 4: Programme for International Student
Assessment (PISA)
1.1. The development of the monitoring system
The OECD Programme for International Student Assessment (PISA) is a collaborative
effort among OECD member countries to measure how well students are prepared to
meet the challenges of today‘s knowledge societies.
The PISA indicators were developed in response to OECD member countries‘ demands
for regular and reliable data on the knowledge and skills of their students and the
performance of their education systems. The work of OECD began in the mid-1990s, it
was officially launched in 1997 and surveys were done in 2000, 2003, 2006 and 2009.
Management and organisation
The OECD Secretariat is responsible for the day-to-day management of PISA.
The PISA Consortium, consisting of international contractors (usually made up of
testing and assessment agencies), is responsible for the design and implementation
of the surveys.
The PISA National Project Managers, appointed by their governments, oversee the
implementation of PISA in each participating country.
The education ministries in participating countries support and guide the process.
Subject Matter Expert Groups, with world experts, design the theoretical framework
for each PISA survey and oversee the three key areas of testing – reading,
mathematics and science literacy – and other subjects if relevant.
The Questionnaire Expert Group provides leadership and guidance in the
construction of the PISA context questionnaires.
Each OECD and partner country participating in PISA has a representative on the
PISA Governing Board, appointed by the country‘s education ministry. The chair of
the PISA Governing Board is chosen by the Board itself.
Each participant has its own group of test correctors, overseen by its National
Project Manager. They mark the PISA tests using a guide developed by the
international contractors and the PISA Subject Experts (with input from all
participating countries). The corrections are cross-checked by other experts.
PISA is financed exclusively through direct contributions from the participants'
government authorities, typically Education Ministries.

30
1.2. The approach of the monitoring system
PISA surveys take place every three years and the survey results have been published in
a series of reports and a wide range of thematic and technical reports. The next survey
will occur in 2012. For each assessment, either science, reading or mathematics is
chosen as the major domain and given greater emphasis.
PISA uses:
Student questionnaires to collect information from students on various aspects of
their home, family and school background;
School questionnaires to collect information from schools about various aspects of
organisation and educational provision in schools; and
Parent questionnaires to the parents of the students participating in PISA.
PISA is an age-based survey, assessing 15-year-old students in school in grade seven or
higher. These students are approaching the end of compulsory schooling in most
participating countries, and school enrolment at this level is close to universal in almost
all OECD countries.
The assessment is forward-looking: rather than focusing on the extent to which these
students have mastered a specific school curriculum, it looks at their ability to use their
knowledge and skills to meet real-life challenges. The PISA assessments take a literacy
perspective, which focuses on the extent to which students can apply the knowledge and
skills they have learned and practised at school when confronted with situations and
challenges for which that knowledge may be relevant.
PISA indicators focus on:
Public policy issues Do schools adequately prepare young people for the
challenges of adult life, which kinds of teaching and schools are more effective and
do schools contribute to improving the futures of students from immigrant or
disadvantaged backgrounds.
Literacy Rather than examine mastery of specific school curricula, PISA looks at
students‘ ability to apply knowledge and skills in key subject areas and to analyse,
reason and communicate effectively as they examine, interpret and solve problems.
Lifelong learning Students cannot learn everything they need to know in school. In
order to be effective lifelong learners, young people need not only knowledge and
skills, but also an awareness of why and how they learn. PISA both measures
student performance in reading, mathematics and science literacy and also asks
students about their motivations, beliefs about themselves and learning strategies.

31
PISA also allows for the assessment of additional cross-curricular competencies from
time to time as participating countries see fit. For example, in PISA 2003, an assessment
of general problem-solving competencies was included. A major addition for PISA 2009
was the inclusion of a computer-delivered assessment of digital reading which is also
known as the digital reading assessment.
Countries may choose to gather further information through national questionnaires, for
example to explore connections between how students perform in PISA and factors such
as migration, gender and students‘ socio-economic background, as well as students‘
attitudes about school and their approaches to learning.
The data collected by PISA shows the success of some participants' schools and the
challenges being faced in other countries/economies. It allows countries and
economies to compare best practices and to further develop their own improvements,
ones appropriate for their school systems.
1.3. The application of the monitoring system
PISA has a worldwide scope: more than 70 countries have taken part in PISA so far. All
OECD member countries participated in the first three PISA surveys, along with certain
partner countries and economies. In total, 43 countries took part in PISA 2000, 41 in
PISA 2003, 58 in PISA 2006 and 74 in PISA 2009. For PISA 2009, 65
countries/economies implemented the assessment. A further 9 implemented the same
assessment in 2010, the results of which will be available in December 2011.
PISA is implemented regularly, and every three years countries can track their progress
regarding key learning goals. Through the collection of such information at the student
and school level on a cross-national comparable basis, PISA adds significantly to the
knowledge base that was previously available from national official statistics, such as
aggregate national statistics on the educational programmes completed and the
qualifications obtained by individuals.
Using the data from student, parent and school questionnaires, analyses linking
contextual information with student achievement could address:
Differences between countries in the relationships between student-level factors
(such as gender and socio-economic background) and achievement;
Differences in the relationships between school-level factors and achievement
across countries;
Differences in the proportion of variation in achievement between (rather than
within) schools, and differences in this value across countries;
Differences between countries in the extent to which schools moderate or increase
the effects of individual-level student factors and student achievement;

32
Differences in education systems and national context that are related to
differences in student achievement across countries;
Through links to PISA 2000, PISA 2003 and PISA 2006, changes in any or all of
these relationships over time.
Ranking
PISA scores can be located along specific scales developed for each subject area,
designed to show the general competencies tested by PISA.
PISA ranks participants according to their performance in reading, mathematics and
science. PISA does not give a collective score for all subjects combined; rather it gives a
score for each subject area and countries are ranked by their mean score in each area.
However, it is not possible to assign a single exact rank in each subject to each country.
Since scores reflect a small measure of statistical uncertainty and it is therefore only
possible to report the range of positions (upper rank and lower rank) within which a
country can be placed.
One of the goals of PISA is to compare the outcomes of education systems. PISA uses a
large basket of about 100 items for major domains, and 30 for minor domains, that are
representative of the knowledge, skills and understandings. Adams et al. (2010) conclude
this is big enough for robust comparisons of countries and also seems to be sufficient to
limit the impact of individual countries‘ views. Furthermore, experts cannot identify items
in advance that will advantage or disadvantage their country. Countries in general do not
gain or lose from considering their preferred items only, which means experts are not
able to predict which items can increase their country‘s chances of improving its ranking
position in PISA.
1.4. Conclusion
The OECD Programme for International Student Assessment (PISA) is a collaborative
effort among OECD member countries to measure how well students are prepared to
meet the challenges of today‘s knowledge societies. PISA looks at subject literacy, life-
long learning and public policy issues. It has a robust management structure with
worldwide experts, national managers, independent consultants and an independent
governing board all contributing to the implementation of the survey.
Every three years, countries can track their progress in meeting key learning goals. The
data collected by PISA shows the successes of schools and the challenges being faced
in other countries. It allows countries to compare best practices and to make their own
improvements appropriate to their school systems. PISA also allows for the assessment
of additional cross-curricular competencies from time to time as participating countries
see fit. And, countries may choose to gather further information through national

33
questionnaires. PISA is a successful programme, with more than 70 countries taking
part.
1.5. Sources
Adams, R., Berezner, A., Jakubowski, M. 2010. Analysis of PISA 2006 preferred items
ranking using the percent-correct method. OECD Education Working Papers, No. 46.
Adams, R. 2011. Comments on Kreiner 2011: Is the foundation under PISA solid? A
critical look at the scaling model underlying international comparisons of student
attainment. OECD technical note, April, 19, 2011 from:
http://www.oecd.org/document/35/0,3746,en_32252351_32235731_46538723_1_1_1
_1,00.html
OECD. 2011. PISA 2009 Technical report. From: http://www.oecd.org/document/19/
0,3746,en_2649_35845621_48577747_1_1_1_1,00.html.
OECD. 2011. OECD Programme for International Student Assessment (PISA). OECD:
http://www.oecd.org/document/53/0,3746,en_32252351_32235731_38262901_1_1_1
_1,00.html.
34
Annex 5: Commitment to Development Index (CDI)
1.1. Introducing the CDI
Since 2003 the Centre for Global Development publishes annually the Commitment to
Development Index (CDI). The index provides a country by country overview and aim is
to remind ―the world that reducing poverty in developing countries is about far more than
giving money‖ (CGD, 2011). The CDI assigns points in seven policy areas: aid (both
quantity as a share of income and quality), trade, investment, migration, environment,
security, and technology. Within each component, a country receives points for policies
and actions that support poor nations in their efforts to build prosperity, good
government, and security. The seven components are averaged for a final score. The
scoring adjusts for size in order to discern how much countries are living up to their
potential to help.2
The Commitment to Development Index has received a lot of media attention over the
years and has sparked criticism and discussion among a wide range of audiences.
Several Member States, NGOs, and academics have discussed the Index in detail and
have published their technical and political analyses, comments and recommendations.
The CDI is considered an important tool to trigger and enhance the discussion on policy
coherence for development. According to David Roodman ‗individual donors‘ make good
use of the CDI; ―the most engaged audience has been officials at bilateral aid agencies‖
(Roodman, 2006: 10).3 ―Dutch and Finnish governments … have adopted the CDI as an
official metric of development performance … The CDI has influenced development
policy white papers in Australia, Canada, Finland and Norway‖ (Roodman, 2006: 11).4
Several respondents in our interviews indicated they do not use the index, including
Austria and the EC. The OECD/DAC sees the Index as a rather arbitrary exercise, it is
not an OECD standard, which they support as a private initiative. Germany and Sweden
are active supporters of the CDI, since it is the most comprehensive and sophisticated
attempt to monitor PCD. Still they state it can be improved and should merely be seen as
a tool to lead to outcomes, rather than an end in itself.
2 See the CGD website: www.cgdev.org and http://www.cgdev.org/section/initiatives/_active/cdi/inside.
3 A consortium of governments supports the CDI, including Australia, Canada, Denmark, Finland, France, the
Netherlands, Norway, Sweden, Switzerland and the United Kingdom (Roodman, 2006). 4 CGD 2006 reviewed the use of the CDI by the following countries: Sweden, Germany, the United Kingdom, France,
Australia and Japan.
35
1.2. Criticism and discussion areas
The Index has to deal with data challenges. The CGD aims to choose indicators that are
available for all countries, and bases itself on standard data, as from the World Bank and
the OECD. The index also highlights data gaps, like with migration. Data are sometimes
outdated, sometimes unreliable.
The index is not based on a theoretical model, since no such overall model exists for
development processes. Evaluating policy is sometimes a matter of political philosophy,
in which CGD aims ―to seek common ground … to earn credibility with the largest
possible audience‖ (Roodman, 2006: 5). As a consequence, such an index always
includes a human judgement, since with every choice, the CDI implies a stand.
The CDI is based on ‘inputs’ of policies, but it is not an ‗outcome‘ index (Sawada,
Kohama, Kono, & Ikegami, 2004). One often mentioned improvement of the CDI is that it
should look beyond commitments and see what actual outcomes of PCD efforts are. Until
now the CDI does not concentrate enough on the outcomes or the response of
beneficiaries (Arness, 2010). As explained by CGD the index aims to measure not the
absolute impact of countries, but the degree to which they are realising their potential to
help. The CDI measures policies, which are complex and diverse and which have equally
complex and diverse relationships with development outcomes.5
Especially the Japanese Ministry of Foreign Affairs questioned the selection of the
seven components. The ministry argues that several categories may be extraneous
when measuring contributions to poverty reduction (MFA Japan, 2006). And according to
Sawada, Kohama, Kono, & Ikegami (2004) the appropriateness of the selected
categories in the CDI is not clear and there are valid arguments against including
additional criteria like immigration, peacekeeping operations and environment.
The CDI does not just measure but also ranks countries in a transparent and, as CGD
puts is, minimally arbitrary way, i.e. equally weighing the seven areas. Still there has
been some discussion whether this averaging of the seven components is appropriate,
since it is highly debatable if they all have the same impact on development (Arness,
2010, USJI, 2010). The Japanese question this equal weighting of components; the CDI
fails to take into account different degrees of impact, thus assuming that foreign aid and
migration have equal effects on development (MFA Japan, 2006). But a survey among
development experts by Chowdhury & Squire (2006) showed that in the end the weights
emerging from the survey were not sufficiently different from equal weights to significantly
alter the ranking of the CDI. Even more, as Roodman (2006) notes, as long as we do not
5 A comparison is often made with the Human Development Index, but that measures outcomes and encompasses
relatively few indicators.
36
know what policies would have an ‗equal effect on development‘, an ideal as equal
weighing is impossible.
The CDI has a composite approach to indicators. This means it combines metrics of
aid, trade, investment, migration, environment, security and technology. According to
Stapleton & Garrod (2008), referring to a survey, these six components should not be
weighted equally. They suggest trade and investment should be weighted higher,
migration and aid should be weighted lower, and peacekeeping and environment the
same as in equal weights. However, when applying these weights as proposed with
hypothetical data, the authors conclude that ―Although the unequally weighted
alternatives provide a superior goodness-of-fit to these hypothetical datasets, this is more
than counteracted by the increased model complexity associated with these unequally
weighted models according to most model selection criteria. The results of our analysis
suggest that the CDI should not diverge from its equal weights assumption.‖ (ibid.).
However, while each area is weighted equally, this is not the case for the components
and sub-components that make-up those areas. There is quite some discussion
regarding the relative weight the CDI attaches to different policy areas. For example, the
CDI puts lots of weight on security (in the first edition this component was just
‗peacekeeping‘), which is an area in which the US invests strongly (whether military
activities contribute to development is questioned, as are the role of national security
rationales, and other parameters that are relevant to validate it), and other countries can
hardly compete with the US on that (Roodman, 2011).6 This results in the US being
ranked number one in security ―while starting two wars in the past eight years‖ and
France getting a good score on environment thanks to their nuclear power plant program
(Owen, 2010).
The CDI is revised and updated annually since its public launch in 2003. This however
means the index cannot be fully compared over time. The index is really a point in time
relative index between countries. As Roodman (2006) notes: ―the pace of changes has
slowed markedly, so the index now seems to have reached a kind of maturity‖. (p.7). Still,
CGD provides some back-calculations to previous year with multi-year graphs making
inter-temporal comparisons meaningful. To allow meaningful comparisons over time, the
‗average‘ is always that of the 21 countries in the first edition of the CDI (2003). This
assures that if all countries improve on an indicator, so that none improves relative to the
group average, their scores will in fact rise (Roodman, 2007: 2).
Some more specific critics look at the aid component of the CDI, suggesting ways the
aid component can be strengthened, including applying selectivity weights, based on
additional factors besides governance and per capita income (McGillivray, 2003). Arness
(2010) notes that quality of aid should be given more consideration. As argued by
6 According to Roodman (2006) CGD does not take a stand on defense spending generally, being neutral about the
invasion of Iraq, neither rewarding nor penalizing the US for it.
37
especially Japan, the index undervalues the areas in which Japan has developed a
comparative advantage in aid, like ODA loans, technical cooperation and grant aid for
grassroots human security. Also, it has a different way to include loans and interests,
compared to the DAC (MFA Japan, 2006, France, 2006). It favours aid delivered to
countries of better governance and lower income, while the significant resources
contributed to fragile states should be treated differently according to some respondents
of the evaluation of CGD (CGD, 2006). Overall, the aid component has a
disproportionate impact on the ranking (Jason, 2011).
France, in turn, criticises the way the migration policy area is composed. The migration
component takes into account the magnitude of the potential transfers to the countries of
origin. This in itself is questionable, because transfers from migrants can certainly be
financial flows that contribute to development, but also represent the compensation for
the departure of potential factors of production. But, because of the lack of reliable data,
CGD uses indicators of human flows. However, these only take into account recent flows
of immigration and not the total immigrant population (as a percentage of the total
population). The impact of emigration flows on the economies and institutional systems of
the countries of origin is debatable, for instance brain drain (France, 2006).
Other areas not covered by the CDI include commitments to democracy and good
governance, both at home and within international institutions, as well as policies and
actions of partner countries in achieving development objectives (Ismail, 2007). Also,
the CDI does not reflect the efforts regarding alignment, specialisation and
harmonisation through aid coordination of the developed countries, and in that way fails
to recognise that countries should use their comparative advantages and complement
one another (MFA Japan, 2006, Arness, 2010, USJI, 2010, CGD, 2010). Furthermore,
the CDI neglects knowledge, learning and technology transfer. In fact, technical
assistance is criticised for being mostly tied and donor-driven, but technical assistance
transfers knowledge and may be the most important part of aid for growth. And results
through long-time efforts, such as the Asian Miracle, are not reflected (USJI, 2010).
The level to which the origin of the CDI can be recognised in the index is another area
for critique. CGD is a think tank founded in 2001 and based in Washington D.C. and
develops the CDI in cooperation with Foreign Policy magazine. According to some
commentators the index is pro-American; rating for example EU countries almost the
same on the variable of trade policy, while there are sharp and important differences in
trade policy among the MS of the EU, especially in subsidies and their impact (CGD,
2006). Also France comments that the CDI very much illustrates the American
perspective, with a very specific ―vision‖ of development. And it states the index ―was
above all devised to be an instrument for internal lobbying in the United States‖ (France,
2006). It is said to have too much a unilateral ‗we did it‘ tone in the way it is announced.
38
The CDI should be far more a collaborative work with regard to its methodology. As
described in the evaluation report of the Centre for Global Development, ―the CDI only
gave a partial look at the Western bilateral countries, neglected emerging donors, and
totally ignored big multilateral development agencies … also ignores large NGOs …‖
(CGD, 2006). Thus, the CDI is very much a Northern index, developed by Northern
(American) researchers. CGD should work together with institutes, universities in the
South, and some respondents suggest the need for more collaborative work on the
methodology (ibid.). Countries need to be involved in both the development and
validation of the index when they are part of the index itself. The CDI is not considered
inclusive (enough) by not involving countries concerned, however, opinions differ whether
it is important to involve more the countries that are indexed, or that the index should be
as independent as possible. Until now the CDI is considered to be an independent,
verifiable, transparent index.
As David Roodman concludes ―the list of CDI countries is starting to look archaic‖
(Roodman, 2011). This asks for more countries to be added to the CDI (CDI added South
Korea in 2008, and experimentally added Brazil, Russia, India, and China to the
environment component in 2007). The CDI should cover more countries, like the BRICS7,
the EU 13 (12 and Luxemburg8) and the Arab states.
1.3. Conclusion
Since 2003 the Centre for Global Development (CGD) publishes annually the
Commitment to Development Index (CDI). The index provides a country by country
overview for most OECD aid donors and the aim is to remind ―the world that reducing
poverty in developing countries is about far more than giving money‖ (CGD 2011a). The
CDI assigns points in seven policy areas: aid (both quantity as a share of income and
quality), trade, investment, migration, environment, security, and technology. The seven
components are averaged and equally weighed for a final score to rank countries based
on their input-performance on development. The scoring adjusts for economic size in
order to discern how much countries are living up to their potential to help. The CGD
itself acknowledges the following issues with the CDI:
The Index has to deal with data challenges;
There is no theoretical model on which the Index is based;
The Index cannot be fully compared over time since it is revised and updated annually; and
The list of CDI countries is, according to the designer, starting to look archaic.
7 A first exercise to include the BRICS is published by Roodman in 2007. This paper states that extending all seven
components of the CDI to major countries outside the OECD is not possible for lack of data. The paper is therefore an incremental step, adding four countries to only the environmental component of the CDI.
8 Luxemburg is not included since it was considered too small (Roodman, 2006).
39
The Index has received a lot of media attention over the years and has sparked criticism
and discussion among a wide range of audiences. It receives support from several DAC
members but is not systematically used or discussed in a relevant international or inter-
governmental forum, and is valued and used to varying degrees. Nevertheless, the Dutch
and Finnish governments have adopted the CDI as an official performance metric and
the index has influenced policy white papers in Australia, Canada, Finland and Norway
(Roodman 2006). The CDI is considered an important tool to trigger and enhance the
discussion on policy coherence for development. The following issues were raised
regularly in discussions:
The CDI is based on ‗inputs‘ of policies, it is not an ‗outcome‘ index;
The selection of the seven components, some are seen as extraneous when measuring contributions to poverty reduction;
The equal weighing of the seven areas, since it is highly debatable if they all have the same impact on development;
The use of composite approach to indicators, combining several policy indicators into a summary figure;
The relative weighting used for the components and sub-components of each of the seven areas;
The lack of attention for the quality of aid in the aid component;
The lacking of areas, including commitments to democracy and good governance, policies and actions of partner countries, efforts regarding alignment, specialisation and harmonisation.
The Northen bias, according to some commentators, the CDI is overly influenced by OECD member perspectives. CGD should work together with institutes, universities in the South, and some suggest the need for more collaborative work on the methodology.
1.4. Sources
Arness, V. (2010) U.S.-Japan Research Institute Hosts Seminar on Japan and the United
States' Commitment to Development: http://www.jica.go.jp/usa/english/
office/others/newsletter/2010/1010_12_06.html
Centre for Global Development (CGD) (2006). Centre for Global Development:
evaluation of impact.
Centre for Global Development (CGD) (2011). http://www.cgdev.org/section/
initiatives/_active/cdi/inside.
Chowdhury, S. & Squire, L. (2006) Setting weights for aggregate indices: An application
to the Commitment to Development Index and Human Development Index. Journal of
Development Studies, 42, 5, p. 761-771. http://www.tandfonline.com/
doi/abs/10.1080/00220380600741904.
France (2006) France: The ―Commitment to Development‖ Index 2006 of the ―Center for
Global Development‖. http://www.diplomatie.gouv.fr/en/france-priorities_1/
development-and-humanitarian-action_2108/international-stakes_2706/development-
40
factors_5768/the-commitment-to-development-index-2006-of-the-center-for-global-
development_9617.html.
Governance Assessment portal (n.d.) http://www.gaportal.org/global-indicators/
commitment-to-development-index.
Ismail, F. (2007) CDI 2007 launch briefing. An ODI, All Parliamentary Group on Overseas
Development and Centre for Global Development public event.
http://www.odi.org.uk/events/details.asp?id=216&title=commitment-development-
index-2007-launch-briefing#report
Jason (2011) Countries most committed to global development. Aid & Development,
Foreign Policy. http://www.globalsherpa.org/center-global-development-index.
McGillivray, M. (2003) Commitment to Development Index: a critical appraisal. AusAid
November 2003.
Roodman, D. (2006) Building and running an effective policy index: lessons from the
Commitment to Development Index. Center for Global Development.
http://www.cgdev.org/content/publications/detail/6661
Roodman, D. (2007) How do the BRICs stack up? Adding Brazil, Russia, India, and
China to the environment component of the Commitment to Development Index.
Center for Global Development.
Owen (2010) Blog Owen Barder, comments: http://www.owen.org/blog/4138.
Sawada, Y., Kohama, H., Kono, H. & Ikegami, M. (2004) Commitment to development
index (CDI): critical comments. FASID Discussion Paper on development assistance
no. 1.
Stapleton, L. M. & Garrod, G. D. (2008) The commitment to development index: An
information theory approach. Ecological economics, 66, 2-3. p. 461-
467. http://www.citeulike.org/user/jfao/article/5066829.
USJI (2010) Summary of USJI seminar on ‗Commitment to Development Index: Its
Meaningfulness and Policy‘, September 9, 2010: www.us-
jpri.org/en/reports/usjiweek/summary4.pdf.

41
Annex 6: Measuring support and protection in agriculture
– the political economy of OECD’s PSE indicator
By Carmel Cahill9 OECD publishes annually the Producer Support Estimate, a measure of the transfers to agricultural producers generated by agriculture-specific policies. The PSE (and a suite of derived indicators) cover all OECD member countries and a growing number of emerging
economies included China, Brazil, the Russian Federation, South Africa and Ukraine. The time series currently available covers 1986 to 2010 for OECD countries and from the mid 1990s for others.
1.1. Impetus
When OECD launched its work to measure support and protection in agriculture in its member countries, the mandate came (in 1982), not from Agriculture Ministers, but from Trade and Finance Ministers. In other words the recognition of a need came from outside the sector. This is a feature of many reform efforts – and of the analytical work that supports them. Since the early 1980s the most radical reforms in agricultural policy have occurred as part and parcel of economy-wide structural reform or because the fiscal/economic burden of agricultural policy has become too big for the economy to bear. Armed with its mandate, how did OECD proceed? The first step was to identify a small number of ―volunteer‖ countries, willing to have their agricultural policies examined under the microscope. In this case the first to come forward were Canada, Australia, New Zealand and the United States. Additional OECD member countries were examined in small batches of 2 or 3, to the point where even the most reluctant were drawn into the process. Not surprisingly, willingness to be examined early in the process was found to be quite strongly inversely correlated with the level of support and protection estimated, with high support Asian and European countries (including some who subsequently became members of the EU) stepping up last. The success and acceptability of this index has built on the following factors.
1.2. Buy-in
Measurement of the Producer Support Estimates (PSEs) and related indicators begins in each case by an in-depth country study which seeks to establish a careful and detailed account of the agricultural policy environment. This is essential to the development of the methodology for the indicators, and to the process of checking for consistency between the known policy context and what the indicators are saying.
9 Carmel Cahill is Senior Counsellor in the OECD‘s Directorate for Trade and Agriculture.

42
Country studies are undertaken with full cooperation of the country being examined. Consultation and checking occur at every step, including round table discussions in capitals, culminating in a peer review, in which fellow OECD member countries vet the results. When the indicators are eventually published, it is with the approval of the country examined and of the remainder of the OECD membership. Country buy-in and peer review have continued to be required as emerging economies and other significant market players that are not OECD members have been added to the list of countries covered. Indonesia and Kazakhstan are currently undergoing this process. OECD has never prepared or published support indicators without the involvement and cooperation of the country studied.
1.3. The Producer Support Estimates (PSEs) and related indicators
Adaptability As agricultural policy has been reformed in response to economic and trade imperatives and the changing needs of the sector itself, the methodology has been adapted and the typology of measures and instruments included in the indicators has changed. Academic and policy experts are conscripted into this process. Revision and renewal have been crucial to the continuing relevance and importance of the indicators. Revisions are applied to the entire historical series, avoiding disruptions for users and interpreters of the information. Significant revisions, are discussed and agreed with OECD member countries, another factor ensuring the continuing credibility of the measure.
Comparability While some member countries involved in the early stages of the exercise insisted on the non-comparability of the indicators across countries, their objections were gradually dropped and now, there is general recognition that the indicators are, as far as is possible, comparable across countries. To ensure that comparability will not be challenged and the entire exercise undermined, a constant effort of checking consistency of coverage and of methodology is undertaken.
Replicability This is an important feature of a good indicator. OECD provides considerable detail about the data, and the methods used to calculate the indicators. This allows a healthy process of ―contestation‖ as background data, calculations and the methodology, including a detailed manual, are freely available. The OECD Secretariat frequently engages with a
wide range of stakeholders on issues they raise directly with the Secretariat, or via academic or other channels.
Utilization Development of the PSE began in the run-up to the Uruguay Round of international trade negotiations, at a time when global trade in agricultural commodities was strongly disrupted and tensions were high. The early calculations allowed the technical and the policy debate to be taken to a different, better informed level internationally. The domestic support discipline adopted during the Uruguay Round was a direct result. The PSE has continued to provide a comparable, internationally recognised benchmark of support to agriculture, but it has also served governments in their domestic reform efforts.

43
A broad range of stakeholders, NGO‘s, researchers, modellers and commentators also use the measures in their own work.
Continuity Finally, the credibility of an indicator is developed and strengthened over time. Both stakeholders and opponents familiarise themselves with the measures and develop appropriate ways to interpret and analyse them. Continuity is essential to inform an on-going and gradual process of policy reforms in agriculture. This requires long-term commitment. In the case of OECD‘s agricultural support indicators, the financial commitment has come from the OECD member countries, who have also accepted the strong institutional independence that is needed to maintain the credibility of the work. Source: Agricultural Policy Monitoring and Evaluation 2011, OECD, Paris. www.oecd.org/
agriculture/pse

44
Annex 7: Issues in establishing PCD causal chains – the
case of food security
OECD country agricultural policies have been consistently criticised by developing countries (see Joint Statements by the G-110, 2005 and 2006) and by development NGOs (consult the web pages of Oxfam, Germanwatch, ActionAid and Aprodev for examples) for their adverse effects on developing country agriculture and on the growth and development prospects of developing countries. Policies to protect domestic agriculture in OECD countries have encouraged over-production and led to the dumping
of surpluses on world markets, depressing world market prices and thus undermining the profitability of farmers in developing countries and discouraging the pursuit of agriculture-led development strategies (Anderson and Martin, 2006; Bouet 2006; World Bank, 2008). The criticisms are directed against both the way subsidised OECD agricultural products undermine the local markets for domestic producers and compete with developing country exports in third country markets, and at the way trade barriers make it more difficult for developing countries to export to OECD markets.
1.1. Not all developing countries are affected in the same way
More detailed investigation shows that developing countries are not necessarily all affected in the same way by OECD agricultural policies (for example, some countries benefit from preferences and would be adversely affected by the erosion of these preferences even if that problem largely affects sugar and banana exporters (Low et al, 2006). The impact on poverty and food security in developing countries depends on whether they are net importers or exporters of OECD-protected commodities or their close substitutes, the nature of their trade regime relations with the countries providing support (preferential or not), the nature of their integration into global supply chains (smallholder value chains versus corporate farming), the distribution of poverty among net food producers and net food purchasers within the country, and the structure of their own domestic trade and agricultural policies. For example, the concern among net food importing low income countries that they would be disadvantaged by further agricultural trade liberalisation led to the inclusion of the Marrakesh Decision on Measures Concerning the Possible Negative Effects of the Reform Programme on least-developed
and net food-importing developing countries.
1.2. Producers versus consumers
The fact that some developing countries, and groups within developing countries such as poor consumers, might benefit from the low world market prices has long been acknowledged (Panagariya, 2005). But it was the negative impacts of low world market prices on agriculture that were the focus of the political criticism documented in the opening paragraph. The focus on the effects of low world market prices for producers was justified by the predominance of agriculture as a source of employment and
45
economic activity and the evidence that the spill-over and multiplier effects of agricultural growth are higher in low-income economies than for growth in other sectors. This primary focus on producers changed with the food price spike of 2008-09. International organisations and development NGOs which previously had highlighted the negative effects of low world food prices on poverty and development turned to highlighting instead the negative impact of high world food prices for poverty (Swinnen, 2011). Figures of the significant increase in the numbers in poverty and likely to experience hunger as a result of the immediate impact higher world market food prices were widely circulated (FAO 2008 chap 6; Ivanic and Martin, 2008). This seemed to contradict the view underlying criticisms of the incoherence of OECD agricultural policies that unduly low world food prices were the cause of poverty and food insecurity in
developing countries. Subsequent research has explored the conditions under which these impact effects of higher world food prices might be reversed over time. Even if the immediate impact of higher food prices within developing countries on poverty is often negative, over time these can turn positive as indirect and induced effects of higher farm incomes come into play (Aksoy and Hoekman, 2010). The dynamic nature of these effects underlines the need for systematic inquiry and a combination of quantitative and qualitative research to understand the actual impact of developed country agricultural policies in developing countries. The fact remains, however, that changes in food prices create both winners and losers between and within developing countries. Identifying more development-coherent policies in this situation means recognising the important role that price play in allocating resources at a global level. Trade-distorting agricultural policies are incoherent because they depress world market prices and discourage food production in developing countries below its optimal level. Biofuel mandates are incoherent with development even if they raise global agricultural prices above market-determined levels because they send a misleading signal to developing countries and encourage a mistaken and potentially costly misallocation of resources. But sets of policies have important distributional impacts within developing countries, creating both winners and losers, but ultimately the coherence of these policies is judged by whether they distort the sensible allocation of resources in developing countries.
1.3. Whole-of-government approach
PCD analysis typically starts by taking individual OECD country policies, such as agricultural policy, and evaluating their impact on developing countries. When policies are examined from the perspective of a developing country objective such as food security, then a range of OECD policies may be relevant. The impact of agricultural policy on developing countries works through its effect on the level and stability of world market prices, and this will also be a relevant channel for other OECD policies. But, in addition, other policies also bring new channels of impact into the picture. Non-agricultural OECD policies relevant to food security in developing countries include food safety, sanitary and phyto-sanitary (SPS), trade, environmental, renewable energy,

46
climate change and research and innovation policies. Food safety and SPS measures, if abused, affect world market prices but also have a discriminatory effect as they are usually targeted against specific exporting countries. Trade policies clearly affect world prices, but also increasingly involve agreements on ‗beyond the border‘ measures with specific countries or groups of countries. Environmental policies may limit agricultural production and hence influence world prices, but can also impact on developing countries through influencing the global stock of biodiversity. Renewable energy policies may also limit food production and hence world prices, but will also affect developing countries through their influence on fossil fuel prices. Climate change policies may limit agricultural production or influence consumption patterns and hence the level of world prices, but by influencing the stock of greenhouse gases in the atmosphere they also affect yield levels in developing countries. Policies towards agricultural research and the use of innovations
(for example, biotechnology) also have the potential to influence OECD agricultural production levels and hence world market prices, but may also increase the shelf of technologies available to developing countries and hence their yield potential in the longer-run. It might be possible, with creative modelling, to determine the overall impact of a particular country‘s policies on food security in developing countries. But, even assuming that this would be possible and that the results were credible and accepted, the value of such an exercise can be questioned. The fact that some policies might benefit developing countries and thus offset possible damage from other policies does not legitimise or justify the incoherence of those policies with adverse effects. If such policies could be reformed, then the benefits to developing countries would be even greater.
1.4. Policy change in a world of distortions
Policy changes never take the form of ‗an either/or‘ choice, e.g. whether a country should have an agricultural policy or not. Policy change usually involves either a change in policy instrument, e.g. a move from coupled to decoupled payments, or a change to the setting of an instrument, e.g. the level of a coupled payment. In a policy setting where there are already other policy instruments in place, evaluating the impact of a policy change needs to take account of the ‗theory of the second-best‘. This theory notes that, where an existing distortion is in place, changing a second policy may have welfare effects opposite to that which might have been normally expected.
As an example, consider the role of production quotas which are still a common feature of OECD country agricultural policies. Production quotas are popular with producers because, assuming inelastic demand, restricting supply will raise the producer price sufficiently to raise overall producer income. For such policies to work, the domestic market must be closed to imports, usually by means of a prohibitive tariff.10 From the point of view of third countries, the principal distortion is the high domestic market price maintained by the prohibitive tariff. The production quota may limit the downward pressure on the world market price that would otherwise result from the high domestic
10
Imports under a tariff rate quota are compatible with operating a production quota. The EU sugar regime with preferential imports provides an example.
47
price. In this context, removing the production quota would exacerbate the effect on world market prices if the tariff protection is left unchanged. As noted in the previous section, similar offsetting effects can also operate across policies. An obvious example is that introducing policies to promote biofuel use (which tend to raise world market prices) can, at an aggregate level, work to offset the lowering effect on world market prices of agricultural policy.11 The fact that one policy may act to counter the adverse effects of another policy on developing countries is relevant when measuring impacts, but should not be used to justify either policy from a PCD perspective.
1.5. Impact on ‘development’, not ‘developing countries’
Given the heterogeneity of developing countries, there will always be some countries that gain from a particular OECD country policy stance even while others are made worse off, and some groups that gain within developing countries while some groups are made worse off. Simply adding up the winners and losers from a particular OECD country policy can provide a first indication to determine if that policy is coherent with the development objective of reducing poverty or not. But it cannot be the sole factor taken into account. Some of the effects will be impact effects while others come into play over time, so the time period for the analysis would have to be specified. There may be disagreement on the set of developing countries to be included in the calculation, and whether these should be weighted equally or using some other set of weights. The relative importance of producer and consumer groups would need to be established. Sometimes the measured impacts are biased because of the existence of other distorting policies in place. Sometimes the effect will depend on the policy stance in the developing country itself, and changes in developing country policies will change the size and even the direction of the measured impact of the OECD country policy. For these reasons, evaluating the coherence of OECD policies for food security should focus more on their implications for the framework of global rules rather than a mechanical calculation on their impacts on developing countries. Developing countries have the main responsibility to provide the appropriate incentives and to make the necessary investments to improve their food security, but their decisions will be influenced by the global framework and rules environment. Greater predictability and stability in global rules to allow developing countries to take advantage of the gains from
trade and ensuring that these rules are consistent with efforts to improve food security should be key metrics for the measurement of PCD. Sources:
Aksoy, M. and Hoekman, B. (eds.) (2010). Food Prices and Rural Poverty, Washington, D.C., World Bank.
11
The effects will be very different for individual developing countries, depending on the relative importance of fossil fuels, biofuel feedstocks and OECD-supported agricultural products in their imports and exports.

48
Anderson, K., and Martin, W. (eds.), (2006). Agricultural Trade Reform and the Doha Development Agenda,(New York: Palgrave Macmillan and the World Bank.
Bouet, A. (2006). What can the poor expect from trade liberalization: opening the ―black box‖ of trade modelling, MTID Discussion Paper No. 93, Washington, D.C. International Food Policy Research Institute.
FAO, (2008). The State of Food and Agriculture. Rome: FAO
G-110 2005, Joint Statement 16 December 2005, accessed online http://www.world-economy-and-development.org/wearchiv/531686972e0d61801.php 9 January 2012
G-110 2006, Joint Statement 1 July 2006, accessed online http://www.philippineswto.org/Alli/G-110_Joint_Statement.htm 9 January 2012.
Ivanic, and Martin, W., (2008). Implications of higher global food prices for poverty in
low-income countries, Agricultural Economics 39 supplement, 405–416
Low, P., Piermartini, R. and Richering, J., 2006, Non-Reciprocal Preference Erosion Arising From MFN Liberalization in Agriculture: What Are the Risks? Staff Working Paper ERSD-2006-02, Geneva, World Trade Organisation.
Panagariya, A., (2005). Agricultural liberalisation and the least developed countries: six fallacies, World Economy, 28, 9, 1277–1299.
Swinnen, J., (2011). The right price of food, Development Policy Review 29, 6, 667–688.
World Bank, (2008), Agriculture for Development, World Development Report, Washington, D.C.

49
Annex 8: Consultation note used for the interviews
Measuring Policy Coherence for Development Studies on Modernising the Comparability of Donor Contributions
Post-2015 Consultation Note for interviews, November 2011
About this note: In September 2011, The Netherlands Ministry of Foreign Affairs
and the German Federal Ministry for Economic Cooperation and Development jointly
commissioned two complementary studies under the heading ‗Modernising the
Comparability of Donor Contributions Post-2015‘. The studies respectively aim to (1)
look into scenarios of how development-related financial contributions can be
associated to Official Development Assistance reporting and (2) examine the design
and feasibility of a ‗development-friendliness‘ index to evaluate donor policies
beyond their quantitative ODA contributions.
The team conducting the second study is composed of experts of the European
Centre for Development Policy Management (ECDPM) and Trinity College Dublin.
Both organisations have in recent years done various studies in the area of Policy
Coherence for Development, and build on these experiences in doing this more
specific study. This note has been circulated to a select group of invited experts
asking them to contribute to this study by means of a semi-structured interview.
These interviews are preferably conducted face-to-face or by phone, while
alternatively written contributions in reference to the questions below are also
welcomed. Interviewees include representatives of DAC members, OECD and EC
officials, and subject matter specialists.
It is emphasised that the content of this note by no means prejudges the outcome of
this study but aims to stimulate further inquiry and analysis, and does not reflect the
official views of the contractors of this study.
INTRODUCTION
While development aid efforts remain central to donor efforts at poverty reduction in
developing countries, the importance of non-aid policies and specifically their coherence
with development objectives has emerged in recent years as a focus of development
efforts under the Policy Coherence for Development (PCD) agenda. PCD is firstly about
doing no harm to developing countries by ensuring that progress towards development
assistance goals is not undermined by policies which relate primarily to domestic goals.
Secondly, PCD is about searching for potential synergies and win-win scenarios, where
domestic policies support development goals whilst securing other objectives too.

50
In the last decade, the EU Commission, the OECD and several EU member states have
made some progress pursuing PCD by adopting policy statements of intent, taking
specific measures aiming to ensure PCD is taken into account in policy discussions, and
upgrading monitoring and evaluation to create a basis for accountability. While finding a
legal basis for EU Member States in Article 208 of the Treaty for European Union, the
concept is also increasingly acknowledged at the international level, e.g. in the Outcome
Document of the 2010 MDG summit. As the PCD agenda matures from its early
development stage, calls for strengthening monitoring and evaluation have come to the
fore. In 2009 the European Ministers for Development called for greater result-orientation
in PCD, and in 2010 the OECD Council adopted recommendations on PCD also
emphasising this issue.
As per the nature of promoting PCD, i.e. avoiding to do harm and seeking policy
synergies, it is inherently a highly information-intensive process. While the first aspect of
avoiding to do harm can especially be strengthened by learning from existing policies
through gathering empirical data ‗on the ground‘, seeking synergies is best explored in
the process of formulating new policies or reforming existing ones with the help of
secondary data such as economic statistics. Using different types of information, a
comprehensive set of indicators designed to capture the coherence of non-aid policies
with development objectives can help by providing a framework for policy action, track
progress and make explicit casual chains. Such indicators can be of a quantitative or
qualitative nature, and capture changes at various level of complexity from inputs to
outcomes.
The value of indicators to measure policy progress is well known in the policy evaluation
literature. Indicators can focus public awareness, they can raise the quality of public
debate, and they can provide a measure of success or otherwise in meeting policy
objectives. Examples of ‗successful‘ indicators that have influenced policy decisions
include the Millennium Development Goals (MDGs), the indicators of the Paris
Declaration on Aid Effectiveness and the 0.7 per cent official development assistance
(ODA) commitment. In the area of PCD, the best known set of indicators, the
Commitment to Development Index (CDI), is published by the Center for Global
Development (CGD) in Washington DC. This index, which is supported by the
Rockefeller Foundation and eight bilateral donors12, is however restricted to DAC
members in its coverage. In addition to not including other donors (e.g. members of the
EU12 who have an observer-status), the CDI is not ‗institutionalised‘ in the sense that it
has a formal route into key political debates on development in the UN or EU.
This study assesses the feasibility of developing an agreed ‗Development Friendliness
Index‘ or ‗Development Coherence Index‘ that could inform a comprehensive framework
for evaluating donor contributions post 2015. We invite you to contribute to this study by
12
Australia, Canada, Finland, Germany, the Netherlands, Norway, Sweden, and the United Kingdom.
51
responding to a series of questions. The 10 questions have been grouped under three
headings:
1. Your position and past experiences in relation to strengthening PCD result-
orientation and monitoring
2. Overall scope of the index in terms of policy areas and indicators used
3. Budgetary and institutional feasibility considerations
QUESTIONS
1. Your position and past experiences in relation to strengthening PCD result-
orientation and monitoring
This first group of questions seeks to gather some general ideas and experiences with
monitoring and evaluation of PCD. They are relatively straightforward and serve to gain
further insights into what efforts have been made in different domains of PCD, and what
kinds of progress or challenges resulted from these efforts.
1.1 Do you think measurement of the policy coherence of donor countries
should form part of the post-2015 development assistance reporting
framework? In international discourse, should measurement of policy
coherence be given equal, less or more billing than measurements of ODA
or finance for development?
1.2 What priority does your organisation/government give to promoting
Policy Coherence for Development, and in what ways are efforts being made
to keep track of progress made (e.g. in parliamentary committees, specific
reporting, …)?
1.3 (as applicable) Does your government financially support the operations
and improvements of the CDI index, and if so how do you use and value this
index in your work?
1.4 An important consideration for measuring PCD is who to include: would
you consider it important to measure the impact of donor policies on all
DAC aid recipient countries, or would you prefer to select a specific group of
developing countries, e.g. least-developed countries or countries meeting
specific criteria (e.g. countries eligible for the General System of
Preferences+ scheme of the EU)?
Answers:
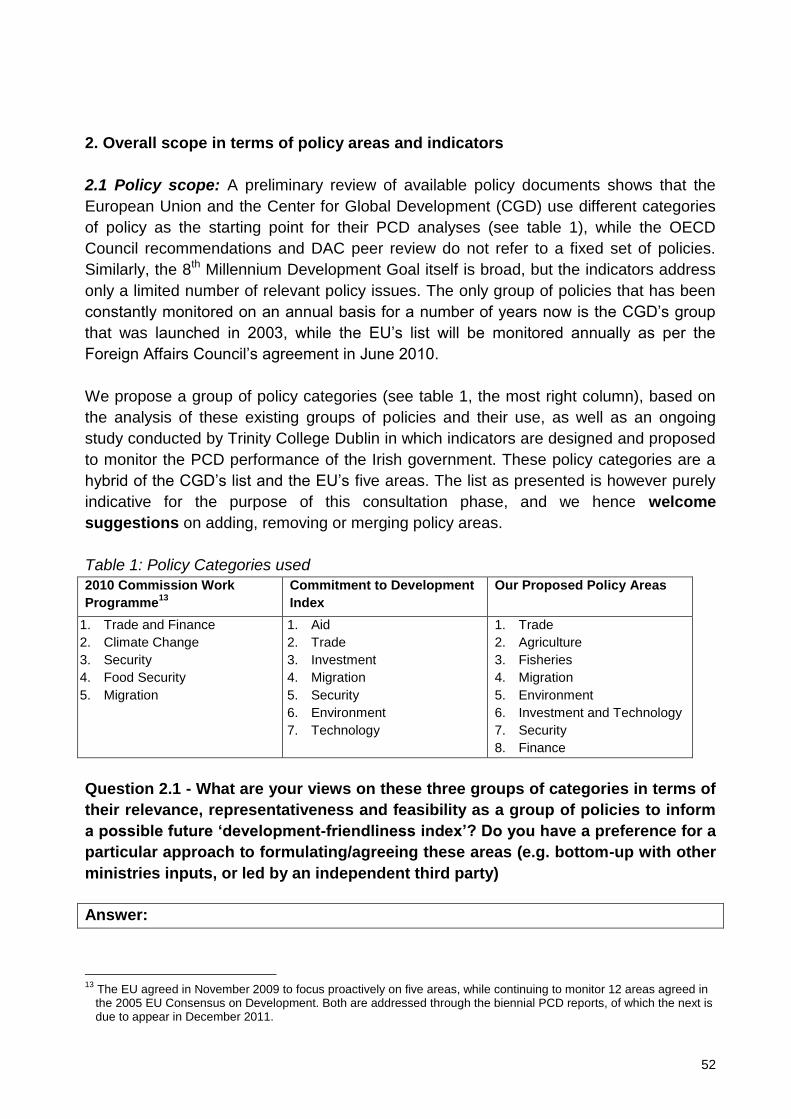
52
2. Overall scope in terms of policy areas and indicators
2.1 Policy scope: A preliminary review of available policy documents shows that the
European Union and the Center for Global Development (CGD) use different categories
of policy as the starting point for their PCD analyses (see table 1), while the OECD
Council recommendations and DAC peer review do not refer to a fixed set of policies.
Similarly, the 8th Millennium Development Goal itself is broad, but the indicators address
only a limited number of relevant policy issues. The only group of policies that has been
constantly monitored on an annual basis for a number of years now is the CGD‘s group
that was launched in 2003, while the EU‘s list will be monitored annually as per the
Foreign Affairs Council‘s agreement in June 2010.
We propose a group of policy categories (see table 1, the most right column), based on
the analysis of these existing groups of policies and their use, as well as an ongoing
study conducted by Trinity College Dublin in which indicators are designed and proposed
to monitor the PCD performance of the Irish government. These policy categories are a
hybrid of the CGD‘s list and the EU‘s five areas. The list as presented is however purely
indicative for the purpose of this consultation phase, and we hence welcome
suggestions on adding, removing or merging policy areas.
Table 1: Policy Categories used
2010 Commission Work
Programme13
Commitment to Development
Index Our Proposed Policy Areas
1. Trade and Finance
2. Climate Change
3. Security
4. Food Security
5. Migration
1. Aid
2. Trade
3. Investment
4. Migration
5. Security
6. Environment
7. Technology
1. Trade
2. Agriculture
3. Fisheries
4. Migration
5. Environment
6. Investment and Technology
7. Security
8. Finance
Question 2.1 - What are your views on these three groups of categories in terms of
their relevance, representativeness and feasibility as a group of policies to inform
a possible future ‘development-friendliness index’? Do you have a preference for a
particular approach to formulating/agreeing these areas (e.g. bottom-up with other
ministries inputs, or led by an independent third party)
Answer:
13
The EU agreed in November 2009 to focus proactively on five areas, while continuing to monitor 12 areas agreed in the 2005 EU Consensus on Development. Both are addressed through the biennial PCD reports, of which the next is due to appear in December 2011.
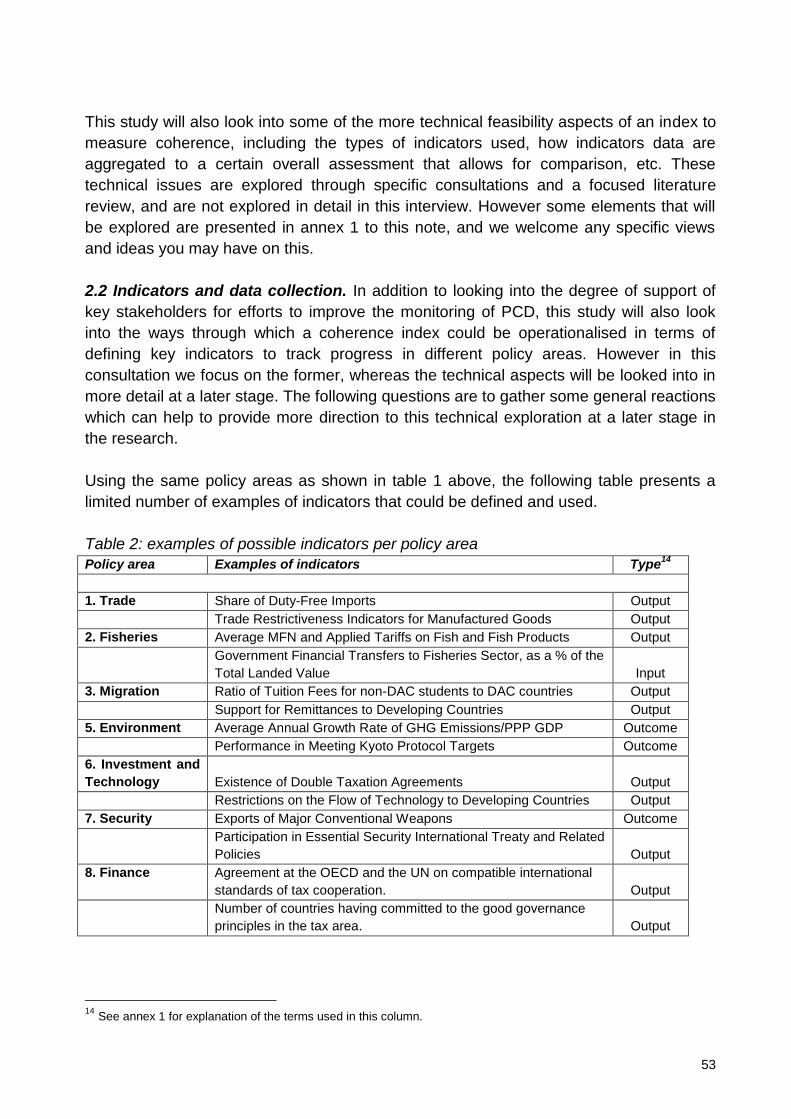
53
This study will also look into some of the more technical feasibility aspects of an index to
measure coherence, including the types of indicators used, how indicators data are
aggregated to a certain overall assessment that allows for comparison, etc. These
technical issues are explored through specific consultations and a focused literature
review, and are not explored in detail in this interview. However some elements that will
be explored are presented in annex 1 to this note, and we welcome any specific views
and ideas you may have on this.
2.2 Indicators and data collection. In addition to looking into the degree of support of
key stakeholders for efforts to improve the monitoring of PCD, this study will also look
into the ways through which a coherence index could be operationalised in terms of
defining key indicators to track progress in different policy areas. However in this
consultation we focus on the former, whereas the technical aspects will be looked into in
more detail at a later stage. The following questions are to gather some general reactions
which can help to provide more direction to this technical exploration at a later stage in
the research.
Using the same policy areas as shown in table 1 above, the following table presents a
limited number of examples of indicators that could be defined and used.
Table 2: examples of possible indicators per policy area
Policy area Examples of indicators Type14
1. Trade Share of Duty-Free Imports Output
Trade Restrictiveness Indicators for Manufactured Goods Output
2. Fisheries Average MFN and Applied Tariffs on Fish and Fish Products Output
Government Financial Transfers to Fisheries Sector, as a % of the
Total Landed Value Input
3. Migration Ratio of Tuition Fees for non-DAC students to DAC countries Output
Support for Remittances to Developing Countries Output
5. Environment Average Annual Growth Rate of GHG Emissions/PPP GDP Outcome
Performance in Meeting Kyoto Protocol Targets Outcome
6. Investment and
Technology Existence of Double Taxation Agreements Output
Restrictions on the Flow of Technology to Developing Countries Output
7. Security Exports of Major Conventional Weapons Outcome
Participation in Essential Security International Treaty and Related
Policies Output
8. Finance Agreement at the OECD and the UN on compatible international
standards of tax cooperation. Output
Number of countries having committed to the good governance
principles in the tax area. Output
14
See annex 1 for explanation of the terms used in this column.
54
Question 2.2 – Defining indicators: can you share some key reflections on
indicator-formulation exercises for PCD (or otherwise) in which you have been
involved? Would you be of the opinion that an index should in principle work on
the basis of existing data, or should additional investments be made in terms of
generating new or improving current data?
Answer:
3. Institutional and financial feasibility aspects in relation to the index
The previous questions mostly addressed the conceptual and methodological aspects of
a future coherence index. However, it is clear that putting in place an internationally
recognised index for monitoring the contributions of all donor policies to development is
only to a small extent a technical endeavour. This is why this study also wishes to collect
views and ideas on the political, institutional and technical aspects. In a later stage, the
study team will explore and present particular scenarios which can be considered in the
near future. Through this stakeholder exchange, the study team seeks to gather some of
the key ‗ingredients‘ that should inform such scenarios through the following three
interrelated questions:
3.1 At what level and in what kind of organisation would you think an
internationally recognised coherence index could best be adopted? (e.g. UN
Development Cooperation Forum, the next MDG review meeting, OECD,
WorldBank)
3.2 Would you have any ideas on the organisation of the data collection
process? E.g. should an official institution like the OECD or UN be charged
with collecting and analysing the data, or should an independent
organisation do so with the OECD or UN providing the necessary forum for
discussion?
3.3 Creating and maintaining a new index could generally bring considerable
costs. What are your ideas on (a) the political basis for justifying making
these costs and (b) how these could be shared between the different donors
given their collective responsibility to promote PCD as expressed in the EU
treaty and/or international declarations?
Answers:

55
Annex to consultation note: Technical feasibility issues to be explored in this
study
Note: This study will also look into some of the more technical feasibility aspects of
an index to measure coherence, including the types of indicators used, how
indicators data are aggregated to a certain overall assessment that allows for
comparison, etc. These technical issues are explored through specific consultations
and a focused literature review, and are not explored in detail in this interview.
A: Types of indicators: From previous work we identify three types of indicators suitable
for any proposed development friendliness index and they are as follows:
Outcome Indicators: Policy indicators tend to focus on outcomes. Outcomes are
defined as socio-economic variables such as, in the case of the Millennium Development
Goals (MDGs), income per capita, school enrolment rates or child malnutrition rates.
They measure real trends that are a result of both policy and societal changes and may
only be partly influenced by policy instruments. As such, they may not accurately
measure policy efforts. For example, countries in close proximity to developing counties
and sharing a language are likely to have a higher proportion of immigrants for/(with)in? a
given immigration policy.
Policy Outputs: Policy output indicators capture concrete changes in efforts designed to
make policy more ‗development-friendly‘. They are attractive measures because they are
directly under the influence of policy-makers. A policy output might for example include
the existence of an information platform comparing the costs of making remittances, the
level of tuition fees for students from developing countries or a tariff rate for beef imports.
The key challenge in identifying output indicators is the need to have a clear ‗story‘
linking the indicator to success in development.
Policy Inputs: Policy input indicators are useful where it may be hard to quantify or
summarise the output of a policy in a single indicator. Input indicators usually monitor
donor expenditure on a particular policy area. The extent of financial contributions can be
considered an important proxy for commitment to a policy area. Examples would include
financial contributions to aid for trade or biodiversity or, with negative consequences for
development, trade-distorting subsidies. Input indicators have the advantage that they
are easily measurable and comparable across countries. However, because the
effectiveness of expenditure in meeting development goals may differ across countries,
rankings using policy input indicators must be interpreted cautiously.
Policy stance indicators: Policy stance indicators arise because of the nature of
decision-making within the European Union where competences in particular policy areas
may be transferred completely to, or shared with, the EU. EU decision-making is a
process of compromise between Council, Parliament and member states. In this process,
56
the position defended by member states may not be reflected in the final outcome. A
similar situation occurs in multilateral negotiations, where member states positions, or
indeed the European Union‘s position may not be obvious. To capture the real position of
countries in such negotiations rather than the agreed outcome, the transparent
publication of pre-negotiation positions is required. In most cases this information is not
available making the inclusion of policy stance indicators in most cases infeasible.
Partner Country Strength: A fifth indicator type, developing country partner strength,
may be less under the influence of EU policy makers but its inclusion is justified for a
number of reasons. These indicators are intended to capture the role key developing
country partners on the coherence of EU and member state policies.
B: Aggregation Issues: There are two alternative approaches to presenting policy
indicators. Composite indicators, combining several policy indicators into a summary
figure, such as the Centre for Global Development‘s Commitment to Development Index
(CGD, 2010). An alternative approach is to present a portfolio of indicators.
Composite indicators can be more easily understood than a portfolio of individual
indicators as they combine diverse indicators into a more digestible measure. A portfolio
of indicators can result in information overload. In a fast moving and media-influenced
policy environment, indicators ideally should deliver short concise messages to
stakeholders in the policy process.
As developing composite indicators involves a two stage methodology, namely
standardisation and aggregation (including value weighting) some caution is required.
First, standardisation imposes uniform units on disparate indicators. This process can
serve to dumb down the contribution of the individual indicator to policy discourse and
render absolute differences in policy performance less meaningful. Second, aggregation
of standardised indicators into a composite indicator opens up the question of value
weighting. One can weight the indicators based on a subjective ratio of importance, or
remain agnostic and simply leave the indicators unweighted and calculate a simple
average of the scores. Nevertheless, there are a number of examples in social science of
composite indicators that use predetermined value weighting, such as the CGD practice
in constructing the policy area indicators in its CDI index. For example, the environment
score in the CDI is made up of standardised climate change indicators (60%), biodiversity
and global ecosystems (30%) and fisheries (10%). The CDI overall country score weights
the standardised scores for aid, trade, environment, security, technology, migration and
investment as equal.