measuring marketing profitability metrics of … · measuring marketing profitability metrics of...
TRANSCRIPT
D.U. Journal of Marketing, Vol. No. 15, June 2012 (Published in November, 2014)
MEASURING MARKETING PROFITABILITY METRICS
OF FIRST GENERATION PRIVATE COMMERCIAL
BANKS IN BANGLADESH
Mahamudul Hasan
Abstract: While a lot has been said about the Financial Profitability, not
much has been said about the concept of Marketing Profitability for
commercial banks. This paper introduces the Marketing Profitability
Metrics (MPM) for the evaluation of Bank‟s Marketing Performance. One
of the greatest challenges for marketing and brand managers is to quantify
the financial return from marketing activities. Therefore, this paper exposes
the quantification of marketing profitability Metrics and examines the
influences of its contents on Banks‟ profitability. First generation of Private
Commercial banks in Bangladesh have been considered for this study. Data
have been collected from Bank‟s Annual reports and analyzed by using the
SPSS software. Correlation analysis has been conducted to establish the
nature of relationship among MPM, NP (Net Profit) and OP (Operating
profit) of Banks. Positive Relationship has been found between NMC (Net
Marketing Contribution) and OP. This study has also found the positive
relationship between NMC and Net Profit (NP).
Keywords: Commercial Banks, MPM, NMC, MROI, MROS, NP, OP
JEL Classification: M31; G21
INTRODUCTION
The performance of „Marketing Profitability‟ for the financial institutions cannot
easily be quantified due to the marketing practice. The selling of financial
products and services is in many ways far more complex than the selling of
manufacturing products. Lebas and Euske (2002) provide a good definition of
performance as “doing today what will lead to measured value outcomes
tomorrow”. Performance relates to profit maximization which is a key objective
in most commercial establishments. Empirical evidence suggest that other
objectives (Gross and Net profit ratios, Return on Investment, Return on Equity,
Earning per share, Dividend per share, and Price Earnings Ratios); normally
perform a peripheral role to the profit goal (Pandey, 2006).Commercial banks
also use the same ratios to clarify their profit performance indicators, where
marketing performance is yet to discover on the basis of those ratios. Marketing
has always been a grueling and competitive sport. What was already difficult is
Assistant Professor, Department of Business Administration, Uttara University,
Bangladesh.
268 D.U. Journal of Marketing, Vol. No. 15, June 2012
becoming increasingly difficult. If you‟re going to do it without measurement,
it‟s like running a marathon, in an earthquake, blindfolded (Raab, 2010).
Therefore, Marketing has a responsibility to measure the performance of
investment in marketing and sales strategies.
Marketing is broadly defined here as what the whole company does to achieve
customer preference and, thereby, its own goals (Webster, 1992). Accordingly,
every bank has some interest in assessing marketing performance in this sense.
Thus, the usage of marketing metrics has been increasingly reported (e.g., Shaw,
1998 and Ambler, 2000). The problem is that most of the metrics used to assess
the outcomes of marketing activities are tactical and not directly relevant to the
overall financial performance of the firm (Lehmann, 2004). The financial
connection of marketing metrics has been associated with financial
consequences, especially, elements of firm value (Ambler et al., 2004). Without
discovering the financial connectivity of marketing operations, it is difficult to
measure the Marketing Profitability of banks. The financial stream on measuring
profitability derived from marketing function pays more attention to objective
measures, and less to the subjective measures of the consumer perception stream.
Simon and Sullivan (1993) used financial data showing the profits stemming
from the brand and thus estimating the firm's overall brand equity. By this
reference, using financial date is justified to calculate the contribution of
Marketing. This study discovers the financial connectivity of MPM for
measuring performance of marketing operations in the banking industry.
LITERATURE REVIEW
The concept of Marketing in the banking industry had taken after 1950 in
western countries (Önce, 2013). “Perhaps no other concept in marketing's short
history has proven as stubbornly resistant to conceptualization, definition or
application as that of marketing performance (Bonoma and Clark, 1988)”.
Previous literature (e.g., Ittner and Larcker, 1998; Kaplan and Norton, 1992) cites
increasing dissatisfaction with these traditional metrics. Conventional measures
of productivity tend to be historical and do not provide information that can be
used to assess the long-term future performance of the firm (Ittner and Larcker,
1998). While historical measurement of performance may be better than none, it
does not allow for the assessment of impact that may take some time to resonate.
The past performance of a firm is no predictor of future performance, thus
historical measures have limited usefulness. Bayon et al. in 2002 discussed the
failure history of accounting metrics that reflects the value of the intangible
assets held by a firm and can be misleading and out of step with the skills and
competencies used and required by the knowledge-intensive businesses of today
(Kaplan and Nortorn, 1992). Today intangible assets are worth, on average, 69%
of the firm‟s total market value as compared to 17% in 1978 (Sawhney and
Zabin, 2002). If firms are to move away from considering marketing as an
Measuring Marketing Profitability Metrics of First Generation Private Commercial 269
269
expense toward marketing as an investment, then it makes sense that returns on
marketing need to be captured in a longer-term context (Seggie et al., 2007).
Practitioners and academics have shown increasing interest in the assessment of
marketing performance (Clark, 1999; Marketing Week, 2001; Schultz, 2000;
Shaw and Mazur, 1997). For a long time now (1997-2006), the Marketing
Science Institute (MSI) has identified marketing metrics and marketing
productivity as one of its top research priorities. Their study domain had included
various aspects such as assessing marketing ROI, linking internal marketing
program metrics (e.g., awareness) to external financial metrics (e.g., ROI), the
valuation of customers, the valuation of brands, the valuation of innovation,
measuring short-term and long-term effects of marketing spend, and
global/international metrics and measures. The need for demonstrating the
financial consequences of marketing expenditures has also been echoed widely at
the Chief Marketing Officers (CMO) Summit jointly hosted by MSI, (Wharton
and McKinsey 2002 and 2003 respectively). The Marketing Science Institute has
raised marketing metrics to become its leading capital research project (MSI
2002). Extant research documents that marketing strategies, such as focus on
customer retention (Reinartz and Kumar, 2003), innovation propensity (Roberts,
2001), strategic differentiation (Veliyath and Farris, 1997), and diversification
into related businesses and geographical markets mitigate risk by reducing
earnings volatility. Interbrand‟s focus on linking brand strength to lower cost of
capital is more normative than descriptive (Interbrand, 2004).
O'Sullivan and Abela (2007) identify three branches of marketing performance
research. These are measurement of market productivity, identification of metrics
in use and measurement of brand equity. This study focuses their second stream
of research. Given the high and increasing value of intangible assets, it is clear
that marketing investments and the resulting assets (brands, customers, and
channels) play an important role in determining a company‟s performance and
financial value (Mylonakis, 2008).
The existing review of literature only assesses the qualitative measurements of
first generation private commercial banks. The quantitative measures using
profitability metrics and marketing contribution on sales are hardly found. This
paper will fulfill this gap
OBJECTIVES
The specific objectives of this paper are twofold.
1. To develop the quantitative measure of Marketing Performance by the
usage of term „Marketing Profitability Metrics‟ include „Net Marketing
Contribution (NMC), Marketing Return on Investment (MROI) and
Marketing Return on Sales (MROS).
270 D.U. Journal of Marketing, Vol. No. 15, June 2012
2. To identify the relationship among these metrics with Operating Profit
(OP) and Net Profit (NP) of first generation commercial banks in
Bangladesh.
METHODOLOGY
For this study, Annual audited reports (2008 to 2012) of all first generation
commercial banks (Banks incorporated from the period of 1971-1990) of
Bangladesh have been considered except ICB Islamic Bank Limited, since; this
bank hasn‟t been consistent in their profitability for the last five years. Most
Marketing metrics found from literature are external performance
metrics and forward looking performance metrics. The three marketing
profitability metrics, however, are internal performance metrics that should be
derived from audited financial statement of banks. The contained data of
financial statement is reviewed and audited by the accountancy for accuracy.
Most data collection activity in the market today is driven by trends of specific
brands and markets, not in measuring marketing inputs and output writ large
(Stewart, 2008). For this reason, raw data are not, in themselves, of much use for
marketing planning and measurement of outcome. As practiced in the
commercial sector, however, data, reliability and validity are often assumed. The
Cronbach‟s alpha of 0.739 shows that all the variables (NMC, MROS, MROI,
NP, OP), are highly reliable. Some standards of this paper include: (a) Full data
set that has been collected from Annual reports of banks, (b) Subsidiaries of
banks are not considered in this study, (c) Interest income is considered as „Sales
Revenue‟ of bank in the sense of Marketing, and (d) Advertising and Publicity
are considered only as marketing related investment for the bank.
MARKETING PROFITABILITY METRICS
Financial Accountability:
At a time when firms are cutting costs, it is essential for all functional disciplines
within the firm to be financially accountable. Without measurement it is
impossible to be accountable. So firms should measure marketing which makes
marketing more accountable and discourage short-termism by focusing on
measures like brand contribution (Ambler, 2000). It is one of the inspired sources
for computing the Net Marketing Contribution (NMC) in my study. Measuring
the return on marketing, it is essential to treat marketing expenditures as an
investment (Schultz and Gronstedt, 1997).Traditionally many firms have viewed
marketing as a short-term expense (Rust et al., 2004) to be indulged when
finances are plentiful, and cut in times of hardship. However, only through
treating marketing expenditures as an investment can marketing be compared to
other tangible and intangible assets enabling the marketing function to play a role
in the strategy of the firm (Schultz and Gronstedt, 1997).
Measuring Marketing Profitability Metrics of First Generation Private Commercial 271
271
Although some techniques exist for evaluating the financial return from
particular marketing expenditures (e.g., advertising, direct mailings, sales
promotion) given a longitudinal history of expenditures (for a review, see Berger
et al., 2002), the approaches have yet to apply practically in the banking industry.
Furthermore, the requirement of a lengthy history of longitudinal data has made
the application of return on investment (ROI) models fairly rare in marketing. As
a result, top management has too often viewed marketing expenditures as short-
term costs rather than long-term investments and as financially unaccountable
(Schultz and Gronstedt, 1997). Leading marketing companies consider this
problem so important that the Marketing Science Institute has established its
highest priority for 2002–2004 as “Assessing Marketing Productivity (Return on
Marketing) and Marketing Metrics.”
Why Marketing Profitability Metrics should be addressed:
Marketing needs MPM to demonstrate its performance as well as take a more
responsible role in managing profits and profitable growth. It has also a
responsibility to account for investment in marketing and interest sales strategies
for a Bank. Therefore, the Standard set of Marketing Profitability metrics should
be addressed to assess the outcome of marketing activities have the potential to
facilitate and improve a variety of management decisions. In the opinion of
Stewart (2008), these decisions are: (a) optimization of resources in such
activities as media planning and design of the marketing mix, (b) forecasting,
including both forward forecasting and the analysis of various “what if”
scenarios, and (c) the assessment of financial return and return on investment.
Financial Linkage of Marketing Profitability Metrics:
On limited occasions in the past, researchers have been able to establish a link
between marketing metrics and its financial consequence to the firm (Rajendra et
al., 2006). When you talk about marketing spending, other executives think of
costs and profit loss. When you talk about future results, they think of revenue
and growth. To formulate accurate forecasts, sales and marketing must sit
together at the revenue table. CEOs and boards their opinion in „Definitive Guide
to Marketing Metrics and Analytics, 2011‟ that they don‟t care about 99% of the
metrics that marketers track – but they do care about revenue and profit growth.
As per their discussion, there are two primary categories of financial metrics that
directly affect revenue and profits: (a) Revenue Metrics: Marketing‟s aggregate
impact on company revenue. (b) Marketing Program Performance Metrics: The
incremental contribution of individual marketing programs
There are many other areas of marketing metrics that are not addressed directly
in this Guide. These include: (a) Customer Profitability: Lifetime value of an
incremental customer, (b) Web Analytics: Measures Web visibility to target
audiences against potential audiences, and compares against industry and
competitor benchmarks, (c) Public Relations: Measures views and impact of
272 D.U. Journal of Marketing, Vol. No. 15, June 2012
corporate communications initiatives, (d) Product Performance: Comparatively
measures the total sales and margins of individual products, (e) Brand Preference
and Health: Assesses brand preference in relation to preference for competing
brands, and (f) Sales Tool Usage: Measures which product marketing materials
are being used the most and many other areas…
This is not to imply that these metrics are not important for marketers to track –
just that they are likely to be less relevant to financially focused executives
outside of marketing. The link between traditional marketing metrics and the
financial performance of the firm is seldom explicit (Rust et al., 2004).
Srivastava and Reibstein (2005) note that “pressure is being placed on marketing
to justify expenditures and to translate their measures into financial outcomes,
which is the language used by the rest of the firm.”
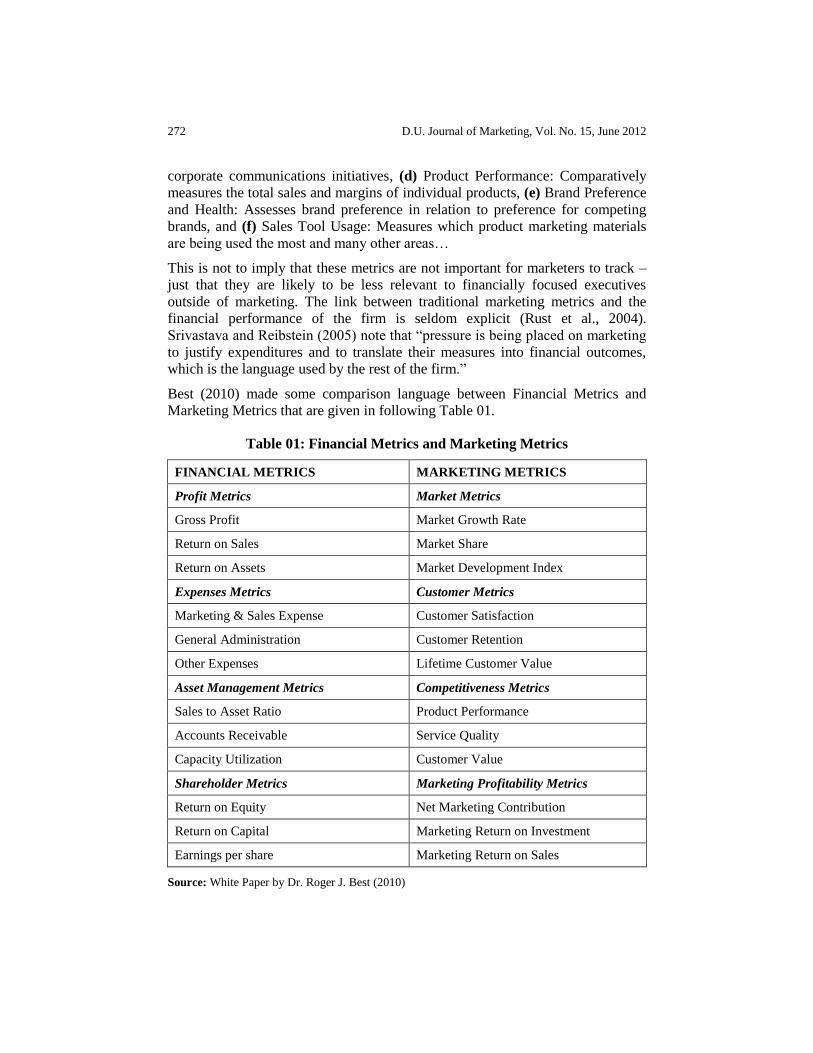
Best (2010) made some comparison language between Financial Metrics and
Marketing Metrics that are given in following Table 01.
Table 01: Financial Metrics and Marketing Metrics
FINANCIAL METRICS MARKETING METRICS
Profit Metrics Market Metrics
Gross Profit Market Growth Rate
Return on Sales Market Share
Return on Assets Market Development Index
Expenses Metrics Customer Metrics
Marketing & Sales Expense Customer Satisfaction
General Administration Customer Retention
Other Expenses Lifetime Customer Value
Asset Management Metrics Competitiveness Metrics
Sales to Asset Ratio Product Performance
Accounts Receivable Service Quality
Capacity Utilization Customer Value
Shareholder Metrics Marketing Profitability Metrics
Return on Equity Net Marketing Contribution
Return on Capital Marketing Return on Investment
Earnings per share Marketing Return on Sales
Source: White Paper by Dr. Roger J. Best (2010)
Measuring Marketing Profitability Metrics of First Generation Private Commercial 273
273
Measuring Marketing Profitability Metrics:
Most companies recognize the need for marketing metrics and the potential benef
it they provide, but they struggle where to get started. A 2010 survey of 400 com
panies found that 75 percent recognized the need for marketing metrics, but only
25 percent had implemented a marketing metrics program. The need for
marketing metrics and how it can be used to measure and manage marketing
performance is addressed by Dr. Roger J. Best in 2010.
Net Marketing Contribution (NMC): Revell (1980) utilizes interest margin as
a performance measure for U.S commercial banks and defines interest margin as
the difference between interest income and expense divided by total assets.
Marketing profitability is based on an investment in marketing and sales required
to achieve certain levels of sales and gross margins. Apple‟s net marketing
contribution had a high correlation (.94) with operating income from 1999 to
2009. Apple‟s net profit was also influenced by its net marketing contribution.
Net marketing contribution is a financial measure of marketing profitability and
is computed as shown below with example:
Net Marketing = Sales x Percent - Marketing & Sales
Contribution Revenues Gross Margin Expenses
Apple‟s net marketing contribution in 2009 was $10 billion, as shown below:
Net Marketing = $36.54 billion x 36% - $3.12 billion
Contribution = $13.15 billion - $3.12 billion
= $10 billion
Net Marketing Contribution in products is calculated by “NMC = Net sales –
Cost of goods sold – Marketing Expenses” (Kotler and Armstrong, 2013), I
would like to propose NMC calculation for financial institution as Net Marketing
Contribution (NMC) = Net Interest Income (Interest Income/Profit on Investment
– Interest/Profit paid on deposits and Borrowings, etc) – Marketing Expenditure
(Advertisement & Publicity) and the calculation of NMC for First Generation
Commercial banks in Bangladesh is given in Table 02.
Interest Income as Sales Revenue: Revenues from a business's primary
activities are reported as sales, sales revenue or net sales. This includes product
returns and discounts for early payment of invoices. All companies need to sell to
accurate benefits that help the company to grow and survive and banks are not an
exception. If we search in any dictionary for a definition of sale, we can find
something like: “the exchange of goods or services for an amount of money or its
equivalent” (Dictionary.com, 2010). Most businesses also have revenue that is
incidental to the business's primary activities, such as different charges earned
from services. This is included in revenue but not included in net sales. Sales
revenue does not include sales tax collected by the business.
274 D.U. Journal of Marketing, Vol. No. 15, June 2012
Bank‟s Interest Revenue is placed at Income statement of Bank‟s Annual Report
as separate from Investment Revenue and Other revenue. Defining other revenue
(non-operating revenue) is a revenue from peripheral (non-core) operations. For
example, a company that manufactures and sells automobiles would record the
revenue from the sale of an automobile as "regular" revenue. If that same
company also rented a portion of one of its buildings, it would record that
revenue as “other revenue” and disclose it separately on its income statement to
show that it is from something other than its core operations.
Money income from activities those are ordinary for a particular corporation,
company, partnership, or sole-proprietorship. For some businesses, such as
manufacturing and/or grocery, most revenue is from the sale of goods. Service
businesses such as law firms and barber shops receive most of their revenue from
rendering services. Lending businesses such as car rentals and banks receive
most of their revenue from fees and interest generated by lending assets to other
organizations or individuals.
Advertising and Publicity as Marketing Expense: „Advertising and Publicity‟
counted as marketing expenses for measuring the Bank‟s marketing contribution.
Best (2010) opined that Marketing Expense should not include general
administration expenses, R&D expenses or other expenses unrelated to the
marketing & sales of company products. Therefore, MROI can be higher even in
less investment on Marketing Expense as Advertising & Publicity. This
statement of „Roger‟ has been proved in my study at Table 01.
Financial advertising includes advertising performed by banks, financial
institutions, insurance companies and investment companies. Most banking
institutions address their advertising to holders of small accounts, thus, selecting
to advertise their products and services mainly through mass media outlets
(Mylonakis, 2008). A recent study (Merino et al., 2006) demonstrates the impact
of long-term advertising on both short term performance (ROA), risk (volatility
of ROA) and long-term intangible value (Tobin‟s Q).
Perhaps no marketing activity has been under greater pressure to demonstrate its
contribution to firm value than advertising. While advertisers focus heavily
measures such as awareness, the finance manager might be concerned with what
a point of awareness means in terms of financial consequences. Many studies that
assess the value of advertising have shown a negative return (Lodish et al., 1995).
In retrospect, this is not very surprising, while the effects of advertising are
typically long term (Dekimpe et al., 2004). This temporal separation of the
returns as illustrated by the case of advertising becomes a cause for concern
when the returns do not get accounted in the appropriate fashion.
Advertising may be used initially to build awareness and encourage usage,
ultimately building a meaningful customer relationship. This relationship could
later be leveraged to make future advertising allocations more productive
Measuring Marketing Profitability Metrics of First Generation Private Commercial 275
275
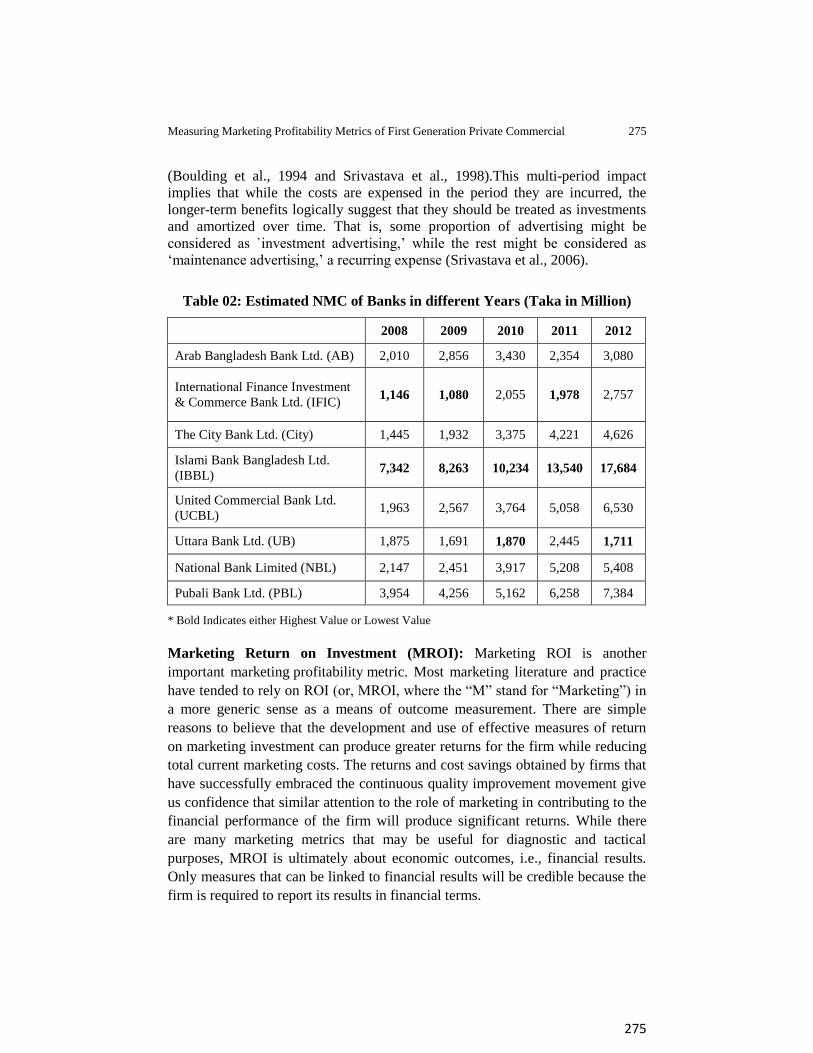
(Boulding et al., 1994 and Srivastava et al., 1998).This multi-period impact
implies that while the costs are expensed in the period they are incurred, the
longer-term benefits logically suggest that they should be treated as investments
and amortized over time. That is, some proportion of advertising might be
considered as `investment advertising,‟ while the rest might be considered as
„maintenance advertising,‟ a recurring expense (Srivastava et al., 2006).
Table 02: Estimated NMC of Banks in different Years (Taka in Million)
2008 2009 2010 2011 2012
Arab Bangladesh Bank Ltd. (AB) 2,010 2,856 3,430 2,354 3,080
International Finance Investment
& Commerce Bank Ltd. (IFIC) 1,146 1,080 2,055 1,978 2,757
The City Bank Ltd. (City) 1,445 1,932 3,375 4,221 4,626
Islami Bank Bangladesh Ltd.
(IBBL) 7,342 8,263 10,234 13,540 17,684
United Commercial Bank Ltd.
(UCBL) 1,963 2,567 3,764 5,058 6,530
Uttara Bank Ltd. (UB) 1,875 1,691 1,870 2,445 1,711
National Bank Limited (NBL) 2,147 2,451 3,917 5,208 5,408
Pubali Bank Ltd. (PBL) 3,954 4,256 5,162 6,258 7,384
* Bold Indicates either Highest Value or Lowest Value
Marketing Return on Investment (MROI): Marketing ROI is another
important marketing profitability metric. Most marketing literature and practice
have tended to rely on ROI (or, MROI, where the “M” stand for “Marketing”) in
a more generic sense as a means of outcome measurement. There are simple
reasons to believe that the development and use of effective measures of return
on marketing investment can produce greater returns for the firm while reducing
total current marketing costs. The returns and cost savings obtained by firms that
have successfully embraced the continuous quality improvement movement give
us confidence that similar attention to the role of marketing in contributing to the
financial performance of the firm will produce significant returns. While there
are many marketing metrics that may be useful for diagnostic and tactical
purposes, MROI is ultimately about economic outcomes, i.e., financial results.
Only measures that can be linked to financial results will be credible because the
firm is required to report its results in financial terms.
276 D.U. Journal of Marketing, Vol. No. 15, June 2012
Relationships among marketing activities, with specific measures of outcomes,
gauge financial results and provide justification for management decisions.
Again, the influence of Sarbanes-Oxley will encourage this type of
accountability, as marketers will increasingly be required to justify their
expenditure in terms of ROI, like the rest of corporation. The validity of such
forecasts will largely depend on the integrity of the data used to make them. It is
simply the net marketing contribution divided by marketing and sales expenses.
When Apple‟s 2009 NMC of $10 billion is divided by their $3.12 billion
investment in marketing and sales (M & SE), a Marketing ROI of 325 percent is
produced. This means that Apple strategies collectively produced $3.25 in net
marketing contribution for every dollar invested in marketing and sales.
Marketing ROI = Net Marketing Contribution / Marketing & Sales Expenses
= $10.03 billion / $3.12 billion
= 325%
Often, marketing ROI models show ridiculously high returns because they don‟t
incorporate all relevant variable and semi-variable costs like Staff costs for
marketing departments, travel expenses and the cost of sales‟ time. Seventy-six
percent (76%) of B2B marketing professionals agree or strongly agree that their
“ability to track marketing ROI gives marketing more respect.” (Forrester
Research). According to a 2010 Lenskold Group / emedia Lead Generation
Marketing ROI Study, the number one metric used by lead generation marketers
is lead quantity, whereas barely half of marketers measure lead quality.
MROI must be an inherently financial construct (David, 2008). No measure or
measurement system is complete without a specific link to financial performance.
He explains some important contributions in his paper that helps to create the
perception of MROI necessity. MROI contributes to economic outcome and
impact of marketing actions. Return, risk, the time value of money and the cost
of capital are reflected by MROI. It has also the ability to recognize the short
time effect of marketing actions and long term outcomes. Few other important
contributions of MROI are sound decision making, accountability, continuous
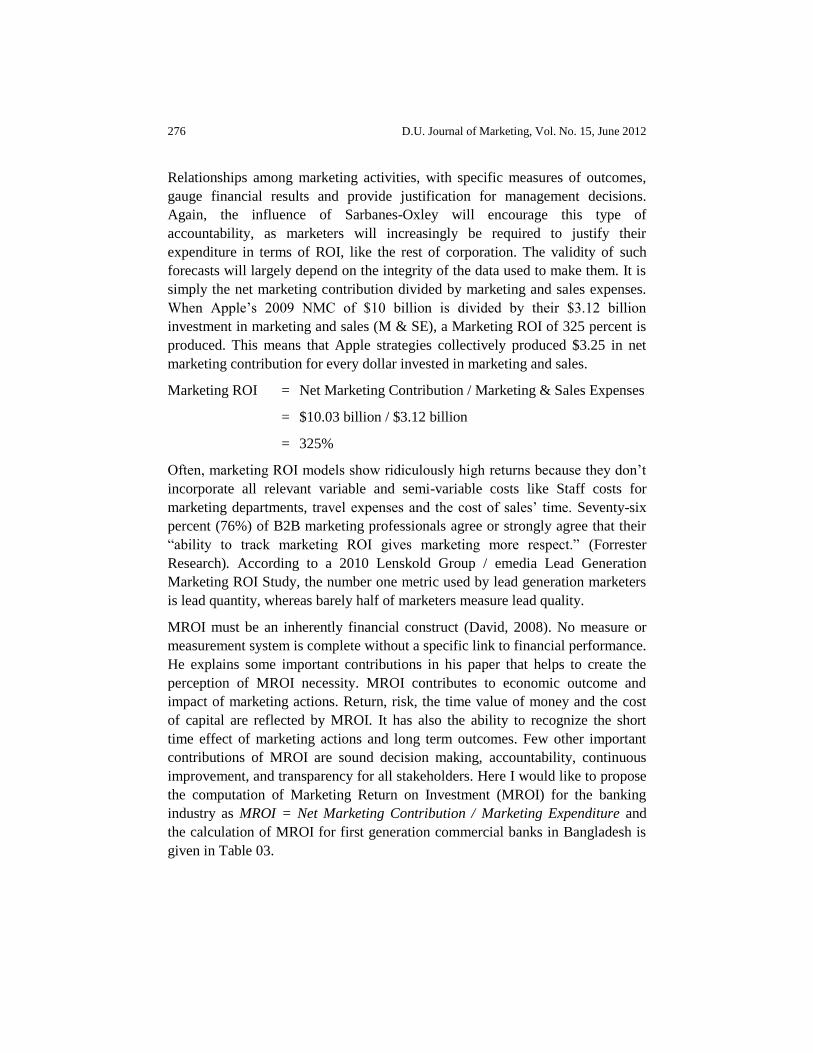
improvement, and transparency for all stakeholders. Here I would like to propose
the computation of Marketing Return on Investment (MROI) for the banking
industry as MROI = Net Marketing Contribution / Marketing Expenditure and
the calculation of MROI for first generation commercial banks in Bangladesh is
given in Table 03.
Measuring Marketing Profitability Metrics of First Generation Private Commercial 277
277
Table 03: Estimated MROI of Banks in different Years (2008-2012)
Marketing Return on Investment (MROI)
2008 2009 2010 2011 2012
AB 9736.83% 5441.80% 6593.76% 5887.30% 7298.40%
IFIC 5136.62% 4980.59% 9751.78% 6615.12% 5698.93%
City 2353.32% 1385.33% 1697.49% 2139.74% 3202.64%
IBBL 18618.23% 27270.16% 17056.69% 17430.87% 15086.40%
UCBL 4580.75% 5098.95% 5307.37% 5576.08% 7806.42%
UB 22612.27% 15244.79% 15352.48% 21314.15% 11323.35%
NBL 4649.02% 3855.73% 7502.39% 13573.16% 34952.79%
PBL 13543.95% 12022.72% 10041.53% 11235.31% 11065.98%
* Bold Indicates either Highest Value or Lowest Value
Marketing Return on Sales (MROS): According to the idea of Best (2010),
Marketing activity is easy to see and measure (costs going out the door), but
marketing results are hard to measure. In contrast, sales activity is hard to
measure, but sales results (revenue coming in) are easy to measure. Ratio metrics
allow businesses to compare their performance to other companies, as well as
other business segments within the organization. Marketing ROS is a simple
marketing profitability metric that allows a business to compare performance
across their organization as well as other publicly traded companies. Marketing
ROS (MROS) for Apple‟s 2009 is calculated as follows:
Marketing ROS = Net Marketing Contribution / Sales
= $10.03 billion / $36.54 billion
= 27.5%
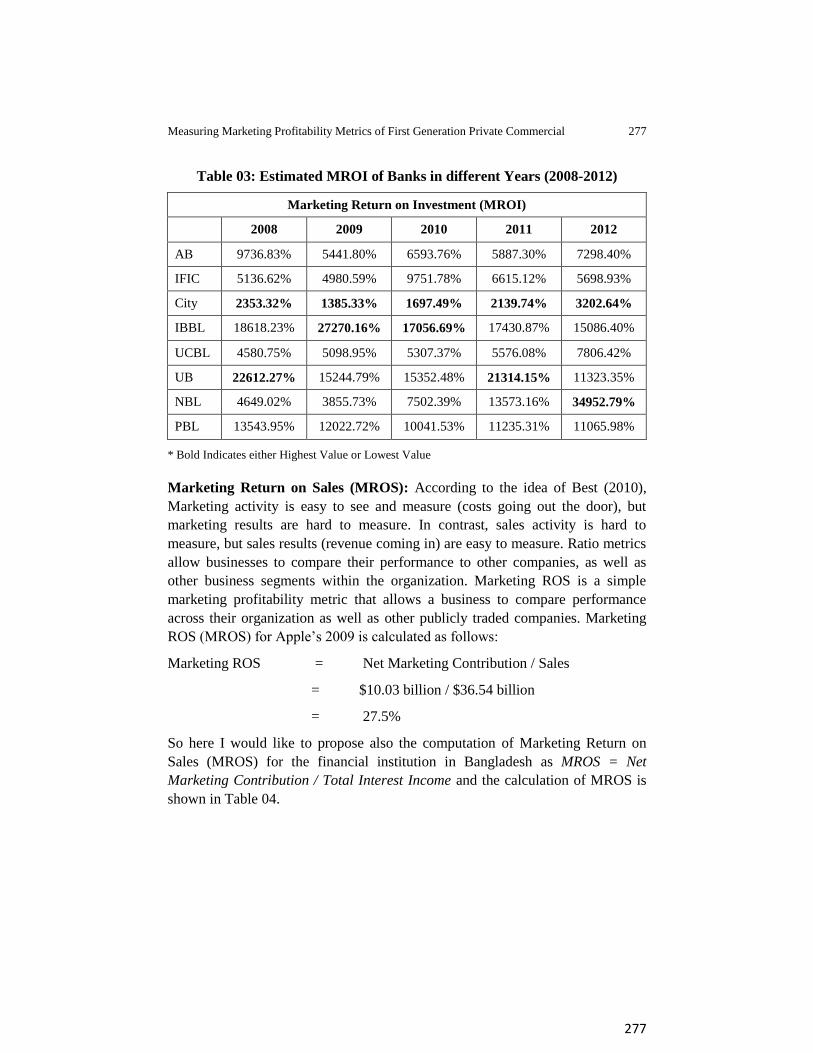
So here I would like to propose also the computation of Marketing Return on
Sales (MROS) for the financial institution in Bangladesh as MROS = Net
Marketing Contribution / Total Interest Income and the calculation of MROS is
shown in Table 04.
278 D.U. Journal of Marketing, Vol. No. 15, June 2012
Table 04: Estimated MROI of Banks in different Years (2008-2012)
Marketing Return on Sales (MROS)
2008 2009 2010 2011 2012
AB 27.29% 31.56% 34.85% 18.35% 19.60%
IFIC 32.61% 27.90% 50.85% 29.72% 26.40%
City 30.95% 33.63% 47.60% 44.83% 37.17%
IBBL 37.57% 38.67% 41.32% 42.29% 40.49%
UCBL 34.19% 36.85% 39.67% 32.95% 30.63%
UB 45.92% 37.64% 35.62% 37.02% 20.84%
NBL 37.09% 34.99% 41.20% 36.08% 28.31%
PBL 58.12% 52.82% 57.33% 51.96% 44.17%
* Bold Indicates either Highest Value or Lowest Value
ANALYSIS AND FINDINGS
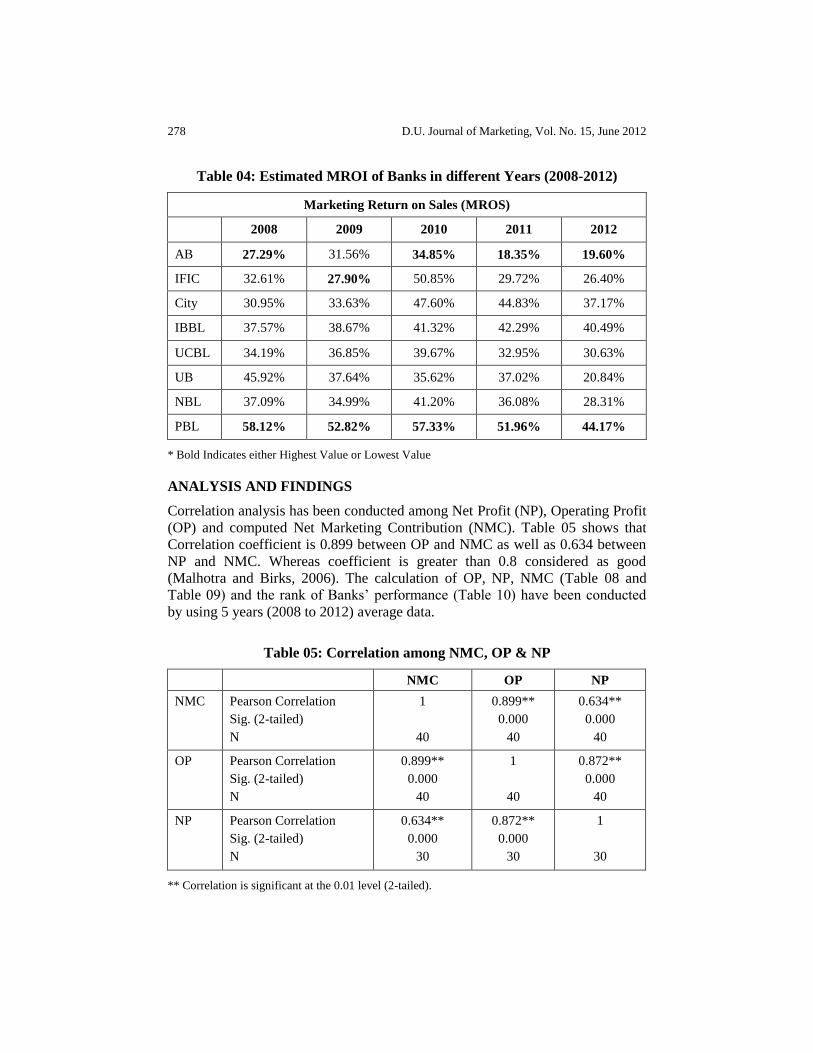
Correlation analysis has been conducted among Net Profit (NP), Operating Profit
(OP) and computed Net Marketing Contribution (NMC). Table 05 shows that
Correlation coefficient is 0.899 between OP and NMC as well as 0.634 between
NP and NMC. Whereas coefficient is greater than 0.8 considered as good
(Malhotra and Birks, 2006). The calculation of OP, NP, NMC (Table 08 and
Table 09) and the rank of Banks‟ performance (Table 10) have been conducted
by using 5 years (2008 to 2012) average data.
Table 05: Correlation among NMC, OP & NP
NMC OP NP
NMC Pearson Correlation
Sig. (2-tailed)
N
1
40
0.899**
0.000
40
0.634**
0.000
40
OP Pearson Correlation
Sig. (2-tailed)
N
0.899**
0.000
40
1
40
0.872**
0.000
40
NP Pearson Correlation
Sig. (2-tailed)
N
0.634**
0.000
30
0.872**
0.000
30
1
30
** Correlation is significant at the 0.01 level (2-tailed).
Measuring Marketing Profitability Metrics of First Generation Private Commercial 279
279
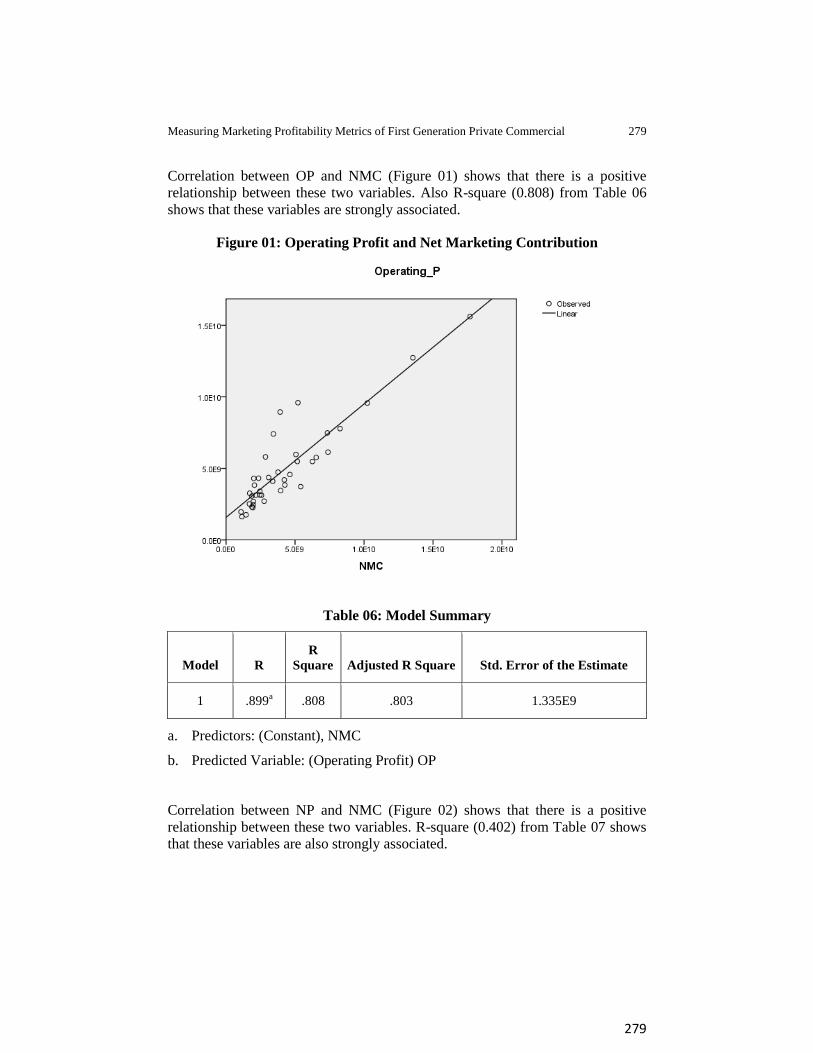
Correlation between OP and NMC (Figure 01) shows that there is a positive
relationship between these two variables. Also R-square (0.808) from Table 06
shows that these variables are strongly associated.
Figure 01: Operating Profit and Net Marketing Contribution
Table 06: Model Summary
Model R
R
Square Adjusted R Square Std. Error of the Estimate
1 .899a .808 .803 1.335E9
a. Predictors: (Constant), NMC
b. Predicted Variable: (Operating Profit) OP
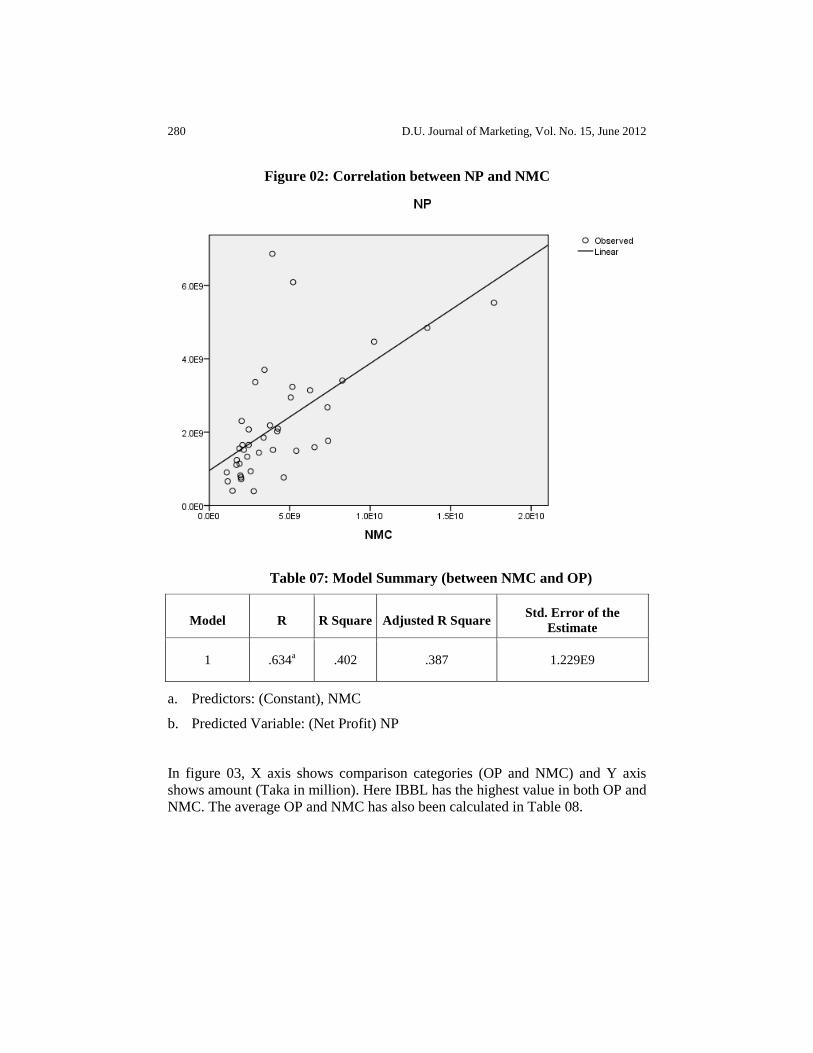
Correlation between NP and NMC (Figure 02) shows that there is a positive
relationship between these two variables. R-square (0.402) from Table 07 shows
that these variables are also strongly associated.
280 D.U. Journal of Marketing, Vol. No. 15, June 2012
Figure 02: Correlation between NP and NMC
Table 07: Model Summary (between NMC and OP)
Model R R Square Adjusted R Square Std. Error of the
Estimate
1 .634a .402 .387 1.229E9
a. Predictors: (Constant), NMC
b. Predicted Variable: (Net Profit) NP
In figure 03, X axis shows comparison categories (OP and NMC) and Y axis
shows amount (Taka in million). Here IBBL has the highest value in both OP and
NMC. The average OP and NMC has also been calculated in Table 08.

Measuring Marketing Profitability Metrics of First Generation Private Commercial 281
281
Figure 03: Average OP and NMC of last Five Years (2008-2012)
0
5000
10000
15000
Millions
Operating Profit NMC
AB IFIC CITY IBBL UCBL UB NBL PBL
Table 08: Average OP and NMC of last Five years (2008-2012)
(Taka in Million)
AB IFIC CITY IBBL UCBL UB NBL PBL
OP 5,237 2,560 3,375 10,634 4,409 2,860 5,756 4,877
NMC 2,746 1,803 3,119 11,413 3,977 1,918 3,826 5,403
* Bold Indicates either Highest Value or Lowest Value
IBBL also keeps the highest position in NP and NMC (Figure 4), where X axis
shows comparison categories (NP and NMC) and Y axis shows amount (Taka in
million). The average NP and NMC for the last five years has been calculated in
Table 09.
Figure 04: Average NP and NMC of last Five Years (2008-2010)
02000400060008000
1000012000
Millions
NP NMC
AB IFIC CITY IBBL UCBL UB NBL PBL
282 D.U. Journal of Marketing, Vol. No. 15, June 2012
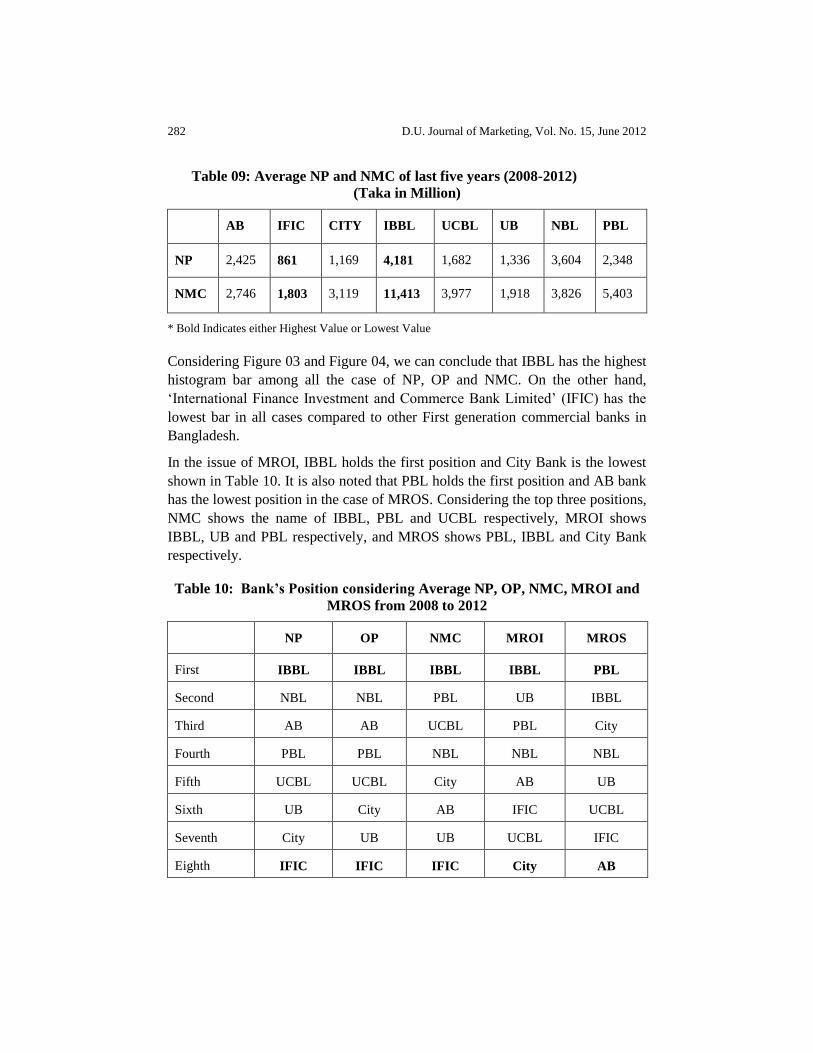
Table 09: Average NP and NMC of last five years (2008-2012)
(Taka in Million)
AB IFIC CITY IBBL UCBL UB NBL PBL
NP 2,425 861 1,169 4,181 1,682 1,336 3,604 2,348
NMC 2,746 1,803 3,119 11,413 3,977 1,918 3,826 5,403
* Bold Indicates either Highest Value or Lowest Value
Considering Figure 03 and Figure 04, we can conclude that IBBL has the highest
histogram bar among all the case of NP, OP and NMC. On the other hand,
„International Finance Investment and Commerce Bank Limited‟ (IFIC) has the
lowest bar in all cases compared to other First generation commercial banks in
Bangladesh.
In the issue of MROI, IBBL holds the first position and City Bank is the lowest
shown in Table 10. It is also noted that PBL holds the first position and AB bank
has the lowest position in the case of MROS. Considering the top three positions,
NMC shows the name of IBBL, PBL and UCBL respectively, MROI shows
IBBL, UB and PBL respectively, and MROS shows PBL, IBBL and City Bank
respectively.
Table 10: Bank’s Position considering Average NP, OP, NMC, MROI and
MROS from 2008 to 2012
NP OP NMC MROI MROS
First IBBL IBBL IBBL IBBL PBL
Second NBL NBL PBL UB IBBL
Third AB AB UCBL PBL City
Fourth PBL PBL NBL NBL NBL
Fifth UCBL UCBL City AB UB
Sixth UB City AB IFIC UCBL
Seventh City UB UB UCBL IFIC
Eighth IFIC IFIC IFIC City AB
Measuring Marketing Profitability Metrics of First Generation Private Commercial 283
283
RECOMMENDATIONS
The quantification of Marketing Profitability Metrics has been valued by
extracted data from annual report of first generation commercial banks in
Bangladesh. The computation of this metrics can create the more accuracy of
Bank‟s Marketing Performance. Results and techniques of this computation can
be a new opportunity to track the marketing related input and output for the
banks. This approach may have significant application for decision making. This
study recommends that the study of Marketing Profitability should be concerned
more along with Financial Probability.
CONCLUSION
Despite the earnings of bank from different sources, the core function for the
bank is to sell their interest by manufacturing deposited money that they can
arrange by the effort of marketing investment. Different banks may have
different concepts for selling their interest and capitalizing customer‟s idle
money. They may have also different strategies even in the case of target
customer. Few perceptions are digested over the market that the cost of
Advertisement is not influential for the customer of few banks like Islami Bank
IBBL, Pubali Bank Limited (PBL) which was nationalized in 1972, etc. Since
customer does not make any transaction by observing bank‟s marketing related
activities. Customer would rather go for transaction on the basis of trust and
bank‟s philosophy. It is true but the trust and bank‟s own philosophy will never
build in a day even in a year. We can never create a strong brand without having
an identical position of attributes, benefits, beliefs and values. For creating a
unique position in customer mind, we have to go for huge promotion like
Advertisement and Publicity. No banks can get the result of marketing expense
like advertising in a particular income year. In fact, it has been noted in
marketing that marketing actions, such as advertising and promotion, have both a
short-term and long-term effect on firm sales (Jedidi et al., 1999). In today, every
commercial bank is more conscious regarding their investment in Advertising
and Publicity. This study has shown that IBBL is the third and PBL is the fourth
in position at the cost of Advertisement among the comparison of Eight Banks,
although most of the target customers of IBBL and PBL are relatively lower class
and lower middle class. This study does not permit to conclude that both of these
banks need not to focus marketing related investment like Advertisement. The
quantification of Marketing Profitability Metrics based on public perception may
change even in within a second due to the volatility of customers‟ perception.
Therefore, Banks should focus on Marketing Profitability by analyzing their
financial data so that decision makers could rely for the justification of their
284 D.U. Journal of Marketing, Vol. No. 15, June 2012
investment. The calculated way of MPM can be debated further in future study.
But it is necessary to establish the way out of this approach in the field of
Marketing for decision making efficiently more than earlier. The contribution of
this study will be successful if banks realize the necessary of computing
Marketing Profitability metrics.
REFERENCES
Aliata, L. V., Odondo, J. A., Aila, O. F., Ojera, B. P., Abong‟o, E. B. and Odera, O.
(2012). “Influence of Promotional Strategies on Banks Performance”,
International Journal of Business, Humanities and Technology, Vol. 2, No. 5.
Ambler, T. (2000). “Marketing and the Bottom Line: The New Metrics of Corporate
Wealth”, London: Pretince Hall/ Financial Times.
Ambler, T. (2000). “Marketing Metrics”, Business Strategy Review, pp.59-66.
Ambler, T. and Riley, D. (2000). “Marketing Metrics: A review of Performance
Measures in Use in the UK and Spain”, Center for Marketing, London School of
Business, No. 00-901.
Ambler, T., Kokkinaki, F. and Puntoni, S. (2004). “Assessing Marketing Performance:
Reasons for Metrics Selection”, Journal of Marketing Management, Vol. 20,
pp.475-498.
Bayon, T., Gutsche, J., and Bauer, H. (2002). “Customer Equity Marketing: Touching the
Intangible, European Management Journal, Vol. 20, No. 3, pp.213-222.
Berger, D. P., Bolton, N. R., Bowman, D., Briggs, E., Kumar, V., Parasuraman, A., and
Terry, C. (2002). “Marketing Actions and the Value of Customer Assets: A
Framework for Customer Asset Management‟, Journal of Service Research, Vol.
5, pp.39-54.
Best, J. R. (2010). “Getting Started Using Marketing Metrics”, White Paper, Marketing
Metrics Handbook.
Bonoma, T. V. and Clark, B. H. (1998). “Marketing Performance Assessment”, Harvard
Business School Press, Boston.
Clark, H. B. (1999). “Marketing Performance Measures: History and Interrelationships”,
Journal of Marketing Management, Vol. 15, pp.711-732.
Dekimpe, G. M., Srinivasan, S., Pauwels, K. and Hanssens, M. D. (2004). “Do
Promotions Benefit Manufacturers, Retailers, or Both”? Management Science, Vol.
50 (May), pp.617-629.
Hanweek, G. and Ryu, L. (2005). “The Sensitivity of Bank Net Interest Margins and
Profitability to Credit, Interest-Rate, and Term-Structure Shocks Across Bank
Product Specializations”, Working Paper 2005-02.
Interbrand Group (2004). “About the Value of Valuation”, Amsterdam, The Netherlands:
Interbrand Zintzmeyer & Lux.
Ittner, C. D. and Larcker, D. F. (1998). “Innovations in Performance Measurement:
Trends and Research Implications,” Journal of Management Accounting Research,
Vol. 10, pp.205-238.
Measuring Marketing Profitability Metrics of First Generation Private Commercial 285
285
Jedidi, Kamel, Mela and Gupta (1999). “Managing Advertising and Promotion for Long-
run Profitability”, Marketing Science, Vol. 18, No. 1, pp.1-22.
Kaplan, R. S. and Norton, D. P. (1992). “The Balanced Scorecard Measures that Drive
Performance”, Harvard Business Review, Vol. 70, No. 1, pp.71-79.
Koksal, H., M. and Ozgul, E. (2007). “The relationship between marketing strategies and
performance in an economic crisis.” Market Intelligence and Planning, pp.326-
342.
Kotler, P. and Armstrong, G. (2013). “Principles of Marketing: Marketing by the
numbers”, Pearson Prentice Hall.
Lebas, M. and Euske, K. (2002). “A conceptual and Operational Delineation of
Performance in Business Performance Measurement: Theory and Practice”, Neely
Andrew, editor, Cambridge University Press.
Lehmann, D. R. (2004). “Linking Marketing to Financial Performance and Firm Value”.
Journal of Marketing, Vol. 68, No. 4, pp.73-75.
Malhotra, N. K. and Birks, D. F., (2006). “Marketing Research: An Applied Approach”,
Pearson Education: Harlow, England.
Mamun, Z. M. (2011). “Marketing Metrics and Analytics”, Marketo Ins.
Marketing Week (2001). “Assessing Marketers‟ Worth”, February 2001, No. 1, pp.42-
43.
Merino, M., Srinivasan, R., and Srivastava, K. R., (2006). “Advertising, Research and
Development and Variability of Cash Flow and Shareholder Value”, ZIBS
Research Report, Emoy University.
Miller, J. (2011). “Marketing Metrics & Analytics”, Marketo, Inc.
Morgan, A. N., Clark, H. B. and Gooner, R. (2002). “Marketing Productivity, Marketing
Audits, and Systems for Marketing Performance Assessment Integrating Multiple
Perspectives”, Journal of Business Research, Vol. 55, pp.363-375.
Mylonakis, J. (2008). “Role, Objectives and Effectiveness of financial advertising: an
Exploratory Bank Marketing Study”, Innovative Marketing, Vol. 4, Issue 3.
Önce, G. (2013). “Service Marketing in Banking Sector and Recent Perceptions in
Marketing Thoughts of Services”. Available at <http://prezi.com/5rgmqe1o9tar/
service-marketing-in-banking-sector-and-recent-perceptions-i/>, Retrieved on
March, 25, 2013.
O'Sullivan, D., and Abela, A. A. (2007). “Marketing Performance Measurement Ability
and Firm Performance.” Journal of Marketing, pp.79-93.
Pandey, I. M. (2006). “Financial Management”, 9th
edition, Vikar Publishing House Pvt
Ltd.
Paul, C. S., Bhowmik, K. P., Islam, R. M., Kaium, A. M., and Masud, A. A. (2013).
“Profitability and Liquidity of Conventional Banking and Islamic Banking in
Bangladesh: A Comparative Study”, Track: Pricing and Financial Issues in
Marketing, ANZMAC 2003 Conference Proceedings Adelaide 1-3.
Pont, M. and Shaw, R. (2003). “Measuring Marketing Performance: A Critique of
Empirical Literature”. Track: Pricing and Financial Issues in Marketing, ANZMAC
2003 Conference Proceedings Adelaide 1-3.
286 D.U. Journal of Marketing, Vol. No. 15, June 2012
Raab, M. D. (2010). “Wining the Marketing Measurement Marathon”, Raab Associates
Inc.
Reinartz, J. W. and Kunar, V. (2003). “The Impact of Customer Relationship
Characteristics on Profitable Lifetime Duration”, Journal of Marketing, Vol. 67,
No. 1, pp.77-99.
Revell, J. (1980). “Costs and Margins in Banking: An International Survey”, Paris,
OECD
Roberts, P. W. (2001). “Innovation and Firm-Level Persistent Profitability: A
Schumpeterian Framework”, Managerial and Decision Economics, Vol. 22,
pp.239-250.
Rust, T. R., Lemon, N. K., and Zeithaml, A.V., (2004), “Return on Marketing: Using
Customer Equity to Focus Marketing Strategy”, Journal of Marketing, Vol. 68,
pp.109-127.
Sawhney, M. and Zabin, J. (2002). “Managing and Measuring Relational Equity in the
Network Economy”, Journal of the Academy of Marketing Science, Vol. 30, No. 4,
pp.313-332.
Seggie, H. S., Cavusgil, E., and Phelan, E. S., (2007). “Measurement of Return on
Marketing Investment: A conceptual Framework and the Future and the Future of
Marketing Metrics”, Industrial Marketing Management, ELSEVIER, Vol. 36,
pp.834-841.
Shaw, R. (1998). “Improving Marketing Effectiveness”, London, The Economist Profile
Books.
Shaw, R. and Mazur, L. (1997). “Marketing Accountability: Improving Business
Performance”, Financial Times, London.
Simon, J. C. and Sullivan, W. M. (1993). “The measurements and Determinants of Brand
Equity: A Financial Approach”, Marketing Science, Vol. 12, No. 1, pp.28-52.
Srivastava, K. R., Reibstein, J. D. and Joshi, V. Y. (2006). “Linking Marketing Metrics to
Financial Performance”, ZIBS Research Reports, Emory University.
Srivastava, K. R., Shervani, T., and Fahey, L. (1998). “Market-Based Assets and
Shareholder Value: A Framework for Analysis,” Journal of Marketing, Vol. 62
(January). pp.2-18.
Stewart, W. D. (2008). “How Marketing Contributes to the Bottom Line”, Journal of
Advertising Research, DOI: 10.2501/S0021849908080112
Uppal, K. R. (2010). “Marketing of Bank Products– Emerging Challenges & New
Strategies”, JM International Journal of Management Research (JMIJMR), ISSN
2229-4562, pp.35-42.
Webster, F. E. J. (1992). “The Changing Role of Marketing in the Corporation”, Journal
of Marketing, Vol. 56 (October), pp.1-17.
wikipedia.org (2013). available at <http://en.wikipedia.org/wiki/Revenue>, Retrieved on
December 22, 2013.