measuring labour productivity and the benefits of ... · measuring labour productivity and the...
TRANSCRIPT
Measuring labour productivity and the benefits
of interventions for osteoarthritis
Project report for Medicines Australia
Professor Deborah Schofielda,b,c, Dr Rupendra Shresthaa, Dr Michelle Cunicha and Ms Sarah Westa
aFaculty of Pharmacy, Charles Perkins Centre, The University of Sydney, NSW 2006, Australia bMurdoch Childrens Research Institute, Royal Children's Hospital, Flemington Road, Parkville, Victoria 3052, Australia cGarvan Institute of Medical Research, Darlinghurst, NSW 2010, Australia
Phone: +61 2 8627 1951
Fax: +61 2 8627 0141
Email: [email protected]
2 September 2016

Acknowledgement
This research was supported by funding from Medicines Australia.

Table of Contents
Executive Summary i
1. Context 1
2. Study objectives 3
2.1. Review of productivity measures in osteoarthritis intervention studies 3
2.2. Propose a measure of productive life years gained 3
2.3. Apply the measure of productive life years gained to OA interventions 4
3. A literature review of productivity measures used in intervention and cost of illness studies of OA (Stage 1) 5
3.1. The burden of OA 5
3.2. Evidence on the economic impacts of OA 6
3.3. Materials and methods 9
3.3.1. Selection of studies 9
3.3.2. Quality of the evidence 10
3.4. Literature synthesis 12
3.4.1. Key information extracted 12
3.4.2. Type of synthesis of results 12
3.4.3. Instruments used 12
3.5. Results 13
3.5.1. Identification of relevant articles 13
3.5.2. Judgements about the quality of the OA studies 14
3.5.3. Synthesis of results 15
3.6. Instruments Used 17
3.7. Single questions about productivity 20
3.8. Monetarisation of productivity losses 21
3.9. Statistical analyses 21
3.10. Productivity measures not captured 22
3.11. Discussion 23
3.11.1. Measuring and reporting productivity losses of OA 23
3.12. Conclusion 25
4. Proposed Productivity Measure (Stage 2) 26
4.1. Framework for productivity measurement 26
4.2. Methods for estimating Productive Life Years Gained (Lost) and related costs 29
4.3. Conclusion 30

5. Productive life years gained and the associated economic gains as a result of OA intervention (Stage 3) 31
5.1. Data and methods 32
5.1.1. Association between SF-36 bodily pain scores and labour force participation 33
5.1.2. Labour force impacts 33
5.1.3. Economic benefits 34
5.2. Results 35
5.2.1. Not in the labour force due to OA 35
5.2.2. Association between SF-36 bodily pain domain scores and labour force participation 36
5.2.3. Impacts on labour force participation 36
5.2.4. Economic impacts 37
5.3. Conclusions 38
6. Conclusions and Future Directions 38
Appendix 1: Inclusion and exclusion criteria of the published studies 49
Appendix 2: Search strategy and list of keywords 50
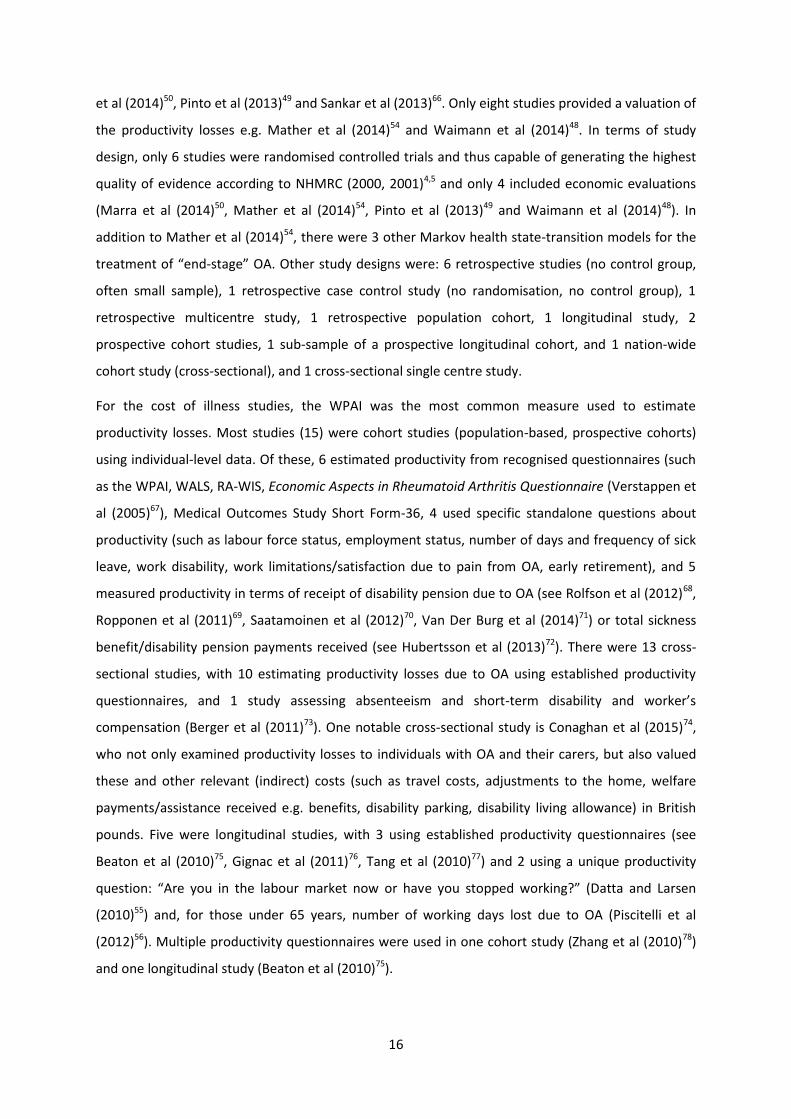
Appendix 3: Summary of Interventions for OA (25 studies) 51
Appendix 4: Summary of cost of illness studies (37 studies; 1 policy document as last entry) 58
Appendix 5: Study characteristics 71
Appendix 6: List of instruments 72
Appendix 7: Scaffolding of the proposed productivity measure 80
Appendix 8: Cost of not being in the labour force due to OA for individuals in 2015 82
Appendix 9: Labour force status of those with OA in 2015 83

Figures
Figure 1. Article selection process 14
Figure 2. Framework for identifying, measuring and valuing productivity changes 27

Tables
Table 1. A framework for judging the state of the evidence for OA-related productivity losses 10
Table 2. Overview of Productivity Instruments 18
Table 3. Estimated numbers of people not in the labour force due to OA, aged 15-64 years, 2015 36
Table 4. Estimated number of people who would have avoided being out of the labour force due
to their OA as a result of starting treatment with NSAIDs for the management of their
OA, aged 15-64 years, 2015 37
Table 5. Estimated individual economic benefits of being in the labour force because of reduced
pain as a result of managing OA, aged 15-64 years, 2015 37
Table 6. Estimated total economic benefits at national level from increased labour force
associated with reduced pain as a result of managing their OA, aged 15-64 years (in
thousands, in 2015 AU$) 38

Glossary of Common Abbreviations/Key Terms
Control group: Participants in the comparison group in a randomised controlled trial. They are assigned to placebo, no treatment or usual/standard treatment.
Cost: The value of the next best alternative (opportunity) forgone by integrating resources in a particular service.
Cost effectiveness analysis: A type of economic evaluation in which health outcomes of different interventions vary but are measured in identical natural units (e.g. number of falls prevented) and relative inputs are costed. The interventions are compared in terms of the cost per unit of the health outcome.
Economic evaluation: The application of analytical methods to identify, measure and value costs and health outcomes/consequences (benefits) of interventions and assist in making choices regarding resource allocation.
Friction cost method: A method for measuring the productivity losses (indirect costs) for long-term absence, ill-health and mortality mainly only occurring during the time it takes to replace an employee i.e. the friction cost period (usually 3-6 months). Estimates of the price of labour are set close to zero after the friction period and reduced during the friction period.
HILDA: The Household Income and Labour Dynamics in Australia (HILDA) Survey
Human capital cost method: A method for measuring labour productivity losses (indirect costs) as the lost gross income during the time of absence from work.
IGR: Intergenerational report.
Markov health state-transition models: An in-built, flexible, and clear approach of computer-intensive decision-analytic modelling, including Markov model cohort simulation. The particular problem is conceptualised in terms of a set of health states and the type of transitions among these states; it is a commonly used modelling technique in clinical decision analysis, health technology assessment, and economic evaluation.
OA: Osteoarthritis.
Prevalence: The proportion of people with a particular finding (such as chronic disease) in a given population at a given time.
PRODISQ: PROductivity and DISease Questionnaire.
Productive Life Years (PLYs): Number of people in the labour force per year.
RA: Rheumatoid arthritis
RA-WIS: Work Instability Scale for Rheumatoid Arthritis.
RCT: Randomised controlled trial.
WALS: Work Activity Limitations Survey.
WLQ: Work Limitations Questionnaire.
WPAI: Work Productivity and Activity Impairment Questionnaire.

(i)
Executive Summary
This project has three aims. They are:
1. To undertake a targeted literature review of OA
intervention studies (and cost of illness) which include
productivity measures;
2. To propose a framework based measure of productive
life years gained; and
3. To apply the new measure and examine the impact on
labour productivity of a pharmaceutical health
intervention, with the impacts quantified for individuals
and the Australian Government.
Aim 1: Literature Review
In the literature review, we identified (a) the type of productivity measures used in the published
studies, and how they have been used; (b) the scale of the productivity costs captured (based on the
type of questions/instruments used); and (c) the potential productivity measures not captured.
The targeted search yielded 63 full-text articles, with 25 interventions, 37 cost of illness studies, and
1 policy document. A range of methods were used to estimate productivity losses due to
osteoarthritis (OA), from a single question about productivity (such as time to return to work, labour
force status, hours of work) to established questionnaires (instruments) where several aspects of
productivity were evaluated (such as WPAI, WALS, WLQ). Yet many of the productivity measures
derived from these questionnaires have only recently been assessed in terms of their sensibility
attributes (i.e. face or content soundness, practicability and feasibility).1 Estimates of the
productivity losses also varied considerably across studies using the same questionnaire
(instrument), which is likely to be due to between-study differences in the country and the site of
pain-related OA examined. Only 8 intervention studies and 4 cost of illness studies valued the
productivity losses. Heterogeneity in the methods used (and how results were reported) for
estimating productivity losses made a direct comparison between studies (or pooling of results)
difficult and, arguably, inappropriate.
As with other instruments, issues surrounding understandability, suitability and sensibility in the
population of interest need to be established for OA. For the 250 OA (or RA) workers in Tang et al
(2013), the WLQ-25 was considered most comprehensive (endorsed by 92.8%), the WALS performed
best in terms of understandability (97.6%) and suitability of response options (97.9%), and the RA-
WIS was favoured in terms of length (91.6%). Consistent sensibility performance between OA and RA
Stage 1: Only 8
intervention studies and 4
cost of illness studies have
valued the productivity
losses due to OA.

(ii)
was also found. The WALS (32.6%) and WLQ-25 (30.0%) were moderately preferred in the final
overall appraisal.1
Despite the high disease burden of OA, evidence on the full economic burden for individuals (and
government) is only just emerging. Productivity measures that have not been captured in the studies
relate to the translation of lost labour force participation into costs for individuals (lost income,
income poverty); costs for government (extra welfare payments and lost taxation revenue); and
costs for society (lost GDP attributable to OA).
The productivity costs missing from the literature are:
1. A wider range of productivity losses for individuals. Such estimates would include not only
lost income from lost labour force participation (or reduced paid working hours) but also the
costs of informal care.
2. Costs to government which consist of extra welfare payments and lost taxation revenue due
to the lost productivity of people with OA.
3. Societal costs e.g. the percentage of lost GDP due to OA through its impact on work capacity.
Aim 2: Propose a Productivity
Measure
In this report it is argued that
productivity changes due to
interventions for health conditions
need to be identified, measured and
valued – just like other costs (and
some benefits) in economic
evaluations.2 The framework for
identifying, measuring and valuing
productivity is outlined in Section 4.
The proposed measure is Productive
Life Years (PLYs) gained which is
defined as the number of people who were out of the labour force due to their own ill-health (chronic
condition) before treatment and subsequently returned to work in in a given year. This measure takes
into account (a) the measures used by government departments in projecting demand and supply in
the labour market, and (b) the dual aims of the government to increase productivity and fiscal
sustainability.
Stage 2: Productive Life Years (PLYs) gained – defined as
the number of people who were out of the labour force
due to their own ill-health (chronic condition) before
treatment and subsequently returned to work in each
year - takes into account (a) the measures used by
government departments in projecting labour demand
and supply, and (b) the dual aims of the government to
increase productivity and fiscal sustainability.

(iii)
Aim 3: Modelling the Impacts of a Pharmaceutical Health
Intervention on Individuals and the Government
Pharmaceutical and multidisciplinary interventions have
the potential to improve labour productivity of those with
chronic conditions. We have used NSAIDs interventions
for the management of OA as a case study to illustrate
how the significant productive life years gained by those
with OA can be counted, measured and valued using
microsimulation. This has flow-on economic benefits to
individuals in terms of increased earnings in addition to
the health benefits, and the government in terms of
increased income tax revenue, reduced welfare payments
and increased GDP. We note that both the type of
intervention and chronic disease are illustrative only;
what is important is the demonstration of how PLYs can be counted, measured and valued and how
they may assist in decision-making by government departments in relation to resource allocation.
Stage 3: The study found that
there was about 43 million
dollars per year gained in
income for individuals, 11
million dollars in additional
tax revenue and 16 million
dollars in welfare payment
savings for the government by
an intervention in OA.
Importantly, there was also
164 million dollars per year in
GDP – a gain from the societal
perspective.

1
1. Context
It is essential to assess both the benefits and the costs of new medical treatments to ensure that
scarce resources (public funds) are allocated to treatments representing value for money.2 To
determine whether a new treatment (or intervention) is effective in treating/managing/preventing a
disease or illness, a clinical study of the treatment in a relevant patient population is needed.
Randomised controlled trials (RCTs) are known to generate the highest standard of evidence in
medicine.3,4 An important consideration within the trial is whether the health effects (benefits)
justify the costs, which is determined via economic evaluation such as cost-effectiveness analysis.5
When new treatments are developed and the government is requested to fund these treatments,
two aspects need to be carefully assessed: (a) whether they are effective in a clinical sense, and (b)
whether they provide value for money i.e. are cost-effective. Thus, when new technologies are
approved for funding through processes run by bodies such as the Medical Services Advisory
Committee (MSAC) or the Pharmaceutical Benefits Advisory Committee (PBAC), there is a
requirement for an economic evaluation to demonstrate the cost-effectiveness of the new
technologies.6,7 This is the main source of information for policymakers in making decisions about
resource allocation.
The benefits of introducing new interventions commonly extend beyond the health system,8,9 which
are apparent as quantifiable improvements in labour productivity and income for individuals,
increased income taxation revenue and reduced welfare payments for the government, and
increased Gross Domestic Product (GDP). It has been demonstrated that the value of these (indirect)
benefits may be greater than the direct (healthcare) benefits for certain interventions.10,11
In addition to MSAC and PBAC, there are several government departments/agencies involved in
making decisions about funding new programs, such as the Department of Social Services,
Department of Health, Department of Education, Department of Finance and the Treasury. These
departments/agencies need to consider the impact of a spending proposal on the entire budget (i.e.
health and other portfolios) as well as the impact on individuals. Coinciding with the release of the
first Intergenerational Report (IGR) in 2002,12 these departments/agencies have been asked to
consider the impacts of their choices in relation to long-run trends in economic drivers, and their
impact on the budget.

2
Consecutive government reports have identified population ageing and the related need for increased labour
force participation, as serious pressures on the budget; see the IGRs for 200212
, 200713
, 201014
, and 201515
. As
a consequence, the Commonwealth Government established the National Commission of Audit to
Government – an independent body – to assess and report on the performance, functions, and roles of the
government in late 2013. Amongst other things, the Commission reported:
Once the impacts of an ageing population and expected lower growth prospects in the longer term are
taken into account a growing fiscal gap will emerge at all levels of government across Australia if
current expenditure and revenue policies remain unchanged.…Today we have five people working for
every one retired person, by 2050 we will only have 2.7. This means those 2.7 people working will need
to produce as much as the 5 today just to maintain our standard of living.
(National Commission of Audit, 2014) 16
In response to this report, the government implemented various policies to improve labour force
participation in the longer-term. For example, the government promoted deferred or gradual
retirement in an effort to ease the slow-down in the reduction of the labour force due to population
ageing. In the 2014 budget, Treasurer Joe Hockey announced that, in addition to the government
raising the age eligibility of the aged pension to 67 years by 2023, it will be increasing eligibility to 70
years by 2035.17 This was despite the Productivity Commission (2013) announcing that there was
likely to be increased longevity without increased years of healthy life in Australia. The Productivity
Commission provided evidence that, over time, there has been an expansion of morbidity, rather
than a compression, in Australia.18 This has implications for the ability for Australians to participate
in the labour force as they age, with an increasing likelihood of living with a medical condition.
The paradox of needing to increase labour force participation among older Australians (aged 45 and
over), many of whom suffer from work-limiting health conditions, is not a new challenge and creates
a dilemma. Using Health&WealthMOD2030, we have previously estimated that there are 347,000
people aged 45-64 years with lost productive life years (PLYs) due to chronic conditions in 2010
which is projected to increase to 459,000 by 2030 (a 32.3% increase over 20 years).10 The top chronic
conditions resulting in lost PLYs among people aged 45-64 years in both years were: back problems
(dorsopathies), arthritis, mental and behavioural disorders, depression (excluding postnatal
depression), and cardiovascular disease.10
The paradox of trying to increase labour force participation whilst having limiting health conditions is
a challenge at the intersection of social, health, and economic policy. It requires a consolidated and
consistent approach (through cross-portfolio alignment) by government to address it. Few
government reports have taken into account the combined effect of different portfolios on the
overall budget, which has led to little significant impact on policy change in Australia with the

3
notable exception of the IGRs. Prominent government reports that emphasise the essential role of
labour productivity in determining fiscal sustainability and national prosperity (such as the IGRs)16-18
are important sources that highlight the need for this study.
2. Study objectives
The aim of this study was to examine the potential productivity benefits of investing in a
pharmaceutical intervention using osteoarthritis (OA) as an example. The study focuses on OA
because of its significant effect on the labour force participation of Australians aged 45-64 years –
who are the fastest growing age group in the working-age population.19 In addition, early retirement
due to OA reduces the income available to individuals, and places a burden on the government due
to lost income taxation revenue and increased welfare payments for retired individuals.20
The project was completed in three stages:
1. Literature Review of OA intervention studies which include productivity measures
2. Propose a framework based measure of productive life years gained; and
3. Apply the new measure and examine the impact on labour productivity of a pharmaceutical
health intervention
2.1. Review of productivity measures in osteoarthritis intervention studies
In the first stage, recent scientific literature was reviewed to summarise the type of productivity
measures that have been included in OA intervention studies. The following issues were covered in
the review:
What productivity measures are included and how they are used;
The scale of the productivity benefits captured; and
Potential productivity benefits not captured
Because relatively few intervention studies for OA with measures of productivity were found, we
also searched for relevant cost of illness studies to determine the type of productivity measures
included in these studies.
2.2. Propose a measure of productive life years gained
In the second stage, we proposed a general measure of productive life years gained taking account
of the measures used by the Treasury in estimating GDP projections and the aims of the government
to increase productivity and fiscal sustainability.

4
2.3. Apply the measure of productive life years gained to OA interventions
In the third stage, we applied the measure of productive life years (PLYs) gained by modelling one
example of the potential productivity impacts of a pharmaceutical intervention to manage OA from
the literature. The intervention captured changes in quality of life (using the Short Form-36 or SF-36)
occurring in patients with OA during treatment with non-specific non-steroidal anti-inflammatory
drugs (NSAIDs). Although two intervention studies were to be used for this stage of the study, where
one was on the impact of medicine on OA and the other was to be about the impact of a lifestyle
intervention for OA, the literature search undertaken in stage 1 of the project did not reveal any
suitable RCTs or other studies. Thus an additional and more specific search was undertaken to
identify the best available study: Rabenda et al (2005).21 This is a naturalistic, prospective follow-up
study of 783 patients with OA in whom general practitioners (GPs) decided to start treatment with
non-selective NSAIDs. The Short Form-36 (includes SF-36 bodily pain) and the Western Ontario and
McMaster Universities OA index (WOMAC) were assessed at baseline and after 3 months. The effect
of NSAIDs for the management of OA on the SF-36 bodily pain domain score over 3 months was used
in our modelling to demonstrate the productivity benefit associated with these medicines. We note
that the PLYs gained per year due to an intervention that improves the health (and thus work
capacity) of people with a chronic condition can be applied to any type of intervention
(pharmaceutical, lifestyle, workplace and so on) and any type of chronic disease, provided
data/modelling needs can be met.
The example provided in Stage 3 shows that there is a clear connection between treatment with
medicine and broader benefits that can be associated with productivity gains.

5
3. A literature review of productivity measures used in intervention and cost of illness
studies of OA (Stage 1)
3.1. The burden of OA
Osteoarthritis (OA) is a degenerative disease of the joints or “wear and tear” form of arthritis. OA is
the most common chronic health condition of the joints, and one of the most common chronic
conditions.22-32 OA ensues when the cartilage or cushioning between the joints deteriorates causing
pain, stiffness and swelling. The most common parts of the body affected by OA are the feet, knees,
hips, wrists.28
The number of people with OA is increasing due to population ageing and the increased prevalence
of several risk factors, such as obesity and sedentary behaviours.33 Based on the methods used in the
Global Burden of Disease study (1997), the population ageing could make OA the 9th cause of
disability-adjusted life years (DALYs) in developed countries by the year 2020.34 The total number of
years lived with disability (YLDs) worldwide caused by OA of the knee and hip increased by 60.2%
between 1990 and 2010, which has meant that OA has moved up from 15th to 11th position in the
list of the most frequent causes of disability.35 Knee and hip joints were responsible for 2.2% of all
YLDs due to OA worldwide (and 0.7% of all DALYs) in 2010,36 however, these numbers are
undervaluations of the OA burden because they do not include the results for all other joints
commonly affected by OA.
OA is responsible for a high number of primary healthcare visits (GPs) as well as knee and hip
replacements, and hospital costs more generally.32 For example, a recent United States (US)
population-based study of healthcare utilisation found that, on average, the cohort with knee OA
had about six more doctor visits and four more non-doctor visits each year than the cohort without
OA.37 The OA cohort also had a significantly higher number of hospital stays (28% more), with the
difference mainly being attributed to total joint replacements. In Australia, OA is one of the top 10
problems managed by GPs. Almost 2.7 million Medicare-paid GP consultations in 2007–2008
included the management of OA.38 And in 2004–2005, AU$1.2 billion in health expenditure was
attributable to OA. The main costs were from in-patient services, for example, joint replacements.38
However, the economic burden of OA consists of direct (healthcare) and indirect (non-healthcare)
costs. The latter mainly take the form of productivity losses and informal caregiving because of the
limited independence (due to reduced physical function) of people with OA.

6
3.2. Evidence on the economic impacts of OA
Cost of illness studies generate an estimate of the economic impact (cost) resulting from the illness,
including direct (healthcare) costs and indirect costs (such as productivity losses, income losses,
carer costs, and travel costs).39 Thus these studies provide an indication of the potential social
benefits that could be achieved if the disease were prevented or treated more effectively. However,
certain productivity costs (such as lost income, receipt of welfare payments, lost taxation revenue,
informal carer costs) are rarely included in cost of illness studies.
Only one systematic review of the cost of OA40 (cost of illness studies) and two of the effects of OA
on productivity41,42 have been published in the last five years. With regard to the latter, Bieleman et
al (2011)41 conducted a systematic literature search for studies on patients with hip or knee OA and
various work participation measures (such as work status, sick leave, work disability, reduced
productivity, lost days of work, and transitions in and out of work). The quality of the methods used
in the studies was assessed using a range of criteria, such as the study population (to assess
selection bias), the soundness of how the determinants were assessed (OA and possibly confounding
determinants of work outcomes) and reported work measures (to assess information bias), and the
quality of the data analysis i.e. statistical analysis (to correct for all factors); and a qualitative data
analysis was accomplished. Fifty-three full-text articles were selected out of 1,861 abstracts; and the
final data for analysis were extracted from 14 articles. Study design, study populations, definitions,
and measurements used in the studies showed large variations; and work outcomes were often only
secondary objectives in these studies. The outcomes were summarised as showing a mild negative
effect of OA on work participation. However, the authors emphasised that “research on the effect of
OA on work participation is scarce and the methodological quality is often insufficient” (p. 1835).
Moreover, the “longitudinal course of work participation in OA has not yet been completely
described” (p. 1840). The review included only one longitudinal study, Gignac et al (2008)43, who
found that in 4.5 years, 63% of study participants (n=490 with 278 OA, 49 OA+RA, 163 RA; mean age
50.9 years; mean disease duration=9.2 years (sd 8.7), at baseline) remained in paid work.43
Considering that governments need to increase the number of people working at older age to
ensure sufficient future revenue, the impact of chronic diseases (and interventions in improving
productivity) require urgent attention in well-designed (RCT) studies.
Palmer’s (2012)42 systematic review considered the impact of knee OA on work participation and the
relationship between work and total knee replacement. In terms of agreement, the authors reported
that “probably” knee OA considerably prevents the patient from participating in work (measured as
labour force participation, attendance at work, and productivity) but the “evidence is limited” (p.
79). Areas of uncertainty centred around the evidence-base for effective interventions (i.e.

7
treatments, work changes or adjustments and work policies) to improve participation in patients
with knee OA, and how the type of work they are undertaking affects long-term clinical outcomes
(e.g. pain, physical function, and the need for revision through surgery) in patients with total knee
replacements.
A recent perspectives study (Hunter et al 2014)44 on the burden of OA for the individual, the health
system and society, draws attention to the magnitude of the current problem with some references
to projected figures. The main message is that there is a pressing opportunity to make fundamental
changes to the way individuals with OA are cared for, that will affect both direct and indirect costs of
the disease. By focusing on the burden of this prevalent, disabling, and costly disease, the authors
highlight the opportunity for shifts in health policy towards better prevention and chronic disease
management through medicine, lifestyle, workplace and other interventions.
Intervention studies provide assessments of improvements in the condition of an individual or
group. RCTs constitute a separate but important class of intervention studies. RCTs are carried out in
order to compare the efficacy and effectiveness of two (or more) health/medical treatments,
surgeries or combinations of these. The target population constitutes patients with a specific disease
or symptom.45 Well designed RCTs generate the highest quality of evidence after systematic reviews;
see NHMRC (2000, 2001)4,5 guidelines for assessing scientific evidence in medicine/public health.
Only one systematic review on the effectiveness of interventions to improve the productivity of
people with musculoskeletal disorders (MSD) (includes OA) has been published between 2010 and
2015: Palmer et al. (2012)46. They included a total of 42 studies (34 RCTs) on the effectiveness of
community and workplace interventions to manage musculoskeletal-related sick leave or other
absences and job loss sourced from 35 earlier systematic reviews and searches of Medline and
Embase between 1990 and 2010. Among the 42 studies, 27 assessed the issue of return to work, 21
the issue of duration of sick leave or other absences, and 5 job losses. Interventions found in the
studies included exercise therapies, behavioural change techniques, workplace adjustments and
providing additional services for employees with OA. The studies were typically small (median
sample=107 [inter-quartile range (IQR) 77-148]) and limited in quality. Most interventions appeared
beneficial, with the median relative risk (RR) for return to work being 1.21 (IQR 1.00-1.60) and for
avoiding MSD-related job losses it was 1.25 (IQR 1.06-1.71); the median reduction in sickness
absences was 1.11 (IQR 0.32-3.20) days per month. Nevertheless, the work effects were smaller in
larger and higher-quality studies, which suggested some publication bias. In this particular study
(Palmer et al. (2012)46), no intervention was clearly found to be superior among the included set;
however, the more effort-intensive interventions were less effective than basic interventions. No
cost-benefit analyses had been undertaken to establish whether there were statistically significant

8
net economic benefits associated with the interventions. Note that the Palmer et al’s (2012)46 review
was also unable to find any RCTs involving interventions to promote productivity in patients with OA
specifically, as well as no cost effectiveness analyses to determine whether they provided value for
money.
Palmer and Goodson (2015)47 recently reviewed the pattern of musculoskeletal complaints in later
middle age (separating out OA) and what is known about their impact on employment; and potential
interventions to support older workers with musculoskeletal diseases (mainly using Medline, Google
Scholar and two relevant journals). They found that musculoskeletal problems are common in older
workers and have a substantial impact on their work capacity. Factors found to influence job
retention included the type of musculoskeletal disease, its severity and treatments, the presence of
comorbid conditions, people's attitudes to work and retirement, and the work environment's
demands on them. The type of interventions that may extend working life were outlined for
musculoskeletal diseases separately, with the section on OA having only Palmer et al’s (2012)
conclusions noted for the period under consideration (2010-2015). Many gaps in the evidence were
found, notably on the health risks and benefits of patients with OA continuing in work and about
which interventions actually worked best.
Ideally, an economic evaluation runs alongside an RCT and assesses whether the intervention(s)
provides value for money compared to standard care. In the review conducted for this study, we
were able to find only three economic evaluations of OA interventions (treatments) to improve
productivity (Waimann et al (2014)48, Pinto et al (2013)49, Marra et al (2014)50), but only the last two
were a cost-effectiveness analysis running alongside an RCT. Pinto et al (2013)49 is a cost-
effectiveness analysis of an RCT involving manual therapy, exercise or both options, in addition to
usual care, for people with hip or knee OA. Marra et al (2014)50 is a cost-utility analysis of a
pharmacist-initiated multidisciplinary strategy providing value for money compared to usual care in
participants with previously undiagnosed knee OA.

9
Overall, these published reviews highlight that there is a limited number of intervention and cost of
illness studies for OA reporting on productivity and thus they have tended not to take a societal
perspective. Consequently, the effects of OA interventions on productivity are rarely identified,
measured, and valued in OA studies. The lack of estimates on productivity costs has implications for
resource allocation. There is also a lack of synthesis on the productivity measures that have been
used in OA studies, and how extensive the valuing of (significant) changes in productivity due to
interventions has been, or should be e.g. impacts from the individual’s perspective only (such as
increased hours of work, increased income, reduced need for informal care), the individual and the
governmental perspectives (such as reduced welfare payments, increased taxation revenue), or the
societal perspective (such as a greater pool of healthy workers, GDP growth attributable to
improving the health of workers).
The objectives of Stage 1 are (1) to review and identify variations in the methods used to estimate
productivity costs in OA studies published between January 2010 and June 2015; and (2) to identify a
set of productivity measures that are not captured. This section addresses three research questions:
a) What productivity measures are included in the studies? How have they been used?
b) What is the scale of the productivity benefits captured? and
c) What potential productivity benefits are not captured?
3.3. Materials and methods
A targeted literature search on medical and economics databases (from 1 January 2010 to 11 June
2015) was performed to identify OA studies including productivity costs. Studies were identified by
searching five electronic databases: three medical databases (Medline, Embase, and Cochrane
Library) and two economics databases (Expanded Academic ASAP and EconLit). Grey literature was
further checked using Google Scholar. The inclusion and exclusion criteria for the studies to be
included in the literature search are listed in Appendix 1 and the search strategy with the list of
keywords are presented in Appendix 2
3.3.1. Selection of studies
Two reviewers (SW and MC) were involved in the selection of studies, where studies were screened
for relevance (independently) based on the inclusion criteria. In stage one, duplicated articles were
identified and removed from the list in the Excel spreadsheet. Following this, the titles and abstracts
of all remaining articles were screened for possible full-text retrieval. In stage two, the full-texts of
potentially relevant articles were reviewed again based on the inclusion criteria. Articles meeting the
inclusion criteria were accepted into the literature synthesis.

10
3.3.2. Quality of the evidence
All accepted studies were judged for their methodological quality using the National Health and
Medical Research Council (NHMRC) of Australia’s frameworks for evaluating scientific evidence and
economic evaluations (NHMRC 2000, 2001)4,5.
Table 1. A framework for judging the state of the evidence for OA-related productivity losses
Evidence Purpose
Relevant and replicable
Did the study identify productivity as an appropriate and relevant outcome?
Is the study design stated clearly enough so that it could be replicated?
Theoretical framework Is there a logical (scientific) reason why the OA intervention will have the desired effect?
Strength of the evidence Is it a robust study design? • Level I (Highest quality): Systematic reviews of randomised
controlled trials (RCTs) • Level II: A well-designed RCT • Level III: Pseudo RCTs, comparative studies, case control
studies, cohort studies • Level IV: Evidence from case series such as pre- and post-
studies • Level V (Lowest quality): Expert opinion
Size of the effect Did the P-value or confidence interval reasonably exclude chance?
Is the effect size of economically important? Transferable and representative What are the benefits and costs (includes productivity) of the
intervention and the comparator? Do they differ between patient groups?
Is the study population representative of the population for whom the OA intervention is intended?
Duration Are the effects (includes productivity) sustained over a relevant time horizon? And who benefits from the OA intervention – individuals, government, or society?
Value for money Is the intervention(s) cost effective (includes productivity outcomes) relative to standard care?
Source: Adapted from NHMRC (2000, 2001)4,5 and Schofield et al (2014).51
The NHMRC’s (2000, 2001)4,5 criteria for assessing medical intervention and other health-related
studies was used as the basis for making judgements about the OA studies in this review. These
criteria are summarised in Table 1. The first is whether the study states the type of effects or
outcomes (productivity) which may be achieved through the intervention, and whether these
outcomes have been measured in appropriate units. For example, whether the OA intervention was
intended to improve health and productivity outcomes, or save money but produce no worse health
outcomes (non-inferiority). Additionally, the study should have a reasonable (main) hypothesis

11
and/or scientific explanation (and perhaps a theoretical model) underpinning it – information that
can be used to explain why the effect is expected from the intervention.
There are a range of possible study designs. According to the NHMRC (2000), the highest quality of
evidence comes from systematic reviews of randomised controlled trials (RCTs; Level I). Systematic
reviews determine whether a treatment (intervention) effect can be replicated and, by pooling the
results of RCTs, provides a best estimate of the magnitude of the effect.4 The second level of
evidence comes from well-designed RCTs, implying they have the strength to minimise bias (Level II).
Pseudo RCTs, comparative studies, case control studies or cohort studies have the potential to
introduce bias and are ranked as Level III. Case series (pre- and post-test studies) suffer from
problems related to the lack of randomisation (e.g. non-comparability of control and treatment
groups, different outcome measures for the two groups) and are ranked as Level IV. The lowest level
of evidence – now excluded by the NHMRC – is expert opinion and consensus from expert
committees because these sources do not have a scientific basis (Level V).
Although a study may report a statistically significant effect, it does not necessarily mean that the
effect has wider importance i.e. clinical, policy, or economic. For OA treatments with productivity as
an outcome, we would want to know what the cut-off was for the productivity scale (instrument) to
be regarded as statistically important (i.e. gaining how many points on the instrument would be
considered as significant). In this case, it would also be important to know whether the difference in
productivity was maintained over time or became insignificant between the intervention and
controls.
As public funds become increasingly scarce due to continuous deficits (as the government tries to
cope with the ageing population) and external shocks (e.g. recessions, mining boom closing off),
ensuring that only health interventions representing efficacy and efficiency are implemented is
essential where the latter is determined via economic evaluation.
The main criteria considered in making judgements about the OA studies (and reported in Tables 2
and 3) were the study population, study design, and relevance (and potential usefulness) of the
productivity measure(s) used. With regard to the latter, the reviewers considered whether the
productivity measure(s) was a single or standalone question specific to the study or well recognised
productivity questionnaires (with validated/tested for suitability instruments) suitable for the OA
population. Together, these judgements help to inform readers about the quality of OA studies
concerning our research questions.

12
We note that Bieleman et al’s (2011)41 systematic review of studies involving patients with hip or
knee OA and work participation (various measures) included a comprehensive assessment of the
methodological quality of the full-text articles in the final selection.
3.4. Literature synthesis
One reviewer (SW) extracted data from the included studies and a second (MC) checked the
accuracy. Any disagreement was resolved by discussion between the two reviewers.
3.4.1. Key information extracted
The current review focused on identifying the methods for estimating productivity losses
attributable to OA. Key information was extracted from eligible studies at the study level. The
information extracted consisted of the authors; publication details (journal, year, pages); title;
abstract; type of study, defined as either “intervention”, “cost of illness”, or “policy document”;
study population i.e. type of OA (e.g. knee, hip), average age of participants, sample size, timeframe
for the study; measure(s) of productivity; how information on productivity had been collected e.g. a
single question or an established productivity questionnaire; the instrument(s) used to measure
productivity and any sources containing a description, interpretation, or validation of the
instrument; the results for productivity i.e. effect size, statistical significance. In some cases, the two
reviewers (SW and MC) also reported the main strengths and weaknesses of the study/productivity
measures. Studies were firstly grouped as either intervention, cost of illness, or policy documents
and, subsequently, the intervention studies were classified by study design (e.g. RCT, cohort study)
to determine the strength of the evidence (as per Table 1).
3.4.2. Type of synthesis of results
A qualitative synthesis of results was undertaken. Quantitative comparisons and pooling of the
estimates of productivity losses due to OA (or productivity gains due to OA interventions) were not
performed due to recognised between-study heterogeneity (e.g. differences in country, methods for
estimating productivity, and the range of productivity measures used) which has been noted in
systematic reviews of the costs of OA generally, and of the impact of OA on labour productivity
specifically.41
3.4.3. Instruments used
The concept, instrument, or technique used in assembling, measuring or quantifying the productivity
benefits (losses) in the articles was our working definition of “scale of productivity benefits”.

13
3.5. Results
3.5.1. Identification of relevant articles
A total of 1,557 records were identified through searches of the five electronic databases:
Medline = 621
Embase = 824
Cochrane Library = 9
Expanded Academic ASAP = 101
EconLit = 2
There were 262 duplicates, leaving 1,295 articles for screening of titles and abstracts. After
screening, 968 articles were rejected for reasons stated in the exclusion criteria. Specific criteria not
being met were noted in the Excel spreadsheet. Full-texts were retrieved for 327 articles, and 209
articles were deemed ineligible. The main reasons for ineligibility were: a) the “article” was a
conference presentation/abstract only; (b) the study was not original (e.g. a systematic review); (c)
the study had been conducted outside the OECD; d) although the study purported to examine
productivity losses (gains) for OA (interventions), it did not have productivity as a principal outcome.
Of the 71 full-texts included for full review, 8 were excluded. Thus 63 were left to be included in the
literature synthesis. The final selected articles consisted of 25 interventions, 37 cost of illness, and 1
policy document (Figure 1). The main characteristics of these studies including the productivity
measures used in the studies are presented in Appendix 3 (intervention studies) and Appendix 4
(cost of illness).

14
Figure 1. Article selection process
3.5.2. Judgements about the quality of the OA studies
The studies included in the literature synthesis underwent an assessment for quality by the
reviewers. The most common areas of concern were:
The study population was heterogeneous e.g. consisting of people with any OA (site
unknown) or people with various forms (sites) of OA (such as knee, hip or both) grouped
together, or a different type of arthritis altogether (RA, inflammatory arthritis (IA)). A study
population consisting of people with any OA was more common in the cost of illness studies
than in the intervention studies (19 out of 37 (51%) versus 2 out of 25 (8%)). Likewise, a
population consisting of people with different sites of OA was more common in the cost of
illness studies than in the interventions studies (10 out of 37 (27%) versus 2 out of 25 (8%)).
A study population consisting of OA and another type of arthritis was equally common in the
two types of studies: 3 studies in each.
The sample size was relatively small. Nine intervention studies (36%) and 2 cost of illness
studies (5%) had a sample size smaller than 50, and an extra 4 intervention and 1 cost of
illness studies had a sample size of less than 100 individuals.
The time horizon for measuring costs was short in most cases. Only one intervention study
(Ruiz et al (2013)52) projected productivity losses over the lifetime of the individuals with OA
using markov health state-transition decision modelling. Two other economic evaluations
used a relatively long time horizon. Bedair et al (2014)53 estimated productivity costs for up
to 30 years for a hypothetical 50 year old with end stage knee OA; and Mather et al (2014)54
estimated costs associated with totalk knee arthroplasty over a 5-year horizon. Only 5 cost
of illness studies were based on longitudinal data and thus capable of tracking changes in
Initial search of Medline, Embase,
Cochrane Library, Expanded Academic and
Econlit produced 1,557 records.
262 duplicates removed
1,295 records were screened by title and
abstract.
968 records were excluded
according to inclusion criteria.
327 full-text articles retrieved.
209 full-text articles were
excluded according to eligibility
criteria. 71 included (I=30,
COI=40, P=1).
71 full-texts considered for review.8 full-texts excluded according
to eligibility criteria.
63 full-texts were included for full review.
Figure 1. Summary flow of article selection process. COI = cost of illness, I = intervention, P = Policy, OA = osteoarthritis.

15
productivity over time, with the longest tracking period being 5 years in Datta and Larsen
(2010)55 and Piscitelli et al (2012)56.
There was no control group in all of the RCTs or the logical comparator in cost of illness
studies (i.e. “individuals without OA”) was missing. In the intervention studies, Verkleij et al
(2010)57 whose randomised open-label trial involved pharmaceutical drugs did not have a
control group – it only compared costs/outcomes to another medication. Almost all of the
cost of illness studies only estimated productivity costs for an OA population, with Tang et al
(2011)58 one notable exception.
A number of other concerns became apparent when compiling the data. The most common reasons
for rejecting studies were: (1) the estimate(s) of productivity was not clearly related to having OA or
changes in productivity were not clearly related to the OA intervention and thus there was some
ambiguity about whether the estimates of productivity were associated with the disease itself (and
not another disease such as chronic pain) or an intervention designed to reduce the severity of OA
only; (2) the source for the productivity measure (and where it had undergone suitability, reliability
or validity checks; a full-description and interpretation of results) was not adequately described in
the study and thus it was not possible to ascertain, from the article, whether the measure was valid
and/or suitable for an OA population; and (3) the productivity measure(s) was not stated as a study
outcome but mentioned elsewhere in the article (e.g. background, discussion). Ambiguity on any of
these areas was checked during Stage 2 of the review where the full-text rather than just title and
abstract were appraised.
3.5.3. Synthesis of results
The methods for estimating productivity due to OA in the studies are summarised in the last column
of Appendices 3 (interventions) and 4 (cost of illness). The most common productivity measure used
in the intervention studies was Time to return to work post-surgery (11 studies), followed by a
particular productivity questionnaire such as WALs, Work Limitations Questinnaire (WLQ) (Lerner et
al (2001)59, PROductivity and DISease Questionnaire (PRODISQ) (Koopmanschap (2005)60. Single
productivity costs were measured as income status and living below the poverty line in Allen et al
(2014)61; lost income in Bedair et al (2014)53 and Marra et al (2014)50; and transitions from
employment to receipt of disability pension because of OA in Svendsen et al (2012)62. Some societal
costs (such as household assistance, informal care) were ascertained in Marra et al (2014)50, Pinto et
al (2013)49 and Waimann et al (2014)48. These studies estimated the costs borne by participants with
OA and their friends or family including out-of-pocket costs, transportation costs, lost earnings,
informal care; and the productivity costs were estimated using the human capital approach (i.e. the
gross earnings of those in employment2) in economic evaluations. Fifteen studies used a mix of
productivity measures e.g. Baldwin et al (2010)63, Gignac et al (2015)64, Lerner et al (2012)65, Marra
16
et al (2014)50, Pinto et al (2013)49 and Sankar et al (2013)66. Only eight studies provided a valuation of
the productivity losses e.g. Mather et al (2014)54 and Waimann et al (2014)48. In terms of study
design, only 6 studies were randomised controlled trials and thus capable of generating the highest
quality of evidence according to NHMRC (2000, 2001)4,5 and only 4 included economic evaluations
(Marra et al (2014)50, Mather et al (2014)54, Pinto et al (2013)49 and Waimann et al (2014)48). In
addition to Mather et al (2014)54, there were 3 other Markov health state-transition models for the
treatment of “end-stage” OA. Other study designs were: 6 retrospective studies (no control group,
often small sample), 1 retrospective case control study (no randomisation, no control group), 1
retrospective multicentre study, 1 retrospective population cohort, 1 longitudinal study, 2
prospective cohort studies, 1 sub-sample of a prospective longitudinal cohort, and 1 nation-wide
cohort study (cross-sectional), and 1 cross-sectional single centre study.
For the cost of illness studies, the WPAI was the most common measure used to estimate
productivity losses. Most studies (15) were cohort studies (population-based, prospective cohorts)
using individual-level data. Of these, 6 estimated productivity from recognised questionnaires (such
as the WPAI, WALS, RA-WIS, Economic Aspects in Rheumatoid Arthritis Questionnaire (Verstappen et
al (2005)67), Medical Outcomes Study Short Form-36, 4 used specific standalone questions about
productivity (such as labour force status, employment status, number of days and frequency of sick
leave, work disability, work limitations/satisfaction due to pain from OA, early retirement), and 5
measured productivity in terms of receipt of disability pension due to OA (see Rolfson et al (2012)68,
Ropponen et al (2011)69, Saatamoinen et al (2012)70, Van Der Burg et al (2014)71) or total sickness
benefit/disability pension payments received (see Hubertsson et al (2013)72). There were 13 cross-
sectional studies, with 10 estimating productivity losses due to OA using established productivity
questionnaires, and 1 study assessing absenteeism and short-term disability and worker’s
compensation (Berger et al (2011)73). One notable cross-sectional study is Conaghan et al (2015)74,
who not only examined productivity losses to individuals with OA and their carers, but also valued
these and other relevant (indirect) costs (such as travel costs, adjustments to the home, welfare
payments/assistance received e.g. benefits, disability parking, disability living allowance) in British
pounds. Five were longitudinal studies, with 3 using established productivity questionnaires (see
Beaton et al (2010)75, Gignac et al (2011)76, Tang et al (2010)77) and 2 using a unique productivity
question: “Are you in the labour market now or have you stopped working?” (Datta and Larsen
(2010)55) and, for those under 65 years, number of working days lost due to OA (Piscitelli et al
(2012)56). Multiple productivity questionnaires were used in one cohort study (Zhang et al (2010)78)
and one longitudinal study (Beaton et al (2010)75).

17
Although well-designed RCTs (intervention studies) produce the “best quality of scientific evidence”,
they have tended to not use the “best” (i.e. reliable, suitable, validated for OA population)
productivity questionnaires. In contrast, the cost of illness studies – ranked relatively low in terms of
quality of evidence by NHMRC (2000, 2001) – have more often than not used established
productivity questionnaires. There is a clear trade-off in terms of quality of study design versus
quality of productivity instrument – we suggest this is a feature of the literature on chronic disease
and productivity in general.
3.6. Instruments Used
More cost of illness studies used a measure of productivity from a conventional questionnaire (n=16,
42%) than intervention studies (n=6, 24%). The most commonly used productivity questionnaires
were the Work Productivity and Activity Impairment Questionnaire (WPAI), Work Activity Limitations
Survey (WALS), Work Limitations Questionnaire (WLQ), Work Instability Scale for Rheumatoid
Arthritis (RA-WIS), and PROductivity and DISease Questionnaire (PRODISQ). A brief description of the
different aspect(s) of productivity measured via the questionnaires used in OA studies, how to
interpret the results, and some limitations of the measures is provided in Appendix 6. Table 2
provides an overview of the measures, assessing the following important features:
Capacity to monetarise productivity impacts
Whether it includes critical subpopulations e.g. those out of the workforce due to the
condition
Whether it includes obvious major costs e.g. lost earnings,
Whether it includes other major costs e.g. welfare, tax, worker’s compensation
Whether it has a direct measure of productivity
Availability (cost and how easy it is to access).
A tick indicates that the questionnaire has this particular feature, and a cross indicates it does not.

18
Table 2. Overview of Productivity Instruments
Instrument
Key Item
Capacity to
monetarise
productivity
impacts
Includes critical
subpopulations e.g.
those out of the
workforce due to
the condition
Includes
obvious major
costs e.g. lost
income
Includes other
major costs e.g.
welfare, tax,
worker’s
compensation
A direct
measure of
productivity
Availability
Workplace Activity Limitations Scale
(WALS) Contact the authors; see Gignac et al (2012).
79
Work Limitations Questionnaire
(WLQ)
Copyrighted: Work Limitations Questionnaire 1998 by The Health Institute, Lerner
D, Amick B 3rd, GlaxoWellcome. Use of the WLQ requires a fee for commercial
applications; free of charge for noncommercial applications.
PROductivity and DISease
Questionnaire (PRODISQ)
See the author for accessing information about PRODISQ: Koopmanschap
(2005)60
.
Osteoarthritis Costs and
Consequences Questionnaire (OCC-Q)
http://www.dirum.org/assets/downloads/634935127915736079-
Osteoarthritis%20Cost%20and%20Consequences%20Questionnaire.pdf.
Work Productivity and Activity
Impairment Questionnaire (WPAI)
http://www.reillyassociates.net/WPAI_SHP.html. Permission and charges are not
required for using the WPAI.
Stanford Presenteeism Scale (SPS-6)
http://stresshealthcenter.stanford.edu/research/documents/Presenteeismactual
measuresps-6.pdf. And see the Stanford Medicine Center on Stress and Health for
description/scoring instructions and various versions:
http://stresshealthcenter.stanford.edu/research/measures.html.
Endicott Work Productivity Scale
(EWPS)
The EWPS is a copyrighted instrument. There is a basic fee charged per user for
commercial use. It is accessed through an unrestricted license arrangement.
Work Instability Scale for Rheumatoid
Arthritis (RA-WIS)
Copyrighted to the Psychometric Laboratory for Health Sciences, University of
Leeds. Go to: www.leeds.ac.uk/medicine/rehabmed/psychometric/Scales3.htm.

19
Instrument
Key Item
Capacity to
monetarise
productivity
impacts
Includes critical
subpopulations e.g.
those out of the
workforce due to
the condition
Includes
obvious major
costs e.g. lost
income
Includes other
major costs e.g.
welfare, tax,
worker’s
compensation
A direct
measure of
productivity
Availability
Economic Aspects in Rheumatoid
Arthritis Questionnaire
See the Appendix in Verstappen et al (2005)67
, which outlines how productivity
costs were estimated and valued using the Friction Cost and Human Capital
methods.
Medical Expenditure Panel Survey
(MEPS) http://meps.ahrq.gov/mepsweb/about_meps/survey_back.jsp.
Helsinki Health Study Baseline
Questionnaire
The Helsinki Health Study Questionnaires (and data) are owned by the Hjelt
Institute, Department of Public Health, University of Helsinki, Finland. Possible
that, through collaboration with the research team, new research
proposals/initiatives can lead to use of the questionnaires. Contact the Helsinki
Health Study group, head Eero Lahelma ([email protected]). Study
website: www.hjelt.helsinki.fi/.
Health and Labour Questionnaire
(HLQ)
The HLQ rights are reserved by the Institute for Medical Technology Assessment
(iMTA), Erasmus University, Rotterdam, Netherlands. Permission to use the
instrument needs to be sought through a licensing arrangement, and sought for
each (individual) study. There are no financial conditions related to the
permission.
World Health Organization’s Health
and Work Performance Questionnaire
(HPQ)
The two versions of the HPQ for employees and clinical trials where recall is the
last 7 or 28 days of work, and other relevant information (short forms and scoring
sheets) are available at: http://www.hcp.med.harvard.edu/hpq/info.php.

20
3.7. Single questions about productivity
In the intervention studies, the productivity questions were about:
Time to return to work post-surgery
Job disruptions due to OA related issues (treatment, problems)
Productivity loss (stated generally)
Absenteeism
Reduced work hours
The amount of work time, absences, and unpaid work
Current employment status when first report back to work
Societal costs such as expenses due to knee pain or OA (out-of-pocket costs, lost earnings,
income status, and transportation costs), household assistance, informal care, and poverty.
In the cost of illness studies, common one-off (or standalone) productivity questions were about:
Absenteeism
Worker’s compensation
Work force status
Role limitations/satisfaction
Sickness benefits and disability pension payments
Retirement due to ill-health
Working ability (disability)
Number of days and frequency of sick leave
Employment status
The majority of intervention studies considered a single productivity measure, with “time to return
to work post surgery” being the usual one (n=8, 32%). Only three studies measured productivity
costs from a societal perspective: (1) Marra et al (2014)50 assessed work changes (work time,
absences, and unpaid work) and other societal costs (expenses from knee pain or OA, household
help, and informal care); (2) Mather et al (2014)54 assessed the impacts of treatment for end stage
knee OA on lost earnings and productivity, and carer costs; and (3) Pinto et al (2013)49 assessed
participants’ loss of hours and the costs borne by participants’ friends or family (out-of-pocket costs,
transportation costs, lost earnings, and informal care). Similarly, Svendsen et al (2012)62 estimated
lost productivity as transitions from employment to disability pension or a flex-job within 2 years of
having knee (OA) surgery using the Danish transfer (welfare) payments register.
Most cost of illness studies (and all of the intervention studies) estimated productivity losses for OA
only i.e. single chronic condition. However, three cost of illness studies estimated the productivity
losses for OA only and OA plus comorbidity (all-cause) (Hubertsson et al (2013)72, Sayre et al
(2010)80, Van Der Burg et al (2014)71). These studies reported statistical differences in odds ratios for
having OA versus OA plus comorbidity but did not provide a value (dollars) for the differences. The

21
OA plus comorbidity method for estimating productivity losses involves counting all productivity
losses (costs) for any health-related reason in the estimates. The main benefit of recording all-cause
productivity losses is the ability to capture the productivity losses attributable to comorbidities.81 As
Catay et al (2012) have stated, common coexisting conditions such as cardiovascular disease and
obesity could be “consequences of osteoarthritis arthritis”.81 Thus, the productivity costs associated
with these type of diseases are best reported separately in future OA studies.
3.8. Monetarisation of productivity losses
Only 8 of the 25 intervention studies (32%) provided a valuation of the productivity losses of OA i.e.
expressed the productivity losses in monetary terms (dollars). The human capital cost method was
used to value these losses, with the exception of Pinto et al (2013)49 who used the friction cost
method. The human capital method takes the patient’s perspective and counts any hour not worked
as an hour lost (based on wages). By contrast, the friction cost method takes the employer’s
perspective, and only counts as lost those hours not worked until another employee takes over the
person’s work (replacement). Both methods can produce widely different results. Thus authors need
to be explicit about the method used for valuation of costs.
Four cost of illness studies (11%) provided valuations of the productivity costs.
3.9. Statistical analyses
The majority of the intervention studies (RCTs) estimated the productivity losses of OA over a
relatively short (follow-up) period e.g. 6 months, 9 months, or 2 years in de Carvalho et al (2014)82.
Some of these studies were also limited in terms of sample size and missing a control group e.g.
Verkleij et al (2010)57. Few intervention studies estimated productivity losses using longitudinal data
(Gignac et al (2015)64 and Sankar et al (2013)66 only). Five intervention studies included economic
evaluations/Markov state-transition decision models for the productivity (and health) outcomes of
people with OA which generated productivity losses over a longer time horizon (e.g. lifetime). Similar
statistical methods to those reported below for the cost of illness studies were used to estimate
productivity losses (i.e. logistic (multiple) regression analysis).
The majority of the cost of illness studies aggregated the productivity losses for each study
participant with OA, and then computed the mean or median productivity loss incurred by those
individuals e.g. Kotlarz et al (2010)83. Hermans et al (2012)84 reported productivity losses as median
productivity losses (lost paid hours) per patient per month as well as total costs. However, a few
studies employed a type of “incremental cost” method where the difference between the
productivity losses incurred by people with OA and those without OA was computed e.g. Berger et al
(2011)73, DiBonaventura et al (2011)85, Datta and Larsen (2010)55, Tang (2011)58. A few cost of illness

22
studies used a matched control group. Control groups tended to be matched to the OA group by
age, sex, and area of residence. Several studies used regression analysis to compute an “adjusted
incremental cost” for productivity in people with OA. The main benefit of estimating adjusted
productivity losses is that it enables control for individual heterogeneity (i.e. demographic, socio-
economic, and health status and/or comorbidity factors). Pit et al (2010)86 and Saastamoinen et al
(2012)70 estimated productivity losses for people with OA and without OA taking into account
comorbidity). The majority of studies used logistic regression analysis to generate these estimates.
Changing productivity losses over time was a common concern raised by authors of the reviewed
studies (e.g. Tang et al (2010)77). Productivity costs of OA may change due to updated treatment
recommendations (and costs) and new clinical practice. Yet, only five cost of illness studies (14%)
examined trends in productivity losses of OA.
3.10. Productivity measures not captured
The productivity costs missing from the literature are:
1. A wider range of productivity losses for individuals. Such estimates would include not only
lost income from lost labour force participation (or reduced paid working hours) but also the
costs of informal care.
2. Costs to government which consist of extra welfare payments and lost taxation revenue due
to the lost productivity of people with OA.
3. Societal costs e.g. the percentage of lost GDP due to OA through its impact on work capacity.
The above costs would be helpful if reported in dollars, making them comparable across time and
countries; and from different perspectives i.e. individual, governmental, societal; and projected
several years into the future using reliable data sources and sophisticated econometric or
microsimulation models. Providing estimates of far-reaching productivity costs due to OA would be
helpful for making decisions about proposed research (includes clinical) and policy.
Recommendation 1: That the impacts of interventions on productivity during the study period
and in the longer-term be identified, measured, and valued. This process requires productivity to
be a central issue that is asked about at baseline and follow-up in trials; however, this may still
not be sufficient to identify the full impacts of the intervention from the different perspectives of
individuals, government and society due to short follow-up. More sophisticated modelling of
productivity impacts is needed e.g. microsimulation models using clinical trial data (for the
effects) as inputs linked to productivity data from national surveys.

23
A range of methods were used to estimate productivity losses due to OA in the studies found, from
standalone questions about a particular aspect of productivity (such as labour force status, hours of
work, sick leave and time to return to work after an intervention) to more comprehensive workplace
activities and limitations surveys (such as WALs, WIS, WLQ, WPAI) and productivity scales (EWPS).
However, many of these measures are reported in natural units (such as hours or paid work, number
of sick days, or are a scale) and thus without conversion to monetary terms no meaningful
comparisons can be made across different OA populations (by gender, country, age). This is
important because OA is a gendered disease and available and best treatments differ across
countries as well as the costs of accessing healthcare (and the flow-on effects to health and work).
As noted earlier, only 12 studies produced an estimate of productivity losses due to OA expressed in
dollar terms.
3.11. Discussion
This study is a review of published OA studies measuring productivity losses, either as a primary or
secondary outcome, focusing on the methods used to do so. The main result is that the methods for
estimating productivity losses of OA vary from a one-off question about a single aspect of
productivity to established questionnaires where several components of productivity can be
evaluated. Estimates of the productivity losses also varied considerably across studies using the
same questionnaire (instrument), which is likely to be due to between-study differences in the
country under consideration and the location of OA examined. Only 8 intervention studies (32%) and
4 cost of illness studies (11%) provided a value for the productivity losses (monetary terms) of their
study population. Heterogeneity in the methods used (and how results are reported) made a direct
comparison between studies (or the pooling of results) difficult and, arguably, inappropriate.
3.11.1. Measuring and reporting productivity losses of OA
A range of productivity measures have been used to estimate the work burden of OA in the included
studies, from standalone or one-off questions about some aspect of productivity (such as time to
return to work, labour force status, hours of work) to entire productivity questionnaires (such as
WPAI, WALs, WLQ). Yet many of the productivity measures derived from these questionnaires have
only recently been assessed in terms of their sensibility features (i.e. face or content soundness and
feasibility) from the perspective of patients with OA. For the 250 OA (or RA) workers in Tang et al
Despite the high disease burden of OA, the evidence base underlying the work burden is only
just emerging. There is a lack of reliable evidence about the productivity losses of OA in many
countries including the UK, US and Australia.

24
(2013)1, the WLQ-25 was considered to be the most comprehensive work questionnaire (supported
by 92.8% of the sample with OA or RA), the WALS was found to perform the best in terms of how
well it could be understood by participants (97.6%) and the suitability of the options for responding
to specific questions (97.9%), and the RA-WIS was found to be the best in terms of the length of the
work questionnaire (91.6%). There was also consistent sensibility between OA and RA. The WALS
(32.6%) and WLQ-25 (30.0%) were found to be moderately preferred in the final overall appraisal
conducted.
A range of data were used to estimate the productivity losses in the reviewed studies, from within-
trial only data, OA cohort studies and administrative data (such as national welfare payments
registers and worker’s compensation data). Only one well designed study (RCT) capable of
generating the highest quality of evidence (NHMRC 2000,2001)4,5 used an established productivity
measure (WLQ) (and provided a valuation) to assess the impact of the intervention on patients,
including a dollar value (Lerner et al (2012)65). Likewise, there were only two economic evaluations
that included productivity losses from an established questionnaire in their calculations i.e. the
OCCQ in Pinto et al (2013)49, and PRODISQ in Verkleij et al (2010)57. While the cost of illness studies
tended to use a productivity measure sourced from a recognised questionnaire, the issue with these
studies is that their study design (cohort, cross-sectional) automatically generates a lower quality of
evidence.4,5
Estimates of the productivity losses due to OA expressed in monetary terms was lacking, and this
was most common in the cost of illness studies (89% did not provide these valuations). Additionally,
reliable “flow-on” estimates of the productivity losses of OA expressed in dollar terms as lost
income, extra welfare payments, lost taxation revenue and the percentage of GDP attributable to
OA was lacking e.g. only Bedair et al (2014)53, Lerner et al (2012)65, Marra et al (2014)50, and Ruiz et
al (2013)52 in the intervention group.
Although cost estimations unavoidably vary to a certain extent, particularly across different
populations, the variations observed in this review were substantial even between studies from the
same country/patient group (e.g. knee OA only), and were mainly due to methodology i.e. the
instrument and costing method used (e.g. human capital versus friction cost methods), the statistical
method used to estimate the cost (modelling), and how those costs were presented. This may raise
suspicions about the consistency, soundness, and appropriateness of the estimates of productivity
losses used in economic and policy evaluations at the present. There needs to be standardisation of
the productivity measure used in intervention and cost of illness studies to enable more meaningful
comparisons to be made across study populations/countries, and assist policymakers in making
resource allocation decisions, especially cross-portfolio decisions.

25
If standardisation cannot be established for all studies focusing on productivity, then perhaps
establishing it for particular types of studies (e.g. interventions) would help to address these types of
suspicions. This would be helpful in increasing comparability across, at least, groupings of
productivity-focused studies and in identifying the factors for variations in the studies.
3.12. Conclusion
This review revealed significant variations among studies on the productivity costs of OA in terms of
methodology (instrument), cost estimation (statistical analyses), and presentation of these costs,
which raises concerns about the reliability, soundness, and appropriateness of productivity cost
estimation in economic/medical/policy impact studies.
Recommendation 2: To improve transparency, repeatability and comparability in studies involving
productivity, there needs to be greater efforts made for standardisation.
Standardisation is needed in order to improve transparency, repeatability and comparability of
studies on the productivity losses of OA.

26
4. Proposed Productivity Measure (Stage 2)
As identified in section 3.10, there were three areas of productivity that were not adequately
captured in previous studies:
1. Productivity losses for individuals including lost income and costs of informal care;
2. Costs to government from additional welfare payments and lost tax revenue; and
3. Societal costs as measured through percent and dollar value of GDP lost.
In this section we propose a measure of productivity that captures these three areas. Our proposed
general measure of productivity, called Productivity Life Years (PLYs) gained (lost), takes into account
measures used by policy makers in Australia. The proposed measure conceptually aligns with the
aims of the Commonwealth Government to increase productivity and fiscal sustainability.
The framework for the productivity measure is described in Section 4.1.
4.1. Framework for productivity measurement
As a first step we have developed a framework for identifying, measuring and valuing productivity
gains (losses) in intervention studies. This framework consists of “scaffolding” based on compiling an
interrelated set of cascading questions. The starting question is about whether a person is in paid
employment or not; followed by their usual hours of work per week; and if not full-time, then
whether the person’s ill-health has been the main factor for the reduced labour force participation
(and OA as the condition causing it) (see Figure 2). Once the nature of the person’s work has been
identified, we consider how to extract information that quantifies the productivity loss e.g. current
annual salary, sources of income (including disability pension, workers compensation), number of
sick leave days due to OA (multiplied by the individual’s hourly wage). The measure of PLY forms
part of this framework. A list of questions that have been used as the basis of the measure is found
in Appendix 7.
All of this information can be asked within an RCT at baseline and perhaps at 3-month intervals
thereafter for the life of the trial (to obtain immediate impacts of the intervention on productivity)
and at follow-up (to obtain information about the longevity of the intervention impacts on
productivity).
Productive Life Years (PLYs) is defined as the number of people in the labour force in any given year.
PLYs lost due to a chronic condition is the number of people who were out of the labour force due to
that chronic condition. PLYs gained due to an intervention is the number of people who were out of
the labour force before treatment and subsequently returned to the labour force in any given year.

27
Figure 2. Framework for identifying, measuring and valuing productivity changes The framework questions allow the identification of whether the individual is in paid work, their
income from that work (earnings), how any health conditions they have affected their work, and any
welfare payments they receive (and thus add to their total income). For those not in paid work, the
framework identifies the main reason for being out of the labour force (and whether illness [OA] is
the reason), and any welfare payments they receive. In short, it gathers information about the
nature of the productivity (labour productivity through number of hours worked) and a valuation of
it (because individuals report their income and welfare payments).
Where there is capacity for more complicated modelling, it would be desirable to model additional
long-term (and wider-reaching) productivity impacts occurring beyond the study (intervention)
period. It is probably not possible to ask participants about their taxation directly – people tend not
to remember and it is often not feasible to ask complicated questions in health/medical intervention
studies – so an alternative approach would be to estimate this information from established income-
welfare payments-taxation microsimulation models based on national population survey data using
closely associated variables such as income, age, family type. It is also possible to develop a model of
GDP impacts; however, this would be reliant on prevalence data relevant to the trial to be
population represented and, from these data, using the hours of work and labour force participation

28
variables as parameters in the GDP model. A GDP model requires a particular set of variables (see
Intergenerational Reports especially IGR 2007).
Applying this framework to RCTs or other intervention studies, we note:
1. Large productivity gains are most likely to be seen for interventions preventing a condition
or early intervention as a form of secondary prevention reducing the risk of disease
progression (and thus reduce the likelihood of exit from the labour force).
2. Capturing productivity gains partly depends on the period of follow-up. The longer the
follow-up, the more likely we will observe improvements in productivity due to the
intervention (and thus no need to increase the sample size in order to observe an impact on
productivity).
3. All the information listed above can be collected by survey in clinical trials and other
intervention studies. Where there is no data collected, an estimate of productivity gains can
be modelled by using a health outcome variable (such as SF36 or its subscales) which is
associated with productivity in survey data (see example, Section 5). One advantage of other
types of studies is that their recruitment criteria are often less restrictive and thus are more
representative of the population of interest.
4. Productivity losses are commonly also incurred by carers, and surveys should be provided to
carers to capture their impacts.
5. Where there is capacity to undertake modelling, it is recommended that additional
productivity impacts (such as longer-term labour force participation, income, welfare
payments) be projected beyond the study period.
6. Although it is possible to survey participants on their taxation, this is often not feasible so an
alternative approach is to use strongly related variables (such as income, age, and family
type) with national population survey data through synthetic matching in a microsimulation
model.
7. It is also possible to develop a model of GDP impacts; however, this would be reliant on
weight in the population trial to be population represented and, from this data, use hours of
work and labour force participation variables as parameters in the GDP model. A GDP model
requires specific inputs such as number of people in the working-age population, number of
people employed.13
8. The framework provides a description of data that could be collected within a clinical trial;
however, the total impacts will represent those for the trial population only. If national
estimates of productivity impacts are desired, then the trial data will need to be reweighted
to be representative of the national population and, in particular, the incidence of the
condition being treated (and eligible for the trial).
Societal costs provide policymakers with the “end result”, including impacts on individuals, the
government, and society.

29
4.2. Methods for estimating Productive Life Years Gained (Lost) and related costs
In Australia, we have a good example of the use of national data and models to capture productivity
impacts of illness based on microsimulation.87 We have previously developed a microsimulation
model Health&WealthMOD to estimate the economic costs of early retirement due to illness for the
older working age (i.e. 45-64 years) Australian population. The development of the model has been
described in detail in Schofield et al (2011)88. The base population of Health&WealthMOD was based
on the Australian Bureau of Statistics’ Surveys of Disability, Ageing and Carers (SDAC) data.89,90 The
SDACs are nationally representative, large, Australian household surveys conducted by the ABS
every 3 or so years. They provide the most comprehensive data about individuals in terms
demographics, socioeconomic status, labour force, chronic conditions, and informal care needs and
roles. But the SDACs include only limited economic data. More detailed economic information (such
as income, welfare payments, income tax paid and the value of wealth assets such as
superannuation) needs to be sourced elsewhere. This study has used outputs from other
microsimulation model such as STINMOD developed for the impact of policy changes on the
Australian population. STINMOD was developed (and is maintained) by the National Centre for Social
and Economic Modelling (NATSEM, University of Canberra) (www.natsem.canberra.edu.au) and is
one of the principal microsimulation models of Australia’s income tax and transfer (welfare)
system.91
In the SDACs used for this study, respondents were asked to nominate their current labour force
status as either:
1. Employed working full-time
2. Employed working part-time
3. Unemployed looking for full-time work
4. Unemployed looking for part-time work
5. Not in the labour force
Respondents who were not in the labour force were also asked to nominate the main reason for not
working or looking for work. One of these options is ‘own ill-health or disability’. All respondents
were asked whether they had long-term health conditions, and to nominate the type of main
condition. The ABS then grouped the diseases based on ICD10 codes. Respondents who reported to
be not in the labour force due to their “own ill-health or disability” and their main health condition
to be “arthritis and related disorders” (ICD10 code M00-19), for example, were then considered to
have ‘arthritis’ as the reason for them being out of the labour force.
We have used the output of Health&WealthMOD to estimate productive life years lost due to
chronic conditions and the related costs such as lost incomes and savings for individuals and the lost

30
income tax and the increased welfare payments for the governments.92. The economic costs of lost
productive life years lost for the 45 to 64 year old Australian population have been estimated for a
number of chronic conditions such as arthritis93, cardiovascular diseases94, mental illness95,
diabetes96 and back pain97.
4.3. Conclusion
The productivity measure proposed in this study is identified and could be measured using relevant
questions in intervention studies or from national surveys conducted by the ABS (SDACs), and valued
using outputs from microsimulation models commonly accessed by government departments in
Australia. A choice will need to be made about how many questions about productivity can be
included in an RCT or other intervention study when the entire set is considered to be too time
consuming for study participants.
Our expectations of the new productivity measure proposed (PLYs) are that it will be included in
intervention studies for all chronic conditions – just as standard questions about healthcare usage
are included – and reported separately to cost-effectiveness measures (such as the Incremental Cost
Effectiveness Ratio or ICER) to enhance decisions about resource allocation. We note that the
framework for the productivity measure includes “yes” and “no” branches for labour force
participation (see Figure 2) to help with counting the number of people in important groupings e.g.
people with a chronic condition [OA] working full-time versus without a chronic condition [No OA]
working full-time, people with a chronic condition who return to work due to an intervention (such
as a pharmaceutical medicine) that improved their health versus people in work who did not have it
(controls). It also assists in identifying relevant valuations e.g. for people in the work force, their
main source of income is likely to be earnings (wages, salaries) whereas, for those not in the work
force, it is likely to be a social security payment(s). It is self-reported changes in the labour force
participation of people with a particular illness through an intervention that generates a measurable
impact that subsequently can be valued for individuals (income), the government (taxes and welfare
payments) and society (GDP). As discussed above, there are data sources currently available in
Australia that can be used for the productivity measure proposed. The particular questions
(branches in Figure 2) may also be added to clinical trials or other intervention studies, although the
follow up period may be insufficient to obtain information on the timing and nature of the labour
market changes. If the data collected is not extensive or sufficiently detailed at the individual level,
the valuation step may need to be completed by bringing in data from other sources (e.g. ABS or
outputs from a microsimulation model such as STINMOD).

31
5. Productive life years gained and the associated economic gains as a result of OA
intervention (Stage 3)
The costs of OA on individuals are substantial, and Appendix 8 provides estimates of the costs for 4
different individuals (based on age, sex and education).
In this section, we applied the measure of productive life years (PLYs) gained, proposed in the
previous section (Stage 2), to estimate the potential productivity benefits of an intervention to
manage OA. As discussed earlier in the report, the productivity improvements have significant flow-
on economic benefits both for individuals in terms of increases in disposable incomes and savings
and for the government in terms of increases in income tax revenue and reductions in welfare
payments. We therefore modelled the economic gains associated with the potential PLYs gained as a
result of managing OA with an intervention.
A targeted literature review of productivity measures used in OA intervention and other studies in
Stage 1 did not reveal any suitable randomised controlled trials or other studies, which have a direct
measure of productive life years (PLYs) gained due to an OA intervention. We therefore modelled
PLYs gained based on the association between improvements in quality of life, as a result of
managing OA with an intervention, and labour force participation.
Our prior work on analysing the association between quality of life measures and labour force
participation suggests that the Short Form-36 or SF-36 (specifically the bodily pain domain) score is
one of the quality of life measures that has a strong association with labour force participation.98
Furthermore, there are nationally representative Australian household panel survey data publicly
available to model the association between the SF-36 bodily domain score and labour force
participation.
A more specific search of the literature to identify the best available study that has measured
improvements in SF-36 bodily pain domain scores as a result of managing OA with a pharmaceutical
intervention resulted in Rabenda et al (2005)21. This is a population based naturalistic prospective
follow-up study of 783 patients aged 35 and over with OA in whom general practitioners (GPs)
decided to start treatment with non-selective non-steroidal anti-inflammatory drugs (NSAIDs) for
the symptomatic management of OA. The study measured health related quality of life (QoL) using
two QoL instruments: the Medical Outcomes Study Short Form-36 Health Survey (SF-36) and the
Western Ontario and McMaster Universities OA index (WOMAC) at baseline and after 3 months.
Although the study is not a randomised controlled trial, it provides part of the information needed
for modelling PLYs gained due to a pharmaceutical intervention i.e. improvements in SF-36 bodily
pain domain scores due to an intervention to manage OA. Being a naturalistic study, it did not have a

32
control group and thus it is not possible to comment on if the improvement estimated in the study is
over the placebo effect (effect in control group). However, the benefit of using results from such
study is that sample selection is not too restrictive and thus is more likely to be represent the
general population with OA.
We simulated the potential labour force gains and the associated economic gains of managing OA
with NSAIDs, as a case study, to demonstrate how interventions to manage OA have the potential to
provide economic benefits to both individuals and the government in addition to health benefits.
Using the estimated number of Australians aged 15-64 years who were out of the labour force due
to their OA in 2015, we estimated how many of them would have remained in the labour force if
their OA was managed using NSAIDs.
Any medicines or other interventions clinically proven to be effective may have some productivity
benefits. The method described in this section can be extended to other interventions and chronic
conditions to estimate the productivity and economic benefits of managing or preventing a
condition, provided that relevant outcome data are collected. We chose “the use of NSAIDs” as a
case study since our extensive literature search did not reveal any other studies that had analysed a
pharmaceutical intervention for the management of OA, which had the relevant information (such
as SF-36 scores) required to model the productivity benefit and the associated economic benefit.
Rabenda et al (2005)21 is the only study that we found, which analysed the effect of a
pharmaceutical health intervention (NSAIDs) and had all the relevant data for modelling the
potential labour force increase.
5.1. Data and methods
Published results from Rabenda et al (2005)21 and nationally representative Australian household
surveys were used to estimate the potential labour force and related economic benefits associated
with pain reduction in patients with OA by managing their OA with the use of NSAIDs. The top five
most commonly used NSAIDs reported in the study was Piroxicam, Nimesulide, Meloxicam,
Ibuprofen and Diclofenac.21 Rabenda et al (2005)21 reported an improvement in two health related
QoL measures: the SF-36 and the WOMAC over a 3 month period. The SF-36 measures eight health
concepts providing scores in eight health domains: physical functioning, role limitations-physical,
bodily pain, social functioning, general health, role limitations-emotional, general mental health and
Selection of “the use of NSAIDs” as a case study to demonstrate the potential economic benefits
of intervention to manage OA does not imply that this is the only intervention that has
productivity and associated economic benefits.

33
vitality.99 Each domain score ranges from 0 to 100, with higher scores reflecting better health status.
The SF-36 bodily pain domain is used to evaluate overall pain. We chose the SF-36 bodily pain
domain score to analyse the association between quality of life and labour force participation
because pain is reported to be one of the strongest predictors of labour force participation and is a
key symptom of OA.98
Rabenda et al (2005)21 reported that a comparison of SF-36 bodily pain domain scores between
baseline and at 3 months after starting treatment showed a statistically significant improvement in
SF-36 bodily pain domain scores in patients with OA over the 3 month period. Rabenda et al (2005)21
estimated that there was an improvement of 6.56 units in average SF-36 bodily pain domain score
between baseline and at 3 months.
5.1.1. Association between SF-36 bodily pain scores and labour force participation
The association between the SF-36 bodily pain domain scores and the probability of being in the
labour force were analysed using Wave 10 data of The Household Income and Labour Dynamics in
Australia (HILDA) Survey which is a nationally representative Australian household panel survey.100
Analysis was restricted to the surveyed populations aged 20-64 years and those who had SF-36
bodily pain scores in the range between 0 and 70. This would exclude individuals in the HILDA Survey
who had lesser or no pain (i.e. higher SF-36 bodily pain scores) and reduce the chance of
contaminating the association between the SF-36 bodily pain scores and the probability of being in
the labour force.
The association between the SF-36 bodily pain scores and labour force participation was estimated
as the prevalence ratio (ratio of the probability of being in the labour force) associated with each
unit increase in the SF-36 bodily pain score using a modified Poisson regression model with a robust
error variance to estimate the prevalence ratios.101 Analyses were adjusted for the confounding
effects of age and highest level of education, and the models were separately fitted for men and
women.
5.1.2. Labour force impacts
We estimated the number of persons, who could have continued to stay in the labour force, among
those not in the labour force due to their OA, as a result of pain reduction (for this case study, we
chose an example of using NSAIDs). This was estimated as the potential increase in those who were
in the labour force and have OA using the equation:
AddLF = NumInt * LFOA * LFGrowth (1)

34
where NumInt is the estimated number of people not in labour force due to their OA who will start
treatment for the management of their OA (for illustration, we used treatment with NSAIDs); LFOA is
the estimated labour force participation of those with OA (a rate); and LFGrowth is the estimated
growth in the labour force participation rates associated with pain reduction as a result of
interventions, which is estimated as
LFGrowth = exp(Effect*ΔPain) – 1 (2)
where Effect is the estimated association between the labour force participation and SF-36 bodily
pain domain scores, which is estimated as the change in the labour force participation rates for each
unit change in SF-36 bodily pain domain score (which was estimated using the Wave 10 data of The
HILDA Survey100), such that expEffect is a prevalence ratio of being in the labour force associated with
each unit change in SF-36 bodily pain domain score; and ΔPain is the estimated improvement in SF-
36 bodily pain score for the patients undergoing an intervention to manage their OA (i.e. starting
NSAIDs in this case) based on the published study by Rabenda et al (2005).21
5.1.3. Economic benefits
For those individuals who are not in the labour force due to their OA, the potential increase in their
incomes as a result of staying in the labour force by managing their OA were estimated as the
difference in their incomes (when they are not in the labour force due to their OA) and their
expected incomes if they remain in the labour force. The expected incomes were estimated using
counterfactual simulation with Monte Carlo methods. For each of those individuals not in the labour
force due to their OA, who could have continued to stay in the labour force by managing their OA, a
counterfactual was selected at random with replacement from the pool of those in the labour force
who had OA, who are in the same age group, same sex and have the same highest level of education
as of those who could have continued to stay in the labour force by managing their OA. The mean of
the difference in the incomes of those not in the labour force due to OA but who could have
continued to stay in the labour force by managing their OA and their counterfactuals were estimated
and reported as the expected average increase in incomes. We ran 1,000 simulations and reported
the average of the 1,000 simulations as the result in this report.
Economic benefits were also estimated for the government in terms of the expected average
increase in income tax payment and the average reduction in welfare payments for those who are
not in the labour force due to their OA but who could have continued to stay in the labour force by
starting NSAIDs. The economic benefits were estimated at the national level and are reported here
as total increases in income and reduction in welfare expenditure. The benefits for individuals were
estimated in terms of an increase in total accumulated income for all additional people in the labour

35
force and, for the government, in terms of total savings in welfare payments and additional income
tax revenue.
We also estimated the impacts on gross domestic product (GDP) resulting from the additional
people who could have continued to stay in the labour force by managing their OA. The impact on
GDP was estimated on a pro-rata basis based on the published GDP data and the number of people
in the labour force.
The labour force impacts and the associated economic benefits of using NSAIDs for the management
of OA were estimated at the population level for Australians aged 15-64 years (the official working
age population) who were out of the labour force due to their OA in 2015. The estimate of the
potential labour force impacts was based on the assumption that all those not in the labour force
due to their OA would take NSAIDs for the management of their OA. The estimated number of
Australians aged 15-64 years who were not in the labour force due to their OA and economic data
including incomes, income tax paid and welfare payments received are based on our
microsimulation models Health&WealthMOD and Health&WealthMOD203087,88 that we developed
to analyse the economic impacts of early retirement due to chronic conditions. The development of
these models are described in detail in Schofield et al (2011) and Schofield et al (2014).87,88 We used
a modified version of our models, updated with more recent data to estimate the results for 2015
and to include all working age individuals (15-64 years), for this analysis.
5.2. Results
5.2.1. Not in the labour force due to OA
The prevalence data and the labour force information were not available for those with OA in the
main data sources for our microsimulation models, the ABS Surveys of Disability, Ageing and Carers,
which only have information for those with overall arthritis. Thus, we estimated the labour force
information for those with OA based on a previous study which estimated the age-specific
proportion of OA among overall arthritis.102 Based on the assumption that all individual labour force
groups would have the same proportion of OA among those with arthritis, it was estimated that
there would be 9,910 men and 19,422 women not in the labour force due to their OA in 2015 (Table
3). The estimated numbers of people in other labour force categories by age group and gender are
listed in Appendix 9.

36
Table 3. Estimated numbers of people not in the labour force due to OA, aged 15-64 years, 2015
5.2.2. Association between SF-36 bodily pain domain scores and labour force
participation
The association between SF-36 bodily pain domain scores and the labour force participation rates
was estimated using Wave 10 data of the HILDA Survey. For those aged between 20-64 years and
with bodily pain domain scores between 0 and 70, the estimated prevalence ratios of being in the
labour force associated with each unit increase in SF-36 bodily pain domain score was 1.0112 for
men and 1.0103 for women.
The labour force participation rates of those with OA were 63.1% for men and 52.5% for women in
2015. The Rabenda et al (2005) estimates of the improvement in SF-36 bodily pain domain score as a
result of starting treatment with NSAIDs for the management of OA from baseline to 3 months
follow-up (a 6.56 units improvement) were then used as an input into the equation (2) (page 35) to
estimate the increase in labour force participation.21 It was found that there would be an estimated
increase of 7.6% points in the labour force participation rate of men and 6.9% points for women
with OA by follow-up.
5.2.3. Impacts on labour force participation
We estimated how many people not in the labour force due to their OA would have continued to
stay in the labour force if they have had started treatment with NSAIDs for the management of OA.
If we assume that all those not in the labour force due to their OA (Table 3) had started managing
their OA with NSAIDs, there would be an additional 472 men and 705 women aged 15-64 years in
the labour force, who otherwise would be out of the labour force due to their OA in 2015 (Table 4).
Age group Male Female
15-44 years 409 986
45-64 years 9,501 18,436
Total 9,910 19,422

37
Table 4. Estimated number of people who would have avoided being out of the labour force due to their OA as a result of starting treatment with NSAIDs for the management of their OA, aged 15-64 years, 2015
Age group Male Female
15-44 years 19 36
45-64 years 453 669
Total 472 705
5.2.4. Economic impacts
The potential increase in the labour force participation of those with OA as a result of reduced pain
by managing their OA with NSAIDs has follow-on economic benefits both to individuals in terms of
an increase in their disposable income and for the government in terms of savings in welfare
payments and additional income tax revenue.
Men aged 45-64 years, who were not in the labour force due to their OA, would have an estimated
increase of $51,888.00 in their annual income if they continued to stay in the labour force by
managing their OA. They would have, on average, paid an additional income tax of $14,144.00 and
received $14,524.00 less in welfare payment annually (Table 5). For women of this age group, the
estimated increase in their annual income was $25,834.00 if they stayed in the labour force by
managing their OA. They would have, on average, paid an additional income tax of $6,395.00 and
received $13,940.00 less in welfare payment annually (Table 5).
Table 5. Estimated individual economic benefits of being in the labour force because of reduced pain as a result of managing OA, aged 15-64 years, 2015
Male Female
15-44 years 45-64 years 15-44 years 45-64 years
Increase in annual incomes 40,614.00 51,888.00 31,742.00 25,834.00
Increase in annual income tax payment 12,077.00 14,114.00 7,295.00 6,395.00
Reduction in annual welfare payment 12,680.00 12,524.00 9,918.00 13,940.00
It was estimated that there would be a total increase of $42.7 million in income per year associated
with people avoiding being out of the labour force due to their OA if they had started NSAIDs early
on for the management of their OA (Table 6). Similarly, it was estimated that there would be a
saving of about $15.6 million per year in welfare payments and an increase of $11.2 million in

38
income tax revenue because of those individuals, who would otherwise be out of the labour force
due to their OA, staying in the labour force as a result of pain reduction (Table 6).
As a result of the estimated 1,177 additional individuals aged 15-64 years in the labour force who
would have avoided being out of the labour force due to their OA by starting treatment with NSAIDs,
there would be an estimated increase in Australian GDP by approximately 164 million dollars in
2015. In our previous work we measured the impacts of chronic diseases on GDP using Treasury’s
GDP equation,96 and this equation was used here to measure the impacts of the intervention on
GDP.
Table 6. Estimated total economic benefits at national level from increased labour force associated with reduced pain as a result of managing their OA, aged 15-64 years (in thousands, in 2015 AU$)
AU$ (‘000)
Total Increase in annual incomes 42,702
Total Increase in annual income tax payment 11,164
Total Reduction in annual welfare payment 15,597
Total Increase in GDP 164,000
5.3. Conclusions
People with OA who experience less bodily pain are more likely to be in the labour force. Effective
interventions that reduce bodily pain may thus help patients to remain in the workforce longer. It
has been estimated that there would be an additional 1,177 people in the workforce associated with
reduced pain as a result of managing their OA by starting early NSAIDs treatment. The cumulative
economic benefit of this increased labour force participation would be an estimated increase of
$42.7 million in their annual income in 2015. As a result of this estimated increased labour force,
Australian GDP in 2015 would have increased by approximately 164 million dollars. The benefit of
increased labour force participation associated with pain reduction by managing OA extends beyond
individuals, and provides economic benefits to government as well.
6. Conclusions and Future Directions
The targeted search of OA studies revealed that relatively few studies include productivity as an
outcome measure. The majority of intervention studies used a single, stand-alone question such as
labour force status, hours of work, sick leave and time to return to work after surgery; whereas the
cost of illness studies tended to use more comprehensive (and usually validated/tested for suitability
with OA population) productivity questionnaires/instruments such as the WALs, WIS, WLQ, WPAI,
and EWPS. Many of these measures are reported in natural units (such as hours or paid work,

39
number of sick days, or are a scale) and thus without a conversion into dollars, no meaningful
comparisons can be made across different OA populations, interventions or competing calls on
scarce resources.
The productivity costs missing from the literature are: (1) a wider range of productivity losses for
individuals, such as lost income from lost labour force participation (or reduced paid working hours)
and the costs of informal care; (2) costs to government, such as extra welfare payments and lost
taxation revenue due to lost productivity of people with OA; and (3) societal costs, such as the dollar
value of lost GDP due to OA through its impact on employment of people with ill-health.
Although RCTs generate the highest quality of evidence, there are practical limitations to trying to
measure productivity within an RCT, such as the short time frame of trials (sometimes as short as 4-
12 weeks) which limits the potential to capture longer term productivity impacts.
The productivity measure proposed in this study – whole productive life years gained in a given year
– is based on a series of questions designed to elicit information about the labour force participation
of individuals with and without ill-health, their income, receipt of welfare payments, estimates of
current income (earnings plus welfare payments), and taxes. Consideration should be given to how
to incorporate the new measure of PLYs into intervention studies, assuming there is a desire to
maintain internal consistency and validity of the new measure by including all of the questions
proposed in the framework (Figure 2). In other words, if there is a desire to identify, measure and
value PLYs in an intervention study then all questions (branches) should be included in
questionnaires for the trial; however, if there are limitations in terms of what is feasible to collect,
then consideration should be given to how many of these questions can be included and thus how
the outcome measure will be reported, for example, only a count of the number of people in the
work force before and after having the intervention but don’t express it in monetary terms (no
income data collected).
Given the lack of productivity measures in published studies, and the short time frame of most
intervention studies, other alternatives to measuring productivity in trials (such as our modelled
approach in Stage 3) or whether other types of intervention studies with longer follow-up are
suitable need to be considered. There is therefore a need for further data to show the significant
association between the intervention and quality of life measure (e.g. SF-36), and then the quality of
life measure and productivity (e.g. labour force participation). We addressed this issue in the
modelling in Stage 3, by using HILDA data to examine the link between quality of life outcomes (SF-
36 bodily pain) and labour force participation. Our previous work demonstrated that the SF-36
bodily pain component was strongly related to having OA symptoms and, through that link,

40
differences in productivity. There is a need to collect data on other commonly used pain scales and
associations with productivity, preferably longitudinally.
The results shown in this study indicate that there is a need to further examine and integrate
productivity based measures in clinical trials and studies for health interventions. By doing so, there
will be an opportunity to better understand the broader economic impacts, and assist in accurately
understanding the link between better health outcomes and broader economic contributions that
result from pharmaceutical interventions.

41
References:
1. Tang K, et al., Sensibility of five at-work productivity measures was endorsed by patients with osteoarthritis or rheumatoid arthritis. J Clin Epidemiol 2013. 66(5): p. 546-56.
2. Drummond MF, et al., Methods for the Economic Evaluation of Health Care Programmes. Third ed. 2005, Oxford: Oxford University Press.
3. Barton S, Which clinical studies provide the best evidence? The best RCT still trumps the best observational study. BMJ Open, 2000. 321(7256): p. 255-256.
4. National Health and Medical Research Council, How to use the evidence: assessment and application of scientific evidence. 2000, NHMRC: Canberra.
5. National Health and Medical Research Council, How to compare the costs and benefits: evaluation of economic evidence. 2001, NHMRC: Canberra.
6. Department of Health and Ageing. Economic Section of the MSAC Guidelines. 2008; Available from: http://www.health.gov.au/internet/msac/publishing.nsf/Content/D81BE529B98B3DB6CA2575AD0082FD1B/$File/Economics%20Glines%20-%20FINAL%20at%20Aug%202008%20-%20endorsed%20MSAC%20ESC%20June%202009.pdf.
7. Department of Health and Ageing. Guidelines for Preparing Submissions to the Pharmaceutical Benefits Advisory Committee December. 2008 21 June 2016]; Available from: http://www.health.gov.au/internet/main/publishing.nsf/content/AECB791C29482920CA25724400188EDB/$File/PBAC4.3.2.pdf.
8. Sculpher MJ, The role and estimation of productivity costs in economic evaluation, in Economic evaluation in health care: merging theory with practice, M.F. Drummond and A. McGuire, Editors. 2001, Oxford University Press: Oxford.
9. Pritchard C and Sculpher M, Productivity costs: principles and practice in economic evaluation 2000, London: Office of Health Economics.
10. Schofield D, et al., Lost productive life years caused by chronic conditions in Australians aged 45-64 years, 2010 to 2030. Medical Journal of Australia, 2015. 203(6): p. 260.e1-6.
11. Passey ME, et al., The impact of diabetes prevention on labour force participation and income of older Australians: an economic study. BMC Public Health, 2012. 12: p. 16.
12. Commonwealth Treasury, Intergenerational report 2002–03. 2002, Commonwealth of Australia (Budget Paper No. 5): Canberra.
13. Commonwealth Treasury, Intergenerational report 2007. 2007, Commonwealth of Australia: Canberra.
14. Commonwealth Treasury, The 2010 Intergenerational Report. 2010, Australian Government: Canberra.
15. Commonwealth of Australia, Intergenerational Report. 2015, The Treasury: Canberra. 16. Commonwealth of Australia. The Report of the National Commission of Audit. 2014 27 April
2016]; Available from: http://www.ncoa.gov.au/. 17. The Treasurer, 2014-2015 Budget Night Speech. 2014, Commonwealth of Australia:
Canberra. 18. Productivity Commission, An Ageing Australia: Preparing for the Future, in Commission
Research Paper Overview. 2013: Canberra. 19. Productivity Commission, Economic Implications of an Ageing Australia, in Research Report.
Productivity Commission. Canberra. 2005, Australian Government: Canberra. 20. Schofield DJ, et al., Labour force participation and the influence of having arthritis on
financial status. Rheumatology International, 2015. 35(7): p. 1175-1181. 21. Rabenda V, et al., A naturalistic study of the determinants of health related quality of life
improvement in osteoarthritic patients treated with non-specific non-steroidal anti-inflammatory drugs. Ann Rheum Dis, 2005. 64: p. 688-693.

42
22. Carmona L, et al., The burden of musculoskeletal diseases in the general population of Spain: results from a national survey. Ann Rheum Dis, 2001. 60: p. 1040-5.
23. Gabriel ES and Michaud KE, Epidemiological studies in incidence, prevalence, mortality, and comorbidity of therheumatic diseases. Arthritis ResTher, 2009. 11: p. 229-35.
24. Haq SA and Davatchi F, Osteoarthritis of the knees in the COPCORD world. Int J Rheum Dis Clin North Am, 2011. 14: p. 122-9.
25. Haugen IK, et al., Prevalence, incidence and progression of hand osteoarthritis in the general population: the Framingham Osteoarthritis Study. Ann Rheum Dis, 2011. 70: p. 1581-6.
26. Lawrence RC, et al., Estimates of the prevalence of arthritis and other rheumatic conditions in the United States. PartII. Arthritis Rheum, 2008. 58: p. 26-35.
27. Murphy L, et al., Lifetime risk of symptomatic knee osteoarthritis. Arthritis Rheum, 2008. 59: p. 1207-13.
28. Neogi T and Zhang YE, Epidemiology of osteoarthritis. Rheum Dis Clin North Am, 2013;. 39: p. 1-19.
29. Oliveria SA, et al., Incidence of symptomatic hand, hip, and knee osteoarthritis among patients in a health maintenance organization. ArthritisRheum, 1995. 38: p. 1134-41.
30. Peña AH and Fernández-López JC, Prevalencia y factores de riesgo d ela osteoartritis. ReumatolClin, 2007. 3(Suppl. 3): p. S6-12.
31. Prieto-Alhambra D, et al., Incidence and risk factors for clinically diagnosed knee, hip and hand osteoarthritis: influences of age, gender and osteoarthritis affecting other joints. Ann Rheum Dis, 2014 Sep. 73(9): p. 1659-64.
32. The National Collaborating Centre for Chronic Conditions, Osteoarthritis. National clinical guideline for care and management in adults. 2008, Royal College ofPhysicians: London.
33. King LK, March L, and Anandacoomarasamy A, Obesity & osteoarthritis. Indian J Med Res, 2013 Aug. 138(2): p. 185-193.
34. Murray CJL and Lopez AD, Alternative projections of mortality and disability by cause 1990–2020: Global Burden of Disease Study. Lancet, 1997. 349: p. 1498-504.
35. Vos T, et al., Years lived with disability (YLDs) for 1160 sequelae of 289 diseases and injuries 1990 2010: asystematic analysis for the Global Burden of Disease Study 2010. Lancet, 2013. 380: p. 2163-96.
36. Murray CJL and Lopez AD, Measuring the Global Burden of Disease. NEnglJMed, 2013. 369: p. 448-57.
37. Wright EA, et al., Impact of knee osteoarthritis on health care resource utilization in a US population-based national sample. Med. Care, 2010. 48: p. 785-791.
38. AIHW, Arthritis and osteoporosis in Australia 2008. 2011, AIHW: Canberra 39. Larg A and Moss JR, Cost-of-illness studies. A guide to critical evaluation.
Pharmacoeconomics, 2011. 29: p. 653-71. 40. Puig-Junoy J and Zamora AR, Socio-economic costs of osteoarthritis: A systematic review of
cost-of-illness studies. Seminars in Arthritis and Rheumatism, 2015. 44: p. 531-541. 41. Bieleman HJ, et al., The effect of osteoarthritis of the hip or knee on work participation. J
Rheumatol, 2011. 38. (9): p. 1835-43. 42. Palmer KT, The older worker with osteoarthritis of the knee. Br Med Bull, 2012. 102(1): p. 79-
88. 43. Gignac MA, et al., Arthritis-Related Work Transitions: A Prospective Analysis of Reported
Productivity Losses, Work Changes, and Leaving the Labor Force. Arthritis & Rheumatism, 2008. 59(12): p. 1805-1813.
44. Hunter DJ, Schofield D, and Callander E, The individual and socioeconomic impact of osteoarthritis. Nat Rev Rheumatol, 2014. 10(7): p. 437-41.
45. Everitt B and Howell D, eds. Encyclopedia of Statistics in Behavioral Science. 2014, John Wiley and Sons Ltd: Chichester, United Kingdom.

43
46. Palmer KT, et al., Effectiveness of community- and workplace-based interventions to manage musculoskeletal-related sickness absence and job loss: a systematic review. Rheumatology, 2012. 51: p. 230-242.
47. Palmer KT and Goodson N, Ageing, musculoskeletal health and work. Best Practice & Research Clinical Rheumatology, 2015. 29: p. 391-404.
48. Waimann CA, et al., Cost-effectiveness of total knee replacement: a prospective cohort study. Arthritis Care Res (Hoboken), 2014. 66(4): p. 592-9.
49. Pinto D, et al., Manual therapy, exercise therapy, or both, in addition to usual care, for osteoarthritis of the hip or knee. 2: economic evaluation alongside a randomized controlled trial. Osteoarthritis Cartilage, 2013. 21(10): p. 1504-13.
50. Marra CA, et al., Cost-utility analysis of a multidisciplinary strategy to manage osteoarthritis of the knee: economic evaluation of a cluster randomized controlled trial study. Arthritis Care Res (Hoboken), 2014. 66(6): p. 810-6.
51. Schofield D, Cunich M, and Naccarella L, An evaluation of the quality of evidence underpinning diabetes management models: a review of the literature. Australian Health Review, 2014. 38(5): p. 495-505.
52. Ruiz D, Jr., et al., The direct and indirect costs to society of treatment for end-stage knee osteoarthritis. J Bone Joint Surg Am, 2013. 95(16): p. 1473-80.
53. Bedair H, Cha TD, and Hansen VJ, Economic benefit to society at large of total knee arthroplasty in younger patients: a Markov analysis. J Bone Joint Surg Am, 2014. 96(2): p. 119-26.
54. Mather III RC, et al., Economic evaluation of access to musculoskeletal care: the case of waiting for total knee arthroplasty. BMC Musculoskeletal Disorders, 2014. 15(22).
55. Datta Gupta N and Larsen M, The impact of health on individual retirement plans: self-reported versus diagnostic measures. Health Econ, 2010. 19(7): p. 792-813.
56. Piscitelli P, et al., Socioeconomic burden of total joint arthroplasty for symptomatic hip and knee osteoarthritis in the Italian population: a 5-year analysis based on hospitalization records. Arthritis Care Res (Hoboken), 2012. 64(9): p. 1320-7.
57. Verkleij SP, et al., Effectiveness of diclofenac versus acetaminophen in primary care patients with knee osteoarthritis: [NTR1485], DIPA-trial: design of a randomized clinical trial. BMC Musculoskelet Disord, 2010. 11: p. 7.
58. Tang K and Canadian Arthritis Network Work Productivity G, Disease-related differential item functioning in the work instability scale for rheumatoid arthritis: converging results from three methods. Arthritis Care Res (Hoboken), 2011. 63(8): p. 1159-69.
59. Lerner D, et al., The Work Limitations Questionnaire. Med Care, 2001. 39: p. 72e85. 60. Koopmanschap MA, PRODISQ: a modular questionnaire on productivity and disease for
economic evaluation studies. Expert Rev Pharmacoecon Outcomes Res, 2005. 5: p. 23-8. 61. Allen KD, et al., Clinic variation in recruitment metrics, patient characteristics and treatment
use in a randomized clinical trial of osteoarthritis management. BMC Musculoskelet Disord, 2014. 15: p. 413.
62. Svendsen SW, Frost P, and Jensen LD, Time trends in surgery for non-traumatic shoulder disorders and postoperative risk of permanent work disability: a nationwide cohort study. Scand J Rheumatol, 2012. 41(1): p. 59-65.
63. Baldwin D, et al., Randomized Prospective Study of a Work Place Ergonomic Intervention for Individuals With Rheumatoid Arthritis and Osteoarthritis. Arthritis Care & Research, 2012. 64(10): p. 1527–1535.
64. Gignac MA, Cao X, and McAlpine J, Availability, need for, and use of work accommodations and benefits: are they related to employment outcomes in people with arthritis? Arthritis Care Res (Hoboken), 2015. 67(6): p. 855-64.

44
65. Lerner D, et al., Imputing at-work productivity loss using results of a randomized controlled trial comparing tapentadol extended release and oxycodone controlled release for osteoarthritis pain. J Occup Environ Med, 2012. 54(8): p. 933-8.
66. Sankar A, et al., Return to work and workplace activity limitations following total hip or knee replacement. Osteoarthritis Cartilage, 2013. 21(10): p. 1485-93.
67. Verstappen SMM, et al., Productivity costs among patients with rheumatoid arthritis: the influence of methods and sources to value loss of productivity. Ann Rheum Dis, 2005. 64(12): p. 1754-60.
68. Rolfson O, et al., Costs related to hip disease in patients eligible for total hip arthroplasty. J Arthroplasty, 2012. 27(7): p. 1261-6.
69. Ropponen A, et al., Health-related risk factors for disability pensions due to musculoskeletal diagnoses: a 30-year Finnish twin cohort study. Scand J Public Health, 2011. 39(8): p. 839-48.
70. Saastamoinen P, et al., Pain and disability retirement: a prospective cohort study. Pain, 2012. 153(3): p. 526-31.
71. van der Burg LR, et al., Effects of cardiovascular comorbidities on work participation in rheumatic diseases: a prospective cohort study among working individuals. Arthritis Care Res (Hoboken), 2014. 66(1): p. 157-63.
72. Hubertsson J, et al., Risk of sick leave and disability pension in working-age women and men with knee osteoarthritis. Ann Rheum Dis, 2013. 72(3): p. 401-5.
73. Berger A, et al., Direct and indirect economic costs among private-sector employees with osteoarthritis. J Occup Environ Med, 2011. 53(11): p. 1228-35.
74. Conaghan PG, et al., Impact and therapy of osteoarthritis: the Arthritis Care OA Nation 2012 survey. Clin Rheumatol, 2015. 34(9): p. 1581-8.
75. Beaton DE, et al., Reliability, validity, and responsiveness of five at-work productivity measures in patients with rheumatoid arthritis or osteoarthritis. Arthritis Care Res (Hoboken), 2010. 62(1): p. 28-37.
76. Gignac MA, et al., Examination of arthritis-related work place activity limitations and intermittent disability over four-and-a-half years and its relationship to job modifications and outcomes. Arthritis Care Res (Hoboken), 2011. 63(7): p. 953e62.
77. Tang K, et al., The Work Instability Scale for rheumatoid arthritis predicts arthritis-related work transitions within 12 months. Arthritis Care Res (Hoboken), 2010. 62(11): p. 1578-87.
78. Zhang W, et al., Productivity loss due to presenteeism among patients with arthritis: estimates from 4 instruments. J Rheumatol, 2010. 37(9): p. 1805-14.
79. Gignac MA, et al., Managing arthritis and employment: making arthritis-related work changes as a means of adaptation. Arthritis Rheum, 2004. 51: p. 909e16.
80. Sayre EC, et al., The effect of disease site (knee, hip, hand, foot, lower back or neck) on employment reduction due to osteoarthritis. PLoS One, 2010. 5(5): p. e10470.
81. Catay E, et al., Cost of rheumatoid arthritis in a selected population from Argentina in the prebiologic therapy era. ClinicoEconomics and Outcomes Research, 2012. 4(1): p. 219-225.
82. de Carvalho LH, Jr., et al., Physical activity after distal femur osteotomy for the treatment of lateral compartment knee osteoarthritis. Knee Surg Sports Traumatol Arthrosc, 2014. 22(7): p. 1607-11.
83. Kotlarz H, et al., Osteoarthritis and absenteeism costs: evidence from US National Survey Data. J Occup Environ Med, 2010. 52(3): p. 263-8.
84. Hermans J, et al., Productivity costs and medical costs among working patients with knee osteoarthritis. Arthritis Care Res (Hoboken), 2012. 64(6): p. 853-61.
85. Dibonaventura MD, et al., Impact of self-rated osteoarthritis severity in an employed population: cross-sectional analysis of data from the national health and wellness survey. Health Qual Life Outcomes, 2012. 10: p. 30.
86. Pit SW, et al., Health problems and retirement due to ill-health among Australian retirees aged 45-64 years. Health Policy, 2010. 94(2): p. 175-81.

45
87. Schofield D, et al., A Microsimulation Model of the Long Term Economic Impacts of Disease on the Labour Force Participation of Australians Aged 45-64 years: What are the Costs to Individuals and Government and the Opportunities for Effective Interventions? International Journal of Microsimulation, 2014. 7(2): p. 94-118.
88. Schofield D, et al., Modelling the cost of ill health in Health&WealthMOD (Version II): lost labour force participation, income and taxation, the impact of disease prevention. The International Journal of Microsimulation, 2011. 4(3): p. 32-36.
89. Australian Bureau of Statistics, Information Paper - Basic Confidentialised Unit Record File: Survey of Disability, Ageing and Carers 2003 (reissue). 2005, Australian Bureau of Statistics: Canberra.
90. Australian Bureau of Statistics, Information Paper: Disability, Ageing and Carers, Australia: User Guide 2009. 2011, Australian Bureau of Statistics Canberra.
91. Percival R, Abello A, and Vu QN, STINMOD (Static Income Model) 2007, in Modelling Our Future: Population ageing, health and aged care, A. Gupta and A. Harding, Editors. 2007, Elsevier B.V.: Amsterdam.
92. Schofield D, et al., Economic Impacts of Illness in Older Workers: Quantifying the impact of illness on income, tax revenue and government spending. BMC Public Health, 2011. 11: p. 418.
93. Schofield D, et al., The personal and national costs of lost labour force participation due to arthritis: an economic study BMC Public Health, 2013. 13: p. 1-10.
94. Schofield D, et al., The personal and national costs of CVD: Impacts on income, taxes, government support payments and GDP due to lost labour force participation. International Journal of Cardiology, 2013. 166(1): p. 68-71.
95. Schofield D, et al., The personal and national costs of mental health conditions: impacts on income, taxes, government support payments due to lost labour force participation BMC Psychiatry, 2011. 11(72): p. 1-7.
96. Schofield D, et al., The economic impact of diabetes through lost labour force participation on individuals and government: evidence from a microsimulation model. BMC Public Health, 2014. 14(220).
97. Schofield DJ, et al., The personal and national costs of early retirement because of spinal disorders: impacts on income, taxes, and government support payments. The Spine Journal, 2012. 12: p. 1111-1118.
98. Schofield D, Shrestha R, and Cunich M, Counting the cost - Part 2 economic costs: The current and future burden of arthritis. 2016, Arthritis Australia: Sydney.
99. Ware JE, Jr. and Sherbourne CD, The MOS 36-item short-form health survey (SF-36). I. Conceptual framework and item selection. Med Care, 1992. 30(6): p. 473-83.
100. Summerfield M, et al., HILDA User Manual - Release 11. 2012, Melbourne Institue of Applied Economic and Social Research, University of Melbourne: Melbourne.
101. Zou G, A modified poisson regression approach to prospective studies with binary data. Am J Epidemiol, 2004. 159(7): p. 702-6.
102. Ackerman IN, et al., Counting the cost - Part 1 healthcare costs: The current and future burden of arthritis. 2016, Arthritis Australia: Sydney.
103. Cowie JG, et al., Return to work and sports after total hip replacement. Arch Orthop Trauma Surg, 2013. 133(5): p. 695-700.
104. Daruwalla ZJ DK-L, Shafighian A, Gillham NR,, An Alternative Treatment Option for Scaphoid Nonunion Advanced Collapse (SNAC) and Radioscaphoid Osteoarthritis: Early Results of a Prospective Study on the Pyrocarbon Adaptive Proximal Scaphoid Implant (APSI). Annals Academy of Medicine Singapore, 2013. 42: p. 278-84.
105. Faschingbauer M, et al., Return to work and sporting activities after high tibial osteotomy. Int Orthop, 2015. 39(8): p. 1527-34.
106. Foote JA, et al., Return to work following knee arthroplasty. Knee, 2010. 17(1): p. 19-22.

46
107. Hungerer S, et al., Posttraumatic arthrodesis of the subtalar joint--outcome in workers compensation and rates of non-union. Foot Ankle Surg, 2011. 17(4): p. 277-83.
108. Husby VS, et al., Early postoperative maximal strength training improves work efficiency 6-12 months after osteoarthritis-induced total hip arthroplasty in patients younger than 60 years. Am J Phys Med Rehabil, 2010. 89(4): p. 304-14.
109. Klein SM, et al., Midterm results after modified Epping procedure for trapeziometacarpal osteoarthritis. Arch Orthop Trauma Surg, 2013. 133(8): p. 1163-71.
110. Nunley RM, et al., Do patients return to work after hip arthroplasty surgery. J Arthroplasty, 2011. 26(6 Suppl): p. 92-98 e1-3.
111. Pauchard N, et al., Dorsal locking plates versus staples in four-corner fusion: a comparative clinical and radiological study. Orthop Traumatol Surg Res, 2014. 100(6): p. 593-7.
112. Schroter S, et al., Return to work and clinical outcome after open wedge HTO. Knee Surg Sports Traumatol Arthrosc, 2013. 21(1): p. 213-9.
113. van Bergen CJ, et al., Arthroscopic treatment of osteochondral defects of the talus: outcomes at eight to twenty years of follow-up. J Bone Joint Surg Am, 2013. 95(6): p. 519-25.
114. Ackerman IN, et al., Comparison of health-related quality of life, work status, and health care utilization and costs according to hip and knee joint disease severity: a national Australian study. Phys Ther, 2013. 93(7): p. 889-99.
115. Agaliotis M, et al., Risk factors associated with reduced work productivity among people with chronic knee pain. Osteoarthritis Cartilage, 2013. 21(9): p. 1160-9.
116. Bieleman HJ, et al., Functional capacity of people with early osteoarthritis: a comparison between subjects from the cohort hip and cohort knee (CHECK) and healthy ageing workers. Int Arch Occup Environ Health, 2010. 83(8): p. 913-21.
117. Bieleman HJ, et al., Work participation and health status in early osteoarthritis of the hip and/or knee: a comparison between the Cohort Hip and Cohort Knee and the Osteoarthritis Initiative. Arthritis Care Res (Hoboken), 2010. 62(5): p. 683-9.
118. Bieleman HJ, et al., Prognostic factors for sustained work participation in early osteoarthritis: a follow-up study in the Cohort Hip and Cohort Knee (CHECK). J Occup Rehabil, 2013. 23(1): p. 74-81.
119. Bushmakin AG, et al., Relationship between patient-reported disease severity and other clinical outcomes in osteoarthritis: a European perspective. J Med Econ, 2011. 14(4): p. 381-9.
120. Busija L, Buchbinder R, and Osborne RH, A grounded patient-centered approach generated the personal and societal burden of osteoarthritis model. J Clin Epidemiol, 2013. 66(9): p. 994-1005.
121. Cunha-Miranda L, et al., Assessing the magnitude of osteoarthritis disadvantage on people's lives: the MOVES study. Revista Brasileira de Reumatologia (English Edition), 2015. 55(1): p. 22-30.
122. DiBonaventura M, et al., Evaluating the health and economic impact of osteoarthritis pain in the workforce: results from the National Health and Wellness Survey. BMC Musculoskeletal Disorders, 2011. 12(83).
123. Fearon AM, et al., Greater trochanteric pain syndrome negatively affects work, physical activity and quality of life: a case control study. J Arthroplasty, 2014. 29(2): p. 383-6.
124. Gignac MA, et al., Striking a balance: work-health-personal life conflict in women and men with arthritis and its association with work outcomes. J Occup Rehabil, 2014. 24(3): p. 573-84.
125. Gignac MA, et al., Social role participation and the life course in healthy adults and individuals with osteoarthritis: are we overlooking the impact on the middle-aged? Soc Sci Med, 2013. 81: p. 87-93.

47
126. Kingsbury SR, et al., Osteoarthritis in Europe: impact on health status, work productivity and use of pharmacotherapies in five European countries. Rheumatology (Oxford), 2014. 53(5): p. 937-47.
127. Matza LS, et al., Impact of caregiver and parenting status on time trade-off and standard gamble utility scores for health state descriptions. Health Qual Life Outcomes, 2014. 12: p. 48.
128. Sadosky AB, et al., Relationship between patient-reported disease severity in osteoarthritis and self-reported pain, function and work productivity. Arthritis Res Ther, 2010. 12(4): p. R162.
129. Wilkie R, et al., Frequency and predictors of premature work loss in primary care consulters for osteoarthritis: prospective cohort study. Rheumatology (Oxford), 2014. 53(3): p. 459-64.
130. Wilkie R, et al., Anticipated significant work limitation in primary care consulters with osteoarthritis: a prospective cohort study. BMJ Open, 2014. 4(e005221).
131. Wilkie R, et al., Exploring How Pain Leads to Productivity Loss in Primary Care Consulters for Osteoarthritis: A Prospective Cohort Study. PLoS One, 2015. 10(4): p. e0120042. doi:10.1371/journal.pone.0120042.
132. Tang K, et al., Worker productivity outcome measures: OMERACT filter evidence and agenda for future research. J Rheumatol, 2014. 41(1): p. 165-76.
133. Reilly MC, Zbrozek AS, and Dukes E, The validity and reproducibility of a work productivity and activity impairment measure. PharmacoEconomics, 1993. 4(5): p. 353-365.
134. Gilworth G, et al., Development of a work instability scale for rheumatoid arthritis. Arthritis Rheum, 2003. 49: p. 349e54.
135. Gignac MA, Arthritis and employment: an examination of behavioral coping efforts to manage workplace activity limitations. Arthritis Rheum, 2005. 53: p. 328e36.
136. Gignac MA, Sutton D, and Badley EM, Arthritis symptoms, the work environment, and the future: Measuring perceived job strain among employed persons with arthritis. Arthritis Rheum Dis Clin North Am, Jun 15 2007. 57(5): p. 738-47.
137. Amick Br, et al., A review of health-related work outcome measures and their uses, and recommended measures. Spine (Phila Pa 1976), 2000. 25(24): p. 3152e60.
138. Lerner D, et al., The Work Limitations Questionnaire’s validity and reliability among patients with osteoarthritis. J Clin Epidemiol 2002. 55(197): p. e208.
139. Walker N, Michaud K, and Wolfe F, Work limitations among working persons with rheumatoid arthritis: results, reliability, and validity of the work limitations questionnaire in 836 patients. J Rheumatol, 2005. 32:: p. 1006e12.
140. Lerner D, Rogers WH, and Chang H, Scoring the work limitations questionnaire (WLQ) and the WLQ index for estimating work productivity loss. Technical Report.
141. Brouwer WB, Koopmanschap MA, and Rutten FF, Productivity losses without absence: measurement validation and empirical evidence. Health Policy, 1999. 48: p. 13-27.
142. Pinto D, et al., Good agreement between questionnaire and administrative databases for health care use and costs in patients with osteoarthritis. BMC Medical Research Methodology, 2011. 11(1): p. 45.
143. Koopman C, et al., Stanford presenteeism scale: health status and employee productivity. J Occup Environ Med, 2002. 44(1): p. 14e20.
144. Lynch W and Riedel J, Measuring employee productivity: a guide to self-assessment tools. 2001, Institute for Health & Productivity Management & William Mercer: Scottsdale, AZ.
145. Endicott J and Nee J, Endicott Work Productivity Scale (EWPS): a new measure to assess treatment effects. Psychopharmacol Bull, 1997. 33(1): p. 13e6.
146. Lahelma E, et al., Cohort Profile: The Helsinki Health Study. Int. J. Epidemiol., 2013. 42(3): p. 722-730.
147. van Roijen L, et al., Labor and health status in economic evaluation of health care. The Health and Labor Questionnaire. Int J Technol Assess Health Care, 1996. 12: p. 405-15.

48
148. van Roijen L and Essink-Bot ML, The Health and Labour Questionnaire (Manual). 2000, Rotterdam: Institute for Medical Technology Assessment.
149. Kessler RC, et al., The World Health Organization Health and Work Performance Questionnaire (HPQ). J Occup Environ Med, 2003. 45(156-74).
150. Kessler RC, et al., Using the World Health Organization Health and Work Performance Questionnaire (HPQ) to evaluate the indirect workplace costs of illness. J Occup Environ Med, 2004. 6 Suppl: p. S23-37.
151. HPQ Short Form (Absenteeism and Presenteeism Questions and Scoring Rules). 2005, Boston Harvard School of Medicine.

49
Appendix 1: Inclusion and exclusion criteria of the published studies
The inclusion criteria consisted of:
1. Study participants: men and/or women aged 18 years or older who were living in the
community.
2. Study outcome measure: productivity of people with OA or changes in productivity due to
interventions to manage OA (expressed in natural or monetary units, can be a primary or
secondary outcome, can be expressed as a cost or benefit); see the search in section 3.3. for
specific productivity measures.
3. Study design: studies of the costs of OA; studies on the direct and indirect costs of OA;
productivity costs of OA from any perspective, including that of the patient, the health
system or government, third party payers (such as health insurance companies), or society;
the disease was explicitly stated as OA in the methods (but could have been self-reported
doctor diagnosed or clinically confirmed OA); studies using a prevalence-based approach
(cost of illness); OA intervention studies (including RCTs, retrospective cohort studies,
prospective cohort studies); studies conducted in developed countries (defined, for the
purpose of this review, as countries in the Organisation for Economic Co-operation and
Development, OECD); any intervention (i.e. pharmaceutical, medical – surgery, diet and
lifestyle) in a study that included productivity as an outcome could be considered.
4. Years considered: studies published between 1 January 2010 to 11 June 2015.
5. Language: published in English.
6. Publication type: original research only.
The exclusion criteria consisted of:
1. Study participants: study population was children only, or a group with special conditions
not representative of the general population; or the studied subjects were non-human (e.g.
mouse) and/or non-living such as cadavers, and human specimens (e.g. genes).
2. Study design: costs of OA did not include, or have a specific breakdown for, productivity
losses; or did not explicitly state that the productivity costs were attributable to OA (e.g.
“musculoskeletal conditions” instead of “osteoarthritis”) i.e. not an outcome measure.
3. Years considered: studies published before 1 January 2010.
4. Publication types: duplicate articles or non-original studies (such as comments, editorials or
letters, and review articles); conference proceedings and other reports where a detailed
study could not be retrieved were excluded.

50
Appendix 2: Search strategy and list of keywords
The search was run by one reviewer (SW). The search strategy combined one search for OA studies
with a second on studies of productivity. In the selected databases the following keywords, search
strategy and limits were included:
Keywords:
1. osteoarthritis
2. labour
3. retire
4. financial
5. societal
6. time off work
7. work
8. carer
9. caregiver
10. presenteeism
11. absenteeism
12. sick leave
13. employment
14. job
15. workers compensation
16. child care
17. income
18. pension
19. productivity
We combined the keywords in our search as follows:
a) All the productivity keywords (2 or 3 or 4 or 5 or 6 or 7 or 8 or 9 or 10 or 11 or 12 or 13 or 14
or 15 or 16 or 17 or 18 or 19)
b) 1 and (a)
c) Limit to (English language and humans and year=“2010-Current”)
All search results were assigned into a Microsoft Excel spreadsheet under key headings (such as
author (year), type of study, study population, productivity measure(s), results), and the full-texts
undergoing further checks for inclusion were compiled.
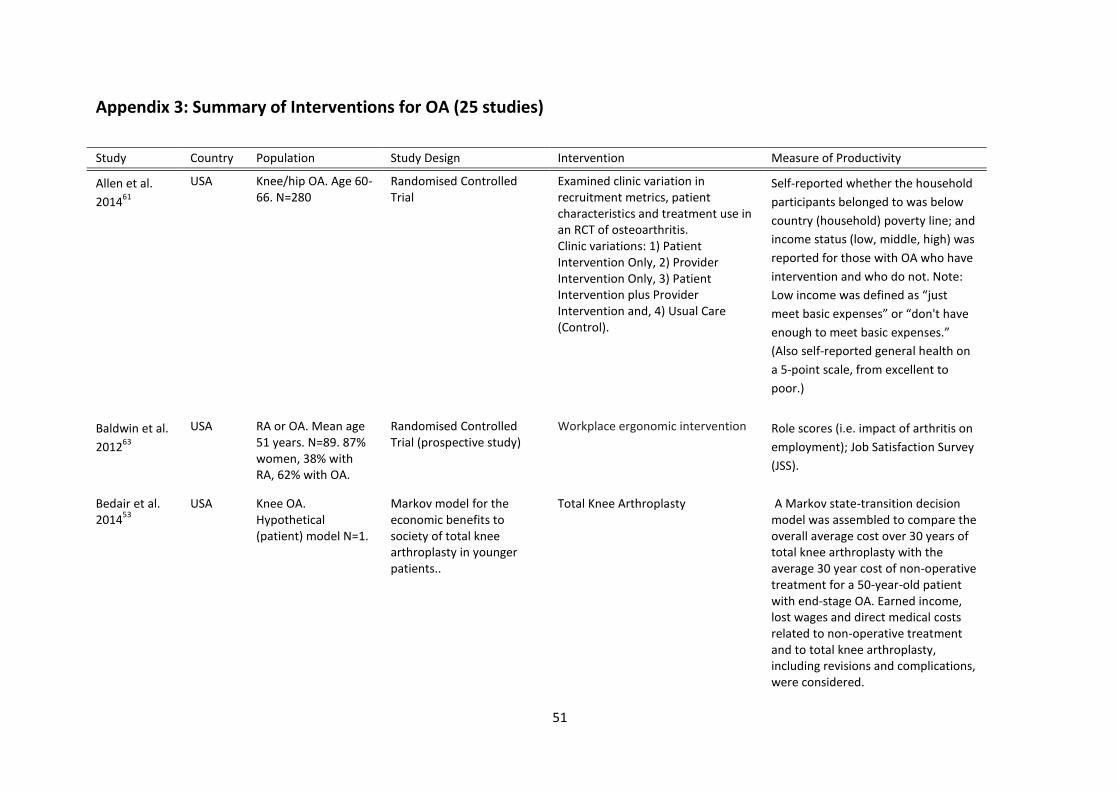
51
Appendix 3: Summary of Interventions for OA (25 studies)
Study Country Population Study Design Intervention Measure of Productivity
Allen et al.
201461
USA Knee/hip OA. Age 60-66. N=280
Randomised Controlled Trial
Examined clinic variation in recruitment metrics, patient characteristics and treatment use in an RCT of osteoarthritis. Clinic variations: 1) Patient Intervention Only, 2) Provider Intervention Only, 3) Patient Intervention plus Provider Intervention and, 4) Usual Care (Control).
Self-reported whether the household
participants belonged to was below
country (household) poverty line; and
income status (low, middle, high) was
reported for those with OA who have
intervention and who do not. Note:
Low income was defined as “just
meet basic expenses” or “don't have
enough to meet basic expenses.”
(Also self-reported general health on
a 5-point scale, from excellent to
poor.)
Baldwin et al.
201263
USA RA or OA. Mean age 51 years. N=89. 87% women, 38% with RA, 62% with OA.
Randomised Controlled Trial (prospective study)
Workplace ergonomic intervention Role scores (i.e. impact of arthritis on
employment); Job Satisfaction Survey
(JSS).
Bedair et al. 2014
53
USA Knee OA. Hypothetical (patient) model N=1.
Markov model for the economic benefits to society of total knee arthroplasty in younger patients..
Total Knee Arthroplasty A Markov state-transition decision model was assembled to compare the overall average cost over 30 years of total knee arthroplasty with the average 30 year cost of non-operative treatment for a 50-year-old patient with end-stage OA. Earned income, lost wages and direct medical costs related to non-operative treatment and to total knee arthroplasty, including revisions and complications, were considered.
52
Study Country Population Study Design Intervention Measure of Productivity
Indirect costs (productivity losses): lost income due to work disability, absenteeism, decreased work hours, job change, and unemployment which were estimated by an equivalent total number of days not worked in one year multiplied by the daily wage.
Cowie et al. 2013
103
UK OA. Age <65. N=238 (OA).
Retrospective study total hip replacement Time to return to work post-surgery.
Daruwalla et al. 2013
104
UK Wrist OA. Age 26-71. N=10
Prospective study (no control group, small sample)
Pyrocarbon Adaptive Proximal Scaphoid Implant (APSI) – an alternative treatment option for scaphoid nonunion advanced collapse (SNAC) and radioscaphoid OA.
Time to return to work post-surgery.
de Carvalho et al. 2014
82
Brazil Knee OA. Age 21-65. N=26
Retrospective study (small sample size, relatively short average follow-up period – 48 months)
Distal femur osteotomy for the treatment of lateral compartment knee OA.
Interviews based on a questionnaire
relating to the level of satisfaction
with the surgery; functional and
physical activities were scored
according to published ratings.
Productivity measure: Resumption of
normal work duties after surgery at
the individual’s preoperative
functional level without limitation or
decline in performance.
Faschingbauer et al. 2015
105
Germany Knee OA. Age >30. N=51 (OA=37).
Retrospective study (relatively short follow-up period)
High tibial osteotomy Time to return to work post-surgery.
Foote et al. UK Knee OA. Age <60. Retrospective study Knee arthroplasty Time and details on return to work
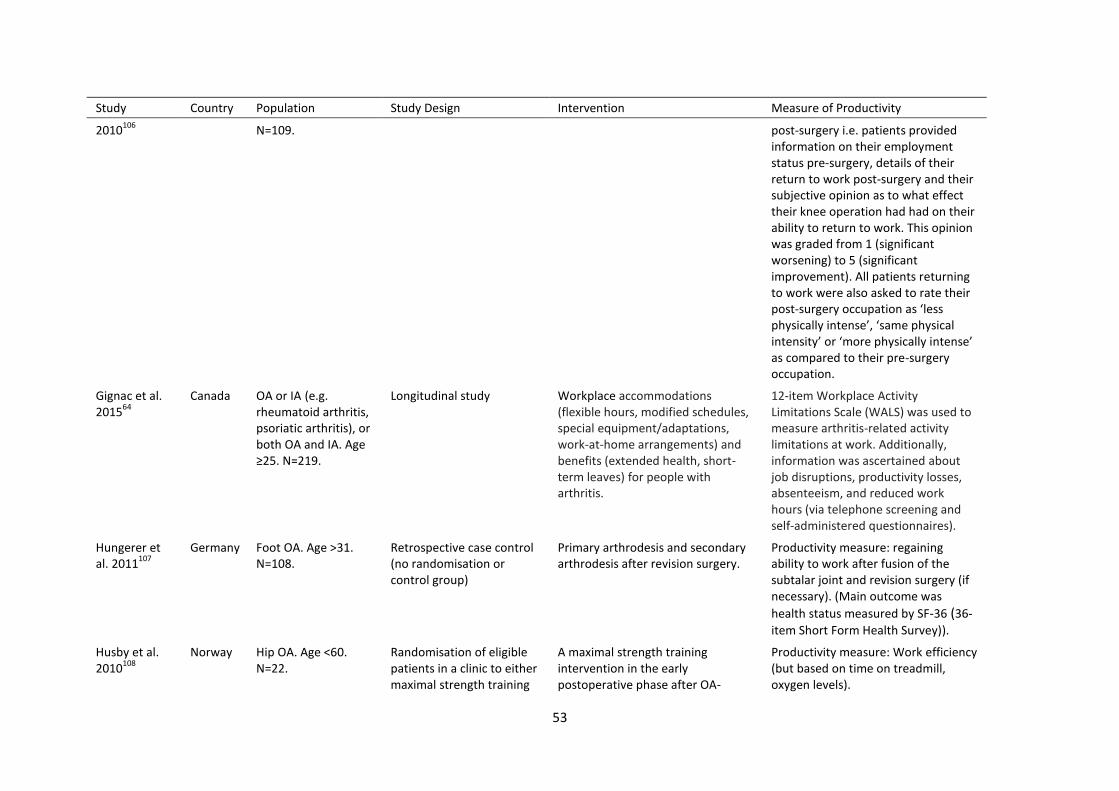
53
Study Country Population Study Design Intervention Measure of Productivity
2010106
N=109. post-surgery i.e. patients provided information on their employment status pre-surgery, details of their return to work post-surgery and their subjective opinion as to what effect their knee operation had had on their ability to return to work. This opinion was graded from 1 (significant worsening) to 5 (significant improvement). All patients returning to work were also asked to rate their post-surgery occupation as ‘less physically intense’, ‘same physical intensity’ or ‘more physically intense’ as compared to their pre-surgery occupation.
Gignac et al. 2015
64
Canada OA or IA (e.g. rheumatoid arthritis, psoriatic arthritis), or both OA and IA. Age ≥25. N=219.
Longitudinal study Workplace accommodations (flexible hours, modified schedules, special equipment/adaptations, work-at-home arrangements) and benefits (extended health, short-term leaves) for people with arthritis.
12-item Workplace Activity Limitations Scale (WALS) was used to measure arthritis-related activity limitations at work. Additionally, information was ascertained about job disruptions, productivity losses, absenteeism, and reduced work hours (via telephone screening and self-administered questionnaires).
Hungerer et al. 2011
107
Germany Foot OA. Age >31. N=108.
Retrospective case control (no randomisation or control group)
Primary arthrodesis and secondary arthrodesis after revision surgery.
Productivity measure: regaining ability to work after fusion of the subtalar joint and revision surgery (if necessary). (Main outcome was
health status measured by SF-36 (36-
item Short Form Health Survey)).
Husby et al. 2010
108
Norway Hip OA. Age <60. N=22.
Randomisation of eligible patients in a clinic to either maximal strength training
A maximal strength training intervention in the early postoperative phase after OA-
Productivity measure: Work efficiency (but based on time on treadmill, oxygen levels).

54
Study Country Population Study Design Intervention Measure of Productivity
plus convention rehabilitation program (CRP) or CRP only (small sample size).
induced total hip arthroplasty. SF-36 used to determine health-related quality of life after each test.
Klein et al. 2013
109
Germany Trapeziometacarpal joint (TMJ) OA. Age 38-78. N=59.
Cross-sectional, single-centre study design
Modified Epping procedure for trapeziometacarpal OA.
Time and details on return to work post-surgery e.g. whether have full or partial (manual) work performance.
Lerner et al. 2012
65
Australia (4 sites), Canada (15 sites), New Zealand (6 sites), USA (87 sites)
Knee OA. Age 40-65. N=758.
Randomised Controlled
Trial (randomised,
double-blind, active- and placebo-controlled, parallelarm, multicentre, phase III trial).
Tapentadol extended release versus oxycodone controlled release for OApain.
Work Limitations Questionnaire (WLQ) – a self-report questionnaire that measures the frequency with which health problems prevent the performance of job tasks and reduces productivity at work. The WLQ provided the Productivity Loss Score for this study. Also imputed the change or difference in WLQ Productivity Loss Scores based on health variables representing the RCT’s endpoints (such as pain intensity). Valuation (dollars): Expressed the improvement in productivity loss from baseline to week 12 of the maintenance period as a productivity cost-savings, by multiplying the imputed change in at-work productivity within each group by an assumed annual income of $100,000 per person.
Marra et al. 2014
50
Canada Knee OA. N=73. Economic evaluation of a cluster Randomised Controlled Trial
Pharmacist-initiated multidisciplinary strategy to manage knee OA.
Questions on work (work time, absences, and unpaid work) and other societal costs (expenses from knee pain or OA, household help, and informal care) were asked at 3 and 6 months

55
after randomisation. Productivity losses were captured using the human capital approach, where average age- and sex-adjusted earnings were utilised to determine the daily loss of income when reported by participants.
Mather et al. 2014
54
England Knee OA. Hypothetical, N=1. Age 60.
Economic evaluation of access to musculoskeletal care: the case of waiting for total knee arthroplasty. Model
Total knee arthroplasty Markov health state-transition decision model was developed for the treatment of end-stage knee OA. Indirect costs included lost earnings and productivity, caregiver costs (expressed in dollars).Patients were assumed to recover 80% of the indirect costs of end-stage knee OA after successful primary total knee arthroplasty. The model incorporated indirect costs into the model, and ICERs were produced with this information included.
Nunley et al. 2011
110
USA Knee OA. Age 18-60. N=661.
Retrospective, multicentre study
Total knee arthroplasty Time and details on return to work post-surgery (e.g. whether returned successfully to usual job either with or without restrictions, main reason for not returning to work). Developed a questionnaire with a unique skip logic preprogrammed algorithm to compare pre- and post-surgery outcomes related to employment.
Pauchard et al. 2014
111
France Wrist OA. Age=mean 50. N=30
Retrospective (no control group, small sample size)
Dorsal locking plates versus staples in four-corner fusion.
Time and details on return to work post-surgery e.g. assessment of conditions of return to work, time off work (initial sick leave plus any further leave for surgical revision.

56
Pinto et al. 2013
49
New Zealand
Hip, Knee or both OA. Adult population, N=209.
Randomised Controlled Trial with Economic Evaluation.
Manual therapy, exercise therapy, or both, in addition to usual care for hip or knee OA.
Questions about loss of hours (productivity measure) and information about costs borne by participants’ friends or family (out-of-pocket costs, transportation costs, lost earnings, and informal care). Instrument used: Osteoarthritis Costs and Consequences Questionnaire (OCCQ) – freely accessible online.
Ruiz et al. 2013
52
USA Knee OA. Hypothetical N=1.
Markov model with three primary components: (1) quality of life; (2) direct medical costs for the total knee arthroplasty, complications of surgery, and revision arthroplasty; and (3) indirect costs involving employment status, earnings, time missed from work (or absenteeism), and disability payments.
Total knee arthroplasty compared with nonsurgical treatment for knee OA.
Markov model results: Employment
status, earnings, time missed from work (or absenteeism), and disability payments.
Sankar et al. 2013
66
Canada OA. Age 18-85. N=310. Sub-sample of a prospective longitudinal cohort
Total hip or knee replacement. Primary outcome was return to work based on the patient’s response to the question: ‘which of the following [responses] best describes your current employment status’ on the first report of a return to work. Secondary outcomes from the Workplace Activity Limitations Scale (WALS).
Schroter et al. 2013
112
Germany Knee OA. Age=mean 47. N=32.
Retrospective study (variations in length of
Open wedge High Tibial Osteotomy.
Time and details on return to work post-surgery i.e. duration of incapacity to
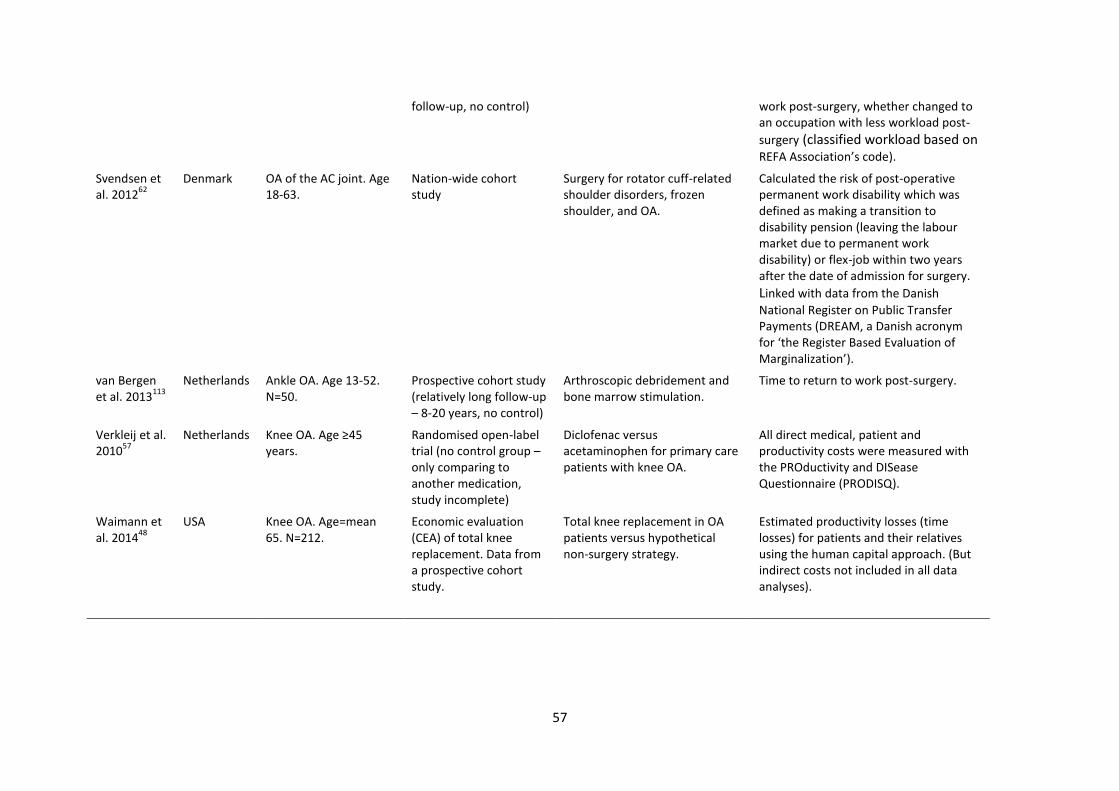
57
follow-up, no control) work post-surgery, whether changed to an occupation with less workload post-
surgery (classified workload based on REFA Association’s code).
Svendsen et al. 2012
62
Denmark OA of the AC joint. Age 18-63.
Nation-wide cohort study
Surgery for rotator cuff-related shoulder disorders, frozen shoulder, and OA.
Calculated the risk of post-operative permanent work disability which was defined as making a transition to disability pension (leaving the labour market due to permanent work disability) or flex-job within two years after the date of admission for surgery. Linked with data from the Danish
National Register on Public Transfer Payments (DREAM, a Danish acronym for ‘the Register Based Evaluation of Marginalization’).
van Bergen et al. 2013
113
Netherlands Ankle OA. Age 13-52. N=50.
Prospective cohort study (relatively long follow-up – 8-20 years, no control)
Arthroscopic debridement and bone marrow stimulation.
Time to return to work post-surgery.
Verkleij et al. 2010
57
Netherlands Knee OA. Age ≥45 years.
Randomised open-label trial (no control group – only comparing to another medication, study incomplete)
Diclofenac versus acetaminophen for primary care patients with knee OA.
All direct medical, patient and productivity costs were measured with the PROductivity and DISease Questionnaire (PRODISQ).
Waimann et al. 2014
48
USA Knee OA. Age=mean 65. N=212.
Economic evaluation (CEA) of total knee replacement. Data from a prospective cohort study.
Total knee replacement in OA patients versus hypothetical non-surgery strategy.
Estimated productivity losses (time losses) for patients and their relatives using the human capital approach. (But indirect costs not included in all data analyses).

58
Appendix 4: Summary of cost of illness studies (37 studies; 1 policy document as last entry)
Study Country Population Study Design Objective Measure of Productivity
Ackerman et al. 2013
114
Australia hip/knee joint
disease (arthritis or
OA) Age 56-74.
N=237 (N=1157?)
Cross sectional (nation-wide) Examined health-related quality of life (HRQoL), work status, and healthcare utilisation (and costs) according to severity of hip and knee joint disease (OA) (measured using WOMAC) and compared to asymptomatic group.
Self-reported employment
information covering paid and unpaid work status, premature exit from the workforce because of hip or knee arthritis or OA, and changes to work because of hip or knee arthritis or OA. (Also used the Assessment of Quality of Life (AQoL) instrument which is the Australian generic measure of HRQoL; and self-reported demographic and health service information).
Agaliotis et al. 2013
115
Australia Knee OA. Age 45-75. N=289
A cohort nested within a randomised controlled trial. Longitudinal data because of the 12 month follow-up. Great accuracy in evaluation (used a day-by-day evaluation of lost work productivity specifically related to knee problems for 7 days every 2 months over a 12-month follow-up period) and thus likely to have produced more reliable estimates of presenteeism.
To determine risk factors associated with reduced work productivity among people with chronic knee pain.
Absenteeism (number of days off work due to knee problems) and presenteeism (% of reduced work productivity while at work due to knee problems) (productivity questions) were derived from the Work Productivity and Activity Impairment Questionnaire (WPAI) via face-to-face assessments. Also assessed changes to work e.g. changing occupations, working hours, retired, lost job.
Beaton et al. 2010
75
Canada RA or OA. Age 19-65. N=250 in total; 0A=130, RA=-120. No breakdown of
Longitudinal design (12-
months?)
Evaluated the relative strengths and weaknesses of 5 measures for quantifying health-related at-work productivity losses in patients with RA or
Workplace Activity Limitations Scale
(WALS), 6-item Stanford
Presenteeism Scale (SPS-6), Endicott
Work Productivity Scale (EWPS), RA

59
Study Country Population Study Design Objective Measure of Productivity
results for productivity losses for OA only.
OA; and determined the best instrument for this population (based on reliability, validity, and responsiveness).
Work Instability Scale (WIS), and
Work Limitations Questionnaire
(WLQ).
Berger et al. 2011
73
USA OA. Age 18 or older. N=2399 (OA)
Cross sectional study. Private
sector employees in the Health
and Productivity Management
(HPM) Database with evidence
of OA (based on hospital visits)
in 2007)
To estimate direct and indirect economic costs among private sector employees with OA.
Absenteeism; short-term disability;
worker's compensation were the
indirect costs (measured and valued
in dollars; compared to those
without OA). All information was on
the Medstat MarketScan Health and
Productivity Management (HPM)
Database i.e. administrative data.
Bieleman et al. 2010 (a)
116
Netherlands Hip/knee OA. Age 45-61. N=275
Cohort study i.e. cohort hip and cohort knee (CHECK) versus healthy ageing workers (cross sectional)
(1) To compare self-reported health status and functional capacity of subjects with early OA of hip and/or knee to reference data of healthy working subjects, and (2) to assess whether this capacity is sufficient to meet physical job demands.
Short-Form 36 Health Survey used to assess health status. Six tests of the WorkWell Systems Functional Capacity Evaluation used to assess productivity = lifting low/overhead, carrying, bending, repeated side reaching.
Bieleman et al. 2010 (b)
117
Netherlands Hip/knee OA. Age 45-61. N=970
Cross sectional study design, using data from the Cohort Hip
and Cohort Knee (CHECK) study
To examine the work participation of Dutch people with early OA in hips or knees and compare this with data from the American Osteoarthritis Initiative (OAI) cohort.
Economic Aspects in Rheumatoid Arthritis questionnaire (validated) used to assess various aspects of work participation (present or last job, work hours, working history, present working status, and sick leave). Participants in paid employment were asked about their present condition and whether they had adapted or would like to adapt their work via tasks, hours, and work place. Subjects without paid work

60
Study Country Population Study Design Objective Measure of Productivity
were asked for reasons for not having a job.
Bieleman et al. 2013
118
Netherlands Early OA of hips or knee. Age=45-65. N=925
Prospective cohort study – 2 years of follow-up in the Cohort Hip and Cohort Knee (CHECK).
To identify prognostic factors for the 2-year course of work participation in early OA of hips or knees.
Used the Economic Aspects in Rheumatoid Arthritis questionnaire (validated) to assess several aspects of work participation: present or last job, work hours, working history, present working status, and sick leave, and physical work demands. Labour force participation was defined as having a paid job for 8 hours or more per week. Participants with paid employment were asked if they had been on sick leave, and if so, if this was because of hip/knee complaints or other health reasons. Another question was whether they had adapted or would like to adapt their work (hours, tasks, workplace). Subjects without paid work were asked for reasons for not having a job. (SR health was measured using SF36).
Bushmakin et al. 2011
119
France,
Germany,
Italy, Spain
and UK
OA. Age >50. N=1739.
Cross sectional, observational study
To determine how patient-rated osteoarthritis (OA) severity correlated with other patient-reported and clinical outcomes in the European clinical setting.
Work Productivity and Activity Impairment (WPAI). The first question is on employment status, and the remaining five, referenced to the past 7 days, pertain to hours worked; hours missed from work because of OA; impact of OA on productivity (rating scale from 0% no effect to 10% completely

61
prevented from working); and degree OA affected regular activities (rating scale 0% no effect to 10% completely prevented daily activities). Responses to the questions were used to calculate absenteeism (i.e. the percentage of work time missed due to OA), presenteeism (i.e. the percentage of impairment on the job due to OA), percentage of overall work impairment due to OA; and percentage of activity impairment due to OA. These percentages were then used to estimate the annual costs of lost productivity in US dollars based on average annual wages estimated by the World Bank for 2008.
Busija et al. 2013120
Australia Hip/knee, hand, generalised OA. Age 51-80. N=26.
Integrated theoretical model (based on qualitative and quantitative data)
To develop a conceptual model to describe the burden of OA in individuals with this condition and on the broader community.
From the seeding statement where participants were asked to form statements about how OA affects their life (and people around them), two relevant impacts were identified: financial and productivity impacts.
Conaghan et al. 2015
74
UK OA. Age 19-91. N=2001
Cross sectional study, using the Arthritis Care OA Nation 2012 survey.
To understand the impact of OA on individuals and to explore current treatment strategies.
Designed survey. Various productivity measures for respondents: early retirement due to OA (and how early in years); and for those under 65 years, whether they had given up work due/changed their type of work/reduced their hours due to

62
OA. The impacts of OA on their partners were also measured: whether partners had either stopped working or reduced their hours to care for them. Relevant valuations: loss of earnings, increased personal costs (included travel costs, adjustments to home), whether received welfare payments/assistance (state benefits, a disability parking blue badge, claimed disability living allowance).
Cunha-Miranda et al. 2015
121
Portugal OA. Age 45-87. N=103
Observational, cross-sectional (the MOVES study)
To estimate the prevalence of self-reported OA and quality of life in Portuguese adults aged 45 years or older.
Questions on working abilities and sick leave in the last year: Changed the type of work due to OA, changed the way of working due to OA, reduced number of working hours due to OA, did not work some days due to OA (absenteeism), stopped working completely due to OA, other.
DiBonaventura et al. 2011
122
USA OA (specific site of OA pain unknown). Age ≥20. N=2173
Cohort study, using the National Health and Wellness Survey (large sample size and population level analysis based on a weighted assessment to reflect the demographic composition of the US population)
To evaluate the impact of OA pain on healthcare resource utilisation, productivity and costs in employed individuals.
Work Productivity and Activity Impairment (WPAI) questionnaire; also classified employed individuals with OA and experiencing pain in the last month as full-time, part-time or self-employed (and compared to those without OA and no pain).
DiBonaventura et al. 2012
85
USA OA (severity provided but not joint affected) vs non OA. Age ≥20. N=39772
Cross sectional analysis, using National Health and Wellness Survey 2009.
To evaluate the impact of self-rated OA severity on quality of life, healthcare resource utilisation, productivity and costs in an employed population with OA relative to
WPAI i.e. absenteeism, presenteeism, overall work impairment, activity impairment (time lost measures). (Also assessed health-related quality of

63
employed individuals without OA. life using the SF-12v2 Health Survey).
Fearon et al. 2014123
Australia Hip OA. Age=mean 62 years. N=20
Observational case control study
To evaluate work participation, health related quality of life, pain and function, and activity participation, in people with a broad spectrum of Greater Trochanteric Pain Syndrome (GTPS) severity.
Asked participants about work participation; full-time (≥35 hours per week), part-time or not in paid employment.
Gignac et al. 201176
Canada OA (57%) or IA. Longitudinal (18 months; working population only)
To examine the type, degree, and episodic nature of arthritis-related work place activity limitations and the consistency of the relationship of activity limitations to job modifications and work place outcomes.
WALS was used to assess arthritis-related disability with job tasks (e.g. getting to, from, and around the workplace; sitting/standing for long periods; concentration at work; job scheduling). (Job modifications/accommodations (e.g. scheduling changes), work place outcomes (e.g. absenteeism), demographics, illness (comorbidities), and work context were also measured.)
Gignac et al. 2014124
Canada OA or IA. Age>40 years.
Cross-sectional study (convenience sample of employed individuals)
To examine men and women’s perceptions of inter-role balance/imbalance in work, arthritis, and personal roles and its association with demographic, health and employment factors, including job stress, career satisfaction, job disruptions, absenteeism and perceived productivity losses.
Main measure was the WALS. (Also measured the number of hours worked in an average week, whether the job required people to work variable or unpredictable hours (i.e. shifts), occupation, work context (i.e. job control over a variety of work tasks, the pace of work, scheduling and the work environment), whether flexible hours were available, whether employer has made changes or modifications to the job to help them manage their arthritis, work outcomes (e.g. job stress, career

64
satisfaction, arthritis-related job disruptions in last 6 months (e.g. lost work time because of arriving late/leaving early; unable to attend meetings, responsibilities, pursue a job promotion or work the shift/schedule desired; work interruptions of 20 min or more). Also measured absent days due to arthritis in last 6 months, and self-rated the extent to which their arthritis or its treatment resulted in being less productive at work in last 6 months.)
Datta and Larsen 2010
55
Denmark Various conditions, including self-reported OA i.e. ‘doctor told you that you have – or within the last year have had OA’). N=approximately 3,000 person-wave observations.
Longitudinal study (older workers drawn from a Danish panel survey from 1997 and 2002, merged to longitudinal register data)
To investigate whether, even for narrowly defined health measures, a divergence exists in the impacts of health on retirement between self-reported health and objective physician-reported health.
Productivity measure = retirement. Respondents were asked ‘Are you on the labour market now or have you stopped working?’ They answered either ‘On the labour market now’, ‘Have stopped temporarily’ or ‘Have stopped permanently’. Individuals were considered to be ‘retired’ if they nomination the latter. That is, retirement was defined as withdrawal from the labour market.
Gignac et al. 2013125
Canada knee, hip, and/or groin pain or other joints affected by OA. Age >40. N=177 (OA)
Cross-sectional study Examined role salience (i.e. importance), role limitations, and role satisfaction among middle- and older-aged adults with and without OA and its relationship to depression, stress, role conflict, healthcare utilisation, and coping behaviours.
Role salience, role limitations – asked participants how difficult it was, given their present health status, to participate in each of the role domains, role satisfaction (as in Social Role Participation Questionnaire or SRPQ). (Also measured if employed or not;

65
involved in continuing education.)
Hermans et al. 2012
84
Netherlands Knee OA. Age=18-65 years. N=117.
Randomised controlled trial (all subjects in employment; BMI measurement taken too)
To identify and quantify knee-related productivity and medical costs in knee OA patients in paid employment.
PRODISQ was used for the
measurement of productivity costs
due to knee symptoms
(absenteeism, presenteeism).
(Participants were also asked to
rate the quality and quantity of
the work performed on their last
work day compared to a regular
work day on a 10-pointscale; to
indicate the amount of work in the
household taken over by others
(i.e. assessing compensation
mechanisms for productivity loss
in the household. All resources
(including productivity) were
valuated according to the Dutch
guideline on prices and tariffs.)
Productivity losses (hours) were
valued in EUROs (median cost per
patient per month; total cost).
Hubertsson et al. 2013
72
Sweden Knee OA. Age >46. N=15345.
Population-based cohort study To investigate the risk of sick leave and disability pension in working-age subjects with knee OA compared to the general population.
Main productivity measure = receipt of sickness benefits exceeding 14 days and all disability pension payments (using large individual-level linked data such as the Swedish Social Insurance Agency or SSIA 2009).
Kingsbury et al. 2014
126
France,
Germany,
Italy, Spain
OA. Age >18. N=3750.
Cross-sectional study To examine the impact of peripheral joint OA across five large European countries and how people with OA use
WPAI (absenteeism, presenteeism)

66
and the UK pharmacotherapies.
Matza et al. 2014127
UK Hip OA. Age>18. N=80.
Secondary analysis of data (possibly economic evaluation)
To examine the effect of caregiver status on time trade-off (TTO) and standard gamble (SG) health state utility scores.
Productivity measure = caregiving. Measuring the impact of OA on utilities of caregivers via interviews.
Kotlarz et al. 201083
USA OA. Age 18-64. National survey (cross-sectional)
To quantify the effects of OA on the cost of absenteeism from work.
Medical Expenditure Panel Survey (MEPS). Absenteeism costs were valued in US dollars (and reported for men and women).
Pit et al. 201086
Australia OA. Age 45-64. N=3160.
Cross-sectional study To examine which health problems are associated with early retirement due to ill health among Australians aged 45–64 years.
Participants who reported being
retired were asked why they had
retired, and were allowed multiple
responses including: ‘reached
usual retirement age’, ‘to care for
family member/friend’, ‘made
redundant’, ‘lifestyle reasons’, ‘ill-
health’ (and specific condition e.g.
OA), ‘could not find a job’, or
‘other’.
Rolfson et al. 201268
Sweden Hip OA. Age 26-95. N=2635.
Cohort study To estimate direct and indirect costs incurred by patients with hip disease and eligible for total hip arthroplasty.
Patients listed for THA answered a questionnaire concerning the use of resources and loss of productivity because of their hip disease (asked whether the patient was currently in work, retired, unemployed, on sick leave, or on disability pension). (Informal carer costs and costs for productivity loss because of sick leave and disability pension were measured and valued in SEK

67
2009).
Roppone et al. 2011
69
Finland N=24043. Cohort study (30-year Finnish twin cohort study)
To investigate the incidence of and risk factors for disability pensions due to any musculoskeletal diagnoses and specifically due to OA.
Receipt of disability pension (main outcome of the study) due to OA.
Saastamoinen et al. 2012
70
Finland OA. N=6258. A prospective cohort study To examine the association of pain with subsequent disability retirement due to all causes as well as musculoskeletal diseases, mental disorders, and a heterogeneous group of other diseases.
Linked Helsinki Health Study baseline questionnaire and national pension register data used to ascertain disability retirement due to pain caused by OA.
Sadosky et al. 2010
128
USA OA (mainly knee and hip). Age>50. N=714.
Cross sectional observational study
To determine how patient-reported OA severity correlates with patient-reported outcomes including pain, function and work productivity.
WPAI. Valuation provided = cost of work impairment for employed persons (cost per patient per year resulting from lost productivity).
Piscitelli et al. 2012
56
Italy Hip & Knee OA. Age >25.
Longitudinal study (5 years of national hospitalisation records)
To assess the socioeconomic burden of total joint arthroplasties (TJAs) performed for symptomatic hip and knee OA in the Italian population.
For patients aged <65 years, loss of productivity in terms of working days lost was estimated.
Sayre et al. 201080
Canada OA (knee, hip,
hand, foot, lower
back or neck). Age
>19. N=688.
Cross sectional study To investigate the effects of the site of OA (knee, hip, hand, foot, lower back or neck) on employment reduction due to OA (EROA).
Current and past employment
status, and Employment reduction
due to OA (EROA) collected via
mailed out questionnaire.
Tang et al. 201077
Canada OA or RA. Age 54 +- 6.7. N=130 with OA.
Longitudinal study (data collected at baseline, 3 months, 6 months and 12 months)
To evaluate the ability of the Work Instability Scale for Rheumatoid Arthritis (RA-WIS) to predict arthritis-related work transitions within a 12-month period (primary outcome) and perceived decreases in work capacity within same time period (secondary outcome).
Used the Work Instability Scale for
Rheumatoid Arthritis (RA-WIS) to
(1) predict arthritis-related work
transitions within 12 months (any,
change in job/occupation,
disability leave of absence,
reduction in work hours); and (2)

68
within 12 months, perceived
decreases in work capacity
(decreased ability to work,
increased illness interference,
decreased work productivity). For
the secondary outcome, 3 self-
reported global indicators to
examine perceived changes in
work capacity 1) change in ability
scale, 2) change in degree of
illness based on illness
Intrusiveness Ratings Scale, and 3)
change in work productivity scale.
Tang et al. 201158
Canada OA. N=130. Cohort To examine disease-related differential item functioning (DIF) in the RA-WIS.
Work Instability Scale for
Rheumatoid Arthritis (several
items such as slowness, pain,
frustration) applied to people with
and without OA.
Van Der Burg et al. 2014
71
Netherlands OA. Age 18-65. N=12140.
Prospective cohort study among working individuals
To determine the risk of sick leave and work disability in relation to rheumatic diseases and cardiovascular comorbidities among working individuals.
Number of days and frequency of
sick leave; work disability
(problems at work due to health
issues, perceived physical
demands of the job); receipt of a
full or partial work disability
pension over 10 year period.

69
Wilkie et al. 2014 (a)
129
England OA. Age 50-65. N=297.
Population-based prospective cohort study.
To describe the prevalence of expected work limitations (EWL) prior to future retirement age in OA consulters, and the associated health, sociodemographic, and workplace factors.
Expected work limitations (EWL)
"Do you think joint pain will limit
your ability to work before you
reach 69 years old?" (will limit or
stop me/ don’t know/ wont limit) -
a single question.
Wilkie et al. 2014 (b)
130
England OA. Age>50. N=1098.
Population-based prospective cohort study
The objective of this study was to describe the extent of premature work loss (PWL) in OA consulters across a 6-year observation period, and associated factors.
PWL was defined as moving from
employment to retirement prior to
state retirement age or transition
from employment to being off
work due to health or
unemployment between baseline
and 3 years or between 3 and 6
years using the participant’s self-
report of employment status
[employed (including self-
employed), off work due to illness,
unemployed, homemaker,
retired].
Wilkie et al. 2015131
England OA. Age <65. N=923.
Population-based prospective Cohort study – primary care consulters for OA.
To provide an in-depth examination of how pain leads to the onset of work productivity loss and identify potential new intervention opportunities.
Work productivity was measured
using a single item from the
Medical Outcomes Study Short
Form-36. Employment status (and
early retirement, homemaker) was
also ascertained over a 3 year
period.
Zhang et al. 201078
Canada Age 18-65. N=212 (OA=111).
Prospective cohort To estimate and compare lost work hours attributable to presenteeism,
Lost hours due to presenteeism
(reduced productivity while

70
defined as reduced productivity while working, in individuals with OA or RA), according to 4 instruments.
working) was estimated using
several questionnaires:(a) Health
and Labor Questionnaire (HLQ),
(b) Work Limitations
Questionnaire (WLQ), (c) the
World Health Organization’s
Health and Work Performance
Questionnaire (HPQ), and (d)
Work Productivity and Activity
Impairment Questionnaire (WPAI).
Instruments were administered at
baseline, 3, 6 and 12 months.
Estimated lost hours and
associated monetary valuation of
productivity loss due to
presenteeism among workers with
OA (dollars).
Tang et al. 2014 (POLICY)
132
Canada OA Policy document Worker productivity outcome measures: OMERACT filter evidence and agenda for future research.
Discusses different productivity measures. OMERACT group are described, and discuss WPAI, WPS-RA, QQ, HPQ, and WAI.

71
Appendix 5: Study characteristics
The main characteristics of the 63 studies and the productivity measures used in OA studies are
presented in Appendix 1 (intervention studies) and Appendix 2 (cost of illness). Together, these
studies were published in 2015 (n=6, 10%), 2014 (n=14, 22%), 2013 (n=14 (includes one policy
document132), 22%), 2012 (n=6, 10%), 2011 (n=8, 13%), and 2010 (n=13, 21%). They reported the
productivity losses of OA in 17 countries, with 12 from Canada, 11 from the USA, and 6 from
Australia. Twenty-two studies (9 intervention and 13 cost of illness) included one type of
productivity measure (i.e. a single question/instrument), 36 included multiple productivity measures
(15 intervention and 21 cost of illness), and 9 included measures related to productivity (such as
quality of life using SF-36) but did not link these results to productivity (3 intervention and 6 cost of
illness). In terms of the productivity measures, 11 studies (intervention) measured time to return to
work post-surgery either on its own or in addition to other measures, 22 studies (3 intervention, 18
cost of illness and 1 policy) measured work absences (e.g. absenteeism, sick leave) through either
single questions or the Work Productivity and Activity Impairment (WPAI) questionnaire (Reilly et al
(1993)133, and see http://www.reillyassociates.net/WPAI_SHP.html), 14 (4 intervention and 10 cost
of illness) measured workplace activity limitations due to OA using the Workplace Activity
Limitations Scale (WALs) (Gignac et al (2004)79), 3 (cost of illness) studies measured productivity
through the Work Instability Scale for Rheumatoid Arthritis (RA-WIS) (Gilworth et al (2003)134), and 2
(intervention studies) measured job satisfaction either post surgery or when working with OA. Seven
studies (3 intervention and 4 cost of illness) assessed quality of life or used markov health state-
transition decision models for tracing changes in productive lives. Of these, 3 used the SF-36 to
assess quality of life with OA/after surgery, 1 used the AQoL, and 3 used Markov state-transition
decision models. Note that none of the studies linked the individual with OA’s quality of life
assessment to their productivity – which had implications for the modelling in Stage 3. Fifty-six
studies (23 intervention and 33 cost of illness) produced productivity outcomes for people with OA
only, while the remaining studies producing these outcomes for individuals with OA or another form
of arthritis (OA or RA, or OA or IA). The majority of the studies assessed productivity benefits (losses)
for the entire working-age population (e.g. 18-60 years), as opposed a subset of the population.

72
Appendix 6: List of instruments
The intervention studies have only used questionnaires (1)-(4) below; the cost of illness studies have
used all of the questionnaires listed below, except (5).
1. Workplace Activity Limitations Scale (WALS)
The WALS consists of 12 items intended to measure arthritis-related workplace activity
limitations76,79,135. The instrument items assess the degree of difficulty people with arthritis have
with various job-related tasks affecting upper/lower limb function, and their difficulties with
travelling, scheduling, concentration, and the pace of the work. Respondents are asked about the
difficulties they encounter “in general”’ or “typically” but without a defined period for which to
recall occurrences. Response options are based on a four-point Likert scale moving from “no
difficulty (a score of 0)” to “not able to do (a score of 3)” plus two other options: “difficulty unrelated
to arthritis” and “not applicable” (both are assigned a score of 0). The WALS has a score range of 0 to
36.
Limitations of the instrument:
No capacity to estimate the monetary value of the productivity losses
Excludes people not working
Does not include obvious major costs (e.g. lost earnings for workers, income/profit for
employers)
Does not include other major costs (e.g. welfare, tax, worker’s compensation)
The instrument asks: “As a result of your arthritis, how much difficulty do you have
concentrating or keeping your mind on your work?”135,136 but this is not a direct measure of
presenteeism (i.e. not quantifying the degree of difficulty a person has at work due to their
illness in terms of lost work hours or lost earnings/income).
2. Work Limitations Questionnaire (WLQ)
The WLQ-25 was developed to measure the impact of chronic diseases and treatments on work
performance59,137 and has been validated in both OA138 and RA139 populations. Questionnaire items
ask about the proportion of time (moving from “none of the time” to “all the time”) over the last 2
weeks, in which the respondent experienced some difficulty in four subscales (each is scored from 0
to 100): time management, physical demands, mental interpersonal, and output demands. The
content and format of the WLQ-25 were originally derived from focus groups and cognitive
interviewing of workers with gastrointestinal, psychiatric or respiratory disorders, or epilepsy.59.
Lerner et al. (2003)140 provides a formula (WLQ Index) that converts WLQ-25 subscale scores into an

73
estimate of percentage of productivity lost compared to healthy controls (i.e. without OA, RA),
which could be used to measure the economic impacts.
Limitations of the instrument:
Consists of people working only (i.e. excludes those out of the workforce)
Does not include obvious major costs (e.g. lost earnings for workers, lost income for
employers)
Does not include other major costs (e.g. welfare, tax, worker’s compensation)
Strengths:
The instrument asks about the amount of health-related productivity loss experienced in a
fixed time period (presenteeism) and thus a direct productivity measure is provided.
It has the capacity to estimate the monetary value of the productivity loss.
3. PROductivity and DISease Questionnaire (PRODISQ)
The Productivity and Disease Questionnaire was developed to measure productivity costs due to
knee symptoms.60 The questionnaire covers various aspects on the relationship between
productivity and health, including the number of knee-related absences from work (sick leave) in the
last 3 months. It includes the measurement of lost productivity due to knee symptoms while at work
using the quality and quantity method.60,141
Limitations of the instrument:
Questions are for people working only
Does not include obvious major costs (e.g. lost income)
Does not include other major costs (e.g. welfare, tax, worker’s compensation)
Strengths:
The instrument asks about the amount of absences due to ill-health in the last 3 months
which could be used to quantify the productivity losses.
4. Osteoarthritis Costs and Consequences Questionnaire (OCC-Q) (used in Pinto et al
(2013)49)
The (OCC-Q) consists of questions about the costs and consequences of rheumatic diseases (hip and
knee OA) incurred by those with the diseases aged 40-85 years, their friends and families (e.g.
carers). The OCC-Q has been validated for use in the New Zealand OA population.142 Respondents
are asked to recall their visits to health professionals, use of public and private hospitals,
medications, transport costs, aids and adjustments that were needed, and the use of community
services over the last 3 months. Information about costs incurred by respondents’ friends or family
(such as out-of-pocket costs, transport costs, lost earnings, and informal caregiving) were also

74
collected. With regard to productivity losses related to arthritis, respondents are asked (a) whether
they are in paid work, and if not, if this is because of their arthritis; and (b) how their work has been
affected by their arthritis in the last month (i.e. how many days off work, reduced hours, restrictions
at work). For those in paid work, there are also questions about the hours they worked and hourly
pay rate or annual salary.
Main limitation of the instrument:
Questions about productivity are for those who are working (i.e. excludes those who are not
working). Everyone is asked about carer costs.
Strengths:
The instrument asks about a number of productivity losses over a fixed time period and
current income, which could be used to quantify (monetarise) the losses.
5. Work Productivity and Activity Impairment Questionnaire (WPAI)
The WPAI Specific Health Problem V2.0 (WPAI:SHP) consists of the following questions about the
effect of a person’s health problem on their work capacity and to perform common tasks. It begins
with asking people whether or not they are currently employed (Yes/No) and then about how their
health problem affected their work in the last seven days, including the number of hours missed
because of problems associated with their health problem, how the problem affected their
productivity while working. In terms of productivity limitations, respondents are asked to:
Think about days you were limited in the amount or kind of work you could do, days you
accomplished less than you would like, or days you could not do your work as carefully as
usual.
And they are asked to circle a number from 0 (health problem had no effect on their work) to 10
(health problem completely prevented them from working) to indicate how much the problem
affected their productivity.
Limitations of the instrument:
Excludes people out of the workforce
Does not include obvious major costs (e.g. lost earnings for workers, lost income for
employers)
Does not include other major costs (e.g. welfare, tax, worker’s compensation)
Strengths:
The WPAI directly measures productivity: current employment status, number of hours
missed due to a health problem (absenteeism), the extent to which their health problem
affected productivity in hours (presenteeism). Consequently, it has the capacity to estimate
the monetary value of the productivity losses.

75
6. Stanford Presenteeism Scale (SPS-6)
The Stanford Presenteeism Scale (SPS)-6143 is a short derivative of the original SPS-32144. It was
designed for non-specific clinical and employee populations. The SPS-6 measures a worker’s ability
to focus on and complete work tasks regardless of health-related distractions, in the last
month143,144. Scale content of the original version (SPS-32) was formulated through a thorough
literature review and the developers’ experiences.143 The SPS-6 consists of six questions with options
being on a five-point Likert scale moving from “strongly agree” (a score of 1) to “strongly disagree”
(a score of 5) to provide a scale score from 6 to 30 (with 30 indicating “most presenteeism”).
Limitations of the instrument:
No capacity to estimate the monetary value of the productivity losses
Excludes people not working
Does not include obvious major costs (e.g. lost income)
Does not include other major costs (e.g. welfare, tax, worker’s compensation, carer costs)
The instrument includes questions about “how hard” people find different aspects of work
(e.g. completing hard tasks) but this is not a direct productivity measurement.
7. Endicott Work Productivity Scale (EWPS)
The Endicott Work Productivity Scale (EWPS) was formulated to quantify the frequency of attitudes
and behaviours that are not productive in the last week, and is relevant for a range of diseases and
occupations.144,145 It consists of four domains: attendance (absenteeism), quality of the work
performed, the worker’s performance capacity, and important personal factors within 25 items. Five
response options are offered for each item: “never” (a score of 0) to “almost always” (a score of
score 4), and the scale is scored from 0 of 100 with “lowest productivity” having ascore of 100.
Limitations of the instrument:
No capacity to estimate the monetary value of the productivity losses
Excludes people not working – an important subpopulation
Does not include obvious major costs (e.g. lost income)
Does not include other major costs (e.g. welfare, tax, worker’s compensation)
The instrument includes several questions relating to productivity, but people self-rate how
they have performed in these areas in the last week (and thus no quantifiable direct
productivity measurement).
8. Work Instability Scale for Rheumatoid Arthritis (RA-WIS)
The RA-WIS was developed for the RA population to assess the degree of incongruity between the
functional abilities of the worker and the demands of their job, and to identify workers needing
workplace adjustments in order to sustain their employment.134 The scale items were initially

76
generated from interviews with workers with early diagnosed RA. Respondents are asked to respond
according to their personal experiences “at the moment”. The scale consists of 23 items where “yes”
has a score of 1, and “no” has a score of score 0. A total score of < 10 signifies “low work instability”,
10-17 signifies “moderate work instability”, and >17 signifies “high work instability”.134 Higher work
instability has been shown to be predictive of transitions in and out of work among people with
arthritis.77
Limitations of the instrument:
No capacity to estimate the monetary value of productivity losses
Excludes people who are not working
Does not include obvious major costs (e.g. lost earnings for workers, lost income for
employers)
Does not include other major costs (e.g. welfare, tax, worker’s compensation)
A range of specific work-related issues are covered (e.g. ways of controlling arthritis
symptoms, time management, difficulties completing tasks, distress caused by concerns
about being able to maintain employment in the future) that could signify functional
disability or an inability to undertake all the demands of the job; but these are not direct
measures of productivity losses (i.e. not quantifying how the instability converts into
productivity losses due to illness as lost work hours or lost earnings/income).
9. Economic Aspects in Rheumatoid Arthritis Questionnaire (used in Bieleman et al
(2010b)117, Bieleman et al (2013)118)
The Economic Aspects in Rheumatoid Arthritis questionnaire enquires about several aspects of work
participation: present or last job, work hours, work history, present work status, sick leave, and
physical demands of the job.67 Respondents in paid work are asked if they have been on sick leave,
and if so, if this was because of hip/knee complaints or other health reasons. Another relevant
question is whether they have altered or would like to alter their work due to their illness.
Respondents not in paid work are asked to provide reasons for not having a job. Household work is
also measured (and valued) through this questionnaire.
Main limitation of the instrument:
Includes household productivity losses, defined as the (value of) household tasks that have
to be carried out by formal (a paid housekeeper) or informal carers (friends, family), if the
person was unable to perform these tasks because of their illness (OA). But it does not
include other major costs (e.g. welfare, tax, worker’s compensation).
Strengths:
The instrument has the capacity to estimate the monetary value of productivity losses for
those in paid work (such as cost of sick leave days due to illness) and unpaid work
(household productivity).
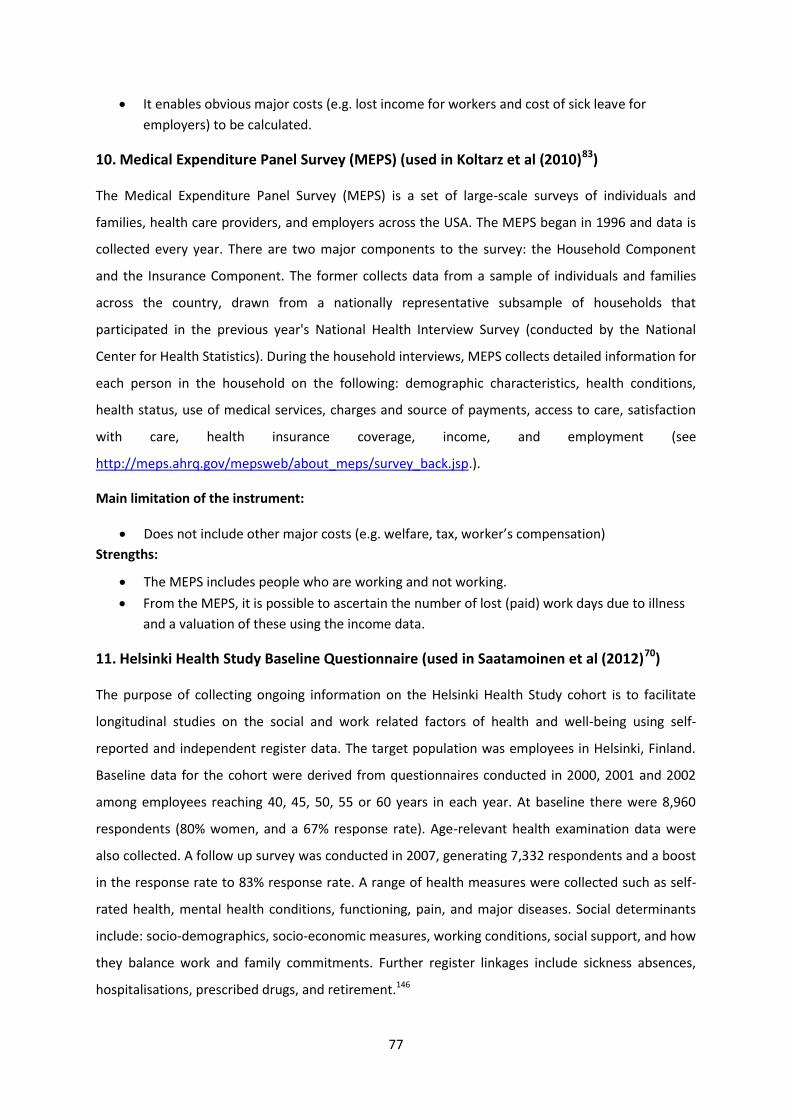
77
It enables obvious major costs (e.g. lost income for workers and cost of sick leave for
employers) to be calculated.
10. Medical Expenditure Panel Survey (MEPS) (used in Koltarz et al (2010)83)
The Medical Expenditure Panel Survey (MEPS) is a set of large-scale surveys of individuals and
families, health care providers, and employers across the USA. The MEPS began in 1996 and data is
collected every year. There are two major components to the survey: the Household Component
and the Insurance Component. The former collects data from a sample of individuals and families
across the country, drawn from a nationally representative subsample of households that
participated in the previous year's National Health Interview Survey (conducted by the National
Center for Health Statistics). During the household interviews, MEPS collects detailed information for
each person in the household on the following: demographic characteristics, health conditions,
health status, use of medical services, charges and source of payments, access to care, satisfaction
with care, health insurance coverage, income, and employment (see
http://meps.ahrq.gov/mepsweb/about_meps/survey_back.jsp.).
Main limitation of the instrument:
Does not include other major costs (e.g. welfare, tax, worker’s compensation)
Strengths:
The MEPS includes people who are working and not working.
From the MEPS, it is possible to ascertain the number of lost (paid) work days due to illness
and a valuation of these using the income data.
11. Helsinki Health Study Baseline Questionnaire (used in Saatamoinen et al (2012)70)
The purpose of collecting ongoing information on the Helsinki Health Study cohort is to facilitate
longitudinal studies on the social and work related factors of health and well-being using self-
reported and independent register data. The target population was employees in Helsinki, Finland.
Baseline data for the cohort were derived from questionnaires conducted in 2000, 2001 and 2002
among employees reaching 40, 45, 50, 55 or 60 years in each year. At baseline there were 8,960
respondents (80% women, and a 67% response rate). Age-relevant health examination data were
also collected. A follow up survey was conducted in 2007, generating 7,332 respondents and a boost
in the response rate to 83% response rate. A range of health measures were collected such as self-
rated health, mental health conditions, functioning, pain, and major diseases. Social determinants
include: socio-demographics, socio-economic measures, working conditions, social support, and how
they balance work and family commitments. Further register linkages include sickness absences,
hospitalisations, prescribed drugs, and retirement.146

78
Main limitation of the instrument:
Does not include other major costs (e.g. welfare, tax, worker’s compensation)
Strengths:
There is the capacity to estimate the monetary value of the productivity losses because
there is information on sickness absence (lost work days) and disability retirement due to
main (diagnosed) illness (includes musculoskeletal diseases), as well as income data.
12. Health and Labour Questionnaire (HLQ) (used in Zhang et al (2010)78)
The HLQ was designed to collect data on the connections between illness, treatment, and work
performance.147,148 The instrument can provide estimates of productivity losses (costs) in both paid
and unpaid work. Reduced productivity at paid work is quantified by a single question asking how
many extra hours individuals would have to work to catch up on tasks they were unable to complete
in normal working hours due to health problems in the last 2 weeks. There are also questions about
how work was reorganised to take account of health problems (e.g. working at a slower pace,
colleagues taking on some of their tasks), income, sick leave, pension and early retirement.
Strengths of the instrument:
The HLQ includes people who performed paid work, unpaid work (e.g. family members
doing household tasks), and were unable to perform paid work due to their illness and other
reasons (i.e. important subpopulations).
The HLQ permits the estimation of productivity losses: an estimate of on-the-job production
losses based on the mean hourly wage (income).
The HLQ permits the estimation of changes in paid work (e.g. household work completed by
family members of the person with the illness).
13. World Health Organization’s Health and Work Performance Questionnaire (HPQ) (used
in Zhang et al (2010)78)
The HPQ is intended to assess the workplace costs of health-related reduced performance in jobs,
sickness absences, and injuries from accidents at work.149,150 Respondents are asked to rate their
overall performance on the days they worked during the last 7 days on a scale of 0 (a total lack of
performance) to 10 (no lack of performance).149-151 If ideal work performance is set at 100%, then
presenteeism can be measured as reduced work performance corresponding to a percentage below
100%; and the implied loss in hours of work can be estimated by multiplying this percentage by the
number of hours worked. There are two versions of the HPQ: one for employees and another for
clinical trials. The recall period is either the last 7 or 28 days of work, and short versions of the
questionnaire (and scoring algorithms) are available
(http://www.hcp.med.harvard.edu/hpq/info.php).

79
Limitations of the instrument:
Excludes people who are not working
Does not include obvious major costs (e.g. lost earnings for workers, lost income for
employers)
Does not include other major costs (e.g. welfare, tax, worker’s compensation)
A scale is used to (self) assess presenteeism – not a direct measure of productivity losses
that could be used by agencies interested in productivity such as Treasury.
Strengths:
There is capacity to estimate the monetary value of the productivity losses because there is
information on the (usual) hours of work and the amount of work time lost due to illness
(self-rated) (work section) which could be used with the information on how much a person
is paid per hour (wage) and annual salary (before tax) (demographics section).
In terms of the review undertaken for this report, one study (Wilkie et al (2015)131) used a single
question from the Medical Outcomes Study Short Form-36 to assess productivity; however, this
form is normally used to derive quality of life. Other instruments used in the cost of illness studies
were: the Workwell Systems Functional Capacity Evaluation, which assesses how OA impacts on the
physical demands of the job (used in Bieleman et al (2010a)116); the Social Role Participation
Questionnaire (SRPQ), which assesses role satisfaction (used in Gignac et al (2013)125). The policy
document (i.e. Tang et al (2014)132) and review by Zhang et al (2010)78 compare productivity
outcomes from several instruments, including the WPAI, HLQ, WLQ, HPQ.

80
Appendix 7: Scaffolding of the proposed productivity measure
The starting point for the proposed productivity measure is:
Are you in paid work (employment)?
o If Yes,
What are your usual paid work hours per week?
If you are working part-time, what is your main reason for this?
Options would include ill-health (including the condition relevant to
the study e.g. osteoarthritis), illness severity (or pain severity if the
intervention is designed to treat arthritis), other health conditions
that prevent me from working.
What is your current hourly wage or annual salary?
Do you receive any social security payments? Common wording for this type
of question includes “Are you receiving any Centrelink support or income
payments?” or “Are you receiving any government income or support
payments?” For example, the ABS’ Survey of Disability, Ageing and Carers
2003 and 2009 includes questions on receipt of welfare payments, as well as
lists of specific payments (e.g. Aged Pension, Disability Support Pension,
Carer’s Payment, Carer’s Allowance, Newstart).89,90
Have you taken a lower paid job due to your illness [osteoarthritis]?
If Yes, what was the size of the pay cut? (Specify the new hourly
wage rate or annual salary)
Have you taken any time off due to your illness [osteoarthritis] in the last X
(e.g. last month) [and duration of the study]?
How many hours did you take off in total?
How was the cost of these hours covered?
o Paid sick leave, unpaid sick or other leave, workers comp,
other forms of insurance, other (please specify).
o If No,
Are you seeking paid work (employment)?
If No, what is the main reason for this? Options to include: ill-health
(including specifically the condition of interest in the study), illness
severity, other health conditions prevented me from working (and
nominate the conditions).
How long has it been since you last worked?
What was your previous annual income in your last paid job?
What was your previous annual income before you developed your illness
[osteoarthritis]?
Are you receiving any social security payments?
If Yes,

81
o What type of payments are you receiving? (e.g. Aged
Pension, Newstart Allowance, Disability Support Pension,
Sickness Allowance, Youth Allowance, Carer Payment, Carer
Allowance).
o How much are your total social security payments per
fortnight?

82
Appendix 8: Cost of not being in the labour force due to OA for individuals in
2015
Individual person characteristics
Average
Total
weekly
income
Average
Tax paid
Average
Transfer
payment
received
Male, aged 45-49 years, no university qualification, not in the
labour force due to OA $169.00 $0.00 $152.00
Male, aged 45-49 years, no university qualification, in the labour
force and no OA $1,432.00 $310.00 $0.00
Female, aged 45-49 years, no university qualification, not in the
labour force due to OA $464.00 $0.00 $437.00
Male, aged 45-49 years, no university qualification, in the labour
force and no OA $970.00 $121.00 $0.00
Note: “In the labour force” means could be “full-time employed” or “part-time employed” or
“unemployed”.

83
Appendix 9: Labour force status of those with OA in 2015
Gender Age group Estimated number of people
Employed full-time with OA (i.e. anyone with OA)
Male 15-24 years 1,554
Male 25-34 years 5,010
Male 35-44 years 12,977
Male 45-54 years 34,214
Male 55-64 years 53,425
Total 107,180
Female 15-24 years 325
Female 25-34 years 2,652
Female 35-44 years 8,889
Female 45-54 years 26,110
Female 55-64 years 40,148
Total 78,124
Employed part-time with OA (i.e. anyone with OA)
Male 15-24 years 140
Male 25-34 years 988
Male 35-44 years 1,865
Male 45-54 years 4,102
Male 55-64 years 12,291
Total 19,386
Female 15-24 years 107
Female 25-34 years 1,012
Female 35-44 years 8,371
Female 45-54 years 27,130
Female 55-64 years 49,109
Total 85,729
Unemployed with OA (i.e. anyone with OA)
Male 15-24 years 52
Male 25-34 years 305
Male 35-44 years 1,254
Male 45-54 years 2,630
Male 55-64 years 3,657
Total 7,898
Female 15-24 years 124
Female 25-34 years 476
Female 35-44 years 1,183
Female 45-54 years 2,368
Female 55-64 years 1,563
Total 5,714

84
Gender Age group Number of people
Not in the labour force due to OA as a main condition
Male 15-24 years 44
Male 25-34 years 115
Male 35-44 years 250
Male 45-54 years 2,722
Male 55-64 years 6,779
Total 9,910
Female 15-24 years 5
Female 25-34 years 0
Female 35-44 years 981
Female 45-54 years 4,942
Female 55-64 years 13,494
Total 19,422