measuring emotion through mobile - esomar
TRANSCRIPT

Page 1 – CONGRESS 2012 Copyright © ESOMAR 2012
PREFACE Measuring emotion is no longer solely the domain of desktops, or laptops for that matter. Mobile devices have increasingly become a robust platform in which to capture consumer insight into ads and other forms of media. Mobile devices are ubiquitous and are ideal for delivering rich media while capturing people’s response to the media. This enables advanced computer vision technology to identify the facial expressions captured in the face videos and to map these expressions to emotional states such as enjoyment, confusion, surprise and attention. This paper documents an iterative process to develop, test, and validate the use of mobile as a powerful way to test ad recall and to assess the emotional impact a given ad has on a group of people through facial coding. This paper shares findings from initial iterations, namely testing ad recall of a battery of TV ads in Brazil and other emerging markets, and then proceeds to test six ads in the beverage category in two cities in India (Hyderabad and Delhi), highlighting differences in ad responses by demographics and location. This innovative use of mobile devices creates many opportunities for innovation in market research. INTRODUCTION While there is little question that mobile is important, there are lingering concerns around how representative mobile users are compared to the general population. Mobile gives us access to representative audiences with ever-greater ease compared to any other means. Figure 1 shows that there are over 5.3 billion mobile subscriptions globally, which represents a penetration rate of 77% of the world's population. Of these 5.3 billion mobile devices, 1.3 billion are camera-ready1),2) and 73% (or 3.8 billion) are based in emerging markets. Moreover, Internet traffic is shifting to mobile across the world and is now at 10%. In emerging markets, however, the majority of Internet traffic is coming from mobile, not PC, use. FIGURE 1, 5.3 BILLION MOBILE PHONE SUBSCRIPTIONS (73% OF THE WORLD’S SUBSCRIPTIONS) ARE IN EMERGING MARKETS
Source: Mashable “Why Mobile Ads in Emerging Markets are the Future”, April 2012 An example is India (see figure 2) where mobile Internet traffic has now surpassed PC-based Internet traffic. With this shift, it becomes clear that the dominant way to reach consumers will be via mobile. The trends impacting India only indicate where the rest of the market is going. In addition, of the 5.3 billion mobile devices, 1.3 billion are camera phones, indicating that cameras are becoming ubiquitous.
MEASURING EMOTIONS THROUGH A MOBILE DEVICE ACROSS BORDERS, AGES, GENDERS AND MORE Rolfe Swinton • Rana El Kaliouby

Page 2 – CONGRESS 2012 Copyright © ESOMAR 2012
FIGURE 2, INDIA INTERNET TRAFFIC BY TYPE: DESKTOP VS. MOBILE, 12/08 – 5/12
India mobile Internet traffic surpasses that on the desktop. (Source: StatCounter Global Stats, Mary Meeker, KPCB, May 2012). THE CORE CHALLENGE: TRADITIONAL MARKET RESEARCH NOT MEETING RESEARCH NEEDS In 2009, a Fortune 100 client was expressing discontent at the then-current methodology to measure advertising recall in emerging markets, namely by presenting illustrative storyboards of ads to consumers (see figure 3). The client felt that there had to be a better way to actually present consumers with the real ads. But how best to do that? It was (and still is!) quite challenging to get a representative sample in an emerging market where computer and Internet penetration is at relatively low levels. Thus, recruiting people online wasn’t a viable option. The research agency and client posited a question: would it work to interview consumers on the street and show them a video via a mobile device, which is inherently more portable and less prone to theft than a laptop might be? FIGURE 3
(left) Before: Traditional approach to testing advertising recall in emerging markets uses storyboards of ads and self-report; (right) After: Lumi Mobile and Affectiva team up to present ads via a mobile device while capturing the consumer’s emotional reactions to the ads Another challenge with emerging markets is that participants are less likely to self-report their true emotion due to cultural norms. For example, when prompted if they “liked the ad”, participants in countries like India and China are more likely to respond positively in order to please the interviewer. Thus, a more objective measure of response to the ad is needed. What if in addition to self-reported measures of recall we could also measure emotional responses to the advertising? Wouldn’t that be powerful? Answering this question prompted a process that took two years to answer in full and culminated in a solution for ad testing and tracking in emerging markets. We share our learnings and findings harvested from this two-year endeavor. The client’s problem presented an opportunity for us to test a methodology of using mobile as a way to deliver content to consumers, measure recall as well as emotional responses. By using a mobile device that delivers the actual advertisement to anyone in the street and captures natural responses, we could look at replacing traditional delivery of content via printed storyboards (which don't really give a respondent the full feeling of the ad given that it is static and without sound) or via PC (which are not available easily in all markets nor very easy to carry around on a street).

Page 3 – CONGRESS 2012 Copyright © ESOMAR 2012
Our objectives were to test that mobile would be as effective, if not more so, as a way to track ad effectiveness when compared to traditional measurement methodologies. What are the big lessons from this paper we want you to take away? Trying a new research methodology, especially when using mobile, should not be a daunting or costly experience. We
show how it is possible to get to a minimum viable product as efficiently as possible to test a new approach; New mobile methodologies work in emerging markets as well, if not better than, in developed economies; With the growth of a range of specific technology skills and areas of expertise, partnering is a great way to make great
things happen fast, in this case Lumi and Affectiva leveraged each other’s strength, namely mobile and emotion measurement respectively, to quickly bring a solution to market.
Measuring emotions with facial coding is now possible on mobile devices and enables unobtrusive emotion measurement in a scalable way.
Facial coding gave a moment-by-moment analysis of scenes that elicited an emotional response, as well as yielded ad-level insights into ad effectiveness.
The rest of the paper shares our learning and findings throughout this endeavor. Our first iteration and minimum viable product focused on the use of mobile phones to test ad recall – a validation study was conducted in Brazil to test V1.0. We then increased the scope of the problem and implemented a solution that measures emotion responses to the ad via mobile using Affectiva’s facial coding platform. We validated this on a large-scale study in two cities in India. We share our finding from this study and discuss our plans to scale to multiple markets. CHALLENGE 1: CAN YOU USE MOBILE TO TEST AD RECALL? For a number of years, the standard research methodology for testing ad recall in emerging markets has been to present participants with an illustrated storyboard of an ad in order to test the recall of that given ad. The technique required little technology and was very portable. Moreover, it was tried and tested. That said, the clients of the service were beginning to question the methodology, especially given the options to use more technology-based, objective measures. Our research clients needed to move their approach forward. They sought out Lumi to provide mobile-based tools that could deliver ad content to the field workers in any geography but have the distribution of the ads managed easily, from a central location. Lumi’s mobile-centric data collection platform was designed to span device type from simple feature phones to the latest smartphones and tablets. For this first test we used Nokia E71 Symbian device – a common mobile device, relatively inexpensive, durable, with a long battery life – ideal for fieldwork. In order to create a sufficiently good service to test, we took a careful look at what was essential to validate the approach, and create a minimum viable product (MVP). Thus, we were very clear on the scope. Rather than trying to move the entire research process to the mobile device including the survey itself, the CAPI management tools, quota management tools, etc., we focused on solving the core problem: whether or not we could successfully move the process of ad testing from using portable, illustrated storyboards as the ad recall stimulus, to giving a respondent a mobile device and headphones to serve the ad stimulus. With that approach, we were able to test, side by side, the quality of data gathered in the traditional ad recall test versus the new methodology. We also had a number of clear metrics beforehand we were testing against (frequency of recall of the ad, recall of the actual brand, recall of the offer all via the traditional approach compared to the new approach), which allowed us to gather important lessons on exactly what was needed to improve the service so that it could scale to serve multiple markets. By focusing only on core outcomes, we were able to bring a product relatively quickly, that exceeded the client requirements for performance for ad recall testing. This process was then more easily extended to test new areas of functionality including emotional measurement made possible by the Affectiva facial coding technology. AD RECALL TESTING METHODOLOGY TAKES A STEP AHEAD Over a period of several months we tested side by side ads presented via: 1) the still / storyboard format; and 2) full video ads via the mobile device. Over the period of the test 547 different full video ads and their related storyboards were tested side by side to consumers stopped in the street (see figure 3). The hypothesis going into the test was that people would have better recall when presented with a real and full ad. The results were on trend, but more subtle.

Page 4 – CONGRESS 2012 Copyright © ESOMAR 2012
The still average recognition level was 65% (with any given ad ranging from 45%-78%) and for video ads it was 78% (with any given ad ranging from 28%-93%). Thus the first conclusion was that on average with mobile we were able to identify more recognisers (and with the average plan aiming to reach as much of the 100% of the target sample as possible, the higher level makes intuitive sense). The second conclusion was that we were able to see a wider range of country averages (from 28% in one country to 93% in the next) meaning greater discrimination. Further analysis then looked at the data by the spend levels. Ads were sorted by range of ad spend which is used as a proxy of advertising frequency. There were six bands of advertising frequency used (see table 1). TABLE 1 Ad Frequency Bands Level of Storyboard Ad Recall Level of Mobile Video Ad Recall
101-300 X% Y301-500 X – 3%* Y + 19% 501-700 X + 4% Y + 29% 701-1000 X + 6% Y + 43% 1001-2000 X + 14% Y + 45% 2000+ X + 13%* Y + 54%
* Note – there is a decrease of 3% at the second spending band and another 1% decrease of recall at the highest spending band in the storyboard test. What we found through the comparison that with the storyboard approach, the data was mixed, with inconsistent declines in the second lowest band as well as the highest band and only an 18% spread from lowest to highest score. With the mobile video test there was generally a continual positive gain across the bands, growing with each band of additional spend test. Overall the mobile video test gave a 54% point difference between the lowest band of spend and the highest with a clear correlation between the volume of advertising and the level of recall whereas the storyboard test gave only an 18% spread. A simple sniff test showed the mobile test data was giving a more accurate read on recall overall and gave a more useful and discriminating read when individual ads were compared. We took further lessons from the initial tests and were able to apply those in subsequent iterations of the platform that is now serving ads for testing in over 15 countries (with nearly as many languages) and hundreds of thousands of ads being presented each month. The approach worked, and with the lessons learned and applied, it has scaled nicely and is delivering regular, strong data on the levels of recall across campaigns, across markets. Challenge 1 down, but how to add another dimension to the measurement? How could we start to use mobile to capture another metric entirely to better gauge how consumers were actually responding to the ads? Now we moved to Challenge 2 – seeing if we could use mobile in an emerging market to measure emotional responses. CHALLENGE 2: CAN YOU TEST EMOTIONAL RESPONSE TO ADS IN EMERGING MARKETS? Emotions have been scientifically shown to drive brand loyalty, impact recall, and influence purchase decisions (Ambler and Burne, 1999). Yet measuring emotions in an objective way is tricky! Because the effects of ads are often implicit, sometimes even subliminal, many people may find it hard to articulate the impact of an ad or map their experience to a number on a scale. Thus, traditional self-reported measures, while convenient, require participants to think about and report their feelings, and so are often biased by participants’ cognitive filters. Self-report methods are particularly challenging in emerging markets where participants are less likely to share their true emotion. Most neuromarketing approaches such as brainwave measurement are obtrusive, lab-based, hard to scale and very expensive, making it especially hard to apply such technologies in developed markets, never mind emerging markets where it becomes untenable. What is needed is an objective measure of emotion that is both unobtrusive and scalable. Facial coding is just that. It provides a moment-by-moment measure of visceral emotional responses to content; it is unobtrusive (participants only need to turn the webcam or handheld camera on) and, by leveraging the ubiquity of camera phones, it is very scalable. THE FACE PAINTS A RICH CANVAS OF EMOTIONAL RESPONSE The face is a primary channel for communicating emotion. Our facial muscles, which are driven by the brain’s emotion center, generate thousands of facial expressions that communicate a wide range of emotions (Rinn, 1984). In advertising, the presence and intensity of facial responses correlate strongly with increased ad recall (Hazlett and Hazlett, 1990).
Page 5 – CONGRESS 2012 Copyright © ESOMAR 2012
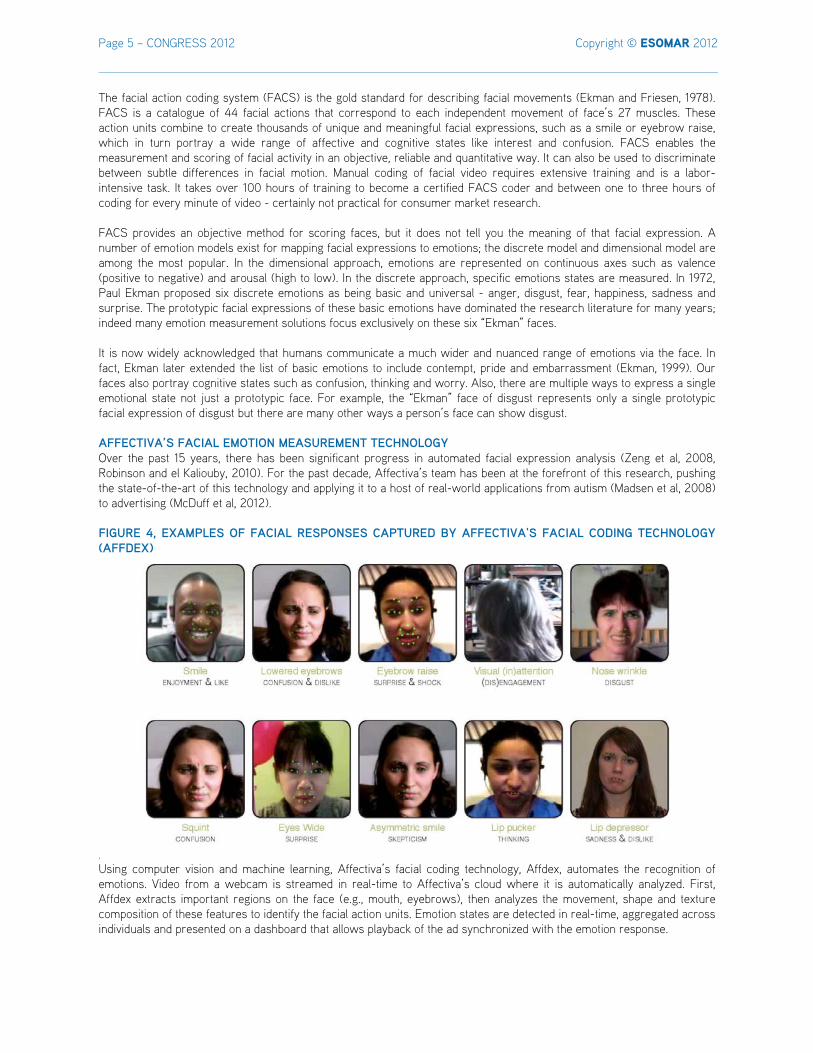
The facial action coding system (FACS) is the gold standard for describing facial movements (Ekman and Friesen, 1978). FACS is a catalogue of 44 facial actions that correspond to each independent movement of face’s 27 muscles. These action units combine to create thousands of unique and meaningful facial expressions, such as a smile or eyebrow raise, which in turn portray a wide range of affective and cognitive states like interest and confusion. FACS enables the measurement and scoring of facial activity in an objective, reliable and quantitative way. It can also be used to discriminate between subtle differences in facial motion. Manual coding of facial video requires extensive training and is a labor-intensive task. It takes over 100 hours of training to become a certified FACS coder and between one to three hours of coding for every minute of video - certainly not practical for consumer market research. FACS provides an objective method for scoring faces, but it does not tell you the meaning of that facial expression. A number of emotion models exist for mapping facial expressions to emotions; the discrete model and dimensional model are among the most popular. In the dimensional approach, emotions are represented on continuous axes such as valence (positive to negative) and arousal (high to low). In the discrete approach, specific emotions states are measured. In 1972, Paul Ekman proposed six discrete emotions as being basic and universal - anger, disgust, fear, happiness, sadness and surprise. The prototypic facial expressions of these basic emotions have dominated the research literature for many years; indeed many emotion measurement solutions focus exclusively on these six “Ekman” faces. It is now widely acknowledged that humans communicate a much wider and nuanced range of emotions via the face. In fact, Ekman later extended the list of basic emotions to include contempt, pride and embarrassment (Ekman, 1999). Our faces also portray cognitive states such as confusion, thinking and worry. Also, there are multiple ways to express a single emotional state not just a prototypic face. For example, the “Ekman” face of disgust represents only a single prototypic facial expression of disgust but there are many other ways a person’s face can show disgust. AFFECTIVA’S FACIAL EMOTION MEASUREMENT TECHNOLOGY Over the past 15 years, there has been significant progress in automated facial expression analysis (Zeng et al, 2008, Robinson and el Kaliouby, 2010). For the past decade, Affectiva’s team has been at the forefront of this research, pushing the state-of-the-art of this technology and applying it to a host of real-world applications from autism (Madsen et al, 2008) to advertising (McDuff et al, 2012). FIGURE 4, EXAMPLES OF FACIAL RESPONSES CAPTURED BY AFFECTIVA'S FACIAL CODING TECHNOLOGY (AFFDEX)
. Using computer vision and machine learning, Affectiva’s facial coding technology, Affdex, automates the recognition of emotions. Video from a webcam is streamed in real-time to Affectiva’s cloud where it is automatically analyzed. First, Affdex extracts important regions on the face (e.g., mouth, eyebrows), then analyzes the movement, shape and texture composition of these features to identify the facial action units. Emotion states are detected in real-time, aggregated across individuals and presented on a dashboard that allows playback of the ad synchronized with the emotion response.
Page 6 – CONGRESS 2012 Copyright © ESOMAR 2012
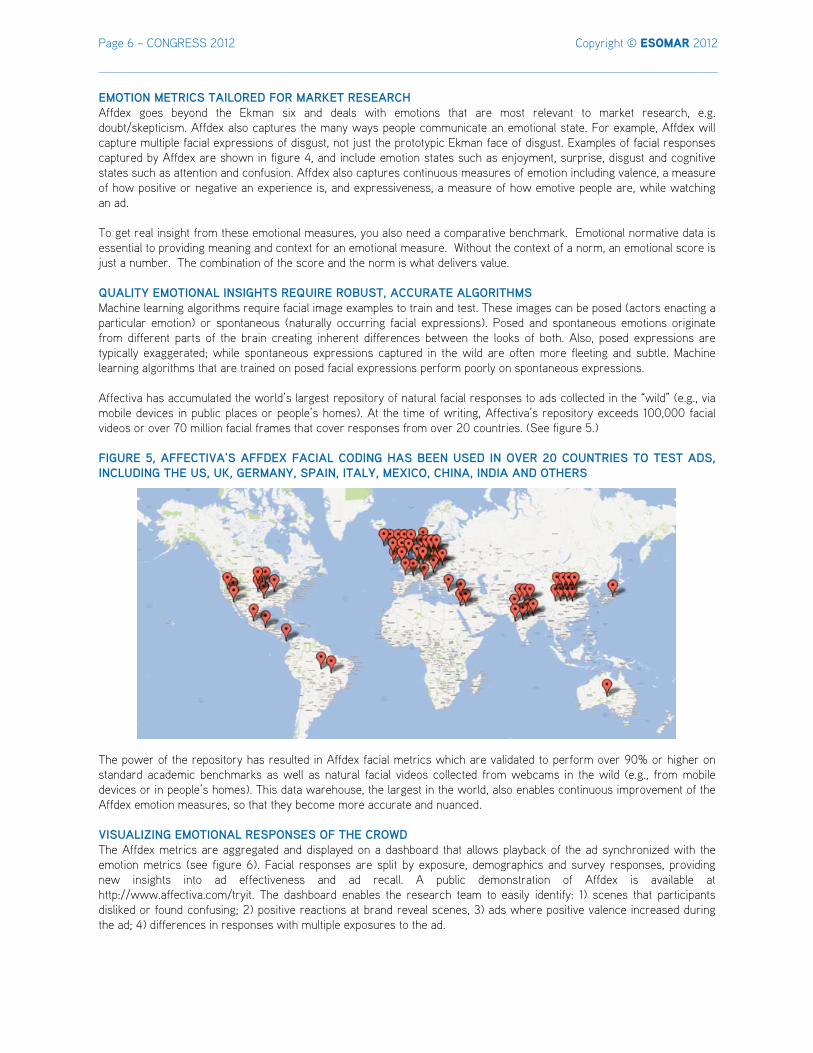
EMOTION METRICS TAILORED FOR MARKET RESEARCH Affdex goes beyond the Ekman six and deals with emotions that are most relevant to market research, e.g. doubt/skepticism. Affdex also captures the many ways people communicate an emotional state. For example, Affdex will capture multiple facial expressions of disgust, not just the prototypic Ekman face of disgust. Examples of facial responses captured by Affdex are shown in figure 4, and include emotion states such as enjoyment, surprise, disgust and cognitive states such as attention and confusion. Affdex also captures continuous measures of emotion including valence, a measure of how positive or negative an experience is, and expressiveness, a measure of how emotive people are, while watching an ad. To get real insight from these emotional measures, you also need a comparative benchmark. Emotional normative data is essential to providing meaning and context for an emotional measure. Without the context of a norm, an emotional score is just a number. The combination of the score and the norm is what delivers value. QUALITY EMOTIONAL INSIGHTS REQUIRE ROBUST, ACCURATE ALGORITHMS Machine learning algorithms require facial image examples to train and test. These images can be posed (actors enacting a particular emotion) or spontaneous (naturally occurring facial expressions). Posed and spontaneous emotions originate from different parts of the brain creating inherent differences between the looks of both. Also, posed expressions are typically exaggerated; while spontaneous expressions captured in the wild are often more fleeting and subtle. Machine learning algorithms that are trained on posed facial expressions perform poorly on spontaneous expressions. Affectiva has accumulated the world’s largest repository of natural facial responses to ads collected in the “wild” (e.g., via mobile devices in public places or people’s homes). At the time of writing, Affectiva’s repository exceeds 100,000 facial videos or over 70 million facial frames that cover responses from over 20 countries. (See figure 5.) FIGURE 5, AFFECTIVA'S AFFDEX FACIAL CODING HAS BEEN USED IN OVER 20 COUNTRIES TO TEST ADS, INCLUDING THE US, UK, GERMANY, SPAIN, ITALY, MEXICO, CHINA, INDIA AND OTHERS
The power of the repository has resulted in Affdex facial metrics which are validated to perform over 90% or higher on standard academic benchmarks as well as natural facial videos collected from webcams in the wild (e.g., from mobile devices or in people’s homes). This data warehouse, the largest in the world, also enables continuous improvement of the Affdex emotion measures, so that they become more accurate and nuanced. VISUALIZING EMOTIONAL RESPONSES OF THE CROWD The Affdex metrics are aggregated and displayed on a dashboard that allows playback of the ad synchronized with the emotion metrics (see figure 6). Facial responses are split by exposure, demographics and survey responses, providing new insights into ad effectiveness and ad recall. A public demonstration of Affdex is available at http://www.affectiva.com/tryit. The dashboard enables the research team to easily identify: 1) scenes that participants disliked or found confusing; 2) positive reactions at brand reveal scenes, 3) ads where positive valence increased during the ad; 4) differences in responses with multiple exposures to the ad.

Page 7 – CONGRESS 2012 Copyright © ESOMAR 2012
FIGURE 6, WEB-BASED DASHBOARD ENABLES REAL-TIME EXPLORATION OF MOMENT-BY-MOMENT EMOTION RESPONSES BROKEN DOWN BY GENDER, AGE, CITY AND OTHER SELF-REPORTED MEASURES SUCH AS USAGE
PILOTING A NEW METHODOLOGY & TECHNOLOGY IN INDIA To test the feasibility of capturing recall and emotion responses using a mobile device, we conducted a pilot study in India, which was funded by Millward Brown. Using the process depicted in figure 7, we tested the response of 300 participants to six ads in the beverage category across two cities in India: Hyderabad and Delhi, for a total of 1800 facial videos and self-reported responses. FIGURE 7, THE INTERVIEWING, DATA COLLECTION AND DATA PROCESSING WORKFLOW
Interviewers first asked participants if they were willing to share their facial responses (in this particular pilot, we asked for permission to publicly share the facial videos). Interviewers then gave participants a mobile device to hold, on which they watched ads while the phone’s forward facing camera captured the participants' facial expressions. After viewing each ad, they were asked three questions on the mobile device: “Do you remember seeing this ad on TV before?”, “How
Recruit Respondents in
the Street Show Respondents the Ad Content via Nokia Mobile
Phone & Capture Emotions & Responses to
Survey Questions
Upload Data to Affdex & Process Emotional Scores
Analyze Video in Background
Marry Ad Recall Data with Emotional
Impact Data on Lumi System
Deliver Data to Client within Hours of Tests

Page 8 – CONGRESS 2012 Copyright © ESOMAR 2012
much would you enjoy seeing this advert each time you see it on TV?”, “How much do you remember this seeing this ad before”. The face video was time-code synced with the ad being played and stored on the device. At the end of the day, the interviewer uploaded facial videos to the Lumi system, along with the self-report responses. Once on Lumi’s system, the facial videos were then sent to Affectiva’s Affdex platform for processing in the cloud (see figure 8). All this is done automatically, without any need for manual intervention. FIGURE 8, INTEGRATING MOBILE DATA COLLECTION WITH FACIAL CODING WITH AFFDEX-LUMI
In line with a minimalist approach focusing only on key objectives, we identified exactly three objectives of the pilot – all of which were successfully met. Objective 1: Is the facial video quality from a mobile device good enough? One of the primary goals of the pilot was to determine the feasibility of capturing facial video from a mobile device with sufficient quality to be processed by Affdex. Our initial tests yielded videos that did not have sufficient face coverage to be accurately tracked; less than 50% of the videos were usable by Affdex. Figure 9 shows the main reasons for the low quality, including poor framing with the camera view, poor lighting and occluded faces. We thus had to iterate with the interviewers on the ground to ensure that we got better quality videos. After several iterations (shown in figure 10), we were able to get to over 90% of usable videos. We compiled a checklist of best practices that we shared with interviewers to ensure high quality facial videos moving forward. FIGURE 9
One of the main technical challenges of the Lumi-Affectiva pilot was helping the participants properly framing their faces into the camera view. The main problems included non-frontal poses, lighting and multiple faces in the frames, cropped faces, etc.

Page 9 – CONGRESS 2012 Copyright © ESOMAR 2012
FIGURE 10
(Left) acceptable facial responses in Delhi (Hindi) vs. (Telugu); (Right) the iterations we went through going from less than 50% usable facial videos to over 90%. Objective 2: Will people emote in response to the ads? Our next objective was to validate that the participants where indeed “emoting” while watching the ads on a mobile device, and that Affdex is able to accurately capture these facial expressions. Figure 11 shows the range of facial expressions we observed in response to the ads and which led us to conclude such validation was possible. FIGURE 11
After several iterations, we went from only 20% of the facial videos being usable to over 90% inclusion rate. We were also able to demonstrate a range of facial expressions, from expressions of enjoyment to surprise, disgust and confusion. Note that how the videos were often taken outdoors, or in people's homes with variable lighting. Also note that all participants gave permission to share their face publicly. Objective 3: Will the aggregated dashboard provide meaningful insights on the participants’ emotional responses to the ads? The intent of this objective was to demonstrate the aggregated responses on a dashboard to enable the comparison of results to the existing methodologies used to measure emotional responses alongside their rates of ad recall. One of the cool things about this approach is that the combined Lumi-Affectiva platform provides fast turnaround of data, without the need for manual intervention. The dashboard resulting from this pilot is available at: http://labs.affectiva.com/mblumi. We demonstrated that we were able to achieve an accurate and actionable measure of emotional responses to advertising as delivered through mobile devices. We were also able to demonstrate how different ages, genders, ethnicities and other variables affected responses. (See figure 12.) One question that research agencies and brands have is whether different demographics respond in the same way to the ads. In our case, the Millward Brown client services teams were curious whether the two cities respond in the same way to the different ads. We demonstrated, at a scene-by-scene level, clearly different responses to the same ads, which was not captured at the self-report level.

Page 10 – CONGRESS 2012 Copyright © ESOMAR 2012
FIGURE 12
Participants in Hyderabad (shown in green) found a scene funny whereas participants in Delhi didn’t (shown in blue). Figure 13 shows the Telugu-speaking participants’ smiles peaking when the motorcycle driver follows the truck and shouts at the passenger. In contrast (figure 14) many Hindi-speaking participants smiled when the passenger advised the motorcycle driver to calm down and drink 7 Up instead of taking risks. Such data allows for ad optimization per demographic or location. We also able to generate a “face-finder” view, which synchronizes the face with the ads and the aggregated emotion metrics brings the data to life by show natural responses to the ads. FIGURE 13
Contrary to the previous example, participants in Delhi found the motorcyclist scene very funny, while participants in Hyderabad didn’t.

Page 11 – CONGRESS 2012 Copyright © ESOMAR 2012
We also measured the “expressiveness”, or the overall magnitude and intensity of facial expressions observed during the ads. The more emotive an ad, the more likely it is to be effective, especially if it is designed to elicit emotional responses. For example, we flagged the low expressiveness response of the Pepsi ad, which was clearly lower than the rest of the ads we tested in this pilot. (See figure 14.) The dashboard also supports a segmented analysis of the emotion metrics by integrating the self-reported questions, such as recall. In some cases we observed that participants who recalled an ad, responded to some of the scenes earlier than those participants who were seeing it for the first time. This points to potential implicit measure of recall, which would be incredibly powerful in ad testing and tracking. FIGURE 14, OVERALL EXPRESSIVENESS, OR THE AMOUNT AND INTENSITY OF FACIAL EXPRESSIONS OBSERVED IN RESPONSE TO THE AD, FOR EACH OF THE SIX ADS TESTED
CONCLUSIONS AND FUTURE DIRECTIONS This paper demonstrated the power of using mobile devices in advertising testing and tracking to improve the reach and accuracy of these studies -- across borders, gender, age and more. Our key learnings included the following: We showed that a minimum viable product approach works and enabled us to take an idea to market fast. Mobile allows you to play – embrace the opportunity for change rather than try to just adapt your existing
methodologies to the new technology. Measuring emotions with facial coding is now possible on mobile devices, is unobtrusive and scalable while bypassing
cognitive biases in responses. Facial coding gave a moment-by-moment analysis of scenes that elicited an emotional response, as well as yielded
ad-level insights into ad effectiveness. Where do we go from here? The real power of mobile-enabled research is that we are able to take full advantage of the ubiquity and the incredible richness of functionality available in today’s “smartphones.” Affectiva and Lumi integrated mobile platforms with emotion measurement technology. With this, we are stepping into the realm of behavioral market research. We believe that there will be even more possibility when we merge active research tools, emotional measurement, and other passive behavioral measurement tools created by Lumi’s sister company RealityMine. With the RealityMine technology we can measure consumer activity through and around their mobile devices and as a result we can understand the context in which people are being exposed to these ads we can measure, and the emotional impact it is making, to more fully evaluate the impact of marketing and the subsequent changes in consumer behavior in the short and long term
Page 12 – CONGRESS 2012 Copyright © ESOMAR 2012
The heart of the opportunity is we can now begin to truly understand the context of someone’s decision-making. Imagine we are following someone through a path to purchase. We can see how they are feeling at the time they are experiencing an ad at home, or what they are feeling at the moment of truth at the shelf when they actually have to make a purchasing decision. We can see from their mobile devices the kinds of data they were seeking or sharing as they find their way to the store, and while they are at the store. We can see what choices they have and what alternatives they are exploring. Our approach fused together several innovative technologies to provide a new research methodology and a viable, scalable ad testing and tracking solution for global markets. Our approach to test and scale can be replicated. Our research methodology can be easily generalized to other markets and points to the kinds of new opportunities and methodologies that we can look to come to market in the coming months and years. ACKNOWLEDGEMENTS Guy Rolfe, the Mobile Practice Leader at Kantar Operations and the head of the InTouch initiative, funded the pilots presented in this paper. Pratyush Sinha oversaw the Millward Brown team pilot in India. Graham Page provided helpful input on the design of the pilot. Scott Spence provided support throughout the mobile piloting process. FOOTNOTES 1. http://www.guardian.co.uk/technology/2010/jan/08/stuart-jeffries-camera-phones 2. http://www.infotrends.com/public/Content/Press/2008/07.29.2008.html REFERENCES T. Ambler and T. Burne (1999), “The impact of affect on memory of advertising,” Journal of Advertising Research, vol. 39, pp. 25–34. P. Ekman and W.V. Friesen (1977), Facial Action Coding System, Consulting Psychologist Press.
P. Ekman, (1999), "Basic Emotions", in Dalgleish, T; Power, M, Handbook of Cognition and Emotion, Sussex, UK: John Wiley & Sons. R. Hazlett and S. Hazlett (1999), "Emotional response to television commercials: Facial EMG vs. self-report." Journal of Advertising Research 39(2): 7-23. M. Madsen, R. el Kaliouby, M. Goodwin and R.W. Picard (2008), "Technology for Just-In-Time In-Situ Learning of Facial Affect for Persons Diagnosed with an Autism Spectrum Disorder," Proceedings of the 10th ACM Conference on Computers and Accessibility (ASSETS) , October 13-15, Halifax, Canada. M. Meeker (2012), All Things Digital Conference: http://tinyurl.com/c8eqp4t D.J. McDuff, el Kaliouby, R., Picard, R. W. (2012), “Crowdsourcing Facial Responses to Online Videos", IEEE Transactions on Affective Computing.
E. Rees (2011), “The Lean Startup: How Today’s Entrepreneurs Use Continuous Innovation to Create Radically Successful Businesses”, W.E. Rinn, (1984), The neuropsychology of facial expression: A review of the neurological and psychological mechanisms for producing facial expressions. Psychological Bulletin, 95:52-77. P. Robinson and R. el Kaliouby (2009), Computation of Emotion in Man and Machines. Philosophical Transactions of The Royal Society series B - Biological Sciences, 364 (1535), 3439=3604. London, UK: The Royal Society.
Z. Zeng, M. Pantic, et al. (2008), "A survey of affect recognition methods: Audio, visual, and spontaneous expressions." IEEE transactions on pattern analysis and machine intelligence: 39-58. THE AUTHORS Rolfe Swinton is co-CEO of RealityMine, co-founder of Lumi Mobile, and Adjunct Professor of Entrepreneurship at INSEAD, United Kingdom. Rana el Kaliouby is co-founder and Chief Technology Officer at Affectiva, and Research Scientist at MIT Media Lab, United States.