measurement systems
DESCRIPTION
Measurement SystemsTRANSCRIPT
Measurement Systems
• A system can be defined as an arrangement
of parts within some boundary which work
together to provide some form of output
from a specified input or inputs.
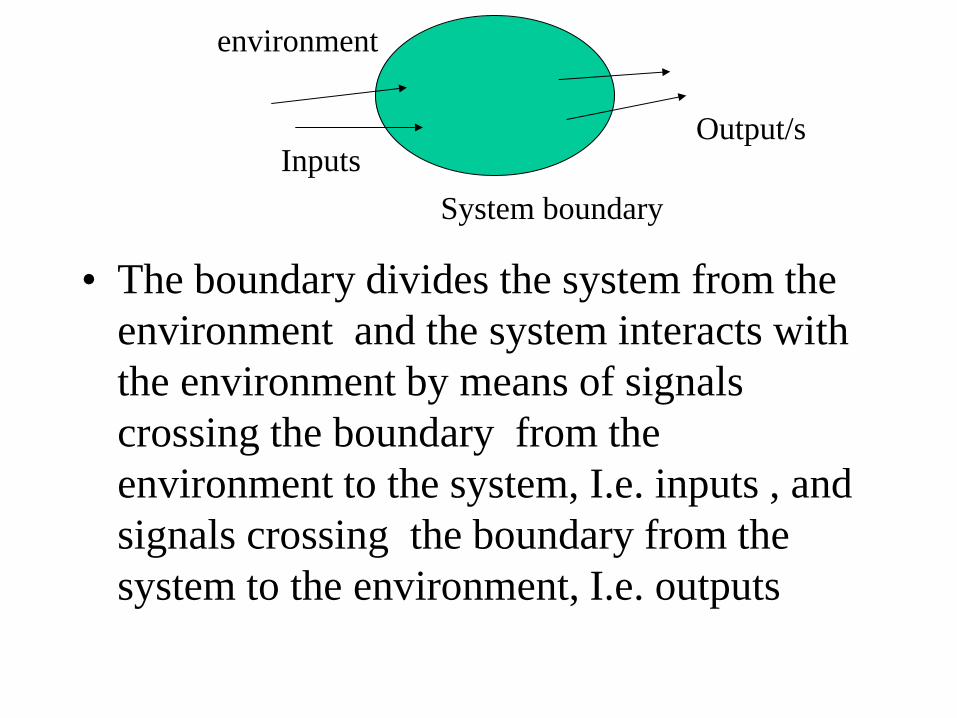
• The boundary divides the system from the
environment and the system interacts with
the environment by means of signals
crossing the boundary from the
environment to the system, I.e. inputs , and
signals crossing the boundary from the
system to the environment, I.e. outputs
Inputs Output/s
System boundary
environment
• A useful way of representing a system is as
a block diagram. Ex.
– Motor system
– Amplifier system
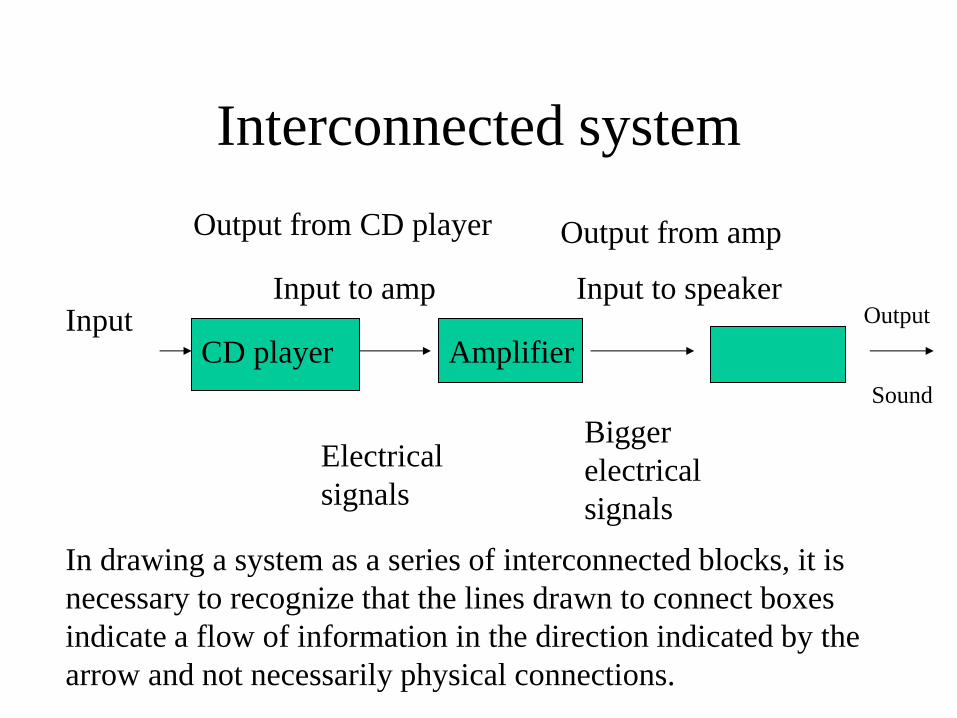
Interconnected system
CD player Amplifier
Output
Sound
Output from amp
Input to speaker
Bigger
electrical
signals
Electrical
signals
Output from CD player
Input to amp Input
In drawing a system as a series of interconnected blocks, it is
necessary to recognize that the lines drawn to connect boxes
indicate a flow of information in the direction indicated by the
arrow and not necessarily physical connections.
• The purpose of an instrumentation system
used for making measurements is to give
the user a numerical value corresponding to
the variable being measured.
• An instrumentation system for making
measurements has an input of the true value
of the variable being measured and an
output of the measured value.
Failure to measure effectively the level of
liquid in bottom of the tower lead to
--- Fire
--- Explosion
Importance of effective measurement in process
industry
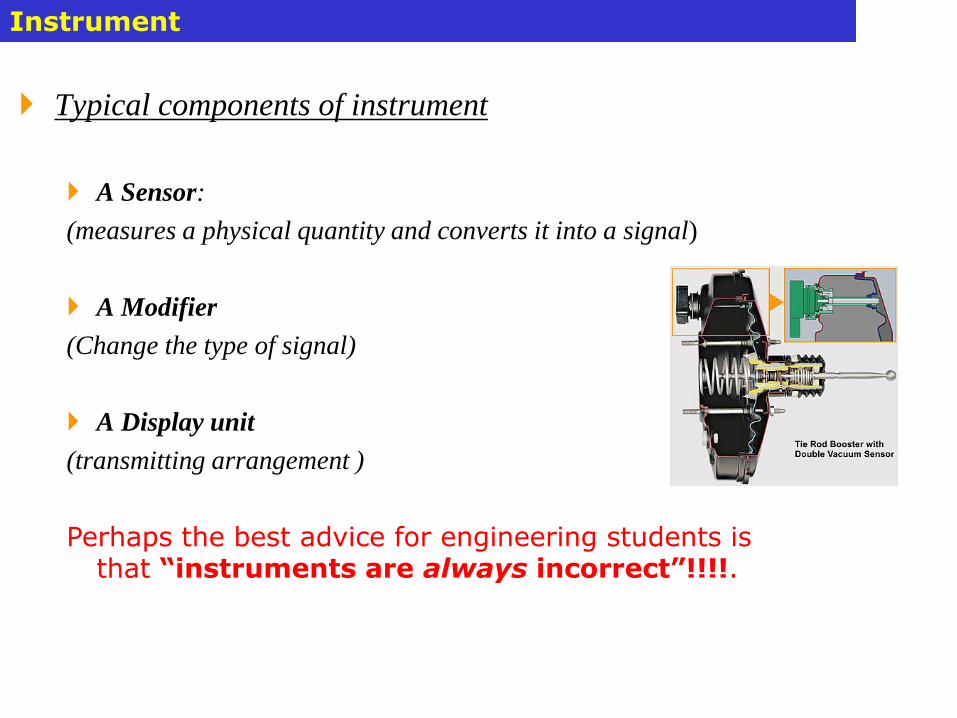
Instrument
Typical components of instrument
A Sensor:
(measures a physical quantity and converts it into a signal)
A Modifier
(Change the type of signal)
A Display unit
(transmitting arrangement )
Perhaps the best advice for engineering students is that “instruments are always incorrect”!!!!.
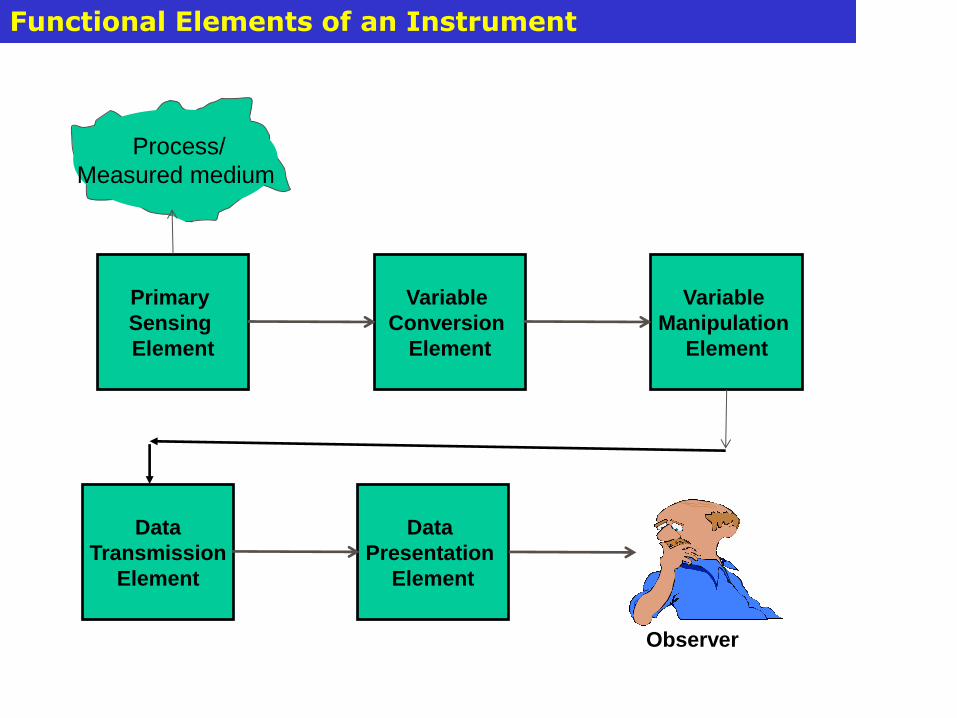
Functional Elements of an Instrument
Process/
Measured medium
Primary
Sensing
Element
Variable
Conversion
Element
Variable
Manipulation
Element
Data
Transmission
Element
Data
Presentation
Element
Observer
Functional Elements of an Instrument (Cont‘d)
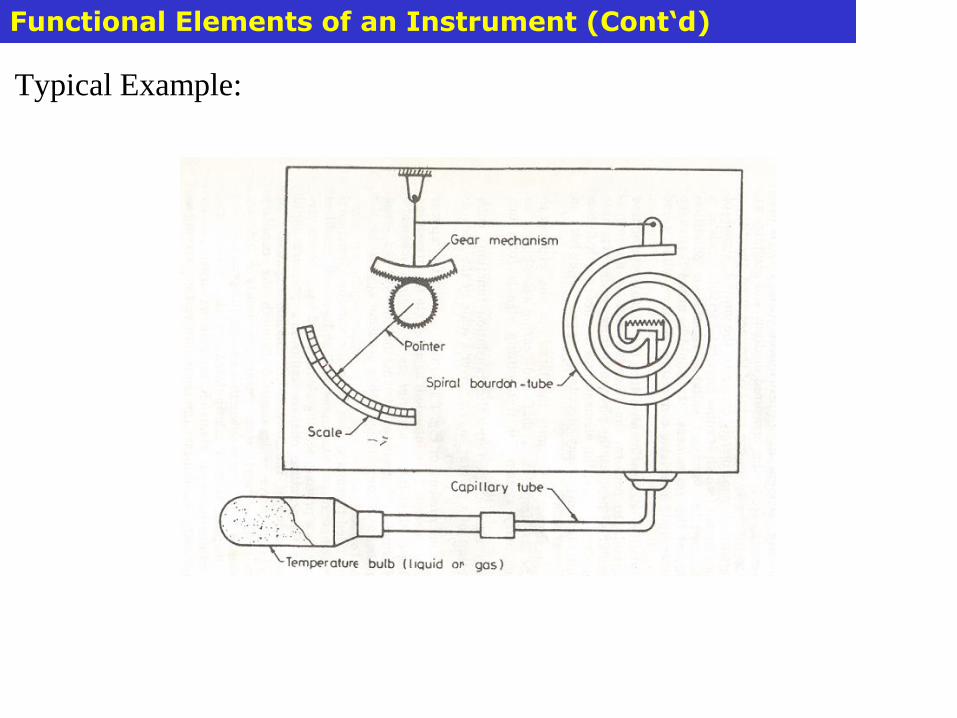
Typical Example:
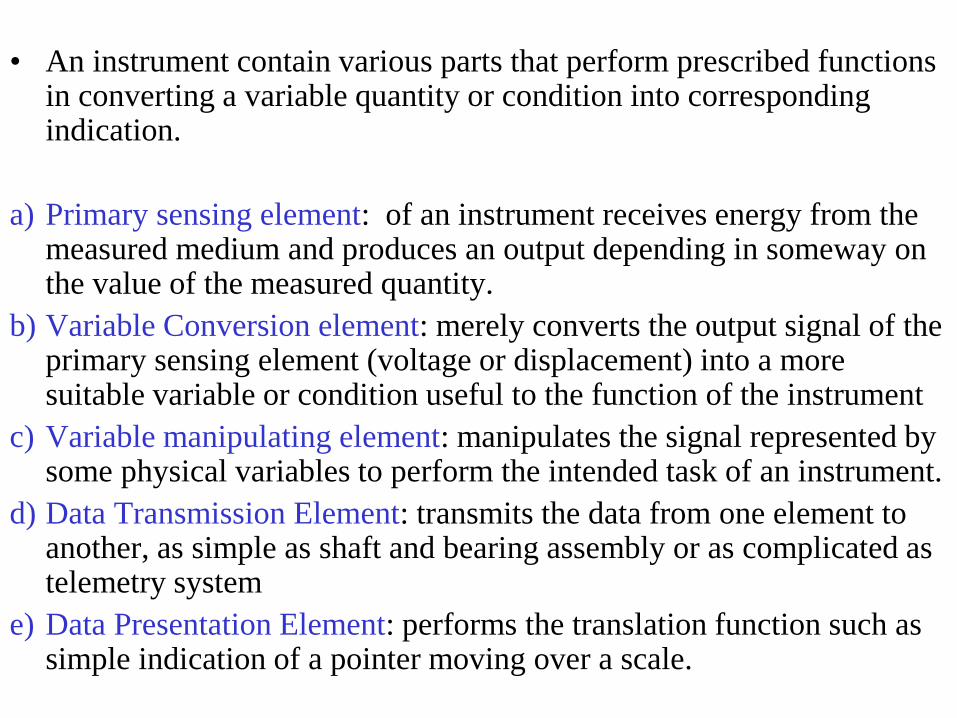
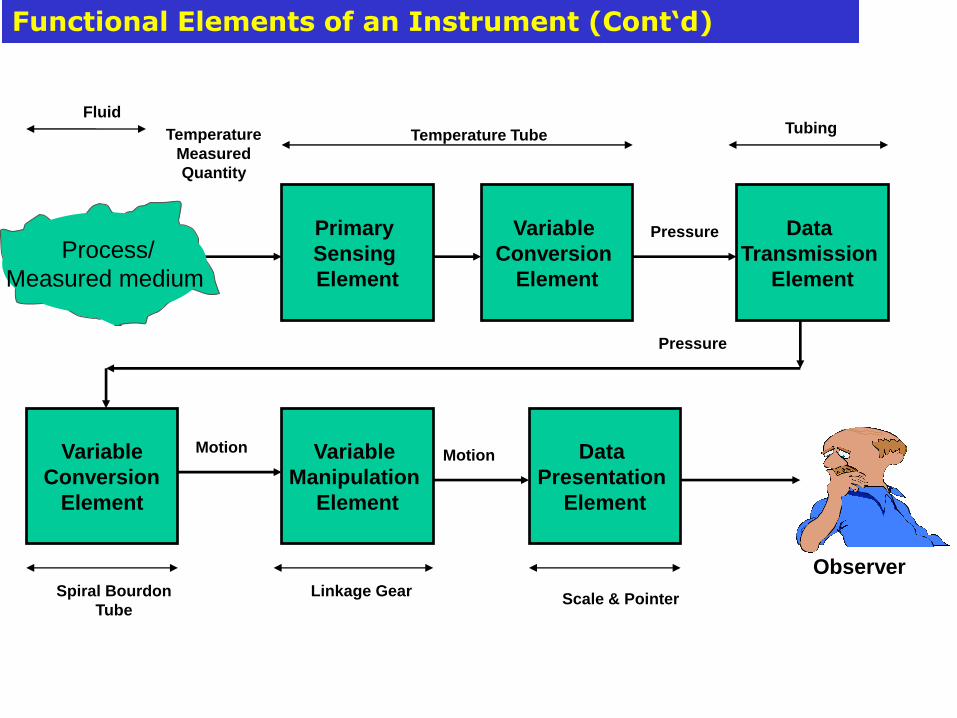
• An instrument contain various parts that perform prescribed functions in converting a variable quantity or condition into corresponding indication.
a) Primary sensing element: of an instrument receives energy from the measured medium and produces an output depending in someway on the value of the measured quantity.
b) Variable Conversion element: merely converts the output signal of the primary sensing element (voltage or displacement) into a more suitable variable or condition useful to the function of the instrument
c) Variable manipulating element: manipulates the signal represented by some physical variables to perform the intended task of an instrument.
d) Data Transmission Element: transmits the data from one element to another, as simple as shaft and bearing assembly or as complicated as telemetry system
e) Data Presentation Element: performs the translation function such as simple indication of a pointer moving over a scale.
Primary
Sensing
Element
Variable
Conversion
Element
Data
Transmission
Element
Variable
Manipulation
Element
Data
Presentation
Element
Temperature
Measured
Quantity
Pressure
Variable
Conversion
Element
Pressure
Motion Motion
Fluid
Temperature Tube Tubing
Spiral Bourdon
Tube
Linkage Gear Scale & Pointer
Functional Elements of an Instrument (Cont‘d)
Observer
Process/
Measured medium
Static characteristics
Dynamic characteristics
Performance Characteristics of Instruments
• The performance characteristics of an instrument are very necessary for choosing the most suitable instrument for specific measuring task.
• Static Characteristics: considered for instruments used to measure an unvarying process conditions
• Dynamic Characteristics: for measuring quantities that fluctuates with time.
• The relative importance of each issue depends upon the specific application; for
example, one application might require excellent accuracy, while another might require only moderate accuracy, but high reliability.
• Generally, we find that the greater the requirements for good performance, the higher the cost for purchase and maintenance. Therefore, we must find the proper balance of performance and cost, rather than always specify the best performing sensor
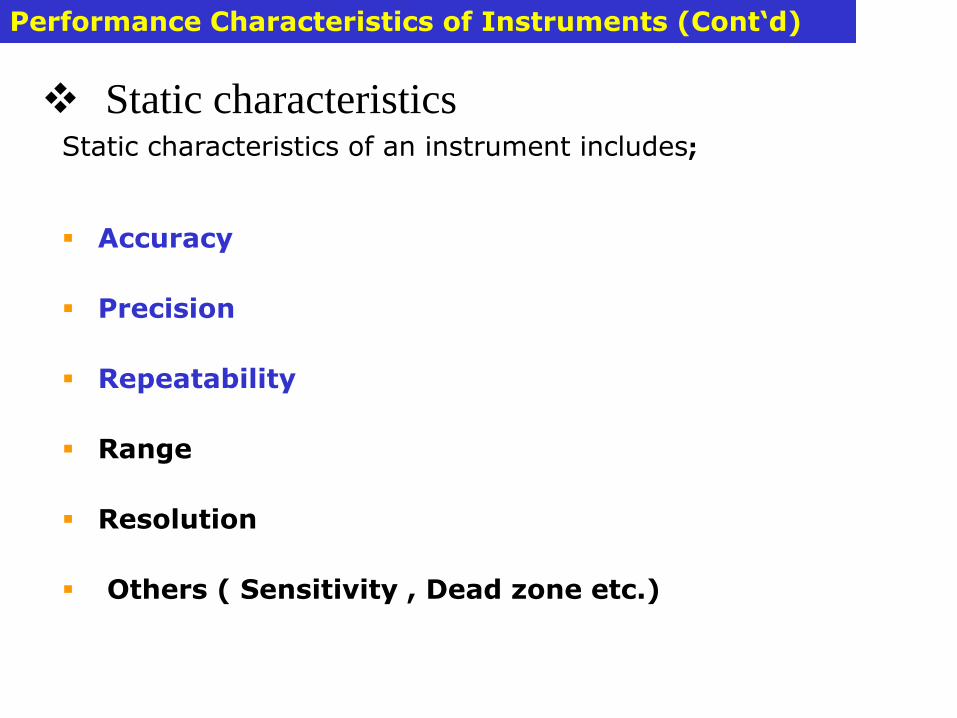
Static characteristics
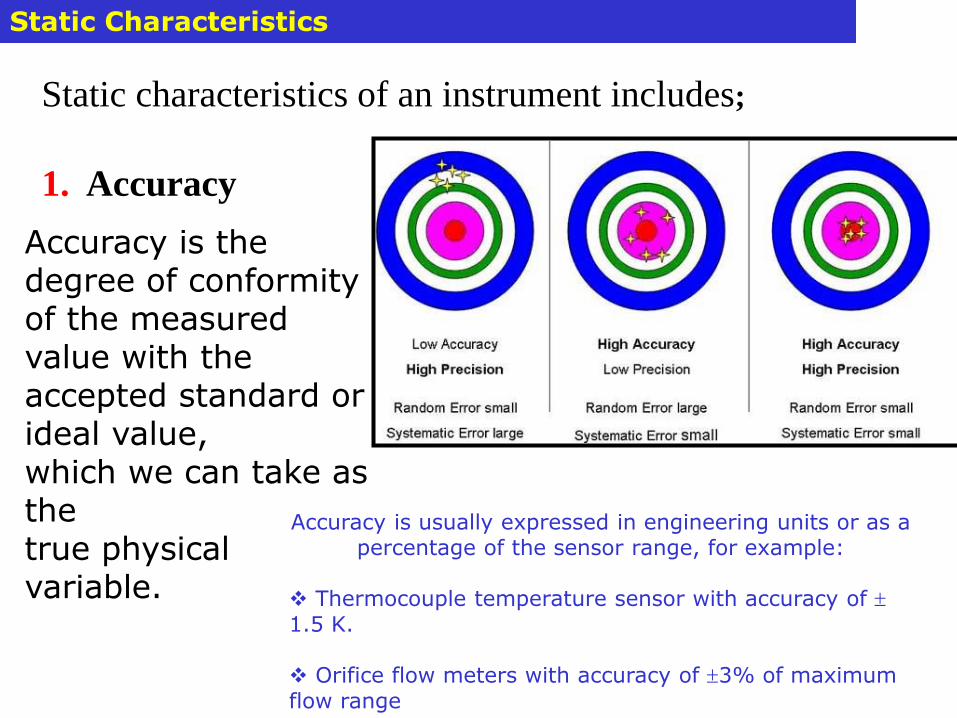
Static characteristics of an instrument includes;
Accuracy
Precision
Repeatability
Range
Resolution
Others ( Sensitivity , Dead zone etc.)
Performance Characteristics of Instruments (Cont‘d)
Elements of an instrumentation
system
• 1. Sensor – element which is effectively in
contact with the process for which a
variable is being measured and gives an
output which depends in some way on the
value of the variable and which can be used
by the rest of the measurement system to
give a value to it.
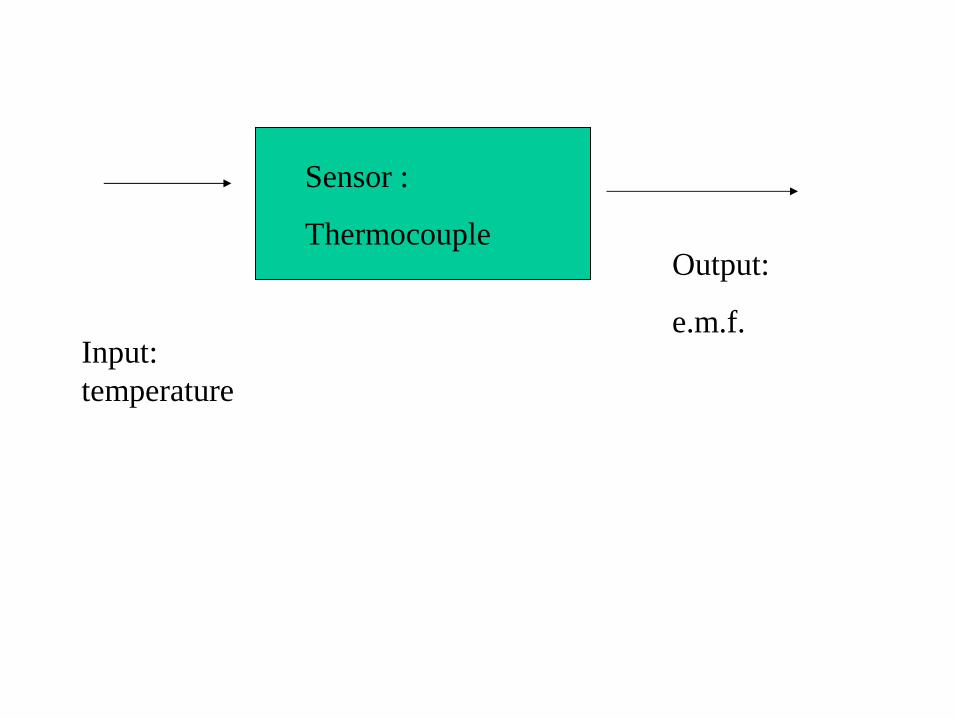
Input:
temperature
Sensor :
Thermocouple Output:
e.m.f.
• 2. Signal Processor
• This element takes the output from the sensor and
converts it into a form which is suitable for
display or onward transmission in some control
system.
• The term signal conditioner is used for an element
which converts the output of a sensor into a
suitable form for further processing
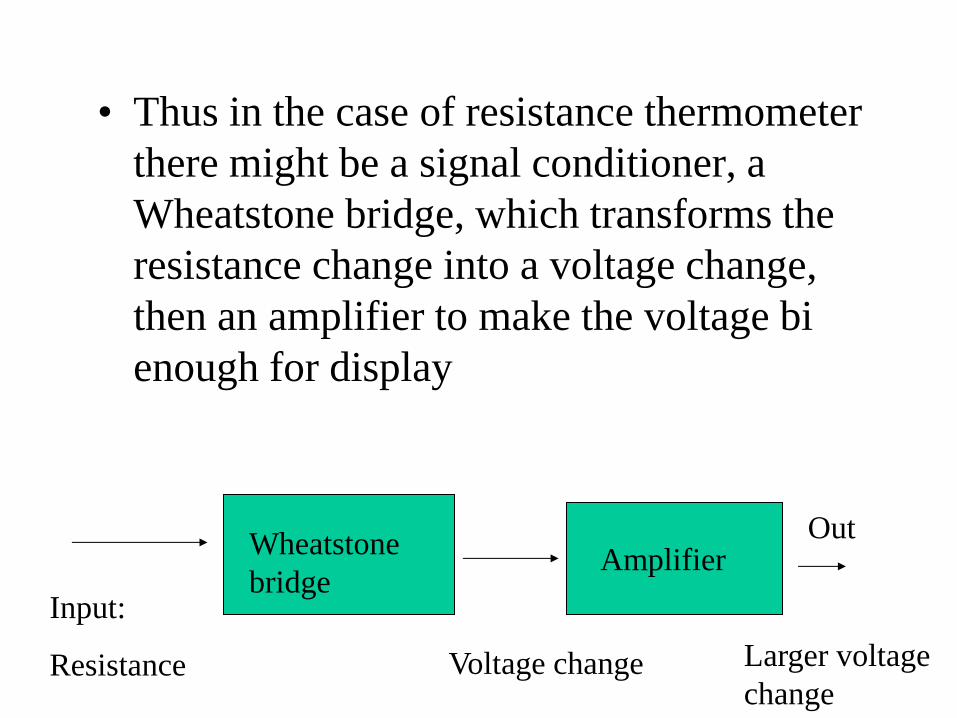
• Thus in the case of resistance thermometer
there might be a signal conditioner, a
Wheatstone bridge, which transforms the
resistance change into a voltage change,
then an amplifier to make the voltage bi
enough for display
Input:
Resistance
Wheatstone
bridge
Voltage change
Amplifier Out
Larger voltage
change
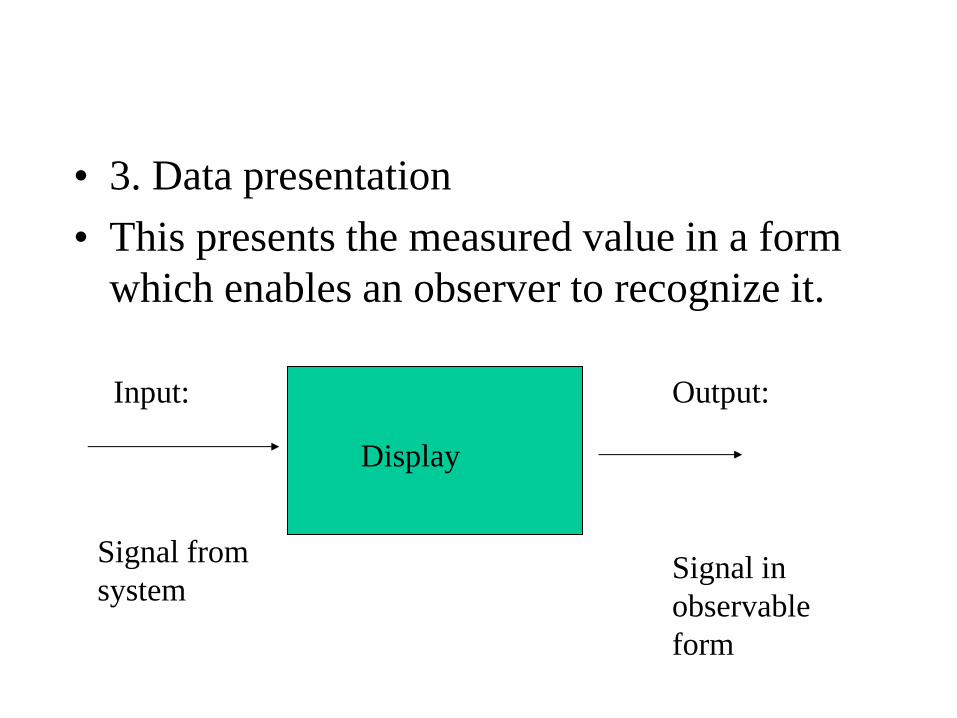
• 3. Data presentation
• This presents the measured value in a form
which enables an observer to recognize it.
Display
Input:
Signal from
system
Output:
Signal in
observable
form
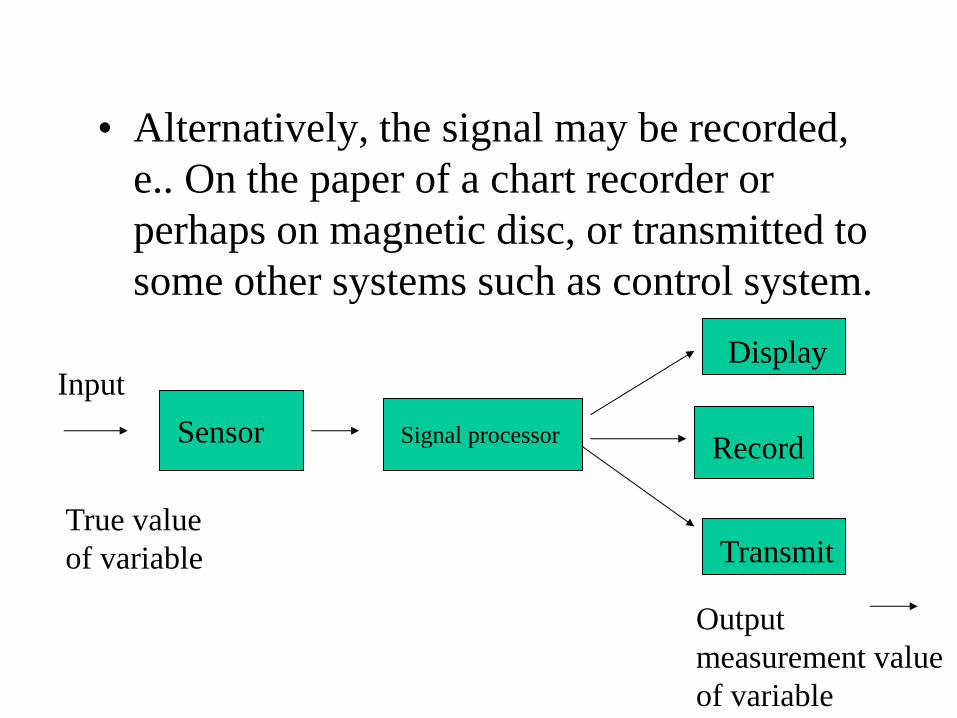
• Alternatively, the signal may be recorded,
e.. On the paper of a chart recorder or
perhaps on magnetic disc, or transmitted to
some other systems such as control system.
Sensor Signal processor
Input
True value
of variable
Display
Record
Transmit
Output
measurement value
of variable
• Transducers are defined as an element that
converts a change in some physical variable into a
related change in some other physical variable.
• It is generally used for an element that converts a
change in some physical variable into an
electrical signal change.
• A measurement system may use transducers, in
addition to the sensor, in other parts of the system
to convert signals in one form to another form.
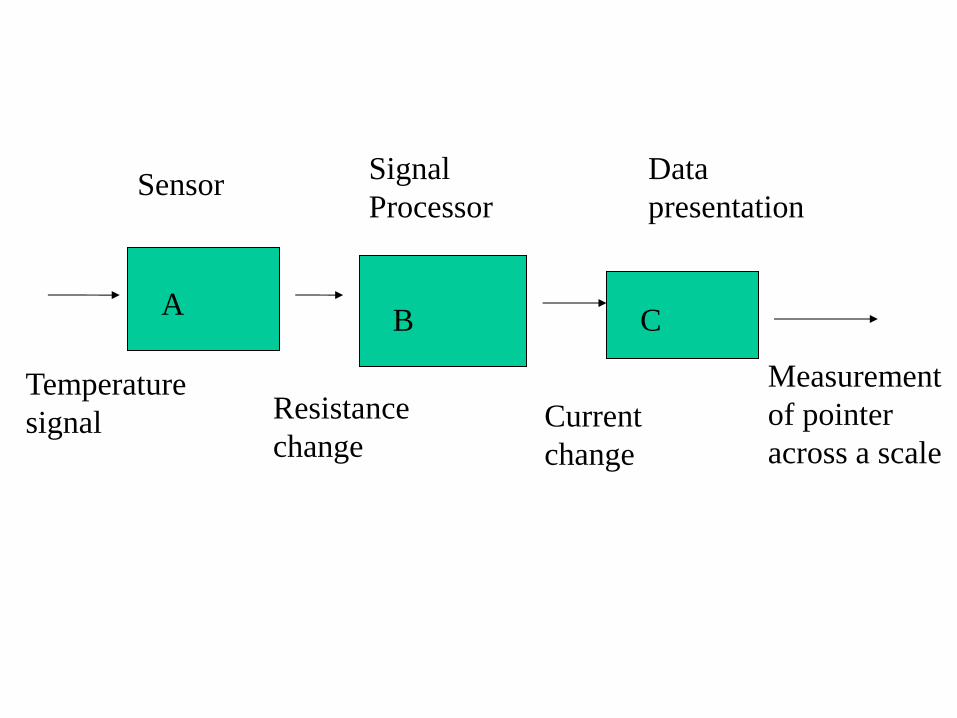
Sensor
A B C
Signal
Processor
Data
presentation
Temperature
signal Resistance
change Current
change
Measurement
of pointer
across a scale
Static characteristics of an instrument includes;
1. Accuracy
Static Characteristics
Accuracy is the degree of conformity of the measured value with the accepted standard or ideal value, which we can take as the true physical variable.
Accuracy is usually expressed in engineering units or as a percentage of the sensor range, for example:
Thermocouple temperature sensor with accuracy of 1.5 K. Orifice flow meters with accuracy of 3% of maximum flow range
• Conditions:
– the same measurement procedure
– the same observer
– the same measuring instrument, used under the
same conditions
– the same location
– repetition over a short period of time.
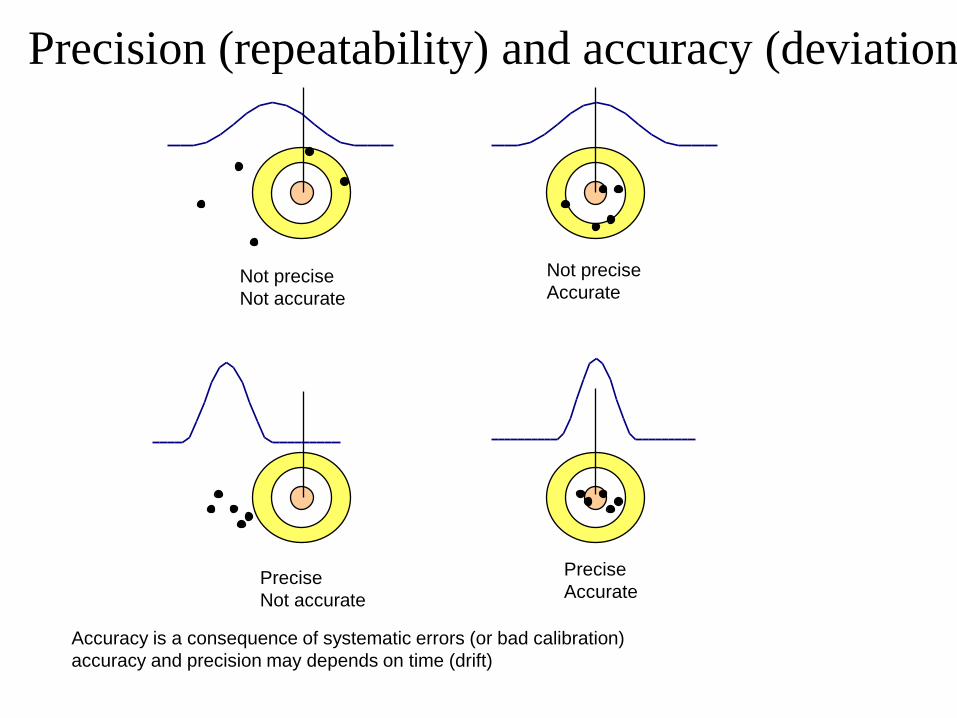
Precision (repeatability) and accuracy (deviation)
Not precise
Not accurate
Not precise
Accurate
Precise
Not accurate
Precise
Accurate
Accuracy is a consequence of systematic errors (or bad calibration)
accuracy and precision may depends on time (drift)
Resolution and accuracy • Resolution expresses how many different levels can be
distinguished
• It is not related to accuracy
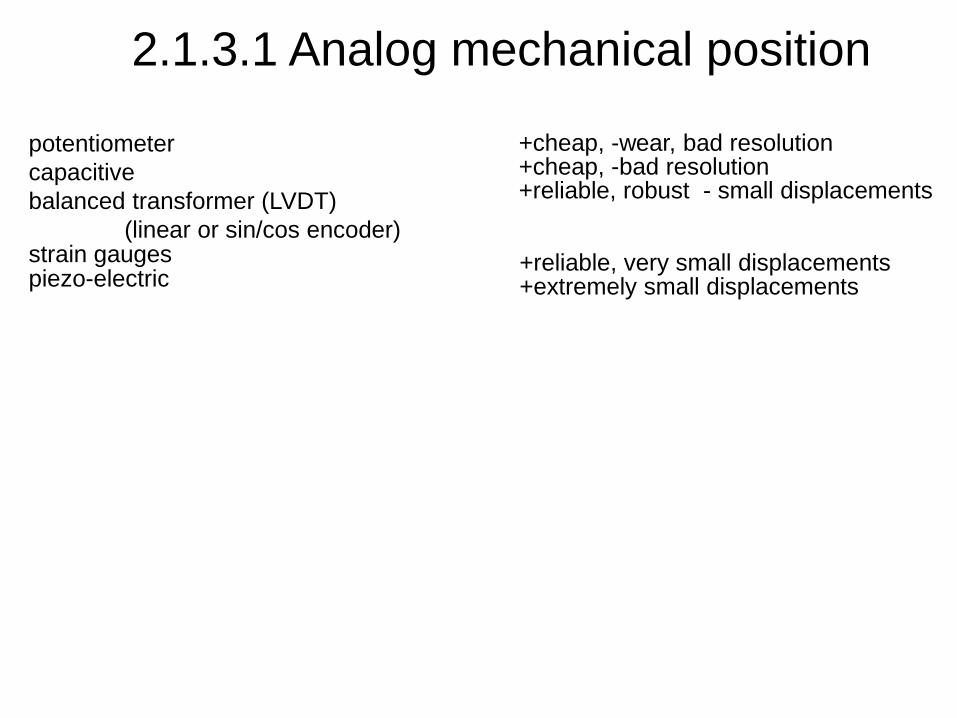
2.1.3.1 Analog mechanical position
potentiometer
capacitive
balanced transformer (LVDT)
(linear or sin/cos encoder) strain gauges piezo-electric
+cheap, -wear, bad resolution +cheap, -bad resolution +reliable, robust - small displacements
+reliable, very small displacements +extremely small displacements
Static Characteristics
• Accuracy is the extent to which the value
indicated by a measurement system or
element might be wrong.
• Accuracy is often expressed as a percentage
of the full range output or full-scale
deflection (f.s.d.)
• For example, a digital thermometer may
have an accuracy of ±0.1oC.
• Is quoted in its specification as :
– Full scale accuracy – better than 2%
• For example, a system might have an
accuracy of ±1% of f.s.d.
• If the full-scale deflection is, say, 10A, then
the accuracy is ±0.1 A.
• Accuracy is the indicator of how close the
value given by a measurement system can
be expected to be to the true value.
• The accuracy is a summation of all the
possible errors that are likely to occur, as
well as the accuracy to which the system or
element has been calibrated.
• Accuracy is needed for some variables, such
as product quality, but it is not required for
others such as level in a large storage tank.
Static characteristics of an instrument includes;
2. Precision
Static Characteristics
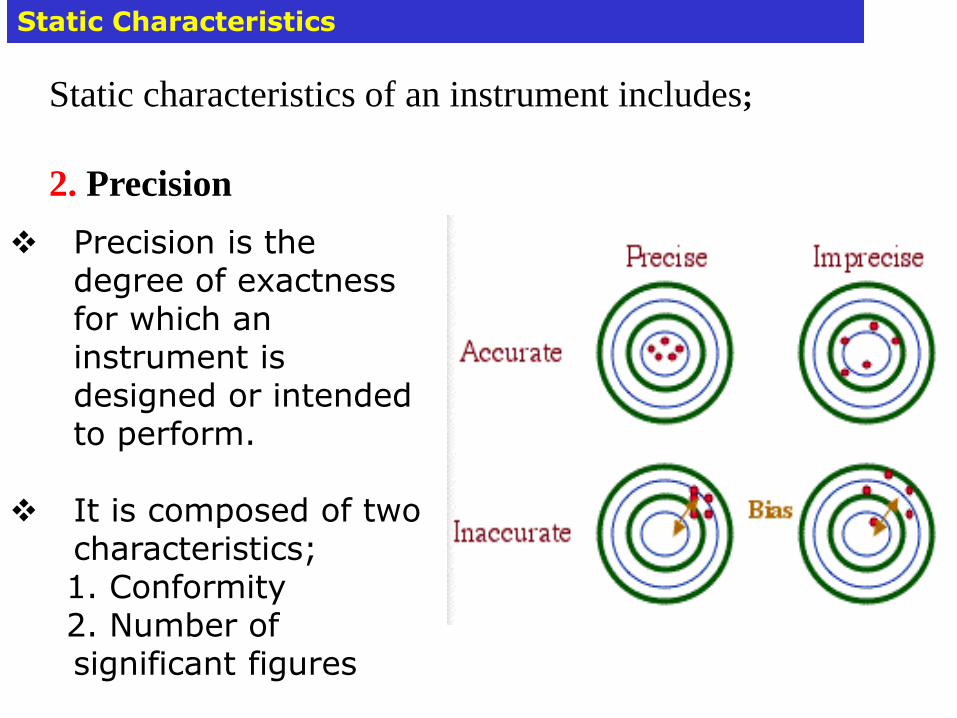
Precision is the degree of exactness for which an instrument is designed or intended to perform.
It is composed of two
characteristics; 1. Conformity 2. Number of
significant figures
• The term precision is used to describe the
degree of freedom of a measurement system
from random errors.
• Thus, a high precision measurement
instrument will give only a small spread of
readings if repeated readings are taken of
the same quantity.
• A low precision measurement system will
give a large spread of readings.
• For example consider the following two sets
of readings obtained for repeated
measurements of the same quantity by two
different instruments: • 20.1mm,20.2mm,20.1mm, 20.0mm,20.1mm,20.1mm,20.0mm
• 19.9mm,20.3mm,20.0mm,20.5mm,20.2mm,19.8mm,20.3mm
• The results of the measurement give values
scattered about some value. The first set of
results shows a smaller spread of readings
than the second and indicates a higher
degree of precision for the instrument used
for the first set.
Static characteristics of an instrument includes;
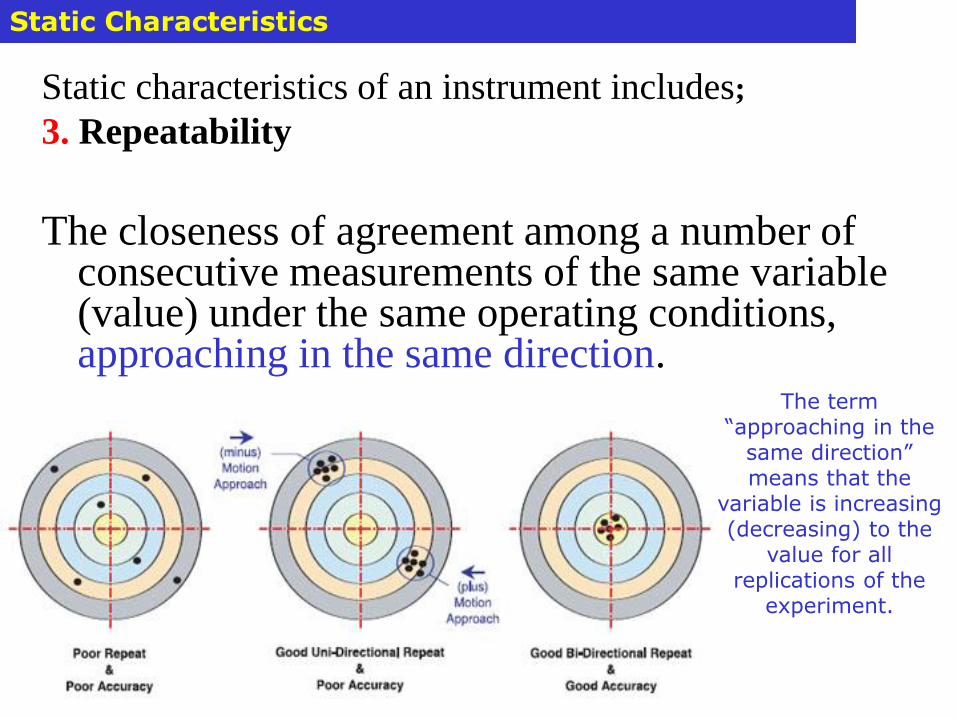
3. Repeatability
The closeness of agreement among a number of consecutive measurements of the same variable (value) under the same operating conditions, approaching in the same direction.
Static Characteristics
The term “approaching in the
same direction” means that the
variable is increasing (decreasing) to the
value for all replications of the
experiment.
• The terms repeatability and reproducibility
are ways of talking about precision ins
specific contexts.
• The term repeatability is used for the ability
of a measurement system to give the same
value for repeated measurements of the
same value of a variable.
• Common cause of lack of repeatability are
random fluctuations in the environment,e.g.
changes in temperature and humidity.
• The error arising from repeatability is
usually expressed as a percentage of the full
range output.
• For example, a pressure sensor might be quoted as
having a repeatability of ±0.1% of full range. Thus with a range of 20kPa this would be an error of ± 20Pa.
• The term reproducibility is used to describe the ability of a system to give the same output when used with a constant input with the system or elements of the system being disconnected from its input and then reinstalled. The resulting error is usually expressed as a percentage of the full range output.
• High precision does not mean high
accuracy. A high precision instruments
could have low accuracy.
Static characteristics of an instrument includes;
4. Reproducibility
• The closeness of agreement among a number of consecutive measurements of the same variable (value) under the same operating conditions over a period of time, approaching from both directions.
Static Characteristics
The period of time is “long”, so that changes occurring over longer times of plant operation are included.
Reproducibility includes hysteresis, dead band, drift
and repeatability.
• Gradual change in instruments
measurements.
OR
• Measure of difference in repeatability.
• Under laboratory conditions drift of an
element can be determined by one of two
ways;
1. Point drift
2. Calibration drift
Drift
• By maintaining exact operating and load
conditions , monitoring of output variations
for a fixed input signals as a function of
time is called point drift.
• Used for stable process conditions
Point Drift
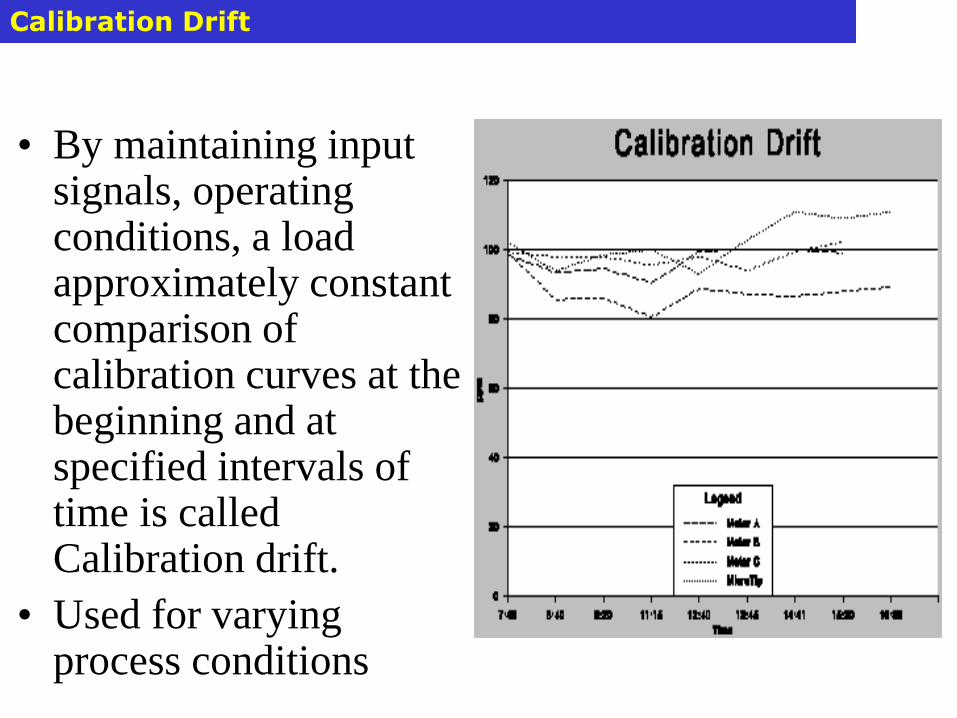
• By maintaining input signals, operating conditions, a load approximately constant comparison of calibration curves at the beginning and at specified intervals of time is called Calibration drift.
• Used for varying process conditions
Calibration Drift
• Dead zone is the largest range of values of a
measured variable to which the instrument
does not respond.
• This is sometimes called dead spot and
hysteresis.
Dead Zone
Backlash Backlash or mechanical hysteresis is defined as that lost
motion or free play which is inherent in mechanical elements
such as gears, linkages or other mechanical transmission
devices that are not rigidly connected.
Range represents the minimum and maximum values which
can be determined by an instrument or equipment.
Difference between upper and lower range is known as Span.
Span can be the same for two different range instruments.
Static characteristics of an instrument includes;
5. Range/Span
Static Characteristics
If a chemical reactor typically operates at 300 C, the engineer might select a
range of 250-350 C.
Since the reactor will be started up from ambient temperature occasionally,
an additional sensor should be provided with a range of -50 to 400 C.
Static characteristics of an instrument includes;
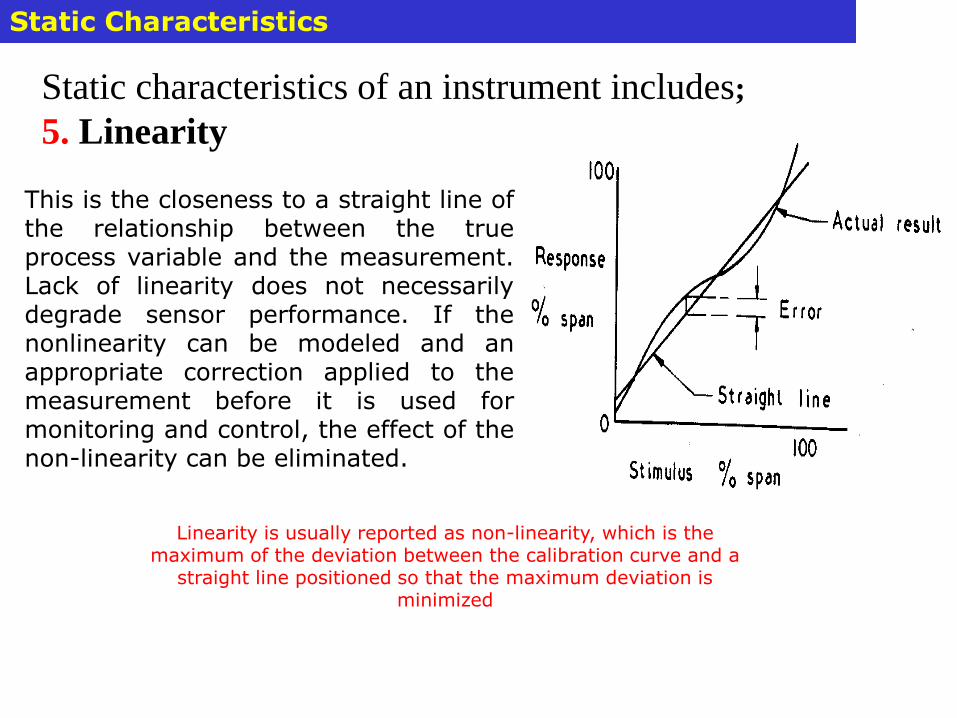
5. Linearity
Static Characteristics
This is the closeness to a straight line of the relationship between the true process variable and the measurement. Lack of linearity does not necessarily degrade sensor performance. If the nonlinearity can be modeled and an appropriate correction applied to the measurement before it is used for monitoring and control, the effect of the non-linearity can be eliminated.
Linearity is usually reported as non-linearity, which is the maximum of the deviation between the calibration curve and a
straight line positioned so that the maximum deviation is minimized
• Typical examples of compensating calculations
are the square root applied to the orifice flow
sensor and the polynomial compensation for a
thermocouple temperature sensor.
• The engineer should not assume that a
compensation for non-linearity has been applied,
especially when taking values from a history
database, which does not contain details of the
measurement technology.
Static characteristics of an instrument includes;
6. Reliability
Static Characteristics
Reliability is the probability that a device will adequately perform (as specified) for a period of time under specified operating conditions. Some sensors are required for safety or product quality, and therefore, they should be very reliable.
If sensor reliability is very important, the engineer can provide duplicate sensors, so that a single failure does
not require a process shutdown
• Probability = number of occurrences of the event/ total number of
trials
• A high reliability system will have a low failure rate.
• Failure rate is the number of times during some period of time that the
system fails to meet the required level of performance, i.e.
• Failure rate= number of failures / number of systems
observed x time observed
• A failure rate of 0.4 per year means that in one year, if ten systems are observed, 4 will fail to meet the require level of performance.
• If 100 systems are observed, 40 will fail to meet the required level of performance.
• Failure rate is affected by environmental conditions.
• For example, the failure rate for a
temperature measurement system used in
hot, dusty, humid, corrosive conditions
might be 1.2 per year, while for the same
system used in dry, cool, non-corrosive
environment it might be 0.3 per year.
• Reliability is affected by maintenance and
consistency with process environment.
Also, some sensors are protected from
contact with corrosive process environment
by a cover or sheath (e.g., a thermowell for
a thermocouple), and some sensors require a
sample to be extracted from the process
(e.g., a chromatograph).
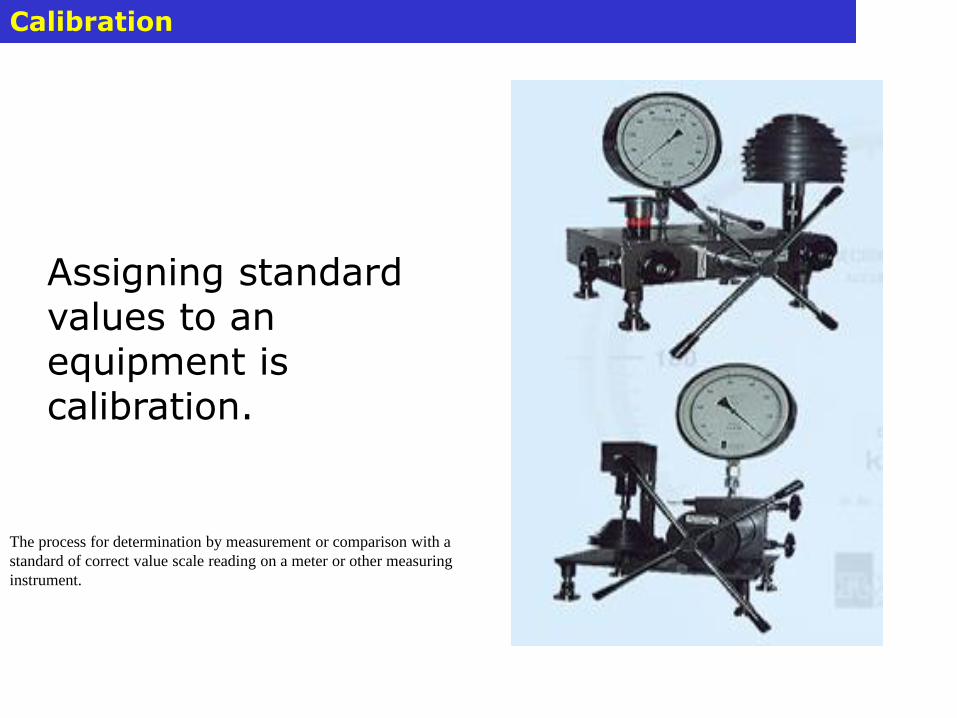
Calibration
Assigning standard values to an equipment is calibration.
The process for determination by measurement or comparison with a
standard of correct value scale reading on a meter or other measuring
instrument.
Error
• The term error is used for the difference
between the result of the measurement and
the true value of the quantity being
measured, i.e.
• Error = measured value – true value
• Thus if the measured value is 10.1 when the
true value is 10.0, the error is +0.1.
• If the measured value is 9.9 when the true
value is 10.0, the error is –0.1.
• Errors can arise in number of ways:
1. Hysteresis error
2. Non-linearity error
3. Insertion error
Instrument
Reading
Increasing
Decreasing
Non
Actual relationship Assumed relationship
error
error
Value measured
Measured
Value
Non
Actual relationship Assumed relationship
error
error
True Value
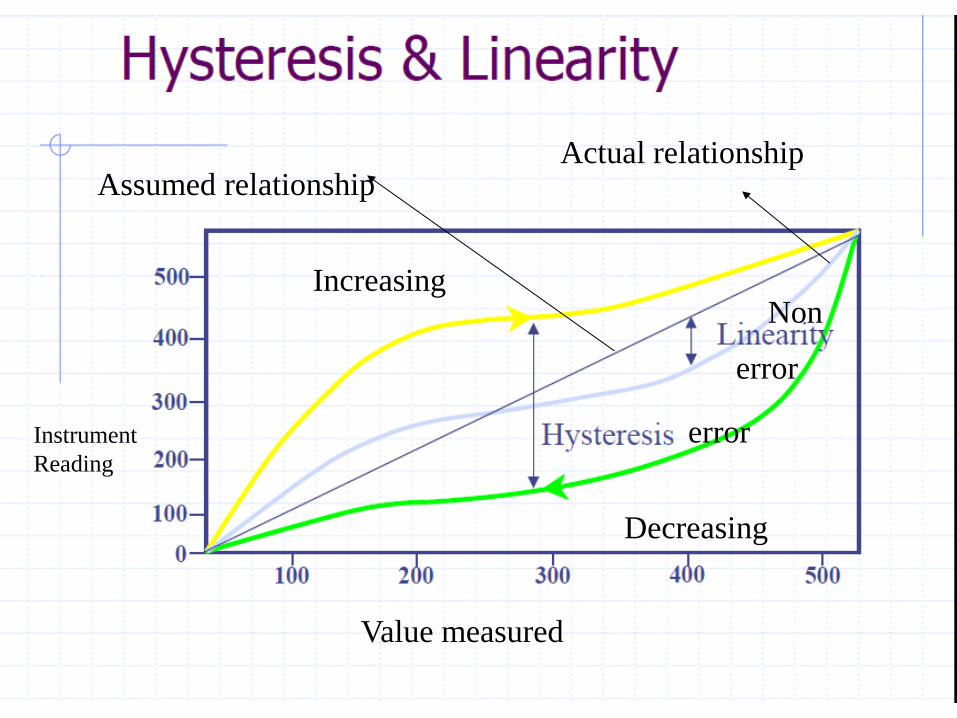
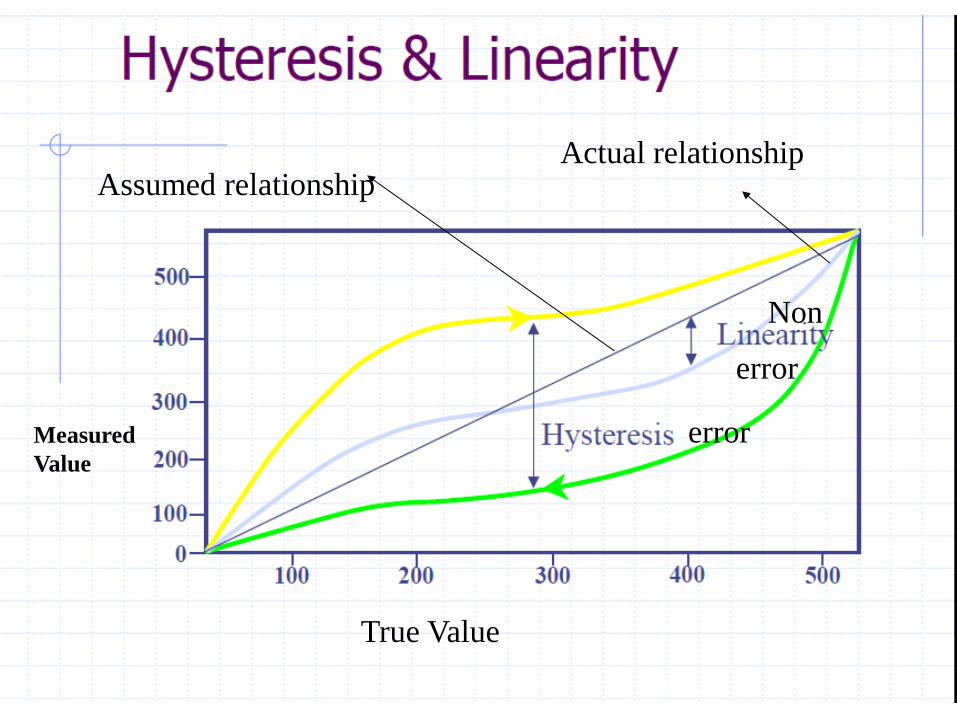
• Hysteresis error- is used for the difference
in outputs given from the same value of
quantity being measured according to
whether that value has been reached by a
continuously increasing change or a
continuously decreasing change.
• Thus, you might obtain a different value
from a thermometer used to measure the
same temperature of a liquid if it is reached
by the liquid warming up to the measured
temperature or it is reached by the liquid
cooling down to the measured temperature.
• Non-linearity error is used for the error that
occurs as a result of assuming a linear
relationship between the input and output
over the working range, i.e. a graph of
output plotted against input is assumed to
give a straight line.
• Few systems or elements, however, have a
truly linear relationship and thus errors
occur as a result of this assumption of
linearity.
• Linearity error is usually expressed as a
percentage error of full range or full scale
output.
Insertion error
• When a cold thermometer is put in to a hot
liquid to measure its temperature, the
presence of the cold thermometer in the hot
liquid changes the temperature of the liquid.
• The liquid cools and so the thermometer
ends up measuring a lower temperature than
that which existed before the thermometer
was introduced.
• The act of attempting to make the measurement
has modified the temperature being measured.
• This effect is called LOADING and the
consequence as an insertion error.
• If we want this modification to be small, then the
thermometer should have a small heat capacity
compared with that of the liquid. A small heat
capacity means that very little heat is needed to
change its temperature.
• Example of loading is when an ammeter is inserted into a circuit to make a measurement of the circuit current, it changes the resistance of the circuit and so changes the current being measured.
• Ex. Two voltmeters are available, one with a resistance of 1 K ohm and the other 1 Mohm. Which instrument should be selected if the indicated value is to be closed to the voltage value that existed across a 2 Kohm resistor before the voltmeter was connected across it.
• The 1Mohm voltmeter should be chosen. This is because when it is in parallel with the 2Kohm, less current will flow through it than if the 1 Kohm voltmeter had been used and so the current through the resistor will be closer to its original value. Hence the indicated voltage will be closer to the value that existed before the voltmeter was connected into the circuit.
• Static errors are generally of three types;
1. Mistake or gross error (human mistakes)
2. Systematic errors (instrumental or environmental errors)
3. Random or accidental errors (unknown)
Static Error
Range
• The range of variable of system is the limits between which the input can vary.
• For example, a resistance thermometer sensor might be quoted as having a range of –200 to +800oC.
• A meter might have dual ranges i.e. 0 to 4 and 0 to 20
• The range of variable of an instrument is also sometimes called its SPAN.
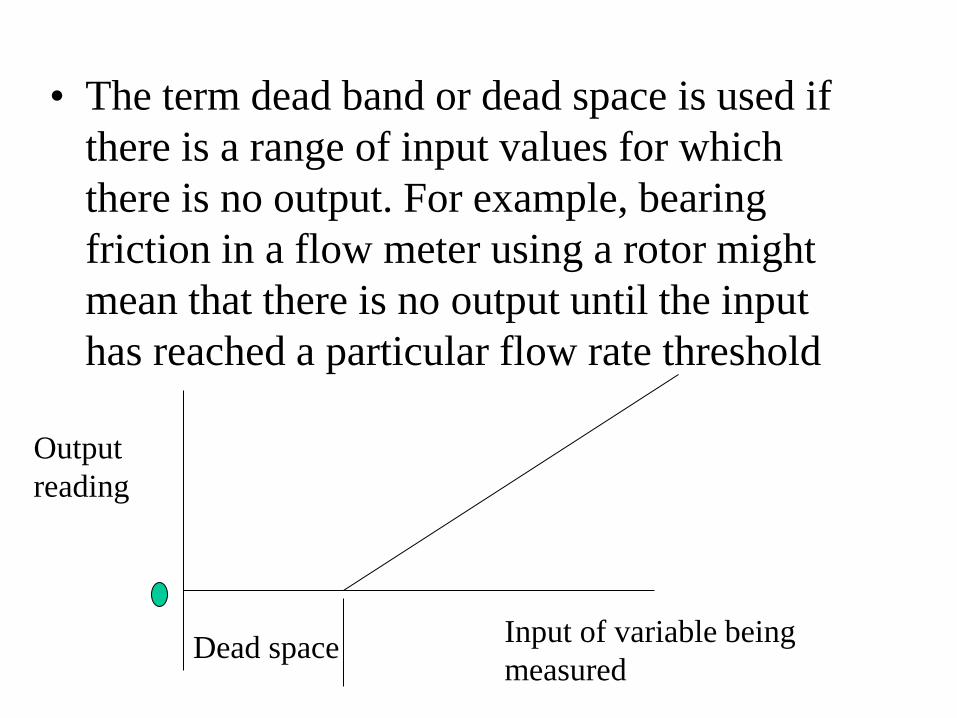
• The term dead band or dead space is used if
there is a range of input values for which
there is no output. For example, bearing
friction in a flow meter using a rotor might
mean that there is no output until the input
has reached a particular flow rate threshold
Dead space
Output
reading
Input of variable being
measured
Sensitivity
• Indicates how much the output of an
instrument system or system element
changes when the quantity being measured
changes by a given amount, i.e. the ratio
out/input.
• For example, a thermocouple might have a
sensitivity of 20uV/oC and so give an output
of 20uV for each change in temperature.
• Thus, if we take a series of readings of the
output of an instrument for a number of
different inputs and plot a graph of output
against input, the sensitivity is the slope of
the graph.
• The term is also frequently used to indicate
the sensitivity to inputs other than that
being measured, i.e. environmental changes.
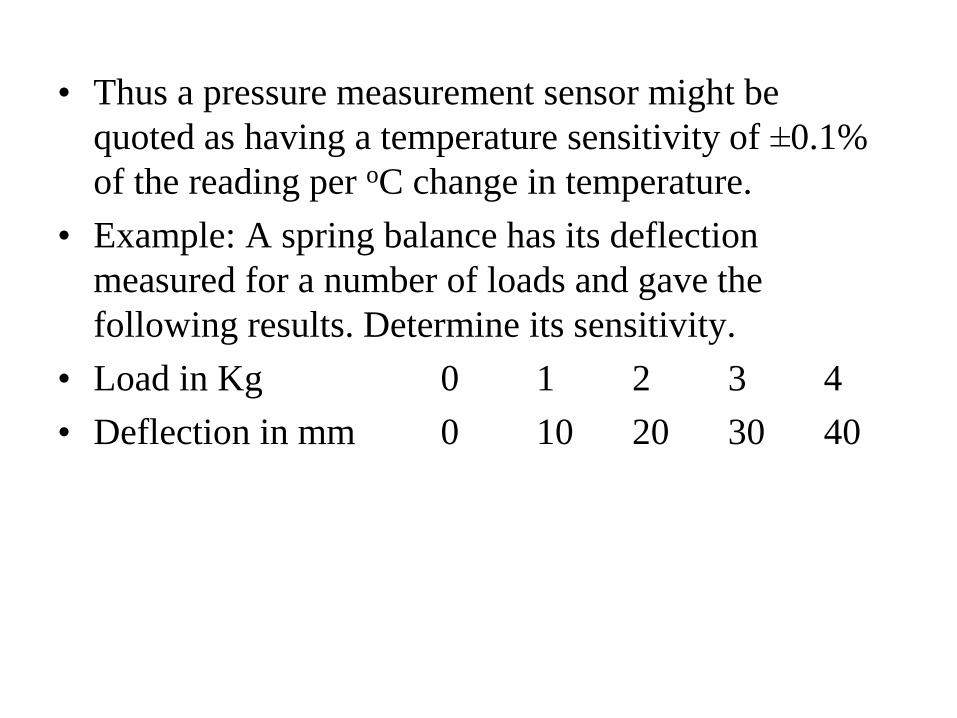
• Thus a pressure measurement sensor might be
quoted as having a temperature sensitivity of ±0.1%
of the reading per oC change in temperature.
• Example: A spring balance has its deflection
measured for a number of loads and gave the
following results. Determine its sensitivity.
• Load in Kg 0 1 2 3 4
• Deflection in mm 0 10 20 30 40
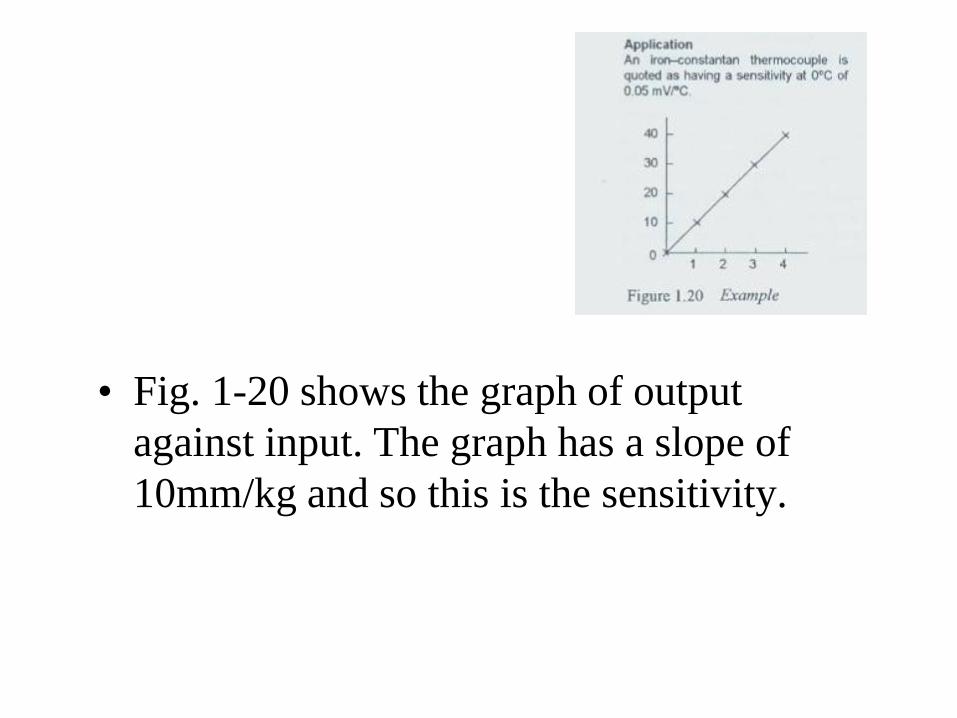
• Fig. 1-20 shows the graph of output
against input. The graph has a slope of
10mm/kg and so this is the sensitivity.
Stability
• The stability of a system is its ability to give
the same output when used to measure a
constant input over a period of time.
• The term drift is often used to describe the
change in output that occurs over time.
• The drift may be expressed as a percentage
of the full range output.
• The term zero drift is used for the changes
that occur in output when there is zero
input.
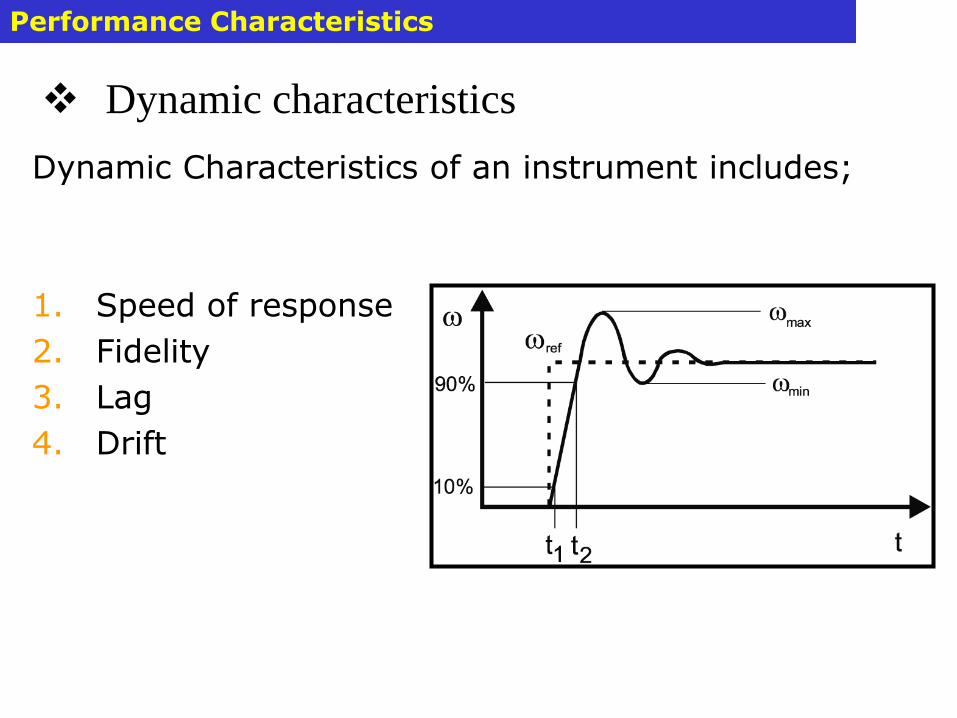
Dynamic characteristics
Performance Characteristics
Dynamic Characteristics of an instrument includes;
1. Speed of response
2. Fidelity
3. Lag
4. Drift
• Speed of Response: is the rapidity with which an instrument responds to the change in the measured quantity.
• Fidelity: degree to which an instrument indicate the changes in the measured variables without dynamic error.
• Lag : is a retardation or delay in the response of an instrument to the changes in the measured quantity
• Drift: is a undesired change or gradual variation in output over a period of time that is unrelated to changes in output, operating conditions or load.
Other Issues
1. Maintenance
2. Consistency with process environment
3. Safety
4. Cost
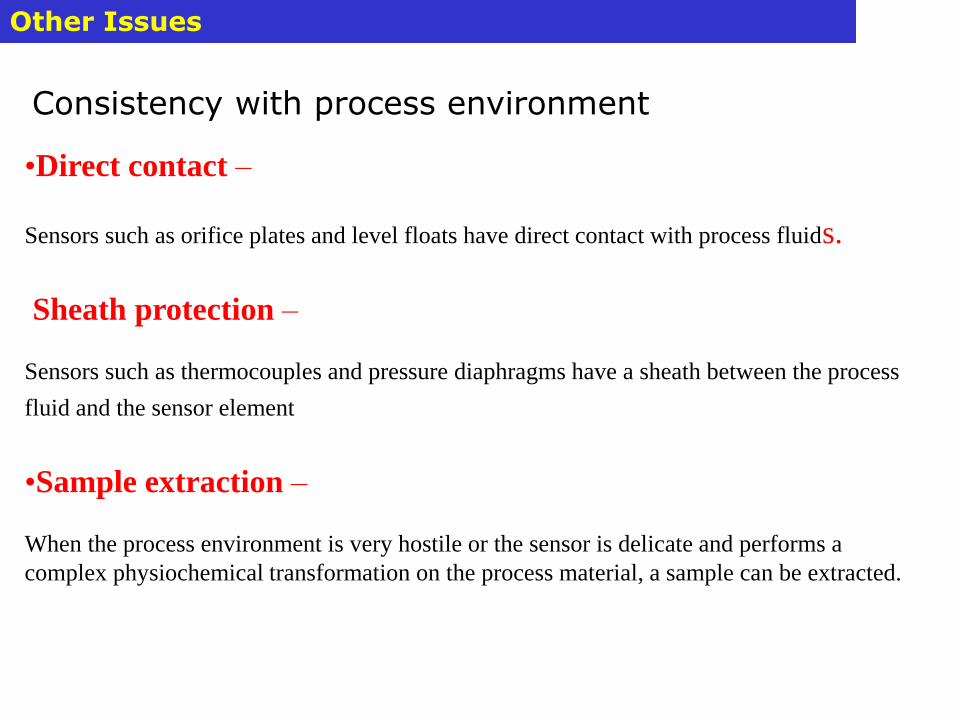
Other Issues
Consistency with process environment
•Direct contact –
Sensors such as orifice plates and level floats have direct contact with process fluids.
Sheath protection –
Sensors such as thermocouples and pressure diaphragms have a sheath between the process
fluid and the sensor element
•Sample extraction –
When the process environment is very hostile or the sensor is delicate and performs a
complex physiochemical transformation on the process material, a sample can be extracted.
• Most sensors will function properly for specific process conditions. For example, many flow sensors function for a single phase, but not for multi-phase fluid flow, whether vapor-liquid or slurry. The engineer must observe the limitations for each sensor.
• Some sensors can have direct contact with the process materials, while others must be protected. Three general categories are given in the following.
• Sensors in direct contact must not be degraded by the process material.
• The sheath usually slows the sensor response.
• Samples must represent the fluid in the process.
Other Issues
Location of Measurement Displays
Local display
Local panel display
Centralized control room
Remote monitoring
• The measurement is displayed for observation by
plant personnel. Typically, the display uses analog principles, which means that the display presents the measurement as a position in a graphical format, which could, for example, be the height of a slide bar or the position of a pointer. Often, the value is displayed as a line on a trend plot that provides the values for some time in the past. In addition, the measurement can be displayed as a digital number to provide more accuracy for calibration. Finally, measurements that are transmitted to a digital control system can be stored in a historical database for later recall and for use in calculating important parameters useful in monitoring process behavior, for example, reactor yields or heat transfer coefficients.
• ------ A sensor can display the measurement at the
point where the sensor is located. This information can be used by the people when monitoring or working on the equipment. A measurement that has only local display involves the lowest cost, because the cost of transmission and interfacing to a digital system are not required. Note that no history of these measurements is available unless people record the values periodically.
• ---- Some equipment is operated from a local
panel, where sensors associated with a unit are collected. This enables a person to startup, shutdown and maintain the unit locally. This must be provided for units that require manual actions at the process during normal operation (loading feed materials, cleaning filters, etc.) or during startup and shutdown. Usually, the values displayed at a local panel are also displayed at a centralized control room.
• ------ Many processes are operated from a
centralized control room that can be located a
significant distance (e.g., hundreds of meters)
from the process. The measurement must be
converted to a signal (usually electronic) for
transmission and be converted to a digital number
when interfaced with the control system. A
centralized control system facilitates the analysis
and control of the integrated plant.
• ----- In a few cases, processes can be operated without a human operator at the location. In these situations, the measurements are transmitted by radio frequency signals to a centralized location where a person can monitor the behavior of many plants. Typical examples are remote oil production sites and small, safe chemical plants, such as air separation units.
The Smart Sensor Revolution
Digital conversion and transmission
Diagnostics
Signal conditioning
Configuration
• Currently, sensor technology is experiencing a dramatic
change. While the basic physics and chemistry of sensors are not changing, sensors are being enhanced by the addition of microprocessors at the location of the sensor. This change makes the following features possible that were not available with older technologies.
• ------ The “signal” from the sensor is no longer simply a single value representing the measured value. The sensor can transmit additional information, including diagnostics and corrected estimates of a variable based on multiple sensors, e.g., orifice pressures and density. All values can be transmitted digitally, which allows many sensor values to be sent by the same cabling, which reduces the cost of an individual cable for each measurement, as required with analog transmission.
• ---- - The sensor can provide sophisticated diagnostics of
its performance and warn when a measurement might be
unreliable.
• ----- The sensor can identify unusual signal characteristics
and eliminate noise or “spikes” according to methods
defined by the engineer.
• ------ The range of a sensor can be changed quickly to
accommodate changes in process operating conditions.
Principle measurements desired in industry
(a) Temperature
(b) Pressure
(c) Level
(d) Flow
(e) Others ( Composition, pH etc.)
Principle measurements desired in Industry
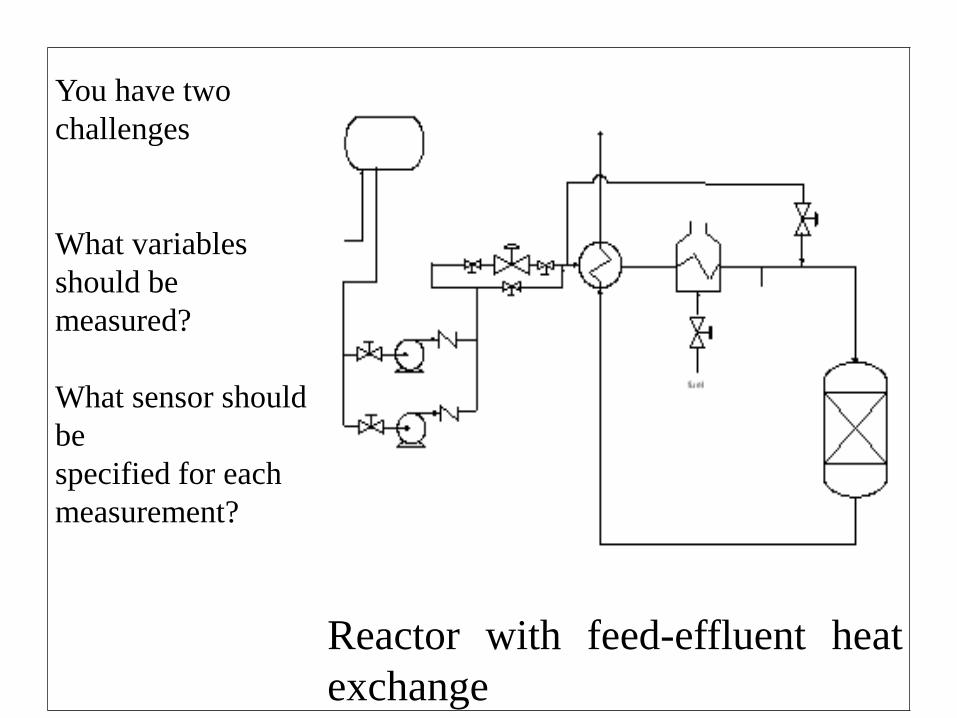
You have two
challenges
What variables
should be
measured?
What sensor should
be
specified for each
measurement?
Reactor with feed-effluent heat
exchange
Calibration
• Calibration should be carried out using
equipment which can be traceable back to
national standards with a separate
calibration record kept for each
measurement instrument.
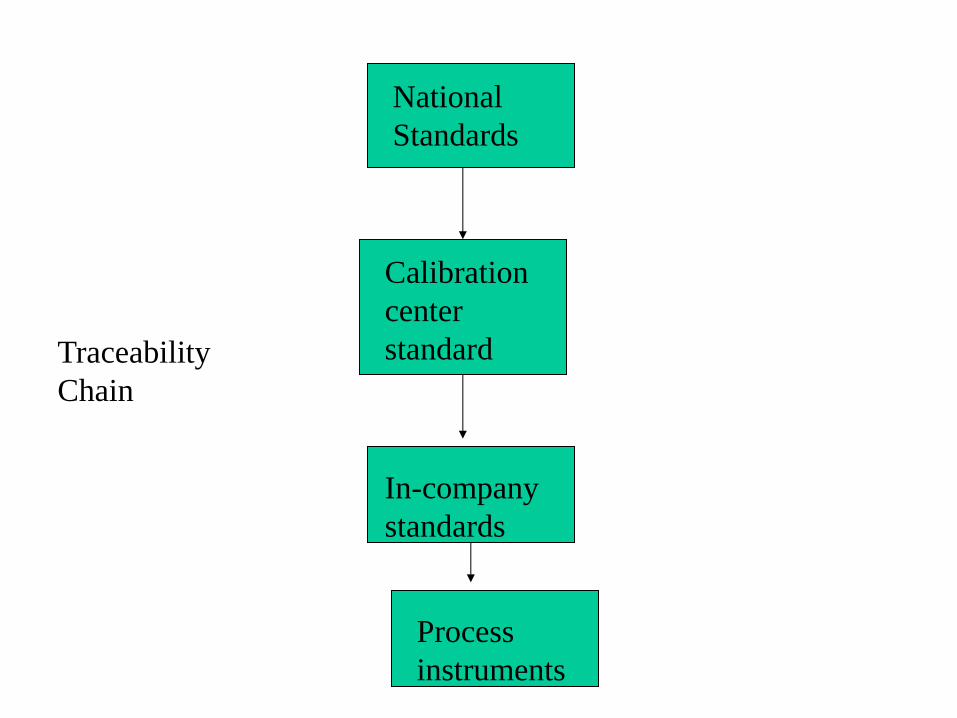
National
Standards
Calibration
center
standard
In-company
standards
Process
instruments
Traceability
Chain
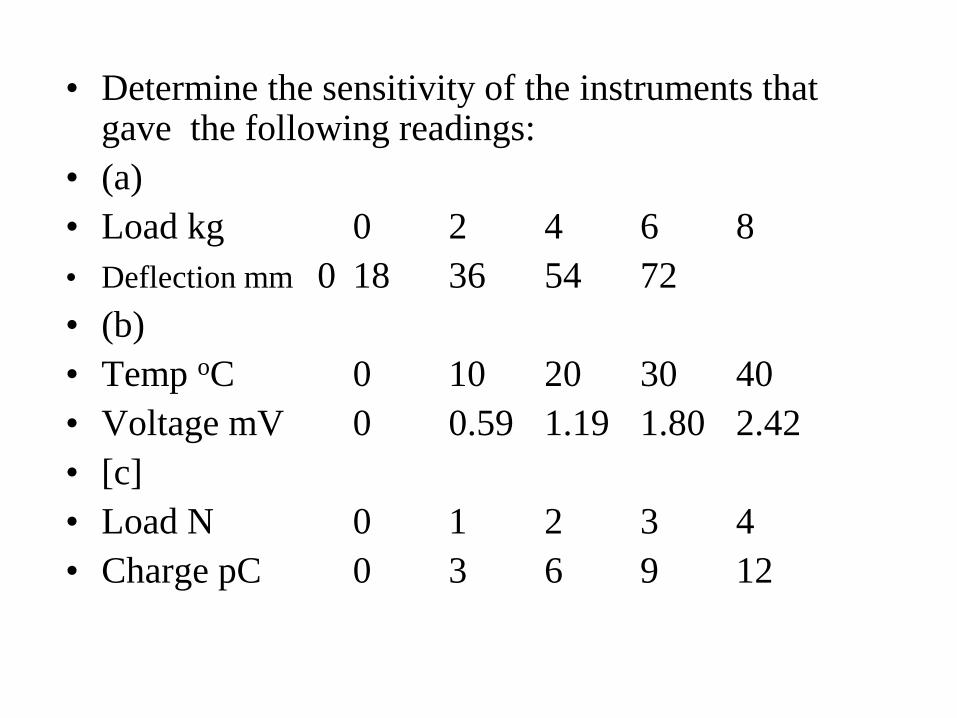
• Determine the sensitivity of the instruments that
gave the following readings:
• (a)
• Load kg 0 2 4 6 8
• Deflection mm 0 18 36 54 72
• (b)
• Temp oC 0 10 20 30 40
• Voltage mV 0 0.59 1.19 1.80 2.42
• [c]
• Load N 0 1 2 3 4
• Charge pC 0 3 6 9 12
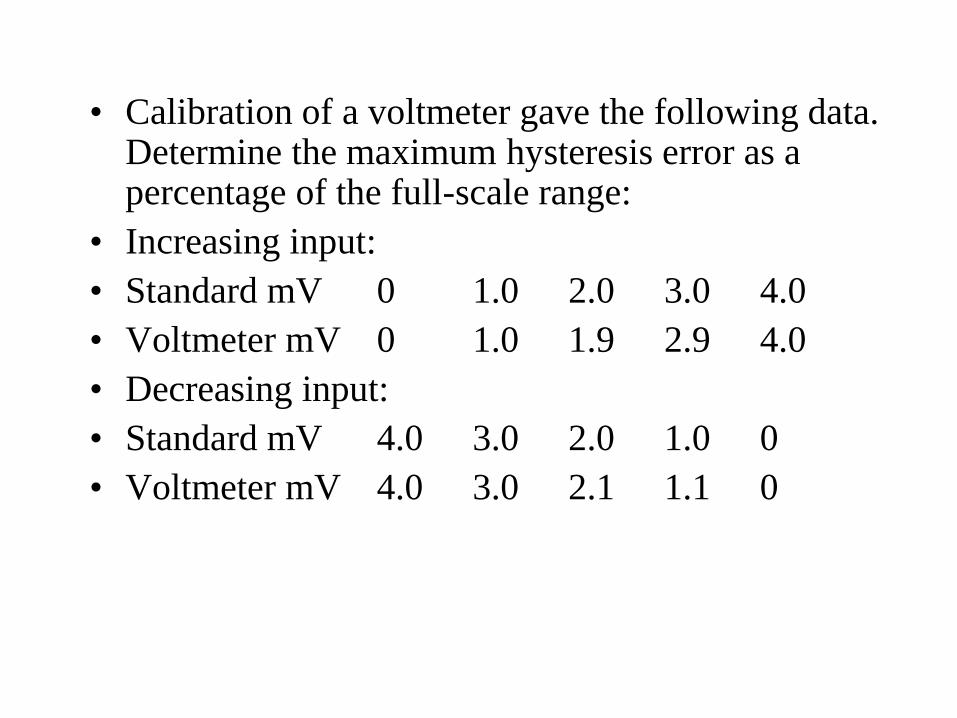
• Calibration of a voltmeter gave the following data. Determine the maximum hysteresis error as a percentage of the full-scale range:
• Increasing input:
• Standard mV 0 1.0 2.0 3.0 4.0
• Voltmeter mV 0 1.0 1.9 2.9 4.0
• Decreasing input:
• Standard mV 4.0 3.0 2.0 1.0 0
• Voltmeter mV 4.0 3.0 2.1 1.1 0
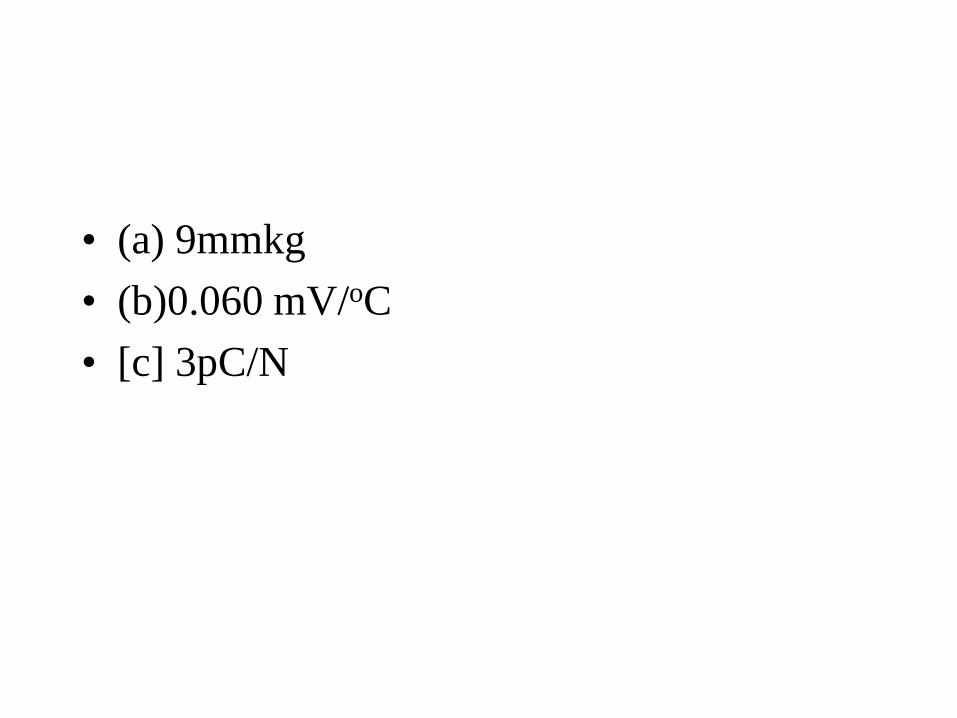
• (a) 9mmkg
• (b)0.060 mV/oC
• [c] 3pC/N

• 5%

