measurement of crystal thickness and crystal tilt from ...svenh/crystal thickness.pdf ·...
TRANSCRIPT
Measurement of Crystal Thickness and Crystal TiltFrom HRTEM Images and a Way to Correct for Their EffectsSVEN HOVMOLLER* AND XIAODONG ZOUStructural Chemistry, Stockholm University, S-106 91 Stockholm, Sweden
KEY WORDS image restoration; electron microscopy; structure determination; crystallographicstructure factors; amplitudes and phases; thickness determination
ABSTRACT The effects of thickness and tilt angle are studied numerically on experimentalhigh-resolution transmission electron microscope (HRTEM) images of a wedge-shaped metal oxidecrystal. For sufficiently thin and well-aligned crystals, the amplitudes and phases of the Fouriertransforms of the HRTEM images are essentially the same as the crystallographic structure factors.For tilted crystals, the changes of amplitudes and phases as a function of increased thickness andtilt angle can be described by a simple model. A method is presented by which the local thickness canbe determined from one HRTEM image and one convergent-beam electron diffraction pattern fromthe same crystal. It is also shown how the projected potential can be reconstructed from HRTEMimages of tilted crystals, disclosing the crystal structure, even from quite thick (.20 nm) samples.Microsc. Res. Tech. 46:00–00, 1999. r 1999 Wiley-Liss, Inc.
INTRODUCTIONModern 200–400 kV high resolution transmission
electron microscopes (HRTEM) have a resolution ofbetween 0.25 and 0.15 nm. This is sufficient for resolv-ing all non-hydrogen atoms, since the interatomicdistances are in the range 1.5–2.5 Å. In some favorablecases, such as metal oxides or alloys with one short unitcell dimension (,5 Å), a single projection along theshort axis may reveal the positions of all metal atoms. Aresolution of 0.25 nm is sufficient for locating the metalatoms in oxides within 0.1 Å (Hovmoller et al., 1984),while about 0.17 nm resolution is needed for locating allatoms in alloys and other metal-rich compounds (Wei-rich et al., 1996). For more complex structures, it maybe necessary to do a full three-dimensional reconstruc-tion of the structure, as shown by Downing et al., 1990.
In practice, a direct interpretation of HRTEM imagesin terms of crystal structures is only possible if allexperimental conditions are close to optimal. Theseinclude microscope alignment including beam tilt (Sax-ton and Smith, 1985), crystal thickness, defocus value,crystal orientation, and others. If one or more of theserequirements is not fulfilled, image processing has to beapplied before the image can be interpreted. The effectsof beam tilt are not studied in this paper, but it isassumed that beam tilt is so small that it is negligible.This is probably a realistic assumption in most cases.
Several schemes of reconstruction of out-of-focusimages have been devised in order to determine theprojected potential, or at least the image of what itwould have been under ideal experimental conditions,allowing a direct interpretation in terms of atomicpositions. Erickson and Klug (1971) showed how thecontrast transfer function (CTF) varies with defocus,how the defocus value can be obtained from the Thonrings in the Fourier transform (FT) of HRTEM images,and finally described how an undistorted image couldbe reconstructed by correcting for the CTF by computer-ized image processing. The method of Erickson and
Klug has recently been implemented in the imageprocessing program CRISP (Hovmoller, 1992) and ap-plied successfully to HRTEM images of inorganic crys-tals by Zou et al. (1996). The defocus value can bedetermined also by other methods (Li, 1998; Van Dycket al., 1996).
The effects of crystal thickness on HRTEM imageshave been extensively studied using image simulations.In spite of the importance of sample thickness for theappearance of HRTEM images, there has hitherto notexisted any generally applicable and straightforwardmethod to determine this parameter. Instead, a seriesof simulated images is typically calculated, within arange of thickness that presumably includes that of theexperimental area (Spence and Cowley, 1995). Jansenet al. (1998) have developed a method for obtaining avalue of the crystal thickness in small areas by combin-ing multi-slice calculations and least-squares refine-ment of a structure model against electron diffractiondata.
Crystal tilt has a great effect on HRTEM images. Itmay sometimes be an advantage to take images ofslightly tilted crystals, since these have a smootherprojected potential and thus are less affected by mul-tiple scattering, which otherwise distorts the imagessuch that they are no longer proportional to the pro-jected potential. A slight tilt may reduce the dynamicalscattering by as much as a factor of 2 (O’Keefe andRadmilovic, 1993). Crystal tilt is a major reason whyHRTEM images of thin crystals often cannot be inter-preted directly. Thus, it is important to look closer atthe effects of crystal tilt and to find a method forcorrecting HRTEM images that are affected by crystal
Contract grant sponsor: Swedish Natural Science Research Council (NFR).*Correspondence to: Sven Hovmoller, Structural Chemistry, Stockholm Univer-
sity, S-106 91 Stockholm Sweden. E-mail: [email protected] 9 March 1998; accepted in revised form 12 February 1999
MICROSCOPY RESEARCH AND TECHNIQUE 46:147–159 (1999)
r 1999 WILEY-LISS, INC.
tilt. This is so much more important, since only rarelyare image simulations carried out with crystal tiltsincluded. In a previous study on simulated images ofthe silicate mineral orthopyroxene, Zou et al. (1995)showed that crystallographic image processing (CIP)could be used to reconstruct interpretable images oftilted crystals. Here a similar approach is taken forcompensating for the effects of crystal tilt on experimen-tal HRTEM images.
The main effect of crystal tilt is to smear out thestructural information in the direction perpendicular tothe tilt axis. This lowers the resolution, but only in thatdirection. For thin crystals and small tilt angles, wherethe weak phase object approximation is valid, theeffects of crystal tilt are proportional to the tilt anglemultiplied by the crystal thickness. For small tilts, theeffects are mainly an attenuation of the amplitudes ofthe image, while phases are unaffected. These effectswere derived in theory by Zou (1995) and are heredemonstrated quantitatively on experimental HRTEMimages of a wedge-shaped crystal.
The traditional way of interpreting HRTEM images,by matching with image simulations, is typically car-ried out by calculating a matrix of some five differentdefocus values and five different crystal thicknesses,while keeping astigmatism, beam tilt, and crystal tilt atzero. If these three latter parameters were also allowedto take on different values in the image simulations,they would each require about a 10-fold increase in thenumber of images calculated. This large number arisessince astigmatism, beam tilt, and crystal tilt each needtwo numbers to describe them; a direction and amagnitude. Clearly it is not practically possible tosimulate tens of thousands of images for each structuremodel. We propose an alternative approach (apart fromthe obvious experimental efforts to keep all these errorparameters as close to zero as possible); to detect andquantify each of these experimental parameters. If weknow the crystal thickness, defocus, tilt, etc., then thereis no need to simulate more than a single image, whichthen has to fit with the experimental one. Before imagesimulations can be applied to an unknown structure, itmust first be solved, for example from the projectedpotential reconstructed from HRTEM images by imageprocessing, after correcting for the various distortions.
We present here a method for determination ofcrystal thickness and tilt angle in HRTEM images. Themethod can be used both on uniformly thick andwedge-shaped crystals. We also show that the projectedpotential can be faithfully reconstructed even fromthick, tilted crystals simply by imposing the crystalsymmetry.
MATERIALS AND METHODSElectron Microscopy
HRTEM images and electron diffraction patterns ofK2O · 7Nb2O5 were taken in a JEOL (Tokyo, Japan)4000 electron microscope operated at 400 kV, with amagnification of 400,000 on Kodak (Rochester, NY)SO-163 Film. K2O · 7Nb2O5 is tetragonal, P4/mbm withunit cell dimensions a 5 b 5 27.5 Å and c 5 3.94 Å. Thestructure of this compound has been solved by electroncrystallography (Hu et al., 1992), that of the isostruc-tural thallium compound by X-ray crystallography
(Bhide and Gasparin, 1979), and the cesium analog byelectron crystallography (Wang et al., 1988).
An electron transparent wedge-shaped crystal wasselected and aligned to have the short c-axis parallel tothe electron beam. A series of images was taken fromthe same area of the crystal, with nominal tilt anglesranging from 0 to 5 degrees. At each tilt angle, electrondiffraction patterns were taken from the same area, byusing both selected area electron diffraction (SAED)and convergent beam electron diffraction (CBED).
Image DigitizationThe photographic negatives were put on a light box
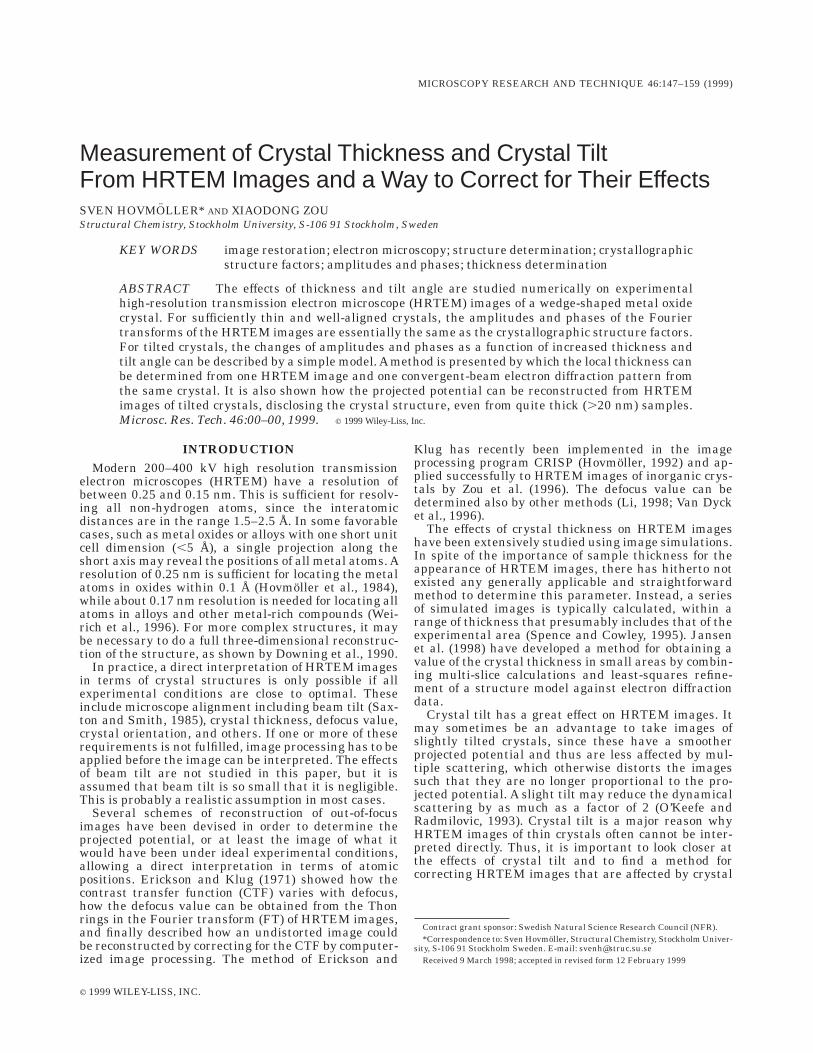
and digitized, using a DAGE (Michigan City, IL) MTICCD72 video-rate CCD camera with 8 bit grey-scaleresolution, connected to a Shark II1 frame grabber.The 256 grey levels provided by 8 bits is sufficient fordigitizing HRTEM images (but not for SAED patterns).Similarly, the non-linearity of photographic film is not aproblem here. Parts of the HRTEM images that allcorresponded to the same area, near the edge of thecrystal, were digitized. The digitization was done with768 3 576 pixels, each 24 3 24 µm, corresponding to0.06 3 0.06 nm per pixel. This is sufficient for recover-ing all structural information out to at least 0.15 nmresolution, since an oversampling of at least 2 is neededto follow a periodic feature. The processed area wasabout 45 3 35 nm2, or just over 16 by 12 unit cells(Fig. 1).
Determination of Tilt AngleThe tilt axis was roughly perpendicular to the edge of
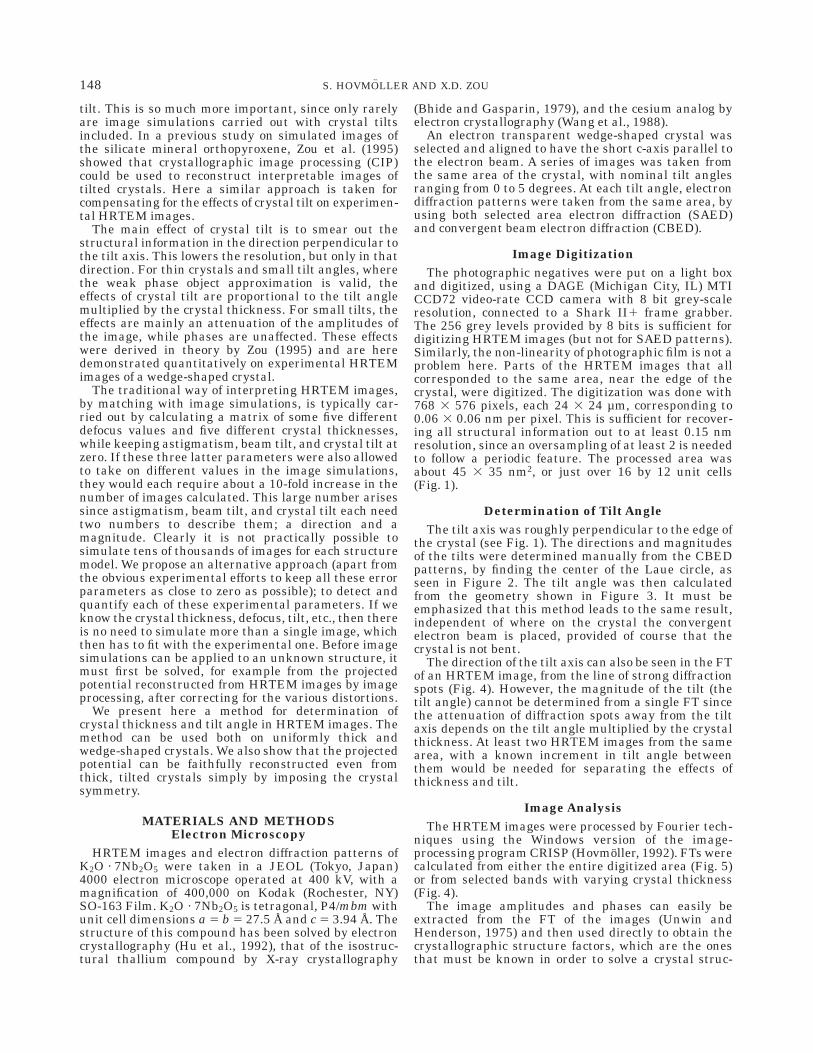
the crystal (see Fig. 1). The directions and magnitudesof the tilts were determined manually from the CBEDpatterns, by finding the center of the Laue circle, asseen in Figure 2. The tilt angle was then calculatedfrom the geometry shown in Figure 3. It must beemphasized that this method leads to the same result,independent of where on the crystal the convergentelectron beam is placed, provided of course that thecrystal is not bent.
The direction of the tilt axis can also be seen in the FTof an HRTEM image, from the line of strong diffractionspots (Fig. 4). However, the magnitude of the tilt (thetilt angle) cannot be determined from a single FT sincethe attenuation of diffraction spots away from the tiltaxis depends on the tilt angle multiplied by the crystalthickness. At least two HRTEM images from the samearea, with a known increment in tilt angle betweenthem would be needed for separating the effects ofthickness and tilt.
Image AnalysisThe HRTEM images were processed by Fourier tech-
niques using the Windows version of the image-processing program CRISP (Hovmoller, 1992). FTs werecalculated from either the entire digitized area (Fig. 5)or from selected bands with varying crystal thickness(Fig. 4).
The image amplitudes and phases can easily beextracted from the FT of the images (Unwin andHenderson, 1975) and then used directly to obtain thecrystallographic structure factors, which are the onesthat must be known in order to solve a crystal struc-
148 S. HOVMOLLER AND X.D. ZOU
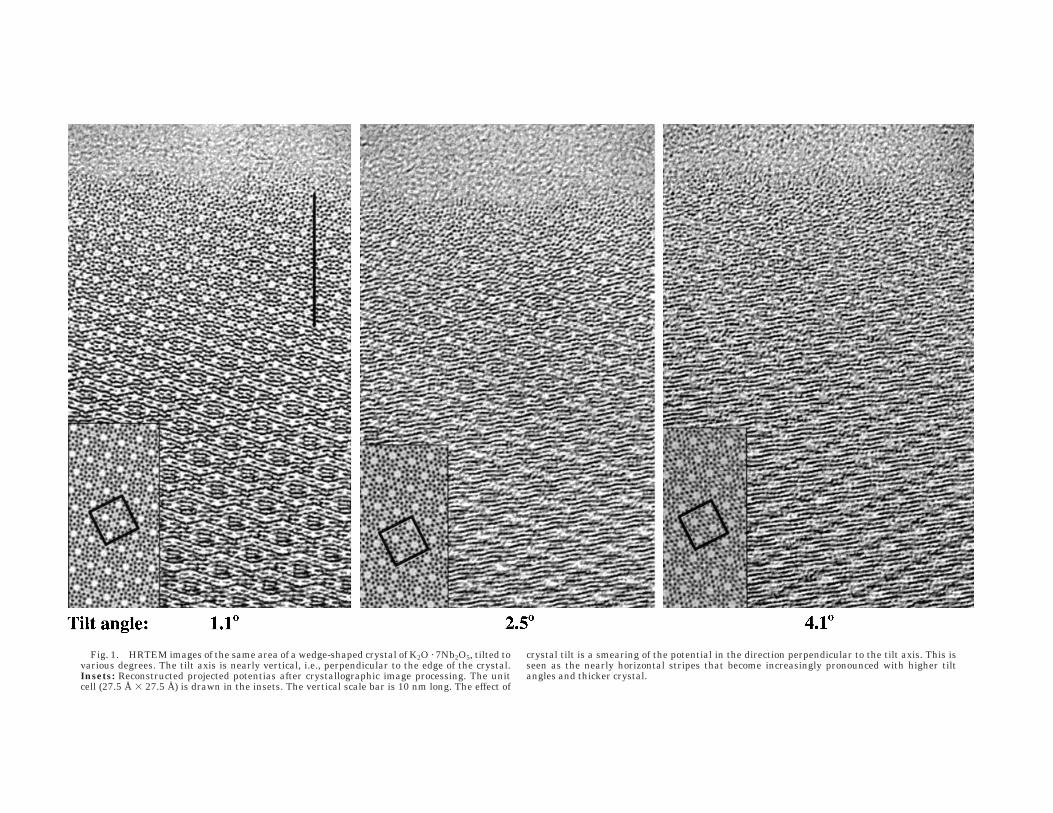
Fig. 1. HRTEM images of the same area of a wedge-shaped crystal of K2O · 7Nb2O5, tilted tovarious degrees. The tilt axis is nearly vertical, i.e., perpendicular to the edge of the crystal.Insets: Reconstructed projected potentias after crystallographic image processing. The unitcell (27.5 Å 3 27.5 Å) is drawn in the insets. The vertical scale bar is 10 nm long. The effect of
crystal tilt is a smearing of the potential in the direction perpendicular to the tilt axis. This isseen as the nearly horizontal stripes that become increasingly pronounced with higher tiltangles and thicker crystal.
ture. The phases of the FT of an image of a perfectlyaligned crystal of a structure with a centrosymmetricprojection remain close to 0° or 180°, and so can only becorrect or wrong by 180°. The phase errors caused byrandom noise and systematic errors, such as multiplediffraction, are typically within 20° in good images ofthin areas.
Throughout this paper, the word phase is used in thesense of crystallographic structure factor phases, eitheras their values in the crystals or as those experimen-tally measured estimates of the structure factor phasesthat we obtain from the FT of the HRTEM images.
Qualitatively, the effects of crystal tilt and thicknesswere investigated by calculating so-called quasi-opti-cally filtered images in the following way. From the FTof the whole digitized area, just one single diffractionspot and its Friedel mate were selected, using the
Lattice Filter option in CRISP. The inverse FT of thisdiffraction pair was calculated. In this way, the ampli-tude and phase of a single diffraction spot could befollowed visually over the entire area of the scannedcrystal, as seen in Figure 5.
Quantitatively, these effects were investigated inseveral ways, all in Fourier space. In the quasi-opticallyfiltered images, the amplitude and phase of a singlereflection was measured at regular intervals, along aline perpendicular to the edge of the crystal. The plotsof a few of these reflections are shown in Figure 6.
The effects of crystal tilt as a function of tilt angle andcrystal thickness were investigated quantitatively alsoby processing a set of narrow bands (4 by 30 nm) of thecrystal at different distances from the crystal edge, andthus of increasing thickness. The bands had their longdirection parallel to the edge of the crystal. For each
Fig. 2. SAED (left) and CBED (right) patterns of K2O · 7Nb2O5tilted 0.35° and 1.10°, respectively. The SAED pattern was used tocalibrate the scale of the electron diffraction patterns, while the CBEDpatterns were used for finding the center of the Ewald spheres for each
tilt angle. In the diffraction patterns above the projections are along(7,7,0) (left) and (6,16,0) (right), with tilt angles of 0.34° and 1.1°,respectively.
Fig. 3. Geometrical estimation of tilt angle.Top (left) and side view (right). The tilt angle u iscalculated from sinu 5 l/d, where l is the wave-length of the electron and d is the d-value ofposition ( p,q,0).
150 S. HOVMOLLER AND X.D. ZOU
band, the FT was calculated and the lattice of diffrac-tion spots in the calculated diffractogram was indexed.All diffractograms were indexed the same way, with theh axis running roughly parallel to the edge of thecrystal and the k axis nearly parallel to the tilt axis.The amplitudes and crystallographic structure factorphases of the indexed diffraction spots within a resolu-
tion of 0.17 nm were extracted from the FT. The phaseorigin of each band was then shifted, such that they allcoincided with the same (of the two possible) 4-fold axiswithin the unit cell. Amplitudes and phases of all thereflections were compared numerically in order to seehow they were affected by crystal tilt and crystalthickness. The amplitudes and phases for four of the
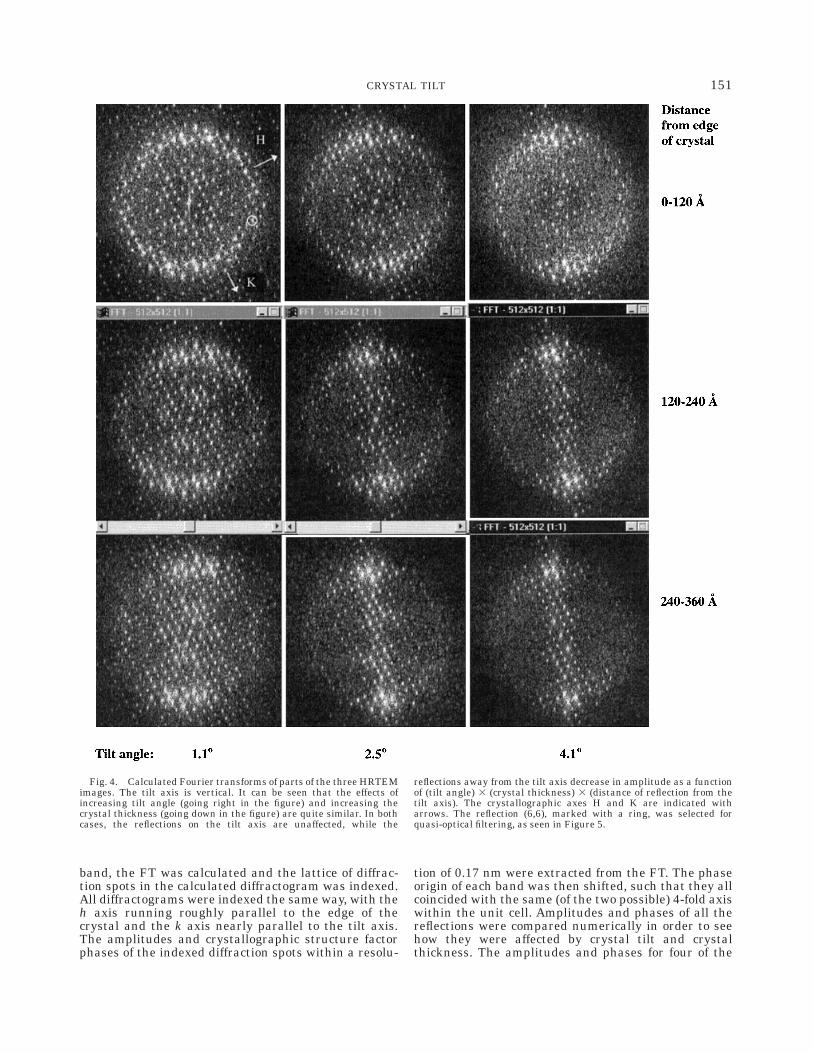
Fig. 4. Calculated Fourier transforms of parts of the three HRTEMimages. The tilt axis is vertical. It can be seen that the effects ofincreasing tilt angle (going right in the figure) and increasing thecrystal thickness (going down in the figure) are quite similar. In bothcases, the reflections on the tilt axis are unaffected, while the
reflections away from the tilt axis decrease in amplitude as a functionof (tilt angle) 3 (crystal thickness) 3 (distance of reflection from thetilt axis). The crystallographic axes H and K are indicated witharrows. The reflection (6,6), marked with a ring, was selected forquasi-optical filtering, as seen in Figure 5.
151CRYSTAL TILT
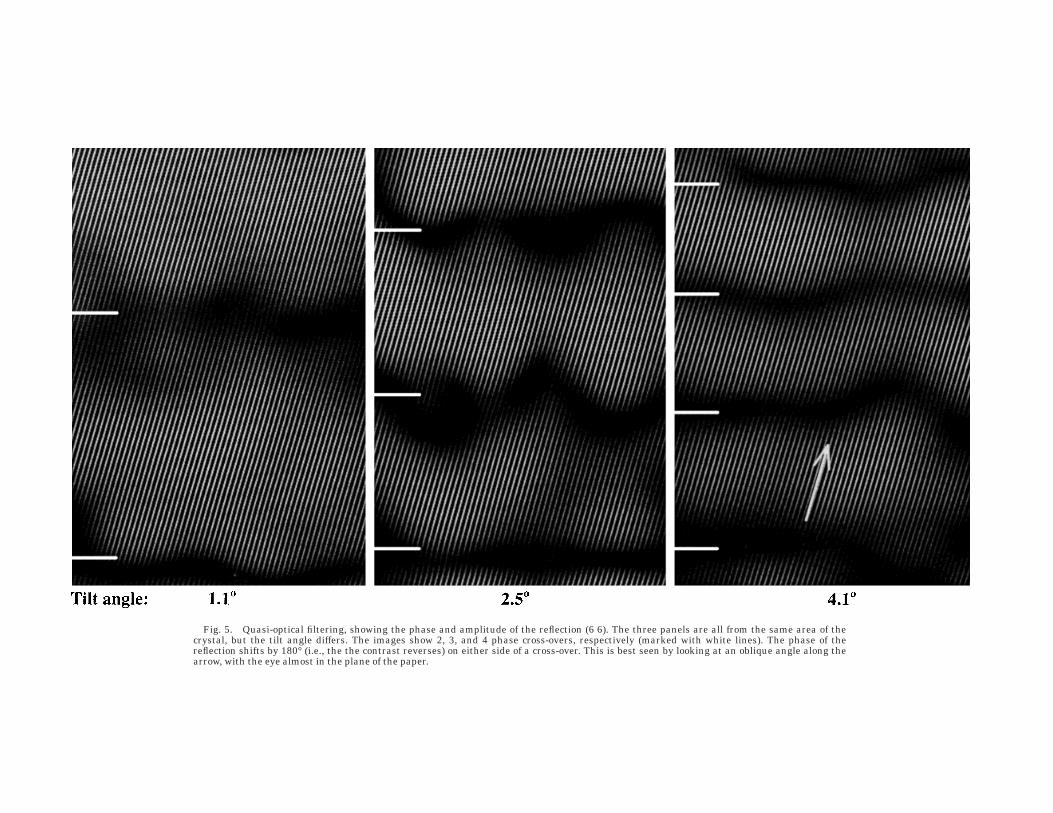
Fig. 5. Quasi-optical filtering, showing the phase and amplitude of the reflection (6 6). The three panels are all from the same area of thecrystal, but the tilt angle differs. The images show 2, 3, and 4 phase cross-overs, respectively (marked with white lines). The phase of thereflection shifts by 180° (i.e., the the contrast reverses) on either side of a cross-over. This is best seen by looking at an oblique angle along thearrow, with the eye almost in the plane of the paper.
strongest high-resolution reflections are shown in Ta-ble 1.
Estimation of Crystal ThicknessThe crystal thickness was estimated from the ratio of
amplitudes of symmetry-related reflections. The most
accurate values are obtained at cross-overs of indi-vidual reflections; i.e., where the amplitude of a strongreflection off the tilt axis has fallen to zero. The highsymmetry of this compound, space group P4/mbm withprojected symmetry p4g, provided a great advantagefor this study. There are always eight symmetry-related
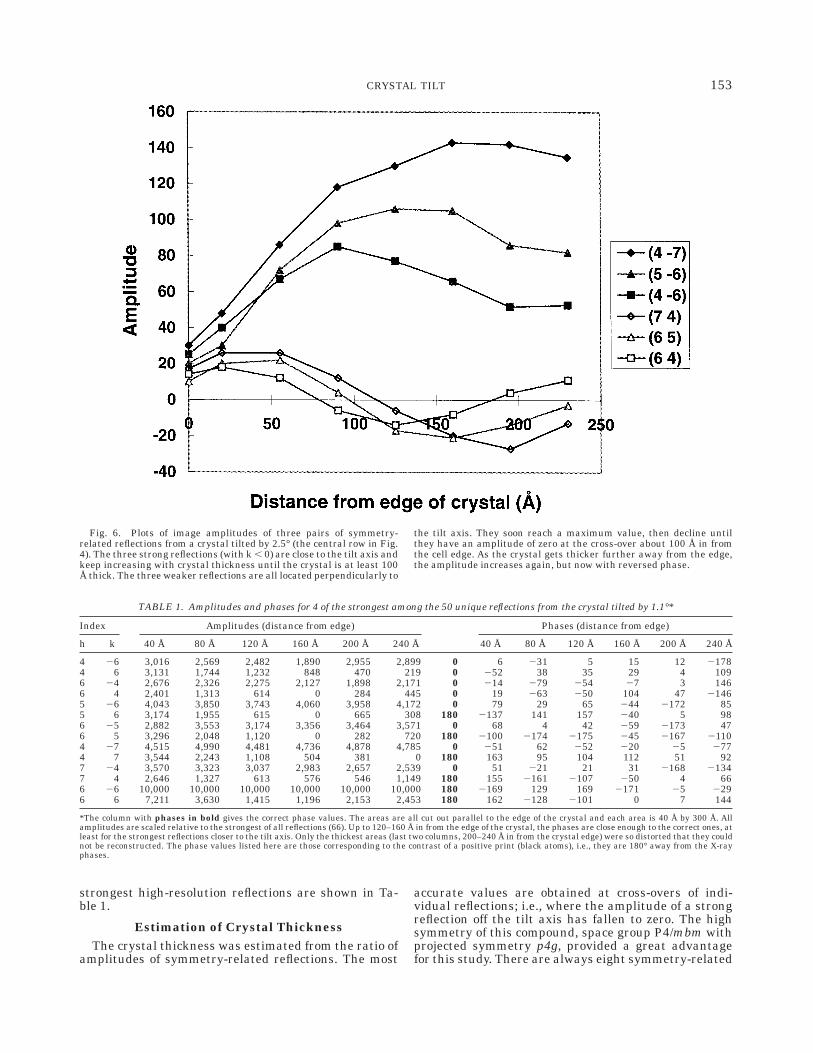
Fig. 6. Plots of image amplitudes of three pairs of symmetry-related reflections from a crystal tilted by 2.5° (the central row in Fig.4). The three strong reflections (with k , 0) are close to the tilt axis andkeep increasing with crystal thickness until the crystal is at least 100Å thick. The three weaker reflections are all located perpendicularly to
the tilt axis. They soon reach a maximum value, then decline untilthey have an amplitude of zero at the cross-over about 100 Å in fromthe cell edge. As the crystal gets thicker further away from the edge,the amplitude increases again, but now with reversed phase.
TABLE 1. Amplitudes and phases for 4 of the strongest among the 50 unique reflections from the crystal tilted by 1.1°*
Index Amplitudes (distance from edge) Phases (distance from edge)
h k 40 Å 80 Å 120 Å 160 Å 200 Å 240 Å 40 Å 80 Å 120 Å 160 Å 200 Å 240 Å
4 26 3,016 2,569 2,482 1,890 2,955 2,899 0 6 231 5 15 12 21784 6 3,131 1,744 1,232 848 470 219 0 252 38 35 29 4 1096 24 2,676 2,326 2,275 2,127 1,898 2,171 0 214 279 254 27 3 1466 4 2,401 1,313 614 0 284 445 0 19 263 250 104 47 21465 26 4,043 3,850 3,743 4,060 3,958 4,172 0 79 29 65 244 2172 855 6 3,174 1,955 615 0 665 308 180 2137 141 157 240 5 986 25 2,882 3,553 3,174 3,356 3,464 3,571 0 68 4 42 259 2173 476 5 3,296 2,048 1,120 0 282 720 180 2100 2174 2175 245 2167 21104 27 4,515 4,990 4,481 4,736 4,878 4,785 0 251 62 252 220 25 2774 7 3,544 2,243 1,108 504 381 0 180 163 95 104 112 51 927 24 3,570 3,323 3,037 2,983 2,657 2,539 0 51 221 21 31 2168 21347 4 2,646 1,327 613 576 546 1,149 180 155 2161 2107 250 4 666 26 10,000 10,000 10,000 10,000 10,000 10,000 180 2169 129 169 2171 25 2296 6 7,211 3,630 1,415 1,196 2,153 2,453 180 162 2128 2101 0 7 144
*The column with phases in bold gives the correct phase values. The areas are all cut out parallel to the edge of the crystal and each area is 40 Å by 300 Å. Allamplitudes are scaled relative to the strongest of all reflections (66). Up to 120–160 Å in from the edge of the crystal, the phases are close enough to the correct ones, atleast for the strongest reflections closer to the tilt axis. Only the thickest areas (last two columns, 200–240 Å in from the crystal edge) were so distorted that they couldnot be reconstructed. The phase values listed here are those corresponding to the contrast of a positive print (black atoms), i.e., they are 180° away from the X-rayphases.
153CRYSTAL TILT
reflections (except for axial (h00 ) and (0k0 ) and diago-nal (hh0 ) and (h-h0 ) reflections, which appear only fourtimes). The symmetry-related reflections are (hk0 ),(2k h 0 ), (2h 2k 0 ), (k 2h 0 ), (2h k 0 ), (h 2k 0 ),(2k 2h 0 ) and (k h 0 ). Due to a fundamental propertyof the FT of any real function, including an image,Friedel pairs of reflections (hk0 ) and (2h 2k 0 ) aremathematically exactly related as 0F(hk0 )0 50F(2h 2k 0 )0 and f(hk0 ) 5 2 f(2h 2k 0 ); i.e., theiramplitudes are equal and their phases are related suchthat if for example the phase of (hk0 ) is 20°, then thephase of (2h 2k 0 ) is 220°. Thus, we are left with fournon-trivially related symmetry-equivalent reflections(two each for axial and diagonal reflections). These four
reflections provide an excellent internal standard forquantitative work. Since all reflections in any one FTcome from exactly the same area, we know that theymust come from the same chemical composition, thesame thickness, the same tilt angle and the sameoptical conditions (focus, astigmatism, etc.). This makesit much simpler to compare the effects of crystal tilt,than would have been the case with a crystal of lowersymmetry. The cross-overs seen in Figures 5 and 6 mustbe caused by tilt effects and not for example multiplescattering or absorption, since their symmetry-relatedreflections, which are from equally thick regions, arenot much different from what they were in the thinregions of the crystal.
a
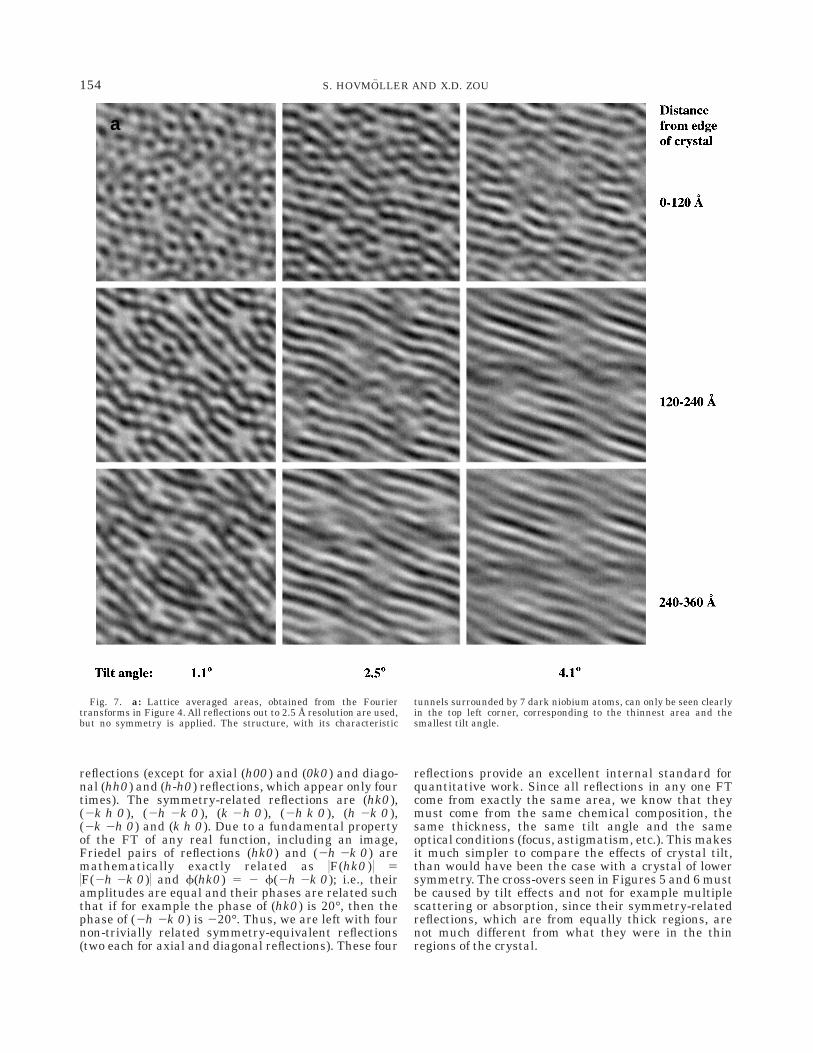
Fig. 7. a: Lattice averaged areas, obtained from the Fouriertransforms in Figure 4. All reflections out to 2.5 Å resolution are used,but no symmetry is applied. The structure, with its characteristic
tunnels surrounded by 7 dark niobium atoms, can only be seen clearlyin the top left corner, corresponding to the thinnest area and thesmallest tilt angle.
154 S. HOVMOLLER AND X.D. ZOU
Reconstruction of Projected PotentialProjected potential maps were reconstructed by in-
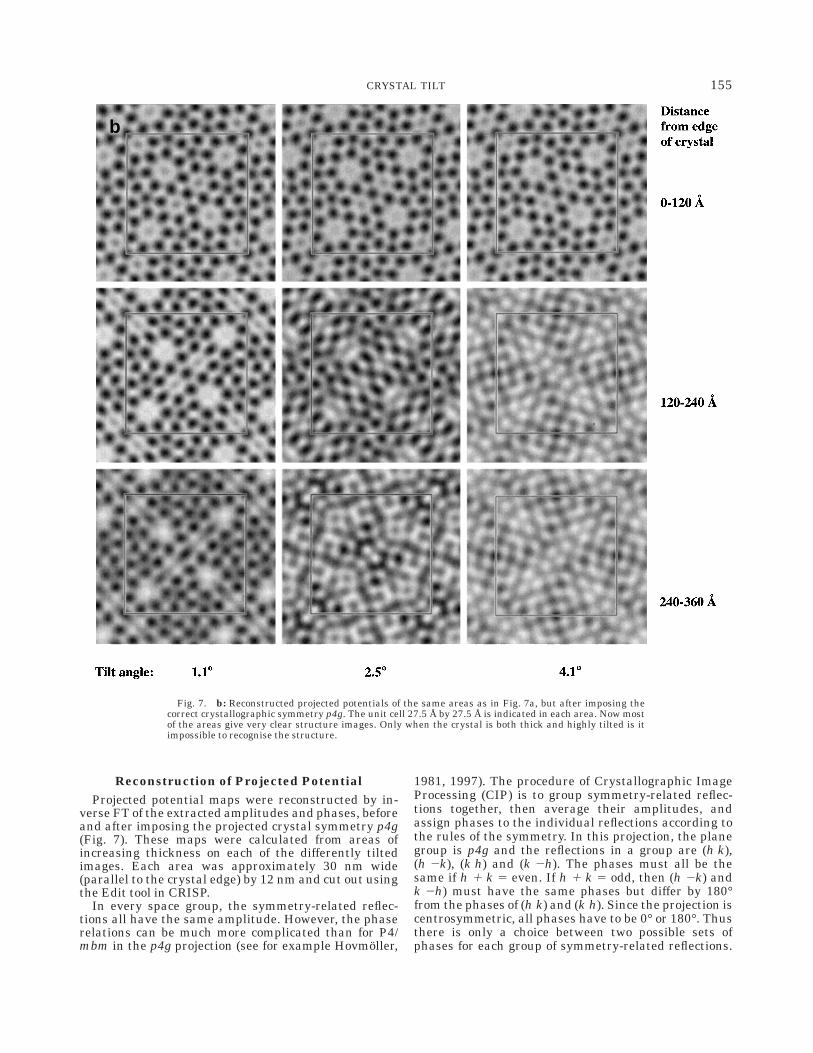
verse FT of the extracted amplitudes and phases, beforeand after imposing the projected crystal symmetry p4g(Fig. 7). These maps were calculated from areas ofincreasing thickness on each of the differently tiltedimages. Each area was approximately 30 nm wide(parallel to the crystal edge) by 12 nm and cut out usingthe Edit tool in CRISP.
In every space group, the symmetry-related reflec-tions all have the same amplitude. However, the phaserelations can be much more complicated than for P4/mbm in the p4g projection (see for example Hovmoller,
1981, 1997). The procedure of Crystallographic ImageProcessing (CIP) is to group symmetry-related reflec-tions together, then average their amplitudes, andassign phases to the individual reflections according tothe rules of the symmetry. In this projection, the planegroup is p4g and the reflections in a group are (h k),(h 2k), (k h) and (k 2h). The phases must all be thesame if h 1 k 5 even. If h 1 k 5 odd, then (h 2k) andk 2h) must have the same phases but differ by 180°from the phases of (h k) and (k h). Since the projection iscentrosymmetric, all phases have to be 0° or 180°. Thusthere is only a choice between two possible sets ofphases for each group of symmetry-related reflections.
b
Fig. 7. b: Reconstructed projected potentials of the same areas as in Fig. 7a, but after imposing thecorrect crystallographic symmetry p4g. The unit cell 27.5 Å by 27.5 Å is indicated in each area. Now mostof the areas give very clear structure images. Only when the crystal is both thick and highly tilted is itimpossible to recognise the structure.
155CRYSTAL TILT
The amplitude and phase of each of the four symmetry-related reflections are measured individually, but sincethey are coupled to each other, we can consider eachreflection as one of four independent measurements ofthe same quantity.
RESULTSAlready a visual inspection of the HRTEM images of
the crystal (Fig. 1) indicated that it was wedge-shapedand that the thickness increasd steadily and rathersmoothly with distance from the edge. In all images, thethinnest part showed point-like features, correspond-ing to the niobium atoms. In the thicker regions, thesepoints were smeared out into lines. This effect was morepronounced the more the crystals were tilted. In theHRTEM images that were tilted 3° to 5°, the regionwhere point-like atoms could be seen extended only 2 to1 nm, respectively, in from the edge.
The tilt angles that were calculated from the CBEDpatterns (Figs. 2 and 3) were rather close to thenominal tilt angles that had been read off the goniom-eter of the electron microscope. The nominal and mea-sured angles differed by about 0.5°, and most of thisdiscrepancy was due to a slight misalignment of thestarting point of the tilt series; the nominally zero-degree tilt was in fact tilted by 0.4°. For the quantita-tive analysis, we always used the tilt angles measuredfrom the CBED patterns.
The FTs had significant diffraction maxima (reflec-tions) out to 17 orders, corresponding to 0.16 nmresolution, which is also the point resolution of thismicroscope. The structure of K2O · 7Nb2O5 has a charac-teristic ring of very strong reflections between 0.35 and0.25 nm resolution (see Fig. 4).
The effects of crystal tilt and crystal thickness areseen in the FT (Fig. 4). The reflections on or very close tothe tilt axis are essentially unaffected by tilt andthickness. The further a reflection is from the tilt axis,the faster its amplitude is attenuated as the crystalgets thicker (going down in Fig. 4) or as it is tilted more(going right in Fig. 4). With a simple approximation, theattenuation S is described for weak phase objects by thesinc ((sinx)/x) function,
S(t, u, u · r0) 5sin [pt(sin u)u · r0]
pt(sin u)u · r0, (1)
(Zou, 1995) where t is the crystal thickness, u the tiltangle and u is the reciprocal vector of a reflection and r0
is a unit vector perpendicular to both the tilt axis andthe incident beam. From this formula, it is predictedthat the phases are unchanged for small tilts and thincrystals, but that they switch by 180° at the point wherethe amplitude reaches zero. If the crystal is tiltedslightly more or is slightly thicker, the reflection reap-pears after the cross-over has been reached, but nowwith reversed phase; i.e., with inverted contrast. Thatthis indeed is what happens is most easily seen bylooking at an oblique angle (with the eye close to thepaper) along the set of lines in Figure 5. Notice thatwhen the lines continue on the other side of a cross-over, all white lines turn into black and vice versa.
The simple behavior of the reflections as sinc func-tions is here confirmed experimentally. Only a few
typical examples are shown in Figures 5 and 6, but allreflections behaved in this way in all parts of theimages.
Determination of Crystal ThicknessThe crystal thickness t at the cross-overs of any
reflection can be calculated from (1), using the formula
d 5 t sin u (2)
since the first cross-over of a sinc function comes wherex 5 p.
If the reflection lies perpendicular to the tilt axis,then (u · r0)21 is equal to the d-value of that reflection.We see from Figure 6 that the cross-overs of reflections(6,4) and (6,5) and (7,4) come at distances of 8, 10, and11 nm, respectively, in from the edge of the crystal,when the crystal is tilted by 2.5°. The values of (u · r0)21
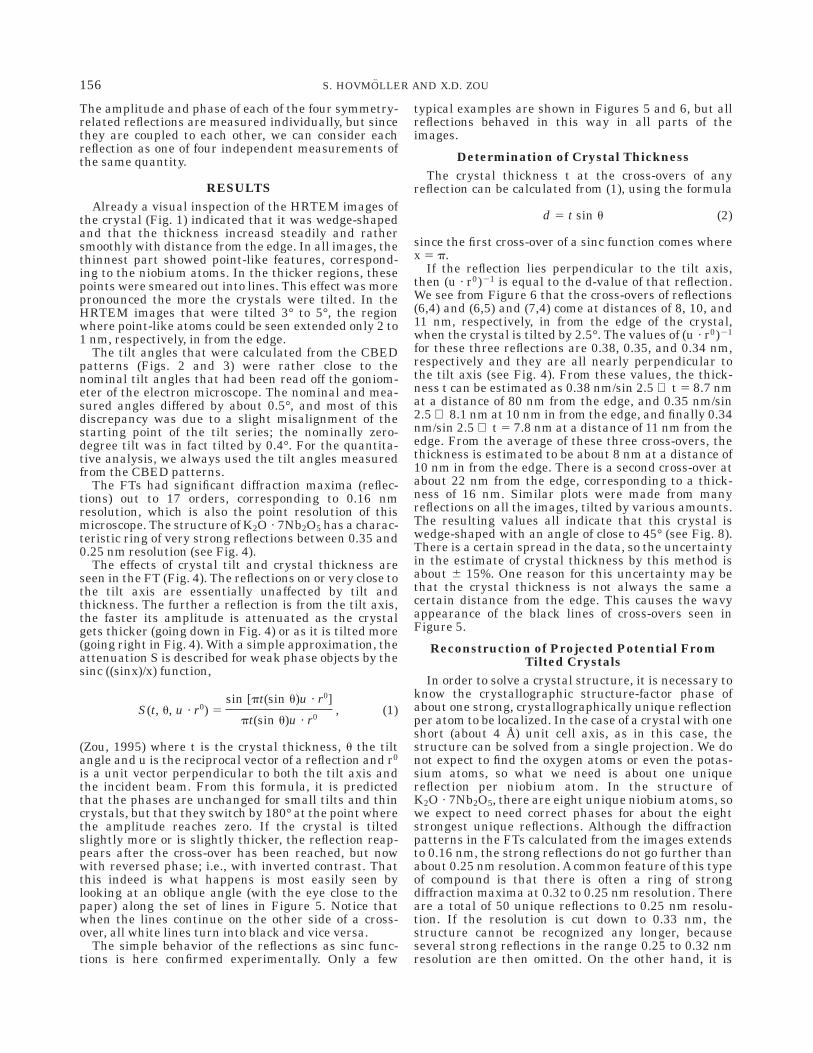
for these three reflections are 0.38, 0.35, and 0.34 nm,respectively and they are all nearly perpendicular tothe tilt axis (see Fig. 4). From these values, the thick-ness t can be estimated as 0.38 nm/sin 2.5 ⇒ t 5 8.7 nmat a distance of 80 nm from the edge, and 0.35 nm/sin2.5 ⇒ 8.1 nm at 10 nm in from the edge, and finally 0.34nm/sin 2.5 ⇒ t 5 7.8 nm at a distance of 11 nm from theedge. From the average of these three cross-overs, thethickness is estimated to be about 8 nm at a distance of10 nm in from the edge. There is a second cross-over atabout 22 nm from the edge, corresponding to a thick-ness of 16 nm. Similar plots were made from manyreflections on all the images, tilted by various amounts.The resulting values all indicate that this crystal iswedge-shaped with an angle of close to 45° (see Fig. 8).There is a certain spread in the data, so the uncertaintyin the estimate of crystal thickness by this method isabout 6 15%. One reason for this uncertainty may bethat the crystal thickness is not always the same acertain distance from the edge. This causes the wavyappearance of the black lines of cross-overs seen inFigure 5.
Reconstruction of Projected Potential FromTilted Crystals
In order to solve a crystal structure, it is necessary toknow the crystallographic structure-factor phase ofabout one strong, crystallographically unique reflectionper atom to be localized. In the case of a crystal with oneshort (about 4 Å) unit cell axis, as in this case, thestructure can be solved from a single projection. We donot expect to find the oxygen atoms or even the potas-sium atoms, so what we need is about one uniquereflection per niobium atom. In the structure ofK2O · 7Nb2O5, there are eight unique niobium atoms, sowe expect to need correct phases for about the eightstrongest unique reflections. Although the diffractionpatterns in the FTs calculated from the images extendsto 0.16 nm, the strong reflections do not go further thanabout 0.25 nm resolution. A common feature of this typeof compound is that there is often a ring of strongdiffraction maxima at 0.32 to 0.25 nm resolution. Thereare a total of 50 unique reflections to 0.25 nm resolu-tion. If the resolution is cut down to 0.33 nm, thestructure cannot be recognized any longer, becauseseveral strong reflections in the range 0.25 to 0.32 nmresolution are then omitted. On the other hand, it is
156 S. HOVMOLLER AND X.D. ZOU
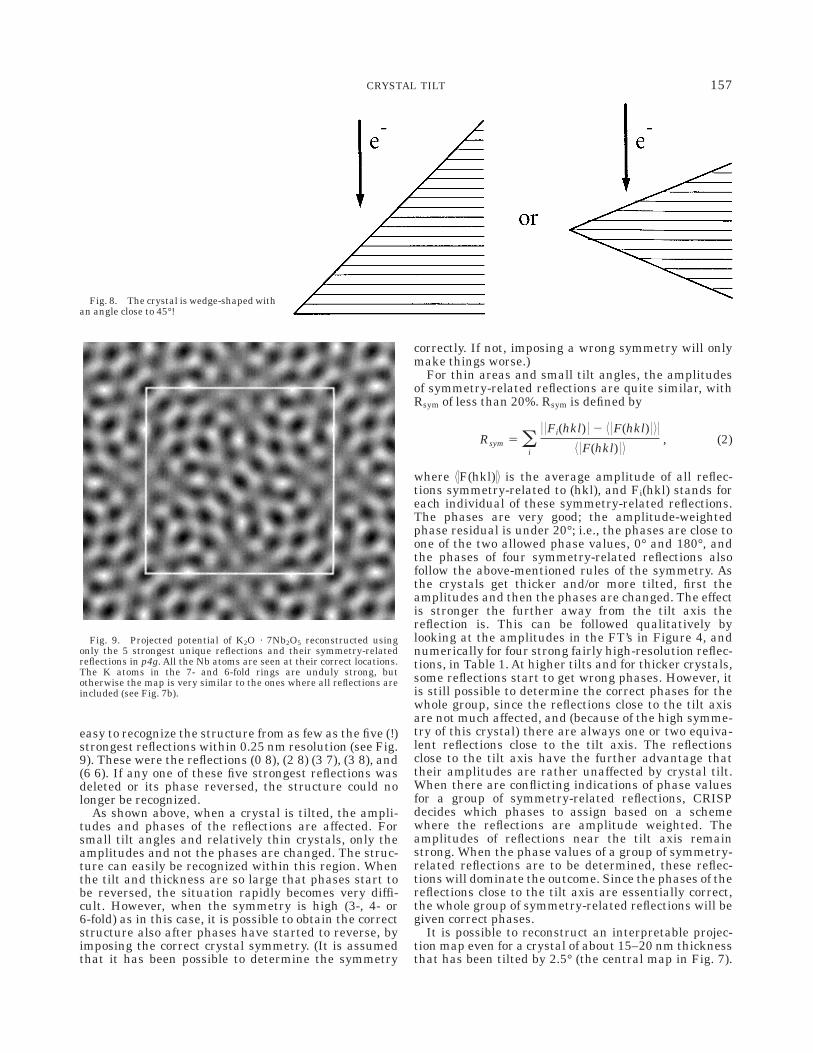
easy to recognize the structure from as few as the five (!)strongest reflections within 0.25 nm resolution (see Fig.9). These were the reflections (0 8), (2 8) (3 7), (3 8), and(6 6). If any one of these five strongest reflections wasdeleted or its phase reversed, the structure could nolonger be recognized.
As shown above, when a crystal is tilted, the ampli-tudes and phases of the reflections are affected. Forsmall tilt angles and relatively thin crystals, only theamplitudes and not the phases are changed. The struc-ture can easily be recognized within this region. Whenthe tilt and thickness are so large that phases start tobe reversed, the situation rapidly becomes very diffi-cult. However, when the symmetry is high (3-, 4- or6-fold) as in this case, it is possible to obtain the correctstructure also after phases have started to reverse, byimposing the correct crystal symmetry. (It is assumedthat it has been possible to determine the symmetry
correctly. If not, imposing a wrong symmetry will onlymake things worse.)
For thin areas and small tilt angles, the amplitudesof symmetry-related reflections are quite similar, withRsym of less than 20%. Rsym is defined by
Rsym 5 oi
0 0Fi(hkl) 0 2 7 0F(hkl) 0 8 0
7 0F(hkl) 0 8, (2)
where 70F(hkl)08 is the average amplitude of all reflec-tions symmetry-related to (hkl), and Fi(hkl) stands foreach individual of these symmetry-related reflections.The phases are very good; the amplitude-weightedphase residual is under 20°; i.e., the phases are close toone of the two allowed phase values, 0° and 180°, andthe phases of four symmetry-related reflections alsofollow the above-mentioned rules of the symmetry. Asthe crystals get thicker and/or more tilted, first theamplitudes and then the phases are changed. The effectis stronger the further away from the tilt axis thereflection is. This can be followed qualitatively bylooking at the amplitudes in the FT’s in Figure 4, andnumerically for four strong fairly high-resolution reflec-tions, in Table 1. At higher tilts and for thicker crystals,some reflections start to get wrong phases. However, itis still possible to determine the correct phases for thewhole group, since the reflections close to the tilt axisare not much affected, and (because of the high symme-try of this crystal) there are always one or two equiva-lent reflections close to the tilt axis. The reflectionsclose to the tilt axis have the further advantage thattheir amplitudes are rather unaffected by crystal tilt.When there are conflicting indications of phase valuesfor a group of symmetry-related reflections, CRISPdecides which phases to assign based on a schemewhere the reflections are amplitude weighted. Theamplitudes of reflections near the tilt axis remainstrong. When the phase values of a group of symmetry-related reflections are to be determined, these reflec-tions will dominate the outcome. Since the phases of thereflections close to the tilt axis are essentially correct,the whole group of symmetry-related reflections will begiven correct phases.
It is possible to reconstruct an interpretable projec-tion map even for a crystal of about 15–20 nm thicknessthat has been tilted by 2.5° (the central map in Fig. 7).
Fig. 8. The crystal is wedge-shaped withan angle close to 45°!
Fig. 9. Projected potential of K2O · 7Nb2O5 reconstructed usingonly the 5 strongest unique reflections and their symmetry-relatedreflections in p4g. All the Nb atoms are seen at their correct locations.The K atoms in the 7- and 6-fold rings are unduly strong, butotherwise the map is very similar to the ones where all reflections areincluded (see Fig. 7b).
157CRYSTAL TILT
The FT of this area is shown in the center of Figure 4. Itis evident that the amplitudes of more than half thereflections are approaching zero. Furthermore, all thestrong reflections around (6, 6) have reversed phases atthis tilt and thickness, as can be seen from Figure 5.The reason why the structure can be reconstructedeven from such a distorted image is that there areenough well-estimated reflections in the band of reflec-tions around the tilt axis. Due to the high symmetry, atleast one of the reflections from each group of symmetry-related reflections is close to the tilt axis. Those reflec-tions have the largest amplitudes in each group ofsymmetry-related reflections and their phases are stillclose to the correct ones. Since these are the strongestreflections in each group, they will force the wholegroup to get correct phase values. This is enough toreconstruct all unique reflections, with virtually nophase errors, and from this an interpretable map isobtained by inverse FT.
If the crystal is too thick and/or too much tilted, it isnot possible to reconstruct the structure (see the threemaps in the bottom right of Fig. 7). The reason isobvious from looking at the FT’s (Fig. 4); there are toofew well-measured reflections in the very narrow bandaround the tilt axis. Even after applying the high p4gsymmetry, many groups of strong reflections had nomember close enough to the tilt axis, and thus thereflections could not be correctly phased.
DISCUSSIONProbably the most surprising result of this study is
that such a transparent crystal as the one used herehas a wedge angle of close to 45° and thus rapidlybecomes quite thick. It must be expected that othercrystals of approximately similar chemical composition(metal oxides) and similar thickness are equally elec-tron transparent.
Another remarkable conclusion is that it is possibleto reconstruct the crystal structure from HRTEM im-ages from areas with a thickness of 10–20 nm.
The experimentally quantified effects of crystal tiltand thickness described here (Fig. 6 and Table 1) followclosely what was theoretically predicted (Zou, 1995).The smooth and well-behaved changes of amplitudesand stability of phases over a wide range of thicknessand tilt may explain why crystallographic image pro-cessing has been so successful in solving unknowncrystal structures from HRTEM images.
It should be stressed that the reason why we chose acrystal with so high a symmetry for this study was thatwe wanted the ‘‘internal standards’’ of symmetry-related reflections, which we know have identical struc-ture factors, in order to obtain quantitative results.
It was possible to reconstruct a very clear and correctprojected potential map from areas of about 20 nmthickness, tilted by 2.5°. For crystals with lower symme-try, it will not necessarily be possible to reconstruct thestructure from such thick and highly tilted crystals. Asomewhat modified approach must be taken for crystalswith lower symmetry. If the effects of tilt are not solarge that the phases of some strong high-resolutionreflections have been reversed, then it may suffice toreplace the amplitudes from the HRTEM images byamplitudes determined from SAED patterns. An evenmore elaborate scheme could be to locate the tilt axis,
then quantify the thickness and tilt angle and finallycorrect the amplitudes and phases of those reflections,by multiplying with the inverse of formula (1). How-ever, in practice, the simplest and best procedure is toalign the crystal to within a fraction of a degree, andthen to process the thinnest area near the edge of atransparent crystal. Typically the amplitudes are cor-rect to within 20% and the phases to within 20–30° insuch cases. If the crystal has a 2-fold axis parallel to theelectron beam, then the projection is centrosymmetric,and the phases can be further improved by setting themto the nearest of 0° and 180°. The defocus must ofcourse be checked by inspecting the FT and if the imageturns out not to have been taken very close to Scherzerdefocus, a correction must be applied, as described (Zouet al., 1996). If the image is taken along a short unit celldimension (,5 Å) and the resolution of the electronmicroscope is high enough for resolving the features ofinterest (about 0.25 nm resolution for metals in oxidesand about 0.17 nm for alloys), the structure can besolved from a single projection. If the shortest crystalaxis is larger than about 6 Å, it is necessary to make a3D structure determination, by combining views alongseveral zone axes.
The accuracy of co-ordinates for the metal atoms inthis structure, after reconstruction by crystallographicimage processing, is 0.1 to 0.2 Å. This is sufficientlyclose to the correct values to serve as a starting point forthe final step in a structure determination—the refine-ment (Weirich et al., 1996).
The method presented here can be used routinely forthickness determination, such that any comparisonswith image simulations then are done with experimen-tally determined, rather than guessed, thickness val-ues. This could be very useful for quantitative compari-sons between experimental and simulated images, afield that is just emerging (Kilaas, 1997).
CONCLUSIONCrystal structures can be solved from HRTEM im-
ages because the crystallographic structure factors canbe determined with sufficient accuracy from the ampli-tudes and phases of the FT of HRTEM images. Astructure can be deduced directly from an HRTEMimage only if the experimental conditions are within avery narrow range of optimal. With image processing, itis possible to extend the range of experimental condi-tions considerably. This greatly facilitates structuredetermination from HRTEM images.
It is now possible to determine all the parameters—defocus, astigmatism, tilt, and thickness—experimen-tally, so there is no longer any need to simulate a set ofimages with guessed focus and thickness values. Sincethe thickness can be experimentally determined, it ispossible to say with certainty which (if any) parts of acrystal are sufficiently thin for the weak phase objectapproximation to be satisfied.
The conclusions of the present investigation are verydifferent from those of Jansen et al. (1998) who claimthat ‘‘the kinematical diffraction theory can only beapplied for thicknesses up to about 2 nm for strongscatterers.’’ The reasons for these highly divergentopinions need to be found out by future collaborativeefforts, where the different methods are applied on thesame samples.
158 S. HOVMOLLER AND X.D. ZOU
ACKNOWLEDGMENTSThe crystals of K2O · 7Nb2O5 were kindly provided by
Dr. Q.Z. Wu, Institute of Physics, Chinese Academy ofSciences, Beijing. The HRTEM images were taken atthe National Center for Electron Microscopy in Lund.
REFERENCESBhide V, Gasparin M. 1979. A new GTB-type thallium niobate. Acta
Cryst B35:1318–1321.Downing KH, Meisheng Hu, Wenk H-R, O’Keefe MA. 1990. Resolution
of oxygen atoms in staurolite by three-dimensional transmissionelectron microscopy. Nature 348:525–528.
Erickson HP, Klug A. 1971. Measurement and compensation ofdefocusing and aberrations by Fourier processing of electron micro-graphs. Phil Trans R Soc Lond B261:105–118.
Han SF, Fan HF, Li FH. 1986. Image processing in high-resolutionelectron microscopy using the direct method. II. Image deconvolu-tion. Acta Cryst A42:353–356.
Hovmoller S. 1981. Origin specification. In part published in PamphletSeries issued by the Education Committee of the Int Union Crystal-logr 9:1–11.
Hovmoller S. 1992. CRISP: Crystallographic image processing on apersonal computer. Ultramicroscopy 40:121–135.
Hovmoller S. 1997. The effects of symmetry in real and reciprocalspace. In: Dorset DL, Hovmoller S, Zou XD, editors. Electroncrystallography. Nato ASI Series E. Kluwer Academic Publishers.347:139–150.
Hovmoller S, Sjogren A, Farrants G, Sundberg M, Marinder BO. 1984.Accurate atomic positions from electron microscopy. Nature 311:238–241.
Hu JJ, Li FH, Fan HF. 1992. Crystal structure determination ofK20 · 7Nb205 by combining high-resolution electron microscopy andelectron diffraction. Ultramicroscopy 41:387–397.
Jansen J, Tang D, Zandbergen HW, Schenk H. 1998. MSLS, aleast-squares procedure for accurate crystal structure refinementfrom dynamical electron diffraction patterns. Acta Cryst A54:91–101.
Kilaas R. 1997. Structure refinement through matching of experimen-tal and simulated HRTEM images. In: Dorset DL, Hovmoller S, ZouXD, editors. Electron crystallography. Nato ASI Series E. Dordrecht:Kluwer Academic Publishers 347:247–260.
Li FH. 1998. Image processing based on the combination of high-resolution electron microscopy and electron diffraction. Microsc ResTech 40:86–100.
O’Keefe MA, Radmilovic V. 1993. The effects of small crystal tilts ondynamical scattering: Why simulated images are thinner thanexperimental ones. Cincinatti, OH: 51st Ann Proc Microsc Soc Am p980–981.
Saxton WO, Smith DJ. 1985. The determination of atomic positions inhigh-resolution electron micrographs. Ultramicroscopy 18:39–48.
Spence JCH, Cowley JM. 1995. Electron diffraction. In: Wilson AJC,editor. International tables for crystallography, Vol C. DordrechtKluwer Academic Publishers. p 371.
Unwin PNT, Henderson R. 1975. Molecular structure determinationby electron microscopy of unstained crystalline specimens. J MolBiol 94:425–440.
Van Dyck D, Lichte H, Van der Mast KD. 1996. Sub-Ångstromstructure characterisation: the brite-euram route towards one Ång-strom. Ultramicroscopy 64:1–15.
Wang DN, Hovmoller S, Kihlborg L, Sundberg M. 1988. Structuredetermination and correction for distortions in HREM by crystallo-graphic image processing. Ultramicroscopy 25:303–316.
Weirich T, Ramlau R, Simon A, Zou XD, Hovmoller S. 1996. A crystalstructure determined to 0.02 Å accuracy by electron microscopy.Nature 382:144–146.
Zou XD. 1995. Electron crystallography of inorganic structures: theoryand practice. Chem Commun 5, Stockholm University, Doctoralthesis.
Zou XD, Ferrow EA, Hovmoller S. 1995. Correcting for crystal tilt inHRTEM images of minerals: the case of orthopyroxene. Phys ChemMinerals 22:89–92.
Zou XD, Sundberg M, Larine M, Hovmoller S. 1996. Structureprojection retrieval by image processing of HREM images takenunder non-optimal defocus conditions. Ultramicroscopy 62:103–121.
159CRYSTAL TILT