measurement and analysis of online social networksmmarcon/socialnetworks-imc.pdf · measurement and...
TRANSCRIPT

Measurement and Analysis of Online Social Networks
Alan MisloveMPI for Software Systems
Campus E1 4Saarbrücken 66123, Germany
Massimiliano MarconMPI for Software Systems
Campus E1 4Saarbrücken 66123, Germany
Krishna P. GummadiMPI for Software Systems
Campus E1 4Saarbrücken 66123, Germany
Peter DruschelMPI for Software Systems
Campus E1 4Saarbrücken 66123, Germany
Bobby BhattacharjeeComputer Science Department
University of MarylandCollege Park, MD 20742
ABSTRACTOnline social networking sites like Orkut, YouTube, andFlickr are among the most popular sites on the Internet.Users of these sites form a social network, which providesa powerful means of sharing, organizing, and finding con-tent and contacts. The popularity of these sites providesan opportunity to study the characteristics of online socialnetwork graphs at large scale. Understanding these graphsis important, both to improve current systems and to designnew applications of online social networks.
This paper presents a large-scale measurement study andanalysis of the structure of multiple online social networks.We examine data gathered from four popular online socialnetworks: Flickr, YouTube, LiveJournal, and Orkut. Wecrawled the publicly accessible user links on each site, ob-taining a large portion of each social network’s graph. Ourdata set contains over 11.3 million users and 328 millionlinks. We believe that this is the first study to examinemultiple online social networks at scale.
Our results confirm the power-law, small-world, and scale-free properties of online social networks. We observe that theindegree of user nodes tends to match the outdegree; thatthe networks contain a densely connected core of high-degreenodes; and that this core links small groups of strongly clus-tered, low-degree nodes at the fringes of the network. Fi-nally, we discuss the implications of these structural prop-erties for the design of social network based systems.
Categories and Subject DescriptorsH.5.m [Information Interfaces and Presentation]: Mis-cellaneous; H.3.5 [Information Storage and Retrieval]:Online Information Services—Web-based services
General TermsMeasurement
Permission to make digital or hard copies of all or part of this work forpersonal or classroom use is granted without fee provided that copies arenot made or distributed for profit or commercial advantage and that copiesbear this notice and the full citation on the first page. To copy otherwise, torepublish, to post on servers or to redistribute to lists, requires prior specificpermission and/or a fee.IMC’07, October 24-26, 2007, San Diego, California, USA.Copyright 2007 ACM 978-1-59593-908-1/07/0010 ...$5.00.
KeywordsSocial networks, measurement, analysis
1. INTRODUCTIONThe Internet has spawned different types of informationsharing systems, including the Web. Recently, online so-cial networks have gained significant popularity and are nowamong the most popular sites on the Web [40]. For example,MySpace (over 190 million users1), Orkut (over 62 million),LinkedIn (over 11 million), and LiveJournal (over 5.5 mil-lion) are popular sites built on social networks.
Unlike the Web, which is largely organized around con-tent, online social networks are organized around users. Par-ticipating users join a network, publish their profile and anycontent, and create links to any other users with whom theyassociate. The resulting social network provides a basis formaintaining social relationships, for finding users with sim-ilar interests, and for locating content and knowledge thathas been contributed or endorsed by other users.
An in-depth understanding of the graph structure of on-line social networks is necessary to evaluate current systems,to design future online social network based systems, andto understand the impact of online social networks on theInternet. For example, understanding the structure of on-line social networks might lead to algorithms that can de-tect trusted or influential users, much like the study of theWeb graph led to the discovery of algorithms for finding au-thoritative sources in the Web [21]. Moreover, recent workhas proposed the use of social networks to mitigate emailspam [17], to improve Internet search [35], and to defendagainst Sybil attacks [55]. However, these systems have notyet been evaluated on real social networks at scale, and lit-tle is known to date on how to synthesize realistic socialnetwork graphs.
In this paper, we present a large-scale (11.3 million users,328 million links) measurement study and analysis of thestructure of four popular online social networks: Flickr,YouTube, LiveJournal, and Orkut. Data gathered from mul-tiple sites enables us to identify common structural proper-ties of online social networks. We believe that ours is thefirst study to examine multiple online social networks atscale. We obtained our data by crawling publicly accessibleinformation on these sites, and we make the data available
1Number of distinct identities as reported by the respectivesites in July 2007.

to the research community. In contrast, previous studieshave generally relied on propreitary data obtained from theoperators of a single large network [4].
In addition to validating the power-law, small-world andscale-free properties previously observed in offline social net-works, we provide insights into online social network struc-tures. We observe a high degree of reciprocity in directeduser links, leading to a strong correlation between user inde-gree and outdegree. This differs from content graphs like thegraph formed by Web hyperlinks, where the popular pages(authorities) and the pages with many references (hubs) aredistinct. We find that online social networks contain a large,strongly connected core of high-degree nodes, surrounded bymany small clusters of low-degree nodes. This suggests thathigh-degree nodes in the core are critical for the connectivityand the flow of information in these networks.
The focus of our work is the social network users withinthe sites we study. More specifically, we study the propertiesof the large weakly connected component2 (WCC) in theuser graphs of four popular sites. We do not attempt tostudy the entire user community (which would include userswho do not use the social networking features), informationflow, workload, or evolution of online social networking sites.While these topics are important, they are beyond the scopeof this paper.
The rest of this paper is organized as follows: We provideadditional background on social networks in Section 2 anddetail related work in Section 3. We describe our methodol-ogy for crawling these networks, and its limitations, in Sec-tion 4. We examine structural properties of the networks inSection 5, and discuss the implications in Section 6. Finally,we conclude in Section 7.
2. BACKGROUND AND MOTIVATIONWe begin with a brief overview of online social networks. Wethen describe a simple experiment we conducted to estimatehow often the links between users are used to locate contentin a social networking site like Flickr. Finally, we discuss theimportance of understanding the structure of online socialnetworks.
Online social networks have existed since the beginning ofthe Internet. For instance, the graph formed by email userswho exchange messages with each other forms an online so-cial network. However, it has been difficult to study thisnetwork at large scale due to its distributed nature.
Popular online social networking sites like Flickr, You-Tube, Orkut, and LiveJournal rely on an explicit user graphto organize, locate, and share content as well as contacts.In many of these sites, links between users are public andcan be crawled automatically to capture and study a largefraction of the connected user graph. These sites present anopportunity to measure and study online social networks ata large scale.
2.1 Online social networking sitesOnline social networking sites are usually run by individualcorporations (e.g. Google and Yahoo!), and are accessiblevia the Web.
2A weakly connected component in a directed graph is a setof nodes where each node in the set has a path to every othernode in the set if all links are viewed as undirected.
Users. To participate fully in an online social network, usersmust register with a site, possibly under a pseudonym.3
Some sites allow browsing of public data without explicitsign-up. Users may volunteer information about themselves(e.g., their birthday, place of residence, or interests), whichis added to the user’s profile.
Links. The social network is composed of user accounts andlinks between users. Some sites (e.g. Flickr, LiveJournal)allow users to link to any other user, without consent fromthe link target. Other sites (e.g. Orkut, LinkedIn) requireconsent from both the creator and target before a link iscreated connecting these users.
Users form links for one of several reasons. The nodesconnected by a link can be real-world acquaintances, onlineacquaintances, or business contacts; they can share an in-terest; or they can be interested in each other’s contributedcontent. Some users even see the acquisition of many linksas a goal in itself [14]. User links in social networks can servethe purpose of both hyperlinks and bookmarks in the Web.
A user’s links, along with her profile, are visible to thosewho visit the user’s account. Thus, users are able to explorethe social network by following user-to-user links, brows-ing the profile information and any contributed content ofvisited users as they go. Certain sites, such as LinkedIn,only allow a user to browse other user accounts within herneighborhood (i.e. a user can only view other users that arewithin two hops in the social network); other sites, includ-ing the ones we study, allow users to view any other useraccount in the system.
Groups. Most sites enable users to create and join specialinterest groups. Users can post messages to groups and up-load shared content to the group. Certain groups are mod-erated; admission to such a group and postings to a groupare controlled by a user designated as the group’s modera-tor. Other groups are unrestricted, allowing any member tojoin and post messages or content.
2.1.1 Is the social network used in locating content?Of the four popular social networking sites we study in thispaper, only Orkut is a “pure” social networking site, in thesense that the primary purpose of the site is finding and con-necting to new users. Others are intended primarily for pub-lishing, organizing, and locating content; Flickr, YouTube,and LiveJournal are used for sharing photographs, videos,and blogs, respectively.
To investigate the role played by the social network in or-ganizing and locating content, we conducted a simple mea-surement of how users browse the Flickr system. We ana-lyzed the HTTP requests going to the flickr.com domainfrom a 55-day HTTP trace taken at the border routers ofthe Technical University of Munich between August 17th,2006 and October 11th, 2006. We found 22,215 photo viewsfrom at least 1,056 distinct users. For each of these views,we examined the browser’s click stream to determine whataction led the user to a given photo.
We found that 17,897 of the views (80.6%) resulted ei-ther from following links in the Flickr user graph or were
3In the rest of this paper, we use the term “user” to de-note a single unique identity in a social network. A personmay create multiple identities, and may even create links be-tween these identities. We consider each of these identitiesas separate users.
additional views within a visited user’s collection. In otherwords, in 80.6% of the views, the user network was involvedin browsing content. We count these views as being influ-enced by the social network. Focusing on the remainingviews, 1,418 (6.3%) views were the result of using the Flickrphoto search facilities. The remaining 2,900 (13.1%) viewswere the result of a link from an external source, such aslinks from an external site or links received via email. Nei-ther of the latter sets of views involved the social network.
Our experiment suggests that the social network in Flickrplays an important role in locating content. Four out of fivephotos were located by traversing the social network links.
2.2 Why study social networks?Online social networks are already at the heart of some verypopular Web sites. As the technology matures, more ap-plications are likely to emerge. It is also likely that socialnetworking will play an important role in future personaland commercial online interaction, as well as the locationand organization of information and knowledge. Examplesinclude browser plug-ins to discover information viewed byfriends [39, 50], and social network based, cooperative Websearch tools [35]. Even major Web search companies are de-ploying services that leverage social networks, like Yahoo!’sMyWeb 2.0 [54] and Google Co-op [19].
Below, we outline a few of the ways is which an under-standing of the structure of online social networks can ben-efit the design of new systems and help us understand theimpact of online social networks on the future Internet. Ad-ditionally, we speculate how our data might be of interest toresearchers in other disciplines.
2.2.1 Shared interest and trustAdjacent users in a social network tend to trust each other.A number of research systems have been proposed to ex-ploit this trust. SybilGuard [55] uses a social network todetect Sybil attacks in distributed systems, leveraging thefact that Sybil users will not be able to create many trustlinks to non-Sybil users. Re [17] exploits the trust betweenemail users to aid spam classification by whitelisting mes-sages from friends and friends-of-friends. We believe that adeeper understanding of the underlying topology is an es-sential first step in the design and analysis of robust trustand reputation metrics for these systems.
Adjacent users in a social network also tend to have com-mon interests. Users browse neighboring regions of theirsocial network because they are likely to find content that isof interest to them. Systems such as Yahoo! My Web [54],Google Co-op [19], and PeerSpective [35] use social networksto rank Internet search results relative to the interests ofa user’s neighborhood in the social network. These sys-tems observe content viewed and search results clicked onby members of a social network in order to better rank theresults of the user’s future searches.
Understanding the structure of online social networks, aswell as the processes that shape them, is important for theseapplications. It would be useful to have efficient algorithmsto infer the actual degree of shared interest between twousers, or the reliability of a user (as perceived by otherusers). With respect to security, it is important to under-stand the robustness of such networks to deliberate attemptsof manipulation. These topics are beyond the scope of thispaper; however, a fundamental understanding of online so-
cial network structure is likely to be a necessary first step inthese directions.
2.2.2 Impact on future InternetThe social networks we study in this paper exist in thedatabases of online social networking sites. However, otheronline social networks are implemented as overlay networks.For instance, the graph formed by people who exchangeemail, or the graph formed by Skype [49] users who includeeach other in their contact lists can be viewed as anothersocial network on top of the Internet. If future distributedonline social networks are popular and bandwidth-intensive,they can have a significant impact on Internet traffic, just ascurrent peer-to-peer content distribution networks do. Un-derstanding the structure of online social networks is notonly critical to understanding the robustness and security ofdistributed online social networks, but also to understandingtheir impact on the future Internet.
2.2.3 Impact on other disciplinesAdditionally, our work has relevance beyond computer sci-ence. To social scientists, online social networks offer an un-precedented opportunity to study social networks at a largescale. Sociologists can examine our data to test existing the-ories about offline social networks, as well as to look for newforms of behavior in online social networks.
Studying the structure of online social networks may helpimprove the understanding of online campaigning and viralmarketing. Political campaigns have realized the importanceof blogs in elections [47]. Similarly, marketing experts areexperimenting with paid viral marketing [44] to better pro-mote products and companies. Regardless of one’s stance onthese phenomena, a better understanding of the structure ofsocial networks is likely to improve our understanding of theopportunities, limitations, and threats associated with theseideas.
3. RELATED WORKIn this section we describe studies of social networks, in-formation networks, as well as work on complex networktheory.
3.1 Social networksSociologists have studied many of the properties of socialnetworks. Milgram [34] shows that the average path lengthbetween two Americans is 6 hops, and Pool and Kochen [46]provide an analysis of the small-world effect. The influentialpaper by Granovetter [20] argues that a social network canbe partitioned into ‘strong’ and ‘weak’ ties, and that thestrong ties are tightly clustered. For an overview of socialnetwork analysis techniques, we refer the reader to the bookby Wasserman and Faust [51].
As online social networks are gaining popularity, sociol-ogists and computer scientists are beginning to investigatetheir properties. Adamic et al. [3] study an early onlinesocial network at Stanford University, and find that the net-work exhibits small-world behavior, as well as significantlocal clustering. Liben-Nowell et al. [32] find a strong cor-relation between friendship and geographic location in so-cial networks by using data from LiveJournal. Kumar etal. [26] examine two online social networks and find thatboth possess a large strongly connected component. Girvanand Newman observe that users in online social networks

tend to form tightly knit groups [18]. Backstrom et al. [8]examine snapshots of group membership in LiveJournal, andpresent models for the growth of user groups over time. Wewere able to verify these properties on a much larger scale.
In recent work, Ahn et al. [4] analyze complete data from alarge South Korean social networking site (Cyworld), alongwith data from small sample crawls of MySpace and Orkut.The authors obtained data directly from CyWorld opera-tors, and the volume of available data allows the authorsto conduct an in-depth study of that site using some of thesame metrics that we use in this paper. The comparisonwith different networks, on the other hand, is limited by thesmall crawled data samples of MySpace and Orkut. Ourstudy is largely complementary: the data available to us forany one site is less detailed, but we are able to compare largecrawled data sets from multiple sites.
3.2 Information networksA long thread of research examines the structure of com-plex networks like the Web and the Internet. A prominentstudy of the Web link structure [12] shows that the Web hasa “bow-tie” shape, consisting of a single large strongly con-nected component4 (SCC), and other groups of nodes thatcan either reach the SCC or can be reached from the SCC.We show that online social networks have a similar largecomponent, but that its relative size is much larger thanthat of the Web’s SCC. Faloutsos et al. [16] show that thedegree distribution of the Internet follows a power-law, andSiganos et al. demonstrate that the high-level structure ofthe Internet resembles a “jellyfish” [48].
Kleinberg [24] demonstrates that high-degree pages in theWeb can be identified by their function as either hubs (con-taining useful references on a subject) or authorities (con-taining relevant information on a subject). Kleinberg alsopresents an algorithm [21] for inferring which pages functionas hubs and which as authorities. The well-known PageRankalgorithm [43] uses the Web structure to determine pagesthat contain authoritative information.
3.3 Complex network theoryThere has been much theoretical work on the properties ofvarious classes of complex graphs.
Random networks have been extensively studied, startingwith the seminal paper by Erdos and Reyni [15]. Thesegraphs are usually constructed by randomly adding linksto a static set of nodes. Researchers have shown that ran-dom graphs tend to have very short paths between any twonodes [25]. More recent work on random graphs has pro-vided mechanisms to construct graphs with specified degreedistributions [36] and has characterized the size of the largeconnected component [37].
Power-law networks are networks where the probabilitythat a node has degree k is proportional to k−γ , for large k
and γ > 1. The parameter γ is called the power-law coef-ficient. Researchers have shown that many real-world net-works are power-law networks, including Internet topolo-gies [16], the Web [9, 27], social networks [3], neural net-works [11], and power grids [45].
Scale-free networks are a class of power-law networks wherethe high-degree nodes tend to be connected to other high-
4A strongly connected component in a graph is a set of nodeswhere each node in the set has a path to every other nodein the set.
degree nodes. Scale-free graphs are discussed in detail by Liet al. [31], and they propose a metric to measure the scale-freeness of graphs. Expectedly, the social networks we studydisplay power-law distributions; by Li’s measure, these net-works show scale-free properties as well.
Small-world networks have a small diameter and exhibithigh clustering. Studies have shown that the Web [5,12], sci-entific collaboration on research papers [41], film actors [6],and general social networks [3] have small-world properties.Kleinberg [23] proposes a model to explain the small-worldphenomenon in offline social networks, and also examinesnavigability in these networks [22]. The online social net-works examined in this paper have small-world propertiesmuch like their offline counterparts.
4. MEASUREMENT METHODOLOGYWe now describe the data presented in this paper and themethodology we used to collect it. We were not able to ob-tain data directly from the respective site operators. Mostsites are hesitant to provide even anonymized data, and sign-ing non-disclosure agreements to obtain data from multiplecompeting sites may not be feasible or desirable. Instead,we chose to crawl the user graphs by accessing the publicweb interface provided by the sites. This methodology givesus access to large data sets from multiple sites.
Since the focus of this paper is to investigate the struc-ture of online social networks, we focus on the large weaklyconnected component (WCC) of the corresponding graphsin the rest of this paper. As we show later in this section,the large WCC is structurally the most “interesting” partof the network. The nodes not included in the WCC tendto be either part of very small, isolated clusters or are notconnected to other users at all.
4.1 Challenges in crawling large graphsCrawling large, complex graphs presents unique challenges.In this section, we describe our general approach before dis-cussing the details of how we crawled each network.
4.1.1 Crawling the entire connected componentThe primary challenge in crawling large graphs is coveringthe entire connected component. At each step, one can gen-erally only obtain the set of links into or out of a specifiednode. In the case of online social networks, crawling thegraph efficiently is important since the graphs are large andhighly dynamic. Common algorithms for crawling graphsinclude breadth-first search (BFS) and depth-first search.
Often, crawling an entire connected component is not fea-sible, and one must resort to using samples of the graph.Crawling only a subset of a graph by ending a BFS early(called the snowball method) is known to produce a biasedsample of nodes [29]. In particular, partial BFS crawls arelikely to overestimate node degree and underestimate thelevel of symmetry [10]. In social network graphs, collectingsamples via the snowball method has been shown to un-derestimate the power-law coefficient, but to more closelymatch other metrics, including the overall clustering coeffi-cient [29].
Some previous studies of social networks have used smallgraph samples. Example studies have used samples of 0.3%of Orkut users [4], less than 1% of LiveJournal communi-ties [8], and 0.08% of MySpace users [4]. In this paper, weobtain and study much larger samples of the user graphs.

Flickr LiveJournal Orkut YouTubeNumber of users 1,846,198 5,284,457 3,072,441 1,157,827Estimated fraction of user population crawled 26.9% 95.4% 11.3% unknownDates of crawl Jan 9, 2007 Dec 9 - 11, 2006 Oct 3 - Nov 11, 2006 Jan 15, 2007Number of friend links 22,613,981 77,402,652 223,534,301 4,945,382Average number of friends per user 12.24 16.97 106.1 4.29Fraction of links symmetric 62.0% 73.5% 100.0% 79.1%Number of user groups 103,648 7,489,073 8,730,859 30,087Average number of groups memberships per user 4.62 21.25 106.44 0.25
Table 1: High-level statistics of our social networking site crawls.
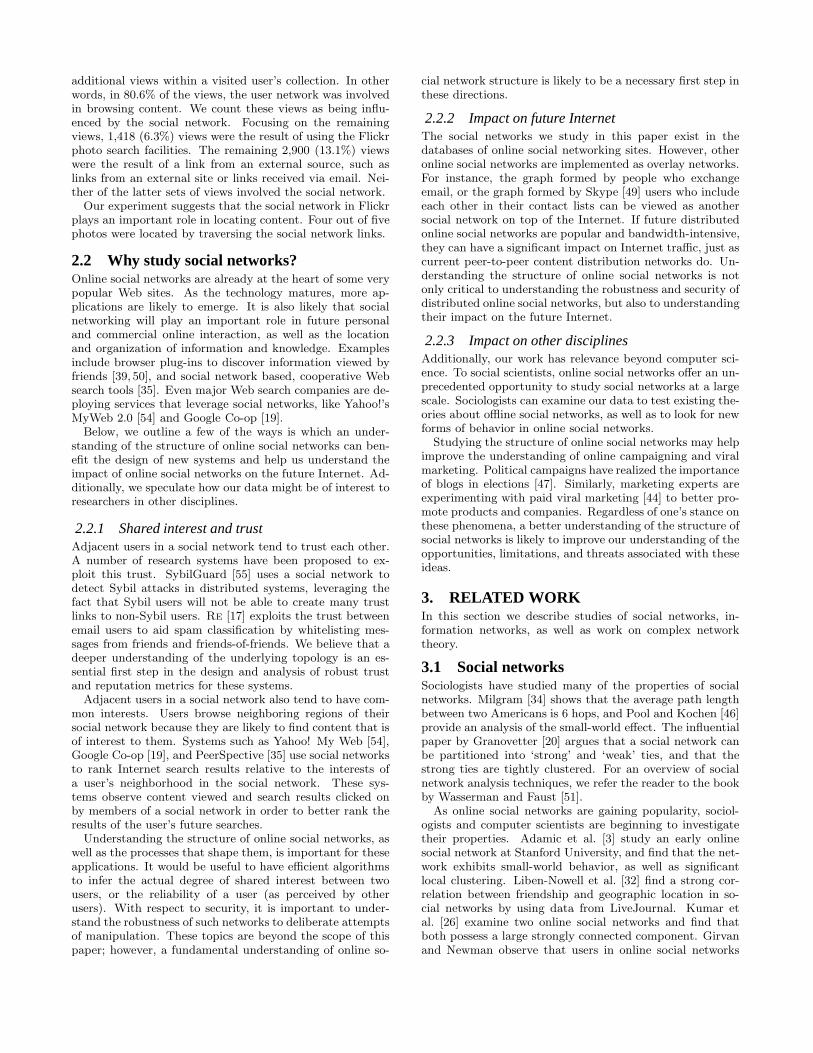
4.1.2 Using only forward linksCrawling directed graphs, as opposed to undirected graphs,presents additional challenges. In particular, many graphscan only be crawled by following links in the forward direc-tion (i.e., one cannot easily determine the set of nodes whichpoint into a given node). Using only forward links does notnecessarily crawl an entire WCC; instead, it explores theconnected component reachable from the set of seed users.This limitation is typical for studies that crawl online net-works, including measurement studies of the Web [12].
START
ONLY USING
FORWARD LINKS
USING
BOTH FORWARD
AND REVERSE LINKS
Figure 1: Users reached by crawling different linktypes. If only forward links are used, we can reachonly the inner cloud (shaded cloud); using bothforward and reverse links crawls the entire WCC(dashed cloud).
Figure 1 shows an example of a directed graph crawl. Theusers reached by following only forward links are shown inthe shaded cloud, and those reached using both forward andreverse links are shown in the dashed cloud. Using both for-ward and reverse links allows us to crawl the entire WCC,while using only forward links results in a subset of theWCC.
4.2 Crawling social networksWe now discuss our methodology for crawling each of thenetworks we crawled, its limitations, and high-level statisticsof the resulting data sets. Using automated scripts on a clus-ter of 58 machines, we crawled the social network graphs ofFlickr, LiveJournal, Orkut, and YouTube. High-level statis-tics of the resulting data sets are presented in Table 1.
We chose these four sites because they are among the mostpopular social networking sites and they allow us to viewthe links out of any user in the network. In each step of ourcrawls, we retrieved the list of friends for a user we had notyet visited and added the retrieved users to the list of usersto visit. We continued until we exhausted the list. Thiscorresponds to a BFS of the social network graphs.
4.2.1 FlickrFlickr (www.flickr.com) is a photo-sharing site based ona social network. The Flickr data presented in this paperis from a crawl of the large WCC conducted on January9th, 2007, and contains over 1.8 million users and 22 millionlinks. Flickr exports an API for third-party developers, andwe used this API to conduct the crawl. We also obtainedgroup membership information via Flickr’s API.5
Flickr only allows us to query for forward links. Thereforewe were unable to crawl the entire large WCC. To estimatethe fraction of users who are part of the WCC but missing inour crawl, we performed the following experiment. We usedthe fact that the vast majority of Flickr user identifiers takethe form of [randomly selected 8 digit number]@N00. Wegenerated 100,000 random user identifiers of this form (froma possible pool of 90 million) and found that 6,902 (6.90%)of these were assigned usernames. These 6,902 nodes forma random sample of Flickr users.
Among these 6,902 users, 1,859 users (26.9%) had beendiscovered during our crawl. Focusing on the 5,043 usersnot previously discovered by our crawl, we conducted a BFSstarting at each user to determine whether or not they couldreach our set of previously crawled users. We found that only250 (5.0%) of the missed users could reach our crawled setand were definitively in the WCC. While we cannot conclu-sively say that the remaining 4,793 (95.0%) missed users arenot attached to the WCC (there could be some other userwho points to them and to the WCC), the fact that 89.7%of these have no forward links suggests that many are notconnected at all.
Finally, to explore how the remaining missing nodes areconnected, we crawled the social network using these missingusers as seeds, and compared the results with our initialcrawl. We found only 11,468 new nodes that were not inthe connected component of 1.8 million nodes discoveredin the original crawl. Of these new nodes, 5,142 (44.8%)were singleton nodes with no forward links, 3,370 (29.3%)had one link, 620 (5.4%) had two or three links, and 2,336(20.3%) had four or more links. Thus, the nodes missingfrom our crawls tend to have low degree and are connectedonly to small clusters that are not reachable from the largeconnected component we crawled.
Thus, we believe that our crawl of the large WCC, al-though not complete, covers a large fraction of the userswho are part of the WCC. Further, our experience with therandomly generated Flickr user identifiers indicates that (atleast for Flickr), the nodes not in the largest WCC do notform large subgraphs.
5Flickr allows users to form private groups, which do notappear in the user’s profile list. We were unable to determineany information about the membership of such groups.

4.2.2 LiveJournalLiveJournal (www.livejournal.com) is a popular bloggingsite whose users form a social network. The LiveJournaldata set considered in this paper is the largest we examine:it contains over 5.2 million users and 72 million links. Dueto its size, the LiveJournal crawl took several days, fromDecember 9-11, 2006. LiveJournal offers an API that al-lows us to query for both forward and reverse links. Wefollowed both link types to crawl the entire large WCC. Wealso obtained group membership information via LiveJour-nal’s API.6
To estimate the fraction of the LiveJournal network cov-ered by our crawl, we used a feature of LiveJournal7 thatreturns random users to select a list of 5,000 random Live-Journal users. We then checked how many of these randomusers our crawl had already covered. We found that we hadalready crawled 4,773 (95.4%) of these users, showing thatour LiveJournal crawl covers the vast majority of the Live-Journal population. Finally, we started another crawl fromthe previously unknown 227 users to determine how manyadditional users could be discovered. This technique foundonly 73 additional users. These results suggest that ourLiveJournal crawl covers almost the entire LiveJournal userpopulation, and that the users not included in our crawl arepart of small, isolated clusters.
Using the entire WCC from LiveJournal, we calculatedthe fraction of the WCC that is not reachable by usingonly forward links (as we did for the Flickr and YouTubecrawls). We found that of the 5,284,457 nodes in the dis-covered weakly connected component, only 404,134 (7.64%)would have been missed had we followed only forward links.Finally, we examined the 404,134 users who would have beenmissed to see how well these users were connected. We foundthat 201,694 (49.9%) of these users had a single forward link,86,561 (21.1%) had two or three links, and 78,463 (19.4%)of the users had four or more forward links. Since, as we willshow later, Flickr and YouTube share many characteristicswith LiveJournal, this result suggests that the users that aremissing in our Flickr and YouTube crawls tend to be smallin number and have relatively small outdegree.
4.2.3 OrkutThe next site we examined is Orkut (www.orkut.com), a so-cial networking site run by Google. Orkut is a “pure” socialnetwork, as the sole purpose of the site is social networking,and no content is being shared. In Orkut, links are undi-rected and link creation requires consent from the target.Since, at the time of the crawl, new users had to be invitedby an existing user to join the system, the Orkut graph formsa single SCC by definition.
The Orkut data considered in the paper was collected dur-ing a crawl performed between October 3rd and November11th, 2006. Because Orkut does not export an API, we hadto resort to HTML screen-scraping to conduct our crawl,which requires more bandwidth. We obtained group infor-mation in a similar manner. Furthermore, Orkut limits therate at which a single IP address can download informationand requires a logged-in account to browse the network. Asa result, it took more than a month to crawl a subset of
6We inferred groups in LiveJournal by crawling the interestsspecified by users.7http://www.livejournal.com/random.bml
3,072,441 users, at which point we stopped. This subset cor-responds to 11.3% of Orkut’s user population of about 27million users at the time of the crawl. The Orkut data con-sidered in this paper, therefore, is limited to this connectedcomponent and disregards all links from this component toother, uncrawled users.
Because our Orkut data set contains only a sample of theentire Orkut network, there are two potential concerns withthe representativeness of the data. The first question is howthe 11.3% subset of the network we gathered would compareto a different 11.3% subset gathered in the same way. Inother words, are the properties of our sample representativeof other samples of similar size? The second question is howthe properties of our sample compare to the properties ofthe network as a whole.
To explore the first of these concerns, we conducted fiveseparate, small crawls of Orkut starting from random lo-cations. Our random starting locations were chosen usingMaximum-Degree random sampling [7] configured with apath length of 100,000 hops. Each of the five crawls wasconfigured to cover 80,000 nodes in the same manner as oursingle, large crawl. We then examined how similar the prop-erties of the resulting samples were to each other.
We found that the properties of the five smaller crawlswere similar, even though these crawls covered only 0.26%of the network. For example, we found that the clusteringcoefficient of these crawls had an average of 0.284 with astandard deviation of 0.040. Similarly, we found that thescale-free metric had an average of 0.550 with a standarddeviation of 0.083 (both of these metrics are discussed inmore detail in the following section). Thus, we believe thatthe properties of our 11.3% sample of the network are likelyto be similar to other crawls of similar size that are done inthe same manner.
However, we caution the reader to be mindful of the sec-ond concern when extrapolating the results from our crawlto the entire Orkut network. Partial BFS crawls are knownto over-sample high-degree nodes, and under-sample low-degree nodes [29]. This has been shown to overestimate theaverage node degree and to underestimate the level of sym-metry [10]. Thus, our results may not be representative ofthe Orkut network as a whole.
4.2.4 YouTubeYouTube (www.youtube.com) is a popular video-sharing sitethat includes a social network. The YouTube data we presentwas obtained on January 15th, 2007 and consists of over1.1 million users and 4.9 million links. Similar to Flickr,YouTube exports an API, and we used this feature to con-duct our crawls.
YouTube allows links to be queried only in the forwarddirection, similar to Flickr. Unfortunately, YouTube’s useridentifiers do not follow a standard format,8 and we weretherefore unable to create a random sample of YouTubeusers. Also, YouTube does not export group informationvia the API. Instead, we obtained group membership infor-mation by screen-scraping the HTML pages attached to userprofiles.
Because we were unable to crawl reverse links or estimatethe size of the user population in YouTube, we advise thereader to be cautious in extrapolating the YouTube results
8YouTube’s user identifiers are user-specified strings.

to the entire YouTube population, as we do not know thenumber of users who do not participate in the social network.
4.2.5 SummaryOur results indicate that
• The Flickr and YouTube data sets may not containsome of the nodes in the large WCC, but this fractionis likely to be very small.
• The LiveJournal data set covers almost the completepopulation of LiveJournal, and contains the entire largeWCC.
• The Orkut data set represents a modest portion of thenetwork, and is subject to the sampling bias resultingfrom a partial BFS crawl.
Moreover, the results also indicate that the vast majorityof missed nodes in Flickr, LiveJournal, and YouTube havelow degree and are likely to be part of small, isolated clus-ters.
Based on the number of users published by the sites atthe time of the crawl, we estimate the fraction of nodesour crawls cover as 1.8 million out of 6.8 million (26.9%)for Flickr, 5.2 million of 5.5 million (95.4%) for LiveJour-nal, and 3.0 million out of 27 million (11.3%) for Orkut.Unfortunately, we do not know the number of accounts inYouTube. Thus, we were unable to estimate the fraction ofthe population that our 1.1 million crawled YouTube usersrepresent.
All of the data sets considered in this paper are availableto the research community. The data has been anonymizedin order to ensure the privacy of the social network users.A detailed description of the data format and downloadinginstructions are available athttp://socialnetworks.mpi-sws.mpg.de
4.3 High-level statisticsTable 1 presents the high-level statistics of the data we gath-ered. The crawled network sizes vary by almost a factor offive (1.1 million users in YouTube vs. 5.2 million in Live-Journal), and the number of links varies by almost two or-ders of magnitude (4.9 million in YouTube versus 223 mil-lion in Orkut). Similarly, other metrics such as the averagenumber of friend links per node and user participation inshared interest groups also vary by two to three orders ofmagnitude. Our analysis later will show that despite thesedifferences, these graphs share a surprisingly large numberof key structural properties.
4.4 Web graph analysisThe Web is one of the most well-studied online networks,and our study shares much of its methodology with previ-ous studies of the Web. It is natural to compare the struc-ture of online social networks to the structure of the Web.However, we are well aware that the user graph in social net-works is fundamentally different from the Web graph; ourcomparisons serve more to provide a point of reference forour results than to point out (expected) differences.
In order to compare the structure of online social net-works with that of the Web, we cite previous studies of theWeb structure where possible. We also performed some ofour own analysis, using the data collected by the StanfordWebBase Project [1] during their crawl of December 2003.
We selected 8.6 million pages and 132 million hyperlinkscollected from over 3,900 Web sites contained in the crawl.
5. ANALYSIS OF NETWORK STRUCTUREIn this section, we characterize the structural properties ofthe four networks we measured. We compare the networksto each other, and we compare their properties with thosepreviously observed for the Web.
5.1 Link symmetryThe fact that links are directed can be useful for locat-ing content in information networks. For example, in theWeb graph, search algorithms such as PageRank [43] con-sider a directed link from a source to a destination as anendorsement of the destination by the source, but not vice-versa. For instance, numerous Web pages point to sites likecnn.com or nytimes.com, but very few pages receive pointersback from these sites. Search engines leverage this to iden-tify reputed sources of information, since pages with highindegree tend to be authorities [21].
With the exception of Orkut, links in the social networkswe studied are directed and users may therefore link to anyother user they wish. The target of the link may reciprocateby placing a link pointing back at the source. Our anal-ysis of the level of symmetry in social networks, shown inTable 1, reveals that all three social networks with directedlinks (Flickr, LiveJournal, and YouTube) have a significantdegree of symmetry. Their high level of symmetry is consis-tent with that of offline social networks [20]. Furthermore,social networking sites inform users of new incoming links,which may also contribute to the high level of symmetry.
Independent of the causes, the symmetric nature of sociallinks affects the network structure. For example, symmetryincreases the overall connectivity of the network and reducesits diameter. Symmetry can also make it harder to identifyreputable sources of information just by analyzing the net-work structure, because reputed sources tend to dilute theirimportance when pointing back to arbitrary users who linkto them.
5.2 Power-law node degreesWe begin to examine the graph structure by considering thenode degree distribution. As discussed in Section 3, the de-gree distributions of many complex networks, including of-fline social networks, have been shown to conform to power-laws. Thus, it may not be surprising that social networksalso exhibit power-law degree distributions. However, as ouranalysis shows, the degree distributions in social networksdiffer from that of other power-law networks in several ways.
Figure 2 shows the outdegree and indegree complementarycumulative distribution function (CCDF) for each measuredsocial network. All of the networks show behavior consistentwith a power-law network; the majority of the nodes havesmall degree, and a few nodes have significantly higher de-gree. To test how well the degree distributions are modeledby a power-law, we calculated the best power-law fit usingthe maximum likelihood method [13]. Table 2 shows theestimated power-law coefficient along with the Kolmogorov-Smirnov goodness-of-fit metric [13]. While the best power-law coefficients approximate the distributions very well forFlickr, LiveJournal, and YouTube, the Orkut data deviatessignificantly.
Two factors contribute to this deviation. First, our Orkut

1
0.01
0.0001
1e-06
1e-08 10000 100 1
P(I
nd
egre
e >=
x)
Degree
1
0.01
0.0001
1e-06
1e-08P(O
utd
egre
e >=
x)
(a) Flickr
10000 100 1
Degree(b) LiveJournal
10000 100 1
Degree(c) Orkut
10000 100 1
Degree(d) YouTube
Figure 2: Log-log plot of outdegree (top) and indegree (bottom) complementary cumulative distributionfunctions (CCDF). All social networks show properties consistent with power-law networks.
Outdegree IndegreeNetwork α D α D
Web [12] 2.67 - 2.09 -Flickr 1.74 0.0575 1.78 0.0278LiveJournal 1.59 0.0783 1.65 0.1037Orkut 1.50 0.6319 1.50 0.6203YouTube 1.63 0.1314 1.99 0.0094
Table 2: Power-law coefficient estimates (α) andcorresponding Kolmogorov-Smirnov goodness-of-fitmetrics (D). The Flickr, LiveJournal, and YouTubenetworks are well approximated by a power-law.
crawl reached only 11.3% of the network — partial BFScrawls tend to undersample nodes with lower degree, whichcan explain the flat head of the distribution [29]. Second,both LiveJournal and Orkut artificially cap a user’s num-ber of outgoing links,9 which leads to a distortion in thedistribution for high degrees.
Additionally, we tested the stability of the power-law co-efficient estimates by running the maximum likelihood esti-mator over varyingly sized subsamples of our data [53]. Wefound that the estimates of the power-law coefficient wereremarkably stable; the estimates varied by less than 6% fromthose provided in Table 2 when we considered as few as 1,000data points.
Table 2 also shows a difference between the structure ofsocial networks and that of previously observed networks.In the Web, for example, the indegree and outdegree power-law exponents have been shown to differ significantly, whilethe power-law exponents for the indegree and outdegree dis-tributions in each of our social networks are very similar.This implies that in online social networks, the distributionof outgoing links is similar to that of incoming links, while inthe Web, the incoming links are significantly more concen-trated on a few high-degree nodes than the outgoing links.
Focusing on this difference, Figure 3 shows the distribu-tion of incoming and outgoing links over nodes in the Web
9Orkut caps the outdegree at 1,000, and LiveJournal at 750.Both of these caps were instituted after the networks wereestablished, and some users therefore exceed the caps. Also,Flickr has since instituted a cap of 3,000 non-reciprocal links;however, the data shown here was collected before this capwas established.
0
0.2
0.4
0.6
0.8
1
0 0.2 0.4 0.6 0.8 1
Fra
ctio
n o
f L
inks
Fraction of Users
Flickr InFlickr Out
Web In Web Out
Figure 3: Plot of the distribution of links acrossnodes. Social networks show similar distributionsfor outgoing and incoming links, whereas the Weblinks shows different distributions.
and Flickr graphs.10 The difference is readily apparent: 5%of the Web nodes account for 75% of all incoming links, butfor only 25% of all outgoing links. In all social networkswe considered, the distributions of incoming and outgoinglinks across the nodes are very similar. We now examinethis phenomenon in more detail.
5.3 Correlation of indegree and outdegreeStudies of the indegree and outdegree distributions in theWeb graph helped researchers find better ways to find rel-evant information in the Web. In the Web, the populationof pages that are active (i.e., have high outdegree) is notthe same as the population of pages that are popular (i.e.,have high indegree) [21]. For example, many Web pages ofindividual users actively point to a few popular pages likewikipedia.org or cnn.com. Web search techniques are veryeffective at separating a very small set of popular pages froma much larger set of active pages.
In social networks, the nodes with very high outdegreealso tend to have very high indegree. In our study, for eachnetwork, the top 1% of nodes ranked by indegree has a morethan 65% overlap with the top 1% of nodes ranked by out-degree. The corresponding overlap in the Web is less than20%. Hence, active users (i.e., those who create many links)
10The Flickr topology is representative of all four networks;we omitted the others in the plot for readability.

0
0.2
0.4
0.6
0.8
1
0 0.1 0.2 0.3 0.4 0.5 0.6 0.7 0.8 0.9 1
Ove
rlap
Fraction of Users (ordered by out/indegree)
LiveJournal
Web
YouTube
Flickr
Figure 4: Plot of the overlap between top x% ofnodes ranked by outdegree and indegree. The high-indegree and high-outdegree nodes are often thesame in social networks, but not in the Web.
in social networks also tend to be popular (i.e., they arethe target of many links). Figure 4 shows the extent of theoverlap between the top x% of nodes ranked by indegree andoutdegree.
0
0.2
0.4
0.6
0.8
1
0.01 0.1 1 10 100
CD
F
Outdegree to Indegree Ratio
WebFlickr
YouTube
LiveJournal
Figure 5: CDF of outdegree to indegree ratio. Socialnetworks show much stronger correlation betweenindegree and outdegree than the Web.
Next, we compared the indegree and outdegree of individ-ual nodes in the social networks. Figure 5 plots the cumula-tive distributions of the outdegree-to-indegree ratio for thefour social networks and the Web. The social networks showa remarkable correspondence between indegree and outde-gree; for all networks, over 50% of nodes have an indegreewithin 20% of their outdegree. The distribution for the Webis markedly different; most nodes have considerably higheroutdegree than indegree, while a small fraction of nodes havesignificantly higher indegree than outdegree.
The high correlation between indegree and outdegree insocial networks can be explained by the high number ofsymmetric links. The high symmetry may be due to thetendency of users to reciprocate links from other users whopoint to them. This process would result in active users (whoplace many outgoing links) automatically receiving many in-coming links, and lead to the distributions we have observed.
5.4 Path lengths and diameterNext, we look at the properties of shortest paths betweenusers. Table 3 shows the average path lengths, diameters,and radii11 for the four social networks. In absolute terms,the path lengths and diameters for all four social networks
11The eccentricity of a node v is the maximal shortest pathdistance between v and any other node. The radius of a
Network Avg. Path Len. Radius DiameterWeb [12] 16.12 475 905Flickr 5.67 13 27LiveJournal 5.88 12 20Orkut 4.25 6 9YouTube 5.10 13 21
Table 3: Average path length, radius, and diameterof the studied networks. The path length betweenrandom nodes is very short in social networks.
are remarkably short. Interestingly, despite being compara-ble in size to the Web graph we considered, the social net-works have significantly shorter average path lengths anddiameters. This property may again result from the highdegree of reciprocity within the social networks. Inciden-tally, Broder et al. [12] noted that if the Web were treatedas an undirected graph, the average path length would dropfrom 16.12 to 7.
5.5 Link degree correlationsTo further explore the difference in network structure be-tween online social networks and previously observed net-works, we examine which users tend to connect to eachother. In particular, we focus on the joint degree distribu-tion (JDD), or how often nodes of different degrees connectto each other. This property is also referred to as the 2K-distribution [33] or the mixing patterns [42].
5.5.1 Joint degree distributionThe JDD provides many insights into the structural proper-ties of networks. For example, networks where high-degreenodes tend to connect to other high-degree nodes are morelikely to be subject to epidemics, as a single infected high-degree node will quickly infect other high-degree nodes. Onthe other hand, networks where high-degree nodes tend toconnect to low-degree nodes show the opposite behavior; asingle infected high-degree node will not spread an epidemicvery far.
The JDD is approximated by the degree correlation func-tion knn, which is a mapping between outdegree and theaverage indegree of all nodes connected to nodes of that out-degree. Clearly, an increasing knn indicates a tendency ofhigher-degree nodes to connect to other high-degree nodes;a decreasing knn represents the opposite trend. Figure 6shows a plot of knn for the four networks we studied.
The trend for high-degree nodes to connect to other high-degree nodes can be observed in all networks except YouTube(the unexpected bump at the head of the Orkut curve islikely due to the undersampling of users). This suggests thatthe high-degree nodes in social networks tend to connect toother high-degree nodes, forming a “core” of the network.Anecdotally, we believe that the different behavior seen inYouTube is due its more “celebrity”-driven nature; there area few extremely popular users on YouTube to whom manyunpopular users connect.
graph is then the minimum eccentricity across all vertices,and the diameter is the maximum eccentricity across allvertices. Due to the computational complexity associatedwith determining the actual radius and diameter, the num-bers presented here are from determining the eccentricity of10,000 random nodes in each network. Therefore, the diam-eter should be viewed as a lower bound, and the radius asan upper bound.

10
100
1000
10000
10000 100 1
k nn
Degree(a) Flickr (0.49)
10000 100 1
Degree(b) LiveJournal (0.34)
10000 100 1
Degree(c) Orkut (0.36)
10000 100 1
Degree(d) YouTube (0.19)
Figure 6: Log-log plot of the outdegree versus the average indegree of friends. The scale-free metrics, includedin the legend, suggest the presence of a well-connected core.
To quantitatively explore this phenomenon, we next ex-amine two metrics based on the joint degree distribution:the scale-free metric s and the assortativity r.
5.5.2 Scale-free behaviorThe scale-free metric s [31] is a value calculated directlyfrom the joint degree distribution of a graph. The scale-freemetric ranges between 0 and 1, and measures the extent towhich the graph has a hub-like core. A high scale-free metricmeans that high-degree nodes tend to connect to other high-degree nodes, while a low scale-free metric means that high-degree nodes tend to connect to low-degree nodes.
The scale-free metric of the networks are shown in thelegend of Figure 6. All of the networks with the exceptionof YouTube show a significant s, indicating that high-degreenodes tend to connect to other high-degree nodes, and low-degree nodes tend to connect to low-degree nodes.
5.5.3 AssortativityThe scale-free metric is related to the assortativity coeffi-cient r, which is a measure of the likelihood for nodes to con-nect to other nodes with similar degrees. The assortativitycoefficient ranges between -1 and 1; a high assortativity coef-ficient means that nodes tend to connect to nodes of similardegree, while a negative coefficient means that nodes likelyconnect to nodes with very different degree from their ownRecent work has suggested that the scale-free metric is moresuitable for comparing the structure of different graphs [30],as it takes into account the possible configurations of net-works with properties including connectedness and no self-loops. However, for completeness, we calculated the assorta-tivity coefficients for each of the networks, and found 0.202for Flickr, 0.179 for LiveJournal, 0.072 for Orkut, and -0.033for YouTube.
The assortativity shows yet another difference betweenthe social networks and other previously observed power-law networks. For example, the Web and the Internet haveboth been shown to have negative assortativity coefficientsof -0.067 and -0.189, respectively [42]. On the other hand,many scientific coauthorship networks, a different type ofsocial network, have been shown to have positive r [42].
Taken together, the significant scale-free metric and thepositive assortativity coefficient suggests that there existsa tightly-connected “core” of the high-degree nodes whichconnect to each other, with the lower-degree nodes on thefringes of the network. In the next few sections, we explorethe properties of these two components of the graph in de-tail.
5.6 Densely connected coreWe loosely define a core of a network as any (minimal) set ofnodes that satisfies two properties: First, the core must benecessary for the connectivity of the network (i.e., removingthe core breaks the remainder of the nodes into many small,disconnected clusters). Second, the core must be stronglyconnected with a relatively small diameter. Thus, a “core”is a small group of well-connected group of nodes that isnecessary to keep the remainder of the network connected.
To more closely explore the core of the network, we use anapproximation previously used in Web graph analysis [12].Specifically, we remove increasing numbers of the highestdegree nodes and analyze the connectivity of the remaininggraph.12 We calculate the size of the largest remaining SCC,which is the largest set of users who can mutually reach eachother.
As we remove the highest degree nodes, the largest SCCbegins to split into smaller-sized SCCs. Figure 7 shows thecomposition of the splits as we remove between 0.01% and10% of the highest-degree nodes in Flickr. The correspond-ing graphs for the other social networks look similar, andwe omit them for lack of space. Once we remove 10% of thehighest indegree nodes,13 the largest SCC partitions intomillions of very small SCCs consisting of only a handful ofnodes.
0
0.2
0.4
0.6
0.8
1
10%1%0.1%0.01%
No
de
Dis
trib
uti
on
inR
emai
nin
g S
CC
s
Fraction of Network Removed
1 Node2-7 Nodes
8-63 Nodes
Large SCC
Figure 7: Breakdown of network into SCCs whenhigh-degree nodes are removed, grouped by SCCsize.
To understand how much the network core contributes to-wards the small path lengths, we analyzed the path lengths
12The large size of the graphs we study makes a cut set anal-ysis computationally infeasible.
13We obtained the same results using both indegree and out-degree.

of subgraphs containing only the highest-degree nodes. Fig-ure 8 shows how path lengths increase as we generate largersubgraphs of the core by progressively including nodes or-dered inversely by their degree. The average path lengthincreases sub-logarithmically with the size of the core. InFlickr, for example, the overall average path length is 5.67,of which 3.5 hops involve the 10% of nodes in the core withthe highest degrees. This suggests that the high-degree corenodes in these networks are all within roughly four hops ofeach other, while the rest of the nodes, which constitute themajority of the network, are at most a few hops away fromthe core nodes.
5
4
3
2
110%1%0.1%0.01%0.001%0.0001%
Ave
rag
e P
ath
Len
gth
Fraction of Network
LiveJournal YouTube
Flickr
Orkut
Figure 8: Average path length among the most well-connected nodes. The path length increases sub-logarithmically.
Thus, the graphs we study have a densely connected corecomprising of between 1% and 10% of the highest degreenodes, such that removing this core completely disconnectsthe graph.
The structure of social networks, with its high dependenceon few highly connected nodes, may have implications forinformation flow, for trust relationships, and for the vulner-ability of these networks to deliberate manipulation. Thesmall diameter and path lengths of social networks are likelyto impact the design of techniques for finding paths in suchnetworks, for instance, to check how closely related a givenpair of nodes is in the network. Such techniques have ap-plications, for instance, in social networks used to verify thetrustworthiness or relevance of received information [17].
5.7 Tightly clustered fringeNext, we consider the graph properties at the scale of localneighborhoods outside of the core. We first examine clus-tering, which quantifies how densely the neighborhood of anode is connected.
The clustering coefficient of a node with N neighbors isdefined as the number of directed links that exist betweenthe node’s N neighbors, divided by the number of possibledirected links that could exist between the node’s neighbors(N(N − 1)). The clustering coefficient of a graph is theaverage clustering coefficient of all its nodes, and we denoteit as C.
Table 4 shows the clustering coefficients for all four socialnetworks. For comparison, we show the ratio of the observedclustering coefficient to that of Erdos-Reyni (ER) randomgraphs [15] and random power-law graphs constructed withpreferential attachment [9], with the same number of nodesand links. ER graphs have no link bias towards local nodes.Hence, they provide a point of reference for the degree oflocal clustering in the social networks. Graphs constructed
Ratio to Random GraphsNetwork C Erdos-Renyi Power-LawWeb [2] 0.081 7.71 -Flickr 0.313 47,200 25.2LiveJournal 0.330 119,000 17.8Orkut 0.171 7,240 5.27YouTube 0.136 36,900 69.4
Table 4: The observed clustering coefficient, and ra-tio to random Erdos-Reyni graphs as well as randompower-law graphs.
using preferential attachment also have no locality bias, aspreferential attachment is a global process, and they providea point of reference to the clustering in a graph with a similardegree distribution.
The clustering coefficients of social networks are betweenthree and five orders of magnitude larger than their corre-sponding random graphs, and about one order of magnitudelarger than random power-law graphs. This unusually highclustering coefficient suggests the presence of strong localclustering, and has a natural explanation in social networks:people tend to be introduced to other people via mutualfriends, increasing the probability that two friends of a sin-gle user are also friends.
0.5
0.4
0.3
0.2
0.1
0 1 10 100 1000 10000A
vg. C
lust
erin
g C
oef
fici
ent
Outdegree
Flickr
YouTube
LiveJournal
Orkut
Figure 9: Clustering coefficient of users with differ-ent outdegrees. The users with few “friends” aretightly clustered.
Figure 9 shows how the clustering coefficients of nodesvary with node outdegree. The clustering coefficient is higherfor nodes of low degree, suggesting that there is significantclustering among low-degree nodes. This clustering and thesmall diameter of these networks qualifies these graphs assmall-world networks [52], and further indicates that thegraph has scale-free properties.
5.8 GroupsIn many online social networks, users with shared interestsmay create and join groups. Table 5 shows the high-levelstatistics of user groups in the four networks we study. Par-ticipation in user groups varies significantly across the differ-ent networks: only 8% of YouTube users but 61% of Live-Journal users declare group affiliations. Once again, thegroup sizes follow a power-law distribution, in which thevast majority have only a few users each.
Note that users in a group need not necessarily link toeach other in the social network graph. As it turns out,however, user groups represent tightly clustered communi-ties of users in the social network. This can be seen fromthe average group clustering coefficients of group members,

Network Groups Usage Avg. Size Avg. CFlickr 103,648 21% 82 0.47LiveJournal 7,489,073 61% 15 0.81Orkut 8,730,859 13% 37 0.52YouTube 30,087 8% 10 0.34
Table 5: Table of the high-level properties of net-work groups including the fraction of users whichuse group features, average group size, and averagegroup clustering coefficient.
shown in Table 5.14 These coefficients are higher than thoseof the corresponding network graph as a whole (shown inTable 4). Further, the members of smaller user groups tendto be more clustered than those of larger groups. Figure 10shows this by plotting the average group clustering coeffi-cient for groups of different sizes in the four observed net-works. In fact, many of the small groups in these networksare cliques.
0
0.2
0.4
0.6
0.8
1
1 10 100 1000 10000 100000
Ave
rag
e G
rou
pC
lust
erin
g C
oef
fici
ent
Group Size
Orkut
YouTube
LiveJournal
Flickr
Figure 10: Plot of group size and average group clus-tering coefficient. Many small groups are almostcliques.
Finally, Figure 11 shows how user participation in groupsvaries with outdegree. Low-degree nodes tend to be part ofvery few communities, while high-degree nodes tend to bemembers of multiple groups. This implies a correlation be-tween the link creation activity and the group participation.There is a sharp decline in group participation for Orkutusers with over 500 links, which is inconsistent with the be-havior of the other networks. This result may be an artifactof our partial crawl of the Orkut network and the resultingbiased user sample.
In general, our observations suggest a global social net-work structure that is comprised of a large number of small,tightly clustered local user communities held together bynodes of high degree. This structure is likely to significantlyimpact techniques, algorithms and applications of social net-works.
5.9 SummaryWe end this section with a brief summary of important struc-tural properties of social networks which we observed in ourdata.
• The degree distributions in social networks follow apower-law, and the power-law coefficients for both in-
14We define the group clustering coefficient of a group G asthe clustering coefficient of the subgraph of the network con-sisting of only the users who are members of G.
0
50
100
150
200
250
300
1 10 100 1000
Ave
rag
e G
rou
ps
Join
ed
Outdegree
Orkut
YouTube
LiveJournal
Flickr
Figure 11: Outdegree versus average number ofgroups joined by users. Users with more links tendto be members of many groups.
degree and outdegree are similar. Nodes with highindegree also tend to have high outdegree.
• Social networks appear to be composed of a large num-ber of highly connected clusters consisting of relativelylow-degree nodes. These clusters connect to each othervia a relatively small number of high-degree nodes. Asa consequence, the clustering coefficient is inverselyproportional to node degree.
• The networks each contain a large, densely connectedcore. Overall, the network is held together by about10% of the nodes with highest degree. As a result,path lengths are short, but almost all shortest pathsof sufficient length traverse the highly connected core.
6. DISCUSSIONIn this section, we discuss some implications of our findings.Our measurements indicate that online social networks havea high degree of reciprocity, a tight core that consists of high-degree nodes, and a strong positive correlation in link de-grees for connected users. What do these findings mean fordevelopers? Alternately, how should applications for socialnetworks be designed to take advantage of these properties?Do these properties reveal straightforward attacks on thesocial structure? Finally, does it make sense to “optimize”algorithms and applications based upon our findings, sincethese networks are still growing rapidly and any propertywe assert now may soon change?
While our findings are likely applicable to many differentapplications, we concentrate on their effect on informationdissemination, search, and trust inference.
6.1 Information dissemination and searchSocial networks are already used as a means for rapidly dis-seminating information, as witnessed by the popularity of“hot” videos on YouTube. The existence of a small, well-connected core implies that information seeded via a corenode will rapidly spread through the entire network. Thisis both a strength and a weakness, as spam or viruses couldbe disseminated this way, as well as important information.
Similarly, searches that proceed along social network linkswill quickly reach the core. This suggests that simple un-structured search algorithms could be designed if the coreusers were to store some state about other users. In effect,the users in the core represent“supernodes” in a two-level hi-erarchy, similar to existing search protocols for unstructurednetworks, such as Gnutella.

6.2 TrustSocial networking sites are the portals of entry into the In-ternet for many millions of users, and they are being usedboth for advertisement as well as for the ensuing commerce.Many of these applications, ranging from mail to auctions,implicitly rely on some form of trust . For example, whena user accepts email from an unknown user, she is trustingthe other party not to send spam. When a user selects awinning bidder in an auction, she is trusting the other partyto pay the winning amount, and the winning user is trustingthe seller to produce the auctioned item.
In a social network, the underlying user graph can po-tentially be used as a means to infer some level of trust inan unknown user [28], to check the validity of a public keycertificate [38], and to classify potential spam [17]. In all ofthese, trust is computed as a function of the path betweenthe source and target user.
Our findings have interesting implications for trust infer-ence algorithms. The tight core coupled with link reciprocityimplies that users in the core appear on a large numberof short paths. Thus, if malicious users are able to pene-trate the core, they can skew many trust paths (or appearhighly trustworthy to a large fraction of the network). How-ever, these two properties also lead to small path lengthsand many disjoint paths, so the trust inference algorithmsshould be adjusted to account for this observation. In par-ticular, given our data, an unknown user should be highlytrusted only if multiple short disjoint paths to the user canbe discovered.
The correlation in link degrees implies that users in thefringe will not be highly trusted unless they form direct linksto other users. The “social” aspect of these networks is self-reinforcing: in order to be trusted, one must make many“friends”, and create many links that will slowly pull theuser into the core.
6.3 Temporal invarianceOne possible criticism of our study is the snapshot characterof our data, which does not account for change over time. Toexplore this, we repeated the entire crawl for both Flickr andYouTube on May 7th, 2007, and recomputed the completestatistics on the new data set. Both of the networks showedrapid growth over this five month time period, with Flickrgrowing by 38% and YouTube by 83%.
However, the salient observations in our original data arestill valid; for Flickr, most of the updated results are indis-tinguishable from the results presented. YouTube showed adifference due to a policy change between our original andnew crawls: YouTube switched from directed links to a two-phase symmetric link creation process. Thus, in the newYouTube crawl, we observe a much higher level of symme-try and a correspondingly larger SCC. However, many ofthe other metrics, such as the assortativity, clustering coef-ficient, and average path length are similar.
This experiment gives us some assurance that our struc-tural observations are not incidental to the stage of growthat which we sampled the network. Our data indicates that,even though the networks are growing rapidly, their basicstructure is not changing drastically.
7. CONCLUSIONSWe have presented an analysis of the structural propertiesof online social networks using data sets collected from four
popular sites. Our data shows that social networks are struc-turally different from previously studied networks, in partic-ular the Web. Social networks have a much higher fractionof symmetric links and also exhibit much higher levels of lo-cal clustering. We have outlined how these properties mayaffect algorithms and applications designed for social net-works.
Much work still remains. We have focused exclusivelyon the user graph of social networking sites; many of thesesites allow users to host content, which in turn can be linkedto other users and content. Establishing the structure anddynamics of the content graph is an open problem, the so-lution to which will enable us to understand how content isintroduced in these systems, how data gains popularity, howusers interact with popular versus personal data, and so on.
AcknowledgmentsWe thank the anonymous reviewers, our shepherd Yin Zhang,and Walter Willinger for their helpful comments. We wouldalso like to thank Anja Feldmann and Nils Kammenhuberfor their assistance with the TU Munich trace. This researchwas supported in part by US National Science Foundationgrant ANI-0225660.
8. REFERENCES[1] Stanford WebBase Project. http://www-diglib.
stanford.edu/~testbed/doc2/WebBase.[2] L. A. Adamic. The Small World Web. In Proceedings
of the Third European Conference on Research andAdvanced Technology for Digital Libraries (ECDL’99),Paris, France, Sep 1999.
[3] L. A. Adamic, O. Buyukkokten, and E. Adar. A socialnetwork caught in the Web. First Monday, 8(6), 2003.
[4] Y.-Y. Ahn, S. Han, H. Kwak, S. Moon, and H. Jeong.Analysis of Topological Characteristics of Huge OnlineSocial Networking Services. In Proceedings of the 16thinternational conference on World Wide Web(WWW’07), Banff, Canada, May 2007.
[5] R. Albert, H. Jeong, and A.-L. Barabasi. TheDiameter of the World Wide Web. Nature, 401:130,1999.
[6] L. A. N. Amaral, A. Scala, M. Barthelemy, and H. E.Stanley. Classes of small-world networks. Proceedingsof the National Academy of Sciences (PNAS),97:11149–11152, 2000.
[7] A. Awan, R. A. Ferreira, S. Jagannathan, andA. Grama. Distributed uniform sampling in real-worldnetworks. Technical Report CSD-TR-04-029, PurdueUniversity, 2004.
[8] L. Backstrom, D. Huttenlocher, J. Kleinberg, andX. Lan. Group Formation in Large Social Networks:Membership, Growth, and Evolution. In Proceedingsof the 12th ACM SIGKDD International Conferenceon Knowledge Discovery and Data Mining (KDD’06),Philadelphia, PA, Aug 2006.
[9] A.-L. Barabasi and R. Albert. Emergence of Scaling inRandom Networks. Science, 286:509–512, 1999.
[10] L. Becchetti, C. Castillo, D. Donato, and A. Fazzone.A Comparison of Sampling Techniques for WebGraph Characterization. In Proceedings of theWorkshop on Link Analysis (LinkKDD’06),Philadelphia, PA, Aug 2006.
[11] V. Braitenberg and A. Schuz. Anatomy of a Cortex:Statistics and Geometry. Springer-Verlag, Berlin, 1991.
[12] A. Broder, R. Kumar, F. Maghoul, P. Raghavan,S. Rajagopalan, R. Stata, A. Tomkins, and J. Wiener.Graph Structure in the Web: Experiments and

Models. In Proceedings of the 9th International WorldWide Web Conference (WWW’00), Amsterdam, May2000.
[13] A. Clauset, C. R. Shalizi, and M. E. J. Newman.Power-law distributions in empirical data, Jun 2007.http://arxiv.org/abs/0706.1062v1.
[14] d. boyd. Friends, Friendsters, and Top 8: Writingcommunity into being on social network sites. FirstMonday, 11(12), 2006.
[15] P. Erdos and A. Renyi. On Random Graphs I.Publicationes Mathematicae Debrecen, 5:290–297,1959.
[16] M. Faloutsos, P. Faloutsos, and C. Faloutsos. OnPower-Law Relationships of the Internet Topology. InProceedings of the Annual Conference of the ACMSpecial Interest Group on Data Communication(SIGCOMM’99), Cambridge, MA, Aug 1999.
[17] S. Garriss, M. Kaminsky, M. J. Freedman, B. Karp,D. Mazieres, and H. Yu. Re: Reliable Email. InProceedings of the 3rd Symposium on NetworkedSystems Design and Implementation (NSDI’06), SanJose, CA, May 2006.
[18] M. Girvan and M. E. J. Newman. Communitystructure in social and biological networks.Proceedings of the National Academy of Sciences(PNAS), 99:7821–7826, 2002.
[19] Google Co-op. http://www.google.com/coop/.[20] M. Granovetter. The Strength of Weak Ties.
American Journal of Sociology, 78(6), 1973.[21] J. Kleinberg. Authoritative Sources in a Hyperlinked
Environment. Journal of the ACM, 46:604–632, 1999.[22] J. Kleinberg. Navigation in a Small World. Nature,
406:845–845, 2000.[23] J. Kleinberg. The Small-World Phenomenon: An
Algorithmic Perspective. In Proceedings of the 32ndACM Symposium on Theory of Computing(STOC’00), Portland, OR, May 2000.
[24] J. Kleinberg and S. Lawrence. The Structure of theWeb. Science, 294:1849–1850, 2001.
[25] J. M. Kleinberg and R. Rubinfeld. Short paths inexpander graphs. In IEEE Symposium on Foundationsof Computer Science (FOCS’96), Burlington, VT, Oct1996.
[26] R. Kumar, J. Novak, and A. Tomkins. Structure andEvolution of Online Social Networks. In Proceedings ofthe 12th ACM SIGKDD International Conference onKnowledge Discovery and Data Mining (KDD’06),Philadelphia, PA, Aug 2006.
[27] R. Kumar, P. Raghavan, S. Rajagopalan, andA. Tomkins. Trawling the Web for EmergingCyber-Communities. Computer Networks,31:1481–1493, 1999.
[28] S. Lee, R. Sherwood, and B. Bhattacharjee.Cooperative peer groups in NICE. In Proceedings ofthe Conference on Computer Communications(INFOCOM’03), San Francisco, CA, Mar 2003.
[29] S. H. Lee, P.-J. Kim, and H. Jeong. Statisticalproperties of sampled networks. Physical Review E,73, 2006.
[30] L. Li and D. Alderson. Diversity of graphs with highlyvariable connectivity. Physics Review E, 75, 2007.
[31] L. Li, D. Alderson, J. C. Doyle, and W. Willinger.Towards a Theory of Scale-Free Graphs: Definitions,Properties, and Implications. Internet Mathematics,2(4):431–523, 2006.
[32] D. Liben-Nowell, J. Novak, R. Kumar, P. Raghavan,and A. Tomkins. Geographic Routing in SocialNetworks. Proceedings of the National Academy ofSciences (PNAS), 102(33):11623–11628, 2005.
[33] P. Mahadevan, D. Krioukov, K. Fall, and A. Vahdat.Systematic Topology Analysis and Generation Using
Degree Correlations. In Proceedings of the AnnualConference of the ACM Special Interest Group onData Communication (SIGCOMM’06), Pisa, Italy,August 2006.
[34] S. Milgram. The small world problem. PsychologyToday, 2(60), 1967.
[35] A. Mislove, K. P. Gummadi, and P. Druschel.Exploiting social networks for Internet search. InProceedings of the 5th Workshop on Hot Topics inNetworks (HotNets-V), Irvine, CA, Nov 2006.
[36] M. Molloy and B. Reed. A critical point for randomgraphs with a given degree distribution. RandomStructures and Algorithms, 6, 1995.
[37] M. Molloy and B. Reed. The size of the giantcomponent of a random graph with a given degreesequence. Combinatorics, Probability and Computing,7, 1998.
[38] R. Morselli, B. Bhattacharjee, J. Katz, and M. A.Marsh. Keychains: A Decentralized Public-KeyInfrastructure. Technical Report CS-TR-4788,University of Maryland, 2006.
[39] MozillaCoop. http://www.mozilla.com.[40] MySpace is the number one website in the U.S.
according to Hitwise. HitWise Press Release, July, 11,2006. http://www.hitwise.com/press-center/hitwiseHS2004/social-networking-june-2006.php.
[41] M. E. J. Newman. The structure of scientificcollaboration networks. Proceedings of the NationalAcademy of Sciences (PNAS), 98:409–415, 2001.
[42] M. E. J. Newman. Mixing patterns in networks.Physics Review E, 67, 2003.
[43] L. Page, S. Brin, R. Motwani, and T. Winograd. ThePageRank Citation Ranking: Bringing Order to theWeb. Technical report, Stanford University, 1998.
[44] PayPerPost. http://www.payperpost.com.[45] A. G. Phadke and J. S. Thorp. Computer relaying for
power systems. John Wiley & Sons, Inc., New York,NY, USA, 1988.
[46] I. Pool and M. Kochen. Contacts and influence. SocialNetworks, 1:1–48, 1978.
[47] D. Rezner. The Power and Politics of Weblogs. InProceedings of the ACM Conference on ComputerSupported Cooperative Work (CSCW’04), Chicago, IL,Nov 2004.
[48] G. Siganos, S. L. Tauro, and M. Faloutsos. Jellyfish: AConceptual Model for the AS Internet Topology.Journal of Communications and Networks,8(3):339–350, 2006.
[49] Skype. http://www.skype.com.[50] StumbleUpon. http://www.stumbleupon.com.[51] S. Wasserman and K. Faust. Social Networks Analysis:
Methods and Applications. Cambridge UniversityPress, Cambridge, UK, 1994.
[52] D. Watts and S. Strogatz. Collective dynamics of‘small-world’ networks. Nature, 393:440–442, 1998.
[53] W. Willinger, D. Alderson, and L. Li. A pragmaticapproach to dealing with high-variability in networkmeasurements. In Proceedings of the 2nd ACM/UsenixInternet Measurement Conference (IMC’04),Taormina, Italy, Oct 2004.
[54] Yahoo! MyWeb. http://myweb2.search.yahoo.com.[55] H. Yu, M. Kaminsky, P. B. Gibbons, and A. Flaxman.
SybilGuard: Defending against Sybil attacks via socialnetworks. In Proceedings of the Annual Conference ofthe ACM Special Interest Group on DataCommunication (SIGCOMM’06), Pisa, Italy, August2006.