measurable news-issue-4-2014
DESCRIPTION
The Measurable News -Issue 4 - 2014. The quarterly publication of the College of Performance Management focused on earned value management and other project performance management techniques. TABLE OF CONTENTS (abbreviated) A Program Management Decision Process by Russ Martinelli and Jim Waddell Building A Credible Performance Measurement Baseline by Glen B. Alleman, Thomas J. Coonce, and Rick A. Price Data About Our Community by Elizabeth Phillips College of Performance Management Tennessee Valley(CPMTV) Pilot Chapter EVM Software Vendors and EVM Consulting ServicesTRANSCRIPT

THE MEASURABLE NEWS
2014.04The Quarterly Magazine of the College of Performance Management
mycpm.org
INSIDETHISISSUE
07 17 37A Program Management Decision Process
By Russ Martinelli and Jim Waddell
Building A Credible PerformanceMeasurement Baseline
By Glen B. Alleman, Thomas J. Coonce, and Rick A. Price
Data About Our Community
By Elizabeth Phillips
20 USD/AUD | 15 EUR/GBP

THE MEASURABLE NEWS
2014.04The Quarterly Magazine of the College of Performance Management
mycpm.org
CONTENTS05 Update from the VP Communications
Mark Phillips, PMP
07 A Program Management Decision ProcessRuss Martinelli and Jim Waddell
17 Building A Credible PerformanceMeasurement BaselineGlen B. Alleman, Thomas J. Coonce, and Rick A. Price
37 Data About Our CommunityElizabeth Phillips
XX College of Performance Management Tennessee Valley(CPMTV) Pilot Chapter
43 Vendors/Services
2014 ISSUE 04

THE COLLEGE OF PERFORMANCE MANAGEMENT
2014 BOARD & STAFFPRESIDENTGary W. Troop 310-365-3876 • [email protected]
EXECUTIVE VICE PRESIDENTWayne Abba 703-658-1815 • [email protected]
VICE PRESIDENT OF FINANCEBuddy Everage 202-507-4372 • [email protected]
VICE PRESIDENT OF ADMINISTRATIONLauren Bone +44 (0) 7766 97 40 63 • [email protected]
VICE PRESIDENT OF CONFERENCE & EVENTSSusan Wood850-585-4830 • [email protected]
VICE PRESIDENT OF EDUCATION & CERTIFICATIONBill Mathis703-825-5588 • [email protected]
VICE PRESIDENT OF RESEARCH & STANDARDSDale Gillam703-431-6398 • [email protected]
VICE PRESIDENT OF GLOBAL OUTREACHKym Henderson61-414-428-437 • [email protected]
VICE PRESIDENT OF COMMUNICATIONSMark Phillips248-914-3774 • [email protected]
PAST PRESIDENTSusan Wood850-585-4830 • [email protected]
EXECUTIVE DIRECTORDon Kaiser703-370-7885 • [email protected]
THE MEASURABLE NEWS IS AN OFFICIAL PUBLICATION OF THE COLLEGE OF PERFORMANCE MANAGEMENT
EDITORIAL STAFFPublisher: College of Performance ManagementStory Editor: Peter SchwarzDesign: id365 Design + CommunicationsCommunications VP: Mark Phillips
EDITORIAL COPY Editorial contributions, photos, and miscellaneous inquiries should be addressed and sent to the editor at the College of Performance Management (CPM) headquarters. Please follow the author guidelines posted on the CPM web site. Letters submitted to the editor will be considered for publication unless the writer requests otherwise. Letters are subject to editing for style, accuracy, space, and propriety. All letters must be signed, and initials will be used on request only if you include your name. CPM reserves the right to refuse publication of any letter for any reason. We welcome articles relevant to project management. The Measurable News does not pay for submissions. Articles published in The Measurable News remain the property of the authors.
ADVERTISINGAdvertising inquiries, submissions, and payments (check or money order made payable to the College of Performance Management) should be sent to CPM headquarters. Advertising rates are $1000 for inside front or back cover (full-page ad only), $800 for other full-page ads, $500 for half-page ads, and $300 for quarter-page ads. Issue sponsorships are available at $2500 per issue. Business card ads are available for $100 per issue (or free with full-page ad). Rates are good from January 1, 2014 – December 31, 2014. College of Performance Management reserves the right to refuse publication of any ad for any reason.
SUBSCRIPTIONSAll College of Performance Management publications are produced as a benefit for College of Performance Management members. All change of address or membership inquiries should be directed to: College of Performance Management 12100 Sunset Hills Road, Suite 130 Reston, VA 20190 Ph 703.370.7885 • Fx 703.370.1757 www.mycpm.org
All articles and letters represent the view of the authors and not necessarily those of College of Performance Management. Advertising content does not signify endorsement by College of Performance Management. Please notify College of Performance Management for single copy or reproduction requests. Appropriate charges will apply.
© 2014 by the College of Performance Management. All rights reserved.
THE MEASURABLE NEWS
2014.04The Quarterly Magazine of the College of Performance Management
mycpm.org

SM&A is a premier program lifecycle consulting �rm, with over 30 years of experience. We help companies successfully pursue, win and perform complex programs:
• Earned value management (EVM), planning, scheduling, and cost management
• Program management office (PMO) support and systems engineering
Your Partner in Successful Programs
949 975 1550
www.smawins.com
A Winning Partnership

THE MEASURABLE NEWS
The Quarterly Magazine of the College of Performance Management | mycpm.org
2014.04
05
UPDATE FROM THE VP COMMUNICATIONSMark Phillips, PMP
Welcome to the final issue of 2014. It always seems to come too soon.
This issue corresponds with the 26th Annual International Integrated Program Management Workshop in November. Before jumping into the specific articles, take a look at the incredible keynote speakers planned for the IPM Workshop.
KATRINA MCFARLAND, (INVITED) U.S. Assistant Secretary of Defense (Acquisition)
LEANNE CARET Chief Financial Officer & VP Finance, Boeing Defense, Space & Security (BDS)
DAVID (DAVE) R. OLIVER, JR. Former CEO & President of EADS, NA
In the words of CPM President, Gary Troop “We are extremely honored and privileged to host these leaders from government and industry. This is a rare opportunity for attendees to learn from, meet with and network with these experienced and inspiring individuals.”
The IPM Workshop is co-hosted by CPM, ICEAA and NDIA and includes world class training, practice symposia from practitioners and emerging practices workshops from government and industry. Learn more at www.ipmconference.org.
This year’s IPM Workshop represents the continued engagement by industry and government in integrated program performance. This same engagement drives the ongoing investigation into improved program management techniques and methods. Measurable News no. 4 reflects these ongoing efforts. It is a weighty issue with two in-depth articles on techniques to enhance program performance and decision making on programs. CPM has hosted the authors of these articles at our topical webinars. Recordings of their webinars are available to CPM members and registered attendees.
We invite you to enjoy the articles, data and announcements in this issue, as well as to take advantage of the information on performance management related tools and services provided by our sponsors. They are an integral part of our community.
As always, if you have ideas on what we should be doing or would like to discuss current initiatives, don’t hesitate to reach out to me at [email protected]. And if you’re at the IPM Workshop, please stop by and say hello.
All the best!
Mark Phillips, PMPVice President – Communication


THE MEASURABLE NEWS
The Quarterly Magazine of the College of Performance Management | mycpm.org
2014.04
07
ABSTRACT This is a three-part article that was previously published as a series of three installments in PM World Journal. Some modifications have been made to accommodate the new format.
I. ESTABLISHING A PROGRAM DECISION FRAMEWORK
As Ricki Godfrey enters his office he stares at the poster pinned to the wall in front of his desk. The poster shows a bulls-eye with the words “Bang Head Here” in the middle. For a moment, he considers it. “This is the third time I have been in front of our governance committee trying to get approval to move to the next stage of my program” states Godfrey in frustration. “Every time I go in for approval I get a new set of questions to find answers to, more action items to follow up on, and direction to come back again in a month.”
What Godfrey describes is not an uncommon scenario. In fact, in many organizations, gaining approval to move forward at critical decision ‘gates’ surfaces as a primary challenge for program managers and a major contributor to time-to-benefits delays.
So what is happening here? There are many reasons why program ‘gate’ decisions are difficult to obtain, of course. Sometimes the decision criteria is unclear or unknown, or the decision methodology (consensus, consultative, authoritative) is not understood, and sometimes sufficient information to make an informed decision is lacking. In Godfrey’s case however, the problem is more systematic. His organization lacks a robust decision framework that focuses work effort on the achievement of the critical business decision-points that are a part of every program.
LIFECYCLE PROCESS VERSUS DECISION FRAMEWORKHere’s the issue at hand. Like many others, Godfrey’s organization has gone to great length, investment, and effort in creating a lifecycle process that meticulously documents the various stages their programs progress through. This is good, but what we consistently see is the bulk of the effort and process definition lies in defining the various work flows and outcomes during each stage of the process, and very little forethought and effort dedicated to the business decisions which need to be made at the culmination of each stage.What if the way we think of our lifecycle models is reversed? Instead of viewing them as processes consisting of stages of work with decision ‘gates’ intended to allow work effort to transition from one stage to the next, we view them as a series of business decisions with iterative work cycles designed to prepare for and successfully traverse each business decision as it is encountered. Let’s look at an example.
BUSINESS DECISION FRAMEWORKDuring the course of a program, a program manager will have to contend with unexpected changes in the market and organizational environment, a large number of uncertainties and assumptions that have to be tested and vetted, and multiple influential stakeholders with opposing views. For these reasons, a robust business decision framework provides the flexibility necessary to enable an adaptive management process that allows for changes in the program as new information comes in, and at the same time, provides anchors to align stakeholders and the program team on the critical business decisions necessary to successfully manage a program.
Figure 1 illustrates an example of a program-level decision framework that is based upon the critical business decisions associated with a program.
The PMWJ series of articles on program management is authored by Russ Martinelli and James Waddell, principal advisors at the Program Management Academy in Oregon, USA. More about the authors and the Program Management Academy can be found at http://www.programmanagement-academy.com
A PROGRAM MANAGEMENT DECISION PROCESSBy Russ Martinelli and Jim Waddell, Program Management Academy

08 The Measurable News 2014.04 | mycpm.org
© 2014 The Program Management Academy
successfully traverse each business decision as it is encountered. Let’s look at an example.
Business Decision Framework During the course of a program, a program manager will have to contend with unexpected changes in the market and organizational environment, a large number of uncertainties and assumptions that have to be tested and vetted, and multiple influential stakeholders with opposing views. For these reasons, a robust business decision framework provides the flexibility necessary to enable an adaptive management process that allows for changes in the program as new information comes in, and at the same time, provides anchors to align stakeholders and the program team on the critical business decisions necessary to successfully manage a program. Figure 1 illustrates an example of a program-level decision framework that is based upon the critical business decisions associated with a program.
Figure 1: Example business decision framework
As a program progresses through time, the program manager leads his or her program team through a series of work cycles. Each work cycle is unique in intent and scope, and is focused on completing the work necessary to make informed decisions at each of the major business decision checkpoints. Each organization is unique, with its own set of business practices, and therefore, each organization will have its own version of the business decision framework. However, care must be taken to define a decision framework which is coherent in that it integrates the inputs and work of the various business functions within the organization.
It’s Not About Project Methodology We have listened to the on-going debate that has been occurring in the project management community over the virtues of iterative (agile) versus linear (waterfall) methodologies for managing a project. Fortunately, we have not witnessed the same debate within the program management community as programs are both linear (time is linear) and iterative (work and learning are iterative) in nature. This truism is demonstrated in Figure 1 which shows the major program decisions occur over time, but the work that occurs between decisions is normally iterative. If a business decision framework is utilized as the guiding framework for a program, the methodologies employed at the project level do not conflict with this framework, but tend to complement the approach. What is significant at the program level is that the work output from each of the projects within a program must synchronize and integrate with the outputs from the other projects – regardless of the project methodology used to generate the outcomes. For example, even though a software
Figure 1: Example business decision framework
As a program progresses through time, the program manager leads his or her program team through a series of work cycles. Each work cycle is unique in intent and scope, and is focused on completing the work necessary to make informed decisions at each of the major business decision checkpoints. Each organization is unique, with its own set of business practices, and therefore, each organization will have its own version of the business decision framework. However, care must be taken to define a decision framework which is coherent in that it integrates the inputs and work of the various business functions within the organization.
IT’S NOT ABOUT PROJECT METHODOLOGYWe have listened to the on-going debate that has been occurring in the project management community over the virtues of iterative (agile) versus linear (waterfall) methodologies for managing a project. Fortunately, we have not witnessed the same debate within the program management community as programs are both linear (time is linear) and iterative (work and learning are iterative) in nature. This truism is demonstrated in Figure 1 which shows the major program decisions occur over time, but the work that occurs between decisions is normally iterative.
If a business decision framework is utilized as the guiding framework for a program, the methodologies employed at the project level do not conflict with this framework, but tend to complement the approach. What is significant at the program level is that the work output from each of the projects within a program must synchronize and integrate with the outputs from the other projects – regardless of the project methodology used to generate the outcomes. For example, even though a software project team on a program employs an agile project management methodology and a hardware project team on the same program employs a waterfall methodology, the outputs must synchronize over time and integrate into a holistic solution at the program level ahead of the critical decision checkpoints.
Referring to Figure 1, let’s look at each of the key decisions as a part of the framework in more detail.
DECISION CHECKPOINT: PROGRAM STRATEGYThe first major business decision on a program is normally strategic and conceptual in nature. It centers on ensuring that both the program strategy and the capability generated by the program align to the strategic business goals of the organization. We use the term capability in order to more broadly define what is generated as output from the program which may be a new product, service, infrastructure initiative or change transition. Due diligence at this business decision point is critically important to ensure that execution of the program is in alignment with the organizational strategy and goals of the business.
The cycle of work geared toward preparation for the program strategy decision is commonly referred to as program definition. Program definition is an extension of the strategic management and portfolio planning processes and is critical in coalescing an organization’s business functions and influential stakeholders to a common strategic vision and program strategy.
In order to successfully achieve a program strategy decision approval, a number of things need to be accomplished including clear definition of the program objectives as well as the capability being considered and the development of a preliminary business case. If approval is achieved at this business decision checkpoint, the program team is normally given the authorization and funding to develop a full business case.

09The Measurable News 2014.04 | mycpm.org
DECISION CHECKPOINT: PROGRAM INVESTMENTFollowing a decision on the program strategy and one or more capability concepts addressing how the program strategy will be achieved, the next major business decision on a program is normally the program investment decision.
The intent of this business decision is to evaluate whether there is sufficient justification to approve funding for a program. If a decision is reached to fund a program at this point, the program will normally be added to a firm’s implementation portfolio (many times called an R&D portfolio) where it will likely be evaluated against other programs for allocation of resources.
The cycle of work ahead of the program investment decision is focused on the work necessary to gain investment approval. Work outcomes involve the definition of a single capability concept, documentation of the high-level program and capability requirements, and development of a detailed business case. Normally, during this cycle of work, program governance activities are also initiated.
Upon achieving program investment decision approval, the program team is given authorization and commitment of funds and resources to develop an integrated program plan.
DECISION CHECKPOINT: EXECUTION READINESSTo this point in a program, the program team has created a strategy to achieve a set of strategic business goals, and has developed a sound business case justifying the investment of a firm’s resources. The next major business decision on a program – the execution readiness decision – centers on ensuring that the program team has a comprehensive plan for execution of the program strategy.
Most seasoned program managers have learned through experience that early and effective planning prevents poor performance and minimizes problems such as quality issues, missed commitments to customers, and delayed realization of business benefits. Program planning is about laying the foundation for the execution of the program and coupling execution directly to the business strategy of an enterprise.
To gain execution readiness decision approval, the program team must demonstrate how the capability concept will be created and how the business benefits described in the program business case will be realized. A number of key activities take place during this work cycle These include definition of the program architecture, collection of detailed requirements, and development of program scope through the use of the program-level work breakdown structure.
This work cycle culminates in a consolidated program plan integrated with all project and functional elements that demonstrates execution readiness has been established. A successful program execution decision results in the formation of the full integrated program team and authorization and commitment of resources to execute the program.
DECISION CHECKPOINT: CAPABILITY RELEASEWith an integrated, cross-organizational program plan in place and resources and funding committed to execute the program, the next major business decision ahead of the program team is the capability release decision.
The intent of the capability release decision is to evaluate the readiness of the capability to be released to the environment or introduced into an organization. Also under evaluation is the readiness of the program team to support the capability and to sufficiently manage the change which the capability will introduce.
The cycle of work ahead of the capability release decision, commonly referred to as program execution, is focused on accomplishing the design and development work necessary to create the capability, integrating the work output to ensure the whole solution is developed, preparing for the release of the capability, and ensuring the program is managed to the intent of the business case. When finished, the cycle of work results in a capability that is ready to be deployed.
The capability release decision ensures that the new product, service, infrastructure initiative or change transition is ready for release, that the organization is prepared to support the capability, and that the environment is ready to receive it. A capability release approval decision results in authorization to release the capability and full commitment of resources for operational support.

10 The Measurable News 2014.04 | mycpm.org
DECISION CHECKPOINT: PROGRAM CLOSUREIn a normal scenario, program closure occurs after the program capability has been in the market, user environment, or in an organization for an appropriate period of time to assess the business benefits intended. However, it should be noted that the program closure decision can also be made at any point in the program cycle if the business environment or program performance has changed to the point where the program is no longer viable or the benefits are no longer attainable.
In either scenario, the final business decision – the program closure decision – can be made to formally stop all program activities and reallocate resources and funding to other programs in the portfolio.
The cycle of work ahead of the program closure decision is centered on a number of primary objectives: releasing the program capability, assessing benefits realization, capturing program knowledge, and preparing for the program closure decision.
The program manager typically presents a closure proposal to the executive decision-making body of the organization. The decision to close a program is heavily based upon the program’s performance against the business case, assessment of whether or not the critical business success factors have been met and any additional requirements as specified by the organization’s governance body. This is generally the point in a program when a judgment will be made on the level of success of a program.
ENABLING EFFECTIVE DECISIONS“Turning our development process into a decision framework has been a bit of work,” explains Godfrey. “It certainly has had its share of opponents, but the change of focus from concentration of work flow to decision management is beginning to demonstrate its value. I’ve been through three major decision checkpoints with my current program and have only been redirected once. I no longer view our decision checkpoints as unlockable gates.”
Due to the complexity of most programs, a robust decision process must provide the flexibility necessary to enable an adaptive management process that allows for changes in the program as new information becomes available , and at the same time anchor and align the program team and other stakeholders to the critical business decisions necessary to successfully manage a program. Additional detail about the program decision framework is available in “Program Management for Improved Business Results, 2nd Edition.”In the next part, “Making Effective Program Decisions,” we explore the necessary factors involved in driving program-level decisions including a characterization of an effective program decision, decision-making empowerment, and establishment of good decision-making boundary conditions.
II. MAKING EFFECTIVE PROGRAM DECISIONS
“Show me the data that supports your decision.” This is a common request heard by Ricki Godfrey, senior program manager for T.C. Holmes, a construction engineering firm in the energy industry with specialty in the construction of wind turbine sites. As leaders of an engineering firm, T.C. Holmes’ executives believe every decision should be based upon supportable data. As Godfrey explains however, “the programs we undertake in the renewable energy sector are usually filled with uncertainty. No two programs are alike.” Because T.C. Holmes is operating in an environment of high uncertainty, data needed to make decisions is usually not available since each program environment is unique.
Many program managers are able to identify with Godfrey’s predicament. Senior leaders desire a high level of confidence with the decisions being made because the outcomes of those decisions can have significant impact on their business. To gain confidence, therefore, they look for data to support the decisions made. The problem is that most available program data is a representation of the past, and in fast-paced and uncertain program situations, data can be highly unreliable. As such, it is a poor predictor of future outcomes from a decision.
This highlights an important distinction between decision making in a program environment versus a project environment. For the most part, the project environment tends to be fairly stable by nature (project management is about predictability, change management, and risk reduction), therefore data can be used as the basis for many decisions on a project,

11The Measurable News 2014.04 | mycpm.org
and traditional data-based decision methods can be employed. By contrast, the program environment tends to be much less stable and more fluid. Data, being a representation of past events, may not directly apply and therefore can actually increase program uncertainty. As a result, program managers often have to rely more on their experience and ‘gut instinct’ to drive their decisions.
This, of course, can put us in a difficult situation with our senior executives who are calling for data-based decisions in order to increase their confidence level with high stakes decisions made on a program. Overcoming this conflict is rooted in trust that a program manager is consistently making good decisions. Consistency begins with understanding and following five tenets of effective decision making.
TENETS OF EFFECTIVE PROGRAM DECISIONSBecoming a more effective program manager in part depends upon becoming a more effective decision maker. There are hundreds; some say thousands of decisions that have to be made during the course of a program. Some are small and relatively insignificant, some are big and critical to the success of a program, some are incremental and follow a pattern or trend, while some are ambiguous and have never been encountered before. Regardless of the type of decision encountered, the program manager must be willing to own the decision and drive it to closure. The following key tenets of effective decision making can assist the program manager in increasing his or her decision making acumen and assist with decisions whether they are based on data or gut instinct.
1. Prevent analysis paralysisFear can paralyze. Many of us fear making a wrong decision and as a result we get caught in an endless loop of examining and reexamining the ‘data’ involved with a decision. If faced with a big or critical decision, a proven approach is to attempt to break the decision into a series of smaller, less critical decisions and employ an incremental approach. Decisions are about solving problems and trying to predict future outcomes from a chosen course of action – this really describes a learning process. An incremental approach to decision making allows one to make a decision, learn about the outcome through feedback, correct course if needed, and move forward until the final critical decision is made.
2. Realize time has valueThe end result of decision procrastination and analysis paralysis is that the clock keeps ticking, time and budget continues to be expended, and a program team becomes impatient if decisions aren’t made in a timely manner. A program manager is in a leadership role and as a leader he or she must be willing to make a decision in a timely manner. This requires us to be willing to accept that wrong decisions can and will be made. Nothing can be more de-motivating for a team than having to wait for a critical decision to be made. The ability to be bold and make the tough decisions will strengthen a program manager’s leadership credibility while serving as a positive factor for team motivation.
3. Avoid the spotlightIn their book titled Decisive, Chip and Dan Heath describe the practice of locking on to a single or constrained number of decision alternatives too quickly as “spotlighting”. This refers to using a spotlight to illuminate a small portion of an area, causing our eyes to only focus on the things within the illuminated area and ignore everything outside. Taking a narrow view of decision alternatives can be a timely approach to decision making in a stable environment. But in environments of high uncertainty, such as most program environments, spotlighting on a single or limited number of decision alternatives is dangerous. Uncertain environments have an uncanny ability to surprise us. Often, we just don’t know what we don’t know.
Program managers should not be afraid to seek multiple decision options. By avoiding the spotlight approach we create the opportunity to find better and more creative decision alternatives. The activities associated with exploring multiple decision alternatives in search of an optimal solution replaces the activities associated with trying to figure out how to make a single decision option work, how to get critical stakeholders behind it, and trying to gather information to support it.
4. Invite criticismOften, human nature (yes, program managers are human) prevents us from seeking contrarian opinions. In the decision making process, contrary opinions – especially those

12 The Measurable News 2014.04 | mycpm.org
that include criticism – lead to better decisions because they force us to look beyond our own biases that we may have in regard to a particular decision. When data is collected and then synthesized into information, it is common to interpret the information in ways that support our preexisting opinions and preferred course of action.
Inviting a dose of criticism, or at least skepticism, is a tried and true way to avoid walking into a bad decision blindly. Program managers need to seek out and listen to the ‘devil’s advocate’ when faced with critical or high-stakes decisions. The point is, considering disconfirming opinions can improve the quality of information we collect and use in making decisions and can help us avoid locking into a single solution too quickly.
5. Use priorities to guide decisionsIn order to ensure that the outcomes of the decisions being made on a program are leading to the same anticipated end state, a compass is needed. Consider this analogy. You are hiking through an uncharted forest (no groomed hiking trails in this one) trying to get from point A to point B. Along the way, you encounter a number of barriers that cause you to make decisions on how to avoid them, but still get to your final destination (point B). Many of the decision options could take you completely off course. Having a compass in hand is a valuable tool to guide you in the choice of your options, as it helps to keep you moving in the correct direction.
In Program Management for Improved Results we advocate for the use of a tool called the program strike zone that serves as a compass for program decisions. This tool contains targets in the form of the business success criteria that have been negotiated and agreed upon between the senior management sponsor and the program manager. The program strike zone provides guardrails that are wide enough to empower the program manager, but narrow enough to guide consistent decision making by establishing the program priorities.
When a program manager uses the program priorities as a decision guide, his or her decisions can become less agonizing and remain consistently aligned to the goals of the program and can be discussed with senior management as part of the buy-in needed. Without clear priorities to draw upon, program decisions will be made in an inconsistent manner. While some level of randomness may be tolerable, for a program to be ultimately successful, alignment to priorities is critical. The success criteria contained within the strike zone establishes the priorities for the program.
To summarize, effective program decisions should be made in a timely manner, be based upon input from key program team members, be vetted through the use of multiple alternatives, and be aligned with the program priorities and critical business success criteria.
IT’S ABOUT ESTABLISHING TRUST“I’ve come to realize that decision making at T.C. Holmes is all about trust, Godfrey explains. When I put myself in the shoes of our executives, I realized that many of the decisions I make as a program manager can have significant impact on the business that they are charged with growing. So I have to demonstrate that I can make the right decisions whether or not relevant and reliable data is available.”
As explained earlier, due to the environment of uncertainty that many programs operate within, trust in data is risky. Therefore trust in the program manager and the decisions he or she makes is critical for an executive team. This trust comes with consistency of approach, which can be grounded in the decision making tenets discussed earlier, as well as consistency of decision outcomes. Without solid information available pertaining to the program, senior management will need to trust the experience and judgment of the program manager making the decision and the program manager’s past track record and accomplishments.
As Godfrey explains however, trust takes time. “I’m beginning to feel some empowerment. I’ve recently had to make some decisions on my program that didn’t have data to support them, so I had to use my gut. By clearly understanding the business objectives of my program and the priority of those objectives, I was able to justify my decisions on where we were going instead of where we had been.”
In the last part of this article, “Incorporating Risk in Program Decisions,” we explore how the integration of program-level risk management and decision management practices can be used to drive good, risk-based program decisions.
13The Measurable News 2014.04 | mycpm.org
III. INCORPORATING RISK IN PROGRAM DECISIONS
“I’ve learned that making decisions on gut instinct really isn’t a process of choosing an option and hoping for success,” stated Ricki Godfrey. “One of my favorite sayings came from a former manager of mine who said ‘you can’t manage hope’.”
What Godfrey is referring to, is that when a high degree of uncertainty surrounds a program, a program manager has to rely on intuition as much or more than current or past information to make decisions. Intuition or “gut feel” as many call it, is rooted in our expertise. Intuition accesses our accumulated experience in a synthesized way, so that we can form judgments and take action without any logical, conscious considerations. The best intuitive decisions are those that are made with the uncertainty comprehended and bounded to the greatest extent possible.
As Godfrey explains, “risk identification and analysis can be applied in the decision process to understand what could affect the outcome of a decision, and factoring that in when making your decision.” Effective program decision making incorporates both the most current information known about a program, as well as developing an understanding of the risks associated with the unknown.
In the final part of this article on effective program decisions, we explore the use of a risk-based decision making framework that can be used to factor in the uncertainties associated with a program in order to bolster the intuitive or ‘gut feel’ approach to decision making that many program managers have to rely upon.
DEALING WITH THE KNOWN AND UNKNOWNAs covered in the first two parts in this article, executive sponsors of programs desire data as the basis for making many of the decisions in our organizations. This is based upon a belief that data increases the probability that the outcome of a decision will yield the desired results. As previously stated, data – being a representation of past events – is a poor predictor of future outcomes. This is particularly true in environments involving a high degree of uncertainty. This causes a dilemma for many decision makers. How much should they rely on data to support their decision, or how much should they rely on experience and intuition?
The environments in which most programs operate can involve a high degree of uncertainty, many times due to the complexity associated with a program as well as an ever-changing business or organizational environment. This means that the program manager, as the primary decision maker on a program, must comprehend both the known and unknown aspects surrounding the situation at hand and the decision to be made.
Let’s start with the knowns. This is where data normally comes in to play. However, what if instead of thinking in terms of program data, we concern ourselves with program information? We believe this is an important distinction and we make the following differentiation between data and information:
• Data is the raw, unorganized facts, events, and transactions that represent the state of a program at the time it is collected.
• Information is data which has been processed, organized, and presented in such a way that it is meaningful given the program context and decision at hand.
The point that we’re making is that program data alone is insufficient to support program decisions. Data associated with a program – such as current schedule, program staffing level, number of lines of code completed – needs to be processed and put into overall program context before it can become meaningful. Especially if it is used to support a critical program decision. If not, it may lead to an undesirable decision outcome.
In uncertain environments, however, even the most current information about a program is insufficient to support many decisions. The uncertainty, or unknowns, must also be factored into a decision. Traditional decision techniques will tend to over rely on the use of current and past information, and insufficiently address the future uncertainties associated with a particular situation. To address the uncertainties, a good understanding of the risks associated with the decision options is necessary. This is where risk management and decision management techniques must be used in tandem.

14 The Measurable News 2014.04 | mycpm.org
RISK-BASED DECISIONSRisk-based decision making allows a program manager to address the uncertainties associated with a program and bring to light the issues that may be overlooked when one focuses solely on current and past program information. The goal of risk-based decision making is to reduce the probability that the program manager and his or her stakeholders will be blind-sided by an unforeseen consequence of a decision. It allows the uncertainties to be characterized and integrated into the decision process.
As shown in Figure 2, risk identification techniques can be used to identify and foresee some of the unknown consequences of the various decision options.
© 2014 The Program Management Academy
The point that we’re making is that program data alone is insufficient to support program decisions. Data associated with a program – such as current schedule, program staffing level, number of lines of code completed – needs to be processed and put into overall program context before it can become meaningful. Especially if it is used to support a critical program decision. If not, it may lead to an undesirable decision outcome.
In uncertain environments, however, even the most current information about a program is insufficient to support many decisions. The uncertainty, or unknowns, must also be factored into a decision. Traditional decision techniques will tend to over rely on the use of current and past information, and insufficiently address the future uncertainties associated with a particular situation. To address the uncertainties, a good understanding of the risks associated with the decision options is necessary. This is where risk management and decision management techniques must be used in tandem.
Risk-based Decisions Risk-based decision making allows a program manager to address the uncertainties associated with a program and bring to light the issues that may be overlooked when one focuses solely on current and past program information. The goal of risk-based decision making is to reduce the probability that the program manager and his or her stakeholders will be blind-sided by an unforeseen consequence of a decision. It allows the uncertainties to be characterized and integrated into the decision process. As shown in Figure 2, risk identification techniques can be used to identify and foresee some of the unknown consequences of the various decision options.
Figure 2: Applying risk identification in the decision process When program managers introduce risk identification into the decision management process, they authorize people to think negatively, at least temporarily, about what can go wrong with any particular decision. In the process, they now comprehend the knowns from program information that represents the current and past states of the program, and the various risks or uncertainties associated with the future outcome of each decision option. For Ricki Godfrey, as the energy sector program manager, incorporating risk management techniques into his decision process is a normal course of action. As he explains, “I was recently faced with a pretty tough trade-off decision on my
Figure 2: Applying risk identification in the decision process
When program managers introduce risk identification into the decision management process, they authorize people to think negatively, at least temporarily, about what can go wrong with any particular decision. In the process, they now comprehend the knowns from program information that represents the current and past states of the program, and the various risks or uncertainties associated with the future outcome of each decision option.
For Ricki Godfrey, as the energy sector program manager, incorporating risk management techniques into his decision process is a normal course of action. As he explains, “I was recently faced with a pretty tough trade-off decision on my program. My program indicators were showing that the subcontractor for a major component of our latest wind turbines, the blade structure, was progressively slipping schedule. When we evaluated this data against the time-to-benefit goal for the program, we could clearly see that if the trend in schedule slip continued, we would miss this important goal for the program.”
The situational analysis resulted in two decision options: 1) stay with the current plan and factor the schedule slips into the program schedule, or 2) revert back to an existing blade structure that is already developed and in use.
“A number of risks were identified for each of the options we had in front of us,” explained Godfrey. “The risk boiled down to this: if we stayed with the current plan to use the new blade designs, it may have a cascading delay on other construction projects, plus the customer may be delayed in their ability to generate and supply energy to the power grid. On the other hand, if we reverted to our existing blade structure we may have to go back to the regulations bodies for approval, plus our customer may lose the energy efficiency anticipated from the new design.”
DECISION CONTEXTOptimal decisions are not necessarily those which achieve the best outcome, but rather those which are most appropriate for adhering to the values and achieving the goals of the organization. As stated earlier, program data has to be processed, organized, and presented in a way that is meaningful given the context of a program. In short, program context refers to the stated business and operational goals of the program. Therefore, in order for program information to be useful to the decision process, it must be presented within context of the program goals.

15The Measurable News 2014.04 | mycpm.org
Clear and concise documentation of the program goals is critical to developing consistency in decision making. It is the program goals that provide the guard rails for program decisions. As stated previously, we advocate the use of a tool called the program strike zone which concisely documents the program goals and boundaries for a program. Figure 3 illustrates a simple example of a program strike zone.
© 2014 The Program Management Academy
Figure 3: Program strike zone example with program goals and boundaries
With respect to program decisions, the program goals contained within the program strike zone provide the appropriate framework for both the known and unknown elements of a decision as discussed earlier. First, raw program data must be processed and presented within the context of the stated goals. For example, schedule information is presented in terms of progress toward meeting the time-to-benefits program goal and resource burn rate is presented in terms of the program budget. Second, the impact of the risks identified for each of the decision options should be assessed in relation to achievement of the program goals. For example, the impact to customer satisfaction if a decision requires the removal of a customer desired feature. As illustrated in Figure 4, the assessment of risk impact within the context of the program goals is the final, and arguably the most important, step in the risk-based decision making process.
Figure 4: Using program goals to guide decisions
“Using the program goals as the framework for assessing the impact of the risks associated with each decision trade-off really helped in driving to a final decision,” stated Godfrey. “With either option, we were going to incur a schedule delay and the
Figure 3: Program strike zone example with program goals and boundaries
With respect to program decisions, the program goals contained within the program strike zone provide the appropriate framework for both the known and unknown elements of a decision as discussed earlier. First, raw program data must be processed and presented within the context of the stated goals. For example, schedule information is presented in terms of progress toward meeting the time-to-benefits program goal and resource burn rate is presented in terms of the program budget. Second, the impact of the risks identified for each of the decision options should be assessed in relation to achievement of the program goals. For example, the impact to customer satisfaction if a decision requires the removal of a customer desired feature. As illustrated in Figure 4, the assessment of risk impact within the context of the program goals is the final, and arguably the most important, step in the risk-based decision making process.
© 2014 The Program Management Academy
Figure 3: Program strike zone example with program goals and boundaries
With respect to program decisions, the program goals contained within the program strike zone provide the appropriate framework for both the known and unknown elements of a decision as discussed earlier. First, raw program data must be processed and presented within the context of the stated goals. For example, schedule information is presented in terms of progress toward meeting the time-to-benefits program goal and resource burn rate is presented in terms of the program budget. Second, the impact of the risks identified for each of the decision options should be assessed in relation to achievement of the program goals. For example, the impact to customer satisfaction if a decision requires the removal of a customer desired feature. As illustrated in Figure 4, the assessment of risk impact within the context of the program goals is the final, and arguably the most important, step in the risk-based decision making process.
Figure 4: Using program goals to guide decisions
“Using the program goals as the framework for assessing the impact of the risks associated with each decision trade-off really helped in driving to a final decision,” stated Godfrey. “With either option, we were going to incur a schedule delay and the
Figure 4: Using program goals to guide decisions
“Using the program goals as the framework for assessing the impact of the risks associated with each decision trade-off really helped in driving to a final decision,” stated Godfrey. “With either option, we were going to incur a schedule delay and the customer was going to be delayed in their ability to generate power. However, the greatest time-to-benefit risk was associated with potentially having to go through a regulation review if we reverted to the old blade structure.” Either option would also result in additional budget expenditure, but less if Godfrey stayed with the current plan for incorporating the new blade structure.

16 The Measurable News 2014.04 | mycpm.org
CONCLUSION
According to Godfrey, “the big factor was our customer satisfaction goal. It became clear that gaining energy efficiency from the new blade structure technology was by far the most important thing for our customer. This makes sense. Schedule and budget are short-term goals, but being able to generate power at a lower cost over the next twenty years is a definite long-term goal of greater importance. This tipped the decision in favor of staying with the plan to use the new blade structure, and to aggressively assist our subcontractor and manage the cascading affects to other projects in the queue.”
As we have been stating throughout this article, it is the uncertainty associated with many programs that makes the decision process challenging for program managers and their stakeholders. The uncertainty has to be comprehended in the decision process, and a level of consistency of positive decision outcomes has to be established for a program manager to gain decision empowerment. Critical to this consistency is documenting the program goals and then applying them in the decision process.
Look carefully at Figure 4 once again. The program goals are critical for processing program data into meaningful information that is used to evaluate the situation requiring a decision and to develop decision options. The program goals are again used to identify risk events which can jeopardize achievement of the goals. Finally, the program goals are used to assess the impact of risks associated with each decision option in order to achieve an optimal decision that is aligned to the business and operational goals of the program.
It is important to understand that applying a risk-based decision process does not change the basic steps involved in decision making:
1. Define the issues requiring a decision be made2. Examine the decision options3. Make the decision4. Manage to the outcome of the decision
What differs is that the final decision is arrived at by a structured understanding of the uncertainties associated with a program and results in a better balance between risk and reward. Also important to note is that risk-based decision making does not replace the decision maker. Its sole purpose is to support the decision maker as a source of information, supplying not only the optimal decision option, but also insight regarding the uncertainties, the program goals, and the various value judgments and assessments for the stakeholders involved.
Finally, effective risk management is much broader than identifying risks and practicing due diligence. Proactive risk management should drive the decision making process to ultimately improve your business results. We have discussed that senior management needs to rely on their trust and confidence of the program manager. This trust may be significantly enhanced if the program manager can support their recommended decisions to senior management with comprehensive risk based decision analysis as demonstrated above.
It is our hope that this article has been useful for you and your organization. Additional information on program management and decision making can be found in the 2nd edition of Program Management for Improved Business Results.
We welcome your questions and comments. Please contact us at our Program Management Academy email addresses noted below.
ABOUT THE AUTHORSRuss Martinelli, Oregon, USARuss Martinelli is a senior program manager at Intel Corporation, one of the world’s largest semiconductor companies. Russ has many years of experience leading global product development teams in both the aerospace and computing industries. Russ is also a founder of the Program Management Academy (www.programmanagement-academy.com), and co-author of Leading Global Project Teams and the first comprehensive book on program management titled Program Management for Improved Business Results. Russ can be contacted at [email protected].
Jim Waddell, Oregon, USAJim Waddell, former PMO director in the high-tech industry, is a founder of the Program Management Academy (www.programmanagement-academy.com) where he consults in program management and mergers & acquisitions. He has held a variety of management positions in the high tech and energy industries, has been a speaker at numerous conferences, and is a co-author of two books: Leading Global Project Teams and Program Management for Improved Business Results. Jim can be contacted at [email protected].

THE MEASURABLE NEWS
The Quarterly Magazine of the College of Performance Management | mycpm.org
2014.04
17
1) The term …”ilities” refers to terms such as maintainability, reliability, serviceability, operability, testability, etc.
INTRODUCTION
Establishing a credible Performance Measurement Baseline, with a risk adjusted Integrated Master Plan and Integrated Master Schedule, starts with the WBS and connects Technical Measures of progress to Earned Value
EIA-748-C asks us to “objectively assess accomplishments at the work performance level.” As well §3.8 of 748-C tells us “Earned Value is a direct measurement of the quantity of work accomplished. The quality and technical content of work performed is controlled by other processes.” [6]
Without connecting the technical and quality measures to Earned Value, CPI and SPI provide little in the way of assuring the delivered products will actually perform as needed. To provide visibility to integrated cost, schedule, and technical performance, we need more than CPI and SPI. We need measures of the increasing technical maturity of the project’s system elements in units of measure meaningful to the decision makers. Those units include Effectiveness, Performance, all the …”ilities”, and risk reduction.1
PROCESSES TO INCREASE THE PROBABILITY OF PROGRAM SUCCESSWith the management processes in Table 1, the elements in Figure 1 are the basis of a credible Performance Measurement Baseline (PMB) needed to increase the probability of program success using these elements.
Step Outcome
Define WBS
• Using SOW, SOO, ConOps, and other program documents, develop WBS for system elements and work processes that produce the program outcomes.
• Develop WBS Dictionary describing the criteria for the successful delivery of these outcomes.
Build IMP
• Develop Integrated Master Plan, showing how each system element in the WBS will move through the maturation process at each Program Event.
• Define Measures of Effectiveness (MOE) at each Accomplishment (SA).• Define Measures of Performance (MOP) at each Criteria (AC).
Identify Reducible Risks
• For each key system element in the WBS, identify reducible risks, probability of occurrence, mitigation plan, and residual risk in the Risk Register. [5][4]
• Risk mitigation activities will be placed in the Integrated Master Schedule (IMS). [20]• For risks without mitigation plans, place budget for risk in Management Reserve (MR)
to be used to handle risk when it becomes an Issue.
BuildIMS
• Arrange Work Packages and Tasks in a logical network of increasing maturity of system elements. [11]
• Define exit criteria for each Work Package to assess planned Physical Percent Complete to inform BCWP with TPM, MOP, MOE, and Risk Reduction assessments.
Identify Irreducible Risks
• For irreducible risks in the IMS, use Reference Classes for Monte Carlo Simulation anchored with Most Likely duration to calculate needed schedule margin.
• Assign schedule margin to protect key system elements, per DI-MGMT-81861 guidance.
Baseline PMB
• Using risk adjusted IMS containing reducible risk and explicit schedule margin tasks, establish the Performance Measurement Baseline (PMB) and calculate the Management Reserve (MR).
• Management Reserve is used for unmitigated risks that remain in the risk register.
Table 1 – Steps to building a risk adjusted Performance Measurement Baseline with Management Reserve.
BUILDING A CREDIBLE PERFORMANCEMEASUREMENT BASELINEBy Glen B. Alleman, Thomas J. Coonce, and Rick A. Price

18 The Measurable News 2014.04 | mycpm.org
THE SITUATIONWe’re working ACAT1/ACAT2 programs for Department of Defense using JCIDS (Joint Capabilities and Development Systems) the governance guidance defined in DODI 5000.02.
The JCIDS Capabilities Based Planning paradigm tells us to define what Done looks like in units of Effectiveness and Performance, so we need to start by measuring progress toward delivered Capabilities. Requirements elicitation is part of the process, but programs shouldn’t start with requirements, but with an assessment of the Capabilities Gaps. While this approach may seem overly formal, the notion of defining what capabilities are needed for success is the basis of defining what Done looks like. We’ll use this definition, so we’ll recognize it when it arrives.
With the definition of Done, we can define the processes for incrementally assessing our system elements along the path to Done. Earned Value Management is one tool to perform these measurements of progress to plan. But like it says in EIA-748-C, Earned Value – left to itself – is a measure of quantity. We need measures of quality and other …ilities that describe the effectiveness and performance of the product to inform our Earned Value measures of the Estimate to Complete (ETC) and Estimate at Completion (EAC). We need to integrate other measures with the Earned Value assessment process. We can start this by recognizing that the Budgeted Cost of Work Performed (BCWP) is a measure of the efficacy of our dollar.
Earned Value is actually the measure of “earned budget.” Did we “earn” our planned budget? Did we get our money’s worth? We only know the answer if we measure “Value” in units other than money. This can be the effectiveness of the solution, the performance of the solution, the technical performance of the products, or the fulfillment of the mission. The maintainability, reliability, serviceability, and other …ilities are assessments of Value earned, not described by CPI and SPI from the simple calculation of BCWP.
THE IMBALANCEWithout the connection between the technical plan and programmatic plan – cost and schedule – the program performance assessment cannot be credible. [3] Of course BCWP represents the Earned Value, but the Gold Card and other guidance doesn’t explicitly state how to calculate this number. BCWP is a variable without directions for its creation. BCWS and ACWP have clear direction on how to assign values to them, but not BCWP.
The common advice is to determine percent done and then multiply that with BCWS to produce BCWP. But what is the percent done of what outcome? What units of measure are used to calculate percent complete?
It’s this gap between just assigning a value to BCWP through Earned Value Techniques (EVT) and informing BCWP with tangible evidence of progress to plan, in units of measure meaningful to the decision makers, that is the goal of this paper.
RESTORING THE BALANCEBalance is restored by starting with the target values for Effectiveness, Performance, …illities, and level of acceptable Risk at specific times in the program – at Program Events – measure the actual Effectiveness, Technical Performance, …illities, and Risk, to produce a variance, to determine the physical percent complete of any system elements in the WBS.
Using the steps in Table 1 and elements of Figure 1 the connections between each element assure the Technical Plan and the Programmatic Plan are integrated with units of performance needed to inform BCWP.

19The Measurable News 2014.04 | mycpm.org
3
Figure 1 – Programmatic elements needed to increase the probability of program success. Connecting the dots between Measures of Effectiveness, Measures of Performance, and Technical Performance Measures needed to inform BCWP that provide leading indicators of performance needed to take corrective actions to Keep The Program GREEN.
The remainder of this paper describes the steps needed to establish a credible PMB containing event-based risk reduction activities and schedule margin for irreducible risks. Both are needed to assure the necessary probability of success for cost, schedule, and technical performance. These steps include:
Identifying the reducible risks and their mitigation plans and placing these in the IMS. Identifying the Measures of Effectiveness, Measures of Performance, Technical
Performance Measures, and Key Performance Parameters and assigning them to IMP and IMS elements.
Baselining the IMS and developing a Monte Carlo Simulation model of the Irreducible Risks with the needed schedule and cost margins to protect delivery dates and baselined budget.
THE SOLUTION Creating a credible PMB and successfully executing the program, starts by connecting the dots between the processes in Table 1, and the elements in Figure 1. This ensures the program’s Technical Plan and the Programmatic Plan are integrated from day one. Making these connections starts with Systems Engineering – where the MOEs, MOPs, TPMs, the …ilities, and Risk are identified. These target values are flowed onto the IMP and IMS and used to create work activities for reducible risks, and appropriate schedule margins identified through Monte Carlo Simulations needed for margins to address the irreducible risks. There is existing guidance in place, starting at the Government Program Management Office, down to the contractor level to guide the development of these connections.
Figure 1 – Programmatic elements needed to increase the probability of program success. Connecting the dots between Measures of Effectiveness, Measures of Performance, and Technical Performance Measures needed to inform BCWP that provide leading indicators of performance needed to take
corrective actions to Keep The Program GREEN.
The remainder of this paper describes the steps needed to establish a credible PMB containing event-based risk reduction activities and schedule margin for irreducible risks. Both are needed to assure the necessary probability of success for cost, schedule, and technical performance. These steps include:
• Identifying the reducible risks and their mitigation plans and placing these in the IMS.• Identifying the Measures of Effectiveness, Measures of Performance, Technical
Performance Measures, and Key Performance Parameters and assigning them to IMP and IMS elements.
• Baselining the IMS and developing a Monte Carlo Simulation model of the Irreducible Risks with the needed schedule and cost margins to protect delivery dates and baselined budget.
THE SOLUTIONCreating a credible PMB and successfully executing the program, starts by connecting the dots between the processes in Table 1, and the elements in Figure 1. This ensures the program’s Technical Plan and the Programmatic Plan are integrated from day one. Making these connections starts with Systems Engineering – where the MOEs, MOPs, TPMs, the …ilities, and Risk are identified. These target values are flowed onto the IMP and IMS and used to create work activities for reducible risks, and appropriate schedule margins identified through Monte Carlo Simulations needed for margins to address the irreducible risks. There is existing guidance in place, starting at the Government Program Management Office, down to the contractor level to guide the development of these connections.
But to restate it again, it can’t be any clearer than this …
4
But to restate it again, it can’t be any clearer than this …
WORK BREAKDOWN STRUCTURE IS PARAMOUNT The path to creating a credible PMB starts with the Work Breakdown Structure. It is in the WBS that the system elements are defined, as well as the processes that produce the system elements, and the risk to the performance of these system elements.
MIL-STD-881-C Guidance [6]
The Work Breakdown Structure, described in MIL-STD-881-C, has several purposes that support the development of our credible PMB. [13]
DoD Directive 5000.01 ― The Defense Acquisition System‖― requires a disciplined approach in establishing program goals over its life cycle with streamlined and effective management that ― is accountable for credible cost, schedule, and performance reporting.
o The WBS is a critical tool in ensuring all portions of the program are covered. This all-in requirement assures all system elements are identified in the WBS.
o The WBS facilitates collaboration between the Integrated Product Teams by connecting performance, cost, schedule, and risk information in the IMP, IMS, and Risk Register.
o The WBS facilitates the technical rigor and integrated development, test, and evaluation throughout the acquisition process.
o The WBS is the first location to define the risks to achieving the above items in this list.
DoD Instruction 5000.02 ― Operation of the Defense Acquisition System ― further outlines the required framework and provides impetus for use of a WBS.
o The evolution of the system through incremental development further drives the requirement to breakdown the system in a structure that clarifies which capabilities will be satisfied in a specific increment of the system development.
o The instruction sets the requirements for Integrated Master Schedules (IMS), Earned Value Management (EVM) and other statutory, regulatory, and contract reporting information and milestone requirements in which the WBS is a critical element.
The final dot to be connected is the critical link between the WBS, IMP, and IMS with the Systems Engineering Plan (SEP) on the government side and the Systems Engineering Management Plan (SEMP) on the contractor side. These are where MOEs, MOPs, KPPs, Risks, and TPMs start and are connected with the assessment of Physical Percent Complete.
Risk Management Starts At The WBS Just like DODI 5000.01 tells us to start with the WBS for risk identification, the Defense Acquisition Guide also states:
Risk is a measure of future uncertainties in achieving program performance goals and objectives within defined cost, schedule, and performance constraints. Risk can be associated with all aspects of a program (e.g., threat environment, hardware, software, human interface, technology maturity, supplier capability, design maturation, performance against plan,) as these aspects relate across the Work Breakdown Structure and Integrated Master Schedule.

20 The Measurable News 2014.04 | mycpm.org
WORK BREAKDOWN STRUCTURE IS PARAMOUNTThe path to creating a credible PMB starts with the Work Breakdown Structure. It is in the WBS that the system elements are defined, as well as the processes that produce the system elements, and the risk to the performance of these system elements.
MIL-STD-881-C GUIDANCE [6]The Work Breakdown Structure, described in MIL-STD-881-C, has several purposes that support the development of our credible PMB. [13]
• DoD Directive 5000.01 – The Defense Acquisition System requires a disciplined approach in establishing program goals over its life cycle with streamlined and effective management that – is accountable for credible cost, schedule, and performance reporting. • The WBS is a critical tool in ensuring all portions of the program are covered. This all-
in requirement assures all system elements are identified in the WBS.• The WBS facilitates collaboration between the Integrated Product Teams by
connecting performance, cost, schedule, and risk information in the IMP, IMS, and Risk Register.
• The WBS facilitates the technical rigor and integrated development, test, and evaluation throughout the acquisition process.
• The WBS is the first location to define the risks to achieving the above items in this list.
• DoD Instruction 5000.02 – Operation of the Defense Acquisition System – further outlines the required framework and provides impetus for use of a WBS. • The evolution of the system through incremental development further drives the
requirement to breakdown the system in a structure that clarifies which capabilities will be satisfied in a specific increment of the system development.
• The instruction sets the requirements for Integrated Master Schedules (IMS), Earned Value Management (EVM) and other statutory, regulatory, and contract reporting information and milestone requirements in which the WBS is a critical element.
• The final dot to be connected is the critical link between the WBS, IMP, and IMS with the Systems Engineering Plan (SEP) on the government side and the Systems Engineering Management Plan (SEMP) on the contractor side. These are where MOEs, MOPs, KPPs, Risks, and TPMs start and are connected with the assessment of Physical Percent Complete.
RISK MANAGEMENT STARTS AT THE WBSJust like DODI 5000.01 tells us to start with the WBS for risk identification, the Defense Acquisition Guide also states:
Risk is a measure of future uncertainties in achieving program performance goals and objectives within defined cost, schedule, and performance constraints. Risk can be associated with all aspects of a program (e.g., threat environment, hardware, software, human interface, technology maturity, supplier capability, design maturation, performance against plan,) as these aspects relate across the Work Breakdown Structure and Integrated Master Schedule.
With the guidance shown above, Figure 1 shows WBS is the first place the program encounters risk management along with their identification and the description of their outcomes, in the WBS Dictionary.
Each key system element in the WBS must be assessed for technical or programmatic risk that will impede its delivery on time, on cost, and on performance. The reduction of this risk, following its planned risk reduction levels, will be used to inform Physical Percent complete and the resulting BCWP. If risk is not being reduced as planned, the program’s Earned Value measures may not properly represent the technical progress.
THE INTEGRATED MASTER PLAN (IMP) The IMP is an event-based plan consisting of a sequence of program events, with each event being supported by specific accomplishments, and each accomplishment associated with specific criteria to be satisfied for its completion. These IMP elements are defined as: [1], [2], [3], [10]
• Event: a key decision point or program assessment point that occurs at the culmination of significant program activities.

21The Measurable News 2014.04 | mycpm.org
• Accomplishment: is the desired result(s) prior to or at completion of an event that indicates a level of the program’s progress.
• Criteria: provides definitive evidence that a specific accomplishment has been completed. Entry criteria reflect what must be done to be ready to initiate a review, demonstration, or test. Exit criteria reflect what must be done to clearly ascertain the event has been successfully completed.
STRUCTURE OF THE INTEGRATED MASTER PLAN (IMP)Figure 2 shows the structure of the Integrated Master Plan (IMP), with Program Events (PE), Significant Accomplishments (SA), and Accomplishment Criteria (AC). This structure assesses the increasing maturity of each key system element, to assure the end item system elements meet the planned Effectiveness and Performance needs that fulfill the capabilities for the mission or business goals. [14][15]
With this structure, Earned Value Management measures can now be connected to the Work Packages defined in the Integrated Master Schedule (IMS) to assess technical performance in ways not available with CPI and SPI only. The Program Manager now has leading indicators of the program success through the MOEs defined by the SA’s and MOPs defined by the AC’s, each assessed for compliance with plan at the Program Event. In Figure 2 the IMS should encompass the IMP; work packages and tasks are the “new” element the IMS adds to the IMP along with the element of time.
6
Structure of the Integrated Master Plan (IMP) Figure 2 shows the structure of the Integrated Master Plan (IMP), with Program Events (PE), Significant Accomplishments (SA), and Accomplishment Criteria (AC). This structure assesses the increasing maturity of each key system element, to assure the end item system elements meet the planned Effectiveness and Performance needs that fulfill the capabilities for the mission or business goals. [14][15]
With this structure, Earned Value Management measures can now be connected to the Work Packages defined in the Integrated Master Schedule (IMS) to assess technical performance in ways not available with CPI and SPI only. The Program Manager now has leading indicators of the program success through the MOEs defined by the SA’s and MOPs defined by the AC’s, each assessed for compliance with plan at the Program Event. In Figure 2 the IMS should encompass the IMP; work packages and tasks are the “new” element the IMS adds to the IMP along with the element of time.
Figure 2 – The Integrated Master Plan defines the increasing maturity of each key system element assessed at Program Events. Significant Accomplishments are entry criteria for this maturity assessment. Accomplishment Criteria are measures substantiating the maturity level of the work products produced by Work Packages in the IMS.
Measures of “Progress To Plan” Start At The IMP The Program Events, Significant Accomplishments, and Accomplishment Criteria form the elements of the IMP. Measures of Effectiveness (MOE) for the program are derived from the JCIDS process and are reflected in the IMP’s Significant Accomplishments (SA). The Measures of Performance (MOP) are derived from the MOEs and are reflected in the IMP’s Accomplishment Criteria (AC).
These measures assess the physical percent complete of the system elements used to inform Earned Value (BCWP) for reporting programmatic performance. With this Physical Percent Complete measure, the EVM indices then reflect the cost, schedule, and technical performance of the program using the Systems Engineering measures:
Measures of Effectiveness (MOE) – are operational measures of success closely related to the achievements of the mission or operational objectives evaluated in the operational environment, under a specific set of conditions.
Measures of Performance (MOP) – characterize physical or functional attributes relating to the system operation, measured or estimated under specific conditions.
Key Performance Parameters (KPP) – represent significant capabilities and characteristics in that failure to meet them can be cause for reevaluation, reassessing, or termination of the program.
Figure 2 – The Integrated Master Plan defines the increasing maturity of each key system element assessed at Program Events. Significant Accomplishments are entry criteria for this maturity
assessment. Accomplishment Criteria are measures substantiating the maturity level of the work products produced by Work Packages in the IMS.
MEASURES OF “PROGRESS TO PLAN” START AT THE IMPThe Program Events, Significant Accomplishments, and Accomplishment Criteria form the elements of the IMP. Measures of Effectiveness (MOE) for the program are derived from the JCIDS process and are reflected in the IMP’s Significant Accomplishments (SA). The Measures of Performance (MOP) are derived from the MOEs and are reflected in the IMP’s Accomplishment Criteria (AC).
These measures assess the physical percent complete of the system elements used to inform Earned Value (BCWP) for reporting programmatic performance. With this Physical Percent Complete measure, the EVM indices then reflect the cost, schedule, and technical performance of the program using the Systems Engineering measures:
• Measures of Effectiveness (MOE) – are operational measures of success closely related to the achievements of the mission or operational objectives evaluated in the operational environment, under a specific set of conditions.
• Measures of Performance (MOP) – characterize physical or functional attributes relating to the system operation, measured or estimated under specific conditions.
• Key Performance Parameters (KPP) – represent significant capabilities and characteristics in that failure to meet them can be cause for reevaluation, reassessing, or termination of the program.
• Technical Performance Measures (TPM) – are attributes that determine how well a system or system element is satisfying or expected to satisfy a technical requirement or goal. [22]

22 The Measurable News 2014.04 | mycpm.org
2) https://dap.dau.mil/acquipedia/Pages/ArticleDetails.aspx?aid=7c1d9528-4a9e-4c3a-8f9e-6e0ff93b6ccb
3) “On Numerical Representation of Aleatory and Epistemic Uncertainty,” Hans Schjær-Jacobsen, Proceedings of 9th International Conference of Structural Dynamics, EURODYN 2014.
Continuous verification of actual performance versus anticipated performance of a selected technical parameter confirms progress and identifies variances that might jeopardize meeting a higher-level end product requirement. Assessed values falling outside established tolerances indicate the need for management attention and corrective action.
A well thought out TPM process provides early warning of technical problems, supports assessments of the extent to which operational requirements will be met, and assesses the impacts of proposed changes made to lower-level elements in the system hierarchy on system performance.2 With this estimate, the programmatic performance of the program can be informed in a way not available with CPI and SPI alone.
Technical Performance Measurement (TPM), as defined in industry standard, EIA-632, involves estimating the future value of a key technical performance parameter of the higher-level end product under development, based on current assessments of products lower in the system structure.
Continuous verification of actual versus anticipated achievement for selected technical parameters confirms progress and identifies variances that might jeopardize meeting a higher-level end product requirement. Assessed values falling outside established tolerances indicate the need for management attention and corrective action.
RISK MANAGEMENT CONTINUES FROM THE WBS TO THE IMPThroughout all product definition processes, technical and programmatic risk assessment is performed. These risks are placed in the Risk Register shown in Figure 3 with their uncertainties. Uncertainty comes in two forms:3
Table 2 – Irreducible and Reducible uncertainty both create risk to the program for cost, schedule, and technical performance. As well as reducible and irreducible there are Unknown Unknowns that are mitigated in the DOD by replanning the program. [19]
Reducible Uncertainty Irreducible Uncertainty
The probability that something will happen to impact cost, schedule, and technical performance of the system elements.
The natural variation of the program’s activities work duration and cost. The variance and its impacts are protected by schedule and cost margin.
• Reducible uncertainty can be stated as the probability of an event, and we can do something about reducing this probability of occurrence.
• These are (subjective or probabilistic) uncertainties that are event-based probabilities, are knowledge-based, and are reducible by further gathering of knowledge.
• Irreducible uncertainty is the probability range of these variances of the stochastic variability from the natural randomness of the process and is characterized by a probability distribution function (PDF) for their range and frequency, and therefore are irreducible.
• Irreducible uncertainty can be modeled with Monte Carlo Simulation using Reference Classes based on past performance.
CAPTURE REDUCIBLE RISKS THROUGH THE WBS NUMBERWith Reducible risks, specific work is performed on baseline to reduce the probability of occurrence or impact or consequence of the risk. [5] With Irreducible risk, schedule margin is needed to protect the delivery date of key system elements. A measure of the performance of the program is the Margin Burn-down Plan shown in Figure 9. If the actual risk reduction does not follow the risk burn-down plan, this is a leading indicator of future difficulties in the program’s performance and an indicator of impact on cost and schedule.

23The Measurable News 2014.04 | mycpm.org
8
the program is the Margin Burn-down Plan shown in Figure 9. If the actual risk reduction does not follow the risk burn-down plan, this is a leading indicator of future difficulties in the program’s performance and an indicator of impact on cost and schedule.
Figure 3 – The mitigation activities for Reducible are guided by the Risk Register’s contents and the WBS in the IMS. Work to reduce risk is planned and executed On Baseline through Work Packages. Risk reduction lowers the probability and/or impact of occurrence and therefore lowers the probability of impact of the named risk.
STEPS TO BUILDING A CREDIBLE INTEGRATED MASTER PLAN The Integrated Master Plan (IMP) is the strategy for the successful delivery of outcomes of the program. Strategies are hypotheses that need to be tested. The IMP’s Events, Accomplishments, and Criteria are the testing points for the hypothesis that the program is proceeding as planned, both technically as planned and programmatically as planned. Development of the IMP is a step-wise process, starting with the Program Events.
Identify Program Events Program Events are maturity assessment points. They define the needed levels of maturity for the products and services before proceeding to the next assessment point. The entry criteria for each Event define the units of measure for the successful completion of the Event.
The Program Events confirm the end-to-end description of the increasing maturity of the program’s system elements. As well, they establish the target dates for each Event in the RFP or contract.
Finally they socialize the language of speaking in “Increasing Maturity at Events” rather than the passage of time and consumption of budget.
Figure 3 – The mitigation activities for Reducible are guided by the Risk Register’s contents and the WBS in the IMS. Work to reduce risk is planned and executed On Baseline through Work Packages.
Risk reduction lowers the probability and/or impact of occurrence and therefore lowers the probability of impact of the named risk.
STEPS TO BUILDING A CREDIBLE INTEGRATED MASTER PLANThe Integrated Master Plan (IMP) is the strategy for the successful delivery of outcomes of the program. Strategies are hypotheses that need to be tested. The IMP’s Events, Accomplishments, and Criteria are the testing points for the hypothesis that the program is proceeding as planned, both technically as planned and programmatically as planned. Development of the IMP is a step-wise process, starting with the Program Events.
IDENTIFY PROGRAM EVENTSProgram Events are maturity assessment points. They define the needed levels of maturity for the products and services before proceeding to the next assessment point. The entry criteria for each Event define the units of measure for the successful completion of the Event.
The Program Events confirm the end-to-end description of the increasing maturity of the program’s system elements. As well, they establish the target dates for each Event in the RFP or contract.
Finally they socialize the language of speaking in “Increasing Maturity at Events” rather than the passage of time and consumption of budget.
IDENTIFY SIGNIFICANT ACCOMPLISHMENTSThe Significant Accomplishments (SA) are the “road map” to the increasing maturity of the program. They are the “Value Stream Map” resulting from the flow of SA’s describing how the products or services move through the maturation process while reducing risk. This Significant Accomplishment map is our path to “done.”
IDENTIFY ACCOMPLISHMENT CRITERIAThe definition of “done” emerges in the form of system elements rather than measures of cost and passage of time. These system elements come from Work Packages, whose outcomes can be assessed against Technical Performance Measures (TPM) to assure compliance with the Measure of Performance (MOP). At each Program Event, the increasing maturity of the system elements is defined through the Measures of Effectiveness (MoE) and Measures of Performance (MoP).
The vertical connectivity of ACs and SAs to PEs, described in Figure 4, establishes the framework for the horizontal traceability of Work Packages in the Integrated Master Schedule to the Integrated Master Plan.

24 The Measurable News 2014.04 | mycpm.org
9
Identify Significant Accomplishments The Significant Accomplishments (SA) are the “road map” to the increasing maturity of the program. They are the “Value Stream Map” resulting from the flow of SA’s describing how the products or services move through the maturation process while reducing risk. This Significant Accomplishment map is our path to “done”.
Identify Accomplishment Criteria The definition of “done” emerges in the form of system elements rather than measures of cost and passage of time. These system elements come from Work Packages, whose outcomes can be assessed against Technical Performance Measures (TPM) to assure compliance with the Measure of Performance (MOP). At each Program Event, the increasing maturity of the system elements is defined through the Measures of Effectiveness (MoE) and Measures of Performance (MoP).
The vertical connectivity of ACs and SAs to PEs, described in Figure 4, establishes the framework for the horizontal traceability of Work Packages in the Integrated Master Schedule to the Integrated Master Plan.
Figure 4 – Vertical and horizontal traceability between the Integrated Master Plan (IMP) and the Integrated Master Schedule (IMS). The IMP describes how the increasing maturity of the system elements will be assessed with Measures of Effectiveness (MOE) and Measures of Performance (MOP). The IMS describes the work needed to produce that increasing maturity through the assessment of Technical Performance Measures (TPM).
Figure 4 – Vertical and horizontal traceability between the Integrated Master Plan (IMP) and the Integrated Master Schedule (IMS). The IMP describes how the increasing maturity of the system
elements will be assessed with Measures of Effectiveness (MOE) and Measures of Performance (MOP). The IMS describes the work needed to produce that increasing maturity through the assessment of
Technical Performance Measures (TPM).
INTEGRATED MASTER SCHEDULE (IMS)The Integrated Master Schedule (IMS) embodies all work effort needed to produce a product or accomplish specific goals that have an associated cost. The work effort is represented by well-defined tasks that program participants execute (expending cost) to generate the desired products. [12]
Tasks are organized in the proper sequence to facilitate efficient execution that enables the program to know what work must be accomplished to achieve their objectives. Task sequencing occurs by recognizing the dependencies among all the tasks. Then, by identifying the expected time to perform each task, the program can project an expected completion time. [3] A well- structured and managed IMS can now serve as the program’s GPS, providing timely information that enables program management to making informed decisions about the paths to successful delivery of all the system elements.
The IMP Events, Accomplishments, and Criteria are duplicated in the IMS. Detailed tasks are added to depict the steps required to satisfy performance criterion. The IMS should be directly traceable to the IMP and should include all the elements associated with development, production or modification, and delivery of the total product and program high level plan.
Durations are entered for each discrete task in a work package, planning package, and lower level task or activity, along with predecessor and successor relationships, and any constraints that control the start or finish of each work package and planning package.
The result is a fully networked “bottoms up” schedule that supports critical path analysis. Although durations are assigned at the work package and planning package level, these durations will roll up to show the overall duration of any event, accomplishment, or criteria. When Level of Effort (LOE) work packages, tasks, or activities are included in the IMS, they must be clearly identified as such. Level of Effort shall never drive the critical path.
STEPS TO BUILDING THE INTEGRATED MASTER SCHEDULE (IMS)Starting with the WBS, a credible IMS that produces the system elements must address reducible risk through risk mitigation activities. This IMS must also address the irreducible uncertainties and those discrete risks that remain in the risk register that could not be mitigated through work activities. These uncertainties are categorized as known–unknowns because they are known, but it is not known for certainty that they will occur.
Programs can protect against these uncertainties by setting cost and schedule margin for the irreducible uncertainties, and management reserves for the reducible risks that were not mitigated. Cost and schedule margins are included in the Performance Measurement Baseline and Management Reserve is established for the latent reducible risks and is held above the PMBs but is still part of the Contract Budget Base (CBB).

25The Measurable News 2014.04 | mycpm.org
REDUCIBLE RISK MANAGEMENT PROCESSES ARE IN THE IMSAll reducible risks identified in the Risk Register need to be assessed for reducibility in the IMS. If the risk – the uncertainty that is event based – can be reduced, then that work is assigned to work packages and activities in the IMS and placed on baseline. These risk buy down activities are managed just like ordinary work, funded by the CBB, and measured for performance just like any other work.
The risk reduction mitigation activities are planned to achieve a specific level of risk reduction at a specific time in the IMS. Meeting the planned risk reduction level at the planned time is a measure of performance of the risk retirement activities.
IRREDUCIBLE RISK MANAGEMENT PROCESSES ARE IN MARGINWith the reducible risks from the Risk Register handled with risk retirement activities in the IMS, the irreducible risks now need to be identified and handled in the IMS. Since the irreducible risks are actually irreducible, only margin can be used to protect the system elements from this naturally occurring variance. No actual work can be done to do this.
Monte Carlo Simulation of the IMS is the primary tool for assessing how much margin is needed for each irreducible risk type.
DEVELOPMENT OF SCHEDULE MARGIN Schedule margin is a buffer of time used to increase the probability that the program will meet the targeted delivery date. Schedule Margin is calculated by starting with a Probability Distribution Function (PDF) of the naturally occurring variance of the work duration of the Most Likely value of that duration. With the Most Likely Value and the PDF for the probability of other values, the durations of all work in the Integrated Master Schedule and the probabilistic completion times of this work can be modeled with a Monte Carlo Simulation tool. [9]
This modeling starts with the deterministic schedule, which includes work for the Reducible Risks. The schedule margin is the difference in the initial deterministic date and a longer duration and associated date with a higher confidence level generated through the Monte Carlo Simulation.
Figure 5 illustrates this concept. In this example, the deterministic delivery date is 8/4/08 with the contract delivery date of 8/31/08. Using the historical variability of the task durations resulted in a 5% confidence level of completing on or before 8/4/14 shown in the deterministic schedule. This says that with the deterministic schedule – no accounting for the natural variability in work durations, the probability of completing on or before 8/4/08 is 5%.4
To increase the confidence level of meeting the contractual date, the contractor needs to increase the probability of completing on or before to 80%. The difference in duration between the deterministic schedule’s completion date of 8/4/08 and the 80% confidence of completing on or before 8/14/08 is 10 calendar days, still earlier than the contractual date of 8/31/08.
12
Figure 5 – Monte Carlo Simulation used to determine schedule margin developed from the Deterministic IMS, showing a completion date of 8/4/08. The 80% confidence of completing on or before the needed 8/14/08. The Schedule Margin is then added in front of key system elements to protect their delivery dates to meet the contractual need date of 8/31/08
Assign Schedule Margin to Protect Key System Elements Using schedule margin to protect against schedule risk – created by the natural uncertainties in the work durations enables on-time contractual end item deliveries.
There are two schools of thought on how schedule margin should be managed.
Place all schedule margin at the end of the program or system elements. Distribute margin at strategic points along critical paths where there are known schedule
risks.
Placing all the margin at the end appears effective in short duration or production efforts where the primary schedule risk is not driven by technical complexity. The same objective can be achieved when a disciplined process is followed for control and consumption of distributed margin. Paramount to this approach is accelerating downstream efforts when margin is NOT consumed.
Most schedule risk in a development program is encountered when program elements are integrated and tested. Even when margin is distributed, margin is often kept at the end of the schedule to help protect against risk when all paths come together during final integration and test. This approach enables on-time end item delivery with realistic cost and schedule baselines that provide accurate forecasts and decisions based on current status, remaining efforts and related schedule risks.
Figure 5 – Monte Carlo Simulation used to determine schedule margin developed from the Deterministic IMS, showing a completion date of 8/4/08. The 80% confidence of completing on or before the needed 8/14/08. The Schedule Margin is then added in front of key system elements to
protect their delivery dates to meet the contractual need date of 8/31/08
4) These dates are taken from the Wright Brothers development efforts of the Heavier-Than-Air contract issued by the U.S. Army at the turn of the twentieth century. This example will be used later in this paper to show how to connect all the dots to produce a credible PMB.

26 The Measurable News 2014.04 | mycpm.org
5) GAO Schedule Assessment Guide, page 113. “Schedule margin is calculated by performing a schedule risk analysis and comparing the schedule date with that of the simulation result at the desired level of uncertainty.”
ASSIGN SCHEDULE MARGIN TO PROTECT KEY SYSTEM ELEMENTSUsing schedule margin to protect against schedule risk – created by the natural uncertainties in the work durations enables on-time contractual end item deliveries.
There are two schools of thought on how schedule margin should be managed.• Place all schedule margin at the end of the program or system elements.• Distribute margin at strategic points along critical paths where there are known schedule risks.
Placing all the margin at the end appears effective in short duration or production efforts where the primary schedule risk is not driven by technical complexity. The same objective can be achieved when a disciplined process is followed for control and consumption of distributed margin. Paramount to this approach is accelerating downstream efforts when margin is NOT consumed.
Most schedule risk in a development program is encountered when program elements are integrated and tested. Even when margin is distributed, margin is often kept at the end of the schedule to help protect against risk when all paths come together during final integration and test. This approach enables on-time end item delivery with realistic cost and schedule baselines that provide accurate forecasts and decisions based on current status, remaining efforts and related schedule risks.
There are several valid reasons for distributing schedule margin earlier in the IMS including:• Protecting use of critical shared resources so that being a few weeks late doesn’t turn
into a several month schedule impact. An example in space programs is use of a thermal vacuum chamber shared across multiple programs at critical times in their schedules. If a program is unable to enter the chamber at their scheduled time the ultimate delay may be an exponential factor of their original delay.
• Protecting highly visible milestones that are difficult and undesirable to change like a Critical Design Review (CDR).
• Establishing realistic performance baselines accounting for schedule risk at key points provides more valid data to make program decisions.
• Establishing realistic baselines that are cost effective.• Placing margin where we believe it will be needed and consumed provides the most
realistic schedule baseline possible for succeeding efforts and enables more accurate resource planning for prime contract, customer, and suppliers.
KEY INSERTION POINTS FOR SCHEDULE MARGINSchedule Margin is not the same as Schedule Slack or Schedule Float as stated in the GAO Schedule Assessment Guide.5 Margin is preplanned and consumed for known schedule irreducible uncertainty and float is the calculated difference between early and late dates. In many ways margin is much like management reserve and float is similar to underruns/overruns.
• Schedule margin is placed where there is known irreducible schedule risk. It is never consumed because of poor schedule performance. In this case, Schedule Margin is managed like Management Reserve.
• Schedule margin is not budgeted – it does not have an assigned BCWS. If the risk the margin is protecting comes true, new tasks need to be identified and budgeted. If the risk is not realized, the schedule margin is zeroed out and the succeeding tasks accelerated – moved to the left.
• Allocating margin for known risks at key points prevents this margin from being used to cover poor schedule performance. This forces an immediate recovery action to stay on schedule instead of degrading margin as if it was schedule float.
• Inclusion of margin – either distributed in front of key system elements or at the end of contractual system elements – does not affect contractual period of performance. The period of performance is defined by the contract. The Schedule Margin activities in the deterministic schedule are represented in the PMB, using the task label defined in DI-MGMT-81861 §3.7.2.4 – SCHEDULE MARGIN.
• Inclusion of schedule margin for known schedule risk provides a realistic baseline and accurate resource planning (including the customer). If not consumed the effort is accurately represented as “ahead of schedule”.
DEVELOPMENT OF COST MARGIN OR CONTINGENCY RESERVEThe cost margin is the amount of cost reserve needed to address irreducible cost variances of the program’s work efforts and to improve the probability of meeting the target cost – the contract cost. Cost margin is calculated in the same manner as schedule margin. The contractor develops a probability distribution of the final cost based on the natural variances contained in the historical databases. The confidence level of meeting the target

27The Measurable News 2014.04 | mycpm.org
contracted cost in the IMS is noted. If the confidence level is too low, it has been suggested that cost margin be added to the baseline, in the same manner as schedule margin, to bring the baseline up to a desired cost confidence level.
However, at this time, there is no generally agreed to mechanism to do so. If the Confidence Level is unacceptably low, the contractor must redo the IMS and try to reduce costs for time dependent and time independent costs to raise the cost confidence to an acceptable level. Re-planning would result in re-calculating the schedule margin. If after re-planning, the cost confidence level is still unacceptably low, the contractor should report the Confidence Level to the customer at the time of the Integrated Baseline Review (IBR). If the customer agrees the Confidence Level is too low, resources could be added and the contractor would update the IMS, or the contract could be de-scoped to improve the Confidence Level. Alternatively, the customer may hold the cost margin as a contingency for overruns.
DEVELOPMENT OF MANAGEMENT RESERVESManagement Reserves are financial resources needed to address the reducible risks that were not mitigated. The optimal way to develop management reserve is to re-run the Monte Carlo Simulation tool with only these risks against the resource-loaded IMS. The difference between the deterministic cost estimate and the point on the cost distribution curve for the desired cost confidence level is the Management Reserve.
EXECUTING THE BASELINED PROGRAMTo inform Earned Value (BCWP), we need information about the performance of the program beyond just cost and schedule performance. We need information about how the program is progressing toward delivering the needed capabilities. How are these capabilities being fulfilled as the program progresses? What risks are bought down at the planned time to increase the probability of success? How are the Technical Performance Measures being assessed compared to the planned measures needed to deliver the needed capabilities?
CONNECTING THE DOTS TO EXECUTE THE IMSSome reminders from DOD guidance are needed before starting to connect the dots. Connecting cost, schedule, and technical performance is the basis of program success. Without these connections the Earned Value measures cannot be informed by the technical performance. Also, the Earned Value measures are simply a reflection of the passage of time and consumption of resources, with no connection to the planned technical maturity of the program’s system elements. Three measures of program performance are used to inform Earned Value. [8]
• Programmatic and Technical Performance Measures, Figure 7 • Risk retirement burn down, Figure 8• Schedule margin utilization, Figure 9
With the MOEs, MOPs, KPPs, Risks and their reduction plans, and the TPMs assigned to the IMP and IMS, we have all the pieces to connect the dots.

28 The Measurable News 2014.04 | mycpm.org
15
EXECUTING THE BASELINED PROGRAM To inform Earned Value (BCWP), we need information about the performance of the program beyond just cost and schedule performance. We need information about how the program is progressing toward delivering the needed capabilities. How are these capabilities being fulfilled as the program progresses? What risks are bought down at the planned time to increase the probability of success? How are the Technical Performance Measures being assessed compared to the planned measures needed to deliver the needed capabilities?
CONNECTING THE DOTS TO EXECUTE THE IMS Some reminders from DOD guidance are needed before starting to connect the dots. Connecting cost, schedule, and technical performance is the basis of program success. Without these connections the Earned Value measures cannot be informed by the technical performance. Also, the Earned Value measures are simply a reflection of the passage of time and consumption of resources, with no connection to the planned technical maturity of the program’s system elements. Three measures of program performance are used to inform Earned Value. [8]
Programmatic and Technical Performance Measures, Figure 7 Risk retirement burn down, Figure 8 Schedule margin utilization, Figure 9
With the MOEs, MOPs, KPPs, Risks and their reduction plans, and the TPMs assigned to the IMP and IMS, we have all the pieces to connect the dots.
Figure 6 – Starting with the IMP and the measures of progress to plan at the Program Event, Significant Accomplishment, and Accomplishment Criteria levels, the IMS is constructed and work performed in Work Packages can be assessed as Physical Percent Complete in units of measure meaningful to the decision makers.
Figure 6 – Starting with the IMP and the measures of progress to plan at the Program Event, Significant Accomplishment, and Accomplishment Criteria levels, the IMS is constructed
and work performed in Work Packages can be assessed as Physical Percent Complete in units of measure meaningful to the decision makers.
PROGRAMMATIC AND TECHNICAL MEASURES INFORM EARNED VALUE Our ultimate purpose for this paper was to lay the groundwork for developing a credible Performance Measurement Baseline, and to use that baseline to increase the probability of program success. The first question that comes up is – what is credible?
16
Programmatic And Technical Measures Inform Earned Value Our ultimate purpose for this paper was to lay the groundwork for developing a credible Performance Measurement Baseline, and to use that baseline to increase the probability of program success. The first question that comes up is – what is credible?
Figure 7 – Technical Performance Measures, Measures of Performance, Measures of Effectiveness, and Key Performance Parameters assure the delivered products are not only Fit for Purpose (Technically compliant) but also Fit for Use (Meet the needed Mission Capabilities).
Risk Retirement as a Measure of Program Performance BCWP can be informed with the performance of the planned retirement processes on the planned day for the planned cost, to the planned risk level. The work activities of risk reduction are no different than work activities needed to produce system elements. They are on baseline, produce outcomes and have technical assessment of their progress to plan.
Figure 8 – The planned risk reduction in the Center Of Gravity going out of bounds for a flight vehicle as a function of time in the Integrated Master Schedule. Baseline work is performed to reduce this risk and therefore reduce the impact of the risk. Making the reductions to the planned level on the planned day informs the BCWP of the Earned Value numbers. Reducing the risk late must reduce the BCWP for activities related to the risk.
Figure 7 – Technical Performance Measures, Measures of Performance, Measures of Effectiveness, and Key Performance Parameters assure the delivered products are not only Fit for Purpose (Technically
compliant) but also Fit for Use (Meet the needed Mission Capabilities).
RISK RETIREMENT AS A MEASURE OF PROGRAM PERFORMANCEBCWP can be informed with the performance of the planned retirement processes on the planned day for the planned cost, to the planned risk level. The work activities of risk reduction are no different than work activities needed to produce system elements. They are on baseline, produce outcomes and have technical assessment of their progress to plan.

29The Measurable News 2014.04 | mycpm.org
16
Programmatic And Technical Measures Inform Earned Value Our ultimate purpose for this paper was to lay the groundwork for developing a credible Performance Measurement Baseline, and to use that baseline to increase the probability of program success. The first question that comes up is – what is credible?
Figure 7 – Technical Performance Measures, Measures of Performance, Measures of Effectiveness, and Key Performance Parameters assure the delivered products are not only Fit for Purpose (Technically compliant) but also Fit for Use (Meet the needed Mission Capabilities).
Risk Retirement as a Measure of Program Performance BCWP can be informed with the performance of the planned retirement processes on the planned day for the planned cost, to the planned risk level. The work activities of risk reduction are no different than work activities needed to produce system elements. They are on baseline, produce outcomes and have technical assessment of their progress to plan.
Figure 8 – The planned risk reduction in the Center Of Gravity going out of bounds for a flight vehicle as a function of time in the Integrated Master Schedule. Baseline work is performed to reduce this risk and therefore reduce the impact of the risk. Making the reductions to the planned level on the planned day informs the BCWP of the Earned Value numbers. Reducing the risk late must reduce the BCWP for activities related to the risk.
Figure 8 – The planned risk reduction in the Center Of Gravity going out of bounds for a flight vehicle as a function of time in the Integrated Master Schedule. Baseline work is performed
to reduce this risk and therefore reduce the impact of the risk. Making the reductions to the planned level on the planned day informs the BCWP of the Earned Value numbers.
Reducing the risk late must reduce the BCWP for activities related to the risk.
SCHEDULE MARGIN BURN-DOWN IS A MEASURE OF PROGRAM PERFORMANCESchedule Margin is a duration buffer prior to a system element delivery date or any contract event. As a project progresses, the length of the schedule margin task is re-evaluated and adjusted as needed to protect the system elements from risks of delay that result from natural variances in work effort durations. The Schedule Margin Burn Down shown in Figure 9, displays the use of schedule margin over time. Schedule Margin compensates for work activity duration uncertainties. As a program progresses, the total schedule margin is re-evaluated and adjusted to protect the system elements from risks that arise from natural variances in duration.
When Schedule Margin is used faster than planned, this indicates cost and schedule progress is at risk, since uncertainty has not been controlled as planned. [21]
The identified schedule margin can then be used to inform program performance by comparing planned schedule margin with actual schedule margin.
17
Schedule Margin Burn-Down is a Measure of Program Performance Schedule Margin is a duration buffer prior to a system element delivery date or any contract event. As a project progresses, the length of the schedule margin task is re-evaluated and adjusted as needed to protect the system elements from risks of delay that result from natural variances in work effort durations. The Schedule Margin Burn Down shown in Figure 9, displays the use of schedule margin over time. Schedule Margin compensates for work activity duration uncertainties. As a program progresses, the total schedule margin is re-evaluated and adjusted to protect the system elements from risks that arise from natural variances in duration.
When Schedule Margin is used faster than planned, this indicates cost and schedule progress is at risk, since uncertainty has not been controlled as planned. [21]
The identified schedule margin can then be used to inform program performance by comparing planned schedule margin with actual schedule margin.
Figure 9 – Schedule Margin Burn-Down Plan depicts the planned schedule margin versus the actual schedule margin consumption that protects the date of a key system element. Status against this schedule margin plan is a leading indicator of the risk to the delivery date and the success of the program. [8]
Figure 9 – Schedule Margin Burn-Down Plan depicts the planned schedule margin versus the actual schedule margin consumption that protects the date of a key system element.
Status against this schedule margin plan is a leading indicator of the risk to the delivery date and the success of the program. [8]

30 The Measurable News 2014.04 | mycpm.org
NOW A PRACTICAL EXAMPLELet’s start with a practical example we can all recognize. Immediately after the Wright Brothers made their first powered flights in 1903, they begin to develop their experimental aircraft into a marketable product.
By 1905 they had the basis of a “practical flying machine.” Other experimenters learned of their work and begin to build on their success. By 1906, others pilots were making tentative hops in uncontrollable aircraft. By 1909, after watching the Wrights’ flying demonstrations, they grasped the brilliance and necessity of three-axis aerodynamic control. The performance of their aircraft quickly caught up to and then surpassed Wright Flyers. The capabilities of and the uses for aircraft expanded as designers and pilots introduced float planes, flying boats, passenger aircraft, observation platforms fitted with radios and wireless telegraphs, fighters, and bombers. [18]
As World War I approached, aircraft became an essential part of war and peace. In 1907, the US Army renewed its interest in the Wright Brothers. The Board of Ordnance and Fortification and the U.S. Signal Corps announced an advertisement for bids to construct an airplane. [16] However, the design and performance specifications were such that the Wrights were the only viable bidder. A price of $25,000 was set for the brothers’ airplane, if they could meet the performance criteria in actual flight trials.
These flight trials were scheduled for late summer 1908 at Fort Myer, Virginia, a military post outside Washington, D.C. With the commitments in Europe, the brothers had to separate for the first time. With Wilbur off to France, Orville did the flying for the Army.
From the source document for the U.S. Signal Corps Agreement and Specifications for a Heavier-Than-Air Flying Machine we have Measures of Effectiveness, Measures of Performance, Technical Performance Measures, and Key Performance Parameters.
Historical Document Program Performance Measure
The flying machine must be designed to carry two people having a combined weight of no more than 350 pounds, MOP
Also sufficient fuel for a flight of 125 miles MOP
The flying machine should be designed to have a speed of at least 40 miles per hour in still air for at least 125 miles MOP
The flying machine should be designed so that it may be quickly and easily assembled and taken apart and packed into an Army wagon. KPP
It should be capable of being assembled and put in operating condition within one hour KPP
Before acceptance, a trial endurance flight will be required of at least one hour during which time, MOP
The flying machine must remain continuously in the air without landing. MOE
It shall return to the starting point and land without any damage that would prevent it immediately starting upon another flight. MOE
During this flight of one hour, it must be steered in all directions without difficulty and at all times under perfect control and equilibrium. MOE
It should be sufficiently simple in its construction and operation to permit an intelligent man to become proficient in its use within a reasonable length of time. KPP
Table 3 – Obtained from historical documents in aviation archives, the Wright brothers needed to address the following Measures of Effectiveness, Measures of Performance, Technical Performance
Measures, and Key Performance Parameters in their program.
! ! ! 18!
NOW A PRACTICAL EXAMPLE Let’s start with a practical example we can all recognize. Immediately after the Wright Brothers made their first powered flights in 1903, they begin to develop their experimental aircraft into a marketable product.
By 1905 they had the basis of a "practical flying machine." Other experimenters learned of their work and begin to build on their success.
By 1906, others pilots were making tentative hops in uncontrollable aircraft. By 1909, after watching the Wrights' flying demonstrations, they grasped the brilliance and necessity of three-axis aerodynamic control. The performance of their aircraft quickly caught up to and then surpassed Wright Flyers. The capabilities of and the uses for aircraft expanded as designers and pilots introduced float planes, flying boats, passenger aircraft, observation platforms fitted with radios and wireless telegraphs, fighters, and bombers. [18]
As World War I approached, aircraft became an essential part of war and peace. In 1907, the US Army renewed its interest in the Wright Brothers. The Board of Ordnance and Fortification and the U.S. Signal Corps announced an advertisement for bids to construct an airplane. [16] However, the design and performance specifications were such that the Wrights were the only viable bidder. A price of $25,000 was set for the brothers’ airplane, if they could meet the performance criteria in actual flight trials.
These flight trials were scheduled for late summer 1908 at Fort Myer, Virginia, a military post outside Washington, D.C. With the commitments in Europe, the brothers had to separate for the first time. With Wilbur off to France, Orville did the flying for the Army.
From the source document for the U.S. Signal Corps Agreement and Specifications for a Heavier-Than-Air Flying Machine we have Measures of Effectiveness, Measures of Performance, Technical Performance Measures, and Key Performance Parameters.
!
Figure%10!–!the!Wright!Flyer!on!its!flight!trials!at!Fort!Myer,!
Virginia,!1908.!
Figure 6 – the Wright Flyer on its flight trials at Fort Myer, Virginia, 1908.

31The Measurable News 2014.04 | mycpm.org
The Wright Brothers identified key functions in Table 3 – obtained from historical documents in aviation archives, the Wright brothers needed to address Measures of Effectiveness, Measures of Performance, Technical Performance Measures, and Key Performance Parameters in their program to develop a heavier-than-air flying machine. They, and many before them, observed that birds have physical components that enable flight. They needed to develop their own physics components that would enable human flight. [17]
On the train ride from Kitty Hawk back to Dayton Ohio, the Wright brothers decided that, for their aircraft to be a success, their flying machine had to take off in a wide range of weather conditions, navigate to a predetermined location, and “land without wrecking.”
Figures 11 and 12 show initial estimated weight against reported EVM data. The actual weight reduction could have been used to drive or inform the cost and schedule status. As the planned weight burn down plan occurred, the actual weight reduction was measured. This Technical Performance Measure can be used to inform Earned Value to assess the program performance.
20
Figure 11 – The plan to reach an 800-pound aircraft. The actual weight for the first months shows they were above their upper threshold.
Figure 12 – The Earned Value reported by program controls, showing BCWP not informed by Technical progress.
Figure 11 – The plan to reach an 800-pound aircraft. The actual weight for the first months shows they were above their upper threshold.
20
Figure 11 – The plan to reach an 800-pound aircraft. The actual weight for the first months shows they were above their upper threshold.
Figure 12 – The Earned Value reported by program controls, showing BCWP not informed by Technical progress.
Figure 12 – The Earned Value reported by program controls, showing BCWP not informed by Technical progress.

32 The Measurable News 2014.04 | mycpm.org
CONCLUSION The roadmap to creating a Performance Measurement Baseline (PMB) driven by the system attributes provides meaningful information on program performance to the end user, and how to objectively measure cost and schedule progress based on technical performance. This process starts with a risk-tolerant PMB that adjusts major risks and protects the PMB performance shortfalls from the natural uncertainties that are typically inherent in development efforts.
Calculating and applying schedule margin to accommodate the natural uncertainties and calculation of Management Reserve to account for the unmitigated risks that remain in the risk register is the basis of a credible PMB. Next is the inclusion of Technical Performance Measures, Risk Burn Down, and Schedule Margin Burn Down data used to inform cost and schedule progress.
Creating a credible PMB and keeping the program green to deliver systems that meet the end user needs with a high probability of meeting cost and schedule targets is the goal of integrating the Technical Plan with the Programmatic Plan.
This is done by:• Having Contractors and Government establish plans and measure integrated technical
cost and schedule progress using the principles of Systems Engineering.• Using the MOE, MOP, KPP, and TPM’s originating from the SOW, SOO, ConOps, and other
acquisition documents, and assigning these to the IMP and IMS to inform the progress to plan for the program.
• Creating the risk adjusted Technical Plan that is aligned with the Cost and Schedule Plan (PMB).• Selecting appropriate Technical Performance Measures (TPM) that assess technical
progress to plan at the work performance level.• Establishing the appropriate schedule margin and Management Reserve from the risk
adjusted Technical Plan.• Ensuring cost and schedule performance is consistent with technical performance.
REFERENCES1. Integrated Master Plan and Integrated Master Schedule Preparation and Use Guide, Version 0.9,
October 21, 2005, OUSD(AT&L) Defense Systems, Systems Engineering, Enterprise Development (OUSD(AT&L) DS/SE/ED).
2. AFMC Pamphlet 63-5, Integrated Master Plan and Schedule Guide, 11 November 2004.3. Air Force Integrated Master Schedule (IMS) Assessment Process, Version 3.0, June 2012.4. Probabilistic Risk Assessment Procedures Guide for NASA Managers and Practitioners, NASA/SP-
2011-3421, 2nd Edition, December 2011.5. NASA Risk Informed Decision Making Handbook, NASA/SP-2010-576, April 2010.6. EAI-748-C, AMSC 9213, 3 October 2011.7. Investing Relationships and Sematic Sets amongst System Lifecycle Properties (ilities), MIT ESD,
June 19, 2012, http://seari.mit.edu/documents/presentations/CESUN12_deWeck_MIT.pdf 8. GAO Cost Estimating and Assessment Guide Best Practices for Developing and Managing Capital
Program Costs, GAO-09-3SP9. “Schedule Margin Management – The Missing Link,” Rick Price, PM Challenge, 9-10 February 2010.10. The Integrated Project Management Handbook, Dayton Aerospace, Inc. 8 February 2002, https://
acc.dau.mil/adl/en-US/19595/file/1047/integrated_project_management_handbook.pdf 11. Air Force Integrated Master Schedule Assessment Process, http://afacpo.com/AQDocs/AF_
IMS_%20Assessment_%20Process_%20V3.0.pdf12. NASA Schedule Management Handbook, NASA/SP-2010-3403, http://www.nasa.gov/
pdf/420297main_NASA-SP-2010-3403.pdf13. Defense Acquisition Program Support Methodology, Version 2.0, 9 January 2009.14. Air Force Nuclear Weapon Center Instruction 63-105, Project Planning, 12 April 2011, http://static.e-
publishing.af.mil/production/1/afnwc/publication/afnwci63-105/afnwci63-105.pdf15. Air Force Instruction 63-101/20-101, Integrated Life Cycle Management, 7 March 2013.16. The Wright Brothers and The Invention of the Aerial Age, Smithsonian National Air and Space
Museum, https://airandspace.si.edu/exhibitions/wright-brothers/online/index.cfm 17. “What is Systems Engineering? A Consensus of Senior Systems Engineers,” http://www.sie.arizona.
edu/sysengr/whatis/whatis.html 18. A History of the Airplane, Wright Brother Aeroplane Co, A Virtual Museum of Pioneer Aviation,
http://www.wright-brothers.org/History_Wing/History_of_the_Airplane/History_of_the_Airplane_Intro/History_of_the_Airplane_Intro.htm
19. Managing Project Uncertainty: From Variation to Chaos, Arnoud De Meyer, Christoph H. Loch, and Michael T. Pich, MIT Sloan Management Review, Winter 2002, pp. 60 – 67.
20. GAO Schedule Assessment Guide, GAO-12-120G, May 2012.21. Guide to Managing Programs with Predictive Measures, NDIA.22. Technical Performance Measurement, Earned Value, and Risk Management: An Integrated Diagnostic Tool for
Program Management, Commander N. D. Pisano, SC, USN, Program Executive Office for Air ASW, Assault, and Special Mission Programs (PEO(A)), Integrated TPM, Earned Value and Risk Management Tool.

33The Measurable News 2014.04 | mycpm.org
ABOUT THE AUTHORSGlen B. Alleman leads the Program Planning and Controls practice for Niwot Ridge, LLC. In this position, Glen brings his 25 years’ experience in program management, systems engineering, software development, and general management to bear on problems of performance based program management.
Mr. Alleman’s experience ranges from real time process control systems to product development management and Program Management in a variety of firms including Logicon, TRW, CH2M Hill, SM&A, and several consulting firms before joining Niwot Ridge, LLC. Mr. Alleman’s teaching experience includes university level courses in mathematics, physics, and computer science.
Tomas J. Coonce is an Adjunct Research Staff Member with the Institute for Defense Analyses (IDA) where he researches Essential Views of the Integrated Program Management Report data to provide government stakeholders with a) insightful program status and b) indicators of problem areas. Prior to joining IDA, Mr. Coonce led NASA’s Cost Analysis Division where he shaped cost and schedule estimating policies and sponsored cost research work. Mr. Coonce also served within the Office of the Secretary of Defense’s (OSD) Cost Analysis Improvement Group (CAIG) where he developed independent estimates of MDAP programs. While at the OSD CAIG, Mr. Coonce also led an effort to re-engineer the Contractor and Software Resources Data Reporting System and to make the data available to users. Prior to joining the OSD CAIG, Mr. Coonce served as a cost estimator for several consulting firms and the U.S. Government Accountability Office.
Rick A. Price has over 34 years of experience with Lockheed Martin in Aerospace and Defense across spacecraft, launch vehicle, missile, site activation, and test facility construction programs. Mr. Price has worked with DoD, NASA, commercial, and international customers. His areas of expertise include program planning & scheduling, program management, EVM, subcontract management, IMP/IMS development, and major proposal efforts (proposal development, review teams, and subcontract source selection evaluations). Currently Mr. Price is a Project Management and Planning Operations Principal with Lockheed Martin Space Systems Company. Mr. Price’s current focus involves mentoring, coaching, and teaching program management fundamentals and techniques across Space Systems programs. Mr. Price has written numerous articles featured in in-house Lockheed Martin corporate and company publications. Mr. Price speaks at PMI/CPM practice symposiums and the NASA PM Challenge.
Departmentof Defense Developer of the
EVM Central Repository
Independent Support
Departmentof Energy EVM System Certications
and Surveillance Support
25years
Department of DefenseEVM Analysis
The path to project successrequires innova ve EVM exper se
Acquisi onSupport
Repor ng &Compliance
Predic veAnaly cs
Prescrip veGuidance
EVM Expertise

As you may be aware, the College of Performance Management has been newly transformed as an independent entity, after a mutual and amicable separation from the Project Management Institute (PMI®).
Come join us and get involved in shaping the exciting future of the “new” CPM!!!Membership is $85/year. Register online at www.mycpm.org.
CPM is the premier organization for earned value management (EVM) and project planning and controls. As an international, non-profit organization, CPM is dedicated to project management and performance management.
CPM Objectives • Promote Earned Value Management and Project Planning and Control: Foster the recognition and use of earned
value management and other project planning and control techniques as integrating processes for project management• Disseminate Information: Provide opportunities for the exchange of ideas, information, solutions and applications• Improve Community: Encourage and enable the advancement of theory and application through research,
standards, and education• Grow Professionals: Provide our diverse membership of project management professionals with growth
opportunities through leadership, education, networking, and other benefits of a professional association• Enhance Membership and Benefits: Improve membership benefits and expand our membership base through
continued development of a professional association
Membership Benefits• Discount to CPM Conferences• Access to latest information on performance management• Networking with other professionals, industry leaders, and academia• Quarterly magazine, The Measurable News • Access to CPM electronic library• Monthly Webinars
Conference• Earn PDUs for Project Management Professionals• Update skills• Network• Participate in EVM Training and Certificate Program
Active members, serving on a committee, as a speaker, volunteer or as a member of the Governing Board, gives you the greatest reward of all – contributing your knowledge and experience to benefit others!
For more information, email [email protected] or call (703) 370-7885
The “New” College of Performance Management (CPM) – JOIN NOW!
Join CPM now at www.mycpm.orgPMI is a registered mark of the Project Management Institute, Inc.

Membership Type: New Member Renewal
Name: Date:
Company/Organization:
Select one: Government Employee Industry
Academic Consulting
Address Type: Work Home
Address:
City: State: Zip/Post Code: Country:
Phone (Daytime): Phone (Evening):
Email Address:
Dues: Annual Membership Dues - $85
Payment: Visa Mastercard Check Enclosed
American Express Discover
Card Number:
Exp. Date: Security Code: Billing Address Zip Code:
Signature:By becoming a member, you hereby agree to abide by the CPM Code of Ethics as shown on the CPM web site – http://www.mycpm.org/about-us/code-of-ethics
PLEASE RETURN THE COMPLETED APPLICATION WITH PAYMENT BY FAX OR MAIL:
College of Performance ManagementATTN: Don Kaiser
12100 Sunset Hills Road, Suite 130Reston, VA 20190
Fax: (703) 435-4390; outside US – Country Code +1-435-4390
For more information, contact [email protected] or call (703) 370-7885; outside US – Country Code +1-703-370-7885
CPM Membership Application
Fax today to (703) 435-4390

EVM World 2015THE PROJECT PERFORMANCE MANAGEMENT WORKSHOP
®
31st Annual International WorkshopMay 27-29, 2015 • Hyatt Regency New Orleans 601 Loyola Avenue, New Orleans, LA 70113504-561-1234 • neworleans.hyatt.com
• Update your skills with the latest Earned Value Management (EVM) trends, tools, and techniques
• Learn through training, practice symposia, as well as workshops
• Earn PDUs (for PMPs)
• Network with earned value professionals from around the world
For more information visit:
www.mycpm.org or www.evmworld.org
©2014 CPM. EVM World is a registered trademark of CPM. R.E.P. PMI, and the Registered Education Provider logo are registered marks of the Project Management Institute, Inc.
SAVETHE DATE

THE MEASURABLE NEWS
The Quarterly Magazine of the College of Performance Management | mycpm.org
2014.04
37
DATA ABOUT OUR COMMUNITYBy Elizabeth Phillips
WEBINAR NO. 15
We’ve continued conducting surveys during the CPM webinars. The survey results help presenters know about the audience to improve their presentations. The survey results also provide insight into the make-up, concerns and issues of our community. Needless to say, survey data is only one dimension in understanding the community and only captures webinar participants. But we believe you’ll find the information interesting.
A full description of the webinar topics and the presenters can be found on the CPM website at MyCPM.org. Recordings of the presentations and the slides are available to members and paid attendees at the CPM EVM Library at EVMLibrary.org.
AGILE EARNED VALUE: RIGOR MEETS FLEXIBILITYWebinar Information Webinar Topic: Agile Earned Value: Rigor Meets FlexibilityPresenter: Luis ContrerasDate: 25 June 2014, 12:00 p.m. EasternNumber of Attendees (includes presenters and hosts): 15
IS EVM MANDATED ON YOUR PROJECTS?
0
1
2
3
4
5 44.4%
11.1%
44.4%
Yes No On Some,But Not All
IF YOU USE AGILE METHODS, ON WHAT TYPE OF PROJECTS DO YOU USE IT (SELECT ALL THAT APPLY)?
0
1
2
3
4
5
6
7
5
1 1 1
Software Hardware Infrastructure
33
OtherOn projectswith EVM
I Don’t UseAgile
Poll Questions
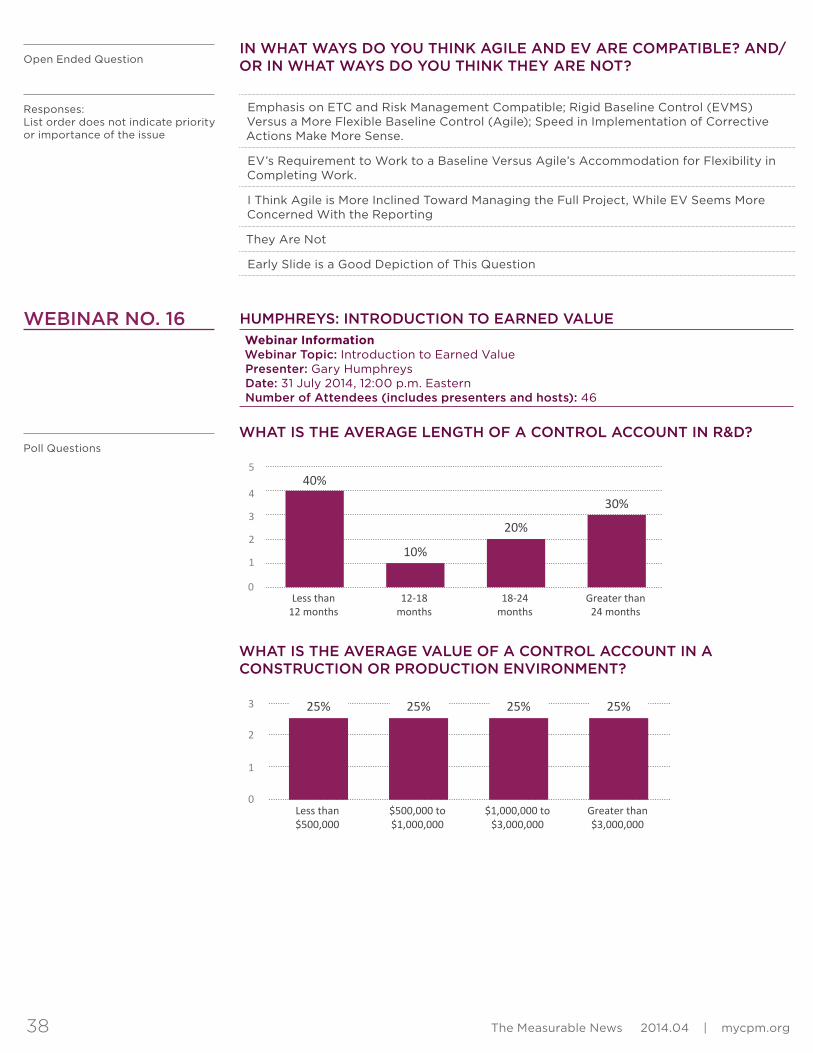
38 The Measurable News 2014.04 | mycpm.org
WEBINAR NO. 16
Open Ended Question
Responses:List order does not indicate priority or importance of the issue
Poll Questions
IN WHAT WAYS DO YOU THINK AGILE AND EV ARE COMPATIBLE? AND/OR IN WHAT WAYS DO YOU THINK THEY ARE NOT?
Emphasis on ETC and Risk Management Compatible; Rigid Baseline Control (EVMS) Versus a More Flexible Baseline Control (Agile); Speed in Implementation of Corrective Actions Make More Sense.
EV’s Requirement to Work to a Baseline Versus Agile’s Accommodation for Flexibility in Completing Work.
I Think Agile is More Inclined Toward Managing the Full Project, While EV Seems More Concerned With the Reporting
They Are Not
Early Slide is a Good Depiction of This Question
HUMPHREYS: INTRODUCTION TO EARNED VALUEWebinar Information Webinar Topic: Introduction to Earned ValuePresenter: Gary HumphreysDate: 31 July 2014, 12:00 p.m. EasternNumber of Attendees (includes presenters and hosts): 46
WHAT IS THE AVERAGE LENGTH OF A CONTROL ACCOUNT IN R&D?
0
1
2
3
4
540%
Less than12 months
10%
12-18months
20%
18-24months
30%
Greater than24 months
WHAT IS THE AVERAGE VALUE OF A CONTROL ACCOUNT IN A CONSTRUCTION OR PRODUCTION ENVIRONMENT?
2
3
1
0
25%
Less than$500,000
25%
$500,000 to$1,000,000
25%
$1,000,000 to$3,000,000
25%
Greater than$3,000,000

39The Measurable News 2014.04 | mycpm.org
WEBINAR NO. 17
Open Ended Question
Responses:List order does not indicate priority or importance of the issue
WHAT IS THE BIGGEST COST DRIVER FOR IMPLEMENTING EVMS ON YOUR PROGRAM?
Scope Creep
Implementing Accurate Data Collection/Recording
Training
Availability of Skilled Labor to Implement
Integration of Scheduling and Financial Systems to Enable Valid Reporting
Do Not Know
Tying Into Legacy Systems
Identifying Requirements
We Get the Presentation
The Appropriate Financial Systems and Changing Accounting Practices
Control Account Levels
I Have No Experience in This Matter. Sorry
EVMS Software
Change Organizational Culture
Insufficient Manpower
Meeting Government's Interpretation Versus the Interpretation of the Guidelines
Gov Audits
ESTABLISHING A PROGRAM DECISION FRAMEWORKWebinar Information Webinar Topic: Establishing a Program Decision FrameworkPresenter: Russ MartinelliDate: 28 August 2014, 12:00 p.m. EasternNumber of Attendees (includes presenters and hosts): 14
DO YOU OR YOUR ORGANIZATION USE A LIFECYCLE MODEL IN THE MANAGEMENT OF PROGRAM?
0
1
2
3
4
5
6
44.4%
Yes
55.5%
No

IS IT CHALLENGING TO GET SENIOR SPONSOR APPROVAL/GO-FORWARD DIRECTION IN LIFECYCLE GATE MEETINGS?
0
1
2
3
4
5
6
7
871.4%
Yes
28.5%
No
WHAT ARE THE BIGGEST CHALLENGES IN USING A LIFECYCLE MODEL ON YOUR PROGRAMS?
Not Drifting Too Far Off.
Getting The Attention and Understanding of Senior Stakeholders, As Well As Their Engagement.
Lots.
Open Ended Question
Responses:List order does not indicate priority or importance of the issue

THE MEASURABLE NEWS
The Quarterly Magazine of the College of Performance Management | mycpm.org
2014.04
41
The pilot CPMTV held its second very informative and educational meeting on September 8, 2014 in Huntsville. OPDEC hosted the meeting with over 58 attendees, including 11 CPM members, and with representation from industry, government and education. Based on a show of hands, this was the first meeting for the majority of attendees. We had EVM personnel, schedulers, as well as program management representatives, and instructors. Bob Wasser, BCF Solutions, served as the organizer and emcee.
Gary Troop, CPM President, provided a brief history of the organization and then focused on the future of CPM, the benefits of membership, and having a strong local presence. He referred attendees to the CPM website, www.mycpm.org, where a wealth of information resides to include membership information, upcoming workshops and events, and current and prior issues addressed in CPM’s The Measurable News. He noted that, although the publications were currently available to all via the website, in the near future they would be moved behind the firewall for members only. He also discussed improvements and changes underway to the CPM professional development program, and the key note speakers, training and key topics included in the upcoming Integrated Program Management Workshop, November 3-5, 2014, in Bethesda, MD.
Our host, Jason Curns of OPDEC, Inc., provided an overview of their Integrated Program Manager (IPM), a Web-based tool that integrates resources between a project’s schedule system and a project’s cost system. IPM provides project management teams with easy access to and understanding of their current EVM reports and status without the additional infrastructure and personnel sometimes required with EVM systems. OPDEC is a small business that is focused on support of government organizations and industry via products and services associated with the development and fielding of specialized program management related software applications, tools, and consulting services. Additional information can be found at www.opdec.com. Tim Loftis, Deputy Director of EVM at the Missile Defense Agency, provided an overview of the MDA’s mission, major programs, and EVM implementation. He acknowledged the challenges associated with maintaining the performance measurement baseline when requirements were constantly changing to meet evolving threats. MDA has nine major programs, with over 19 major contracts containing EVM system and reporting requirements.
Gary Humphreys, CEO of Humphreys & Associates, Inc., gave a presentation on “Your Estimate at Completion (EAC) – Can you trust it?” It was both thought provoking and entertaining. He defined the typical Independent EACs as “independent of sanity, logic, and judgment” and provided best practices and approaches for developing EACs, as well as testing the reasonableness of an EAC.
Mark Phillips, CPM Vice President of Communications, was the last speaker. His presentation on “Improving Project Communication” was engaging and practical. His use of communication theory to improve project planning and execution can serve as an enabler for successful project management teams. This approach is described in his book, “Reinventing Communication - How to Design, Lead and Manage High Performing Projects”, Gower 2014.
At the beginning and conclusion of the meeting, Bob encouraged attendees to sign up as an officer or identify a duty they would be willing to perform for the CPMTV Pilot Chapter. He also asked for sponsors to host and provide a venue for the next meeting in December 2014. The following five people have volunteered for officer positions: Bob Wasser- President; Julie Curns- VP Meetings and Events; Reuben Russell- Certifications; Norman Dean- VP Admin; and John Pruett- VP Finance. There is one opening for Chapter Vice President.
Four organizations have offered to host our next four quarterly meetings.December 20141st week – DAUMarch 2015 1st week - TruePlan
June 2015 1st week - DeltekSeptember 2015 1st week - Encore
We look forward to our meetings becoming a regular event in the Huntsville area. Please feel free to contact me concerning any questions, volunteering for an office, presenting or hosting at one of our meetings, or any other issues.
BOB [email protected] [email protected]: 256-656-7600
COLLEGE OF PERFORMANCE MANAGEMENT TENNESSEE VALLEY(CPMTV) PILOT CHAPTER

42 The Measurable News 2014.04 | mycpm.org
website: www.CBTWorkshop.com phone: 888•644•5613
Let The CBT Workshop Assist You!
Staff Augmentation
Tools Implementation and Training
Skilled EVMS Planners, Schedulers, Program Control Analysts, Estimators, and EVMS Consultants
Short or Long Term Assignments Contract-to-hire personnel
We have EVMS tools experts who can implement, train, integrate, and migrate EVMS data in the following tools:
Microsoft Project and Project Server Deltek MPM, wInsight, Cobra, Open Plan Primavera
Everyone is Looking for Skilled EVMS Resources…We Have Them
EVMS Services
Web Based EVMS Training
EVMS Gap Analysis System Description Design and Development Desktop Operating Procedures IBR Preparation and Dispositioning CAM Training and Mock Interviews
EVMS Fundamentals and EVMS Advanced training, testing, and certification.
Call UsToday!
Proposal Support
EVMS StaffAugmentation
EVMS ComplianceReview Preparation
Integrated BaselineReview (IBR)Preparation
EVMSImplementation
EVMS Design andDocumentation
EVMS Requirementsor Gap Analysis
EVMS andProject Management
Training
Humphreys & AssociatesEVMS
Consulting Services
Humphreys & Associates offers a complete range of EVMS consulting services. From proposal preparation and management system gap analysis to mock compliance reviews or contractor self-surveillance and third party validations, H&A is the authority in EVMS.
As the industry recognized leader in EVMS training, H&A offers regularly scheduled Earned Value Management System, Project Scheduling, and Advanced Earned Value Management Techniques public workshops.
H&A now offers a Control Account Manager (CAM) Certification Program – ideal for anyone looking to improve their EVM expertise and distinguish themselves with a professional certification.
Interested in learning more? Visit our web site at www.humphreys-assoc.com or call us today at (714) 685-1730

THE MEASURABLE NEWS
The Quarterly Magazine of the College of Performance Management | mycpm.org
2014.04
43
VENDORS & SERVICES
P.O. Box 20996Sarasota, FL 34276
Phone: (888) 644-5613
www.CBTWorkshop.com
see our ad on p. 42
Planning every step — Every step as planned™
EVPrep™ Exam Study Guide EVPrep™ Exam Prep Workshops
www.mgmt-technologies.com*Earned Value Professional
Get it now!
Got your ?*
www.lexemstrategy.com
www.humphreys-assoc.comsee our ad on p. 42 see our ad on p. 4
www.smawins.com
Your ad could go here.
Contact us today: www.mycpm.org
EVMLibrary.org: The CPM Online Library
A comprehensive, online library of resources about Earned Value Management (EVM) and related project management topics.
The CPM library now contains well over 2,100 documents, such as articles and presentations, and is growing everyday.
Each document has been catalogued by subject area, author, publication date, keywords, etc.
How You Can Contribute? Do you have topical articles, speeches, or presentations?
Contact Don Kaiser at [email protected] to have your contributions included in this online resource.
www.safranna.com
see our ad on p. 6
S N A Software

THE MEASURABLE NEWS
2013.04The Quarterly Magazine of the College of Performance Management
mycpm.org