mean meridional circulation and large-scale eddies
TRANSCRIPT
Mean meridional circulation and large-scale eddies
By Y. P. RAO, Regional Meteorological Centre, Calcutta
(Manuscript received January 17, 1966)
ABSTRACT
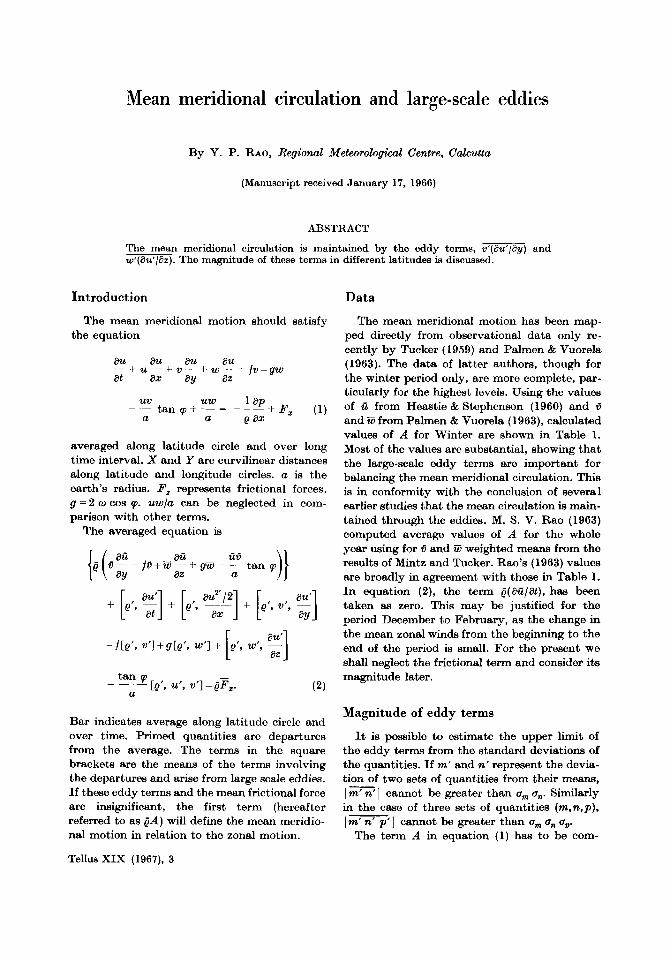
The mean meridional circulation is maintained by the eddy terms, v“lay) and w’(au’/az). The magnitude of these terms in different latitudes is discussed.
Introduction
The mean meridional motion should satisfy the equation
au au au au - - + u - - + v - + w - - i v + g w at ax ay az
averaged along latitude circle and over long time interval. X and Y are curvilinear distances along latitude and longitude circles. a is the earth’s radius. Fr represents frictional forces. g = 2 w COB cp. uwla can be neglected in com- parison with other t e r n .
The averaged equation is
- h’, v’l+ d e ’ , w’l + e’, w’ - [ tan cp -
[@’, u’, v’] = pp,. -~ a
Bar indicates average along latitude circle and over time. Primed quantities are departures from the average. The terms in the square brackets are the means of the terms involving the departures and arise from large scale eddies. If these eddy terms and the mean frictional force are insignificant, the first term (hereafter referred to as @ A ) will define the mean meridio- nal motion in relation to the zonal motion.
Tellus XIX (1967), 3
Data
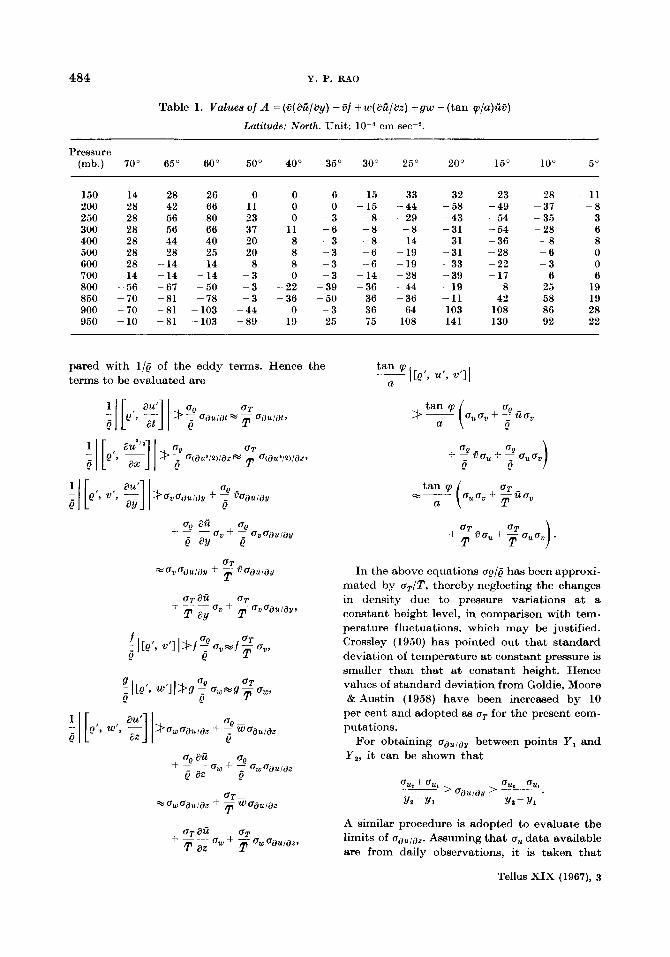
The mean meridional motion has been map- ped directly from observational data only re- cently by Tucker (1959) and Palmen & Vuorela (1963). The data of latter authors, though for the winter period only, are more complete, par- ticularly for the highest levels. Using the values of Q from Heastie & Stephenson (1960) and 8 and G from Palmen & Vuorela (1963), calculated values of A for Winter are shown in Table 1. Most of the values are Substantial, showing that the large-scale eddy terms are important for balancing the mean meridional circulation. This is in conformity with the conclusion of several earlier studies that the mean circulation is main- tained through the eddies. M. s. V. Rao (1963) computed average values of A for the whole year using for 25 and Z weighted means from the results of Mintz and Tucker. Rao’s (1963) values are broadly in agreement with those in Table 1. In equation (2), the term Q(aQ/at), has been taken as zero. This may be justified for the period December to February, as the change in the mean zonal winds from the beginning to the end of the period is small. For the present we shall neglect the frictional term and consider its magnitude later.
Magnitude of eddy terms
It is possible to estimate the upper limit of the eddy terms from the standard deviations of the quantities. I f m’ and n’ represent the devia- tion of two sets of quantities from their means, I m‘ n‘ I cannot be greater than a,,, a,,. Similarly in the case of three sets of quantities (m,n ,p) , Im’n‘ p’l cannot be greater than a,,, a,, a,.
The term A in equation (1) has to be com-
-
484 Y. P. RAO
Table 1. Vulues of A =(e(aii/ay) -e/ +a(aa/az) +gw -(tan &z)ae) Latitude: North. Unit: cm sec-,.
Pressure (mb.) 70" 65" 60" 50' 40' 35" 30" 25" 20" 15" 10" 5"
150 200 250 300 400 500 600 700 800 850 900 950
14 28 26 0 0 6 -15 -33 -32 -23 -28 -11 28 42 66 11 0 0 -15 -44 -58 -49 -37 -8 28 56 80 23 0 - 3 -8 -29 -43 -54 -35 3 28 56 66 37 11 -6 -8 -8 -31 -54 -28 6 28 44 40 20 8 - 3 -8 -14 -31 -36 -8 8 28 28 25 20 8 - 3 -6 -19 -31 -28 -6 0 28 -14 14 8 8 - 3 -6 -19 -33 -22 - 3 0 14 -14 -14 - 3 0 - 3 -14 -28 -39 -17 6 6
-56 -67 -50 - 3 - 2 2 -39 -36 -44 -19 8 25 19 -70 -81 -78 - 3 -36 -50 36 -36 -11 42 58 19 -70 -81 -103 -44 0 - 3 36 64 103 108 86 28 -10 -81 -103 -89 19 25 75 108 141 130 92 22
pared with l/@ of the eddy terms. Hence the tan p a - ~ I re', u', V'I I terms to be evaluated are
In the above equations up/@ has been approxi- mated by aT/T, thereby neglecting the changes in density due to pressure variations at a constant height level, in comparison with tem- perature fluctuations, which may be justified. Crossley (1950) has pointed out that standard deviation of temperature a t constant pressure is smaller than that at constant height. Hence values of standard deviation from Goldie, Moore &Austin (1958) have been increased by 10
per cent and adopted as uT for the present com- putations.
For obtaining aauiay between points Y , and Y,, it can be shown that
A similar procedure is adopted to evaluate the limits of aau/az. Assuming that a, data available are from daily observations, it is taken that
Tellus XIX (1967), 3
MEAN MERIDIONAL CIRCULATION 485
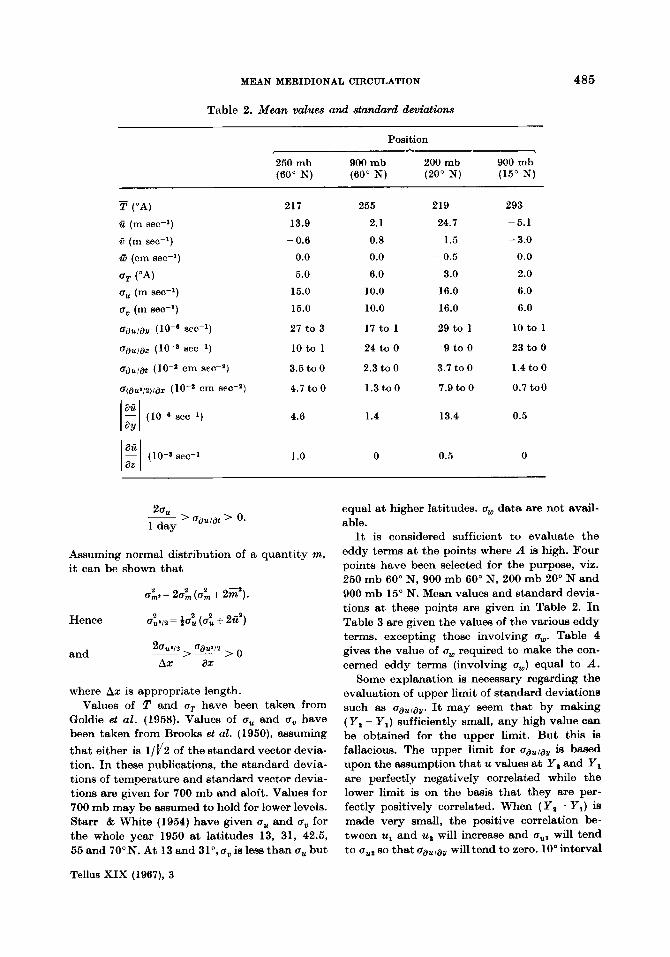
Table 2. Mean values and standard d e t n d k m
Position
250 mb 900 mb 200 m b 900 m b (SO0 N) (60' N) (ZOO N) (15' N)
T ("A)
4 (m sec-l) 6 (m sec-l)
tZ (om sec-l)
("A) u, (m sec-l) u, (m sec-l)
217 255 219 293
13.9 2.1 24.7 - 5.1
- 0.6 0.8 1.5 - 3.0 0.0 0.0 - 0.5 0.0
5.0 6.0 3.0 2.0
15.0 10.0 16.0 6.0
15.0 10.0 16.0 6.0
uau/ag (lo-" sec-l) 27 to 3 17 to 1 29 to 1 10 to 1
Uau/a2 ( sec-l) 10 to 1 24 to 0 9 to 0 23 to 0
uau/at ( lo-' cm sec-') 3.5 to 0 2.3 to 0 3.7 t o 0 1.4 to 0
~(a,*/z)/aZ (lo-* om s e r a ) 4.7 to 0 1.3 to 0 7.9 to 0 0.7 to0
4.6
1 .o
1.4
0
13.4
0.5
0.5
0
Assuming normal distribution of a quantity m, it can be shown that
a;, = 20; (a; + 2;').
Hence u2,*,2 = tu2, ((72, + 26')
20,112 > -2 ~ > O and
A X ax
where Ax is appropriate length. Values of ?' and a, have been taken from
Goldie et al. (1958). Values of u, and u, have been taken from Brooks et al. (1950), assuming that either is 1/12 of the standard vector devia- tion. I n these publications, the standard devia- tions of temperature and standard vector devia- tions are given for 700 mb and aloft. Values for 700 mb may be assumed to hold for lower levels. Starr & White (1954) have given u, and u, for the whole year 1950 at latitudes 13, 31, 42.5, 55 and 70"N. At 13 and 3 lo ,uv is leas than u, but
Tellus XIX (1967), 3
equal a t higher latitudes. ow data are not avail- able.
It is considered sufficient to evaluate the eddy terms a t the points where A is high. Four points have been selected for the purpose, viz. 250 mb 60" N, 900 mb 60" N, 200 mb 20" N and 900 mb 15" N. Mean values and standard devia- tions a t these points are given in Table 2. In Table 3 are given the values of the various eddy terms, excepting those involving a,. Table 4 gives the value of a, required to make the con- cerned eddy terms (involving a,) equal to A.
Some explanation is necessary regarding the evaluation of upper limit of standard deviations such as Uau/ay. It may seem that by making ( Y , - Y, ) sufficiently small, any high value can be obtained for the upper limit. But this k fallacious. The upper limit for uau/av k b-d upon the assumption that u values at Y , and Y l are perfectly negatively correlated while the lower limit is on the basis that they are per- fectly positively correlated. When ( Y r - Y, ) k made very small, the positive correlation be- tween u1 and u2 will increase and (I,,, will tend to uUl so that ua,,a, will tend to zero. 10" interval

486 Y . P. RAO
Table 3. Magnitudes of components of eddy terms All values less than 0.1 are shown as zero. Unit: cm sec-2.
Position
250 mb 900 mb 200 mb 900 mb Eddy term (60' N ) (60" N) (20' N) (15" N)
8 to 0
1 1 t o o
405 to 45
0.4 to 0
1.6
9 to 1
44
0
61
1.3
0.0
1.4
78
5.4 to 0
3.1 to 0
170 to 10
0.3 to 0
0.3
4 to 0.2
30
0
27
5.7
0.1
0.6
103
5.1 to 0
10.9 to 0
464 to 16
0.6 to 0
2.9
6 to 0.2
11
0.6 to 0
15
0.3
0.0
0.2
56
l.Oto 0
0.5 to 0
60 to 6
0.2 to 0
0.0
0.4to 0
2
0
2
0.0
0.0
0.0
109
for A Y , 10" interval for Ax, height interval cor- responding to 100 mb for AZ, and time interval of one day for At have been used in the compu- tations in Table 2.
It is clear from Tables 3 and 4 that only two eddy terms may possibly be of the magnitude of A. They are u, Uau/ay of (1/@) (e',v', au'/ay] and a, uau/az of (1/p) [e', w', au'/az]. The maximum pissible magnitude of uv uau/ay exceeds A at
60" N at both the levela and at 20" N at 200 mb. At 15" N and 900 mb it is about 55 per cent of A. The standard deviations of w required to make a, oau/az equal to A , assuming the maxi- mum value of Uau/az, is very small and seems probable. In the next section the magnitudes of v'(au'/ay) and w'(au'/az), of which u, uau,au and uw Uau/az are respectively the possible upper limits, are further examined from actual data.
Tellus XIX (1967), 3
MEAN MERIDIONAL CIRCULATION 487
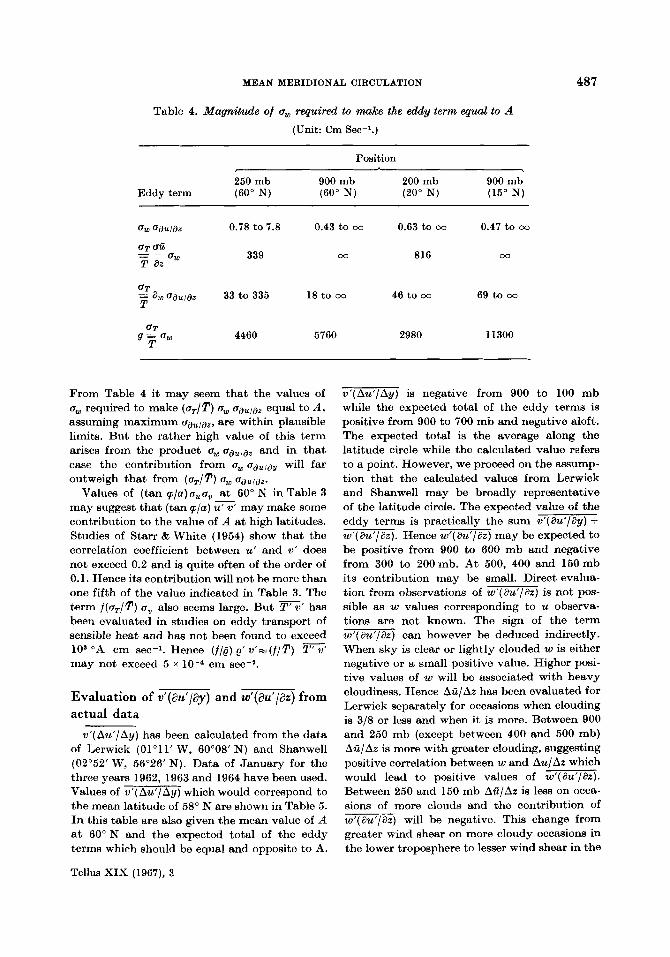
Table 4. Magnitude of a, required to make the eddy term equal to A (Unit: Cm Sec-l.)
Position
250 mb 900 mb 200 mb 900 mb Eddy term (60’ N) (60” N) (20“ N) (15” N)
h
ow Uduiaz 0.78 t o 7.8 0.43 to 03 0.63 to 00 0.47 to 00
339 816
UT = a w dau/az 33 t o 335 18 t o 00 46 to co 69 to 00 T
4460 5760 2980 11300 UT
9 - - w T
From Table 4 it may seem that the values of uw required to make (uT/T) ow u,jdu,,jr equal to A , assuming maximum uau/az, are within plausible limits. But the rather high value of this term arises from the product a, uau/ae and in that case the contribution from uw Uau,c3v will far outweigh that from (uT/T) a, uadu/at,
Values of (tan q / a ) uu u, fi 60” N in Table 3 may suggest that (tan q/a) u’ v‘ may make some contribution to the value of A a t high latitudes. Studies of Starr & White (1954) show that the correlation coefficient between u’ and v’ does not exceed 0.2 and is quite often of the order of 0.1. Hence its contribution will not be more than one fifth of the value indicated in Table 3. The term f(uT/p) u, also seems large. But T” has been evaluated in studies on eddy transport of sensible heat and has not been found to exceed 10* ‘A cm sec-1. Hence (f/@) p’ v’i.:(f/!l‘) may not exceed 5 x cm sec-*.
Evaluation of w’(au’/ay) and w’(au’/az) from actual data
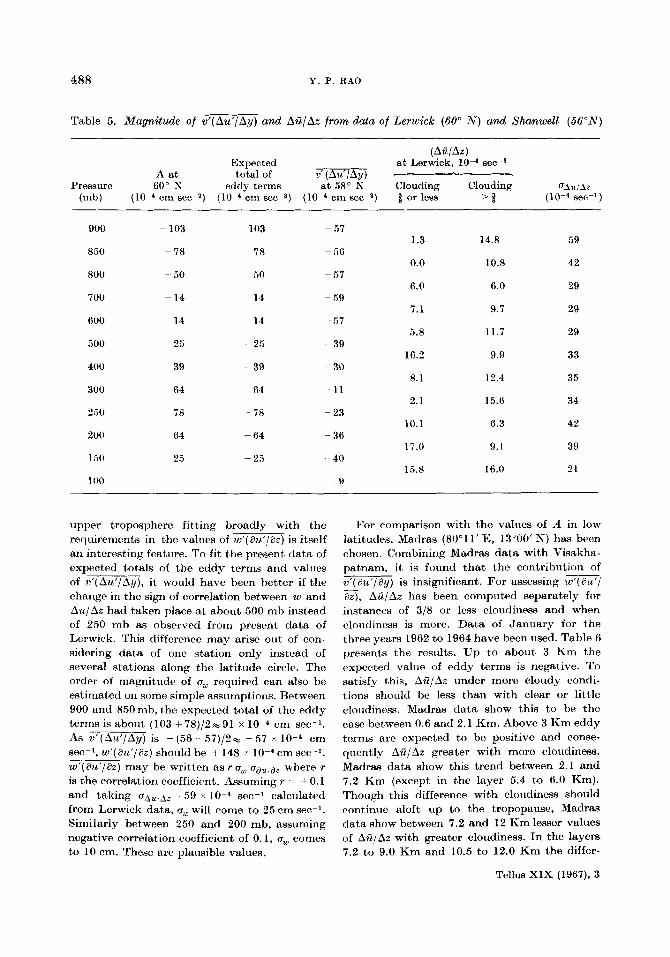
v’(Au’/Ay) has been calculated from the data of Lerwick (Ol”11’ W, 60”08’ N) and Shanwell (02”52’ W, 56”26’ N). Data of January for the three years 1962, 1963 and 1964 have been used. Values of w‘(Au’/Ay) which would correspond to the mean latitude of 58” N are shown in Table 5. I n this table are also given the mean value of A at 6 0 ” N and the expected total of the eddy terms which should be equal and opposite to A.
Tellus XIX (1967), 3
v‘(Au‘/Ay) is negative from 900 to 100 mb while the expected total of the eddy terms is positive from 900 to 700 mb and negative aloft. The expected total is the average along the latitude circle while the calculated value refers to a point. However, we proceed on the assump- tion that the calculated values from Lerwick and Shanwell may be broadly representative of the latitude circle. The expected value of the eddy terms is practically the sum v’(au’/ay) + wyau’laz). Hence w’(au’/az) may be expected to be positive from 900 to 600 mb and negative from 300 to 200mb. At 500, 400 and 150mb its contribution may be small. Direct evalua- tion from observations of wyau’jaz) is not pos- sible as w values corresponding to u observe- tions are not known. The sign of the term w‘( 8u’/az) can however be deduced indirectly. When sky is clear or lightly clouded w is either negative or a small positive value. Higher posi- tive values of w will be associated with heavy cloudiness. Hence AQ/Az has been evaluated for Lerwick separately for occasions when clouding is 318 or less and when it is more. Between 900 and 250 mb (except between 400 and 500 mb) AQ/Az is more with greater clouding, suggesting positive correlation between wand AulAz which would lead to positive values of w’(au’/az). Between 250 and 150 mb Afi/Az is less on occa- sions of more clouds and the contribution of w’(au‘/az) will be negative. This change from greater wind shear on more cloudy occasions in the lower troposphere to lesser wind shear in the
--
488 Y. P. RAO
Table 5 . Magnitude of w'(Au'/Ay) and Aii/Az from data of Lerwick (60" N ) and Shnwell (5G"N)
(AC/Az) Expected at Lerwick, 10-4 sec-l
A at total of ~; (AU' /AY) - Pressure 60" N eddy terms at 58' N Clouding Clouding aAUlA2
(nib) ( cm secc2) ( cm ( cm sec-*) # or less > # (10 -4 see-l)
900
850
800
700
600
500
400
300
250
200
150
100
- 103
- 78
- 50
- 14
14
25
39
64
78
64
2 3
103
78
50
14
~ 14
- 25
- 39
~ 64
- 78
- 64
~ 25
- 57
- 56
- 57
- 59
- 57
- 39
- 30
- . 11
- 23
- 36
-~ 40
- 9
1.3
0.0
6.0
7.1
5 .8
16.2
8.1
2.1
10.1
17.0
15.8
14.8
10.8
6.0
9.7
11.7
9.9
12.4
15.6
6.3
9.1
16.0
59
42
29
29
29
33
35
34
42
39
21
upper troposphere fitting broadly with the requirements in the values of w'( au ' /az ) is itself an interesting feature. To fit the present data of expected totals of the eddy terms and values of v'(Au'/Ay), it would have been better if the change in the sign of correlation between w and Auld2 had taken place at about 500 mb instead of 250 mb as observed from present data of Lerwick. This difference may arise out of con- sidering data of one station only instead of several stations along the latitude circle. The order of magnitude of a, required can also be estimated on some simple assumptions. Between 900 and 850mb, the expected total of the eddy terms is about (103 + 78)/2%91 x cm 9ec-I. As z ( m is - ( 5 6 57)/2% - 57 x lo-' cm sec-l, w'(au'/az) should be + 148 x cm sec-l. w'(au'/az) may be written as r om ad,, d2 where r is the correlation coefficient. Assuming r = + 0.1 and taking aAu,Ar? ~ 59 x sec-1 calculated from Lerwick data, a, will come to 2 5 cm sec-I. Similarly between 250 and 200 mb, assuming negative correlation coefficient of 0.1, u, comes to 10 cm. These are plausible values.
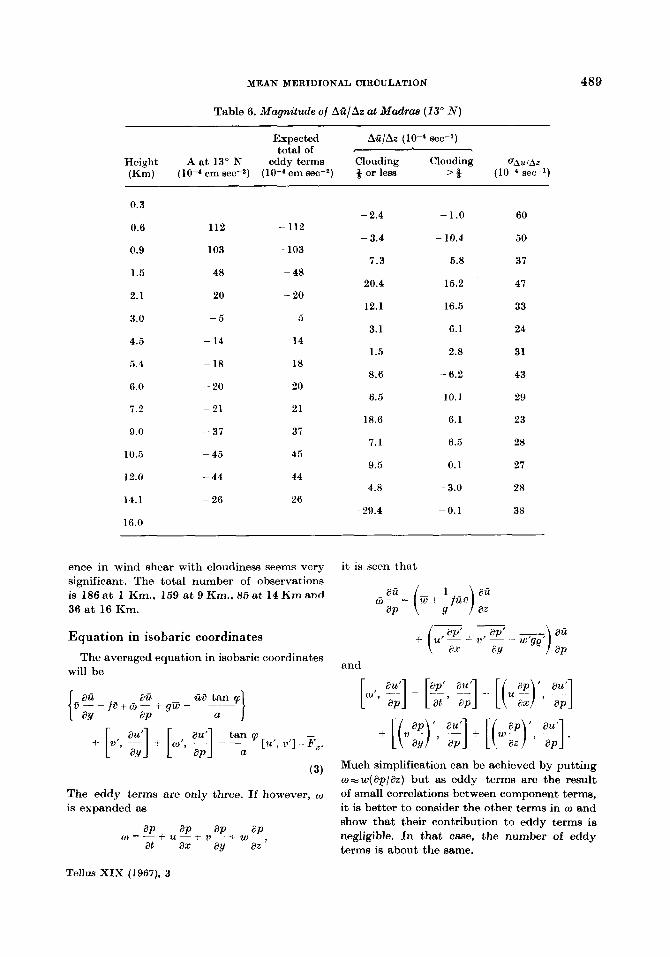
For comparison with the values of A in low latitudes, Madras (8O"ll' E, 13"00' N) has been chosen. Combining Madras data with Visakha- patnam, i t is found that the contribution of v'( - au' /ay) is insignificant. For assessing w'( au'/ az), Ati/Az has been computed separately for instances of 3/8 or less cloudiness and when cloudiness is more. Data of January for the three years 1962 to 1964 have been used. Table 6 presents the results. Up to about 3 Km the expected value of eddy terms is negative. To satisfy this, Aii/Az under more cloudy condi- tions should be less than with clear or little cloiidiness. Madras data show this to be the case between 0.6 and 2.1 Km. Above 3 Km eddy terms are expected to be positive and conse- quently Aa/Az greater with more cloudiness. Madras data show this trend between 2.1 and 7.2 Km (except in the layer 5.4 to 6.0 Km). Though this difference with cloudiness should continue aloft up to the tropopause, Madras data show between 7.2 and 12 Km lesser values of Aii/Az with greater cloudiness. I n the layers 7.2 to 9.0 Km and 10.5 to 12.0 Km the differ-
Tellus XIX (1967), 3
MEAN MERIDIONAL CIRCULATION 489
Table 6. Magnitude of AtilAz at Madras (13" N )
Expected Afi/Az (10-4 sec-l) total of ?
Height A at 13" N eddy terms Clouding Clouding ~AUIAZ (Km) ( cm sere) ( cm sec-l) # or less > # (10-4 sec-l)
0.3
0.6
0.9
1.5
2.1
3.0
4.5
5.4
6.0
7.2
9.0
10.5
12.0
14.1
16.0
112
103
48
20
- 5
- 14
- 18
- 20
- 21
- 37
- 45
- 44
- 26
- 112
- 103
- 48
- 20
5
14
18
20
21
37
45
44
26
- 2.4
- 3.4
7.3
20.4
12.1
3.1
1.5
8.6
6.5
18.6
7.1
9.5
~ 4.8
- 29.4
-1.0
- 10.4
5.8
15.2
16.5
6.1
2.8
- 6.2
10.1
6.1
6.5
0.1
- 3.0
-0.1
60
50
37
47
33
24
31
43
29
23
28
27
28
38
ence in wind shear with cloudiness seems very significant. The total number of observations is 186 a t 1 Km., 159 at 9 Km., 85 at 14 Km and 36 a t 16 Km.
Equation in isobaric coordinates
will be The averaged equation in isobaric coordinates
t i0 tan p
a
(3 )
The eddy terms are only three. I f however, Q
is expanded as
it is seen that
-- + ( u f ~ ' + v,- - Luge
ax ap' ay -i ap aii and
Much simplification can be achieved by putting w=w(ap/az) but as eddy terms are the result of small correlations between component terms, it is better to consider the other terms in w and show that their contribution to eddy terms is negligible. In that case, the number of eddy terms is about the same.
Tellus XIX (1967), 3
490 Y. P. RAO
Equation (3) can also be written as
a a - (60) f ~ (iiiiQ) - f0 + gw aY aP
+ -~ a - (u’v‘) + -- a (u’w’) = - F,.
aY aP Hence
a - a - - (u’w’) + ~~ (u ’w’ ) aY aP
- u’v’ has been computed by many workers studying the angular momentum balance of the atmosphere and u w has been estimated as a residual required to maintain balance. I n the present study attempt has been made to evaluate ‘u’(au’/ay) and w’(au’/az). These provide infor- mation on the correlation between vertical velocity and vertical shear and also between meridional wind component and vertical vortic- ity due to zonal winds which are characteristics of synoptic disturbances.
Frictional term
F, may be written as K ( a 2 i i / W ) . The magni- tude of k in the free atmosphere is not known. If Gl, ii, and ii3 are the mean winds at two succes- sive height intervals of Az,
Taking A z = 1 Km, K=104 eme sec-* and ii3 +a, - 222, = 20 Kt, K ( a2ii/az2) = 10-3 cm sec-2. The mean wind profiles do not show this degree of curvature even near the jet stream. With the observed mean wind profiles, the maximum magnitude of K ( a%/az*) is found to be 20 x lo-‘ cm sec-, with K = 106 cm* sec-l which is near the sub-tropical jet stream. It appears reasonable to conclude that the frictional term may not appreciably alter the contribution of v’( au’/ay) and w’(au’/az) to A in the free atmosphere.
(4)
Conclusions
From the above study the following conclu- sions may be drawn regarding the eddy terms principally contributing to the mean meridional circulation in winter:
(i) w’( au’/ay) and w’( au ’ /az) are of the same order magnitude to the north of 50”N. I n low lati- tudes (below 20”) v ’ ( a d / a y ) is insignificant and only w’( au’az) matters. (ii) At 60” N w’(au’/ay) seems negative npto 100 mb. I n most of the troposphere w’(au’/az) is positive and negative aloft. It is the contribu- tion of w’(au’/az) that makes the total of the eddy terms positive as required in the lower troposphere. (iii) I n low latitudes w’(au’/az) is negative in the lower troposphere and positive aloft. This is opposite to that at 60” N. Vertical wind shear as a characteristic of tropical disturbances, seems worth more investigation. (iv) Between 30” and 40” latitudes, total of the eddy terms should be small. This may be due to the change in the sign of w’( au ’ /az ) from very high latitudes to low latitudes. w’( au’/ay) may be small between 30” and 40” as in low latitudes.
REFERESCES
Brooks, C. E. P., Durst, C. S., Carruthers, N., Dewar, Palmen, E. & Vuorela, L. A. 1963. On the mean meridional circulations in the Northern Herni- sphere during the winter season. Quarterly Journal
Rao, M. S. V. 1963. Mean meridional air-motion and associated transport processes in the atmosphere. I n d i u n Journal of Met. and Geophysics 14, 117-
Starr, V. P. & White, R. M. 1954. Balance require- ments of the general cirrulation. Geophysics Res. papers, No. 35. Cambridge, U.S.A.
Tucker, G. B. 1959. Mean meridional circulations in the atmosphere. Quarterly Journal of Royal Met .
D. & Sawyer, J . S. 1950. Upper winds over the world. Geophysical Memoirs, London, Vol. 10, No. 85. Royal Met . Soc. 89, 131-138.
CROSSLEY, A. F. 19.50. Relation between the standard deviations of temperature at constant pressure and at constant height. Quarterly Journal Royal Met. SOC. 76 , 337-340. 142.
Goldie, N., Moore, J. G. & Austin, E. E. 1958. Upper air temperature over the world. Geophysical M e - moirs, London, 13, No. 101.
Heastie, M. & Stephenson, P. M. 1960. Upper winds over the world. Geophysical Memoirs, London, 13, No. 103. SOC. 8;, 209-224.
Tellus XIX (1967), 3
M E A N MERIDIONAL. CIRCULATION 491
CPE~HFIHMEPI4~ElOHAJIbHAFI~IIPICYJIFI~HFIBKPY~HOMACIIITABHAFI TYPBYJIEHTHOCTb
Tellus XIX (1967), 3
32 - 672899