mcps graduates earning college degrees in stem-related …...schools (mcps) 2001 through 2006...
TRANSCRIPT
MCPS Graduates Earning College Degrees in
STEM-Related Fields
Office of Shared Accountability
September 2012
Natalie Wolanin & Julie Wade

OFFICE OF SHARED ACCOUNTABILITY
Adrian B. Talley, Associate Superintendent
850 Hungerford Drive
Rockville, Maryland 20850
301-279-3553
Dr. Joshua P. Starr Dr. Kimberly A. Statham
Superintendent of Schools Deputy Superintendent of
Teaching, Learning, and Programs

Montgomery County Public Schools Office of Shared Accountability
Program Evaluation Unit i MCPS Graduates Earning STEM Degrees
Table of Contents
Executive Summary ........................................................................................................................ v
Summary of Findings .................................................................................................................. v
Recommendations ..................................................................................................................... vii
Background ..................................................................................................................................... 1
Literature Review............................................................................................................................ 1
Research Questions ......................................................................................................................... 3
Methodology ................................................................................................................................... 3
Data Sources ............................................................................................................................... 3
Sample......................................................................................................................................... 4
Data Analysis Procedures ........................................................................................................... 5
Limitations ...................................................................................................................................... 5
Findings........................................................................................................................................... 6
Research Question 1: What proportion of MCPS college graduates earned a bachelor’s degree
or higher in a STEM-related field, and what was the breakdown of STEM categories? ........... 6
Research Question 2: What proportion of MCPS college graduates earned a bachelor’s degree
in a STEM-related field among racial/ethnic and gender subgroups? ...................................... 11
Research Question 3: What were the high school SAT and AP scores, GPA, and science and
mathematics courses taken among MCPS graduates earning STEM degrees? ........................ 13
Research Question 4: What were the colleges most frequently attended by MCPS graduates
earning STEM degrees? ............................................................................................................ 24
Research Question 5: Does enrollment in a science-related high school program relate to
STEM degree completion? ....................................................................................................... 26
Summary ....................................................................................................................................... 27
STEM Degrees Among MCPS Graduates ................................................................................ 27
STEM Higher Degrees Among MCPS Graduates .................................................................... 27
Breakdown Among Gender and Race/Ethnicity ....................................................................... 27
SAT Scores and GPA................................................................................................................ 28
Science Courses and Science AP Exams .................................................................................. 28
Mathematics Courses and Mathematics AP Exams .................................................................. 28
Colleges Attended by Graduates ............................................................................................... 28
MCPS School-level STEM Degrees ......................................................................................... 29

Montgomery County Public Schools Office of Shared Accountability
Program Evaluation Unit ii MCPS Graduates Earning STEM Degrees
Conclusion and Recommendations ............................................................................................... 29
Acknowledgements ....................................................................................................................... 29
References ..................................................................................................................................... 30
Appendix ....................................................................................................................................... 32

Montgomery County Public Schools Office of Shared Accountability
Program Evaluation Unit iii MCPS Graduates Earning STEM Degrees
List of Figures
Figure 1. Numbers of students at stages of education toward a STEM degree (NCES, 2009;
National Science Board, 2010). .......................................................................................... 2
List of Tables
Table 1 MCPS 2001–2006 Graduates Who Received a Bachelor’s Degree by Spring 2011 ........ 6
Table 2 MCPS 2001–2006 Graduates with Bachelor’s Degree by Type of Degree ..................... 7
Table 3 National Data: Percentage of Bachelor’s Degrees in U.S. awarded in STEM Fields ....... 7
Table 4 MCPS 2001–2006 Graduates with Bachelor’s Degree by More Specific Type of
Degree ................................................................................................................................. 8
Table 5 MCPS 2001–2006 Graduates with Bachelor’s Degree by STEM Type of Degree ......... 8
Table 6 MCPS 2001–2005 Graduates Who Received a Higher Degree in Addition to a
Bachelor’s Degree by Spring 2011 ..................................................................................... 9
Table 7 MCPS 2001–2005 Graduates with a Higher Degree by Type of Higher Degree ............ 9
Table 8 MCPS 2001–2005 Graduates With a STEM Higher Degree by Type of Degree ......... 10
Table 9 MCPS 2001–2005 Graduates with a STEM Higher Degree by Type of Bachelor’s
Degree ............................................................................................................................... 10
Table 10 MCPS 2001–2006 Gender Subgroups by Type of STEM Bachelor’s Degree ............. 11
Table 11 National Data: STEM Bachelor’s Degrees Awarded to U.S. Male and Female
Graduates in 2005 and 2006 ............................................................................................. 11
Table 12 MCPS 2001–2006 Degree Type Among Racial/Ethnic Subgroups ............................. 12
Table 13 National Data: Degree Type Among Racial/Ethnic Subgroups ................................... 12
Table 14 MCPS 2001–2006 Graduates’ SAT Scores by Degree Type ....................................... 13
Table 15 MCPS 2002–2006 Graduates’ GPA by Degree Type .................................................. 14
Table 16 MCPS 2001–2006 Graduates’ High School Science Courses by Degree Type .......... 15
Table 17 MCPS 2001–2006 Graduates’ High School Honor Science Courses by Degree
Type .................................................................................................................................. 16
Table 18 MCPS 2001–2006 Graduates’ High School AP Science Courses by Degree Type .... 17
Table 19 MCPS 2001–2006 Graduates’ AP Biology and Chemistry Scores by Degree Type ... 18
Table 20 MCPS 2001–2006 Graduates’ AP Physics C Mechanical and Environmental
Science Scores by Degree Type ........................................................................................ 19
Table 21 MCPS 2001–2006 Graduates’ Highest High School Mathematics Course by
Degree Type ...................................................................................................................... 20

Montgomery County Public Schools Office of Shared Accountability
Program Evaluation Unit iv MCPS Graduates Earning STEM Degrees
Table 22 MCPS 2001–2006 Graduates’ High School Honor Mathematics Courses by
Degree Type ...................................................................................................................... 21
Table 23 MCPS 2001–2006 Graduates’ High School AP Mathematics Courses by Degree
Type .................................................................................................................................. 22
Table 24 MCPS 2001–2006 Graduates’ AP Calculus Scores by Degree Type .......................... 23
Table 25 MCPS 2001–2006 Graduates’ AP Statistics Scores by Degree Type ......................... 24
Table 26 MCPS 2001–2004 Graduates’ Top Colleges for Receiving Bachelor’s Degrees by
Degree Type ...................................................................................................................... 26
Table A-1 Coding Scheme of Bachelor’s Degrees into STEM and non-STEM Categories ....... 32
Table A-2 Montgomery County Public Schools 2001–2006 Graduates With STEM
Bachelor’s Degree Among Those Receiving Bachelor’s by High School ....................... 33

Montgomery County Public Schools Office of Shared Accountability
Program Evaluation Unit v MCPS Graduates Earning STEM Degrees
Executive Summary
The Office of Shared Accountability (OSA) conducted a study of Montgomery County Public
Schools (MCPS) 2001 through 2006 graduates earning college degrees in Science, Technology,
Engineering, and Mathematics (STEM). The study is the second in a series of college tracking
reports from OSA.1 The study examined the proportions of students in these six cohorts earning
various types of STEM degrees, as well as their high school achievement and course taking
patterns.
Five research questions guided this study:
1. What proportion of MCPS college graduates earned a bachelor’s degree or higher in a
STEM-related field, and what was the breakdown of STEM categories?
2. What proportion of MCPS college graduates earned a bachelor’s degree in a STEM-
related field among racial/ethnic and gender subgroups?
3. What were the high school SAT and AP scores, GPA, and science and mathematics
courses taken among MCPS graduates earning STEM degrees?
4. What were the colleges most frequently attended by MCPS graduates earning STEM
degrees?
5. Does enrollment in a science-related high school program relate to STEM degree
completion?
The Office of Shared Accountability examined the bachelor’s degrees earned by MCPS
graduates, including graduating cohorts from 2001 through 2006, using data available from the
National Student Clearinghouse (NSC) as of May 2011—including college of enrollment, degree
received, and major area of study. MCPS high school records were used for students’
mathematics and science course history, GPA, SAT scores, and AP scores, as well as student
demographic characteristics. STEM and non-STEM categories of degree majors were coded
based on the National Science Foundation’s (NSF) classification of degrees.
To view the MCPS data within a broader context, the percentage of bachelor’s degrees earned in
STEM fields nationally were computed from the last two years of NSF data available (2005 and
2006) to best correspond with MCPS cohorts of students who graduated from high school in
2001 and 2002.
Summary of Findings
Research Question 1: What proportion of MCPS college graduates earned a bachelor’s degree
or higher in a STEM-related field, and what was the breakdown of STEM categories?
The data reported by the NSC in May 2011 indicated that a range of 37% to 52% of MCPS
2001–2006 graduates received a bachelor’s degree, with 52% from the 2001 cohort. Across all
cohorts of MCPS graduates earning a bachelor’s degree, 19% earned a degree in a STEM field of
1 See College Enrollment, Persistence, and Degree Attainment for High School Graduates in Montgomery County Public
Schools, Maryland [Zhao, Liu, & Wolanin, 2012] for the first.
Montgomery County Public Schools Office of Shared Accountability
Program Evaluation Unit vi MCPS Graduates Earning STEM Degrees
study. Nationally, the percentage of STEM bachelor’s degrees for years 2005 and 2006 was
16%. Of those MCPS graduates who earned STEM-related bachelor’s degrees, over half were in
the field of science, followed by engineering, technology, and mathematics degrees.
Data show that of the 2001–2005 MCPS graduates holding bachelor’s degrees, between 4% and
23% of each cohort also earned a higher degree prior to May 2011. Of the higher degrees earned
so far among MCPS 2001–2005 graduates, the majority have earned non-STEM related higher
degrees. Of the MCPS 2001 cohort who earned a bachelor’s degree and have had the most time
of all the cohorts to earn a higher degree, 14% went on to earn a higher degree in a STEM-
related field. Of the graduates across cohorts who earned a STEM-related higher degree, the
most frequently acquired degree was engineering and science.
Research Question 2: What proportion of MCPS college graduates earned a bachelor’s degree
in a STEM-related field among racial/ethnic and gender subgroups?
A higher proportion of MCPS male college graduates than female graduates received STEM-
related bachelor’s degrees over non-STEM (25% compared with 15%). Nationally, the
percentage of STEM bachelor’s degrees for years 2005 and 2006 was 24% among males and
11% among females. Compared with other racial/ethnic subgroups, a higher proportion of Asian
American graduates, earned a STEM-related field of study. Over one third of Asian American
graduates earned a STEM degree, which is much higher than the percentage of STEM degrees
earned among White (16%), African American (15%), and of Hispanic (12%) graduates.
Nationally, the percentage of STEM bachelor degrees for years 2005 and 2006 was 29% among
Asian American, 16% among White, 14% among Hispanic, and 12% among African American
graduates.
Research Question 3: What were the high school SAT and AP scores, GPA, and science and
mathematics courses taken among MCPS graduates earning STEM degrees?
The majority of graduates with STEM degrees took four or more science classes in high school,
AP calculus or higher, and one or more AP science and mathematics classes in high school.
They also scored higher on science and mathematics AP tests and SATs, and had a higher high
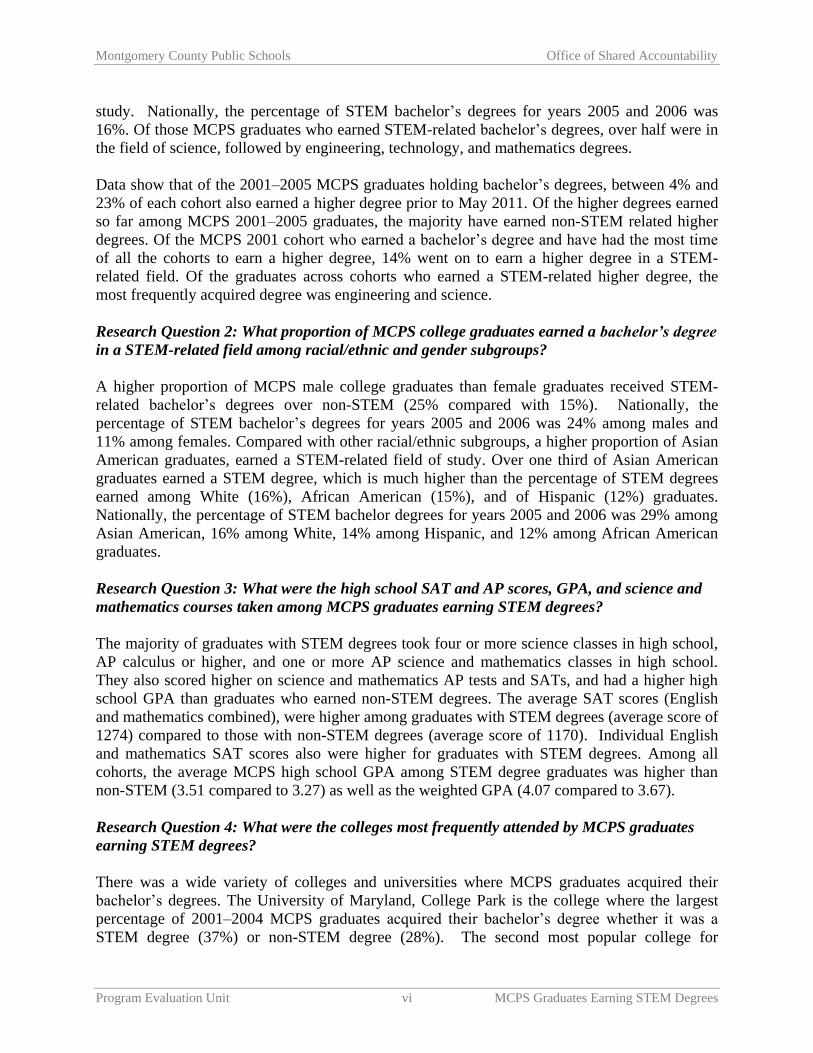
school GPA than graduates who earned non-STEM degrees. The average SAT scores (English
and mathematics combined), were higher among graduates with STEM degrees (average score of
1274) compared to those with non-STEM degrees (average score of 1170). Individual English
and mathematics SAT scores also were higher for graduates with STEM degrees. Among all
cohorts, the average MCPS high school GPA among STEM degree graduates was higher than
non-STEM (3.51 compared to 3.27) as well as the weighted GPA (4.07 compared to 3.67).
Research Question 4: What were the colleges most frequently attended by MCPS graduates
earning STEM degrees?
There was a wide variety of colleges and universities where MCPS graduates acquired their
bachelor’s degrees. The University of Maryland, College Park is the college where the largest
percentage of 2001–2004 MCPS graduates acquired their bachelor’s degree whether it was a
STEM degree (37%) or non-STEM degree (28%). The second most popular college for

Montgomery County Public Schools Office of Shared Accountability
Program Evaluation Unit vii MCPS Graduates Earning STEM Degrees
acquiring bachelor’s degrees was University of Maryland, Baltimore County among STEM
degree graduates (10%) and Towson University among non-STEM degree graduates (6%).
Research Question 5: Does enrollment in a science-related high school program relate to
STEM degree completion?
The high school with the highest percentage of STEM degrees across all the cohorts was
Montgomery Blair High School (Blair). Over one fourth of graduates from Blair who received a
college bachelor’s degree earned a STEM degree across all cohorts; however, as explained in the
limitations section, accurate student-level data indicating enrollment in MCPS special school
level science, technology, engineering, and mathematics programs are not available for all
students across the cohorts. Therefore, the percentage of students who were enrolled in special
academic high school programs and went on to earn STEM bachelor’s degrees cannot be
determined.
Recommendations
Findings of the current study suggest the following recommendations:
1. Explore ways to engage more students in STEM subjects, especially technology,
engineering, and mathematics to increase participation in STEM-related fields after high
school.
2. Explore ways to engage more female students in STEM subjects in order to close the
gender gap between female and male graduates who earn a STEM bachelor’s degree.
3. Explore ways to engage all student racial/ethnic subgroups in STEM subjects to close the
gap between these groups.
4. Develop a centralized student specific tracking system of individual participation in
specific school-level academies and programs in order to track students with STEM
bachelor’s degrees and their participation in STEM-related high school programs.

Montgomery County Public Schools Office of Shared Accountability
Program Evaluation Unit viii MCPS Graduates Earning STEM Degrees
This page is intentionally left blank.

Montgomery County Public Schools Office of Shared Accountability
Program Evaluation Unit 1 MCPS Graduates Earning STEM Degrees
MCPS Graduates Earning College Degrees in STEM-Related Fields
Natalie Wolanin and Julie Wade
The Office of Shared Accountability (OSA) conducted a study of Montgomery County Public
Schools (MCPS) 2001 through 2006 graduates earning college degrees in Science, Technology,
Engineering, and Mathematics (STEM). The study is the second in a series of college tracking
reports from OSA.2 Data available from the National Student Clearinghouse (NSC) as of May
2011 were used. The study examined the proportions of students in these six cohorts earning
various types of STEM degrees, as well as their high school achievement and course taking
patterns.
Background
Education in STEM is a growing concern among educators, policymakers, and the science
community. In MCPS, STEM education is a key ingredient in a students’ school experience;
MCPS promotes the vision that ―all students achieve full science, technology, engineering, and
mathematics (STEM) literacy through seamlessly integrated instruction that is project/problem
and standards-based. STEM literate students are critical thinkers who are able to solve
nonroutine problems in a globally competitive society‖ (MCPS, 2012). STEM education in
MCPS includes a comprehensive kindergarten through Grade 12 curriculum, as well as a range
of special programs for students in middle and high school. In addition, with support from
Howard Hughes Medical Institute (HHMI), MCPS has implemented several professional
development initiatives for teachers in STEM (see Wolanin & Wade, 2012).
Beyond their MCPS experience in STEM, the question remains, how many students go on to
pursue a STEM degree in college? To address that question, this study tracked six cohorts of
MCPS graduates to determine what proportion of them attained a bachelor’s degree in a STEM-
related field. In addition to a description of STEM degree completion among MCPS graduates,
additional analytic questions were addressed, such as an examination of high school course-
taking patterns (e.g., type and number of science, mathematics, and technology courses) and
academic measures (e.g., Grade Point Average [GPA] and Advanced Placement [AP] scores) in
relation to STEM degree completion. As the interest in engaging students in the STEM fields
grows, this initial examination of STEM degree completion by MCPS students may provide a
baseline measure for possible future investigations of STEM degree attainment.
Literature Review
The number of bachelor’s degrees awarded to U.S. citizens grew during the years 2003 through
2007, but the share of degrees in STEM fields actually shrank during those years (National
Science Board, 2010, appendix table 2-13; Business-Higher Education Forum, 2010).
According to the U.S. Department of Education’s report, The Condition of Education, 2012,
(Aud et al., 2012) more than half of the 1.7 million bachelor’s degrees awarded in 2009–2010
2 See College Enrollment, Persistence, and Degree Attainment for High School Graduates in Montgomery County Public
Schools, Maryland [Zhao, Liu, & Wolanin, 2012] for the first.

Montgomery County Public Schools Office of Shared Accountability
Program Evaluation Unit 2 MCPS Graduates Earning STEM Degrees
were in five fields: business (including management, marketing, personal and culinary services)
(22%); social sciences and history (10%); health professions and related programs (8%);
education (6%); and psychology (6%). In the same year, the percentage of bachelor’s degrees
awarded in engineering and biological sciences, two STEM-related fields of study, was 5% in
each.
A report from the Georgetown University Center on Education and the Workforce (Carnevale,
Smith, & Melton, 2012) projects 2.4 million job vacancies for STEM occupations between 2008
and 2018, with a substantial portion of the projected vacancies (65%) requiring bachelor’s and
graduate degrees. The President’s Council of Advisors on Science and Technology (2012)
asserts that to retain preeminence in science and technology, the United States will need to
increase the number of students who receive undergraduate STEM degrees by about 34%
annually over current rates.
In the United States, the ―pipeline‖ to a STEM degree narrows quickly; students fall out of the
STEM pipeline at all levels of schooling. Less than 25% of high school graduates heading to
college enter into STEM majors, and 38% of those who start with a STEM major do not graduate
with one (Carnevale, Smith, & Melton, 2012; Boundaoul, 2011). Figure 1 illustrates the
diminishing number of students at each stage on the way to a STEM degree. Nationally, in 2001,
about 2.7 million students graduated from high school; in the same year, almost 1.7 million
students enrolled in two- or four-year colleges (National Center for Education Statistics, 2009).
However, by 2007 only about 233,000 students earned a STEM bachelor’s degree, about 15.6%
of all bachelor’s degrees awarded (National Science Board, 2010).
Figure 1. Numbers of students at stages of education toward a STEM degree (Chen, 2009; National
Science Board, 2010).
The pipeline to a STEM degree is even narrower for some groups of students. Educators and the
scientific community express concerns over the lower proportion of women and minority
students earning degrees in STEM fields. Historically, these groups have been underrepresented
in many of the STEM fields, particularly engineering and mathematics. Efforts to engage more
female and minority students in the STEM fields are numerous, but gaps remain overall, and
differences in career choices and employment patterns are still evident (Beebe, Julian, Langdon,
McKittrick, & Doms, 2011; National Science Foundation, 2011).
2.7 million HS graduates in2001
1.7 million students entercollege in 2001
233,000 students earnedSTEM Bachelor's degree by2007

Montgomery County Public Schools Office of Shared Accountability
Program Evaluation Unit 3 MCPS Graduates Earning STEM Degrees
Research Questions
The following research questions guided the study:
1. What proportion of MCPS college graduates earned a bachelor’s degree or higher in a
STEM-related field, and what was the breakdown of STEM categories?
2. What proportion of MCPS college graduates earned a degree in a STEM-related field
among racial/ethnic and gender subgroups?
3. What were the high school SAT and AP scores, GPA, and science and mathematics
courses taken among MCPS graduates earning STEM degrees?
4. What were the colleges most frequently attended by MCPS graduates earning STEM
degrees?
5. Does enrollment in a science-related high school program relate to STEM degree
completion?
Methodology
The Office of Shared Accountability examined the bachelor’s degrees earned by MCPS
graduates, including graduating cohorts from 2001 through 2006, using data available from the
NSC.
Data Sources
College Data from NSC. College degree data used for this report were obtained from the
NSC, a nonprofit organization that collects and verifies students’ postsecondary enrollment and
degree attainment on a national level. NSC student data are updated multiple times each year;
StudentTracker Data are available for over 92% of American collegiate enrollment (NSC, 2012).
Over 3,300 participating colleges and universities nationwide provide data to the NSC. School
districts, universities, and agencies can obtain information about students’ postsecondary
educational outcomes from the NSC. Students who declined to release their information were not
included in the NSC data in order to comply with the Family Educational Rights and Privacy Act
(FERPA).
NSC data used for this study included college of enrollment, degree received, and major area of
study through May 2011. Results are based on unduplicated counts of students across all
colleges and universities; if a student was enrolled in multiple institutions during their
postsecondary education only the institution that granted the degree was considered. If a student
received multiple degree levels (e.g., bachelor’s and master’s), both were counted in this study.
Information from National Science Foundation. STEM and non-STEM categories of
degree majors were coded based on the National Science Foundation’s (NSF) classification of
degrees for its 2010 Science and Engineering Degrees, by Race/Ethnicity: 1997–2006 report
(NSF, 2010), which was derived from the Integrated Postsecondary Education Data System
(IPEDS) Completions survey, conducted by the National Center for Education Statistics (NCES),
U.S. Department of Education. Additionally, data published by the NSF’s report (NSF, 2010),
were used to derive national findings.

Montgomery County Public Schools Office of Shared Accountability
Program Evaluation Unit 4 MCPS Graduates Earning STEM Degrees
For this report, a STEM degree refers to a degree in one of the following broad fields: science,
technology, engineering, or mathematics, since many education initiatives address shortages in
those areas specifically (Chen, 2009). A non-STEM degree refers to all other degrees such as
business, English, psychology, education, social sciences, health, arts, etc.; however, some
reports include psychology and social science in a broad science category (e.g., NSF, 2010; see
NCES 2009 for discussion of STEM fields definition). A more comprehensive list of degrees
can be found in Appendix Table A-1.
To view the MCPS data within a broader context, the percentage of bachelor’s degrees earned in
STEM fields nationally were computed from the last two years of NSF data available (2005 and
2006) to best correspond with MCPS cohorts of students who graduated from high school in
2001 and 2002.
Data from MCPS. MCPS high school records were used for students’ mathematics and
science course history, GPA, and SAT and AP test scores, as well as student demographic
characteristics.
Sample
MCPS graduates. Results are based on students who graduated from MCPS from 2001
to 2006 and received at least a bachelor’s degree prior to May 2011, regardless of how long after
graduation and regardless of when they enrolled in college. Since the current report focuses on
completing a bachelor’s degree or higher, the class of 2006 is the last class that would allow four
years to earn a bachelor’s degree after high school graduation and for the colleges to report the
information to NSC by May 2011. The MCPS cohorts used for analyses in this report are as
follows:
Degree attainment is reported for MCPS graduating classes 2001 to 2006; however,
the graduating classes of 2005 and 2006 may still need to be viewed with caution as
the data may not be complete since those students haven’t had a commonly used six-
year window of time to complete their degrees.
Percentage of degrees in STEM findings are reported for all cohorts from 2001 to
2006 because there is a large enough sample in these cohorts to look at the
proportional representation of groups of students.
Higher degree attainment (overall and in STEM) findings are reported for all
cohorts from 2001 to 2005 to extend the window for a higher degree completion.
Because of the varying length of time it takes to earn a higher degree, as well as the
common practice of gaining work experience before pursuing a graduate degree, we
cannot assume that any of the higher degree data from the MCPS graduating classes
in our sample are complete; therefore, the information in this part of the report may
be underestimated. It also should be noted that there are some five-year programs
where students can earn a bachelor’s and master’s degree within five years.
Colleges where the highest number of students completed STEM and non-STEM
degrees are reported for 2001 to 2004 to ensure the most complete data, since there is
variability by college in the time taken to report to NSC.

Montgomery County Public Schools Office of Shared Accountability
Program Evaluation Unit 5 MCPS Graduates Earning STEM Degrees
Data Analysis Procedures
Descriptive statistics were used to present the findings in this report. The number and percentage
of MCPS graduates receiving a bachelor’s degree, and type of bachelor’s degree received (field
of study, STEM and non-STEM) were presented. Among bachelor’s degree recipients, the
number and percentage of graduates receiving STEM and non-STEM degrees were presented for
all students, and for racial subgroups and male and female students. To provide a broader
context, the number and percentage of STEM degrees were reported for MCPS and a national
sample. SAT scores, GPAs, and AP scores were reported with means and standard deviations;
the number and percentage of students taking advanced science and mathematics courses were
reported for students receiving STEM and non-STEM degrees.
Limitations
Of the bachelor’s degrees reported for 2001 to 2006 MCPS graduates, 12.4% were nonspecified
as to the type of degree earned; therefore they could not be categorized as STEM or non-STEM
and were placed in a ―non-specified degree‖ category. After further investigation, it was
determined that some colleges gave their data to NSC with nonspecified degrees while other
nonspecified degrees were scattered throughout the data regardless of cohort or college.
The findings for the MCPS graduating classes of 2005 and 2006 need to be viewed with caution
as complete bachelor’s degree data may not yet have been reported by all colleges to NSC. In
addition, the time allowed to complete a degree is shorter for these more recent cohorts, and
STEM and non-STEM degrees may be differentially affected (Cataldi et al., 2011). Also,
because of the varying length of time it takes to earn a higher degree, as well as the common
practice of gaining work experience before pursuing a graduate degree, we cannot assume that
any of the higher degree data from the MCPS graduating classes in our sample are complete;
therefore, the information in this part of the report may be underestimated.
Comparisons between MCPS and national findings need to be viewed with caution. MCPS
cohorts represent the years students graduated from high school; the years reported in NSF’s
national data represent the years students received their college degrees. Furthermore, across the
cohorts, there are approximately 12% of college graduates from MCPS who have unspecified
degrees (i.e. STEM vs. non-STEM), unlike NSF’s data of bachelor’s degree types.
Complete and accurate information is not yet available for students’ enrollment in MCPS special
school-level science, technology, engineering, and mathematics programs. Therefore, the
percentage of students who were enrolled in special academic high school programs and went on
to earn STEM bachelor’s degrees cannot be determined, and research question 5 cannot be fully
addressed. However, MCPS high school-level data for STEM and non-STEM degree graduates
are shown for each cohort in Appendix Table A-2.

Montgomery County Public Schools Office of Shared Accountability
Program Evaluation Unit 6 MCPS Graduates Earning STEM Degrees
Findings
Research Question 1: What proportion of MCPS college graduates earned a bachelor’s
degree or higher in a STEM-related field, and what was the breakdown of STEM
categories?
Bachelor’s Degrees Among MCPS Graduates
The data reported by the NSC in May 2011 indicated that a range of 36.8% to 51.8% of MCPS
2001–2006 graduates received a bachelor’s degree, with 51.8% from the 2001 cohort (Table 1).
It should be noted that the later cohorts 2005 and 2006 may have incomplete data, as those
students haven’t had six years, a commonly used window, to complete their degrees. The
bachelor’s degrees obtained by students in the 2001 through 2004 cohorts were between 48.6%
and 51.8%.
Table 1
MCPS 2001–2006 Graduates Who
Received a Bachelor’s Degree by Spring 2011
MCPS
class
Graduated
MCPS
Received
bachelor’s
Received
bachelor’s
N n %
2001 7,837 4,062 51.8
2002 8,305 4,286 51.6
2003 8,865 4,394 49.6
2004 9,062 4,408 48.6
2005* 9,313 4,173 44.8
2006* 9,856 3,623 36.8
Note. A total row is not shown due to the influence of
incomplete data in later years.
*These years may not have complete data due to reporting
or insufficient time to earn a bachelor’s degree.
Bachelor’s Degrees in STEM
Across all cohorts of MCPS graduates earning a bachelor’s degree, 19.4% earned a degree in a
STEM field of study (Table 2). There was a slight increase in the percentage of students
receiving STEM-related degrees over the years, from 18.8% among 2001 graduates to 21.1%
among 2006 graduates.

Montgomery County Public Schools Office of Shared Accountability
Program Evaluation Unit 7 MCPS Graduates Earning STEM Degrees
Table 2
MCPS 2001–2006 Graduates with Bachelor’s Degree by
Type of Degree
MCPS
class
Bachelor’s
degree
STEM
degree Non-STEM
degree Non-specified
degree
N n % n % n %
All
cohorts 24,946 4,833 19.4 17,010 68.2 3,103 12.4
2001 4,062 762 18.8 2,739 67.4 561 13.8
2002 4,286 786 18.3 2,970 69.3 530 12.4
2003 4,394 804 18.3 3,038 69.1 552 12.6
2004 4,408 863 19.6 3,047 69.1 498 11.3
2005 4,173 853 20.4 2,836 68.0 484 11.6
2006 3,623 765 21.1 2,380 65.7 478 13.2
Among bachelor’s degrees awarded nationally during 2005 and 2006, 16.2% were in a STEM-
related field as shown in Table 3 (as derived from NSF raw data). Data for college bachelor’s
degrees earned in 2005 and 2006 provide the best available alignment with MCPS data for
students who graduated from high school in 2001 and 2002.
Table 3
National Data: Percentage of Bachelor’s Degrees
in U.S. awarded in STEM Fieldsa
Bachelor’s
degree
STEM
degree
N n %
Total 2,910,935 472,969 16.2 aNational numbers and percentages derived from NSF
2005 & 2006 raw data (NSF, 2010).
Table 4 shows the non-STEM degrees broken down by social science, psychology, and other
non-STEM fields of study in addition to the STEM and non-specified degrees. The social science
and psychology degrees make up almost one fourth (23.5%) of the MCPS bachelor’s degrees
earned across all cohorts. As discussed previously, some national reports include psychology and
social sciences in a broad science category (NSF, 2010; see Chen, 2009 for discussion of STEM
fields definition).

Montgomery County Public Schools Office of Shared Accountability
Program Evaluation Unit 8 MCPS Graduates Earning STEM Degrees
Table 4
MCPS 2001–2006 Graduates with Bachelor’s Degree by
More Specific Type of Degree
Non-STEM
Degree
MCPS
class
Bachelor’s
degree
STEM
degree
Social Science/
Psychology
Other non-
STEM degree
Non-specified
degree type
N n % n % n % n %
All
Cohorts 24,946 4,833 19.4 5,859 23.5 11,151 44.7 3,103 12.4
2001 4,062 762 18.8 920 22.6 1,819 44.8 561 13.8
2002 4,286 786 18.3 999 23.3 1,971 46.0 530 12.4
2003 4,394 804 18.3 1,069 24.3 1,969 44.8 552 12.6
2004 4,408 863 19.6 1,028 23.3 2,019 45.8 498 11.3
2005 4,173 853 20.4 1,006 24.1 1,830 43.9 484 11.6
2006 3,623 765 21.1 837 23.1 1,543 42.6 478 13.2
Type of STEM Degrees
Of those MCPS graduates who earned STEM-related bachelor’s degrees, over half (55.1%) were
in the field of science (Table 5). This is followed by 28.3% holding engineering degrees, 12.2%
with technology degrees, and 4.4% with mathematics degrees. The percentage of science
degrees increased 10 percentage points over the years from 48.3% in 2001 to 58.3% in 2006;
technology degrees decreased 7.4 percentage points from 17.6% in 2001 to 10.2% in 2006.
Table 5
MCPS 2001–2006 Graduates with Bachelor’s Degree by
STEM Type of Degree
MCPS
class
STEM
degree Science Engineering Technology Mathematics
N n % n % n % n %
All
Cohorts 4,833 2,661 55.1 1,367 28.3 590 12.2 214 4.4
2001 762 368 48.3 230 30.2 134 17.6 30 3.9
2002 786 409 52.0 243 30.9 102 13.0 32 4.1
2003 804 426 53.0 253 31.5 100 12.4 25 3.1
2004 863 502 58.2 227 26.3 86 10.0 48 5.6
2005 853 510 59.8 213 25.0 90 10.6 40 4.7
2006 765 446 58.3 201 26.3 78 10.2 40 5.2
Higher Degrees Among MCPS Graduates
Because of the varying length of time it takes to earn a master’s or doctorate degree, or
professional law degree, as well as the common practice of gaining work experience before
pursuing a higher degree, we cannot assume that any of the higher degree data from the MCPS
graduating classes in our sample are complete; therefore, the information in this part of the report
may be underestimated. However, data show that of the 2001–2005 MCPS graduates holding
bachelor’s degrees, between 4.1% and 22.7% of each cohort also earned a higher degree prior to

Montgomery County Public Schools Office of Shared Accountability
Program Evaluation Unit 9 MCPS Graduates Earning STEM Degrees
May 2011. Of the students from the MCPS 2001 graduating class who earned a bachelor’s
degree and have had the most time of all the cohorts to earn a higher degree, 22.7% went on to
earn a higher degree (Table 6).
Table 6
MCPS 2001–2005 Graduates Who Received a Higher Degree
in Addition to a Bachelor’s Degree by Spring 2011
MCPS
class
Received
bachelors Received higher degree
N n %
2001 4,062 924 22.7
2002 4,286 757 17.7
2003 4,394 518 11.8
2004 4,408 322 7.3
2005 4,173 170 4.1
Note. A total row is not shown due to the influence of incomplete data in
later years. More recent years may not have complete data due to reporting
lag or insufficient time to earn a higher degree. Higher degree includes
master’s, doctorate and professional law.
STEM Higher Degrees Among MCPS graduates
Of the higher degrees earned so far among MCPS 2001–2005 graduates, the majority have
earned non-STEM related higher degrees (68.2% to 86.0% across the years), as shown in
Table 7. Of the MCPS 2001 cohort who earned a bachelor’s degree and have had the most time
of all the cohorts to earn a higher degree, 14.0% went on to earn a higher degree in a STEM-
related field. The data also show that the percentage of graduates earning a STEM higher degree
increased over the years from 14.0% for 2001 MCPS graduates to 31.8% for 2005 graduates;
however, caution should be used when viewing later years, as students have not had much time
to acquire a higher degree prior to the May 2011 data.
Table 7
MCPS 2001–2005 Graduates with a Higher Degree by
Type of Higher Degree
MCPS
class
Higher
degree
STEM higher
degree Non-STEM
higher degree
N n % n %
2001 924 129 14.0 795 86.0
2002 757 111 14.7 646 85.3
2003 518 99 19.1 419 80.9
2004 322 85 26.4 237 73.6
2005 170 54 31.8 116 68.2
Note. A total row is not shown due to the influence of incomplete
data in later years. More recent years may not have complete data
due to reporting lag or insufficient time to earn a higher degree.
Higher degree includes master’s, doctorate and professional law.

Montgomery County Public Schools Office of Shared Accountability
Program Evaluation Unit 10 MCPS Graduates Earning STEM Degrees
Of the graduates who earned a STEM-related higher degree (Table 8), the most frequently
acquired degree was engineering (ranging from 40.7% to 49.5%) and science (ranging from
27.8% to 47.1%). However, when only looking at the MCPS class of 2001 graduates, who had
the most time to earn a higher degree, the most common degree was science (44.2%) followed by
engineering (41.9%).
Of the non-STEM higher degrees that have been earned so far, up to 15.3% were in the medical
field, shown in Table 8. In keeping with the degree coding used by NSF, the degrees earned in
the medical fields were classified as non-STEM.
Table 8
MCPS 2001–2005 Graduates With a
STEM Higher Degree by Type of Degree
STEM Non-STEM
MCPS
class
All
higher
degree
STEM
higher
degree Science Engineering Technology Math
Non-
STEM
higher
degree Medicala
Other
Non-STEM
N N n % n % n % n % N n % n %
2001 924 129 57 44.2 54 41.9 16 12.4 2 1.6 795 111 14.0 684 86.0
2002 757 111 40 36.0 55 49.5 13 11.7 3 2.7 646 99 15.3 547 84.7
2003 518 99 41 41.4 45 45.5 10 10.1 3 3.0 419 30 7.2 389 92.8
2004 322 85 40 47.1 35 41.2 9 10.6 1 1.2 237 11 4.6 226 95.4
2005 170 54 15 27.8 22 40.7 14 25.9 3 5.6 116 0 0.0 116 100.0
Note. A total row is not shown due to the influence of incomplete data in later years. More recent years may not have complete data due to
reporting lag or insufficient time to earn a higher degree. Higher degree includes master’s, doctorate and professional law. aMedical degrees include: medicine, chiropractic, pharmacy, veterinary medicine, and nursing.
Of the graduates across five cohorts that earned STEM-related higher degrees, more than 80% of
each cohort (ranging from 81.4% to 85.9%) also earned a STEM-related bachelor’s degree
(Table 9). Furthermore, less than 11% (ranging from 3.0% to 10.9%) earned a non-STEM
bachelor’s degree, but went on to earn a STEM higher degree.
Table 9
MCPS 2001–2005 Graduates with a
STEM Higher Degree by Type of Bachelor’s Degree
MCPS
class
STEM
higher
degree STEM
bachelor’s degree Non-STEM
bachelor’s degree Non-specified
bachelor’s degree
N n % n % n %
2001 129 105 81.4 14 10.9 10 7.8
2002 111 91 82.0 10 9.0 10 9.0
2003 99 84 84.8 3 3.0 12 12.1
2004 85 73 85.9 8 9.4 4 4.7
2005 54 44 81.5 5 9.3 5 9.3
Note. A total row is not shown due to the influence of incomplete data in later years. More
recent years may not have complete data due to reporting lag or insufficient time to earn a
higher degree. STEM higher degree includes master’s or doctorate.

Montgomery County Public Schools Office of Shared Accountability
Program Evaluation Unit 11 MCPS Graduates Earning STEM Degrees
Research Question 2: What proportion of MCPS college graduates earned a bachelor’s
degree in a STEM-related field among racial/ethnic and gender subgroups?
Student Gender Subgroups and Types of Degrees Earned
A higher proportion of MCPS male college graduates than female graduates earned STEM-
related bachelor’s degrees over non-STEM. Across all the cohorts, one fourth of males (24.9%)
earned a STEM degree compared to 15.1% of females (Table 10). There was a slight upward
trend over the years among males who acquired a STEM bachelor’s degree (from 23.8% in 2001
to 28.0% in 2006).
Table 10
MCPS 2001–2006 Gender Subgroups by Type of STEM Bachelor’s Degree
Male Female
MCPS
class
Bachelor’s
degree STEM
Non-STEM
Non-specified
Bachelor’s
degree STEM
Non-STEM
Non-specified
N n % n % n % N n % n % n %
All
Cohorts 10,887 2,714 24.9 6,793 62.4 1,380 12.7 14,059 2,119 15.1 10,217 72.7 1,723 12.3
2001 1,816 432 23.8 1,126 62.0 258 14.2 2,246 330 14.7 1,613 71.8 303 13.5
2002 1,922 451 23.5 1,221 63.5 250 13.0 2,364 335 14.2 1,749 74.0 280 11.8
2003 1,895 466 24.6 1,196 63.1 233 12.3 2,499 338 13.5 1,842 73.7 319 12.8
2004 1,927 469 24.3 1,225 63.6 233 12.1 2,481 394 15.9 1,822 73.4 265 10.7
2005* 1,814 472 26.0 1,128 62.2 214 11.8 2,359 381 16.2 1,708 72.4 270 11.4
2006* 1,513 424 28.0 897 59.3 192 12.7 2,110 341 16.2 1,483 70.3 286 13.6
*Later years may not have complete data due to reporting or insufficient time among some to earn a bachelor’s degree.
A similar gender gap is evident in the national data. The national percentage of STEM bachelor’s
degrees among males was 23.7% and 10.8% among females (Table 11), which was derived from
NSF data in years 2005 and 2006.
Table 11
National Data: STEM Bachelor’s Degrees Awarded to
U.S. Male and Female Graduates in 2005 and 2006a
Male Female
Bachelor’s
Degree Stem Degree Non-Stem
Degree Bachelor’s
Degree Stem Degree Non-Stem
Degree
N n % n % N n % n %
Total 1,230,173 291,246 23.7 938,927 76.3 1,680,762 181,723 10.8 1,499,039 89.2 aNational numbers and percentages derived from NSF 2005 and 2006 raw data (NSF, 2010).
Student Racial/Ethnic Subgroups and Types of Degrees Earned
Compared with other racial/ethnic subgroups, a higher proportion of Asian American graduates,
who received a bachelor’s degree, earned a STEM-related field of study. As shown in Table 12,
over one third (34.7%) of Asian American graduates earned a STEM degree, which was much
higher than the percentage of STEM degrees earned among Whites (16.3%) and African

Montgomery County Public Schools Office of Shared Accountability
Program Evaluation Unit 12 MCPS Graduates Earning STEM Degrees
Americans (15.3%) followed by 11.9% of Hispanic graduates. The percentage of Asian
Americans with a STEM degree increased from 31.0% in 2001 to 39.0% in 2006.
Table 12
MCPS 2001–2006 Degree Type Among Racial/Ethnic Subgroups
Asian American African American
MCPS
Class
Bachelor’s
Degree STEM Non-STEM Non-
Specified
Bachelor’s
Degree STEM Non-STEM Non-
Specified
N n % n % n % N n % n % n %
All
Cohorts 4,654 1,616 34.7 2,580 55.4 458 9.8 2,811 430 15.3 1,914 68.1 467 16.6
2001 722 224 31.0 404 56.0 94 13.0 479 79 16.5 307 64.1 93 19.4
2002 835 256 30.7 501 60.0 78 9.3 466 72 15.5 329 70.6 65 13.9
2003 764 276 36.1 402 52.6 86 11.3 516 79 15.3 356 69.0 81 15.7
2004 817 285 34.9 458 56.1 74 9.1 507 86 17.0 349 68.8 72 14.2
2005* 796 294 36.9 432 54.3 70 8.8 511 71 13.9 359 70.3 81 15.9
2006* 720 281 39.0 383 53.2 56 7.8 332 43 13.0 214 64.5 75 22.6
White Hispanic
N n % n % n % N n % n % n %
All
Cohorts 16,088 2,620 16.3 11,468 71.3 2000 12.4 1,358 162 11.9 1,020 75.1 176 13.0
2001 2,605 430 16.5 1,837 70.5 338 13.0 250 29 11.6 185 74.0 36 14.4
2002 2,722 425 15.6 1,941 71.3 356 13.1 255 32 12.5 193 75.7 30 11.8
2003 2,868 421 14.7 2,093 73.0 354 12.3 239 26 10.9 183 76.6 30 12.6
2004 2,843 464 16.3 2,061 72.5 318 11.2 238 28 11.8 176 73.9 34 14.3
2005* 2,646 464 17.5 1,880 71.1 302 11.4 213 24 11.3 158 74.2 31 14.6
2006* 2,404 416 17.3 1,656 68.9 332 13.8 163 23 14.1 125 76.7 15 9.2
*Later years may not have complete data due to reporting or insufficient time among some to earn a bachelor’s degree.
A higher proportion of Asian Americans in the national study (28.6%) also earned a STEM-
related field of study compared to other racial/ethnic groups (Table 13); data were derived from
NSF data in years 2005 and 2006. 15.5% earned a STEM degree among White graduates, 13.7%
among Hispanic, and 12.3% among African American graduates earned a STEM degree.
Table 13
National Data: Degree Type Among Racial/Ethnic Subgroupsa
Asian American African American
Bachelor’s
Degree STEM Non-STEM
Bachelor’s
Degree STEM Non-STEM
N n % n % N n % n %
Total 185,660 53,139 28.6 132,521 71.4 255,502 31,517 12.3 223,985 87.7
White Hispanic
STEM Non-STEM STEM Non-STEM
N n % n % N n % n %
Total 1,973,752 305,475 15.5 1,668,277 84.5 224,922 30,743 13.7 194,179 86.3
aNational numbers and percentages derived from NSF 2005 & 2006 raw data (NSF, 2010).
Montgomery County Public Schools Office of Shared Accountability
Program Evaluation Unit 13 MCPS Graduates Earning STEM Degrees
Research Question 3: What were the high school SAT and AP scores, GPA, and science
and mathematics courses taken among MCPS graduates earning STEM degrees?
SAT Scores and High School GPA for Students Earning STEM and Non-STEM Bachelor’s
Degrees
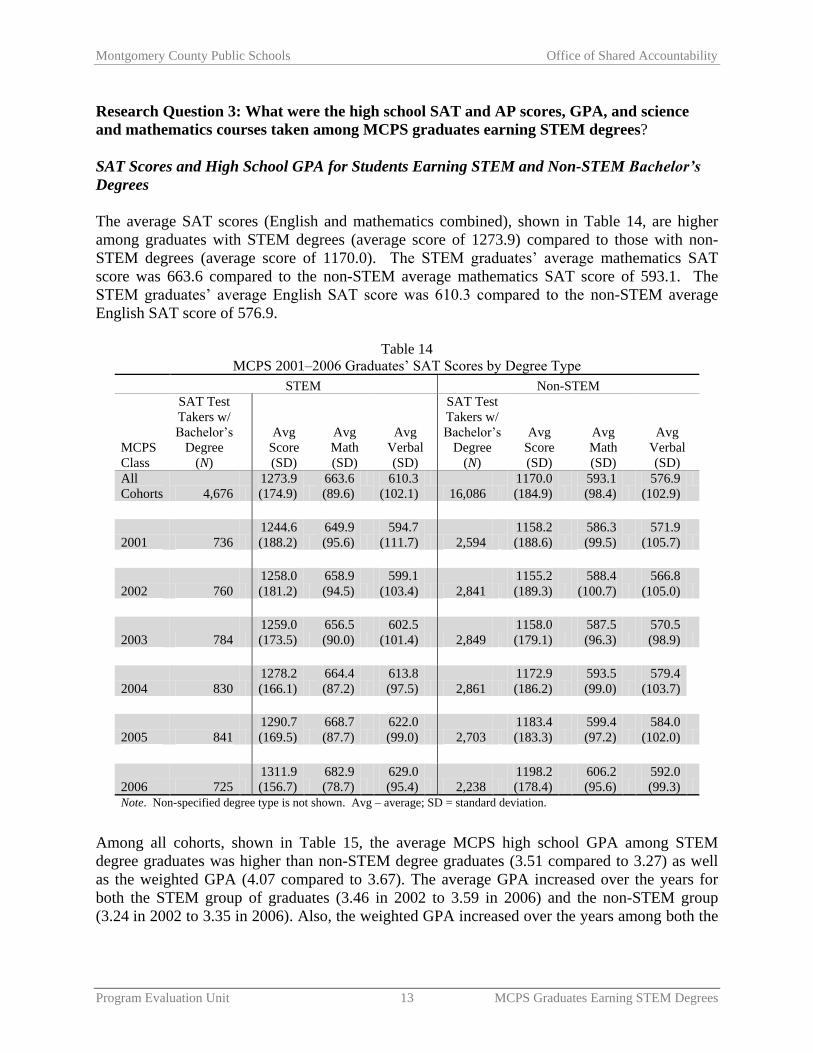
The average SAT scores (English and mathematics combined), shown in Table 14, are higher
among graduates with STEM degrees (average score of 1273.9) compared to those with non-
STEM degrees (average score of 1170.0). The STEM graduates’ average mathematics SAT
score was 663.6 compared to the non-STEM average mathematics SAT score of 593.1. The
STEM graduates’ average English SAT score was 610.3 compared to the non-STEM average
English SAT score of 576.9.
Table 14
MCPS 2001–2006 Graduates’ SAT Scores by Degree Type
STEM Non-STEM
MCPS
Class
SAT Test
Takers w/
Bachelor’s
Degree
(N)
Avg
Score
(SD)
Avg
Math
(SD)
Avg
Verbal
(SD)
SAT Test
Takers w/
Bachelor’s
Degree
(N)
Avg
Score
(SD)
Avg
Math
(SD)
Avg
Verbal
(SD)
All
Cohorts 4,676
1273.9
(174.9)
663.6
(89.6)
610.3
(102.1)
16,086
1170.0
(184.9)
593.1
(98.4)
576.9
(102.9)
2001 736
1244.6
(188.2)
649.9
(95.6)
594.7
(111.7) 2,594
1158.2
(188.6)
586.3
(99.5)
571.9
(105.7)
2002 760
1258.0
(181.2)
658.9
(94.5)
599.1
(103.4) 2,841
1155.2
(189.3)
588.4
(100.7)
566.8
(105.0)
2003 784
1259.0
(173.5)
656.5
(90.0)
602.5
(101.4) 2,849
1158.0
(179.1)
587.5
(96.3)
570.5
(98.9)
2004 830
1278.2
(166.1)
664.4
(87.2)
613.8
(97.5) 2,861
1172.9
(186.2)
593.5
(99.0)
579.4
(103.7)
2005 841
1290.7
(169.5)
668.7
(87.7)
622.0
(99.0) 2,703
1183.4
(183.3)
599.4
(97.2)
584.0
(102.0)
2006 725
1311.9
(156.7)
682.9
(78.7)
629.0
(95.4) 2,238
1198.2
(178.4)
606.2
(95.6)
592.0
(99.3)
Note. Non-specified degree type is not shown. Avg – average; SD = standard deviation.
Among all cohorts, shown in Table 15, the average MCPS high school GPA among STEM
degree graduates was higher than non-STEM degree graduates (3.51 compared to 3.27) as well
as the weighted GPA (4.07 compared to 3.67). The average GPA increased over the years for
both the STEM group of graduates (3.46 in 2002 to 3.59 in 2006) and the non-STEM group
(3.24 in 2002 to 3.35 in 2006). Also, the weighted GPA increased over the years among both the

Montgomery County Public Schools Office of Shared Accountability
Program Evaluation Unit 14 MCPS Graduates Earning STEM Degrees
STEM group (3.97 in 2002 to 4.23 in 2006) and the non-STEM group (3.58 in 2002 to 3.83 in
2006). Table 15
MCPS 2002–2006 Graduates’ GPA by Degree Type
STEM Non-STEM
MCPS
Class
Bachelor’s
Degree
(N)
Avg
GPA
(SD)
Avg
WGPA
(SD)
Bachelor’s
Degree
(N)
Avg
GPA
(SD)
Avg
WGPA
(SD)
All
Cohorts 4,071
3.51
(.38)
4.07
(.56)
14,266
3.27
(.44)
3.67
(.63)
2002 786
3.46
(.42)
3.97
(.61)
2,970
3.24
(.46)
3.58
(.65)
2003 804
3.48
(.42)
3.99
(.61)
3,037
3.23
(.46)
3.57
(.65)
2004 863
3.52
(.37)
4.07
(.53)
3,044
3.27
(.44)
3.67
(.64)
2005 853
3.52
(.38)
4.11
(.54)
2,836
3.29
(.42)
3.72
(.60)
2006 765
3.59
(.33)
4.23
(.45)
2,379
3.35
(.39)
3.83
(.55)
Note. Non-specified degree type is not shown. 2001 GPA not available. Avg = average;
SD = standard deviation.
Science Courses Taken by Students Earning STEM and Non-STEM Bachelor’s Degrees
MCPS high school students are required to earn at least three science credits (one in biology, one
in physical science, and one in other science) to graduate. A large majority of MCPS students
with bachelor’s degrees in a STEM field of study, took four or more science courses in high
school (37.0% took four courses and 53.4% took five or more) compared to 46.6% of non-STEM
graduates who took four courses and 17.5% who took five or more courses (Table 16). Over one
third (35.1%) of non-STEM graduates took the required three science credits compared to 9.5%
of STEM graduates.

Montgomery County Public Schools Office of Shared Accountability
Program Evaluation Unit 15 MCPS Graduates Earning STEM Degrees
Table 16
MCPS 2001–2006 Graduates’
High School Science Courses by Degree Type
STEM Non-STEM
MCPS
Class
Bachelor’s
Degree
Took 3
Science
Courses
Took 4
Science
Courses
Took 5+
Science
Courses
Bachelor’s
Degree
Took 3
Science
Courses
Took 4
Science
Courses
Took 5+
Science
Courses
N n % n % n % N n % n % n %
Total 4,833 457 9.5 1,790 37.0 2,579 53.4 17,010 5,975 35.1 7,931 46.6 2,981 17.5
2001 762 85 11.2 310 40.7 367 48.2 2,739 973 35.5 1,323 48.3 420 15.3
2002 786 96 12.2 286 36.4 402 51.1 2,970 1,137 38.3 1,306 44.0 502 16.9
2003 804 78 9.7 316 39.3 409 50.9 3,038 1,079 35.5 1,440 47.4 488 16.1
2004 863 67 7.8 344 39.9 451 52.3 3,047 1,028 33.7 1,395 45.8 605 19.9
2005 853 79 9.3 286 33.5 486 57.0 2,836 952 33.6 1,359 47.9 512 18.1
2006 765 52 6.8 248 32.4 464 60.7 2,380 806 33.9 1,108 46.6 454 19.1
Note. Non-specified degree type is not shown. Students who took 3.5 courses (i.e. three plus one semester) were included in three science
classes; students who took 4.5 were included in four science classes. The less than 1% who took two science courses (due to moving into
high school after freshman year/intern/academy) are missing information or are not shown.
Among students who earned a STEM degree across all cohorts, under one third (29.3%) took
four honors-level science courses in high school, and 41.6% took five or more honors-level high
school science courses (Table 17). Among graduates earning non-STEM degrees, 23.0% took
four honors-level science courses in high school, and 10.1% took five or more.

Montgomery County Public Schools Office of Shared Accountability
Program Evaluation Unit 16 MCPS Graduates Earning STEM Degrees
Table 17
MCPS 2001–2006 Graduates’ High School
Honor Science Courses by Degree Type
STEM
MCPS
Class
Bachelor’s
Degree
Took 0-2 Honors
Science Courses Took 3 Honors
Science Courses
Took 4 Honors
Science Courses
Took 5+ Honors
Science Courses
N n % n % n % n %
All
Cohorts 4,833 845 17.5 561 11.6 1,418 29.3 2,009 41.6
2001 762 198 26.0 88 11.5 222 29.1 254 33.3
2002 786 176 22.4 96 12.2 223 28.4 291 37.0
2003 804 161 20.0 104 12.9 232 28.9 307 38.2
2004 863 134 15.5 105 12.2 276 32.0 348 40.3
2005 853 113 13.2 91 10.7 244 28.6 405 47.5
2006 765 63 8.2 77 10.1 221 28.9 404 52.8
Non-STEM
N n % n % n % n %
All
Cohorts 17,010 7,704 45.3 3,667 21.6 3,914 23.0 1,725 10.1
2001 2,739 1,453 53.0 515 18.8 552 20.2 219 8.0
2002 2,970 1,547 52.1 607 20.4 552 18.6 264 8.9
2003 3,038 1,527 50.3 605 19.9 650 21.4 256 8.4
2004 3,047 1,346 44.2 608 20.0 731 24.0 362 11.9
2005 2,836 1,063 37.5 685 24.2 760 26.8 328 11.6
2006 2,380 768 32.3 647 27.2 669 28.1 296 12.4
Note. Non-specified degree type is not shown. Students who took 3.5 courses (i.e., three plus one semester) were included
in three science classes; students who took 4.5 were included in four science classes.
Advanced placement science courses in high school include: AP Biology, AP Chemistry,
AP Physics B, AP Physics C Mechanics, AP Physics C Electricity & Magnetism, and
AP Environmental Science. As shown in Table 18, across all cohorts, a much higher percentage
of MCPS students who went on to get STEM degrees in college took one or more AP science
courses (63.8%) in high school compared to non-STEM graduates (26.9%).

Montgomery County Public Schools Office of Shared Accountability
Program Evaluation Unit 17 MCPS Graduates Earning STEM Degrees
Table 18
MCPS 2001–2006 Graduates’ High School
AP Science Courses by Degree Type
STEM Non-STEM
MCPS
Class
Bachelor’s
Degree
Took 1 or more
AP Science
Courses
Bachelor’s
Degree
Took 1 or more
AP Science
Courses
N n % N n %
Total 4,833 3,085 63.8 17,010 4,581 26.9
2001 762 423 55.5 2,739 589 21.5
2002 786 468 59.5 2,970 698 23.5
2003 804 477 59.3 3,038 740 24.4
2004 863 551 63.8 3,047 845 27.7
2005 853 598 70.1 2,836 846 29.8
2006 765 568 74.2 2,380 863 36.3
Note. Non-specified degree type is not shown.
Advanced Placement Test Scores in Science Achieved by Students Earning STEM and Non-
STEM Bachelor’s Degrees
The next section examines a selection of high school AP test scores among MCPS students who
received a bachelor’s degree in STEM and non-STEM fields of study. AP scores range from 1 to
5, with 5 being the highest score possible. Only high school students who take an AP course
typically take the corresponding AP test following the course.
Students who earned STEM-related college degrees had a higher average AP score in both
Biology and Chemistry (Table 19) than those with non-STEM degrees. For Biology, STEM
graduates earned an average score of 4.1 across the cohorts compared to 3.4 among non-STEM
graduates; and for Chemistry, STEM graduates had an average of a 3.9 score compared to a
3.3 average score among non-STEM graduates.
Higher AP scores also were found among STEM test takers for Physics C Mechanical and
Environmental Science (Table 20). For Physics, an average AP score of 3.9 was earned by
STEM degree graduates compared to an average score of 3.4 among non-STEM graduates. Also
shown in Table 22, for Environmental Science, an average score of 3.8 was1
earned by STEM graduates versus 3.0 among non-STEM graduates.
It is also interesting to note that in every cohort year, more STEM graduates took the Chemistry
and Physics AP tests than non-STEM graduates and more non-STEM graduates took the Biology
(except in 2006) and Environmental Science AP tests than STEM graduates.

Montgomery County Public Schools Office of Shared Accountability
Program Evaluation Unit 18 MCPS Graduates Earning STEM Degrees
Table 19
MCPS 2001–2006 Graduates’
AP Biology and Chemistry Scores by Degree Type
AP Biology Score AP Chemistry Score
STEM Non-STEM STEM Non-STEM
MCPS
Class
AP Test
Takers
(N)
Avg
Score
(SD)
Test
Takers
(N)
Avg
Score
(SD)
AP Test
Takers
(N)
Avg
Score
(SD)
AP Test
Takers
(N)
Avg
Score
(SD)
All
Cohorts 1,386
4.1
(1.1) 1,516
3.4
(1.2) 1,289
3.9
(1.2) 903
3.3
(1.3)
2001 158
3.9
(1.2) 184
3.2
(1.3) 182
3.9
(1.1) 129
3.4
(1.3)
2002 208
3.9
(1.2) 260
3.3
(1.3) 188
3.7
(1.2) 147
3.1
(1.3)
2003 175
3.9
(1.1) 217
3.3
(1.3) 200
3.7
(1.2) 160
3.2
(1.2)
2004 260
4.0
(1.1) 279
3.4
(1.2) 218
3.9
(1.2) 172
3.2
(1.3)
2005 310
4.2
(1.0) 313
3.6
(1.2) 224
3.8
(1.1) 146
3.3
(1.3)
2006 275
4.3
(0.9) 263
3.7
(1.2) 277
4.1
(1.0) 149
3.6
(1.3)
Note. Non-specified degree type is not shown. Score range 1–5. SD = standard deviation; Avg = average.

Montgomery County Public Schools Office of Shared Accountability
Program Evaluation Unit 19 MCPS Graduates Earning STEM Degrees
Table 20
MCPS 2001–2006 Graduates’ AP Physics C Mechanical and
Environmental Science Scores by Degree Type
AP Physics C, Mechanical AP Environmental Science
STEM Non-STEM STEM Non-STEM
MCPS
Class
AP Test
Takers
(N)
Avg
Score
(SD)
Test
Takers
(N)
Avg
Score
(SD)
AP Test
Takers
(N)
Avg
Score
(SD)
AP Test
Takers
(N)
Avg
Score
(SD)
All
Cohorts 997
3.9
(1.1) 531
3.4
(1.2) 340
3.8
(1.1) 1,217
3.0
(1.2)
2001 125
4.0
(1.0) 68
3.6
(1.1) 23
3.7
(1.3) 98
2.9
(1.3)
2002 145
3.9
(1.1) 71
3.4
(1.1) 41
4.0
(1.0) 118
3.3
(1.1)
2003 169
3.8
(1.1) 77
3.2
(1.1) 36
3.7
(1.1) 165
2.7
(1.2)
2004 173
3.8
(1.2) 111
3.3
(1.3) 61
3.8
(1.2) 242
2.9
(1.3)
2005 194
3.8
(1.2) 98
3.6
(1.1) 95
3.8
(1.1) 268
2.9
(1.3)
2006 191
4.0
(1.1) 106
3.3
(1.3) 84
3.9
(1.1) 326
3.1
(1.2)
Note. Non-specified degree type is not shown. Score range 1–5. SD = standard deviation;
Avg = average.
Mathematics Courses taken by Students Earning STEM Bachelor’s Degrees
MCPS requires students to take four credits of high school mathematics to graduate, two of
which must include one credit of algebra and one credit of geometry. Table 21 shows that the
majority of MCPS graduates with college STEM degrees took AP Calculus or higher in high
school (65.2% of students across all the cohorts), with more than three fourths (76.6%) of the
2006 cohort having taken AP Calculus or higher. This compares to about one fourth (25.5%
across all cohorts) of the graduates with non-STEM degrees having taken AP Calculus or higher;
although, the percentage of non-STEM graduates taking AP Calculus or higher increased each
year (19.6% in 2001 to 31.4% in 2006). The most common higher mathematics course among
MCPS students with non-STEM college degrees was Pre-calculus or Statistics, with 34% across
all the cohorts; however, that percentage decreased over each of the cohorts (37.2% in 2001 to
27.1% in 2006).

Montgomery County Public Schools Office of Shared Accountability
Program Evaluation Unit 20 MCPS Graduates Earning STEM Degrees
Table 21
MCPS 2001–2006 Graduates’
Highest High School Mathematics Course by Degree Type
STEM Degree
MCPS
Class
Bachelor’s
Degree Otherb Alg2/
Hon. Alg2
Precalculus/
Statistics
Honors
Precalculus/
AP Stat
Calculus w/
Applications
AP Calculus
or Higher
N n % n % n % n % n % n %
All
Cohorts 4,833 15 0.3 82 1.7 574 11.9 422 8.7 591 12.2 3,149 65.2
2001 762 3 0.4 28 3.7 143 18.8 75 9.8 111 14.6 402 52.8
2002 786 4 0.5 13 1.7 118 15.0 76 9.7 100 12.7 475 60.4
2003 804 2 0.2 15 1.8 94 11.7 78 9.7 97 12.1 518 64.4
2004 863 0 0.0 10 1.1 94 10.9 79 9.2 100 11.6 580 67.2
2005 853 3 0.4 10 1.1 80 9.4 75 8.8 97 11.4 588 68.9
2006 765 3 0.4 6 0.8 45 5.9 39 5.1 86 11.2 586 76.6
Non-STEM Degree
N n % n % n % n % n % n %
All
Cohortsa 17,010 250 1.5 1,282 7.5 5,787 34.0 2,802 16.5 2,523 14.8 4,362 25.5
2001 2,739 55 2.0 276 10.1 1,020 37.2 392 14.3 459 16.8 537 19.6
2002 2,970 64 2.2 260 8.8 1,123 37.8 462 15.6 368 12.4 693 23.3
2003a 3,038 59 1.9 263 8.7 1,120 36.9 480 15.8 378 12.4 737 24.3
2004 3,047 35 1.1 207 6.8 1,027 33.7 489 16.0 438 14.4 851 27.9
2005 2,836 26 0.9 169 6.0 854 30.1 543 19.1 447 15.8 797 28.1
2006a 2,380 11 0.5 107 4.5 643 27.1 436 18.3 433 18.2 747 31.4
Note. Non-specified degree type is not shown. a2003 is missing mathematics course data for one student, 2006 is missing course data for three students, all cohorts reflects this
missing course data. bOther indicates remedial mathematics, Algebra 1, Geometry, and Honors Geometry.
The majority of STEM degree graduates took four or more honors-level mathematics courses in
high school (Table 22); 43.1% took four courses and 17.3% took five or more. This compares to
21.6% of non-STEM graduates across all cohorts taking four honors-level mathematics courses,
and 5.8% taking five or more. The majority (61%) of non-STEM graduates took two or fewer
honors-level high school mathematics courses.

Montgomery County Public Schools Office of Shared Accountability
Program Evaluation Unit 21 MCPS Graduates Earning STEM Degrees
Table 22
MCPS 2001–2006 Graduates’ High School
Honor Mathematics Courses by Degree Type
STEM
MCPS
Class
Bachelor’s
Degree
Took 02
Honors Math
Courses
Took 3
Honors Math
Courses
Took 4
Honors Math
Courses
Took 5+
Honors Math
Courses
N n % n % n % n %
Total 4,833 1,344 27.8 572 11.8 2,081 43.1 836 17.3
2001 762 287 37.7 88 11.5 295 38.7 92 12.1
2002 786 259 33.0 96 12.2 297 37.8 134 17.0
2003 804 249 31.0 84 10.4 359 44.7 112 13.9
2004 863 223 25.8 102 11.8 399 46.2 139 16.1
2005 853 204 23.9 112 13.1 376 44.1 161 18.9
2006 765 122 15.9 90 11.8 355 46.4 198 25.9
Non-STEM
N n % n % n % n %
Total 17,010 10,382 61.0 1964 11.5 3,676 21.6 988 5.8
2001 2,739 1,840 67.2 247 9.0 525 19.2 127 4.6
2002 2,970 1,979 66.6 276 9.3 574 19.3 141 4.7
2003 3,038 1,987 65.4 313 10.3 592 19.5 146 4.8
2004 3,047 1,810 59.4 346 11.4 727 23.9 164 5.4
2005 2,836 1,586 55.9 386 13.6 684 24.1 180 6.3
2006 2,380 1,180 49.6 396 16.6 574 24.1 230 9.7
Note. Non-specified degree type is not shown.
High school AP mathematics courses include Calculus AB, Calculus BC, or Statistics. Among
all cohorts, almost two thirds (63.7%) of MCPS graduates who earned a STEM degree took one
or more AP mathematics courses in high school (Table 23). This compares to just over one third
(34.8%) of non-STEM degree graduates across the cohorts. In both groups, the percentage of
graduates taking one or more AP mathematics courses increased throughout the cohort years.
Among STEM graduates, 49.7% took one or more AP mathematics courses in 2001, which
increased to 73.6% in 2006. Among non-STEM graduates, 27.3% took one or more
AP mathematics courses in 2001, which increased to 43.6% in 2006.

Montgomery County Public Schools Office of Shared Accountability
Program Evaluation Unit 22 MCPS Graduates Earning STEM Degrees
Table 23
MCPS 2001–2006 Graduates’ High School
AP Mathematics Courses by Degree Type
STEM Non-STEM
MCPS
Class
Bachelor’s
Degree
Took 1 or
more AP Math
Courses
Bachelor’s
Degree
Took 1 or
more AP Math
Courses
N n % N n %
Total 4,833 3,077 63.7 17,008 5,925 34.8
2001 762 379 49.7 2,739 748 27.3
2002 786 449 57.1 2,970 902 30.4
2003 804 507 63.1 3,038 985 32.4
2004 863 588 68.1 3,047 1,129 37.1
2005 853 591 69.3 2,836 1,125 39.7
2006 765 563 73.6 2,378 1,036 43.6
Note. Non-specified degree type is not shown.
Advanced Placement Test Scores in Mathematics Achieved by Students Earning STEM
Bachelor’s Degrees
On average, STEM degree graduates scored higher on AP mathematics tests in high school
compared to their non-STEM degree counterparts. The STEM graduates received an average
score of 4.1 for AP Calculus AB, 4.0 for AP Calculus BC (Table 24) and 3.9 for AP Statistics
(Table 25) across all the cohorts. This compares to non-STEM graduates who received an
average score of 3.7 for AP Calculus AB, 3.6 for AP Calculus BC, and 3.1 for AP Statistics.

Montgomery County Public Schools Office of Shared Accountability
Program Evaluation Unit 23 MCPS Graduates Earning STEM Degrees
Table 24
MCPS 2001–2006 Graduates’ AP Calculus Scores
by Degree Type
AP Calculus AB AP Calculus BC
STEM Non-STEM STEM Non-STEM
MCPS
Class
Test
Takers
(N)
Avg
Score
(SD)
Test
Takers
(N)
Avg
Score
(SD)
Test
Takers
(N)
Avg
Score
(SD)
Test
Takers
(N)
Avg
Score
(SD)
Total 2,837
4.1
(1.1) 3,485
3.7
(1.2) 1,905
4.0
(1.2) 1,658
3.6
(1.3)
2001 346
4.3
(0.9) 423
3.8
(1.0)
254
4.1
(1.1) 239
3.7
(1.2)
2002 412
4.2
(0.9) 529
3.9
(1.1) 304
4.0
(1.2) 300
3.6
(1.3)
2003 464
4.1
(1.0) 573
3.6
(1.1) 314
3.9
(1.2) 239
3.5
(1.3)
2004 535
4.0
(1.2) 676
3.7
(1.3) 355
3.8
(1.3) 315
3.6
(1.3)
2005 537
4.1
(1.1) 656
3.6
(1.3) 325
4.1
(1.2) 293
3.5
(1.4)
2006 543
4.2
(1.1) 628
3.7
(1.3) 353
4.1
(1.2) 272
3.8
(1.4)
Note. Non-specified degree type is not shown. SD = standard deviation; Avg = average.

Montgomery County Public Schools Office of Shared Accountability
Program Evaluation Unit 24 MCPS Graduates Earning STEM Degrees
Table 25
MCPS 2001–2006 Graduates’ AP Statistics
Scores by Degree Type
AP Statistics
STEM Non-STEM
MCPS
Class
Test
Takers
Avg
Score
(SD)
Test
Takers
Avg
Score
(SD)
N N
Total 946
3.9
(1.1) 2,225
3.1
(1.2)
2001 109
3.9
(1.0) 275
3.3
(1.1)
2002 152
3.9
(1.1) 308
3.2
(1.2)
2003 125
3.8
(1.1) 345
3.0
(1.2)
2004 179
3.7
(1.2) 406
3.1
(1.2)
2005 196
3.8
(1.1) 436
3.1
(1.1)
2006 185
4.1
(1.0) 455
3.2
(1.2)
Note. Non-specified degree type is not shown.
SD = standard deviation; Avg = average.
Research Question 4: What were the colleges most frequently attended by MCPS graduates
earning STEM degrees?
Colleges Attended by Students Earning STEM Bachelor’s Degrees
There was a wide variety of colleges and universities where MCPS graduates acquired their
bachelor’s degrees, with 244 colleges among STEM degree graduates and 528 colleges among
non-STEM degree graduates represented across the 2001–2004 year cohorts. The University of
Maryland, College Park is where the largest percentage of MCPS students acquired their
bachelor’s degree whether it was a STEM degree (38.0%) or non-STEM degree (27.8%)
(Table 26). The second most popular college across the cohorts for acquiring a bachelor’s
degree was University of Maryland, Baltimore County among STEM degree graduates (10.0%)
and Towson University among non-STEM degree graduates (6.0%). No other college across all
four cohorts exceeds 10% of where students received their bachelor’s degree; after the second
most popular college, each school makes up less than 5% of the students.
When looking at the colleges where the largest percentage of 2001–2004 MCPS graduates
received their bachelor’s degree, it is interesting to note that there are colleges in the top 16

Montgomery County Public Schools Office of Shared Accountability
Program Evaluation Unit 25 MCPS Graduates Earning STEM Degrees
among STEM degree graduates that are not in the non-STEM top 16 and vice versa; and these
rankings change from year to year (Table 26). Colleges that are only in the top 16 among STEM
degree graduates are: Cornell University (1.9%), Carnegie Mellon University (1.6%), Duke
University (1.2%), Stanford University (1.1%), Massachusetts Institute of Technology (0.9%),
University of Illinois Urbana (0.9%) and University of Pennsylvania (0.9%). Colleges that are
only in the top sixteen among non-STEM degree students are: Frostburg University (2.0%),
New York University (1.1%), James Madison University (1.0%), George Washington University
(1.0%), American University (1.0%), University of Delaware (1.0%) and West Virginia
University (0.9%).

Montgomery County Public Schools Office of Shared Accountability
Program Evaluation Unit 26 MCPS Graduates Earning STEM Degrees
Table 26
MCPS 2001–2004 Graduates’ Top Colleges
for Receiving Bachelor’s Degrees by Degree Type
STEM Non-STEM
College Rank n % College Rank n %
Univ of Maryland College
Park 1 1,221 38.0
Univ of Maryland
College Park 1 3,279 27.8
Univ of Maryland
Baltimore County 2 320 10.0 Towson University 2 707 6.0
Virginia Polytech and
State University 3 77 2.4
Univ of Maryland
Baltimore County 3 515 4.4
Pennsylvania State
University 4 73 2.3 Salisbury University 4 362 3.1
Towson University 5 69 2.1
Frostburg State
University 5 238 2.0
Cornell University 6 62 1.9
St. Marys College of
Maryland 6 203 1.7
Carnegie Mellon
University 7 50 1.6
Pennsylvania State
University 7 187 1.6
St. Marys College of
Maryland 8 47 1.5
Virginia Polytech and
State University 8 135 1.1
George Washington
University 9 39 1.2
University of
Michigan-Central
Campus 9 127 1.1
Duke University 10 38 1.2 New York University 10 126 1.1
Stanford University 11 34 1.1
James Madison
University 11 122 1.0
Salisbury University 12 33 1.0
George Washington
University 12 120 1.0
Massachusetts Institute of
Technology 13 29 .9 American University 13 119 1.0
University of Illinois @
Urbana 14 29 .9
University of
Delaware 14 117 1.0
University of
Pennsylvania 15 29 .9
West Virginia
University 15 112 0.9
University of Michigan-
Central Campus 16 28 .9
Georgetown
University 16 105 0.9
Other Colleges 17-244 1,037 32.3 Other Colleges 17-528 5,220 44.3
Total 3,215 100.0 11,794 100.0
Note. Non-specified degree type is not shown. 2001 through 2004 data is shown to report the most complete data. Each
STEM and non-STEM list of colleges is ranked in descending order of students receiving bachelor’s degrees among MCPS
2001–2004 graduates. Percentages may not total 100.0% due to rounding.
Research Question 5: Does enrollment in a science-related high school program relate to
STEM degree completion?
The percentage of MCPS graduates who earned STEM bachelor’s degrees by May 2011 varied
for each cohort year among individual MCPS high schools (see Appendix Table A-2). The high
school with the highest percentage of STEM degrees across all the cohorts was Montgomery
Blair High School (Blair). Just over one fourth (26.6%) of graduates from Blair who received a
college bachelor’s degree earned a STEM degree across all the cohorts.

Montgomery County Public Schools Office of Shared Accountability
Program Evaluation Unit 27 MCPS Graduates Earning STEM Degrees
As explained in the limitations section, accurate student-level data indicating enrollment in
MCPS special school level science, technology, engineering, and mathematics programs are not
available for all students across the cohorts. Therefore, the percentage of students who were
enrolled in special academic high school programs and went on to earn STEM bachelor’s
degrees cannot be determined. However, Blair houses an Academy of Science, Technology,
Engineering, and Mathematics, which complements its Science, Mathematics, and Computer
Science Magnet program; these programs are likely related to the high rate of graduates going on
to earn STEM bachelor’s degrees.
Summary
STEM Degrees Among MCPS Graduates
Of MCPS graduates who received a bachelor’s degree across all cohorts—
o about 19% received a STEM degree;
o about 12% of degrees were non-specified; and
o about 24% of non-STEM degrees were psychology and social sciences.
There was a slight increase of students who received STEM degrees over the years.
Science degrees made up over half of the STEM degrees, while mathematics made up the
least.
Science degrees increased over the cohort years and technology degrees decreased.
Nationally, the percentage of STEM bachelor’s degrees for years 2005 and 2006 was
16%.
STEM Higher Degrees Among MCPS Graduates
Across the cohorts of MCPS graduates who earned a bachelor’s degree, a range of 4% to
23% also earned a higher degree.
Almost one fourth of bachelor’s degree holders from the MCPS class of 2001 earned a
higher degree.
A range of 14% to 32% across cohorts earned a STEM higher degree.
The most frequently earned types of STEM higher degrees so far across all the cohorts
were in engineering and science, with science being the most frequently earned type of
STEM higher degree from the class of 2001.
More than 80% of MCPS college graduates with a STEM higher degree also earned a
STEM-related bachelor’s degree.
Breakdown Among Gender and Race/Ethnicity
More male MCPS graduates with bachelor’s degrees chose a STEM degree compared to
female MCPS graduates; a similar gap was found nationally in years 2005 and 2006.
There was slight increase among males obtaining a STEM degree.
More than one third of Asian American graduates with bachelor’s degrees earned a
STEM degree, compared to 12–16% of Hispanic, African American, and White
graduates. Likewise, nationally, Asian American graduatess also had a much higher

Montgomery County Public Schools Office of Shared Accountability
Program Evaluation Unit 28 MCPS Graduates Earning STEM Degrees
percentage of STEM degrees compared to Hispanic, African American, and White
graduates.
The percentage of Asian American graduates with STEM degrees increased over the six
cohorts.
SAT Scores and GPA
The average SAT scores among MCPS STEM degree holders was higher than those with
non-STEM bachelor’s degrees.
The average GPA and weighted GPA among MCPS STEM degree students was higher
than those with non-STEM bachelor’s degrees.
Science Courses and Science AP Exams
A large majority of MCPS graduates with STEM degrees took four or more science
courses in high school, while more than one third of non-STEM graduates took the
required three courses and just under half took four courses.
Across cohorts, a much higher percentage of graduates with STEM degrees took one or
more AP science courses in high school (almost two thirds) compared to non-STEM
graduates (just over one fourth).
Graduates who earned a STEM degree had higher average AP science scores than non-
STEM degree graduates.
More graduates with STEM degrees took Chemistry and Physics AP exams compared to
non-STEM graduates and more non-STEM graduates took the Biology and
Environmental Science AP tests over the years.
Mathematics Courses and Mathematics AP Exams
The majority of MCPS graduates with STEM degrees took AP Calculus or higher in high
school (almost two thirds) compared to one fourth of non-STEM graduates across the
years; however, the percentage of non-STEM graduates taking AP Calculus or higher
increased over the years.
More STEM graduates (almost two thirds) took one or more AP mathematics courses in
high school compared to just over one third of non-STEM graduates; however, the
percentage increased for both groups over the years.
STEM degree graduates scored higher on AP mathematics exams compared to their non-
STEM degree counterparts.
Colleges Attended by Graduates
The University of Maryland, College Park is the college where the largest percentage of
MCPS graduates acquired their bachelor’s degree whether it was a STEM degree or non-
STEM degree. Outside of University of Maryland, there was a wide variety of colleges
and universities where MCPS graduates have acquired their bachelor’s degrees.

Montgomery County Public Schools Office of Shared Accountability
Program Evaluation Unit 29 MCPS Graduates Earning STEM Degrees
Among colleges where the largest percentage MCPS graduates received their bachelor’s
degrees, there are colleges in the top sixteen percentages among STEM degree graduates
that are not in the non-STEM top sixteen such as: Cornell University, Carnegie Mellon
University, Duke University, Stanford University, Massachusetts Institute of Technology,
University of Illinois Urbana, and University of Pennsylvania.
MCPS School-level STEM Degrees
Across all the cohorts, Montgomery Blair High School, which houses a mathematics,
science, and computer science magnet program, had the highest percentage of STEM
degrees among its graduates who received a bachelor’s degree compared to other MCPS
schools.
Conclusion and Recommendations
Almost one fifth of MCPS graduates from 2001–2006 who earned a college bachelor’s degree,
earned it in a STEM-related field, and this has increased slightly over the years. Proportionately,
more males and more Asian American MCPS graduates with bachelor’s degrees chose STEM
fields of study than their respective counterparts, which is consistent with the national sample.
The majority of graduates with STEM degrees took four or more science classes in high school,
AP calculus or higher, and one or more science and mathematics AP classes in high school.
They also scored higher on science and mathematics AP tests and SATs and had a higher high
school GPA.
Findings of the current study suggest the following recommendations:
Explore ways to engage more students in STEM subjects, especially technology,
engineering, and mathematics to increase participation in STEM-related fields after high
school.
Explore ways to engage more female students in STEM subjects in order to close the
gender gap between female and male graduates who earn a STEM bachelor’s degree.
Explore ways to engage all student racial/ethnic subgroups in STEM subjects to close the
gap between these groups.
Develop a centralized student specific tracking system within MCPS to record individual
participation in specific school-level academies and programs. Such a system would
allow tracking of students with STEM bachelor’s degrees and their participation in
STEM-related high school programs.
Acknowledgements
The authors would like to thank Dr. Shahpar Modarresi, Dr. Huafang Zhao, Shihching Liu,
Trisha McGaughey, and Dr. Kecia Addison-Scott for their valued assistance and guidance with
this study.

Montgomery County Public Schools Office of Shared Accountability
Program Evaluation Unit 30 MCPS Graduates Earning STEM Degrees
References
Aud, S., Hussar, W., Johnson, F., Kena, G., Roth, E., Manning, E., Wang, X., and Zhang, J.
(2012). The condition of education 2012 (NCES 2012-045). Retrieved from the
U.S. Department of Education, National Center for Education Statistics website:
http://nces.ed.gov/pubsearch/pubsinfo.asp?pubid=2012045.
Beede, D., Julian, T., Langdon, D., McKittrick, B. K., & Doms, M. (2011). Women in STEM: A
gender gap to innovation (ESA Issue Brief #04-11). Retrieved from the Department of
Commerce, Economics and Statistics Administration website:
http://esa.doc.gov/sites/default/files/reports/documents/womeninstemagaptoinnovation83
11.pdf.
Boundaoul, A. (Writer). CNN (Producer). (2011, May 21). Why would-be engineers end up as
English majors. Retrieved from
http://www.cnn.com/2011/US/05/17/education.stem.graduation/index.html?iref=allsearch.
Business-Higher Education Forum. (2010). Increasing the number of STEM graduates:
Insights from the U.S. STEM education and modeling project. Washington, DC: Author.
Retrieved from http://www.bhef.com/publications/.
Carnevale, A.P., Smith, N., and Melton, M. (2012). STEM. Georgetown University, Center on
Education and the Workforce. Retrieved from
http://www9.georgetown.edu/grad/gppi/hpi/cew/pdfs/stem-complete.pdf .
Cataldi, E.F., Green, C., Henke, R., Lew, T., Woo, J., Shepherd, B., and Siegel, P. (2011). 2008–
09 Baccalaureate and Beyond Longitudinal Study (BB:08/09): First Look (NCES 2011-
236). Retrieved from the U.S. Department of Education, National Center for Education
Statistics website: http://nces.ed.gov/pubsearch/pubsinfo.asp?pubid=2011236.
Chen, Xianglei. (2009). Students who study Science, Technology, Engineering, and
Mathematics (STEM) in postsecondary education (NCES 2009-161). Retrieved from the
U.S. Department of Education, National Center for Education Statistics website:
http://nces.ed.gov/pubsearch/pubsinfo.asp?pubid=2009161
Montgomery County Public Schools. (2012). Science, Technology, and Engineering.
Rockville, MD: Author. http://www.montgomeryschoolsmd.org/curriculum/science/.
National Science Board. (2010). Science and engineering indicators 2010. Arlington, VA:
Author.
National Science Foundation, Division of Science Resources Statistics. (2011). Women,
Minorities, and Persons with Disabilities in Science and Engineering: 2011. Special
Report NSF 11-309. Arlington, VA. Available at
http://www.nsf.gov/statistics/wmpd/pdf/nsf11309.pdf.

Montgomery County Public Schools Office of Shared Accountability
Program Evaluation Unit 31 MCPS Graduates Earning STEM Degrees
National Science Foundation, Division of Science Resources Statistics. (2010). Science and
Engineering Degrees, by Race/Ethnicity of Recipients: 1997–2006. Detailed Statistical
Tables NSF 10-300. Arlington, VA. Available at http://www.nsf.gov/statistics/nsf10300/.
National Student Clearinghouse (2012). Student Tracker.
http://www.studentclearinghouse.org/colleges/files/ST_SchoolBrochure.pdf.
President’s Council of Advisors on Science and Technology. (2012). Report to the President:
Engage to excel: Producing one million additional college graduates with degrees in
science, technology, engineering, and mathematics. Retrieved from
http://www.whitehouse.gov/sites/default/files/microsites/ostp/pcast-executive-report-
final_2-13-12.pdf.
Wolanin, N., & Wade, J. (2012). Evaluation of the science, technology, and engineering
leadership program, year one. Rockville, MD: Montgomery County Public Schools.
Zhao, H., Liu, S., and Wolanin, N. (2012) College enrollment, persistence, and degree attainment
for high school graduates in Montgomery County Public Schools, Maryland. Rockville,
MD: Montgomery County Public Schools.

Montgomery County Public Schools Office of Shared Accountability
Program Evaluation Unit 32 MCPS Graduates Earning STEM Degrees
Appendix
Table A-1
Coding Scheme of Bachelor’s Degrees into STEM and non-STEM Categories
STEM Degrees Non-STEM Degrees
Science Degrees such as: Business Degrees such as:
Biology/Microbiology/Biological Sciences Accounting
Chemistry Marketing
Biochemistry Finance
Environmental Science Management
Physics English
Agricultural Science Foreign Language
Marine Biology Liberal Arts
Animal Behavior Journalism
Forensic Science Communication
Astronomy
Education: Elementary, Secondary, specified
field, Early Childhood
Food Science Medicine
Engineering Degrees such as: Nursing Fields
Civil Engineering Exercise Science/Kinesiology/Nutrition
Mechanical Engineering Pharmacy
Electrical Engineering Veterinary
Biomedical Engineering History/Art History
Computer Engineering Music/Drama
Aerospace Engineering Graphic Design
Mathematic Degrees Architecture
Technology Degrees such as: Parks and Recreation
Robotics Hotel and Tourism
Computer Science/Information Systems Philosophy
Linguistics Psychology
Social Sciences such as:
Political Science/Government/International
Relations
Sociology
American/Women’s/Urban Studies
Anthropology
Economics
Criminal Justice/Criminology
Geography
Note. The above table is not a complete list of all degrees acquired. This is to give a sense of the major types of degrees and
their classifications. Coding is based upon the National Science Foundation’s Classification of degrees for it’s Science and
Engineering Degrees, by race/ethnicity: 19972006 report, which was derived from the Integrated Postsecondary Education
Data System completions survey, conducted by the National Center for Education Statistics, U.S. Department of Education.
However, this report categorizes social science and psychology under non-STEM.

Montgomery County Public Schools Office of Shared Accountability
Program Evaluation Unit 33 MCPS Graduates Earning STEM Degrees
Table A-2
Montgomery County Public Schools 2001–2006 Graduates With STEM Bachelor’s Degree Among Those
Receiving Bachelor’s by High School
Bethesda-Chevy Chase Blair Blake Churchill Clarksburga
MCPS
Class
Bachelor’s
STEM
Degree Bachelor’s
STEM
Degree Bachelor’s
STEM
Degree Bachelor’s
STEM
Degree Bachelor’s
STEM
Degree
N n % N n % N n % N n % N n %
Total 1,146 162 14.1 1,642 437 26.6 950 120 12.6 1,907 366 19.2 N/A
2001 166 22 13.3 246 63 25.6 117 20 17.1 284 47 16.5
2002 156 24 15.4 313 81 25.9 140 12 8.6 337 48 14.2
2003 174 20 11.5 282 73 25.9 172 18 10.5 320 58 18.1
2004 220 33 15.0 283 73 25.8 165 24 14.5 345 71 20.6
2005 228 27 11.8 283 73 25.8 192 24 12.5 314 56 17.8
2006 202 36 17.8 235 74 31.5 164 22 13.4 307 86 28.0
Damascus Einstein Gaithersburg Walter Johnson Kennedy
MCPS
Class
Bachelor’s
STEM
Degree Bachelor’s
STEM
Degree Bachelor’s
STEM
Degree Bachelor’s
STEM
Degree Bachelor’s
STEM
Degree
N n % N n % N n % N n % N n %
Total 1,178 239 20.3 522 90 17.2 963 193 20.0 1,390 286 20.6 546 113 20.7
2001 174 32 18.4 100 15 15.0 181 33 18.2 213 42 19.7 106 17 16.0
2002 198 40 20.2 105 17 16.2 166 36 21.7 230 44 19.1 113 24 21.2
2003 223 52 23.3 105 16 15.2 187 31 16.6 243 43 17.7 110 20 18.2
2004 206 39 18.9 112 22 19.6 154 30 19.5 245 52 21.2 84 18 21.4
2005 203 47 23.2 100 20 20.0 149 36 24.2 254 63 24.8 71 19 26.8
2006 174 29 16.7 69 9 13.0 126 27 21.4 205 42 20.5 62 15 24.2
Magruder Richard Montgomery Northwest Northwooda
Paint Branch
MCPS
Class
Bachelor’s
STEM
Degree Bachelor’s
STEM
Degree Bachelor’s
STEM
Degree Bachelor’s
STEM
Degree Bachelor’s
STEM
Degree
N n % N n % N n % N n % N n %
Total 1,293 231 17.9 1,259 249 19.8 845 153 18.1 N/A 970 220 22.7
2001 211 37 17.5 207 34 16.4 115 19 16.5 186 36 19.4
2002 230 42 18.3 214 44 20.6 147 16 10.9 187 47 25.1
2003 231 46 19.9 221 44 19.9 146 25 17.1 166 30 18.1
2004 236 40 16.9 231 44 19.0 151 36 23.8 146 35 24.0
2005 201 36 17.9 198 48 24.2 159 31 19.5 163 45 27.6
2006 184 30 16.3 188 35 18.6 127 26 20.5 122 27 22.1 Continued

Montgomery County Public Schools Office of Shared Accountability
Program Evaluation Unit 34 MCPS Graduates Earning STEM Degrees
Table A-2
Montgomery County Public Schools 2001–2006 Graduates With STEM Bachelor’s Degree Among Those
Receiving Bachelor’s by High School
Poolesville Quince Orchard Rockville Seneca Valley Sherwood
MCPS Class
Bachelor’s
STEM
Degree Bachelor’s
STEM
Degree Bachelor’s
STEM
Degree Bachelor’s
STEM
Degree Bachelor’s
STEM
Degree
N n % N n % N n % N n % N n %
Total 554 119 21.5 1,176 213 18.1 557 102 18.3 635 120 18.9 1,309 197 15.0
2001 75 17 22.7 197 38 19.3 127 33 26.0 112 23 20.5 210 28 13.3
2002 100 22 22.0 197 29 14.7 104 18 17.3 105 18 17.1 205 16 7.8
2003 91 13 14.3 195 41 21.0 98 17 17.3 120 23 19.2 242 37 15.3
2004 112 26 23.2 221 41 18.6 81 10 12.3 114 21 18.4 246 40 16.3
2005 91 23 25.3 200 33 16.5 89 13 14.6 96 25 26.0 208 38 18.3
2006 85 18 21.2 166 31 18.7 58 11 19.0 88 10 11.4 198 38 19.2
Springbrook Watkins Mill Wheaton Whitman Wootton
MCPS Class
Bachelor’s
STEM
Degree Bachelor’s
STEM
Degree Bachelor’s
STEM
Degree Bachelor’s
STEM
Degree Bachelor’s
STEM
Degree
N n % N n % N n % N n % N n %
Total 1,044 230 22.0 926 189 20.4 354 56 15.8 1,740 261 15.0 1,957 474 24.2
2001 209 42 20.1 182 38 20.9 89 21 23.6 264 38 14.4 284 65 22.9
2002 184 42 22.8 187 34 18.2 56 8 14.3 290 45 15.5 320 78 24.4
2003 188 39 20.7 177 32 18.1 68 9 13.2 319 52 16.3 315 65 20.6
2004 209 46 22.0 153 27 17.6 53 9 17.0 288 42 14.6 351 83 23.6
2005 128 31 24.2 133 34 25.6 56 5 8.9 294 37 12.6 363 89 24.5
2006 126 30 23.8 94 24 25.5 32 4 12.5 285 47 16.5 324 94 29.0
aNorthwood and Clarksburg High Schools did exist yet and therefore did not have graduating classes from 2001 to 2006.