mcdonald's 2008 annual report - zone bourse · pdf filemcdonald’s embraced a...
TRANSCRIPT

McDonald’s Corporation One McDonald’s Plaza Oak Brook, IL 60523 www.mcdonalds.com
2008 Annual Report
McDonald’s Corporation

Global comparable sales increase
2008 Highlights:
6.9%Total revenues
$23.5 Billion
Cash returned to shareholders via dividends and share repurchases
$5.8 Billion
Ronald McDonald House Charities has grown from a single Ronald McDonald House program in Philadelphia, PA, in 1974 into a global organization. Founded in recognition of McDonald’s founder Ray Kroc, who believed in an individual’s obligation to give back to communities in a relevant and meaningful way, RMHC and its network of local chapters support core programs that help bridge access to health care.
More than 3.7 million children and families are served each year in 285 Ronald McDonald Houses in 30 countries and regions, 35 Ronald McDonald Care Mobiles in six countries and 137 Ronald McDonald Family Rooms in 15 countries and regions.
RMHC is actively supported by McDonald’s Corporation, its owner/operators, suppliers, customers, other companies and the general public. To learn more about RMHC, call 1.630.623.7048 or visit our website at www.rmhc.org.
© 2009 McDonald’s Corporation

Jim Skinner, Chief Executive Officer (left)
Ralph Alvarez, President and Chief Operating Officer (right)
To Our Valued Shareholders:
I’ve been thinking a lot lately about a quote from Thomas Alva Edison, one of America’s greatest inventors. “Opportunity is missed by most people,” he observed, “because it is dressed in overalls and looks like work.”
I believe Mr. Edison was reminding us that lightning really doesn’t come in a bottle — and that overnight successes are very much the exception to the rule, not the norm.
At McDonald’s, success has always involved a not-so-profound formula involving one-part inspiration and four-parts perspiration.
Our founder, Ray Kroc, coined the phrase “grinding it out” to characterize the determination and attention to detail that is required to be successful in our industry. “Grinding it out” was his way of saying the restaurant business is, and always will be, a labor-intensive operation.
It was hard work and determination that built McDonald’s — and today, those same qualities drive our success.
As this Annual Report indicates, 2008 was a banner year for McDonald’s. Revenues increased to a record $23.5 billion … global comparable sales increased 6.9 percent and we marked our 68th consecutive monthly increase … operating income and earnings per share rose 17 and 15 percent, respectively (excluding the 2007 Latin America transaction) … and we returned $5.8 billion to shareholders through share repurchases and dividends paid.
REVENUES
060708 $23.5
$22.8$20.9
In billions.
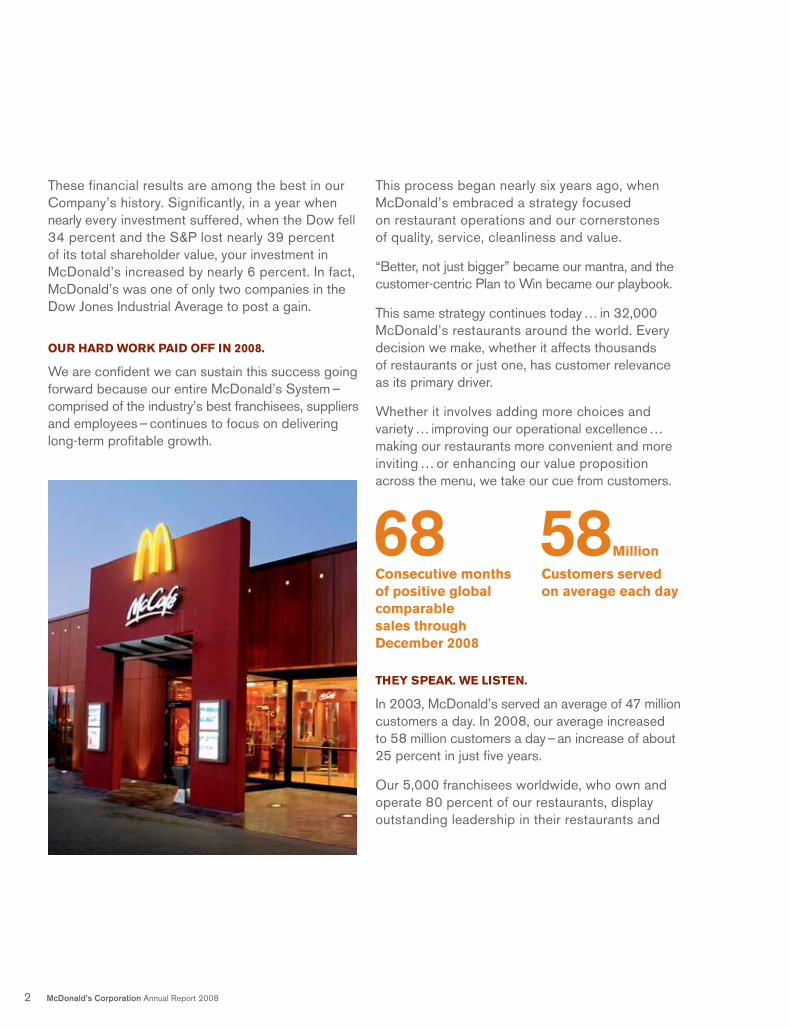
68Consecutive months of positive global comparable sales through December 2008
Customers served on average each day
58Million
These financial results are among the best in our Company’s history. Significantly, in a year when nearly every investment suffered, when the Dow fell 34 percent and the S&P lost nearly 39 percent of its total shareholder value, your investment in McDonald’s increased by nearly 6 percent. In fact, McDonald’s was one of only two companies in the Dow Jones Industrial Average to post a gain.
OUR HARD WORK PAID OFF IN 2008.
We are confident we can sustain this success going forward because our entire McDonald’s System — comprised of the industry’s best franchisees, suppliers and employees — continues to focus on delivering long-term profitable growth.
This process began nearly six years ago, when McDonald’s embraced a strategy focused on restaurant operations and our cornerstones of quality, service, cleanliness and value.
“Better, not just bigger” became our mantra, and the customer-centric Plan to Win became our playbook.
This same strategy continues today … in 32,000 McDonald’s restaurants around the world. Every decision we make, whether it affects thousands of restaurants or just one, has customer relevance as its primary driver.
Whether it involves adding more choices and variety … improving our operational excellence … making our restaurants more convenient and more inviting … or enhancing our value proposition across the menu, we take our cue from customers.
THEY SPEAK. WE LISTEN.
In 2003, McDonald’s served an average of 47 million customers a day. In 2008, our average increased to 58 million customers a day — an increase of about 25 percent in just five years.
Our 5,000 franchisees worldwide, who own and operate 80 percent of our restaurants, display outstanding leadership in their restaurants and
2 McDonald’s Corporation Annual Report 2008

communities. Our managers and crew are serving customers better than ever, as measured through our Customer Satisfaction Opportunity scores.
Our unparalleled global supply chain enables us to obtain the quality and quantity of ingredients we need at competitive and predictable prices. The collaborative relationship we have with our suppliers is a true competitive advantage, especially in today’s environment, and a key reason why we continue to achieve industry-leading restaurant-level profitability.
CASH GENERATED BY OPERATIONS
060708 $5.9
$4.9$4.3
In billions.
And our talented, experienced employees, led by President and Chief Operating Officer Ralph Alvarez and his global management team, have kept McDonald’s strategically focused on the Plan to Win.
In addition, strong financial management contributes to our profitability and returns. Whether it involves controlling our costs or investing to grow our business, McDonald’s disciplined approach provides flexibility and strength in these unprecedented financial markets. This is reflected in our healthy balance sheet and the highest credit rating in the restaurant industry, which allows us to have ready access to capital when we need it. Our financial strength is also a positive for our owner/operators and suppliers, who continue to have access to the credit needed to reinvest in their businesses.
CASH RETURNED TO SHAREHOLDERS
060708 $5.8
$5.7$4.9
Through dividends and share repurchases. In billions.
We believe the strategies we have in place continue to be exactly right for our business … and, in the future, will enable us to seize opportunities when others can’t.
I am immensely proud to be a part of this McDonald’s team. Six years ago, to recall Mr. Edison, we did not let opportunity pass us by. We rolled up our sleeves and worked together to restore pride and prosperity to the McDonald’s brand. Looking ahead to 2009 and beyond, I am confident we will maintain our momentum by continuing to focus on our customers, our restaurants and our strategy of being “better, not just bigger.”
As always, thank you for your investment in McDonald’s. We appreciate the trust you have in our Company, and we are working hard to keep it.
Sincerely,
Jim SkinnerVice Chairman and CEO
McDonald’s Corporation Annual Report 2008 3
SENIOR CORPORATE & BUSINESS UNIT OFFICERS
Ralph Alvarez* President, Chief Operating Officer
Jose Armario* Group President — Canada & Latin America
Peter Bensen* Chief Financial Officer
Peter Bush President — APMEA Pacific & South Africa Division
Mary Dillon* Global Chief Marketing Officer
Steven Easterbrook President — Europe Northern Division
Timothy Fenton* President — Asia/Pacific, Middle East & Africa
Janice Fields U.S. Chief Operations Officer
Richard Floersch* Chief Human Resources Officer
Denis Hennequin* President — Europe
James Johannesen President — U.S. Central Division
Khamzat Khasbulatov President — Europe Eastern Division
Karen King President — U.S. East Division
Bane Knezevic President — Europe Western Division
Kevin Ozan* Corporate Controller
Jean-Pierre Petit President — Europe Southern Division
Steven Plotkin President — U.S. West Division
Peter Rodwell President — APMEA Greater Asia & Middle East Division
Gloria Santona* General Counsel, Corporate Secretary
James Skinner* Vice Chairman, Chief Executive Officer
Jeffrey Stratton* Chief Restaurant Officer
Donald Thompson* President — U.S.A.
*Executive Officer
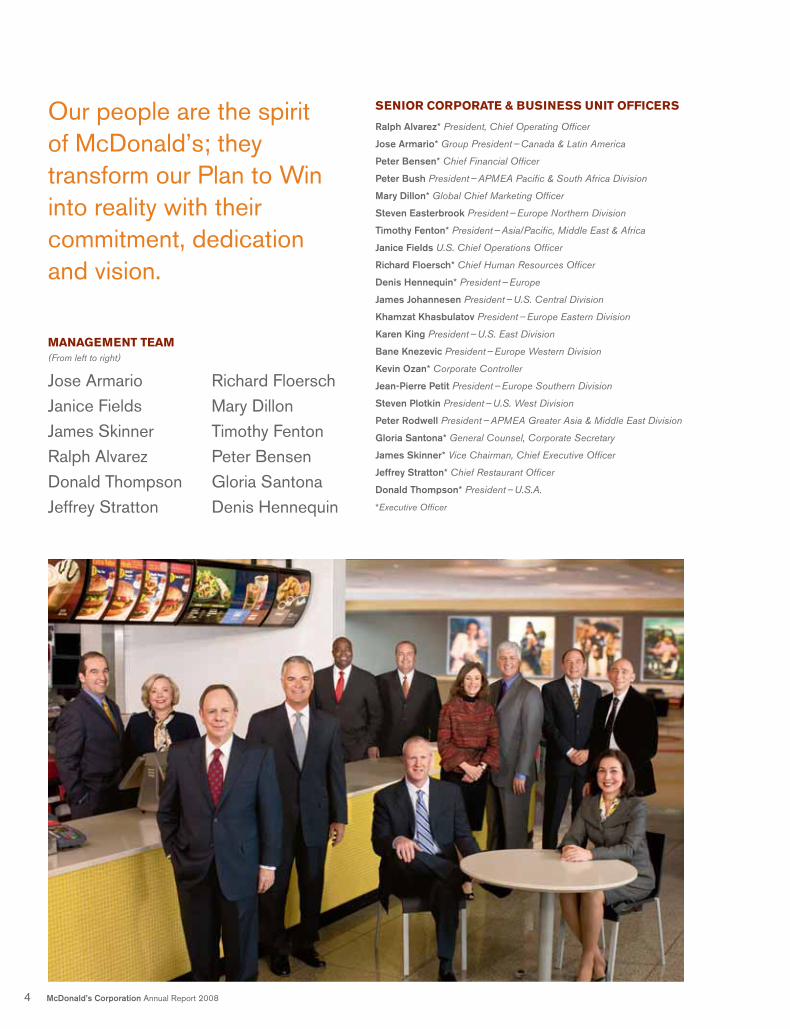
Our people are the spirit of McDonald’s; they transform our Plan to Win into reality with their commitment, dedication and vision.
MANAGEMENT TEAM(From left to right)
Jose ArmarioJanice FieldsJames SkinnerRalph AlvarezDonald ThompsonJeffrey Stratton
Richard FloerschMary DillonTimothy FentonPeter BensenGloria SantonaDenis Hennequin
4 McDonald’s Corporation Annual Report 2008

From young adults to moms, from breakfast to late night, from Beijing to Brussels to Boston, McDonald’s is firing on all cylinders.We drive our business momentum by focusing on what matters most to customers. Our owner/operators, suppliers and employees work together to meet customer needs in uniquely McDonald’s ways. The powerful combination of entrepreneurial spirit and Systemwide alignment around our Plan to Win enables us to execute the best ideas with both large - scale efficiency and local flair.
As a result, we’re delivering simple, easy and enjoyable restaurant experiences for customers and creating superior value for shareholders. Read on to learn how McDonald’s is …
On the Menu For Great Taste and Variety
On the Move For Today’s Busy Lifestyles
On the Mark For a Great Experience
On the Map As a Place to Gather
On the Money All Day Every Day
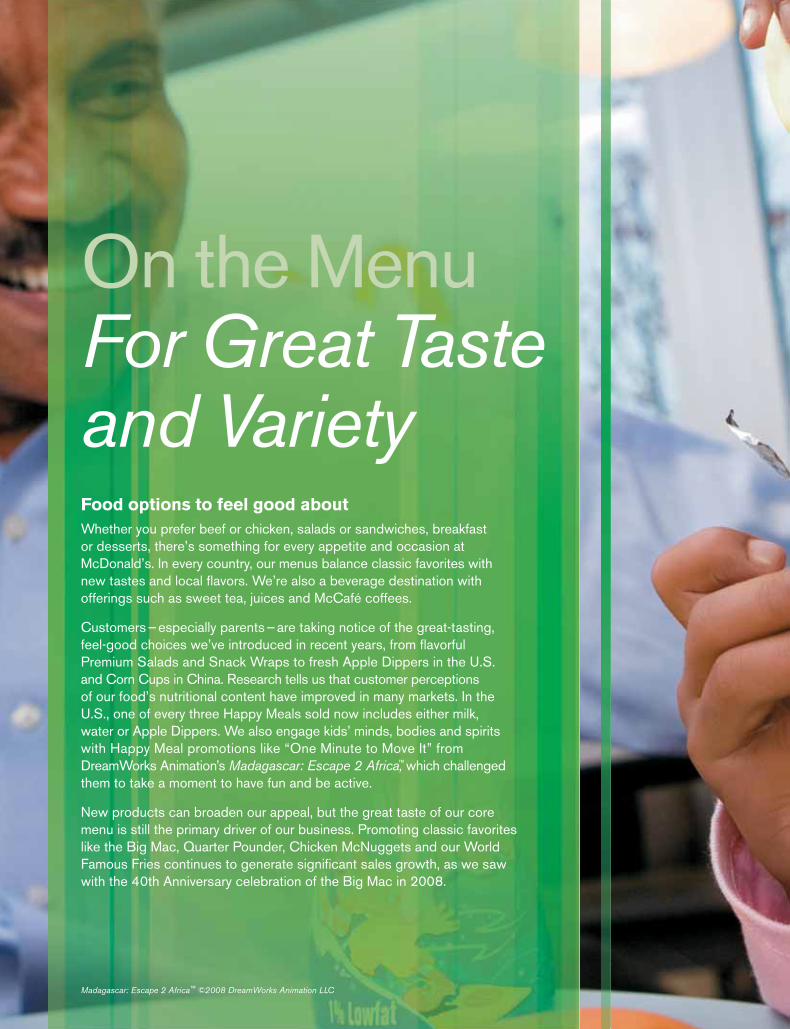
On the MenuFor Great Tasteand VarietyFood options to feel good aboutWhether you prefer beef or chicken, salads or sandwiches, breakfast or desserts, there’s something for every appetite and occasion at McDonald’s. In every country, our menus balance classic favorites with new tastes and local flavors. We’re also a beverage destination with offerings such as sweet tea, juices and McCafé coffees.
Customers — especially parents — are taking notice of the great-tasting, feel-good choices we’ve introduced in recent years, from flavorful Premium Salads and Snack Wraps to fresh Apple Dippers in the U.S. and Corn Cups in China. Research tells us that customer perceptions of our food’s nutritional content have improved in many markets. In the U.S., one of every three Happy Meals sold now includes either milk, water or Apple Dippers. We also engage kids’ minds, bodies and spirits with Happy Meal promotions like “One Minute to Move It” from DreamWorks Animation’s Madagascar: Escape 2 Africa,™ which challenged them to take a moment to have fun and be active.
New products can broaden our appeal, but the great taste of our core menu is still the primary driver of our business. Promoting classic favorites like the Big Mac, Quarter Pounder, Chicken McNuggets and our World Famous Fries continues to generate significant sales growth, as we saw with the 40th Anniversary celebration of the Big Mac in 2008.
Madagascar: Escape 2 Africa™ ©2008 DreamWorks Animation LLC

Iconic SaladsAround the world, our premium salads add variety, freshness and quality to our menu. In Europe, they appeal to both men and women and are now even more irresistible in their new packaging.
Beverage Destination Cappuccinos, lattes and mochas are part of our delicious lineup of new McCafé specialty coffees. Available at the front counter and drive-thru, McDonald’s can now provide express service to espresso lovers throughout the U.S.
Say MmmmmIn Europe, the unique beef taste and real ciabatta bread of The M from McDonald’s has boosted our image for innovation and quality. This new burger has driven sales in several European countries, including France, Germany and the U.K.

24 Hours Around the world, we aim to own the night. In Hong Kong, with 40% of our restaurants open 24/7, we’re using creative marketing and an exclusive late-night menu to build awareness and customer visits.
Delivered toYour Door Too busy to go out? Let McDonald’s come to you. Customers in 23 countries in Asia, the Middle East and Latin America can have their McDonald’s favorites delivered directly to their homes or offices.
Early Risers Earlier opening times, premium coffee and a flavorful breakfast menu have accelerated our morning momentum in the U.K. and U.S., growing sales and our market share at breakfast.

On the MoveFor Today’sBusy LifestylesEasy access all day longMore than ever, today’s busy, time-pressed consumers want the great taste of McDonald’s when, where and how they choose. We’re making it easier with convenience initiatives such as drive-thru, cashless payments, and extended or 24-hour service.
Restaurants with drive-thrus consistently achieve higher sales and returns. So, we’re seizing opportunities to make McDonald’s even more convenient by building more drive-thrus to support increasingly mobile populations in countries like China, Japan and Russia. We’re also working to optimize drive-thru speed and efficiency by repositioning crew and equipment in countries such as the U.S., U.K. and Germany.
Early birds and night owls get hungry, too. Opening earlier and closing later helped accelerate the growth of our breakfast and late-night businesses in many markets. Today, about 80% of U.S. restaurants are open by 5 a.m. and 40% are open 24/7. In Europe, nearly 80% of our restaurants open early or stay open late.
We continue to build our momentum in the growing breakfast category. Great coffee and new products such as the Bacon Roll in the U.K. are driving sales, while we’re creating new fans of portable, quick - service breakfast in China, Japan and Singapore. Today, customers can get breakfast in about 70% of our restaurants in Asia/Pacific, Middle East and Africa.

A New Classic New grill technology has solved a kitchen capacity challenge and now enables us to serve the Quarter Pounder in Japan. First introduced in Tokyo, this classic sandwich was enthusiastically welcomed by customers.
Power Alignment The alignment of our owner/operators, suppliers and employees around our customer-focused Plan to Win continues to drive our success around the world, creating great restaurant experiences for customers and bringing our brand to life in our local communities.
Crew Interactive Crew in the U.S. and Canada can connect through an online community called StationM. Available in English, Spanish and French, the site features crew blogs and opportunities to share experiences.

On the MarkFor a GreatExperienceSatisfying every customer, every timeWhether in the drive-thru or at the front counter, customers are looking for simple, easy and enjoyable McDonald’s experiences. We work to satisfy them by accurately serving hot, freshly prepared food with fast and friendly service in a clean and attractive restaurant. We consistently measure restaurant performance in these areas and address improvement opportunities with new training, equipment and processes. In 2008, we improved our customer satisfaction scores for both drive-thru and dine-in experiences in nearly all our key markets around the world.
Our back-to-basics focus also includes food improvement teams working around the world to ensure restaurants adhere to our strict food quality standards, while an emphasis on better shift management helps our restaurants run more smoothly all day long.
To maximize the effectiveness of our equipment and processes, it’s essential we have well-trained and motivated crew and managers. So, we continue to strengthen our hiring, orientation and training practices, as well as provide workplace flexibility in our restaurants to attract and retain quality employees. The data is clear: restaurants with higher levels of employee commitment create more satisfied customers and, in turn, higher sales and profits.
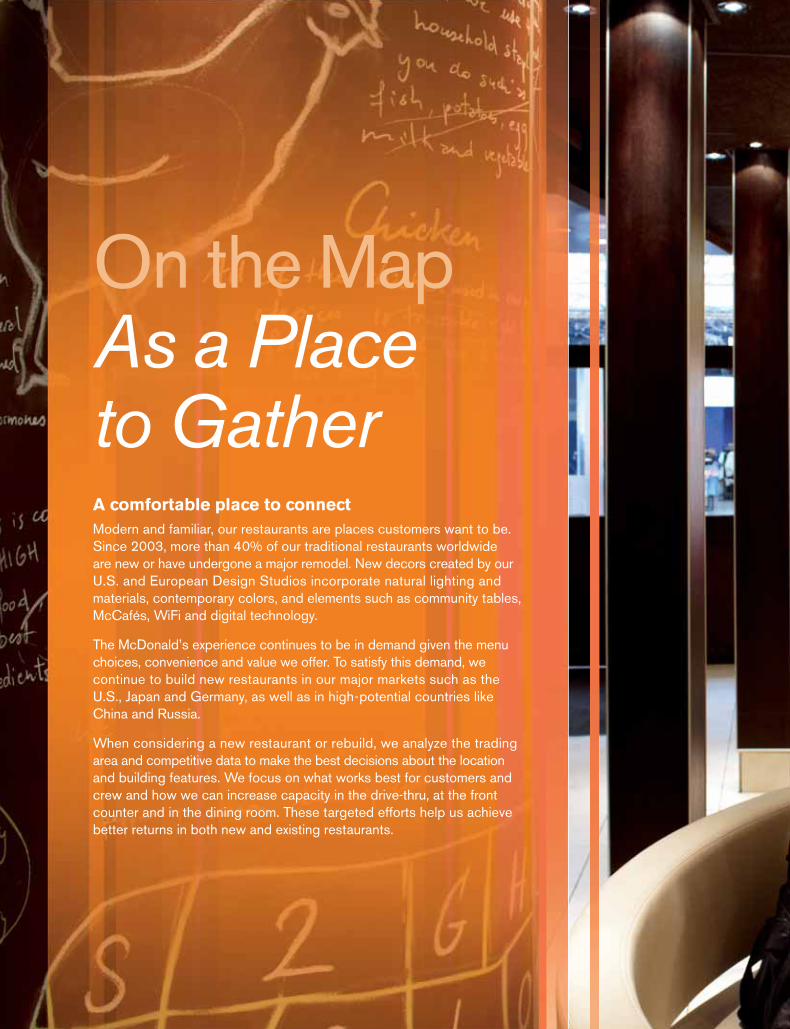
A comfortable place to connectModern and familiar, our restaurants are places customers want to be. Since 2003, more than 40% of our traditional restaurants worldwide are new or have undergone a major remodel. New decors created by our U.S. and European Design Studios incorporate natural lighting and materials, contemporary colors, and elements such as community tables, McCafés, WiFi and digital technology.
The McDonald’s experience continues to be in demand given the menu choices, convenience and value we offer. To satisfy this demand, we continue to build new restaurants in our major markets such as the U.S., Japan and Germany, as well as in high - potential countries like China and Russia.
When considering a new restaurant or rebuild, we analyze the trading area and competitive data to make the best decisions about the location and building features. We focus on what works best for customers and crew and how we can increase capacity in the drive-thru, at the front counter and in the dining room. These targeted efforts help us achieve better returns in both new and existing restaurants.
On the MapAs a Placeto Gather

Olympic Fun From the 1,400 McDonald’s Champion Crew who served athletes in our four Olympic restaurants to the debut of McDonald’s Champion Kids program, to unique menu promotions around the world, McDonald’s was the place to celebrate the Beijing 2008 Olympic Games.
Coffee Connection With more than 500 McCafé locations, McDonald’s is the largest coffee chain in Germany. Throughout Europe we have about 1,000 McCafés and we continue to add more as the popularity of our coffee builds across the continent.
Energy Savings We continue to explore ways to be more energy efficient, such as installing LED lighting, programmable thermostats and high - efficiency heating, cooling and cooking equipment. We’re also piloting green technology in Sweden, France, Denmark, Canada, Brazil, Costa Rica and the U.S.

Big Flavors,Small PricesIn France, we refreshed the P’tit Plaisirs range of small sandwiches by developing more sophisticated flavors, such as the Provençal and Oriental, and then promoting their delightfully low prices.
A Lot for a LittleCheeseburger fans in the U.S. now have more great choices. The McDouble, with two beef patties and one slice of cheese, is the new star of the Dollar Menu, while the classic Double Cheeseburger with two slices of cheese remains a best seller.
Value on the GoIn Japan, we e-mail the latest offers directly to more than 10 million customers, which is more efficient than traditional coupons. More than 150,000 customers use their mobile phones to pay for their McDonald’s meals.

Compelling value across the menuValue for the money has become even more important to consumers. For some, this means every day low prices as found on the Dollar, Value Picks or 100 Yen Menus. For others, it means surprisingly affordable premium products like salads, sandwiches or specialty coffees. No matter your McDonald’s favorite, we work to provide it to you at a great value.
Consumer desire for greater portability and snacking choices has spurred the popularity of mid-tier products such as Snack Wraps in the U.S., Europe and Japan, P’tit Plaisirs in France, Little Tasters in the U.K. and El Placer Del Momento in Latin America. Priced between value and classic menu offerings, these smaller-serving-size platforms offer a variety of tastes perfect for a lighter meal or quick snack.
Compelling value requires the right balance of quality and price. McDonald’s collaborates with suppliers to obtain fresh, high-quality ingredients for our products while, at the same time, leveraging our size and scale to achieve cost savings. We’re also using fresh food imagery on our new global packaging to communicate our commitment to quality.
On the MoneyAll DayEvery Day

Your Board of Directors believes that the Company’s winning performance is a direct reflection of the strength of McDonald’s global management team, led by Jim Skinner, Vice Chairman and CEO. Under Jim’s leadership, the Company continues to focus on decisions that enhance long-term profitable growth, talent management and leadership development, and ongoing commitment to supporting balanced, active lifestyles. These are among the factors that contribute to McDonald’s reputation as an admired and respected global company. And again this year, a variety of financial media recognized Jim’s leadership, a tribute not only to Jim, but acknowledgment of the good work of the entire organization.
Looking forward, we believe that the Company has a clear strategic vision for our business. While economic conditions throughout the world remain uncertain, the true test of any company is how it performs in tough times. At McDonald’s, this is demonstrated by the Company’s ongoing levels of excellence in operations and leadership marketing, essential qualities regard-less of the economic climate.
In addition to overseeing McDonald’s plans and performance, your Board of Directors is dedicated to maintaining strong corporate governance principles and management oversight. Our diverse team of
directors brings independent and experienced voices to our deliberations. Together, we are committed to ensuring that McDonald’s Corporation continues to deliver shareholder value.
We are proud to serve you and are confident that McDonald’s management has the dedication and enthusiasm to continue the Company’s profitable growth in the future.
Very truly yours,
Andy McKenna Chairman
Dear Fellow Shareholders:
2008 was another strong year for McDonald’s Corporation. We continue to maintain a single-minded focus on satisfying customers within the context of our proven Plan to Win.
1. Audit Committee2. Compensation Committee3. Corporate Responsibility
Committee4. Executive Committee5. Finance Committee6. Governance Committee
BOARD OF DIRECTORS
Ralph AlvarezSusan Arnold 2, 3
Robert Eckert 2, 4, 6
Enrique Hernandez, Jr.1, 4, 6
Jeanne Jackson 5, 6
Richard Lenny 2, 5
Walter Massey 1, 3 Andrew McKenna, Chairman 4, 5, 6
Cary McMillan 1, 5
Sheila Penrose 1, 3
John Rogers, Jr. 2, 3
James Skinner 4
Roger Stone 1, 5, 6
Andy McKenna, Chairman
16 McDonald’s Corporation Annual Report 2008

2008 Financial Report

2008 Financial Report19 6-year Summary20 Stock Performance Graph21 Management’s Discussion and Analysis of Financial
Condition and Results of Operations40 Consolidated Statement of Income41 Consolidated Balance Sheet42 Consolidated Statement of Cash Flows43 Consolidated Statement of Shareholders’ Equity44 Notes to Consolidated Financial Statements55 Quarterly Results (Unaudited)56 Management’s Assessment of Internal Control over
Financial Reporting57 Report of Independent Registered Public Accounting Firm58 Report of Independent Registered Public Accounting Firm
on Internal Control over Financial Reporting
18 McDonald’s Corporation Annual Report 2008
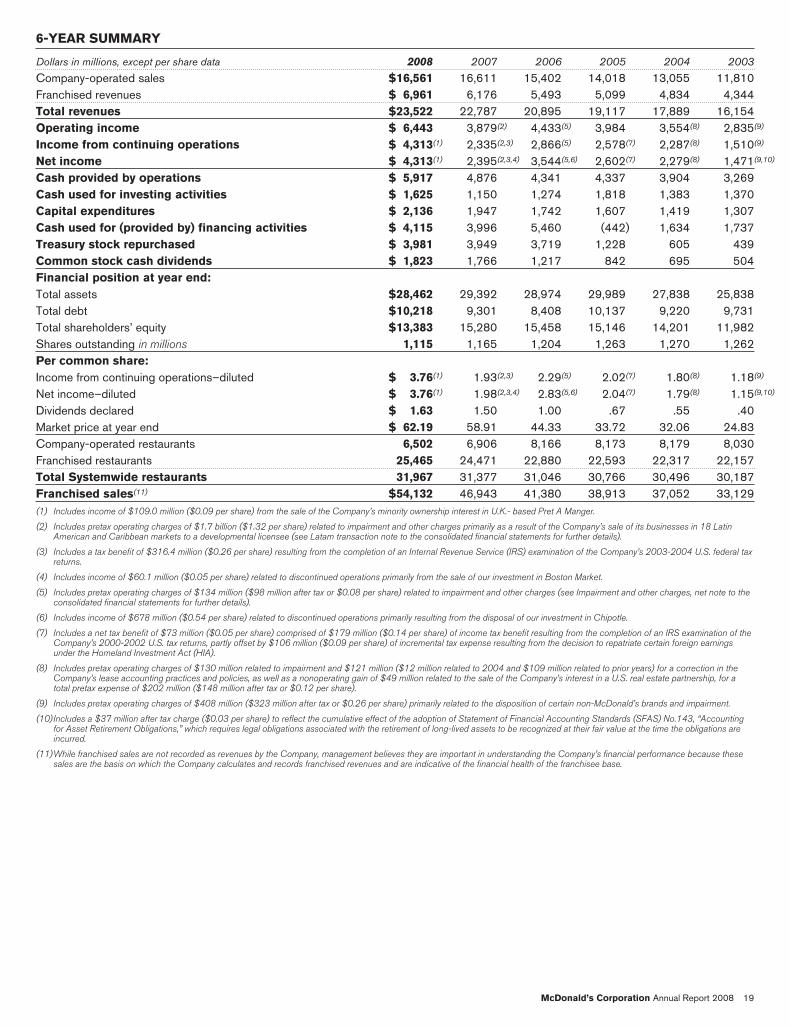
6-YEAR SUMMARY
Dollars in millions, except per share data 2008 2007 2006 2005 2004 2003Company-operated sales $16,561 16,611 15,402 14,018 13,055 11,810Franchised revenues $ 6,961 6,176 5,493 5,099 4,834 4,344Total revenues $23,522 22,787 20,895 19,117 17,889 16,154Operating income $ 6,443 3,879(2) 4,433(5) 3,984 3,554(8) 2,835(9)
Income from continuing operations $ 4,313(1) 2,335(2,3) 2,866(5) 2,578(7) 2,287(8) 1,510(9)
Net income $ 4,313(1) 2,395(2,3,4) 3,544(5,6) 2,602(7) 2,279(8) 1,471(9,10)
Cash provided by operations $ 5,917 4,876 4,341 4,337 3,904 3,269Cash used for investing activities $ 1,625 1,150 1,274 1,818 1,383 1,370Capital expenditures $ 2,136 1,947 1,742 1,607 1,419 1,307Cash used for (provided by) financing activities $ 4,115 3,996 5,460 (442) 1,634 1,737Treasury stock repurchased $ 3,981 3,949 3,719 1,228 605 439Common stock cash dividends $ 1,823 1,766 1,217 842 695 504Financial position at year end:Total assets $28,462 29,392 28,974 29,989 27,838 25,838Total debt $10,218 9,301 8,408 10,137 9,220 9,731Total shareholders’ equity $13,383 15,280 15,458 15,146 14,201 11,982Shares outstanding in millions 1,115 1,165 1,204 1,263 1,270 1,262Per common share:Income from continuing operations–diluted $ 3.76(1) 1.93(2,3) 2.29(5) 2.02(7) 1.80(8) 1.18(9)
Net income–diluted $ 3.76(1) 1.98(2,3,4) 2.83(5,6) 2.04(7) 1.79(8) 1.15(9,10)
Dividends declared $ 1.63 1.50 1.00 .67 .55 .40Market price at year end $ 62.19 58.91 44.33 33.72 32.06 24.83Company-operated restaurants 6,502 6,906 8,166 8,173 8,179 8,030Franchised restaurants 25,465 24,471 22,880 22,593 22,317 22,157Total Systemwide restaurants 31,967 31,377 31,046 30,766 30,496 30,187Franchised sales(11) $54,132 46,943 41,380 38,913 37,052 33,129(1) Includes income of $109.0 million ($0.09 per share) from the sale of the Company’s minority ownership interest in U.K.- based Pret A Manger.
(2) Includes pretax operating charges of $1.7 billion ($1.32 per share) related to impairment and other charges primarily as a result of the Company’s sale of its businesses in 18 LatinAmerican and Caribbean markets to a developmental licensee (see Latam transaction note to the consolidated financial statements for further details).
(3) Includes a tax benefit of $316.4 million ($0.26 per share) resulting from the completion of an Internal Revenue Service (IRS) examination of the Company’s 2003-2004 U.S. federal taxreturns.
(4) Includes income of $60.1 million ($0.05 per share) related to discontinued operations primarily from the sale of our investment in Boston Market.
(5) Includes pretax operating charges of $134 million ($98 million after tax or $0.08 per share) related to impairment and other charges (see Impairment and other charges, net note to theconsolidated financial statements for further details).
(6) Includes income of $678 million ($0.54 per share) related to discontinued operations primarily resulting from the disposal of our investment in Chipotle.
(7) Includes a net tax benefit of $73 million ($0.05 per share) comprised of $179 million ($0.14 per share) of income tax benefit resulting from the completion of an IRS examination of theCompany’s 2000-2002 U.S. tax returns, partly offset by $106 million ($0.09 per share) of incremental tax expense resulting from the decision to repatriate certain foreign earningsunder the Homeland Investment Act (HIA).
(8) Includes pretax operating charges of $130 million related to impairment and $121 million ($12 million related to 2004 and $109 million related to prior years) for a correction in theCompany’s lease accounting practices and policies, as well as a nonoperating gain of $49 million related to the sale of the Company’s interest in a U.S. real estate partnership, for atotal pretax expense of $202 million ($148 million after tax or $0.12 per share).
(9) Includes pretax operating charges of $408 million ($323 million after tax or $0.26 per share) primarily related to the disposition of certain non-McDonald’s brands and impairment.
(10)Includes a $37 million after tax charge ($0.03 per share) to reflect the cumulative effect of the adoption of Statement of Financial Accounting Standards (SFAS) No.143, “Accountingfor Asset Retirement Obligations,” which requires legal obligations associated with the retirement of long-lived assets to be recognized at their fair value at the time the obligations areincurred.
(11)While franchised sales are not recorded as revenues by the Company, management believes they are important in understanding the Company’s financial performance because thesesales are the basis on which the Company calculates and records franchised revenues and are indicative of the financial health of the franchisee base.
McDonald’s Corporation Annual Report 2008 19

Stock performance graphAt least annually, we consider which companies comprise a readily identifiable investment peer group. McDonald’s is included in pub-lished restaurant indices; however, unlike most other companies included in these indices, which have no or limited internationaloperations, McDonald’s does business in more than 100 countries and a substantial portion of our revenues and income is generatedoutside the U.S. In addition, because of our size, McDonald’s inclusion in those indices tends to skew the results. Therefore, we believethat such a comparison is not meaningful.
Our market capitalization, trading volume and importance in an industry that is vital to the U.S. economy have resulted in McDonald’sinclusion in the Dow Jones Industrial Average (DJIA) since 1985. Like McDonald’s, many DJIA companies generate meaningful rev-enues and income outside the U.S. and some manage global brands. Thus, we believe that the use of the DJIA companies as the groupfor comparison purposes is appropriate.
The following performance graph shows McDonald’s cumulative total shareholder returns (i.e., price appreciation and reinvestment ofdividends) relative to the Standard & Poor’s 500 Stock Index (S&P 500 Index) and to the DJIA companies for the five-year period endedDecember 31, 2008. The graph assumes that the value of an investment in McDonald’s common stock, the S&P 500 Index and the DJIAcompanies (including McDonald’s) was $100 at December 31, 2003. For the DJIA companies, returns are weighted for market capital-ization as of the beginning of each period indicated. These returns may vary from those of the Dow Jones Industrial Average Index, whichis not weighted by market capitalization, and may be composed of different companies during the period under consideration.
50
100
150
200
250
$300
‘07 ‘08‘06‘05‘04Dec ‘03
DJIA companies
S&P 500 Index
McDonald’s
Source: Standard & Poor’s Compustat
Comparison of cumulative five-year total return
281259190141131100
90142135116111100
95139128107106100
20 McDonald’s Corporation Annual Report 2008

MANAGEMENT’S DISCUSSION AND ANALYSIS OFFINANCIAL CONDITION AND RESULTS OFOPERATIONS
OVERVIEW
Description of the businessThe Company franchises and operates McDonald’s restaurants. Ofthe 31,967 restaurants in 118 countries at year-end 2008, 25,465were operated by franchisees (including 18,402 operated byconventional franchisees, 2,926 operated by developmentallicensees and 4,137 operated by foreign affiliated markets(affiliates)—primarily in Japan) and 6,502 were operated by theCompany. Under our conventional franchise arrangement, franchi-sees provide a portion of the capital required by initially investing inthe equipment, signs, seating and décor of their restaurant busi-nesses, and by reinvesting in the business over time. The Companyowns the land and building or secures long-term leases for bothCompany-operated and conventional franchised restaurant sites.This maintains long-term occupancy rights, helps control relatedcosts and assists in alignment with franchisees. Under our devel-opmental license arrangement, licensees provide capital for theentire business, including the real estate interest, while the Com-pany has no capital invested. In addition, the Company has anequity investment in a limited number of affiliates that invest in realestate and operate or franchise restaurants within a market.
We view ourselves primarily as a franchisor and continuallyreview our mix of Company-operated and franchised (conventionalfranchised, developmental licensed and affiliated) restaurants todeliver a great customer experience and drive profitability. In mostcases, franchising is the best way to achieve both goals. Althoughdirect restaurant operation is more capital-intensive relative tofranchising and results in lower restaurant margins as a percent ofrevenues, Company-operated restaurants are important to oursuccess in both mature and developing markets. In our Company-operated restaurants, and in collaboration with our franchisees, wefurther develop and refine operating standards, marketing con-cepts and product and pricing strategies, so that only those thatwe believe are most beneficial are introduced Systemwide. In addi-tion, we firmly believe that owning restaurants is paramount tobeing a credible franchisor and essential to providing Companypersonnel with restaurant operations experience. Our Company-operated business also helps to facilitate strategic changes inrestaurant ownership.
The Company’s revenues consist of sales by Company-operated restaurants and fees from restaurants operated byfranchisees. Revenues from conventional franchised restaurantsinclude rent and royalties based on a percent of sales along withminimum rent payments, and initial fees. Revenues from restau-rants licensed to affiliates and developmental licensees include aroyalty based on a percent of sales, and may include initial fees.Fees vary by type of site, amount of Company investment, if any,and local business conditions. These fees, along with occupancyand operating rights, are stipulated in franchise/license agree-ments that generally have 20-year terms.
The business is managed as distinct geographic segments.Significant reportable segments include the United States (U.S.),Europe, and Asia/Pacific, Middle East and Africa (APMEA). Inaddition, throughout this report we present “Other Countries &Corporate” that includes operations in Canada and Latin America,as well as Corporate activities. The U.S., Europe and APMEAsegments account for 34%, 42% and 18% of total revenues,
respectively. France, Germany and the United Kingdom (U.K.), col-lectively, account for approximately 55% of Europe’s revenues; andAustralia, China and Japan (a 50%-owned affiliate accounted forunder the equity method), collectively, account for over 50% ofAPMEA’s revenues. These six markets along with the U.S. andCanada are referred to as “major markets” throughout this reportand comprise over 70% of total revenues.
The Company continues to focus its management and financialresources on the McDonald’s restaurant business as we believethe opportunities for long-term growth remain significant. Accord-ingly, in second quarter 2008, the Company sold its minorityownership interest in U.K.-based Pret A Manger for $229 million.In connection with the sale, the Company recognized a non-operating gain. During the third quarter 2007, the Company soldits investment in Boston Market. In 2006, the Company disposedof its investment in Chipotle Mexican Grill (Chipotle) via publicstock offerings and a tax-free exchange for McDonald’s commonstock. As a result of the disposals during 2007 and 2006, bothBoston Market’s and Chipotle’s results of operations and trans-action gains have been reflected as discontinued operations for allperiods presented.
In analyzing business trends, management considers a varietyof performance and financial measures, including comparablesales and comparable guest count growth, Systemwide salesgrowth, restaurant margins and returns.
• Constant currency results exclude the effects of foreign cur-rency translation and are calculated by translating current yearresults at prior year average exchange rates. Managementreviews and analyzes business results in constant currenciesand bases certain incentive compensation plans on these resultsbecause they believe this better represents the Company’sunderlying business trends.
• Comparable sales and comparable guest counts are key perform-ance indicators used within the retail industry and are indicativeof acceptance of the Company’s initiatives as well as local eco-nomic and consumer trends. Increases or decreases incomparable sales and comparable guest counts represent thepercent change in sales and transactions, respectively, from thesame period in the prior year for all restaurants in operation atleast thirteen months, including those temporarily closed. Com-parable sales exclude the impact of currency translation. Someof the reasons restaurants may be temporarily closed includereimaging or remodeling, rebuilding, road construction and natu-ral disasters. McDonald’s reports on a calendar basis andtherefore the comparability of the same month, quarter and yearwith the corresponding period of the prior year will be impactedby the mix of days. The number of weekdays, weekend days andtiming of holidays in a given timeframe can have a positive ornegative impact on comparable sales and guest counts. TheCompany refers to these impacts as calendar shift/trading dayadjustments. These impacts vary geographically due toconsumer spending patterns and have the greatest effect onmonthly comparable sales and guest counts while the annualimpacts are typically minimal. In 2008, there was an incrementalfull day of sales and guest counts due to the leap year.
• Systemwide sales include sales at all restaurants, whether oper-ated by the Company or by franchisees. While sales byfranchisees are not recorded as revenues by the Company,management believes the information is important in under-standing the Company’s financial performance because thesesales are the basis on which the Company calculates and
McDonald’s Corporation Annual Report 2008 21
records franchised revenues and are indicative of the financialhealth of our franchisee base.
• Return on incremental invested capital (ROIIC) is a measurereviewed by management over one-year and three-year timeperiods to evaluate the overall profitability of the business units,the effectiveness of capital deployed and the future allocation ofcapital. The return is calculated by dividing the change in operat-ing income plus depreciation and amortization (numerator) bythe adjusted cash used for investing activities (denominator),primarily capital expenditures. The calculation assumes a con-stant average foreign exchange rate over the periods included inthe calculation.
Strategic direction and financial performanceThe strength of the alignment between the Company, its franchi-sees and suppliers (collectively referred to as the System) hasbeen key to McDonald’s success over the years. This businessmodel enables McDonald’s to consistently deliver locally-relevantrestaurant experiences to customers and be an integral part of thecommunities we serve. In addition, it facilitates our ability to identi-fy, implement and scale innovative ideas that meet our customers’changing needs and preferences.
McDonald’s customer-centered Plan to Win — which isfocused on being better, not just bigger — provides a commonframework for our restaurants yet allows for local adaptation. ThePlan facilitates the execution of multiple initiatives surrounding thefive factors of exceptional customer experiences — people, prod-ucts, place, price and promotion. Through the execution of theseinitiatives, we have enhanced the McDonald’s experience for cus-tomers worldwide, growing sales and guest counts in each of thelast five years. This Plan, coupled with financial discipline, hasdelivered strong results for shareholders.
We have exceeded our long-term, constant currency financialtargets of average annual Systemwide sales and revenue growthof 3% to 5%; average annual operating income growth of 6% to7%; and annual returns on incremental invested capital in the highteens every year since the Plan’s implementation in 2003, afteradjusting 2007 for the Latin America developmental licensetransaction. Given the size and scope of our global business, webelieve these financial targets are realistic and sustainable,enabling us to focus on those opportunities that best optimizelong-term shareholder value.
In 2008, we continued to focus on our key global successfactors of branded affordability, menu variety and beverage choice,convenience and daypart expansion, ongoing restaurant reinvest-ment and operations excellence. Locally-relevant initiatives aroundeach of these success factors resonated with consumers’ increas-ingly busy lifestyles and their growing demand for menu variety,value and simple, enjoyable eating-out experiences. As a result,every area of the world contributed to 2008 global comparablesales and guest counts increasing 6.9% and 3.1%, respectively,despite a challenging economic environment in many countries.
In the U.S., we continued to drive sales higher and increase ourshare of the informal eating-out market in 2008 due to ourongoing focus on breakfast, chicken, beverages, convenience andbranded affordability. We extended our leadership in the breakfastand chicken categories with the launch of the Southern StyleChicken Biscuit for breakfast and Southern Style Chicken Sand-wich for the remainder of the day. We profitably built greater visitfrequency by leveraging our convenient locations, extended hours,drive-thru service and value-oriented local beverage promotions
that often featured our popular Iced Coffee and Sweet Tea. As partof our multi-year strategy to take advantage of the significant andgrowing beverage category, we began rolling-out espresso-basedhot and cold specialty coffees. At year-end 2008, over 7,000 res-taurants were offering the new specialty coffees, and we expect tocomplete the roll-out in mid-2009. To accommodate the relatednew equipment as well as enable potential future offerings such assmoothies, frappes and bottled beverages, construction is requiredin many restaurants. In most cases this construction also involvesexpanding and optimizing the efficiency of our drive-thru booth,which enables us to better serve even more customers, faster. TheCompany is investing capital to fund a portion of this construction-related reinvestment for franchised restaurants.
In Europe, we posted record-high comparable sales growth in2008. Every country contributed to this performance, which wasled by France, the U.K., Russia and Germany. This success wasdriven in part by greater local customer relevance created by ourtiered menu approach, featuring an effective combination of pre-mium selections, classic menu favorites, everyday value andpopular limited-time food promotions. We also connected withcustomers throughout the day with new sandwiches such as theBacon Roll for breakfast in the U.K. and premium M burger inFrance, Germany and the U.K. We continued upgrading theMcDonald’s experience by reimaging more than 650 locations,primarily in the U.K. and Germany. In addition, we continued theroll-out of a new kitchen operating system — currently in about5,000 of our European restaurants — to enhance operational effi-ciency and support greater menu variety. Open communication andtransparency is especially important to European consumers. Tobuild brand trust, we actively communicated the facts aboutMcDonald’s as an employer and highlighted the quality andnutrition of our food with the early launch of the Company’s newglobal packaging design.
In APMEA, our momentum continued with nearly every countrydelivering positive comparable sales, driven by Australia, Japan andChina. In addition, aggressive restaurant development in China —where we opened our 1,000th restaurant — contributed to rev-enue growth. Our performance was driven by strategic initiativessurrounding convenience, breakfast, core menu extensions andvalue. We further enhanced McDonald’s convenience with drive-thru and delivery service, as well as expansion of extended hoursto 60% (or about 5,000) of our restaurants in APMEA. We built onthe momentum of our breakfast business, currently in 70% of ourrestaurants in APMEA, by raising customer awareness, trial andvisit frequency with relevant marketing and new menu offeringslike the egg, tomato and pepper McPuff in China. We also con-tinued to appeal to customers with branded affordability platformsand locally-relevant new product launches such as the premiumchicken line in Australia and New Zealand.
Our customer-centered strategies to drive global momentumalso consider price and product mix as a means to enhancerestaurant profitability. This approach is complemented by a focuson optimizing restaurant operations and effectively managing foodand paper costs by leveraging our scale, supply chain infra-structure and risk management strategies. As a result, amid avolatile commodity environment, McDonald’s delivered con-solidated Company-operated restaurant margins of 17.6% – itshighest in nine years.
Strong sales and margin performance positively impactedgrowth in cash from operations, which rose $1 billion to$5.9 billion in 2008. Our substantial cash flow, strong credit ratingand continued access to credit provides us significant flexibility to
22 McDonald’s Corporation Annual Report 2008

fund capital expenditures and debt repayments as well as returncash to shareholders.
In 2008, capital expenditures of $2.1 billion were primarilyused to open 995 restaurants (590 net, after 405 closings) andreimage 1,450 locations. In addition, we believe strongly in return-ing cash to shareholders via dividends and share repurchases. In2008, we returned $5.8 billion to shareholders, consisting of$1.8 billion in dividends and $4.0 billion in share repurchases. Thisbrings total cash returned to $11.5 billion under our 2007-2009$15 billion to $17 billion target. We are confident we will achievethis cash return target given the ongoing strength and stability ofcash from operations and our continued evolution toward a moreheavily franchised, less capital-intensive business model.
We believe locally-owned and operated restaurants are at thecore of our competitive advantage, making us not just a globalbrand but also a locally relevant one. In addition, an optimized mixof franchised and Company-operated restaurants helps to max-imize brand performance and further enhance the reliability of ourcash flow and returns. To that end, in August 2007, the Companycompleted the sale of its businesses in Brazil, Argentina, Mexico,Puerto Rico, Venezuela and 13 other countries in Latin Americaand the Caribbean, which totaled 1,571 restaurants, to a devel-opmental licensee organization. Under the new ownershipstructure, the Company receives royalties in these markets insteadof a combination of Company-operated sales and franchised rentsand royalties.
In addition, in 2007 we set a three-year target to refranchise1,000 to 1,500 existing Company-operated restaurants between2008 and 2010, primarily in our major markets. In 2008, werefranchised about 675 restaurants, increasing the percent offranchised restaurants worldwide to 80% from 78% at year-end2007. This transition to a greater percentage of franchised restau-rants is expected to affect consolidated financial statements asfollows:
• A negative impact on consolidated revenues as Company-operated sales shift to franchised sales where we receive rentand/or royalties, along with initial fees.
• A decrease in Company-operated margin dollars and anincrease in franchised margin dollars, while margin percentageswill vary based on sales and cost structures of refranchised res-taurants.
• Fluctuations in Other Operating (Income) Expense due to gainsand/or losses resulting from sales of restaurants.
• An increase in combined operating margin percent.
• An increase in return on average assets due primarily to adecrease in average asset balances.
Highlights from the year included:• Comparable sales grew 6.9% and guest counts rose 3.1%, build-
ing on 2007 increases of 6.8% and 3.8%, respectively.• Systemwide sales increased 11% (9% in constant currencies).• Company-operated margins improved to 17.6% and franchised
margins improved to 82.3%.• Net income per share from continuing operations was $3.76, an
increase of 16% after adjusting for the impact of the 2007 LatinAmerica transaction.
• Cash provided by operations totaled $5.9 billion and capitalexpenditures totaled $2.1 billion.
• Returned $5.8 billion to shareholders through sharesrepurchased and dividends paid, including a 33% increase in thequarterly cash dividend to $0.50 per share for the fourth quarter– bringing our current annual dividend rate to $2.00 per share.
• One-year ROIIC was 38.9% and three-year ROIIC was 37.5%for 2008.
Outlook for 2009We will continue to drive success in 2009 and beyond by remain-ing focused on being better, not just bigger. We will do so byfurther enhancing our understanding of consumers’ needs andwants; facilitating greater sharing and adoption of best practicesand new ideas worldwide; and leveraging a strategic approach toimplementing initiatives to drive the best bottom-line impact.
Despite challenging economic conditions, the McDonald’sSystem is energized by our current worldwide momentum. We willcontinue to build on our strength in five key areas: maintaining thebalance between price and value; maximizing the benefit of avail-able capital by improving the relevance and contemporary feel ofour existing restaurants; leveraging the equity and unique tastes ofcore menu favorites like the Big Mac, the Quarter Pounder withCheese and our world-famous French Fries; continuing our finan-cial discipline and evaluation of success measures to ensure thesemeasures are driving actions that positively impact our restaurants;and furthering operations excellence by focusing on improvedexecution. As we do so, we are confident we can meet or exceedthe long-term constant currency financial targets previously dis-cussed.
In the U.S., our 2009 focus is to continue to build relevanceand loyalty by staying connected to customers’ needs for menuvariety and beverage choice, everyday affordability and con-venience. Our initiatives will include reminding customers of theenduring appeal of menu classics such as the Big Mac andencouraging trial of new sandwich and beverage options includingspecialty coffees. Also in 2009, we will continue to offer valueacross our menu from the Dollar Menu to our premium products,as well as our classic menu favorites and mid-tier offerings such asour Double Cheeseburger and Snack Wraps. These initiativescombined with the convenience of our locations, optimized drive-thru service, cashless transactions and longer operating hours willreinforce McDonald’s position as our customers’ preferred placeand way to eat.
Our priorities in Europe remain upgrading the customer andemployee experience, enhancing local relevance and buildingbrand transparency. In 2009, we will continue upgrading ourrestaurants’ ambiance through reimaging, including adding another200 McCafes primarily in Germany and France. In addition, we willfocus on optimizing our drive-thru service, completing the con-version of our kitchen operating system in most Europeanrestaurants and increasing total locations offering extended and24-hour service. We also will strengthen our local relevance bycomplementing our tiered menu with new products and a relevantvariety of limited-time food events featuring beef, chicken, dessertsand coffee selections. In the area of brand transparency, we willremain open and accessible and will continue to inform consumersabout our food quality and reputation as an employer.
In APMEA, our goal is to be consumers’ first choice when eatingout. To achieve this goal, locally-relevant strategies surroundingconvenience, breakfast and branded affordability are essential inthis diverse and dynamic part of the world. Convenience initiativesinclude leveraging the success of 24-hour or extended operatinghours, offering delivery service and building our drive-thru
McDonald’s Corporation Annual Report 2008 23
traffic. We will also aggressively continue to open new restaurantsin China. We will further build our breakfast business in APMEA byincreasing the number of locations where it is served, utilizinginnovative marketing support and launching new products. At thesame time, we will continue to highlight our classic menu favoritesand offer locally-relevant extensions of these products. In addition,we are further leveraging a strategic pricing tool to optimize menuprices to drive sales and profits.
In 2009, we will continue to optimize the mix of franchised andCompany-operated restaurants and will refranchise restaurantsunder the previously mentioned target. The speed with which wemake progress toward this goal will depend on our ability toidentify the appropriate prospective franchisees with the experi-ence and financial resources in the relevant markets. We will alsocontinue to evaluate several small markets in APMEA and Europefor potential transition to developmental license structures. We willonly convert such markets when we believe that we have identifieda qualified licensee and our business is ready for transition tooptimize the transaction for the long-term.
As previously discussed, our evolution toward a more heavilyfranchised, less capital-intensive business model has favorableimplications for the amount of capital we invest, the strength andstability of our cash flow and our long-term returns. As a result, weexpect free cash flow — cash from operations less capitalexpenditures — will continue to grow and be a significant source tofund total cash returned to shareholders. In addition, we expect ourshare repurchase activity will continue to yield reductions in ouroutstanding share count.
Finally, we will continue to be disciplined financially, remainingdiligent about how and where we invest capital and selling, generaland administrative expenses to grow our business. Consistent withthe last few years, to drive sales and returns we will allocate nearly50% of our $2.1 billion of planned 2009 capital expenditurestoward reinvestments in existing restaurants, mainly related to thereimaging of locations in Europe and the rollout of the beveragestrategy in the U.S. The remainder of our capital expenditures willprimarily be used to build new locations.
McDonald’s does not provide specific guidance on net incomeper share. The following information is provided to assist in analyz-ing the Company’s results:
• Changes in Systemwide sales are driven by comparable salesand net restaurant unit expansion. The Company expects netrestaurant additions to add nearly 2 percentage points to 2009Systemwide sales growth (in constant currencies), most of whichwill be due to the 709 net traditional restaurants added in 2008.
• The Company does not generally provide specific guidance onchanges in comparable sales. However, as a perspective, assum-ing no change in cost structure, a 1 percentage point increase incomparable sales for either the U.S. or Europe would increaseannual net income per share by about 3 cents.
• With about 75% of McDonald’s grocery bill comprised of 10different commodities, a basket of goods approach is the mostcomprehensive way to look at the Company’s commodity costs.For the full year 2009, the total basket of goods is expected torise about 5% to 5.5% in the U.S. and about 4% to 4.5% inEurope with more of this pressure occurring in the first half ofthe year. Some volatility may be experienced between quartersin the normal course of business.
• The Company expects full-year 2009 selling, general & admin-istrative expenses to decline, in constant currencies, althoughfluctuations may be experienced between quarters due to cer-tain items in 2008 such as the biennial Worldwide Owner/Operator Convention and the Beijing Summer Olympics.
• Based on current interest and foreign currency exchange rates,the Company expects interest expense in 2009 to be relativelyflat compared with 2008. Interest income in 2009 is expected todecrease about 80% compared with 2008 due to expectedlower average interest rates and average cash balances.
• A significant part of the Company’s operating income is gen-erated outside the U.S., and about 45% of its total debt isdenominated in foreign currencies. Accordingly, earnings areaffected by changes in foreign currency exchange rates, partic-ularly the Euro, British Pound, Australian Dollar and CanadianDollar. Collectively, these currencies represent approximately70% of the Company’s operating income outside the U.S. If allfour of these currencies moved by 10% in the same directioncompared with 2008, the Company’s annual net income pershare would change by about 12 to 15 cents. Due to the recentstrengthening of the U.S. Dollar relative to virtually all foreigncurrencies, full year 2009 revenues and operating income willlikely be negatively impacted by foreign currency translation.
• The Company expects the effective income tax rate for the full-year 2009 to be approximately 29% to 31%. In the normalcourse of business and based on the timing of certain trans-actions and events, some volatility may be experienced betweenthe quarters resulting in a quarterly tax rate that is outside theannual range.
• The Company expects capital expenditures for 2009 to beapproximately $2.1 billion. About half of this amount will bereinvested in existing restaurants while the rest will primarily beused to open about 1,000 restaurants (950 traditional and 50satellites). The Company expects net additions of about 650restaurants (750 net traditional additions and 100 net satelliteclosings). These restaurant numbers include new unit openings(approximately 30%) in affiliated and developmental licensedmarkets, such as Japan and Latin America, where the Companydoes not fund any capital expenditures.
• For 2007 through 2009, the Company expects to return$15 billion to $17 billion to shareholders through sharerepurchases and dividends, subject to business and marketconditions. For 2007 and 2008 combined, the Companyreturned $11.5 billion to shareholders.
• The Company continually reviews its restaurant ownership struc-tures to optimize cash flow and returns and to enhance localrelevance. The Company expects to refranchise 1,000 to 1,500Company-operated restaurants between 2008 and 2010,primarily in its major markets, and by continuing to utilize itsdevelopmental license strategy. In 2008, the Company refran-chised about 675 restaurants, primarily in its major markets.
• In February 2009, consistent with its focus on the McDonald’srestaurant business, McDonald’s agreed to sell its minority inter-est in Redbox Automated Retail, LLC, an automated DVD rentalservice. The Company expects to recognize a nonoperating gainupon the closing of the transaction in first quarter 2009.
24 McDonald’s Corporation Annual Report 2008
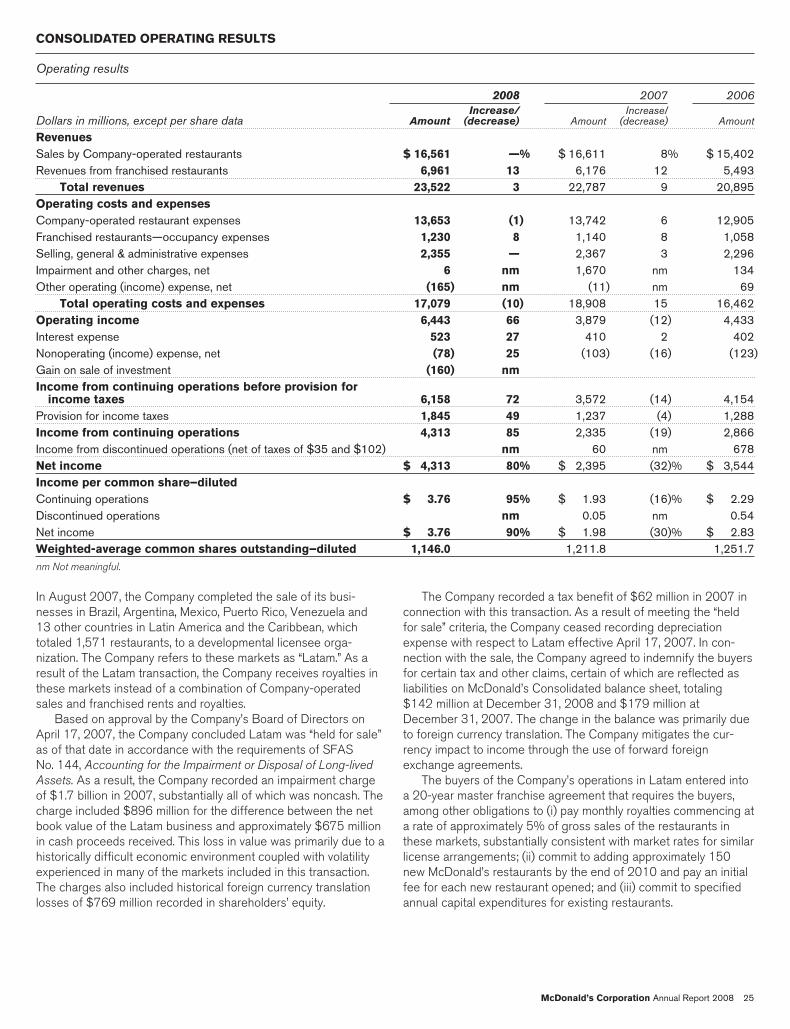
CONSOLIDATED OPERATING RESULTS
Operating results
2008 2007 2006
Dollars in millions, except per share data AmountIncrease/
(decrease) AmountIncrease/
(decrease) Amount
RevenuesSales by Company-operated restaurants $ 16,561 —% $ 16,611 8% $ 15,402Revenues from franchised restaurants 6,961 13 6,176 12 5,493
Total revenues 23,522 3 22,787 9 20,895Operating costs and expensesCompany-operated restaurant expenses 13,653 (1) 13,742 6 12,905Franchised restaurants—occupancy expenses 1,230 8 1,140 8 1,058Selling, general & administrative expenses 2,355 — 2,367 3 2,296Impairment and other charges, net 6 nm 1,670 nm 134Other operating (income) expense, net (165) nm (11) nm 69
Total operating costs and expenses 17,079 (10) 18,908 15 16,462Operating income 6,443 66 3,879 (12) 4,433Interest expense 523 27 410 2 402Nonoperating (income) expense, net (78) 25 (103) (16) (123)Gain on sale of investment (160) nmIncome from continuing operations before provision for
income taxes 6,158 72 3,572 (14) 4,154Provision for income taxes 1,845 49 1,237 (4) 1,288Income from continuing operations 4,313 85 2,335 (19) 2,866Income from discontinued operations (net of taxes of $35 and $102) nm 60 nm 678Net income $ 4,313 80% $ 2,395 (32)% $ 3,544Income per common share–dilutedContinuing operations $ 3.76 95% $ 1.93 (16)% $ 2.29Discontinued operations nm 0.05 nm 0.54Net income $ 3.76 90% $ 1.98 (30)% $ 2.83Weighted-average common shares outstanding–diluted 1,146.0 1,211.8 1,251.7nm Not meaningful.
In August 2007, the Company completed the sale of its busi-nesses in Brazil, Argentina, Mexico, Puerto Rico, Venezuela and13 other countries in Latin America and the Caribbean, whichtotaled 1,571 restaurants, to a developmental licensee orga-nization. The Company refers to these markets as “Latam.” As aresult of the Latam transaction, the Company receives royalties inthese markets instead of a combination of Company-operatedsales and franchised rents and royalties.
Based on approval by the Company’s Board of Directors onApril 17, 2007, the Company concluded Latam was “held for sale”as of that date in accordance with the requirements of SFASNo. 144, Accounting for the Impairment or Disposal of Long-lived
Assets. As a result, the Company recorded an impairment chargeof $1.7 billion in 2007, substantially all of which was noncash. Thecharge included $896 million for the difference between the netbook value of the Latam business and approximately $675 millionin cash proceeds received. This loss in value was primarily due to ahistorically difficult economic environment coupled with volatilityexperienced in many of the markets included in this transaction.The charges also included historical foreign currency translationlosses of $769 million recorded in shareholders’ equity.
The Company recorded a tax benefit of $62 million in 2007 inconnection with this transaction. As a result of meeting the “heldfor sale” criteria, the Company ceased recording depreciationexpense with respect to Latam effective April 17, 2007. In con-nection with the sale, the Company agreed to indemnify the buyersfor certain tax and other claims, certain of which are reflected asliabilities on McDonald’s Consolidated balance sheet, totaling$142 million at December 31, 2008 and $179 million atDecember 31, 2007. The change in the balance was primarily dueto foreign currency translation. The Company mitigates the cur-rency impact to income through the use of forward foreignexchange agreements.
The buyers of the Company’s operations in Latam entered intoa 20-year master franchise agreement that requires the buyers,among other obligations to (i) pay monthly royalties commencing ata rate of approximately 5% of gross sales of the restaurants inthese markets, substantially consistent with market rates for similarlicense arrangements; (ii) commit to adding approximately 150new McDonald’s restaurants by the end of 2010 and pay an initialfee for each new restaurant opened; and (iii) commit to specifiedannual capital expenditures for existing restaurants.
McDonald’s Corporation Annual Report 2008 25

In addition to the consolidated operating results shown on the previous page, consolidated results for 2007 and adjusted growthrates for 2008 and 2007 are presented in the following table excluding the impact of the Latam transaction. These results include theeffect of foreign currency translation further discussed in the section titled Impact of foreign currency translation on reported results.While the Company has converted certain other markets to a developmental license arrangement, management believes the Latamtransaction and the associated charge are not indicative of ongoing operations due to the size and scope of the transaction. Managementbelieves that the adjusted operating results better reflect the underlying business trends relevant to the periods presented.
Dollars in millions, except per share data 2008 2007(1)Latam
Transaction(1)
2007Excluding
LatamTransaction 2006
2008Adjusted
% Inc
2007Adjusted
% Inc
Operating income $6,443 $3,879 $(1,641) $5,520 $4,433 17 25Income from continuing operations 4,313 2,335 (1,579) 3,914 2,866 10 37Income from discontinued operations 60 60 678 nm nmNet income 4,313 2,395 (1,579) 3,974 3,544 9 12Income per common share – diluted
Continuing operations(2,3) 3.76 1.93 (1.30) 3.23 2.29 16 41Discontinued operations 0.05 0.05 0.54 nm nmNet income(2,3) 3.76 1.98 (1.30) 3.28 2.83 15 16nm Not meaningful.
(1) The results for the full year 2007 included impairment and other charges of $1,665 million, partly offset by a benefit of $24 million due to eliminating depreciation on the assets in Latamin mid-April 2007, and a tax benefit of $62 million.
(2) The following items impact the comparison of adjusted growth in diluted income per share from continuing operations and diluted net income per share for the year ended December 31,2008 compared with 2007. On a net basis, these items negatively impact the comparison by 7 and 6 percentage points, respectively:
2008
• $0.09 per share gain on the sale of the Company’s minority interest in Pret A Manger.
2007
• $0.26 per share of income tax benefit resulting from the completion of an Internal Revenue Service (IRS) examination of the Company’s 2003-2004 U.S. federal income tax returns;partly offset by
• $0.02 per share of income tax expense related to the impact of a tax law change in Canada.
(3) The following items impact the comparison of adjusted growth in diluted income per share from continuing operations and diluted net income per share for the year ended December 31,2007 compared with 2006. On a net basis, these items positively impact the comparison by 15 and 12 percentage points, respectively:
2007
• $0.26 per share of income tax benefit resulting from the completion of an IRS examination of the Company’s 2003-2004 U.S. federal income tax returns; partly offset by
• $0.02 per share of income tax expense related to the impact of a tax law change in Canada.
2006
• $0.08 per share of operating expenses primarily related to strategic actions taken to enhance overall profitability and improve returns; and
• $0.01 per share of incremental income tax expense primarily related to the impact of a tax law change in Canada.
Net income and diluted net income per common shareIn 2008, net income and diluted net income per common sharewere $4.3 billion and $3.76. Results benefited by a $109 million,or $0.09 per share, gain on the sale of the Company’s minorityinterest in Pret A Manger.
In 2007, net income and diluted net income per common sharewere $2.4 billion and $1.98. Income from continuing operationswas $2.3 billion or $1.93 per share, which included $1.6 billion or$1.30 per share of net expense related to the Latam transaction.This reflects an impairment charge of $1.32 per share, partly offsetby a $0.02 per share benefit due to eliminating depreciation on theassets in Latam in mid-April 2007 in accordance with accountingrules. In addition, 2007 results included a net tax benefit of$288 million or $0.24 per share resulting from the completion ofan IRS examination of the Company’s 2003-2004 U.S. federalincome tax returns, partly offset by the impact of a tax law change
in Canada. Income from discontinued operations was $60 millionor $0.05 per share.
In 2006, net income and diluted net income per common sharewere $3.5 billion and $2.83. Income from continuing operationswas $2.9 billion or $2.29 per share, which included $134 million($98 million after tax or $0.08 per share) of impairment and othercharges primarily related to strategic actions taken to enhanceoverall profitability and improve returns, as well as $0.01 per shareof net incremental income tax expense primarily related to theimpact of a tax law change in Canada. Income from discontinuedoperations was $678 million or $0.54 per share.
Refer to the Impairment and other charges, net and Dis-continued operations sections for further discussion.
The Company repurchased 69.7 million shares of its stock for$4.0 billion in 2008 and 77.1 million shares for $3.9 billion in2007, driving reductions of over 4% and 3% of total shares out-standing, respectively, net of stock option exercises.
26 McDonald’s Corporation Annual Report 2008

Impact of foreign currency translation on reported resultsWhile changing foreign currencies affect reported results, McDonald’s mitigates exposures, where practical, by financing in local curren-cies, hedging certain foreign-denominated cash flows, and purchasing goods and services in local currencies.
In 2008, foreign currency translation had a positive impact on consolidated operating results, driven by the stronger Euro and mostother currencies, partly offset by the weaker British Pound. However, in fourth quarter 2008, the U.S. Dollar strengthened significantlyagainst nearly every foreign currency, reducing the full year foreign currency benefit. Due to this strengthening, full year 2009 revenuesand operating income will likely be negatively impacted by foreign currency translation. In 2007, foreign currency translation had a pos-itive impact on consolidated operating results, primarily driven by the stronger Euro, British Pound, Australian Dollar and Canadian Dollar.In 2006, consolidated operating results were positively impacted by the stronger Euro, Canadian Dollar and British Pound.
Impact of foreign currency translation on reported results
Reported amount Currency translation benefit/(cost)In millions, except per share data 2008 2007 2006 2008 2007 2006
Revenues $23,522 $22,787 $20,895 $441 $988 $271Company-operated margins 2,908 2,869 2,497 63 129 35Franchised margins 5,731 5,036 4,435 120 179 23Selling, general & administrative expenses 2,355 2,367 2,296 (21) (73) (19)Operating income 6,443 3,879 4,433 163 230 29Income from continuing operations 4,313 2,335 2,866 103 138 18Net income 4,313 2,395 3,544 103 138 18Income from continuing operations per common share—diluted 3.76 1.93 2.29 .09 .12 .02Net income per common share—diluted 3.76 1.98 2.83 .09 .12 .01
RevenuesThe Company’s revenues consist of sales by Company-operated restaurants and fees from restaurants operated by franchisees. Rev-enues from conventional franchised restaurants include rent and royalties based on a percent of sales along with minimum rentpayments, and initial fees. Revenues from restaurants licensed to affiliates and developmental licensees include a royalty based on apercent of sales, and may include initial fees.
In both 2008 and 2007, consolidated revenue growth was driven by positive comparable sales as well as stronger foreign currencies.Revenue growth in both years was negatively impacted by the Latam transaction. Upon completion of the Latam transaction inAugust 2007, the Company receives royalties based on a percent of sales in these markets instead of a combination of Company-operated sales and franchised rents and royalties. Revenue growth in 2008 was also partly offset by the impact of the refranchisingstrategy in certain of the Company’s major markets, which resulted in a higher proportion of franchised restaurants compared with 2007.
Revenues
Amount Increase/(decrease)
Increase/(decrease)excluding currency
translationDollars in millions 2008 2007 2006 2008 2007 2008 2007
Company-operated sales:U.S. $ 4,636 $ 4,682 $ 4,410 (1)% 6% (1)% 6%Europe 7,424 6,817 5,885 9 16 6 7APMEA 3,660 3,134 2,674 17 17 14 12Other Countries & Corporate 841 1,978 2,433 (57) (19) (58) (23)
Total $16,561 $16,611 $15,402 –% 8% (2)% 3%Franchised revenues:U.S. $ 3,442 $ 3,224 $ 3,054 7% 6% 7% 6%Europe 2,499 2,109 1,753 18 20 13 10APMEA 571 465 379 23 22 20 14Other Countries & Corporate 449 378 307 19 24 17 17
Total $ 6,961 $ 6,176 $ 5,493 13% 12% 10% 8%Total revenues:U.S. $ 8,078 $ 7,906 $ 7,464 2% 6% 2% 6%Europe 9,923 8,926 7,638 11 17 7 8APMEA 4,231 3,599 3,053 18 18 15 12Other Countries & Corporate 1,290 2,356 2,740 (45) (14) (46) (18)
Total $23,522 $22,787 $20,895 3% 9% 1% 4%
McDonald’s Corporation Annual Report 2008 27
In the U.S., the increases in revenues in 2008 and 2007 wereprimarily driven by our market-leading breakfast business and theongoing appeal of new products, as well as continued focus oneveryday value and convenience. New products introduced in2008 included Southern Style Chicken products, Iced Coffee andSweet Tea, while new products introduced in 2007 included theSouthwest Salad and an extended Snack Wrap line. In 2008, rev-enue growth was largely offset by the impact of the refranchisingstrategy.
Europe’s constant currency increase in revenues in 2008 and2007 was primarily due to strong comparable sales in Russia(which is entirely Company-operated), France and the U.K., as wellas positive comparable sales in all other markets. These increaseswere partly offset by the impact of the refranchising strategy, pri-marily in the U.K. and Germany in 2008 and in the U.K. in 2007.
In APMEA, the constant currency increases in revenues in2008 and 2007 were primarily driven by strong comparable salesin Australia and China, as well as positive comparable salesthroughout the segment. In addition, expansion in China con-tributed to the increases in both years.
In Other Countries & Corporate, Company-operated salesdeclined in 2008 and 2007 while franchised revenues increasedprimarily as a result of the Latam transaction in August 2007.
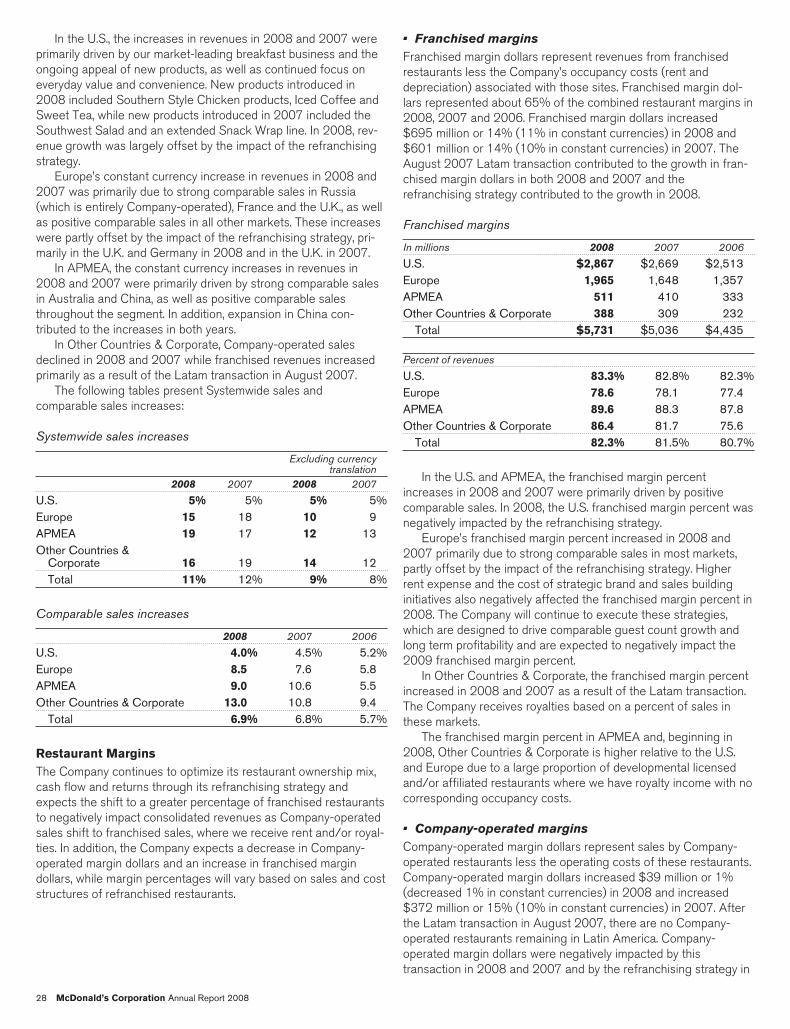
The following tables present Systemwide sales andcomparable sales increases:
Systemwide sales increases
Excluding currencytranslation
2008 2007 2008 2007
U.S. 5% 5% 5% 5%Europe 15 18 10 9APMEA 19 17 12 13Other Countries &
Corporate 16 19 14 12Total 11% 12% 9% 8%
Comparable sales increases
2008 2007 2006
U.S. 4.0% 4.5% 5.2%Europe 8.5 7.6 5.8APMEA 9.0 10.6 5.5Other Countries & Corporate 13.0 10.8 9.4
Total 6.9% 6.8% 5.7%
Restaurant MarginsThe Company continues to optimize its restaurant ownership mix,cash flow and returns through its refranchising strategy andexpects the shift to a greater percentage of franchised restaurantsto negatively impact consolidated revenues as Company-operatedsales shift to franchised sales, where we receive rent and/or royal-ties. In addition, the Company expects a decrease in Company-operated margin dollars and an increase in franchised margindollars, while margin percentages will vary based on sales and coststructures of refranchised restaurants.
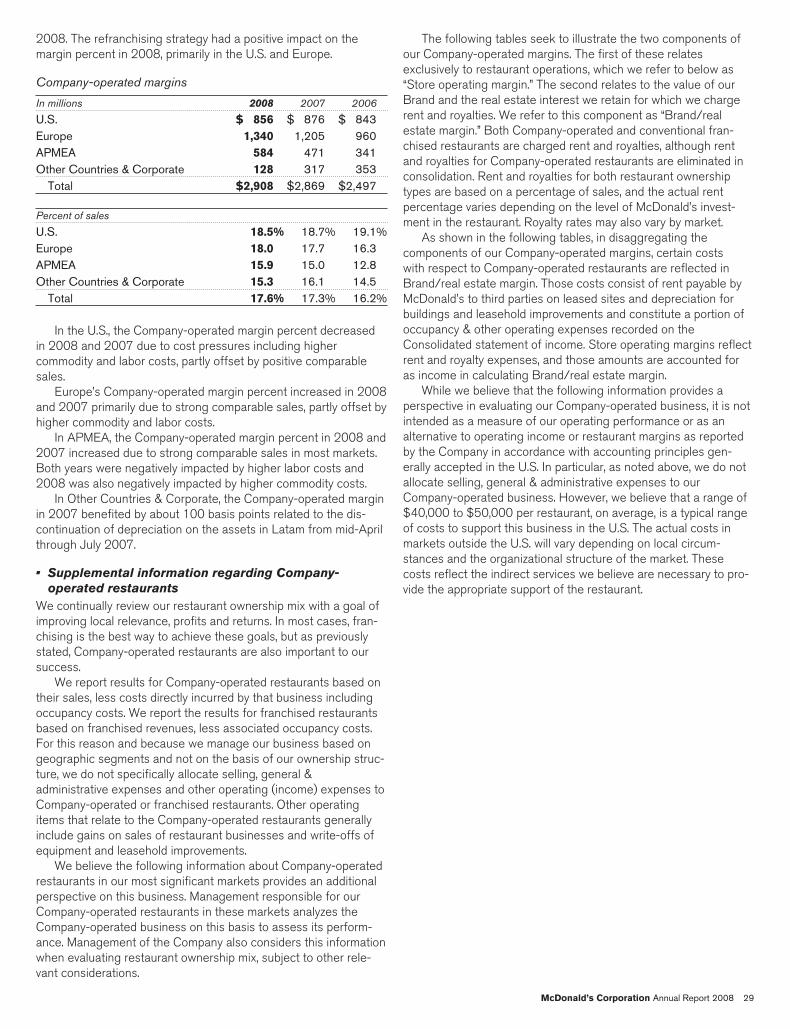
• Franchised marginsFranchised margin dollars represent revenues from franchisedrestaurants less the Company’s occupancy costs (rent anddepreciation) associated with those sites. Franchised margin dol-lars represented about 65% of the combined restaurant margins in2008, 2007 and 2006. Franchised margin dollars increased$695 million or 14% (11% in constant currencies) in 2008 and$601 million or 14% (10% in constant currencies) in 2007. TheAugust 2007 Latam transaction contributed to the growth in fran-chised margin dollars in both 2008 and 2007 and therefranchising strategy contributed to the growth in 2008.
Franchised margins
In millions 2008 2007 2006
U.S. $2,867 $2,669 $2,513Europe 1,965 1,648 1,357APMEA 511 410 333Other Countries & Corporate 388 309 232
Total $5,731 $5,036 $4,435
Percent of revenues
U.S. 83.3% 82.8% 82.3%Europe 78.6 78.1 77.4APMEA 89.6 88.3 87.8Other Countries & Corporate 86.4 81.7 75.6
Total 82.3% 81.5% 80.7%
In the U.S. and APMEA, the franchised margin percentincreases in 2008 and 2007 were primarily driven by positivecomparable sales. In 2008, the U.S. franchised margin percent wasnegatively impacted by the refranchising strategy.
Europe’s franchised margin percent increased in 2008 and2007 primarily due to strong comparable sales in most markets,partly offset by the impact of the refranchising strategy. Higherrent expense and the cost of strategic brand and sales buildinginitiatives also negatively affected the franchised margin percent in2008. The Company will continue to execute these strategies,which are designed to drive comparable guest count growth andlong term profitability and are expected to negatively impact the2009 franchised margin percent.
In Other Countries & Corporate, the franchised margin percentincreased in 2008 and 2007 as a result of the Latam transaction.The Company receives royalties based on a percent of sales inthese markets.
The franchised margin percent in APMEA and, beginning in2008, Other Countries & Corporate is higher relative to the U.S.and Europe due to a large proportion of developmental licensedand/or affiliated restaurants where we have royalty income with nocorresponding occupancy costs.
• Company-operated marginsCompany-operated margin dollars represent sales by Company-operated restaurants less the operating costs of these restaurants.Company-operated margin dollars increased $39 million or 1%(decreased 1% in constant currencies) in 2008 and increased$372 million or 15% (10% in constant currencies) in 2007. Afterthe Latam transaction in August 2007, there are no Company-operated restaurants remaining in Latin America. Company-operated margin dollars were negatively impacted by thistransaction in 2008 and 2007 and by the refranchising strategy in
28 McDonald’s Corporation Annual Report 2008
2008. The refranchising strategy had a positive impact on themargin percent in 2008, primarily in the U.S. and Europe.
Company-operated margins
In millions 2008 2007 2006
U.S. $ 856 $ 876 $ 843Europe 1,340 1,205 960APMEA 584 471 341Other Countries & Corporate 128 317 353
Total $2,908 $2,869 $2,497
Percent of sales
U.S. 18.5% 18.7% 19.1%Europe 18.0 17.7 16.3APMEA 15.9 15.0 12.8Other Countries & Corporate 15.3 16.1 14.5
Total 17.6% 17.3% 16.2%
In the U.S., the Company-operated margin percent decreasedin 2008 and 2007 due to cost pressures including highercommodity and labor costs, partly offset by positive comparablesales.
Europe’s Company-operated margin percent increased in 2008and 2007 primarily due to strong comparable sales, partly offset byhigher commodity and labor costs.
In APMEA, the Company-operated margin percent in 2008 and2007 increased due to strong comparable sales in most markets.Both years were negatively impacted by higher labor costs and2008 was also negatively impacted by higher commodity costs.
In Other Countries & Corporate, the Company-operated marginin 2007 benefited by about 100 basis points related to the dis-continuation of depreciation on the assets in Latam from mid-Aprilthrough July 2007.
• Supplemental information regarding Company-operated restaurants
We continually review our restaurant ownership mix with a goal ofimproving local relevance, profits and returns. In most cases, fran-chising is the best way to achieve these goals, but as previouslystated, Company-operated restaurants are also important to oursuccess.
We report results for Company-operated restaurants based ontheir sales, less costs directly incurred by that business includingoccupancy costs. We report the results for franchised restaurantsbased on franchised revenues, less associated occupancy costs.For this reason and because we manage our business based ongeographic segments and not on the basis of our ownership struc-ture, we do not specifically allocate selling, general &administrative expenses and other operating (income) expenses toCompany-operated or franchised restaurants. Other operatingitems that relate to the Company-operated restaurants generallyinclude gains on sales of restaurant businesses and write-offs ofequipment and leasehold improvements.
We believe the following information about Company-operatedrestaurants in our most significant markets provides an additionalperspective on this business. Management responsible for ourCompany-operated restaurants in these markets analyzes theCompany-operated business on this basis to assess its perform-ance. Management of the Company also considers this informationwhen evaluating restaurant ownership mix, subject to other rele-vant considerations.
The following tables seek to illustrate the two components ofour Company-operated margins. The first of these relatesexclusively to restaurant operations, which we refer to below as“Store operating margin.” The second relates to the value of ourBrand and the real estate interest we retain for which we chargerent and royalties. We refer to this component as “Brand/realestate margin.” Both Company-operated and conventional fran-chised restaurants are charged rent and royalties, although rentand royalties for Company-operated restaurants are eliminated inconsolidation. Rent and royalties for both restaurant ownershiptypes are based on a percentage of sales, and the actual rentpercentage varies depending on the level of McDonald’s invest-ment in the restaurant. Royalty rates may also vary by market.
As shown in the following tables, in disaggregating thecomponents of our Company-operated margins, certain costswith respect to Company-operated restaurants are reflected inBrand/real estate margin. Those costs consist of rent payable byMcDonald’s to third parties on leased sites and depreciation forbuildings and leasehold improvements and constitute a portion ofoccupancy & other operating expenses recorded on theConsolidated statement of income. Store operating margins reflectrent and royalty expenses, and those amounts are accounted foras income in calculating Brand/real estate margin.
While we believe that the following information provides aperspective in evaluating our Company-operated business, it is notintended as a measure of our operating performance or as analternative to operating income or restaurant margins as reportedby the Company in accordance with accounting principles gen-erally accepted in the U.S. In particular, as noted above, we do notallocate selling, general & administrative expenses to ourCompany-operated business. However, we believe that a range of$40,000 to $50,000 per restaurant, on average, is a typical rangeof costs to support this business in the U.S. The actual costs inmarkets outside the U.S. will vary depending on local circum-stances and the organizational structure of the market. Thesecosts reflect the indirect services we believe are necessary to pro-vide the appropriate support of the restaurant.
McDonald’s Corporation Annual Report 2008 29

U.S. EuropeDollars in millions 2008 2007 2006 2008 2007 2006
As reportedNumber of Company-operated
restaurants at year end 1,782 2,090 2,104 2,024 2,177 2,253Sales by Company-operated restaurants $4,636 $4,682 $4,410 $ 7,424 $ 6,817 $ 5,885Company-operated margin $ 856 $ 876 $ 843 $ 1,340 $ 1,205 $ 960Store operating marginCompany-operated margin $ 856 $ 876 $ 843 $ 1,340 $ 1,205 $ 960Plus:
Outside rent expense(1) 74 82 82 254 248 229Depreciation – buildings &
leasehold improvements(1) 70 78 74 110 107 98Less:
Rent & royalties(2) (684) (691) (651) (1,435) (1,294) (1,099)Store operating margin $ 316 $ 345 $ 348 $ 269 $ 266 $ 188Brand/real estate marginRent & royalties(2) $ 684 $ 691 $ 651 $ 1,435 $ 1,294 $ 1,099Less:
Outside rent expense(1) (74) (82) (82) (254) (248) (229)Depreciation – buildings &
leasehold improvements(1) (70) (78) (74) (110) (107) (98)Brand/real estate margin $ 540 $ 531 $ 495 $ 1,071 $ 939 $ 772(1) Represents certain costs recorded as occupancy & other operating expenses on the Consolidated statement of income – rent payable by McDonald’s to third parties on leased sites and
depreciation for buildings and leasehold improvements. This adjustment is made to reflect these occupancy costs in Brand/real estate margin. The relative percentage of sites that areowned versus leased varies by country.
(2) Reflects average Company–operated rent and royalties (as a percentage of 2008 sales: U.S. – 14.8% and Europe – 19.3%). This adjustment is made to reflect expense in Storeoperating margin and income in Brand/real estate margin. Countries within Europe have varying economic profiles and a wide range of rent and royalty rates as a percentage of sales.
Selling, general & administrative expensesConsolidated selling, general & administrative expenses were flat (decreased 1% in constant currencies) in 2008 and increased 3% (flatin constant currencies) in 2007. The 2008 constant currency change benefited by 3 percentage points due to the 2007 Latam trans-action. In 2008, expenses included costs related to the Beijing Summer Olympics and the Company’s biennial Worldwide Owner/Operator Convention. In 2007, higher employee-related costs were offset by a reduction in costs due to the Latam transaction.
Selling, general & administrative expenses
Amount Increase/(decrease)
Increase/(decrease)excluding currency
translationDollars in millions 2008 2007 2006 2008 2007 2008 2007
U.S. $ 745 $ 744 $ 727 —% 2% —% 2%Europe 714 689 610 4 13 1 4APMEA 300 276 238 9 16 8 11Other Countries & Corporate(1) 596 658 721 (9) (9) (9) (10)
Total $2,355 $2,367 $2,296 —% 3% (1)% —%(1) Included in Other Countries & Corporate are home office support costs in areas such as facilities, finance, human resources, information technology, legal, marketing, restaurant oper-
ations, supply chain and training.
Selling, general & administrative expenses as a percent of revenues were 10.0% in 2008 compared with 10.4% in 2007 and 11.0%in 2006. Selling, general & administrative expenses as a percent of Systemwide sales were 3.3% in 2008 compared with 3.7% in 2007and 4.0% in 2006. Management believes that analyzing selling, general & administrative expenses as a percent of Systemwide sales, aswell as revenues, is meaningful because these costs are incurred to support Systemwide restaurants.
30 McDonald’s Corporation Annual Report 2008

Impairment and other charges, netOn a pretax basis, the Company recorded impairment and other charges, net of $6 million in 2008, $1.7 billion in 2007 and $134 millionin 2006. McDonald’s management does not include these items when reviewing business performance trends because we do notbelieve these items are indicative of expected ongoing results.
Impairment and other charges (credits), net
In millions, except per share data 2008 2007 2006
U.S.Europe $ 6 $ (11) $ 62APMEA 48Other Countries & Corporate 1,681 24
Total $ 6 $1,670 $134After tax(1) $ 4 $1,606 $ 98Income from continuing operations per common share – diluted $.01 $ 1.32 $ .08(1) Certain items were not tax affected.
In 2008, the charges primarily related to market restructuring costs in Greece.In 2007, the Company recorded $1.7 billion of pretax impairment charges primarily related to the Company’s sale of its Latam busi-
nesses to a developmental licensee organization. In addition, the Company recorded a $16 million write-off of assets associated with theToasted Deli Sandwich products in Canada and a net gain of $14 million as a result of the transfer of the Company’s ownership interestin three European markets to a developmental licensee, partly offset by a loss on the transfer of a small market in Europe to a devel-opmental licensee.
In 2006, the charges primarily related to losses of $36 million incurred on the transfers of the Company’s ownership interest in cer-tain markets, primarily in APMEA and Europe, to developmental licensees, costs of $35 million related to the closing of certainrestaurants in the U.K. in conjunction with an overall restaurant portfolio review, costs of $29 million to buy out certain litigating franchi-sees in Brazil, asset write-offs and other charges in APMEA of $18 million, and a loss of $13 million related to the decision to dispose ofsupply chain operations in Russia.
Other operating (income) expense, netOther operating (income) expense, net
In millions 2008 2007 2006
Gains on sales of restaurant businesses $(126) $ (89) $ (38)Equity in earnings of unconsolidated affiliates (111) (116) (77)Asset dispositions and other expense 72 194 184
Total $(165) $ (11) $ 69
• Gains on sales of restaurant businessesGains on sales of restaurant businesses include gains from salesof Company-operated restaurants as well as gains from exercisesof purchase options by franchisees with business facilities leasearrangements (arrangements where the Company leases the busi-nesses, including equipment, to franchisees who generally haveoptions to purchase the businesses). The Company’s purchasesand sales of businesses with its franchisees are aimed at achievingan optimal ownership mix in each market. Resulting gains or lossesare recorded in operating income because the transactions are arecurring part of our business. The Company realized higher gainson sales of restaurant businesses in 2008 and 2007 primarily as aresult of selling more Company-operated restaurants in connectionwith our refranchising strategy in the Company’s major markets.
• Equity in earnings of unconsolidated affiliatesUnconsolidated affiliates and partnerships are businesses in whichthe Company actively participates but does not control. The Com-pany records equity in earnings from these entities representing
McDonald’s share of results. For foreign affiliated markets – primar-ily Japan – results are reported after interest expense and incometaxes. McDonald’s share of results for partnerships in certainconsolidated markets such as the U.S. are reported before incometaxes. These partnership restaurants are operated under conven-tional franchise arrangements and are included in conventionalfranchised restaurant counts. Results in 2008 and 2007 reflectedimproved results from our Japanese affiliate.
• Asset dispositions and other expenseAsset dispositions and other expense consists of gains or losseson excess property and other asset dispositions, provisions forstore closings, contingencies and uncollectible receivables, andother miscellaneous expenses. Asset dispositions in 2008reflected lower losses on restaurant closings and property dis-posals compared with 2007. In addition, 2008 results includedincome of $18 million due to the partial recovery of prior years’sales taxes in the U.K. Results for 2006 reflected a gain of$26 million related to the sale of an office building in Russia.
McDonald’s Corporation Annual Report 2008 31
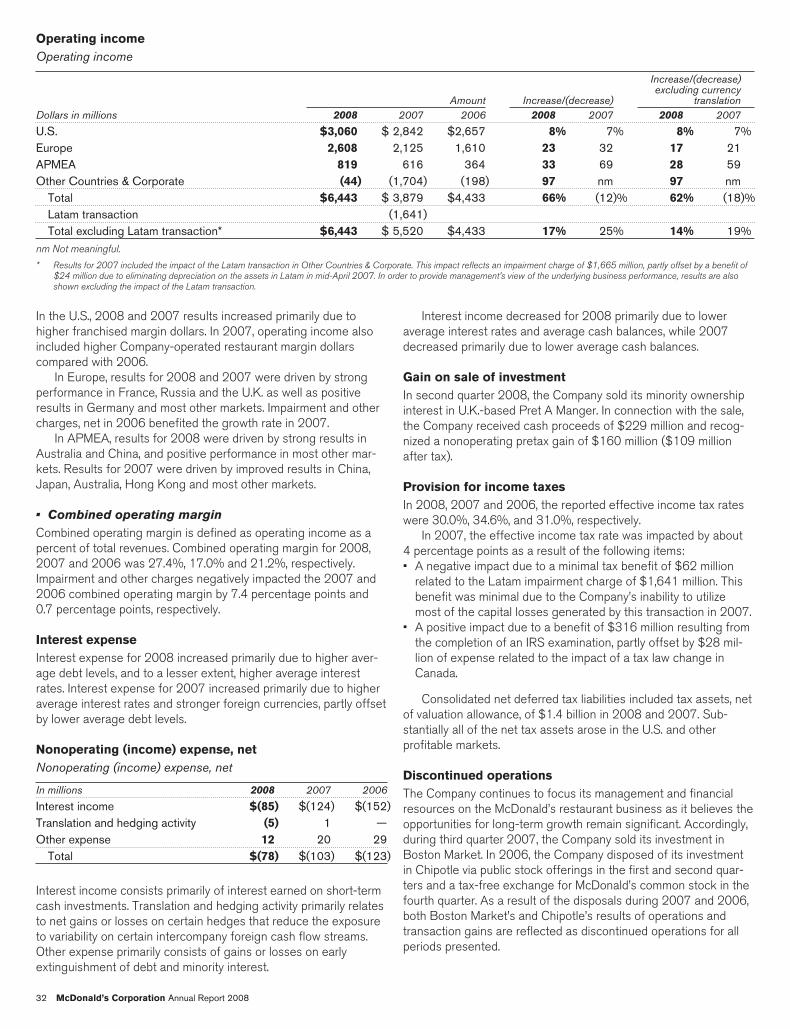
Operating incomeOperating income
Amount Increase/(decrease)
Increase/(decrease)excluding currency
translationDollars in millions 2008 2007 2006 2008 2007 2008 2007
U.S. $3,060 $ 2,842 $2,657 8% 7% 8% 7%Europe 2,608 2,125 1,610 23 32 17 21APMEA 819 616 364 33 69 28 59Other Countries & Corporate (44) (1,704) (198) 97 nm 97 nm
Total $6,443 $ 3,879 $4,433 66% (12)% 62% (18)%Latam transaction (1,641)Total excluding Latam transaction* $6,443 $ 5,520 $4,433 17% 25% 14% 19%
nm Not meaningful.
* Results for 2007 included the impact of the Latam transaction in Other Countries & Corporate. This impact reflects an impairment charge of $1,665 million, partly offset by a benefit of$24 million due to eliminating depreciation on the assets in Latam in mid-April 2007. In order to provide management’s view of the underlying business performance, results are alsoshown excluding the impact of the Latam transaction.
In the U.S., 2008 and 2007 results increased primarily due tohigher franchised margin dollars. In 2007, operating income alsoincluded higher Company-operated restaurant margin dollarscompared with 2006.
In Europe, results for 2008 and 2007 were driven by strongperformance in France, Russia and the U.K. as well as positiveresults in Germany and most other markets. Impairment and othercharges, net in 2006 benefited the growth rate in 2007.
In APMEA, results for 2008 were driven by strong results inAustralia and China, and positive performance in most other mar-kets. Results for 2007 were driven by improved results in China,Japan, Australia, Hong Kong and most other markets.
• Combined operating marginCombined operating margin is defined as operating income as apercent of total revenues. Combined operating margin for 2008,2007 and 2006 was 27.4%, 17.0% and 21.2%, respectively.Impairment and other charges negatively impacted the 2007 and2006 combined operating margin by 7.4 percentage points and0.7 percentage points, respectively.
Interest expenseInterest expense for 2008 increased primarily due to higher aver-age debt levels, and to a lesser extent, higher average interestrates. Interest expense for 2007 increased primarily due to higheraverage interest rates and stronger foreign currencies, partly offsetby lower average debt levels.
Nonoperating (income) expense, netNonoperating (income) expense, net
In millions 2008 2007 2006
Interest income $(85) $(124) $(152)Translation and hedging activity (5) 1 —Other expense 12 20 29
Total $(78) $(103) $(123)
Interest income consists primarily of interest earned on short-termcash investments. Translation and hedging activity primarily relatesto net gains or losses on certain hedges that reduce the exposureto variability on certain intercompany foreign cash flow streams.Other expense primarily consists of gains or losses on earlyextinguishment of debt and minority interest.
Interest income decreased for 2008 primarily due to loweraverage interest rates and average cash balances, while 2007decreased primarily due to lower average cash balances.
Gain on sale of investmentIn second quarter 2008, the Company sold its minority ownershipinterest in U.K.-based Pret A Manger. In connection with the sale,the Company received cash proceeds of $229 million and recog-nized a nonoperating pretax gain of $160 million ($109 millionafter tax).
Provision for income taxesIn 2008, 2007 and 2006, the reported effective income tax rateswere 30.0%, 34.6%, and 31.0%, respectively.
In 2007, the effective income tax rate was impacted by about4 percentage points as a result of the following items:• A negative impact due to a minimal tax benefit of $62 million
related to the Latam impairment charge of $1,641 million. Thisbenefit was minimal due to the Company’s inability to utilizemost of the capital losses generated by this transaction in 2007.
• A positive impact due to a benefit of $316 million resulting fromthe completion of an IRS examination, partly offset by $28 mil-lion of expense related to the impact of a tax law change inCanada.
Consolidated net deferred tax liabilities included tax assets, netof valuation allowance, of $1.4 billion in 2008 and 2007. Sub-stantially all of the net tax assets arose in the U.S. and otherprofitable markets.
Discontinued operationsThe Company continues to focus its management and financialresources on the McDonald’s restaurant business as it believes theopportunities for long-term growth remain significant. Accordingly,during third quarter 2007, the Company sold its investment inBoston Market. In 2006, the Company disposed of its investmentin Chipotle via public stock offerings in the first and second quar-ters and a tax-free exchange for McDonald’s common stock in thefourth quarter. As a result of the disposals during 2007 and 2006,both Boston Market’s and Chipotle’s results of operations andtransaction gains are reflected as discontinued operations for allperiods presented.
32 McDonald’s Corporation Annual Report 2008
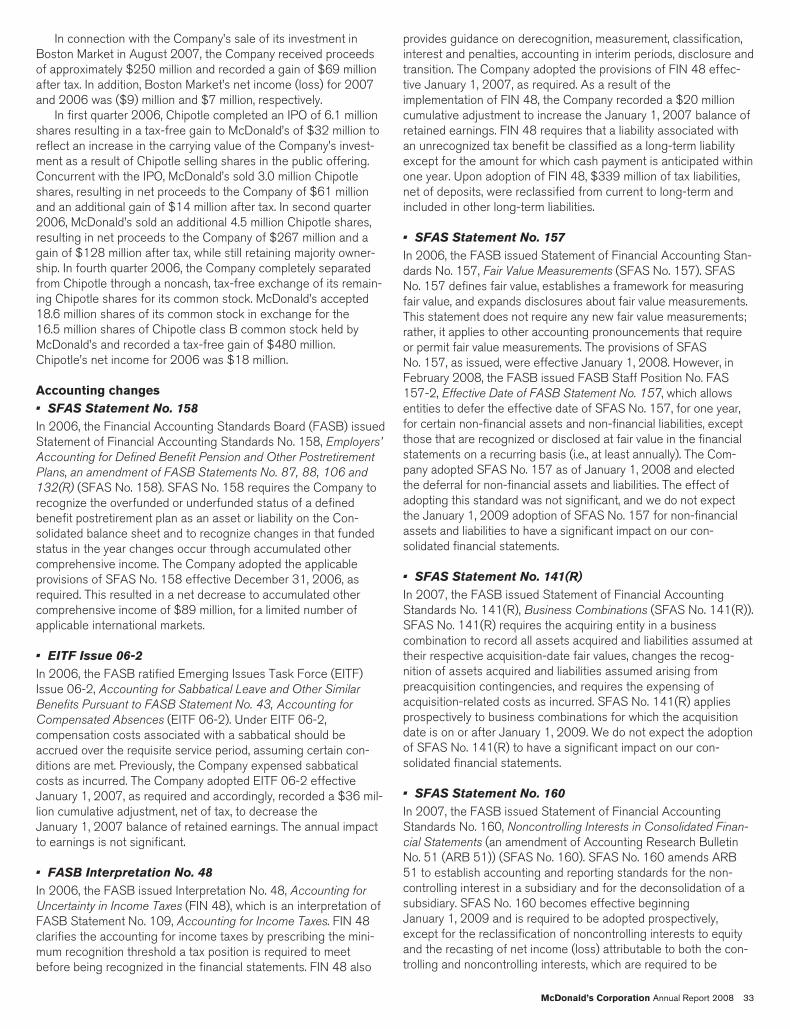
In connection with the Company’s sale of its investment inBoston Market in August 2007, the Company received proceedsof approximately $250 million and recorded a gain of $69 millionafter tax. In addition, Boston Market’s net income (loss) for 2007and 2006 was ($9) million and $7 million, respectively.
In first quarter 2006, Chipotle completed an IPO of 6.1 millionshares resulting in a tax-free gain to McDonald’s of $32 million toreflect an increase in the carrying value of the Company’s invest-ment as a result of Chipotle selling shares in the public offering.Concurrent with the IPO, McDonald’s sold 3.0 million Chipotleshares, resulting in net proceeds to the Company of $61 millionand an additional gain of $14 million after tax. In second quarter2006, McDonald’s sold an additional 4.5 million Chipotle shares,resulting in net proceeds to the Company of $267 million and again of $128 million after tax, while still retaining majority owner-ship. In fourth quarter 2006, the Company completely separatedfrom Chipotle through a noncash, tax-free exchange of its remain-ing Chipotle shares for its common stock. McDonald’s accepted18.6 million shares of its common stock in exchange for the16.5 million shares of Chipotle class B common stock held byMcDonald’s and recorded a tax-free gain of $480 million.Chipotle’s net income for 2006 was $18 million.
Accounting changes• SFAS Statement No. 158In 2006, the Financial Accounting Standards Board (FASB) issuedStatement of Financial Accounting Standards No. 158, Employers’
Accounting for Defined Benefit Pension and Other Postretirement
Plans, an amendment of FASB Statements No. 87, 88, 106 and
132(R) (SFAS No. 158). SFAS No. 158 requires the Company torecognize the overfunded or underfunded status of a definedbenefit postretirement plan as an asset or liability on the Con-solidated balance sheet and to recognize changes in that fundedstatus in the year changes occur through accumulated othercomprehensive income. The Company adopted the applicableprovisions of SFAS No. 158 effective December 31, 2006, asrequired. This resulted in a net decrease to accumulated othercomprehensive income of $89 million, for a limited number ofapplicable international markets.
• EITF Issue 06-2In 2006, the FASB ratified Emerging Issues Task Force (EITF)Issue 06-2, Accounting for Sabbatical Leave and Other Similar
Benefits Pursuant to FASB Statement No. 43, Accounting for
Compensated Absences (EITF 06-2). Under EITF 06-2,compensation costs associated with a sabbatical should beaccrued over the requisite service period, assuming certain con-ditions are met. Previously, the Company expensed sabbaticalcosts as incurred. The Company adopted EITF 06-2 effectiveJanuary 1, 2007, as required and accordingly, recorded a $36 mil-lion cumulative adjustment, net of tax, to decrease theJanuary 1, 2007 balance of retained earnings. The annual impactto earnings is not significant.
• FASB Interpretation No. 48In 2006, the FASB issued Interpretation No. 48, Accounting for
Uncertainty in Income Taxes (FIN 48), which is an interpretation ofFASB Statement No. 109, Accounting for Income Taxes. FIN 48clarifies the accounting for income taxes by prescribing the mini-mum recognition threshold a tax position is required to meetbefore being recognized in the financial statements. FIN 48 also
provides guidance on derecognition, measurement, classification,interest and penalties, accounting in interim periods, disclosure andtransition. The Company adopted the provisions of FIN 48 effec-tive January 1, 2007, as required. As a result of theimplementation of FIN 48, the Company recorded a $20 millioncumulative adjustment to increase the January 1, 2007 balance ofretained earnings. FIN 48 requires that a liability associated withan unrecognized tax benefit be classified as a long-term liabilityexcept for the amount for which cash payment is anticipated withinone year. Upon adoption of FIN 48, $339 million of tax liabilities,net of deposits, were reclassified from current to long-term andincluded in other long-term liabilities.
• SFAS Statement No. 157In 2006, the FASB issued Statement of Financial Accounting Stan-dards No. 157, Fair Value Measurements (SFAS No. 157). SFASNo. 157 defines fair value, establishes a framework for measuringfair value, and expands disclosures about fair value measurements.This statement does not require any new fair value measurements;rather, it applies to other accounting pronouncements that requireor permit fair value measurements. The provisions of SFASNo. 157, as issued, were effective January 1, 2008. However, inFebruary 2008, the FASB issued FASB Staff Position No. FAS157-2, Effective Date of FASB Statement No. 157, which allowsentities to defer the effective date of SFAS No. 157, for one year,for certain non-financial assets and non-financial liabilities, exceptthose that are recognized or disclosed at fair value in the financialstatements on a recurring basis (i.e., at least annually). The Com-pany adopted SFAS No. 157 as of January 1, 2008 and electedthe deferral for non-financial assets and liabilities. The effect ofadopting this standard was not significant, and we do not expectthe January 1, 2009 adoption of SFAS No. 157 for non-financialassets and liabilities to have a significant impact on our con-solidated financial statements.
• SFAS Statement No. 141(R)In 2007, the FASB issued Statement of Financial AccountingStandards No. 141(R), Business Combinations (SFAS No. 141(R)).SFAS No. 141(R) requires the acquiring entity in a businesscombination to record all assets acquired and liabilities assumed attheir respective acquisition-date fair values, changes the recog-nition of assets acquired and liabilities assumed arising frompreacquisition contingencies, and requires the expensing ofacquisition-related costs as incurred. SFAS No. 141(R) appliesprospectively to business combinations for which the acquisitiondate is on or after January 1, 2009. We do not expect the adoptionof SFAS No. 141(R) to have a significant impact on our con-solidated financial statements.
• SFAS Statement No. 160In 2007, the FASB issued Statement of Financial AccountingStandards No. 160, Noncontrolling Interests in Consolidated Finan-
cial Statements (an amendment of Accounting Research BulletinNo. 51 (ARB 51)) (SFAS No. 160). SFAS No. 160 amends ARB51 to establish accounting and reporting standards for the non-controlling interest in a subsidiary and for the deconsolidation of asubsidiary. SFAS No. 160 becomes effective beginningJanuary 1, 2009 and is required to be adopted prospectively,except for the reclassification of noncontrolling interests to equityand the recasting of net income (loss) attributable to both the con-trolling and noncontrolling interests, which are required to be
McDonald’s Corporation Annual Report 2008 33

adopted retrospectively. We do not expect the adoption of SFASNo. 160 to have a significant impact on our consolidated financialstatements.
CASH FLOWSThe Company generates significant cash from its operations andhas substantial credit availability and capacity to fund operatingand discretionary spending such as capital expenditures, debtrepayments, dividends and share repurchases.
Cash provided by operations totaled $5.9 billion and exceededcapital expenditures by $3.8 billion in 2008, while cash providedby operations totaled $4.9 billion and exceeded capitalexpenditures by $2.9 billion in 2007. In 2008, cash provided byoperations increased $1.0 billion or 21% compared to 2007 pri-marily due to increased operating results and changes in workingcapital, partly due to lower income tax payments and the receipt of$143 million related to an IRS examination completed in 2007. In2007, cash provided by operations increased $535 million com-pared to 2006 primarily due to increased operating results andlower income tax payments.
Cash used for investing activities totaled $1.6 billion in 2008,an increase of $475 million compared with 2007. Proceeds fromcertain asset sales were lower in 2008 (Pret A Manger) than 2007(Latam and Boston Market). In addition, capital expendituresincreased $189 million in 2008, primarily driven by increases inEurope and APMEA, partly offset by the elimination of capitalexpenditures as a result of the Latam transaction. The increase incash used for investing activities was partly offset by higher pro-ceeds from the sales of restaurant businesses and property andlower expenditures on purchases of restaurant businesses in con-junction with our overall refranchising strategy. Cash used forinvesting activities totaled $1.2 billion in 2007, a decrease of$124 million compared with 2006, primarily due to net proceedsreceived from the Latam transaction and the sale of Boston Mar-ket in 2007, partly offset by higher capital expenditures.
Cash used for financing activities totaled $4.1 billion in 2008,an increase of $118 million compared with 2007. Financing activ-ities in 2008 reflected lower proceeds from stock option exercises,mostly offset by higher net debt issuances. In 2007, cash used forfinancing activities totaled $4.0 billion, a decrease of $1.5 billioncompared to 2006, primarily due to higher net debt issuances,partly offset by higher treasury stock purchases and an increase inthe common stock dividend.
As a result of the above activity, the Company’s cash and equiv-alents balance increased $82 million in 2008 to $2.1 billion,compared with a decrease of $147 million in 2007. In addition tocash and equivalents on hand and cash provided by operations, theCompany can meet short-term funding needs through its con-tinued access to commercial paper borrowings and line of creditagreements.
Restaurant development and capital expendituresIn 2008, the Company opened 918 traditional restaurants and 77satellite restaurants (small, limited-menu restaurants for which theland and building are generally leased), and closed 209 traditionalrestaurants and 196 satellite restaurants. In 2007, the Companyopened 743 traditional restaurants and 93 satellite restaurants,and closed 240 traditional restaurants and 265 satellite restau-rants. About 60% of restaurant openings and more than 75% ofrestaurant closings occurred in the major markets in both years.
Systemwide restaurants at year end(1)
2008 2007 2006
U.S. 13,918 13,862 13,774Europe 6,628 6,480 6,403APMEA 8,255 7,938 7,822Other Countries & Corporate 3,166 3,097 3,047
Total 31,967 31,377 31,046(1) Includes satellite units at December 31, 2008, 2007 and 2006 as follows: U.S.–
1,169, 1,233, 1,254; Europe–226, 214, 201; APMEA (primarily Japan)–1,379,1,454, 1,640; Other Countries & Corporate–447, 439, 417.
In 2009, the Company expects to open about 950 traditionalrestaurants and 50 satellite restaurants and close about 200 tradi-tional restaurants and 150 satellite restaurants. About 60% of totalopenings and 70% of total closings will be in major markets.
Approximately 65% of Company-operated restaurants andabout 80% of franchised restaurants were located in the majormarkets at the end of 2008. Franchisees operated 80% of therestaurants at year-end 2008.
Capital expenditures increased $189 million or 10% in 2008and $205 million or 12% in 2007. The increases in capitalexpenditures in both years were primarily due to higher investmentin new restaurants — in Europe and APMEA in 2008 and inEurope and the U.S. in 2007. Capital expenditures reflected theCompany’s commitment to growing sales at existing restaurants,including reinvestment initiatives such as reimaging in many mar-kets around the world in both years and the Combined BeverageBusiness in the U.S. in 2008. Capital expenditures related to dis-continued operations were $10 million and $82 million in 2007and 2006, respectively. The expenditures in 2007 primarily relatedto investment in existing Boston Market restaurants andexpenditures in 2006 primarily related to new Chipotle restaurants.
Capital expenditures invested in major markets, excludingJapan, represented over 70% of the total in 2008, 2007 and2006. Japan is accounted for under the equity method, andaccordingly its capital expenditures are not included in con-solidated amounts.
Capital expenditures
In millions 2008 2007 2006
New restaurants $ 897 $ 687 $ 530Existing restaurants 1,152 1,158 1,075Other(1) 87 102 137
Total capital expenditures $ 2,136 $ 1,947 $ 1,742Total assets $28,462 $29,392 $28,974
(1) Primarily corporate equipment and other office related expenditures.
New restaurant investments in all years were concentrated inmarkets with acceptable returns or opportunities for long-termgrowth. Average development costs vary widely by market depend-ing on the types of restaurants built and the real estate andconstruction costs within each market. These costs, which includeland, buildings and equipment, are managed through the use ofoptimally sized restaurants, construction and design efficienciesand leveraging best practices. In addition, foreign currency fluctua-tions affect average development costs. Although the Company isnot responsible for all costs for every restaurant opened, totaldevelopment costs (consisting of land, buildings and equipment)for new traditional McDonald’s restaurants in the U.S. averagedapproximately $2.6 million in 2008.
34 McDonald’s Corporation Annual Report 2008

The Company owned approximately 45% of the land and about70% of the buildings for restaurants in its consolidated markets atyear-end 2008 and 2007.
Share repurchases and dividendsFor 2007 through 2009, the Company expects to return $15 bil-lion to $17 billion to shareholders through a combination of sharerepurchases and dividends, subject to business and market con-ditions. In 2008, the Company returned $5.8 billion to shareholdersthrough a combination of shares repurchased and dividends paid,bringing the two-year total returned to shareholders for 2007 and2008 to $11.5 billion.
Shares repurchased and dividends
In millions, except per share data 2008 2007 2006
Number of shares repurchased(1) 69.7 77.1 98.4Shares outstanding at year end 1,115 1,165 1,204Dividends declared per share $1.625 $ 1.50 $ 1.00Dollar amount of shares
repurchased(1) $3,981 $3,949 $3,719Dividends paid 1,823 1,766 1,217
Total returned to shareholders $5,804 $5,715 $4,936(1) 2006 included 18.6 million shares or $743.6 million acquired through the October
2006 Chipotle exchange.
In September 2007, the Company’s Board of Directorsapproved a $10 billion share repurchase program with no specifiedexpiration date. In 2007 and 2008 combined, approximately147 million shares have been repurchased for $7.9 billion, ofwhich 97 million shares or $5.6 billion were purchased under thisprogram. The Company reduced its shares outstanding at year endby over 4% compared with 2007, net of stock option exercises.
The Company has paid dividends on its common stock for 33consecutive years and has increased the dividend amount everyyear. The Company’s Board of Directors decided that beginning in2008, dividends declared will be paid on a quarterly basis, at theBoard’s discretion. The 2008 full year dividend of $1.625 pershare reflects the quarterly dividend paid for each of the first threequarters of $0.375 per share, with an increase to $0.50 per sharepaid in the fourth quarter. This 33% increase in the quarterly divi-dend equates to a $2.00 per share annual dividend rate andreflects the Company’s confidence in the ongoing strength andreliability of its cash flow. As in the past, future dividend amountswill be considered after reviewing profitability expectations andfinancing needs.
FINANCIAL POSITION AND CAPITAL RESOURCES
Total assets and returnsTotal assets decreased $930 million or 3% in 2008. Excluding theeffect of changes in foreign currency exchange rates, total assetsincreased $784 million in 2008 primarily due to capitalexpenditures. Over 70% of total assets were in major markets atyear-end 2008. Net property and equipment decreased $730 mil-lion in 2008 and represented about 70% of total assets at yearend. Excluding the effect of changes in foreign currency exchangerates, net property and equipment increased $681 million.
Operating income is used to compute return on average assets,while income from continuing operations is used to calculatereturn on average common equity. Month-end balances are used tocompute both average assets and average common equity. Assets
of discontinued operations are excluded from average assets sinceoperating income excludes results from discontinued operations.
Returns on assets and equity
2008 2007 2006
Return on average assets 21.8% 13.2% 15.0%Return on average common equity 30.6 15.1 18.4
In 2008 and 2007, return on average assets and return onaverage common equity both benefited from strong operatingresults in the U.S., Europe and APMEA. During 2009, the Com-pany will continue to concentrate restaurant openings and investnew capital in markets with acceptable returns or opportunities forlong-term growth.
Impairment and other charges reduced return on averageassets by 5.4 percentage points and 0.4 percentage points in2007 and 2006, respectively. In addition, impairment and othercharges, partly offset by the 2007 net tax benefit resulting fromthe completion of an IRS examination, reduced return on averagecommon equity by 8.5 percentage points and 0.6 percentagepoints in 2007 and 2006, respectively.
Operating income, as reported, does not include interestincome; however, cash balances are included in average assets.The inclusion of cash balances in average assets reduced returnon average assets by 1.9 percentage points, 1.3 percentage pointsand 2.1 percentage points in 2008, 2007 and 2006, respectively.
Financing and market riskThe Company generally borrows on a long-term basis and isexposed to the impact of interest rate changes and foreign cur-rency fluctuations. Debt obligations at December 31, 2008 totaled$10.2 billion, compared with $9.3 billion at December 31, 2007.The net increase in 2008 was primarily due to net issuances of$1.0 billion, partly offset by the impact of changes in exchangerates on foreign currency denominated debt of $155 million.
Debt highlights (1)
2008 2007 2006
Fixed-rate debt as a percent of total debt(2,3) 72% 58% 49%Weighted-average annual interest rate of
total debt(3) 5.0 4.7 4.1Foreign currency-denominated debt as a
percent of total debt(2) 45 66 80Total debt as a percent of total capitalization
(total debt and total shareholders’equity)(2) 43 38 35
Cash provided by operations as a percent oftotal debt(2) 59 53 52
(1) All percentages are as of December 31, except for the weighted-average annual inter-est rate, which is for the year.
(2) Based on debt obligations before the effect of SFAS No. 133 fair value adjustments.This effect is excluded as these adjustments have no impact on the obligation atmaturity. See Debt financing note to the consolidated financial statements.
(3) Includes the effect of interest rate exchange agreements.
Fitch, Standard & Poor’s and Moody’s currently rate, with a sta-ble outlook, the Company’s commercial paper F1, A-1 and P-2,respectively; and its long-term debt A, A and A3, respectively. TheCompany’s key metrics for monitoring its credit structure are shownin the preceding table. While the Company targets these metrics forease of focus, it also considers similar credit ratios that incorporatecapitalized operating leases to estimate total adjusted debt. Total
McDonald’s Corporation Annual Report 2008 35
adjusted debt, a term that is commonly used by the rating agenciesreferred to above, includes debt outstanding on the Company’sbalance sheet plus an adjustment to capitalize operating leases.Based on their most recent calculations, these agencies addbetween $6 billion and $12 billion to debt for lease capitalizationpurposes, which increases total debt as a percent of total capital-ization and reduces cash provided by operations as a percent oftotal debt for credit rating purposes. The Company believes therating agency methodology for capitalizing leases requires certainadjustments. These adjustments include: excluding percent rents inexcess of minimum rents; excluding certain Company-operatedrestaurant lease agreements outside the U.S. that are cancelablewith minimal penalties (representing approximately 30% ofCompany-operated restaurant minimum rents outside the U.S.,based on the Company’s estimate); capitalizing non-restaurantleases using a multiple of three times rent expense; and reducingtotal rent expense by a percentage of the annual minimum rentpayments due to the Company from franchisees operating onleased sites. Based on this calculation, for credit analysis purposes,approximately $4 billion to $5 billion of future operating leasepayments would be capitalized.
Certain of the Company’s debt obligations contain cross-acceleration provisions and restrictions on Company and subsidiarymortgages and the long-term debt of certain subsidiaries. There areno provisions in the Company’s debt obligations that would accel-erate repayment of debt as a result of a change in credit ratings ora material adverse change in the Company’s business. Under exist-ing authorization from the Company’s Board of Directors, atDecember 31, 2008, the Company has approximately $2.3 billionof authority remaining to borrow funds, including through (i) publicor private offering of debt securities; (ii) issuance of commercialpaper; (iii) direct borrowing from banks or other financialinstitutions; and (iv) other forms of indebtedness. In addition toregistered debt securities on a U.S. shelf registration statement anda Euro Medium-Term Notes program, the Company has $1.3 billionavailable under a committed line of credit agreement (see Debtfinancing note to the consolidated financial statements). Debtmaturing in 2009 is approximately $400 million of long-termcorporate debt and $230 million of outstanding commercial paper.In 2009, the Company expects to issue commercial paper andlong-term debt in order to refinance this maturing debt and poten-tially finance a portion of the Company’s previously disclosed2007-2009 expectation to return $15 billion to $17 billion toshareholders. The Company also has $625 million of foreign cur-rency bank line borrowings outstanding at year-end.
Historically, the Company has not experienced difficulty inobtaining financing or refinancing existing debt. Although therecent instability in the financial markets has resulted in con-straints on available credit, the Company’s ability to raise funding inthe long-term and short-term debt capital markets has not beenadversely affected. In November 2008, the Company directly bor-rowed 40 billion Japanese Yen ($440 million) via a floating-ratesyndicated term loan maturing in 2014. In January 2009, theCompany issued $400 million of 10-year U.S. Dollar-denominatednotes at a coupon rate of 5.0%, and $350 million of 30-yearU.S. Dollar-denominated bonds at a coupon rate of 5.7%.
The Company uses major capital markets, bank financings andderivatives to meet its financing requirements and reduce interestexpense. The Company manages its debt portfolio in response tochanges in interest rates and foreign currency rates by periodicallyretiring, redeeming and repurchasing debt, terminating exchangeagreements and using derivatives. The Company does not usederivatives with a level of complexity or with a risk higher than theexposures to be hedged and does not hold or issue derivatives fortrading purposes. All exchange agreements are over-the-counterinstruments.
In managing the impact of interest rate changes and foreigncurrency fluctuations, the Company uses interest rate exchangeagreements and finances in the currencies in which assets aredenominated. Derivatives were recorded at fair value on theCompany’s Consolidated balance sheet at December 31, 2008 asfollows: miscellaneous other assets–$88 million; prepaid expensesand other current assets–$44 million; accrued payroll and otherliabilities–$22 million; and other long-term liabilities (excludingaccrued interest)–$4 million. For the year ended December 31,2007, the Company’s derivatives were recorded in miscellaneousother assets–$64 million and other long-term liabilities (excludingaccrued interest)–$70 million. See Summary of significantaccounting policies note to the consolidated financial statementsrelated to financial instruments for additional information regardingtheir use and the impact of SFAS No. 133 regarding derivatives.
The Company uses foreign currency debt and derivatives tohedge the foreign currency risk associated with certain royalties,intercompany financings and long-term investments in foreignsubsidiaries and affiliates. This reduces the impact of fluctuatingforeign currencies on cash flows and shareholders’ equity. Totalforeign currency-denominated debt was $4.5 billion and $6.1 bil-lion at December 31, 2008 and 2007, respectively. In addition,where practical, the Company’s restaurants purchase goods andservices in local currencies resulting in natural hedges.
The Company does not have significant exposure to anyindividual counterparty and has master agreements that containnetting arrangements. Certain of these agreements also requireeach party to post collateral if credit ratings fall below, oraggregate exposures exceed, certain contractual limits. AtDecember 31, 2008, neither the Company nor its counterpartieswere required to post collateral on any derivative position.
The Company’s net asset exposure is diversified among abroad basket of currencies. The Company’s largest net assetexposures (defined as foreign currency assets less foreign cur-rency liabilities) at year end were as follows:
Foreign currency net asset exposures
In millions of U.S. Dollars 2008 2007Euro $4,551 $3,999Australian Dollars 1,023 1,147Canadian Dollars 795 929British Pounds Sterling 785 634Russian Ruble 407 463
The Company prepared sensitivity analyses of its financial instru-ments to determine the impact of hypothetical changes in interestrates and foreign currency exchange rates on the Company’s resultsof operations, cash flows and the fair value of its financial instru-ments. The interest rate analysis assumed a one percentage pointadverse change in interest rates on all financial instruments but didnot consider the effects of the reduced level of economic activitythat could exist in such an environment. The foreign currency rateanalysis assumed that each foreign currency rate would change by10% in the same direction relative to the U.S. Dollar on all financialinstruments; however, the analysis did not include the potentialimpact on revenues, local currency prices or the effect of fluctuatingcurrencies on the Company’s anticipated foreign currency royaltiesand other payments received in the U.S. Based on the results ofthese analyses of the Company’s financial instruments, neither aone percentage point adverse change in interest rates from 2008levels nor a 10% adverse change in foreign currency rates from2008 levels would materially affect the Company’s results of oper-ations, cash flows or the fair value of its financial instruments.
36 McDonald’s Corporation Annual Report 2008
Contractual obligations and commitmentsThe Company has long-term contractual obligations primarily in theform of lease obligations (related to both Company-operated andfranchised restaurants) and debt obligations. In addition, theCompany has long-term revenue and cash flow streams that relateto its franchise arrangements. Cash provided by operations(including cash provided by these franchise arrangements) alongwith the Company’s borrowing capacity and other sources of cashwill be used to satisfy the obligations. The following table summa-rizes the Company’s contractual obligations and their aggregatematurities as well as future minimum rent payments due to theCompany under existing franchise arrangements as ofDecember 31, 2008. See discussions of cash flows and financialposition and capital resources as well as the Notes to the con-solidated financial statements for further details.
Contractual cash outflows Contractual cash inflows
In millionsOperating
leasesDebt
obligations(1)Minimum rent under
franchise arrangements2009 $ 1,046 $ 32 $ 2,0902010 972 616 2,0282011 891 611 1,9522012 809 2,214 1,8862013 746 657 1,809Thereafter 5,614 5,980 13,641
Total $10,078 $10,110 $23,406(1) The maturities reflect reclassifications of short-term obligations to long-term obligations
of $1.3 billion, as they are supported by a long-term line of credit agreement expiring in2012. Debt obligations do not include $108 million of SFAS No. 133 noncash fairvalue adjustments because these adjustments have no impact on the obligation atmaturity, as well as $174 million of accrued interest.
The Company maintains certain supplemental benefit plansthat allow participants to (i) make tax-deferred contributions and(ii) receive Company-provided allocations that cannot be madeunder the qualified benefit plans because of IRS limitations. Theinvestment alternatives and returns are based on certain market-rate investment alternatives under the Company’s qualified ProfitSharing and Savings Plan. Total liabilities for the supplementalplans were $390 million at December 31, 2008 and were primarilyincluded in other long-term liabilities on the Consolidated balancesheet. Also included in other long-term liabilities at December 31,2008 were gross unrecognized tax benefits of $272 million andliabilities for international retirement plans of $131 million.
In connection with the Latam transaction, the Company hasagreed to indemnify the buyers for certain tax and other claims,certain of which are reflected in other long-term liabilities onMcDonald’s Consolidated balance sheet totaling $142 million atyear-end 2008.
OTHER MATTERS
Critical accounting policies and estimatesManagement’s discussion and analysis of financial condition andresults of operations is based upon the Company’s consolidatedfinancial statements, which have been prepared in accordance withaccounting principles generally accepted in the U.S. The prepara-tion of these financial statements requires the Company to makeestimates and judgments that affect the reported amounts ofassets, liabilities, revenues and expenses as well as related dis-closures. On an ongoing basis, the Company evaluates itsestimates and judgments based on historical experience and vari-ous other factors that are believed to be reasonable under thecircumstances. Actual results may differ from these estimatesunder various assumptions or conditions.
The Company reviews its financial reporting and disclosurepractices and accounting policies quarterly to ensure that theyprovide accurate and transparent information relative to the currenteconomic and business environment. The Company believes thatof its significant accounting policies, the following involve a higherdegree of judgment and/or complexity:
• Property and equipmentProperty and equipment are depreciated or amortized on astraight-line basis over their useful lives based on management’sestimates of the period over which the assets will generate rev-enue (not to exceed lease term plus options for leased property).The useful lives are estimated based on historical experience withsimilar assets, taking into account anticipated technological orother changes. The Company periodically reviews these lives rela-tive to physical factors, economic factors and industry trends. Ifthere are changes in the planned use of property and equipment,or if technological changes occur more rapidly than anticipated, theuseful lives assigned to these assets may need to be shortened,resulting in the recognition of increased depreciation and amor-tization expense or write-offs in future periods.
• Share-based compensationThe Company has a share-based compensation plan which author-izes the granting of various equity-based incentives including stockoptions and restricted stock units (RSUs) to employees and non-employee directors. The expense for these equity-based incentivesis based on their fair value at date of grant and generally amortizedover their vesting period.
The fair value of each stock option granted is estimated on thedate of grant using a closed-form pricing model. The pricing modelrequires assumptions, such as the expected life of the stock option,the risk-free interest rate and expected volatility of the Company’sstock over the expected life, which significantly impact the assumedfair value. The Company uses historical data to determine theseassumptions and if these assumptions change significantly forfuture grants, share-based compensation expense will fluctuate infuture years. The fair value of each RSU granted is equal to themarket price of the Company’s stock at date of grant less the pres-ent value of expected dividends over the vesting period.
• Long-lived assets impairment reviewLong-lived assets (including goodwill) are reviewed for impairmentannually in the fourth quarter and whenever events or changes incircumstances indicate that the carrying amount of an asset maynot be recoverable. In assessing the recoverability of the Compa-ny’s long-lived assets, the Company considers changes ineconomic conditions and makes assumptions regarding estimatedfuture cash flows and other factors. Estimates of future cash flowsare highly subjective judgments based on the Company’s experi-ence and knowledge of its operations. These estimates can besignificantly impacted by many factors including changes in globaland local business and economic conditions, operating costs,inflation, competition, and consumer and demographic trends. Akey assumption impacting estimated future cash flows is the esti-mated change in comparable sales. If the Company’s estimates orunderlying assumptions change in the future, the Company may berequired to record impairment charges.
When the Company sells an existing business to a devel-opmental licensee, it determines when these businesses are “heldfor sale” in accordance with the requirements of SFAS No. 144,Accounting for the Impairment or Disposal of Long-lived Assets.Impairment charges on assets held for sale are recognized when
McDonald’s Corporation Annual Report 2008 37
management and, if required, the Company’s Board of Directorshave approved and committed to a plan to dispose of the assets,the assets are available for disposal, the disposal is probable ofoccurring within 12 months, and the net sales proceeds areexpected to be less than the assets’ net book value, among otherfactors. An impairment charge is recognized for the differencebetween the net book value of the business (including foreigncurrency translation adjustments recorded in accumulated othercomprehensive income in shareholders’ equity) and the estimatedcash sales price, less costs of disposal.
An alternative accounting policy would be to recharacterizesome or all of any loss as an intangible asset and amortize it toexpense over future periods based on the term of the relevantlicensing arrangement and as revenue is recognized for royaltiesand initial fees. Under this alternative for the 2007 Latam trans-action, approximately $900 million of the $1.7 billion impairmentcharge could have been recharacterized as an intangible asset andamortized over the franchise term of 20 years, resulting in about$45 million of expense annually. This policy would be based on aview that the consideration for the sale consists of two compo-nents–the cash sales price and the future royalties and initial fees.
The Company bases its accounting policy on management’sdetermination that royalties payable under its developmentallicense arrangements are substantially consistent with marketrates for similar license arrangements. The Company does notbelieve it would be appropriate to recognize an asset for the rightto receive market-based fees in future periods, particularly giventhe continuing support and services provided to the licensees.Therefore, the Company believes that the recognition of animpairment charge based on the net cash sales price reflects thesubstance of the sale transaction.
• Litigation accrualsFrom time to time, the Company is subject to proceedings, lawsuitsand other claims related to competitors, customers, employees,franchisees, government agencies, intellectual property, share-holders and suppliers. The Company is required to assess thelikelihood of any adverse judgments or outcomes to these mattersas well as potential ranges of probable losses. A determination ofthe amount of accrual required, if any, for these contingencies ismade after careful analysis of each matter. The required accrualmay change in the future due to new developments in each matteror changes in approach such as a change in settlement strategy indealing with these matters. The Company does not believe that anysuch matter currently being reviewed will have a material adverseeffect on its financial condition or results of operations.
• Income taxesThe Company records a valuation allowance to reduce its deferredtax assets if it is more likely than not that some portion or all of thedeferred assets will not be realized. While the Company hasconsidered future taxable income and ongoing prudent and feasibletax strategies, including the sale of appreciated assets, in assessingthe need for the valuation allowance, if these estimates andassumptions change in the future, the Company may be required toadjust its valuation allowance. This could result in a charge to, or anincrease in, income in the period such determination is made.
In addition, the Company operates within multiple taxing jurisdictionsand is subject to audit in these jurisdictions. The Company recordsaccruals for the estimated outcomes of these audits, and the accrualsmay change in the future due to new developments in each matter.During 2008, the IRS examination of the Company’s 2005-2006 U.S.tax returns was completed. The tax provision impact associated with the
completion of this examination was not significant. During 2007, theCompany recorded a $316 million benefit as a result of the completionof an IRS examination of the Company’s 2003-2004 U.S. tax returns.The Company’s 2007 U.S. tax return is currently under examination andthe completion of the examination, which will ultimately include the2008 U.S. tax return, is expected in 2011.
Deferred U.S. income taxes have not been recorded for tempo-rary differences totaling $6.9 billion related to investments incertain foreign subsidiaries and corporate joint ventures. Thetemporary differences consist primarily of undistributed earningsthat are considered permanently invested in operations outside theU.S. If management’s intentions change in the future, deferredtaxes may need to be provided.
Effects of changing prices—inflationAlthough inflationary cost pressures increased globally in 2008,the Company has demonstrated an ability to manage inflationarycost increases effectively. This is because of rapid inventory turn-over, the ability to adjust menu prices, cost controls and substantialproperty holdings, many of which are at fixed costs and partlyfinanced by debt made less expensive by inflation.
Reconciliation of returns on incremental invested capitalReturn on incremental invested capital (ROIIC) is a measure reviewedby management over one-year and three-year time periods to eval-uate the overall profitability of the business units, the effectiveness ofcapital deployed and the future allocation of capital. This measure iscalculated using operating income and constant foreign exchangerates to exclude the impact of foreign currency translation. Thenumerator is the Company’s incremental operating income plusdepreciation and amortization, from the base period, adjusted for theimpact of the Latam transaction in 2007. While the Company hasconverted certain other markets to a developmental licensearrangement, management believes the Latam transaction and theassociated charge are not indicative of ongoing operations due to thesize and scope of the transaction. Management believes that theadjusted operating results better reflect the underlying businesstrends relevant to the periods presented.
The denominator is the weighted-average adjusted cash usedfor investing activities during the applicable one- or three-yearperiod. Adjusted cash used for investing activities is defined ascash used for investing activities less cash generated from inves-ting activities related to the Boston Market, Chipotle, Latam andPret A Manger transactions. The weighted-average adjusted cashused for investing activities is based on a weighting applied on aquarterly basis. These weightings are used to reflect the estimatedcontribution of each quarter’s investing activities to incrementaloperating income. For example, fourth quarter 2008 investingactivities are weighted less because the assets purchased haveonly recently been deployed and would have generated littleincremental operating income (12.5% of fourth quarter 2008investing activities are included in the one-year and three-yearcalculations). In contrast, fourth quarter 2007 is heavily weightedbecause the assets purchased were deployed more than 12months ago, and therefore have a full year impact on 2008 operat-ing income, with little or no impact to the base period (87.5% and100.0% of fourth quarter 2007 investing activities are included inthe one-year and three-year calculations, respectively). Manage-ment believes that weighting cash used for investing activitiesprovides a more accurate reflection of the relationship between itsinvestments and returns than a simple average.
38 McDonald’s Corporation Annual Report 2008

The reconciliations to the most comparable measurements, in accordance with accounting principles generally accepted in the U.S.,for the numerator and denominator of the one-year and three-year ROIIC are as follows:
One-year ROIIC calculation
Years ended December 31, 2008 2007Incremental
changeNUMERATOR:Operating income $6,442.9 $3,879.0 $ 2,563.9Depreciation and amortization(1) 1,207.8 1,192.8 15.0Latam transaction 1,665.3 (1,665.3)Currency translation(2) (180.7)Incremental adjusted operating income plus
depreciation and amortization(at constant foreign exchange rates) $ 732.9
DENOMINATOR:Weighted-average adjusted cash used for investing
activities(3) $ 1,911.9Currency translation(2) (25.9)Weighted-average adjusted cash used for
investing activities (at constant foreignexchange rates) $ 1,886.0
One-year ROIIC 38.9%
(1) Represents depreciation and amortization from continuing operations.
(2) Represents the effect of foreign currency translation by translating results at an averageexchange rate for the periods measured.
(3) Represents one-year weighted-average adjusted cash used for investing activities,determined by applying the weightings below to the adjusted cash used for investingactivities for each quarter in the two-year period ended December 31, 2008.
Years ended December 31,2007 2008
Cash used for investing activities $1,150.1 $1,624.7Less: Cash generated from investing
activities related to Boston Market (184.3)Less: Cash generated from investing
activities related to Latam transaction (647.5)Less: Cash generated from investing
activities related to Pret A Mangertransaction (229.4)
Adjusted cash used for investing activities $1,981.9 $1,854.1AS A PERCENTQuarters ended:March 31 12.5% 87.5%June 30 37.5 62.5September 30 62.5 37.5December 31 87.5 12.5
Three-year ROIIC calculation
Years ended December 31, 2008 2005Incremental
changeNUMERATOR:Operating income $6,442.9 $3,984.0 $2,458.9Depreciation and amortization(4) 1,207.8 1,187.6 20.2Currency translation(5) (508.3)Incremental adjusted operating income plus
depreciation and amortization(at constant foreign exchange rates) $1,970.8
DENOMINATOR:Weighted-average adjusted cash used for investing
activities(6) $5,267.5Currency translation(5) (14.0)Weighted-average adjusted cash used for
investing activities (at constant foreignexchange rates) $5,253.5
Three-year ROIIC 37.5%(4) Represents depreciation and amortization from continuing operations.
(5) Represents the effect of foreign currency translation by translating results at an averageexchange rate for the periods measured.
(6) Represents three-year weighted-average adjusted cash used for investing activities,determined by applying the weightings below to the adjusted cash used for investingactivities for each quarter in the four-year period ended December 31, 2008.
Years ended December 31,2005 2006 2007 2008
Cash used for investingactivities $1,817.8 $1,274.1 $1,150.1 $1,624.7
Less:Cash (generated from)used for investing activitiesrelated to Boston Market& Chipotle 109.0 (203.8) (184.3)
Less: Cash generatedfrom investing activitiesrelated to Latamtransaction (647.5)
Less: Cash generatedfrom investing activitiesrelated to Pret AManger transaction (229.4)
Adjusted cash used forinvesting activities $1,708.8 $1,477.9 $1,981.9 $1,854.1
AS A PERCENTQuarters ended:March 31 12.5% 100.0% 100.0% 87.5%June 30 37.5 100.0 100.0 62.5September 30 62.5 100.0 100.0 37.5December 31 87.5 100.0 100.0 12.5
Risk factors and cautionary statement about forward-looking informationThis report includes forward-looking statements about our plans and future performance, including those under Outlook for 2009. Thesestatements use such words as “may,” “will,” “expect,” “believe” and “plan.” They reflect our expectations and speak only as of the date ofthis report. We do not undertake to update them. Our expectations (or the underlying assumptions) may change or not be realized, andyou should not rely unduly on forward-looking statements. We have identified the principal risks and uncertainties that affect ourperformance in the Company’s filings with the Securities and Exchange Commission, and investors are urged to consider these risks anduncertainties when evaluating our historical and expected performance.
McDonald’s Corporation Annual Report 2008 39
CONSOLIDATED STATEMENT OF INCOME
In millions, except per share data Years ended December 31, 2008 2007 2006REVENUESSales by Company-operated restaurants $16,560.9 $16,611.0 $15,402.4Revenues from franchised restaurants 6,961.5 6,175.6 5,492.8
Total revenues 23,522.4 22,786.6 20,895.2OPERATING COSTS AND EXPENSESCompany-operated restaurant expenses
Food & paper 5,586.1 5,487.4 5,111.8Payroll & employee benefits 4,300.1 4,331.6 3,991.1Occupancy & other operating expenses 3,766.7 3,922.7 3,802.2
Franchised restaurants–occupancy expenses 1,230.3 1,139.7 1,058.1Selling, general & administrative expenses 2,355.5 2,367.0 2,295.7Impairment and other charges, net 6.0 1,670.3 134.2Other operating (income) expense, net (165.2) (11.1) 69.1
Total operating costs and expenses 17,079.5 18,907.6 16,462.2Operating income 6,442.9 3,879.0 4,433.0Interest expense–net of capitalized interest of $12.3, $6.9 and $5.4 522.6 410.1 401.9Nonoperating (income) expense, net (77.6) (103.2) (123.3)Gain on sale of investment (160.1)Income from continuing operations before provision for income taxes 6,158.0 3,572.1 4,154.4Provision for income taxes 1,844.8 1,237.1 1,288.3Income from continuing operations 4,313.2 2,335.0 2,866.1Income from discontinued operations (net of taxes of $34.5 and $101.9) 60.1 678.1Net income $ 4,313.2 $ 2,395.1 $ 3,544.2Per common share–basic:Continuing operations $ 3.83 $ 1.96 $ 2.32Discontinued operations 0.05 0.55Net income $ 3.83 $ 2.02 $ 2.87Per common share–diluted:Continuing operations $ 3.76 $ 1.93 $ 2.29Discontinued operations 0.05 0.54Net income $ 3.76 $ 1.98 $ 2.83Dividends declared per common share $ 1.625 $ 1.50 $ 1.00Weighted-average shares outstanding–basic 1,126.6 1,188.3 1,234.0Weighted-average shares outstanding–diluted 1,146.0 1,211.8 1,251.7
See Notes to consolidated financial statements.
40 McDonald’s Corporation Annual Report 2008
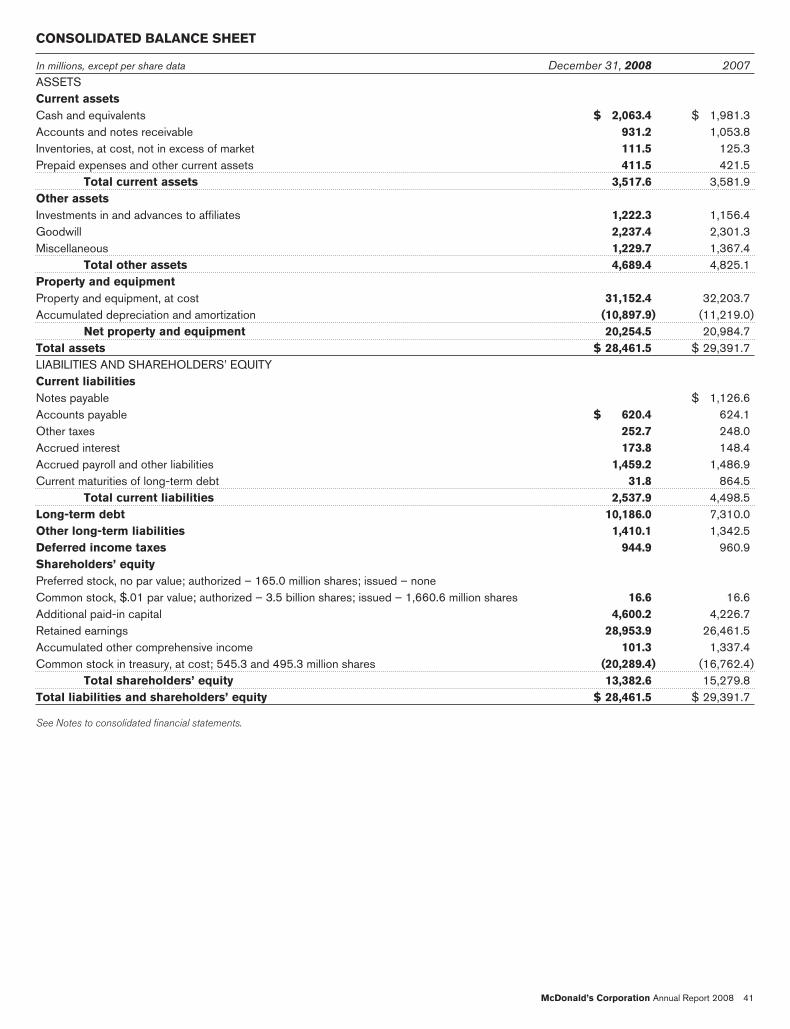
CONSOLIDATED BALANCE SHEET
In millions, except per share data December 31, 2008 2007ASSETSCurrent assetsCash and equivalents $ 2,063.4 $ 1,981.3Accounts and notes receivable 931.2 1,053.8Inventories, at cost, not in excess of market 111.5 125.3Prepaid expenses and other current assets 411.5 421.5
Total current assets 3,517.6 3,581.9Other assetsInvestments in and advances to affiliates 1,222.3 1,156.4Goodwill 2,237.4 2,301.3Miscellaneous 1,229.7 1,367.4
Total other assets 4,689.4 4,825.1Property and equipmentProperty and equipment, at cost 31,152.4 32,203.7Accumulated depreciation and amortization (10,897.9) (11,219.0)
Net property and equipment 20,254.5 20,984.7Total assets $ 28,461.5 $ 29,391.7LIABILITIES AND SHAREHOLDERS’ EQUITYCurrent liabilitiesNotes payable $ 1,126.6Accounts payable $ 620.4 624.1Other taxes 252.7 248.0Accrued interest 173.8 148.4Accrued payroll and other liabilities 1,459.2 1,486.9Current maturities of long-term debt 31.8 864.5
Total current liabilities 2,537.9 4,498.5Long-term debt 10,186.0 7,310.0Other long-term liabilities 1,410.1 1,342.5Deferred income taxes 944.9 960.9Shareholders’ equityPreferred stock, no par value; authorized – 165.0 million shares; issued – noneCommon stock, $.01 par value; authorized – 3.5 billion shares; issued – 1,660.6 million shares 16.6 16.6Additional paid-in capital 4,600.2 4,226.7Retained earnings 28,953.9 26,461.5Accumulated other comprehensive income 101.3 1,337.4Common stock in treasury, at cost; 545.3 and 495.3 million shares (20,289.4) (16,762.4)
Total shareholders’ equity 13,382.6 15,279.8Total liabilities and shareholders’ equity $ 28,461.5 $ 29,391.7
See Notes to consolidated financial statements.
McDonald’s Corporation Annual Report 2008 41
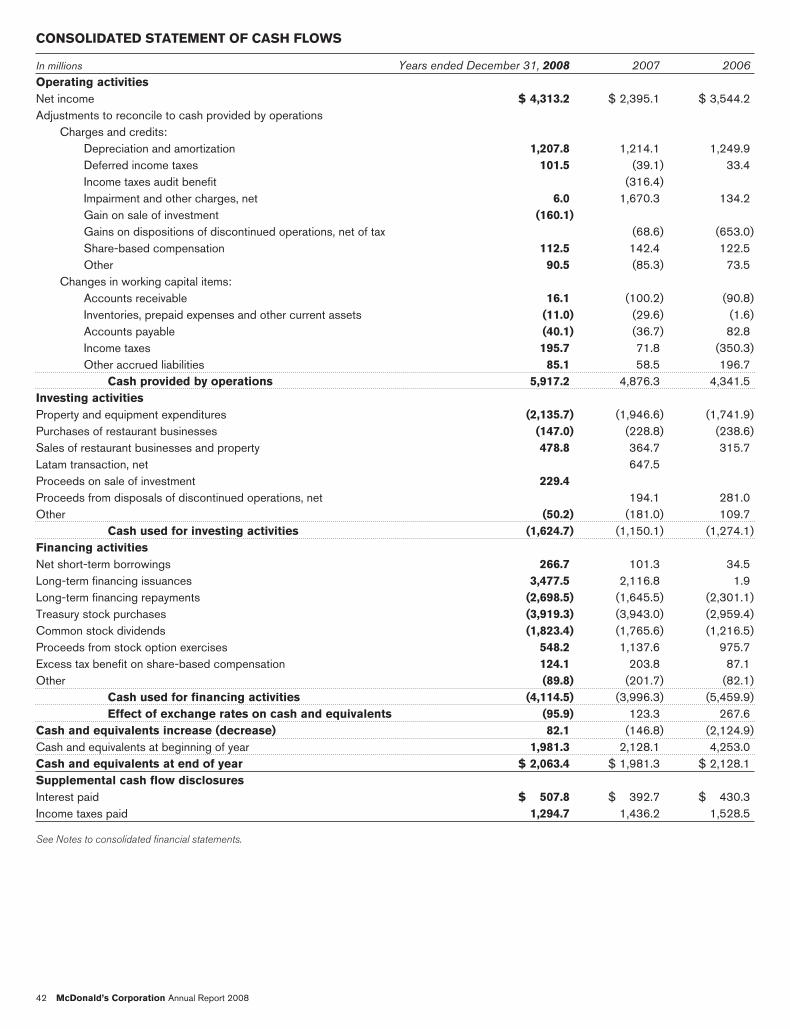
CONSOLIDATED STATEMENT OF CASH FLOWS
In millions Years ended December 31, 2008 2007 2006Operating activitiesNet income $ 4,313.2 $ 2,395.1 $ 3,544.2Adjustments to reconcile to cash provided by operations
Charges and credits:Depreciation and amortization 1,207.8 1,214.1 1,249.9Deferred income taxes 101.5 (39.1) 33.4Income taxes audit benefit (316.4)Impairment and other charges, net 6.0 1,670.3 134.2Gain on sale of investment (160.1)Gains on dispositions of discontinued operations, net of tax (68.6) (653.0)Share-based compensation 112.5 142.4 122.5Other 90.5 (85.3) 73.5
Changes in working capital items:Accounts receivable 16.1 (100.2) (90.8)Inventories, prepaid expenses and other current assets (11.0) (29.6) (1.6)Accounts payable (40.1) (36.7) 82.8Income taxes 195.7 71.8 (350.3)Other accrued liabilities 85.1 58.5 196.7
Cash provided by operations 5,917.2 4,876.3 4,341.5Investing activitiesProperty and equipment expenditures (2,135.7) (1,946.6) (1,741.9)Purchases of restaurant businesses (147.0) (228.8) (238.6)Sales of restaurant businesses and property 478.8 364.7 315.7Latam transaction, net 647.5Proceeds on sale of investment 229.4Proceeds from disposals of discontinued operations, net 194.1 281.0Other (50.2) (181.0) 109.7
Cash used for investing activities (1,624.7) (1,150.1) (1,274.1)Financing activitiesNet short-term borrowings 266.7 101.3 34.5Long-term financing issuances 3,477.5 2,116.8 1.9Long-term financing repayments (2,698.5) (1,645.5) (2,301.1)Treasury stock purchases (3,919.3) (3,943.0) (2,959.4)Common stock dividends (1,823.4) (1,765.6) (1,216.5)Proceeds from stock option exercises 548.2 1,137.6 975.7Excess tax benefit on share-based compensation 124.1 203.8 87.1Other (89.8) (201.7) (82.1)
Cash used for financing activities (4,114.5) (3,996.3) (5,459.9)Effect of exchange rates on cash and equivalents (95.9) 123.3 267.6
Cash and equivalents increase (decrease) 82.1 (146.8) (2,124.9)Cash and equivalents at beginning of year 1,981.3 2,128.1 4,253.0Cash and equivalents at end of year $ 2,063.4 $ 1,981.3 $ 2,128.1Supplemental cash flow disclosuresInterest paid $ 507.8 $ 392.7 $ 430.3Income taxes paid 1,294.7 1,436.2 1,528.5
See Notes to consolidated financial statements.
42 McDonald’s Corporation Annual Report 2008
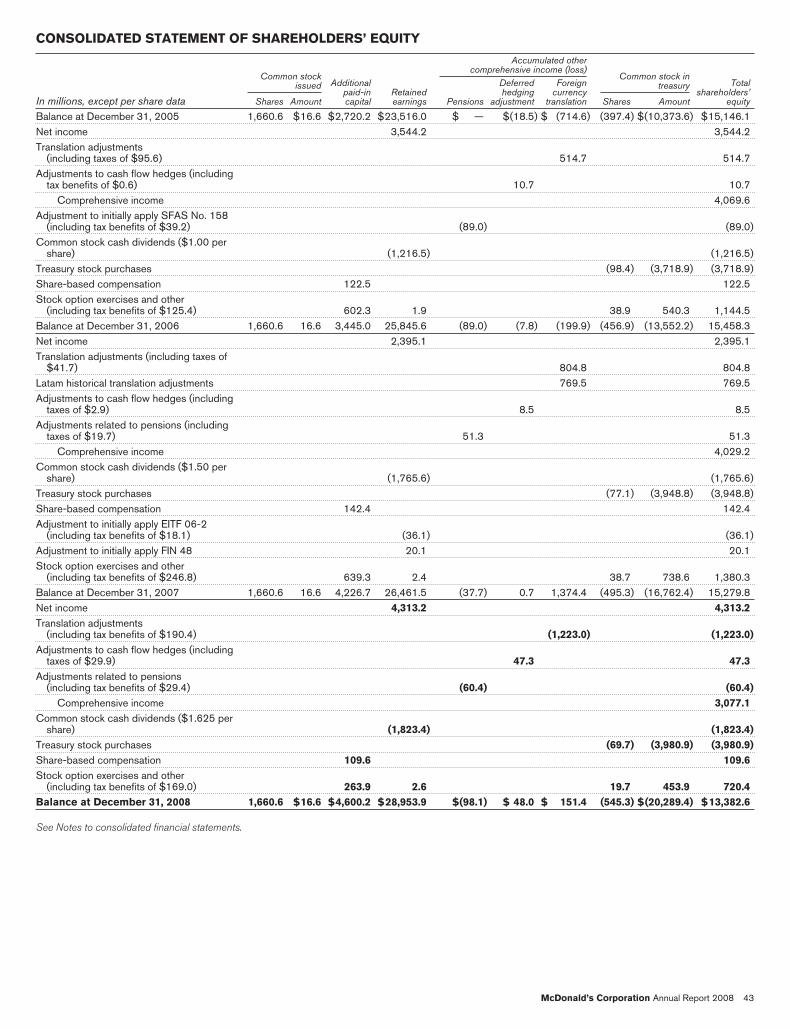
CONSOLIDATED STATEMENT OF SHAREHOLDERS’ EQUITY
Common stockissued
Accumulated othercomprehensive income (loss)
Common stock intreasury
In millions, except per share data
Additionalpaid-incapital
Retainedearnings
Deferredhedging
adjustment
Foreigncurrency
translation
Totalshareholders’
equityShares Amount Pensions Shares Amount
Balance at December 31, 2005 1,660.6 $16.6 $2,720.2 $23,516.0 $ — $(18.5) $ (714.6) (397.4) $(10,373.6) $15,146.1Net income 3,544.2 3,544.2Translation adjustments
(including taxes of $95.6) 514.7 514.7Adjustments to cash flow hedges (including
tax benefits of $0.6) 10.7 10.7Comprehensive income 4,069.6
Adjustment to initially apply SFAS No. 158(including tax benefits of $39.2) (89.0) (89.0)
Common stock cash dividends ($1.00 pershare) (1,216.5) (1,216.5)
Treasury stock purchases (98.4) (3,718.9) (3,718.9)Share-based compensation 122.5 122.5Stock option exercises and other
(including tax benefits of $125.4) 602.3 1.9 38.9 540.3 1,144.5Balance at December 31, 2006 1,660.6 16.6 3,445.0 25,845.6 (89.0) (7.8) (199.9) (456.9) (13,552.2) 15,458.3Net income 2,395.1 2,395.1Translation adjustments (including taxes of
$41.7) 804.8 804.8Latam historical translation adjustments 769.5 769.5Adjustments to cash flow hedges (including
taxes of $2.9) 8.5 8.5Adjustments related to pensions (including
taxes of $19.7) 51.3 51.3Comprehensive income 4,029.2
Common stock cash dividends ($1.50 pershare) (1,765.6) (1,765.6)
Treasury stock purchases (77.1) (3,948.8) (3,948.8)Share-based compensation 142.4 142.4Adjustment to initially apply EITF 06-2
(including tax benefits of $18.1) (36.1) (36.1)Adjustment to initially apply FIN 48 20.1 20.1Stock option exercises and other
(including tax benefits of $246.8) 639.3 2.4 38.7 738.6 1,380.3Balance at December 31, 2007 1,660.6 16.6 4,226.7 26,461.5 (37.7) 0.7 1,374.4 (495.3) (16,762.4) 15,279.8Net income 4,313.2 4,313.2Translation adjustments
(including tax benefits of $190.4) (1,223.0) (1,223.0)Adjustments to cash flow hedges (including
taxes of $29.9) 47.3 47.3Adjustments related to pensions
(including tax benefits of $29.4) (60.4) (60.4)Comprehensive income 3,077.1
Common stock cash dividends ($1.625 pershare) (1,823.4) (1,823.4)
Treasury stock purchases (69.7) (3,980.9) (3,980.9)Share-based compensation 109.6 109.6Stock option exercises and other
(including tax benefits of $169.0) 263.9 2.6 19.7 453.9 720.4Balance at December 31, 2008 1,660.6 $16.6 $4,600.2 $28,953.9 $(98.1) $ 48.0 $ 151.4 (545.3) $(20,289.4) $13,382.6
See Notes to consolidated financial statements.
McDonald’s Corporation Annual Report 2008 43
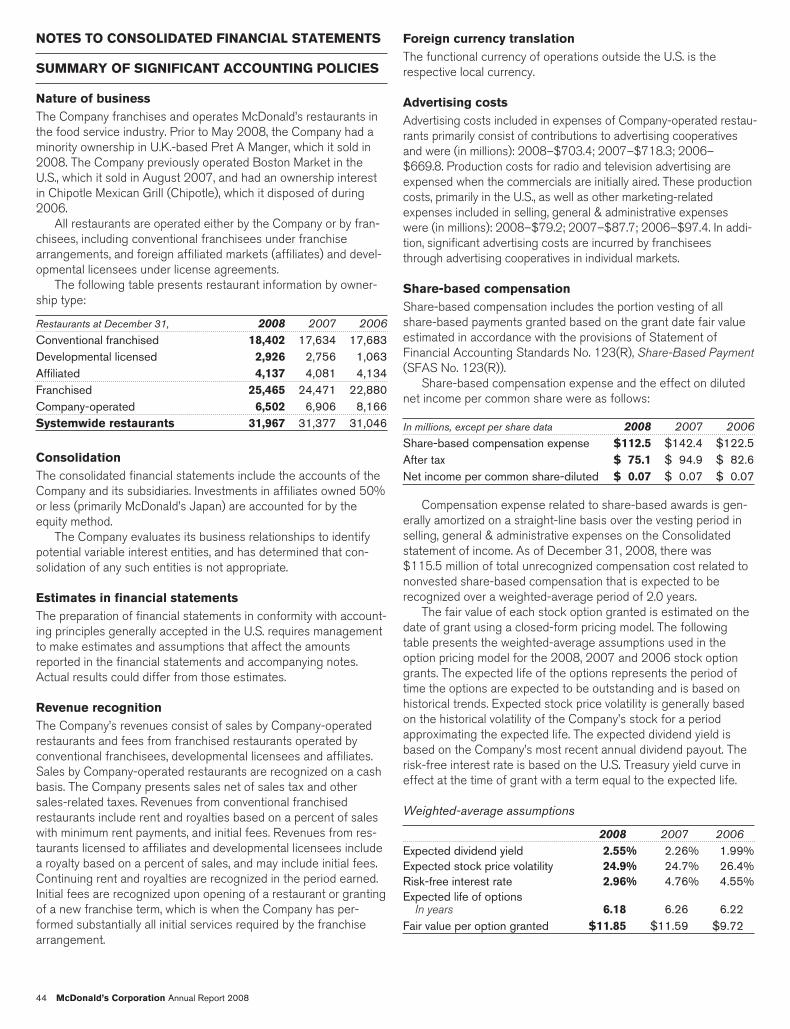
NOTES TO CONSOLIDATED FINANCIAL STATEMENTS
SUMMARY OF SIGNIFICANT ACCOUNTING POLICIES
Nature of businessThe Company franchises and operates McDonald’s restaurants inthe food service industry. Prior to May 2008, the Company had aminority ownership in U.K.-based Pret A Manger, which it sold in2008. The Company previously operated Boston Market in theU.S., which it sold in August 2007, and had an ownership interestin Chipotle Mexican Grill (Chipotle), which it disposed of during2006.
All restaurants are operated either by the Company or by fran-chisees, including conventional franchisees under franchisearrangements, and foreign affiliated markets (affiliates) and devel-opmental licensees under license agreements.
The following table presents restaurant information by owner-ship type:
Restaurants at December 31, 2008 2007 2006Conventional franchised 18,402 17,634 17,683Developmental licensed 2,926 2,756 1,063Affiliated 4,137 4,081 4,134Franchised 25,465 24,471 22,880Company-operated 6,502 6,906 8,166Systemwide restaurants 31,967 31,377 31,046
ConsolidationThe consolidated financial statements include the accounts of theCompany and its subsidiaries. Investments in affiliates owned 50%or less (primarily McDonald’s Japan) are accounted for by theequity method.
The Company evaluates its business relationships to identifypotential variable interest entities, and has determined that con-solidation of any such entities is not appropriate.
Estimates in financial statementsThe preparation of financial statements in conformity with account-ing principles generally accepted in the U.S. requires managementto make estimates and assumptions that affect the amountsreported in the financial statements and accompanying notes.Actual results could differ from those estimates.
Revenue recognitionThe Company’s revenues consist of sales by Company-operatedrestaurants and fees from franchised restaurants operated byconventional franchisees, developmental licensees and affiliates.Sales by Company-operated restaurants are recognized on a cashbasis. The Company presents sales net of sales tax and othersales-related taxes. Revenues from conventional franchisedrestaurants include rent and royalties based on a percent of saleswith minimum rent payments, and initial fees. Revenues from res-taurants licensed to affiliates and developmental licensees includea royalty based on a percent of sales, and may include initial fees.Continuing rent and royalties are recognized in the period earned.Initial fees are recognized upon opening of a restaurant or grantingof a new franchise term, which is when the Company has per-formed substantially all initial services required by the franchisearrangement.
Foreign currency translationThe functional currency of operations outside the U.S. is therespective local currency.
Advertising costsAdvertising costs included in expenses of Company-operated restau-rants primarily consist of contributions to advertising cooperativesand were (in millions): 2008–$703.4; 2007–$718.3; 2006–$669.8. Production costs for radio and television advertising areexpensed when the commercials are initially aired. These productioncosts, primarily in the U.S., as well as other marketing-relatedexpenses included in selling, general & administrative expenseswere (in millions): 2008–$79.2; 2007–$87.7; 2006–$97.4. In addi-tion, significant advertising costs are incurred by franchiseesthrough advertising cooperatives in individual markets.
Share-based compensationShare-based compensation includes the portion vesting of allshare-based payments granted based on the grant date fair valueestimated in accordance with the provisions of Statement ofFinancial Accounting Standards No. 123(R), Share-Based Payment
(SFAS No. 123(R)).Share-based compensation expense and the effect on diluted
net income per common share were as follows:
In millions, except per share data 2008 2007 2006Share-based compensation expense $112.5 $142.4 $122.5After tax $ 75.1 $ 94.9 $ 82.6Net income per common share-diluted $ 0.07 $ 0.07 $ 0.07
Compensation expense related to share-based awards is gen-erally amortized on a straight-line basis over the vesting period inselling, general & administrative expenses on the Consolidatedstatement of income. As of December 31, 2008, there was$115.5 million of total unrecognized compensation cost related tononvested share-based compensation that is expected to berecognized over a weighted-average period of 2.0 years.
The fair value of each stock option granted is estimated on thedate of grant using a closed-form pricing model. The followingtable presents the weighted-average assumptions used in theoption pricing model for the 2008, 2007 and 2006 stock optiongrants. The expected life of the options represents the period oftime the options are expected to be outstanding and is based onhistorical trends. Expected stock price volatility is generally basedon the historical volatility of the Company’s stock for a periodapproximating the expected life. The expected dividend yield isbased on the Company’s most recent annual dividend payout. Therisk-free interest rate is based on the U.S. Treasury yield curve ineffect at the time of grant with a term equal to the expected life.
Weighted-average assumptions
2008 2007 2006Expected dividend yield 2.55% 2.26% 1.99%Expected stock price volatility 24.9% 24.7% 26.4%Risk-free interest rate 2.96% 4.76% 4.55%Expected life of options
In years 6.18 6.26 6.22Fair value per option granted $11.85 $11.59 $9.72
44 McDonald’s Corporation Annual Report 2008

Property and equipmentProperty and equipment are stated at cost, with depreciation andamortization provided using the straight-line method over the fol-lowing estimated useful lives: buildings–up to 40 years; leasehold
improvements–the lesser of useful lives of assets or lease terms,which generally include option periods; and equipment–three to 12years.
GoodwillGoodwill represents the excess of cost over the net tangibleassets and identifiable intangible assets of acquired restaurantbusinesses. The Company’s goodwill primarily results from pur-chases of McDonald’s restaurants from franchisees and ownershipincreases in international subsidiaries or affiliates, and it is gen-erally assigned to the reporting unit expected to benefit from thesynergies of the combination. If a Company-operated restaurant issold within 24 months of acquisition, the goodwill associated withthe acquisition is written off in its entirety. If a restaurant is soldbeyond 24 months from the acquisition, the amount of goodwillwritten off is based on the relative fair value of the business soldcompared to the portion of the reporting unit (defined as eachindividual country).
In accordance with Statement of Financial Accounting Stan-dards No. 142, Goodwill and Intangible Assets, the annual goodwillimpairment test, conducted in the fourth quarter, compares the fairvalue of a reporting unit, generally based on discounted futurecash flows, with its carrying amount including goodwill. If the carry-ing amount of a reporting unit exceeds its fair value, an impairmentloss is measured as the difference between the implied fair valueof the reporting unit’s goodwill and the carrying amount of good-will.
The following table presents the 2008 activity in goodwill bysegment:
In millions U.S. Europe APMEA(1)Other Countries
& Corporate(2) Consolidated
Balance at December 31, 2007 $1,146.5 $700.2 $306.1 $148.5 $2,301.3Net restaurant purchases (sales) 3.2 53.2 4.9 (2.4) 58.9Ownership increases in subsidiaries/affiliates 10.1 10.1Currency translation (71.5) (34.3) (27.1) (132.9)Balance at December 31, 2008 $1,149.7 $692.0 $276.7 $119.0 $2,237.4(1) APMEA represents Asia/Pacific, Middle East and Africa.
(2) Other Countries & Corporate represents Canada, Latin America and Corporate.
Long-lived assetsIn accordance with Statement of Financial Accounting StandardsNo. 144, Accounting for the Impairment or Disposal of Long-Lived
Assets (SFAS No. 144), long-lived assets are reviewed for impair-ment annually in the fourth quarter and whenever events orchanges in circumstances indicate that the carrying amount of anasset may not be recoverable. For purposes of annually reviewingMcDonald’s restaurant assets for potential impairment, assets areinitially grouped together at a television market level in the U.S. andat a country level for each of the international markets. The Com-pany manages its restaurants as a group or portfolio withsignificant common costs and promotional activities; as such, anindividual restaurant’s cash flows are not generally independent ofthe cash flows of others in a market. If an indicator of impairment(e.g., negative operating cash flows for the most recent trailing24-month period) exists for any grouping of assets, an estimate ofundiscounted future cash flows produced by each individualrestaurant within the asset grouping is compared to its carryingvalue. If an individual restaurant is determined to be impaired, theloss is measured by the excess of the carrying amount of the res-taurant over its fair value as determined by an estimate ofdiscounted future cash flows.
Losses on assets held for disposal are recognized when man-agement and the Board of Directors, as required, have approvedand committed to a plan to dispose of the assets, the assets areavailable for disposal, the disposal is probable of occurring within12 months, and the net sales proceeds are expected to be lessthan its net book value, among other factors. Generally, suchlosses relate to restaurants that have closed and ceased oper-ations as well as other assets that meet the criteria to beconsidered “available for sale” in accordance with SFAS No. 144.
When the Company sells an existing business to a devel-opmental licensee, the licensee purchases the business, includingthe real estate, and uses his/her capital and local knowledge tobuild the McDonald’s Brand and optimize sales and profitabilityover the long term. The sale of the business includes primarily land,buildings and improvements, and equipment, along with the fran-chising and leasing rights under existing agreements. Under therelated developmental licensing arrangement, the Company col-lects a royalty based on a percent of sales, as well as initial fees,but does not have either any capital invested in the business or anycommitment to invest future capital.
An impairment charge is recognized for the difference betweenthe net book value of the business (including any foreign currencytranslation adjustments recorded in accumulated other compre-hensive income in shareholders’ equity) and the estimated cashsales price, less costs of disposal.
The Company bases its accounting policy on management’sdetermination that royalties payable under its developmentallicense arrangements are substantially consistent with marketrates for similar license arrangements. Therefore, the Companybelieves that the recognition of an impairment charge based on thenet cash sales price reflects the substance of the sale transaction.
Financial instrumentsThe Company generally borrows on a long-term basis and isexposed to the impact of interest rate changes and foreign cur-rency fluctuations. The Company uses foreign currencydenominated debt and derivative instruments to mitigate the impactof these changes. The Company does not use derivatives with alevel of complexity or with a risk higher than the exposures to be
McDonald’s Corporation Annual Report 2008 45

hedged and does not hold or issue derivatives for trading purposes.The counterparties to these agreements consist of a diverse
group of financial institutions. The Company continually monitors itspositions and the credit ratings of its counterparties and adjustspositions as appropriate. The Company did not have significantexposure to any individual counterparty at December 31, 2008 andhas master agreements that contain netting arrangements. Some ofthese agreements also require each party to post collateral if creditratings fall below, or aggregate exposures exceed, certain con-tractual limits. At December 31, 2008, neither the Company nor itscounterparties were required to post collateral on any derivativeposition. At December 31, 2007, the Company was required to postcollateral of $54.8 million, which was used to reduce the carryingvalue of the derivatives recorded in other long-term liabilities.
Statement of Financial Accounting Standards No. 133, Account-
ing for Derivative Instruments and Hedging Activities (SFASNo. 133), as amended, requires companies to recognize allderivatives as either assets or liabilities on the balance sheet at fairvalue. SFAS No. 133 also requires companies to designate allderivatives that qualify as hedging instruments as fair value hedges,cash flow hedges or hedges of net investments in foreign oper-ations. This designation is based upon the exposure being hedged.
The Company’s use of derivatives primarily consists of interestrate exchange agreements, forward foreign currency exchangeagreements and foreign currency options. These derivatives wereclassified on the Consolidated balance sheet at December 31,2008 as follows: miscellaneous other assets–$87.6 million; pre-paid expenses and other current assets–$43.8 million; accruedpayroll and other liabilities–$22.1 million; and other long-termliabilities (excluding accrued interest)–$3.5 million. For the yearended December 31, 2007, the Company’s derivatives wererecorded in miscellaneous other assets–$63.7 million and otherlong-term liabilities (excluding accrued interest)–$70.3 million. Allderivative purchases and settlements are classified in other financ-ing activities on the Consolidated statement of cash flows.
There was no significant impact to the Company’s earningsrelated to the ineffective portion of any hedging instruments forthe three years ended December 31, 2008.
• Fair value hedgesThe Company enters into fair value hedges to reduce the exposureto changes in the fair values of certain liabilities. The fair valuehedges the Company enters into consist of interest rate exchangeagreements which convert a portion of its fixed-rate debt intofloating-rate debt.
For fair value hedges, the gains or losses on derivatives as wellas the offsetting gains or losses on the related hedged itemsresulting from changes in fair value are recognized in nonoperating(income) expense, net.
• Cash flow hedgesThe Company enters into cash flow hedges to reduce theexposure to variability in certain expected future cash flows. Thetypes of cash flow hedges the Company enters into include(i) interest rate exchange agreements that effectively convert aportion of floating-rate debt to fixed-rate debt and are designed toreduce the impact of interest rate changes on future interestexpense; and (ii) forward foreign exchange contracts and foreigncurrency options that are designed to protect against the reductionin value of forecasted foreign currency cash flows (such as royal-ties denominated in foreign currencies) due to changes in foreigncurrency exchange rates.
For cash flow hedges, the effective portion of the gains orlosses on derivatives is reported in the deferred hedging adjust-ment component of accumulated other comprehensive income inshareholders’ equity and reclassified into earnings in the sameperiod or periods in which the hedged transaction affects earnings.The remaining gain or loss, if any, is recognized in earningscurrently.
The Company recorded after-tax adjustments related to cashflow hedges to the deferred hedging adjustment component ofaccumulated other comprehensive income in shareholders’ equity.The Company recorded net increases of $47.3 million, $8.5 millionand $10.7 million for the years ended December 31, 2008, 2007and 2006, respectively. Based on interest rates and foreign cur-rency exchange rates at December 31, 2008, the majority ofdeferred hedging adjustments, after tax, included in accumulatedother comprehensive income in shareholders’ equity atDecember 31, 2008, will be recognized in earnings in 2009 as theunderlying hedged transactions are realized. The maximummaturity date of any cash flow hedge of forecasted transactions atDecember 31, 2008 was 15 months, excluding an instrumenthedging forecasted payments of variable interest on an existingfinancial instrument that matures in the fourth quarter of 2010.
• Hedges of net investments in foreign operationsThe Company uses forward foreign exchange contracts and for-eign currency denominated debt to hedge its investments incertain foreign subsidiaries and affiliates. Realized and unrealizedtranslation adjustments from these hedges are included in share-holders’ equity in the foreign currency translation component ofaccumulated other comprehensive income and offset translationadjustments on the underlying net assets of foreign subsidiariesand affiliates, which also are recorded in accumulated other com-prehensive income.
During the years ended December 31, 2008, 2007 and 2006,the Company recorded decreases in translation adjustments inaccumulated other comprehensive income of $31.2 million aftertax (included in the net decrease of $1.2 billion of translationadjustments on the Consolidated statement of shareholders’equity), $76.5 million after tax, and $23.2 million after tax,respectively, related to hedges of net investments.
Sales of stock by subsidiaries and affiliatesAs permitted by Staff Accounting Bulletin No. 51 issued by theSecurities and Exchange Commission (SEC), when a subsidiary oraffiliate sells unissued shares in a public offering, the Companyrecords an adjustment to reflect an increase or decrease in thecarrying value of its investment and a resulting nonoperating gain orloss. In 2006, the Company’s gain of $32.0 million as a result of theChipotle initial public offering (IPO) is reported in discontinuedoperations.
Income tax uncertaintiesIn 2006, the Financial Accounting Standards Board (FASB) issuedInterpretation No. 48, Accounting for Uncertainty in Income Taxes
(FIN 48), which is an interpretation of FASB Statement No. 109,Accounting for Income Taxes. FIN 48 clarifies the accounting forincome taxes by prescribing the minimum recognition threshold a taxposition is required to meet before being recognized in the financialstatements. FIN 48 also provides guidance on derecognition,measurement, classification, interest and penalties, accounting ininterim periods, disclosure and transition. The Company adopted the
46 McDonald’s Corporation Annual Report 2008

provisions of FIN 48 effective January 1, 2007, as required. As aresult of the implementation of FIN 48, the Company recorded a$20.1 million cumulative adjustment to increase the January 1, 2007balance of retained earnings. FIN 48 requires that a liability associatedwith an unrecognized tax benefit be classified as a long-term liabilityexcept for the amount for which cash payment is anticipated withinone year. Upon adoption of FIN 48, $338.7 million of net tax liabilitieswere reclassified from current to long-term.
The Company, like other multi-national companies, is regularlyaudited by federal, state and foreign tax authorities, and taxassessments may arise several years after tax returns have beenfiled. Beginning in 2007, tax liabilities are recorded when, inmanagement’s judgment, a tax position does not meet the morelikely than not threshold for recognition as prescribed by FIN 48.For tax positions that meet the more likely than not threshold, a taxliability may be recorded depending on management’s assessmentof how the tax position will ultimately be settled. Prior to 2007, taxliabilities had been recorded when, in management’s judgment, itwas not probable that the Company’s tax position would ultimatelybe sustained.
The Company records interest on unrecognized tax benefits inthe provision for income taxes.
Per common share informationDiluted net income per common share is calculated using netincome divided by diluted weighted-average shares. Dilutedweighted-average shares include weighted-average shares out-standing plus the dilutive effect of share-based compensationcalculated using the treasury stock method, of (in millions ofshares): 2008–19.4; 2007–23.5; 2006–17.7. Stock options thatwere not included in diluted weighted-average shares becausethey would have been antidilutive were (in millions of shares):2008–0.6; 2007–0.7; 2006–16.4.
The Company has elected to exclude the pro forma deferredtax asset associated with share-based compensation in net incomeper share.
Statement of cash flowsThe Company considers short-term, highly liquid investments withan original maturity of 90 days or less to be cash equivalents.
Employers’ accounting for defined benefit pension andother postretirement plansIn 2006, the FASB issued Statement of Financial AccountingStandards No. 158, Employers’ Accounting for Defined Benefit
Pension and Other Postretirement Plans, an amendment of FASB
Statements No. 87, 88, 106 and 132(R) (SFAS No. 158). SFASNo. 158 requires the Company to recognize the overfunded orunderfunded status of a defined benefit postretirement plan as anasset or liability on the Consolidated balance sheet and to recog-nize changes in that funded status during the year throughaccumulated other comprehensive income. The Company adoptedthe applicable provisions of SFAS No. 158 effective December 31,2006, as required, which resulted in a net decrease to accumu-lated other comprehensive income of $89.0 million for a limitednumber of applicable international markets. In 2008, the Companyrecorded an unrecognized actuarial loss, net of tax, of $60.4 mil-lion and in 2007 recorded an unrecognized actuarial gain, net oftax, of $51.3 million, in accumulated other comprehensive income.
Sabbatical leaveIn certain countries, eligible employees are entitled to take a paidsabbatical after a predetermined period of service. In 2006, theFASB ratified Emerging Issues Task Force Issue 06-2, Accounting
for Sabbatical Leave and Other Similar Benefits Pursuant to FASB
Statement No. 43, Accounting for Compensated Absences (EITF06-2). Under EITF 06-2, compensation costs associated with asabbatical should be accrued over the requisite service period,assuming certain conditions are met. Previously, the Companyexpensed sabbatical costs as incurred. The Company adoptedEITF 06-2 effective January 1, 2007, as required and accordingly,recorded a $36.1 million cumulative adjustment, net of tax, todecrease beginning retained earnings in the first quarter 2007.The annual impact to earnings is not significant.
Fair value measurementsIn 2006, the FASB issued Statement of Financial AccountingStandards No. 157, Fair Value Measurements (SFAS No. 157).SFAS No. 157 defines fair value, establishes a framework formeasuring fair value in accordance with generally acceptedaccounting principles, and expands disclosures about fair valuemeasurements. This statement does not require any new fair valuemeasurements; rather, it applies to other accounting pronounce-ments that require or permit fair value measurements. Theprovisions of SFAS No. 157, as issued, were effective January 1,2008. However, in February 2008, the FASB deferred the effec-tive date of SFAS No. 157 for one year for certain non-financialassets and non-financial liabilities, except those that are recog-nized or disclosed at fair value in the financial statements on arecurring basis (i.e., at least annually). The Company adopted therequired provisions of SFAS No. 157 related to debt andderivatives as of January 1, 2008 and elected the deferral fornon-financial assets and liabilities. The effect of adopting thisstandard was not significant, and the Company does not expectthe January 1, 2009 adoption of SFAS No. 157 for non-financialassets and liabilities to have a significant impact on its con-solidated financial statements.
Fair value is defined under SFAS No. 157 as the price thatwould be received to sell an asset or paid to transfer a liability inthe principal or most advantageous market in an orderly trans-action between market participants on the measurement date.SFAS No. 157 also establishes a three-level hierarchy, whichrequires an entity to maximize the use of observable inputs andminimize the use of unobservable inputs when measuring fairvalue.
The valuation hierarchy is based upon the transparency ofinputs to the valuation of an asset or liability on the measurementdate. The three levels are defined as follows:
• Level 1 – inputs to the valuation methodology are quoted prices(unadjusted) for an identical asset or liability in an active market.
• Level 2 – inputs to the valuation methodology include quotedprices for a similar asset or liability in an active market or model-derived valuations in which all significant inputs are observablefor substantially the full term of the asset or liability.
• Level 3 – inputs to the valuation methodology are unobservableand significant to the fair value measurement of the asset orliability.
The Company’s use of derivatives primarily consists of interestrate exchange agreements, forward foreign currency exchangeagreements and foreign currency options. The Company does not
McDonald’s Corporation Annual Report 2008 47
use derivatives with a level of complexity or with a risk higher thanthe exposures to be hedged and does not hold or issue derivativesfor trading purposes.
Certain of the Company’s derivatives are valued using variouspricing models or discounted cash flow analyses that incorporateobservable market parameters, such as interest rate yield curves,option volatilities and currency rates, classified as Level 2 withinthe valuation hierarchy. In accordance with the requirements ofSFAS No. 157, derivative valuations incorporate credit risk adjust-ments that are necessary to reflect the probability of default by thecounterparty or the Company.
The following table presents financial assets and liabilitiesmeasured at fair value on a recurring basis as of December 31,2008 by SFAS No. 157 valuation hierarchy:
In millions Level 1 Level 2 Level 3Carrying
Value
Cash equivalents $444.9 $444.9Investments 96.1* 96.1Derivative receivables 90.2* $131.4 221.6Total assets at fair value $631.2 $131.4 $762.6Derivative payables $ (25.6) $ (25.6)Total liabilities at fair
value $ (25.6) $ (25.6)* Represents long-term investments and derivatives that hedge market-driven changes in
liabilities associated with the Company’s supplemental benefit plans.
Business combinationsIn 2007, the FASB issued Statement of Financial AccountingStandards No. 141(R), Business Combinations (SFAS No. 141(R)).SFAS No. 141(R) requires the acquiring entity in a businesscombination to record all assets acquired and liabilities assumed attheir respective acquisition-date fair values, changes the recog-nition of assets acquired and liabilities assumed arising frompreacquisition contingencies, and requires the expensing ofacquisition-related costs as incurred. SFAS No. 141(R) appliesprospectively to business combinations for which the acquisitiondate is on or after January 1, 2009. We do not expect the adoptionof SFAS No. 141(R) to have a significant impact on our con-solidated financial statements.
Noncontrolling interestsIn 2007, the FASB issued Statement of Financial AccountingStandards No. 160, Noncontrolling Interests in Consolidated
Financial Statements (an amendment of Accounting ResearchBulletin No. 51 (ARB 51)) (SFAS No. 160). SFAS No. 160amends ARB 51 to establish accounting and reporting standardsfor the noncontrolling interest in a subsidiary and for thedeconsolidation of a subsidiary. SFAS No. 160 becomes effectivebeginning January 1, 2009 and is required to be adopted pro-spectively, except for the reclassification of noncontrollinginterests to equity and the recasting of net income (loss) attribut-able to both the controlling and noncontrolling interests, which arerequired to be adopted retrospectively. We do not expect the adop-tion of SFAS No. 160 to have a significant impact on ourconsolidated financial statements.
PROPERTY AND EQUIPMENT
Net property and equipment consisted of:
In millions December 31, 2008 2007Land $ 4,689.6 $ 4,836.6Buildings and improvements
on owned land 10,952.3 11,306.6Buildings and improvements
on leased land 10,788.6 10,962.6Equipment, signs and seating 4,205.1 4,558.2Other 516.8 539.7
31,152.4 32,203.7Accumulated depreciation and
amortization (10,897.9) (11,219.0)Net property and equipment $20,254.5 $ 20,984.7
Depreciation and amortization expense related to continuingoperations was (in millions): 2008-$1,161.6; 2007-$1,145.0;2006-$1,146.3.
DISCONTINUED OPERATIONS
The Company continues to focus its management and financialresources on the McDonald’s restaurant business as it believes theopportunities for long-term growth remain significant. Accordingly,during the third quarter 2007, the Company sold its investment inBoston Market. In 2006, the Company disposed of its investmentin Chipotle via public stock offerings in the first and second quar-ters and a tax-free exchange for McDonald’s common stock in thefourth quarter. As a result of the disposals during 2007 and 2006,both Boston Market’s and Chipotle’s results of operations andtransaction gains are reflected as discontinued operations for allperiods presented.
In connection with the Company’s sale of its investment inBoston Market in August 2007, the Company received proceedsof approximately $250 million and recorded a gain of $68.6 millionafter tax. In addition, Boston Market’s net income (loss) for 2007and 2006 was ($8.5) million and $6.9 million, respectively.
In first quarter 2006, Chipotle completed an IPO of 6.1 millionshares resulting in a tax-free gain to McDonald’s of $32.0 millionto reflect an increase in the carrying value of the Company’sinvestment as a result of Chipotle selling shares in the public offer-ing. Concurrent with the IPO, McDonald’s sold 3.0 million Chipotleshares, resulting in net proceeds to the Company of $61.4 millionand an additional gain of $13.6 million after tax. In second quarter2006, McDonald’s sold an additional 4.5 million Chipotle shares,resulting in net proceeds to the Company of $267.4 million and again of $127.8 million after tax, while still retaining majorityownership. In fourth quarter 2006, the Company completely sepa-rated from Chipotle through a noncash, tax-free exchange of itsremaining Chipotle shares for its common stock. McDonald’saccepted 18.6 million shares of its common stock in exchange forthe 16.5 million shares of Chipotle class B common stock held byMcDonald’s and recorded a tax-free gain of $479.6 million. Inaddition, Chipotle’s net income for 2006 was $18.2 million.
48 McDonald’s Corporation Annual Report 2008

Boston Market’s and Chipotle’s results of operations (exclusiveof the transaction gains), which previously were included in OtherCountries & Corporate, consisted of revenues and pretax income(loss) as follows:
In millions 2007 2006Boston Market
Revenues $444.1 $691.2Pretax income (loss) (17.0) 12.0
ChipotleRevenues $631.7Pretax income 39.8
LATAM TRANSACTION
In August 2007, the Company completed the sale of itsbusinesses in Brazil, Argentina, Mexico, Puerto Rico, Venezuelaand 13 other countries in Latin America and the Caribbean, whichtotaled 1,571 restaurants, to a developmental licensee orga-nization. The Company refers to these markets as “Latam”. Basedon approval by the Company’s Board of Directors on April 17,2007, the Company concluded Latam was “held for sale” as of thatdate in accordance with the requirements of SFAS No. 144. As aresult, the Company recorded an impairment charge of $1.7 billionin 2007, substantially all of which was noncash. The total chargesfor the full year included $895.8 million for the difference betweenthe net book value of the Latam business and approximately$675 million in cash proceeds received. This loss in value wasprimarily due to a historically difficult economic environment cou-pled with volatility experienced in many of the markets included inthis transaction. The charges also included historical foreign cur-rency translation losses of $769.5 million recorded inshareholders’ equity. The Company recorded a tax benefit of$62.0 million in connection with this transaction. The tax benefitwas minimal in 2007 due to the Company’s inability to utilize mostof the capital losses generated by this transaction. As a result ofmeeting the “held for sale” criteria, the Company ceased recordingdepreciation expense with respect to Latam effective April 17,2007. In connection with the sale, the Company agreed toindemnify the buyers for certain tax and other claims, certain ofwhich are reflected in other long-term liabilities on McDonald’sConsolidated balance sheet, totaling $141.8 million atDecember 31, 2008 and $179.2 million at December 31, 2007.The change in the balance was primarily due to foreign currencytranslation. The Company mitigates the currency impact to incomethrough the use of forward foreign exchange agreements.
The buyers of the Company’s operations in Latam entered intoa 20-year master franchise agreement that requires the buyers,among other obligations to (i) pay monthly royalties commencing ata rate of approximately 5% of gross sales of the restaurants inthese markets, substantially consistent with market rates for similarlicense arrangements; (ii) commit to adding approximately 150new McDonald’s restaurants by the end of 2010 and pay an initialfee for each new restaurant opened; and (iii) commit to specifiedannual capital expenditures for existing restaurants.
IMPAIRMENT AND OTHER CHARGES, NET
On a pretax basis, the Company recorded impairment and othercharges, net of $6.0 million in 2008, $1,670.3 million in 2007 and$134.2 million in 2006.
In 2008, the charges primarily related to market restructuringcosts in Greece.
In 2007, the Company recorded a charge of $1.7 billion relatedto the sale of the Latam businesses to a developmental licensee.In addition, the charges for 2007 included a $15.7 million write-offof assets associated with the Toasted Deli Sandwich products inCanada and a net gain of $14.1 million as a result of the transferof the Company’s ownership interest in three European markets toa developmental licensee, partly offset by a loss on the transfer ofa small market in Europe to a developmental licensee.
In 2006, the charges primarily related to losses of $35.8 millionincurred on the transfers of the Company’s ownership interest incertain markets, primarily in APMEA and Europe, to developmentallicensees, costs of $35.3 million related to the closing of certainrestaurants in the U.K. in conjunction with an overall restaurantportfolio review, costs of $29.3 million to buy out certain litigatingfranchisees in Brazil, asset write-offs and other charges in APMEAof $17.5 million, and a loss of $13.1 million related to the decisionto dispose of supply chain operations in Russia.
OTHER OPERATING (INCOME) EXPENSE, NET
In millions 2008 2007 2006Gains on sales of restaurant
businesses $(126.5) $ (88.9) $ (38.3)Equity in earnings of unconsolidated
affiliates (110.7) (115.6) (76.8)Asset dispositions and other
expense 72.0 193.4 184.2Total $(165.2) $ (11.1) $ 69.1
• Gains on sales of restaurant businessesGains on sales of restaurant businesses include gains from salesof Company-operated restaurants as well as gains from exercisesof purchase options by franchisees with business facilities leasearrangements (arrangements where the Company leases the busi-nesses, including equipment, to franchisees who generally haveoptions to purchase the businesses). The Company’s purchasesand sales of businesses with its franchisees are aimed at achievingan optimal ownership mix in each market. Resulting gains or lossesare recorded in operating income because the transactions are arecurring part of our business.
• Equity in earnings of unconsolidated affiliatesUnconsolidated affiliates and partnerships are businesses in whichthe Company actively participates but does not control. The Com-pany records equity in earnings from these entities representingMcDonald’s share of results. For foreign affiliated markets –primarily Japan – results are reported after interest expense andincome taxes. McDonald’s share of results for partnerships in cer-tain consolidated markets such as the U.S. are reported beforeincome taxes. These partnership restaurants are operated underconventional franchise arrangements and are included in conven-tional franchised restaurant counts.
• Asset dispositions and other expenseAsset dispositions and other expense consists of gains or losseson excess property and other asset dispositions, provisions forstore closings, contingencies and uncollectible receivables, andother miscellaneous income and expenses.
McDonald’s Corporation Annual Report 2008 49

GAIN ON SALE OF INVESTMENT
In second quarter 2008, the Company sold its minority ownershipinterest in U.K.-based Pret A Manger. In connection with the sale,the Company received cash proceeds of $229.4 million andrecognized a nonoperating pretax gain of $160.1 million ($109.0million after tax).
CONTINGENCIES
From time to time, the Company is subject to proceedings, lawsuitsand other claims related to competitors, customers, employees,franchisees, government agencies, intellectual property, share-holders and suppliers. The Company is required to assess thelikelihood of any adverse judgments or outcomes to these mattersas well as potential ranges of probable losses. A determination ofthe amount of accrual required, if any, for these contingencies ismade after careful analysis of each matter. The required accrualmay change in the future due to new developments in each matteror changes in approach such as a change in settlement strategy indealing with these matters. The Company does not believe that anysuch matter currently being reviewed will have a material adverseeffect on its financial condition or results of operations.
In connection with the 2007 sale of the Company’s businessesin Latam, the Company agreed to indemnify the buyers for certaintax and other claims, certain of which are reflected as liabilities onMcDonald’s Consolidated balance sheet, totaling $141.8 million atDecember 31, 2008 and $179.2 million at December 31, 2007.The change in the balance was primarily due to foreign currencytranslation. The Company mitigates the currency impact to incomethrough the use of forward foreign exchange agreements.
FRANCHISE ARRANGEMENTS
Conventional franchise arrangements generally include a leaseand a license and provide for payment of initial fees, as well ascontinuing rent and royalties to the Company based upon a per-cent of sales with minimum rent payments that parallel theCompany’s underlying leases and escalations (on properties thatare leased). Under this arrangement, franchisees are granted theright to operate a restaurant using the McDonald’s System and, inmost cases, the use of a restaurant facility, generally for a period of20 years. These franchisees pay related occupancy costs includingproperty taxes, insurance and maintenance. In addition, in certainmarkets outside the U.S., franchisees pay a refundable, non-interest bearing security deposit. Affiliates and developmentallicensees operating under license agreements pay a royalty to theCompany based upon a percent of sales, and may pay initial fees.
The results of operations of restaurant businesses purchasedand sold in transactions with franchisees were not material to theconsolidated financial statements for periods prior to purchase andsale.
Revenues from franchised restaurants consisted of:
In millions 2008 2007 2006Rents $4,612.8 $4,177.2 $3,756.1Royalties 2,275.7 1,941.1 1,685.2Initial fees 73.0 57.3 51.5Revenues from franchised
restaurants $6,961.5 $6,175.6 $5,492.8
Future minimum rent payments due to the Company underexisting franchise arrangements are:
In millions Owned Sites Leased Sites Total
2009 $ 1,125.0 $ 965.1 $ 2,090.12010 1,091.2 936.6 2,027.82011 1,047.7 904.2 1,951.92012 1,014.1 872.2 1,886.32013 975.8 833.2 1,809.0Thereafter 7,648.8 5,992.0 13,640.8Total minimum payments $12,902.6 $10,503.3 $23,405.9
At December 31, 2008, net property and equipment underfranchise arrangements totaled $11.9 billion (including land of$3.5 billion) after deducting accumulated depreciation and amor-tization of $5.7 billion.
LEASING ARRANGEMENTS
At December 31, 2008, the Company was the lessee at 13,620restaurant locations through ground leases (the Company leasesthe land and the Company or franchisee owns the building) andthrough improved leases (the Company leases land and buildings).Lease terms for most restaurants are generally for 20 years and, inmany cases, provide for rent escalations and renewal options, withcertain leases providing purchase options. Escalation terms vary bygeographic segment with examples including fixed-rent escala-tions, escalations based on an inflation index, and fair-value marketadjustments. The timing of these escalations generally ranges fromannually to every five years. For most locations, the Company isobligated for the related occupancy costs including property taxes,insurance and maintenance; however, for franchised sites, theCompany requires the franchisees to pay these costs. In addition,the Company is the lessee under noncancelable leases coveringcertain offices and vehicles.
Future minimum payments required under existing operatingleases with initial terms of one year or more are:
In millions Restaurant Other Total
2009 $ 980.8 $ 65.3 $ 1,046.12010 918.7 52.9 971.62011 849.1 41.7 890.82012 779.6 29.8 809.42013 724.5 21.6 746.1Thereafter 5,500.0 114.4 5,614.4Total minimum payments $9,752.7 $325.7 $10,078.4
The following table provides detail of rent expense:
In millions 2008 2007 2006Company-operated restaurants:U.S. $ 73.7 $ 82.0 $ 81.6Outside the U.S. 532.0 533.9 515.1
Total 605.7 615.9 596.7Franchised restaurants:U.S. 374.7 358.4 340.2Outside the U.S. 409.4 364.5 312.5
Total 784.1 722.9 652.7Other 101.8 98.5 104.5Total rent expense $1,491.6 $1,437.3 $1,353.9
50 McDonald’s Corporation Annual Report 2008
Rent expense included percent rents in excess of minimumrents (in millions) as follows–Company-operated restaurants:2008–$130.2; 2007–$118.3; 2006–$106.9. Franchised restau-rants: 2008–$143.5; 2007–$136.1; 2006–$124.3.
INCOME TAXES
Income from continuing operations before provision for incometaxes, classified by source of income, was as follows:
In millions 2008 2007 2006U.S. $2,769.4 $2,455.0 $2,126.2Outside the U.S. 3,388.6 1,117.1 2,028.2Income from continuing
operations before provision forincome taxes $6,158.0 $3,572.1 $4,154.4
The provision for income taxes, classified by the timing andlocation of payment, was as follows:
In millions 2008 2007 2006U.S. federal $ 808.4 $ 480.8 $ 624.8U.S. state 134.7 84.9 107.4Outside the U.S. 800.2 710.5 522.7
Current tax provision 1,743.3 1,276.2 1,254.9U.S. federal 75.6 (14.3) 55.7U.S. state 28.7 10.0 10.8Outside the U.S. (2.8) (34.8) (33.1)
Deferred tax provision(benefit) 101.5 (39.1) 33.4
Provision for income taxes $1,844.8 $1,237.1 $1,288.3
Net deferred tax liabilities consisted of:
In millions December 31, 2008 2007Property and equipment $1,587.5 $ 1,532.7Other 308.1 231.8
Total deferred tax liabilities 1,895.6 1,764.5Property and equipment (243.4) (370.5)Employee benefit plans (300.9) (292.8)Intangible assets (227.8) (282.4)Capital loss carryforwards (161.9) (228.3)Deferred foreign tax credits (131.1) (127.2)Operating loss carryforwards (70.9) (102.6)Indemnification liabilities (49.6) (62.7)Other (462.3) (295.8)
Total deferred tax assetsbefore valuation allowance (1,647.9) (1,762.3)
Valuation allowance 199.7 385.1Net deferred tax liabilities $ 447.4 $ 387.3Balance sheet presentation:Deferred income taxes $ 944.9 $ 960.9Other assets–miscellaneous (417.4) (502.8)Current assets–prepaid
expenses and other currentassets (80.1) (70.8)
Net deferred tax liabilities $ 447.4 $ 387.3
The statutory U.S. federal income tax rate reconciles to theeffective income tax rates as follows:
2008 2007 2006Statutory U.S. federal income tax rate 35.0% 35.0% 35.0%State income taxes, net of related federal
income tax benefit 1.8 2.3 1.9Benefits and taxes related to foreign
operations (6.4) (7.5) (5.3)Completion of federal tax audit (8.9)Latam transaction 14.3Other, net (0.4) (0.6) (0.6)Effective income tax rates 30.0% 34.6% 31.0%
As of December 31, 2008 and 2007, the Company’s grossunrecognized tax benefits totaled $272.5 million and $249.7 mil-lion, respectively. After considering the federal impact on stateissues, about $225 million of the total as of December 31, 2008would favorably affect the effective tax rate if resolved in theCompany’s favor.
The following table presents a reconciliation of the beginningand ending amounts of unrecognized tax benefits:
In millions 2008 2007
Balance at January 1 $249.7 $ 664.3Decreases for positions taken in prior years:
Remeasurement due to completion of audit (7.6) (295.8)Disposition of entity (29.9)Other (14.2) (60.4)
Increases for positions taken in prior years 25.0 18.3Increases for positions related to the current
year 65.9 82.5Settlements with taxing authorities (39.5) (122.7)Lapsing of statutes of limitations (6.8) (6.6)Balance at December 31(1) $272.5 $ 249.7(1) Included in other long-term liabilities on the Consolidated balance sheet.
It is reasonably possible that the total amount of unrecognizedtax benefits could decrease within the next 12 months by$30 million to $40 million. This decrease would result from theexpiration of the statute of limitations and the completion of taxaudits in multiple tax jurisdictions.
The Company is generally no longer subject to U.S. federal,state and local, or non-U.S. income tax examinations by tax author-ities for years prior to 2002.
The continuing practice of the Company is to recognize interestand penalties related to income tax matters in the provision forincome taxes. The Company had $24.1 million and $9.4 millionaccrued for interest at December 31, 2008 and 2007,respectively, and no accrual for penalties in either year. The Com-pany recorded interest expense related to tax matters of$13.7 million in 2008 and interest income related to tax mattersof $34.9 million in 2007, and no expense for penalties in eitheryear.
Deferred U.S. income taxes have not been recorded for tempo-rary differences related to investments in certain foreignsubsidiaries and corporate joint ventures. These temporary differ-ences were approximately $6.9 billion at December 31, 2008 andconsisted primarily of undistributed earnings considered perma-nently invested in operations outside the U.S. Determination of thedeferred income tax liability on these unremitted earnings is notpracticable because such liability, if any, is dependent on circum-stances existing if and when remittance occurs.
McDonald’s Corporation Annual Report 2008 51

SEGMENT AND GEOGRAPHIC INFORMATION
The Company operates in the food service industry and managesits business as distinct geographic segments.
All intercompany revenues and expenses are eliminated incomputing revenues and operating income. Royalties and otherpayments from subsidiaries outside the U.S. were (in millions):2008–$1,229.8; 2007–$1,116.7; 2006–$945.4.
Corporate general & administrative expenses are included inOther Countries & Corporate and consist of home office supportcosts in areas such as facilities, finance, human resources,information technology, legal, marketing, restaurant operations,supply chain and training. Corporate assets include corporate cashand equivalents, asset portions of financial instruments and homeoffice facilities.
In millions 2008 2007 2006U.S. $ 8,078.3 $ 7,905.5 $ 7,464.1Europe 9,922.9 8,926.2 7,637.7APMEA 4,230.8 3,598.9 3,053.5Other Countries &
Corporate 1,290.4 2,356.0 2,739.9Total revenues $23,522.4 $22,786.6 $20,895.2
U.S. $ 3,059.7 $ 2,841.9 $ 2,657.0Europe 2,608.0 2,125.4 1,610.2APMEA 818.8 616.3 364.4Other Countries &
Corporate (43.6) (1,704.6) (198.6)Total operating income $ 6,442.9 $ 3,879.0(1) $ 4,433.0(2)
U.S. $10,356.7 $10,031.8 $ 9,477.4Europe 10,532.7 11,380.4 10,413.9APMEA 4,074.6 4,145.3 3,727.6Other Countries &
Corporate 3,497.5 3,834.2 3,529.4Businesses held for sale 1,631.5Discontinued operations 194.7
Total assets $28,461.5 $29,391.7 $28,974.5U.S. $ 837.4 $ 805.1 $ 774.3Europe 864.1 687.4 504.9APMEA 360.6 302.8 208.1Other Countries &
Corporate 73.6 97.3 85.4Businesses held for sale 43.7 87.0Discontinued operations 10.3 82.2
Total capitalexpenditures $ 2,135.7 $ 1,946.6 $ 1,741.9
U.S. $ 400.9 $ 402.7 $ 390.5Europe 506.3 473.3 436.4APMEA 193.4 178.1 171.8Other Countries &
Corporate 107.2 112.6 110.4Businesses held for sale 26.1 81.8Discontinued operations 21.3 59.0
Total depreciation andamortization $ 1,207.8 $ 1,214.1 $ 1,249.9
See Impairment and other charges, net note for further discussion of the following items:
(1) Includes $1.7 billion of charges/(credits) (Other Countries & Corporate–$1,681.0 mil-lion and Europe–($10.7) million) primarily related to the Latam transaction.
(2) Includes $134.2 million of charges (Europe–$61.9 million; APMEA–$48.2 million andOther Countries & Corporate–$24.1 million) primarily related to losses incurred on thetransfers of the Company’s ownership interest in certain markets to developmentallicensees and certain other strategic actions.
Total long-lived assets, primarily property and equipment, were(in millions)—Consolidated: 2008–$24,385.8; 2007–$25,186.9;2006–$23,185.3. U.S. based: 2008–$10,389.7;2007–$10,043.7; 2006–$9,421.6.
DEBT FINANCING
Line of credit agreementsAt December 31, 2008, the Company had a $1.3 billion line ofcredit agreement expiring in 2012 with fees of 0.05% per annumon the total commitment, which remained unused. Fees and inter-est rates on this line are based on the Company’s long-term creditrating assigned by Moody’s and Standard & Poor’s. In addition,certain subsidiaries outside the U.S. had unused lines of credittotaling $783.2 million at December 31, 2008; these uncommittedlines of credit were principally short-term and denominated in vari-ous currencies at local market rates of interest.
As a result of the Company’s decision to repatriate certain for-eign earnings under the Homeland Investment Act (HIA), certainwholly-owned subsidiaries outside the U.S. entered into a multi-currency term loan facility totaling $2.9 billion in 2005. The facilityexpired in 2008, and the $1.8 billion in outstanding borrowings atDecember 31, 2007 were repaid during 2008.
The weighted-average interest rate of short-term borrowingswas 4.7% at December 31, 2008 (based on $232.1 million ofcommercial paper and $625.4 million of foreign currency bank lineborrowings) and 5.9% at December 31, 2007 (based on$625.8 million of foreign currency bank line borrowings).
Fair valuesAt December 31, 2008, the fair value of the Company’s debt obli-gations was estimated at $10.3 billion, compared to a carryingamount of $10.2 billion. This fair value was estimated using variouspricing models or discounted cash flow analyses that incorporatedquoted market prices and are similar to Level 2 inputs within theSFAS No. 157 valuation hierarchy. The Company has no currentplans to retire a significant amount of its debt prior to maturity.
The carrying amounts for both cash and equivalents and notesreceivable approximate fair value. No fair value was estimated fornon-interest bearing security deposits by franchisees, becausethese deposits are an integral part of the overall franchisearrangements.
Debt obligationsThe Company has incurred debt obligations principally throughpublic and private offerings and bank loans. There are no provi-sions in the Company’s debt obligations that would acceleraterepayment of debt as a result of a change in credit ratings or amaterial adverse change in the Company’s business. Certain of theCompany’s debt obligations contain cross-acceleration provisions,and restrictions on Company and subsidiary mortgages and thelong-term debt of certain subsidiaries. Under certain agreements,the Company has the option to retire debt prior to maturity, eitherat par or at a premium over par.
In January 2009, the Company issued $400 million of 10-yearU.S. Dollar-denominated notes at a coupon rate of 5.0%, and$350 million of 30-year U.S. Dollar-denominated bonds at a cou-pon rate of 5.7%.
52 McDonald’s Corporation Annual Report 2008

The following table summarizes the Company’s debt obligations. (Interest rates and debt amounts reflected in the table include theeffects of interest rate exchange agreements.)
Interest rates(1) December 31Amounts outstanding
December 31
In millions of U.S. DollarsMaturity
dates 2008 2007 2008 2007Fixed 5.6% 5.5% $ 4,726.1 $3,042.3Floating 2.3 4.8 857.1 160.0
Total U.S. Dollars 2009-2038 5,583.2 3,202.3Fixed 5.0 2.7 704.1 121.8Floating 5.2 4.8 829.4 2,093.3
Total Euro 2009-2015 1,533.5 2,215.1Fixed 6.0 6.0 654.9 1,078.8Floating 3.6 6.5 2.0 689.9
Total British Pounds Sterling 2009-2032 656.9 1,768.7Fixed 2.2 2.2 720.1 585.0Floating 1.6 440.2
Total Japanese Yen 2010-2030 1,160.3 585.0Fixed 2.8 3.4 453.8 497.8Floating 5.6 5.7 722.5 946.9
Total other currencies(2) 2009-2014 1,176.3 1,444.7Debt obligations before fair value adjustments(3) 10,110.2 9,215.8Fair value adjustments(4) 107.6 85.3Total debt obligations(5) $10,217.8 $9,301.1(1) Weighted-average effective rate, computed on a semi-annual basis.
(2) Primarily consists of Chinese Renminbi, Swiss Francs, Korean Won, and Singapore Dollars.
(3) Aggregate maturities for 2008 debt balances, before fair value adjustments, were as follows (in millions): 2009–$31.8; 2010–$616.5; 2011–$610.9; 2012–$2,214.3;2013–$657.0; Thereafter–$5,979.7. These amounts include a reclassification of short-term obligations totaling $1.3 billion to long-term obligations as they are supported by a long-term line of credit agreement expiring in 2012.
(4) SFAS No. 133 requires that the carrying value of underlying items in fair value hedges, in this case debt obligations, be adjusted for fair value changes to the extent they are attributableto the risk designated as being hedged. The related hedging instrument is also recorded at fair value in either miscellaneous other assets or other long-term liabilities. A portion($25.1 million) of the adjustments at December 31, 2008 related to interest rate exchange agreements that were terminated in December 2002 and will amortize as a reduction ofinterest expense over the remaining life of the debt.
(5) Includes notes payable, current maturities of long-term debt and long-term debt included on the Consolidated balance sheet. The increase in debt obligations from December 31, 2007to December 31, 2008 was due to (in millions): net issuances ($1,045.7), SFAS No. 133 noncash fair value adjustments ($22.3) and other changes ($4.0), partly offset by changes inexchange rates on foreign currency denominated debt ($155.3).
ESOP loansBorrowings related to the leveraged Employee Stock OwnershipPlan (ESOP) at December 31, 2008, which include $63.6 millionof loans from the Company to the ESOP, are reflected as debt witha corresponding reduction of shareholders’ equity (additionalpaid-in capital included a balance of $56.4 million and $63.8 mil-lion at December 31, 2008 and 2007, respectively). The ESOP isrepaying the loans and interest through 2018 using Companycontributions and dividends from its McDonald’s common stockholdings. As the principal amount of the borrowings is repaid, thedebt and the unearned ESOP compensation (additional paid-incapital) are reduced.
EMPLOYEE BENEFIT PLANS
The Company’s Profit Sharing and Savings Plan for U.S.-basedemployees includes a 401(k) feature, an ESOP feature, and a dis-cretionary employer profit sharing match. The 401(k) featureallows participants to make pretax contributions that are partlymatched from shares released under the ESOP. The Profit Sharingand Savings Plan also provides for a discretionary employer profitsharing match after the end of the year for those participants eligi-ble to share in the match who have contributed to the 401(k)feature.
All contributions and related earnings can be invested in sev-eral investment alternatives as well as McDonald’s common stock
in accordance with each participant’s elections. Beginning in 2007,participants’ annual contributions to the 401(k) feature and thediscretionary employer match are limited to 20% investment inMcDonald’s common stock.
The Company also maintains certain supplemental benefitplans that allow participants to (i) make tax-deferred contributionsand (ii) receive Company-provided allocations that cannot be madeunder the Profit Sharing and Savings Plan because of InternalRevenue Service limitations. The investment alternatives andreturns are based on certain market-rate investment alternativesunder the Profit Sharing and Savings Plan. Total liabilities were$389.7 million at December 31, 2008 and $415.3 million atDecember 31, 2007 and were primarily included in other long-term liabilities on the Consolidated balance sheet.
The Company has entered into derivative contracts to hedgemarket-driven changes in certain of the liabilities. At December 31,2008, derivatives with a fair value of $90.2 million indexed to theCompany’s stock as well as an investment totaling $60.7 millionindexed to certain market indices were included in miscellaneousother assets on the Consolidated balance sheet. All changes inliabilities for these nonqualified plans and in the fair value of thederivatives are recorded in selling, general & administrativeexpenses. Changes in fair value of the derivatives indexed to theCompany’s stock are recorded in the income statement becausethe contracts provide the counterparty with a choice to settle incash or shares.
McDonald’s Corporation Annual Report 2008 53

Total U.S. costs for the Profit Sharing and Savings Plan, includ-ing nonqualified benefits and related hedging activities, were (inmillions): 2008–$61.2; 2007–$57.6; 2006–$60.1. Certain sub-sidiaries outside the U.S. also offer profit sharing, stock purchaseor other similar benefit plans. Total plan costs outside the U.S.were (in millions): 2008–$55.4; 2007–$62.7; 2006–$69.8.
The total combined liabilities for international retirement planswere $131.1 million and $129.4 million at December 31, 2008and 2007, respectively, primarily in the U.K. and Canada.
Other postretirement benefits and post-employment benefitswere immaterial.
SHARE-BASED COMPENSATION
The Company maintains a share-based compensation plan which authorizes the granting of various equity-based incentives including stockoptions and restricted stock units (RSUs) to employees and nonemployee directors. The number of shares of common stock reserved forissuance under the plans was 97.3 million at December 31, 2008, including 40.9 million available for future grants.
Stock optionsStock options to purchase common stock are granted with an exercise price equal to the closing market price of the Company’s stock onthe date of grant. Substantially all of the options become exercisable in four equal installments, beginning a year from the date of thegrant, and generally expire 10 years from the grant date. Options granted between May 1, 1999 and December 31, 2000 (approximately11 million options outstanding at December 31, 2008) expire 13 years from the date of grant.
Intrinsic value for stock options is defined as the difference between the current market value and the exercise price. During 2008,2007 and 2006, the total intrinsic value of stock options exercised was $549.5 million, $815.3 million and $412.6 million, respectively.Cash received from stock options exercised during 2008 was $548.2 million and the actual tax benefit realized for tax deductions fromstock options exercised totaled $160.2 million. The Company uses treasury shares purchased under the Company’s share repurchaseprogram to satisfy share-based exercises.
A summary of the status of the Company’s stock option grants as of December 31, 2008, 2007 and 2006, and changes during theyears then ended, is presented in the following table:
2008 2007 2006
OptionsShares in
millions
Weighted-averageexercise
price
Weighted-average
remainingcontractuallife in years
Aggregateintrinsicvalue inmillions
Shares inmillions
Weighted-averageexercise
priceShares in
millions
Weighted-averageexercise
price
Outstanding at beginning of year 67.5 $31.85 101.9 $30.03 136.3 $28.90Granted 5.3 56.55 5.7 45.02 7.0 36.36Exercised (18.7) 29.97 (38.4) 28.89 (37.7) 26.86Forfeited/expired (0.7) 37.53 (1.7) 33.63 (3.7) 32.51Outstanding at end of year 53.4 $34.88 5.22 $1,458.0 67.5 $31.85 101.9 $30.03Exercisable at end of year 40.8 $31.21 4.31 $1,263.6 52.6 78.7
RSUsRSUs generally vest 100% on the third anniversary of the grantand are payable in either shares of McDonald’s common stock orcash, at the Company’s discretion. Certain executives have beenawarded RSUs that vest based on Company performance. The fairvalue of each RSU granted is equal to the market price of the
Company’s stock at date of grant less the present value ofexpected dividends over the vesting period.
A summary of the Company’s RSU activity during the yearsended December 31, 2008, 2007 and 2006 is presented in thefollowing table:
2008 2007 2006
RSUsShares in
millions
Weighted-average
grantdate fair
valueShares in
millions
Weighted-average
grantdate fair
valueShares in
millions
Weighted-average
grantdate fair
value
Nonvested at beginning of year 3.4 $35.94 2.6 $33.00 2.6 $23.60Granted 0.8 51.10 1.2 41.73 1.4 34.12Vested (1.1) 30.38 (0.2) 32.78 (1.3) 15.24Forfeited (0.1) 40.41 (0.2) 35.97 (0.1) 31.78Nonvested at end of year 3.0 $40.88 3.4 $35.94 2.6 $33.00
The Company realized tax deductions of $8.8 million from RSUs vested during 2008. The total fair value of RSUs vested during2008, 2007 and 2006 was $56.4 million, $12.6 million and $43.8 million, respectively.
54 McDonald’s Corporation Annual Report 2008

QUARTERLY RESULTS (UNAUDITED)
In millions, except per share dataQuarters ended
December 31Quarters ended
September 30Quarters ended
June 30Quarters ended
March 312008 2007 2008 2007 2008 2007 2008 2007
RevenuesSales by Company-operated
restaurants $3,855.0 $4,103.2 $4,411.1 $4,276.2 $4,296.0 $4,317.8 $3,998.8 $3,913.8Revenues from franchised
restaurants 1,710.0 1,650.4 1,856.2 1,624.7 1,779.3 1,521.6 1,616.0 1,378.9Total revenues 5,565.0 5,753.6 6,267.3 5,900.9 6,075.3 5,839.4 5,614.8 5,292.7
Company-operated margin 664.1 705.3 823.9 783.9 760.8 759.6 659.2 620.5Franchised margin 1,411.7 1,355.3 1,539.3 1,337.3 1,464.0 1,240.1 1,316.2 1,103.2Operating income (loss) 1,502.2 1,354.6 1,823.7 1,524.8 1,654.2 (181.7)(4) 1,462.8 1,181.3Income (loss) from continuing
operations 985.3 1,273.2(1) 1,191.3 1,003.7 1,190.5(3) (708.4)(4) 946.1 766.5Net income (loss) $ 985.3 $1,273.2(1) $1,191.3 $1,071.2(2) $1,190.5(3) $ (711.7)(4) $ 946.1 $ 762.4Per common share—basic:
Income (loss) fromcontinuing operations $ 0.88 $ 1.08(1) $ 1.07 $ 0.85 $ 1.05(3) $ (0.59)(4) $ 0.83 $ 0.64
Net income (loss) $ 0.88 $ 1.08(1) $ 1.07 $ 0.90(2) $ 1.05(3) $ (0.60)(4) $ 0.83 $ 0.63Per common share—diluted:
Income (loss) fromcontinuing operations $ 0.87 $ 1.06(1) $ 1.05 $ 0.83 $ 1.04(3) $ (0.59)(4) $ 0.81 $ 0.63
Net income (loss) $ 0.87 $ 1.06(1) $ 1.05 $ 0.89(2) $ 1.04(3) $ (0.60)(4) $ 0.81 $ 0.62Dividends declared per
common share $ 0.875(5) $ 1.50 $ 0.375 $ 0.375Weighted-average common
shares—basic 1,115.4 1,173.7 1,116.6 1,185.0 1,128.9 1,193.7 1,145.6 1,201.2Weighted-average common
shares—diluted 1,131.6 1,196.8 1,136.0 1,207.1 1,148.8 1,193.7 1,165.3 1,222.3Market price per common
share:High $ 64.02 $ 63.69 $ 67.00 $ 55.73 $ 61.76 $ 52.88 $ 59.48 $ 46.21Low 45.79 54.67 55.55 46.64 55.14 44.26 49.36 42.31Close 62.19 58.91 61.70 54.47 56.22 50.76 55.77 45.05(1) Includes an income tax benefit of $316.4 million ($0.26 per share) resulting from the completion of an IRS examination of the Company’s 2003-2004 U.S. federal tax returns.
(2) Includes income from discontinued operations of $67.5 million after tax ($0.05 per share–basic, $0.06 per share–diluted) primarily due to the gain on the sale of Boston Market.
(3) Includes income of $109.0 million after tax ($0.09 per share-basic, $0.10 per share-diluted) from the sale of the Company’s minority ownership interest in U.K.-based Pret A Manger.
(4) Includes net pretax and after tax expense of $1.6 billion ($1.32 per share from continuing operations–basic, $1.33 per share net income–basic, $1.31 per share–diluted) related to thesale of Latam to a developmental licensee.
(5) Includes a $0.375 per share dividend declared and paid in third quarter and a $0.50 per share dividend declared in third quarter and paid in fourth quarter.
McDonald’s Corporation Annual Report 2008 55
MANAGEMENT’S ASSESSMENT OF INTERNAL CONTROL OVER FINANCIAL REPORTING
The financial statements were prepared by management, which is responsible for their integrity and objectivity and for establishing andmaintaining adequate internal controls over financial reporting.
The Company’s internal control over financial reporting is designed to provide reasonable assurance regarding the reliability of financialreporting and the preparation of financial statements for external purposes in accordance with generally accepted accounting principles.The Company’s internal control over financial reporting includes those policies and procedures that:
I. pertain to the maintenance of records that, in reasonable detail, accurately and fairly reflect the transactions and dispositions ofthe assets of the Company;
II. provide reasonable assurance that transactions are recorded as necessary to permit preparation of financial statements inaccordance with generally accepted accounting principles, and that receipts and expenditures of the Company are being madeonly in accordance with authorizations of management and directors of the Company; and
III. provide reasonable assurance regarding prevention or timely detection of unauthorized acquisition, use or disposition of theCompany’s assets that could have a material effect on the financial statements.
There are inherent limitations in the effectiveness of any internal control, including the possibility of human error and the circumvention oroverriding of controls. Accordingly, even effective internal controls can provide only reasonable assurances with respect to financialstatement preparation. Further, because of changes in conditions, the effectiveness of internal controls may vary over time.
Management assessed the design and effectiveness of the Company’s internal control over financial reporting as of December 31, 2008.In making this assessment, management used the criteria set forth by the Committee of Sponsoring Organizations of the TreadwayCommission (“COSO”) in Internal Control – Integrated Framework.
Based on management’s assessment using those criteria, as of December 31, 2008, management believes that the Company’s internalcontrol over financial reporting is effective.
Ernst & Young, LLP, independent registered public accounting firm, has audited the financial statements of the Company for the fiscalyears ended December 31, 2008, 2007 and 2006 and the Company’s internal control over financial reporting as of December 31, 2008.Their reports are presented on the following pages. The independent registered public accountants and internal auditors advisemanagement of the results of their audits, and make recommendations to improve the system of internal controls. Management evaluatesthe audit recommendations and takes appropriate action.
McDONALD’S CORPORATIONFebruary 18, 2009
56 McDonald’s Corporation Annual Report 2008

REPORT OF INDEPENDENT REGISTERED PUBLIC ACCOUNTING FIRM
The Board of Directors and Shareholders ofMcDonald’s Corporation
We have audited the accompanying consolidated balance sheets of McDonald’s Corporation as of December 31, 2008 and 2007, andthe related consolidated statements of income, shareholders’ equity, and cash flows for each of the three years in the period endedDecember 31, 2008. These financial statements are the responsibility of the Company’s management. Our responsibility is to express anopinion on these financial statements based on our audits.
We conducted our audits in accordance with the standards of the Public Company Accounting Oversight Board (United States). Thosestandards require that we plan and perform the audit to obtain reasonable assurance about whether the financial statements are free ofmaterial misstatement. An audit includes examining, on a test basis, evidence supporting the amounts and disclosures in the financialstatements. An audit also includes assessing the accounting principles used and significant estimates made by management, as well asevaluating the overall financial statement presentation. We believe that our audits provide a reasonable basis for our opinion.
In our opinion, the financial statements referred to above present fairly, in all material respects, the consolidated financial position ofMcDonald’s Corporation at December 31, 2008 and 2007, and the consolidated results of its operations and its cash flows for each ofthe three years in the period ended December 31, 2008, in conformity with U.S. generally accepted accounting principles.
As discussed in the Notes to the consolidated financial statements, effective January 1, 2007, the Company changed its method ofaccounting for uncertain tax positions to conform with FASB Interpretation No. 48, Accounting for Uncertainty in Income Taxes and forcompensation costs associated with a sabbatical to conform with EITF 06-2, Accounting for Sabbatical Leave and Other Similar Benefits
Pursuant to FASB Statement No. 43, Accounting for Compensated absences. On December 31, 2006, the Company adopted the provi-sions of SFAS No. 158, Employers’ Accounting for Defined Benefit Pension and Other Postretirement Plans, and changed its method ofrecognizing the funded status of its defined benefit postretirement plans.
We also have audited, in accordance with the standards of the Public Company Accounting Oversight Board (United States), McDonald’sCorporation’s internal control over financial reporting as of December 31, 2008, based on criteria established in Internal Control-Integrated Framework issued by the Committee of Sponsoring Organizations of the Treadway Commission and our report datedFebruary 18, 2009 expressed an unqualified opinion thereon.
ERNST & YOUNG LLP
Chicago, IllinoisFebruary 18, 2009
McDonald’s Corporation Annual Report 2008 57

REPORT OF INDEPENDENT REGISTERED PUBLIC ACCOUNTING FIRM ON INTERNAL CONTROL OVER FINANCIALREPORTING
The Board of Directors and Shareholders of McDonald’s Corporation
We have audited McDonald’s Corporation’s internal control over financial reporting as of December 31, 2008, based on criteria estab-lished in Internal Control—Integrated Framework issued by the Committee of Sponsoring Organizations of the Treadway Commission(the COSO criteria). McDonald’s Corporation’s management is responsible for maintaining effective internal control over financial report-ing, and for its assessment of the effectiveness of internal control over financial reporting included in the accompanying report onManagement’s Assessment of Internal Control over Financial Reporting. Our responsibility is to express an opinion on the Company’sinternal control over financial reporting based on our audit.
We conducted our audit in accordance with the standards of the Public Company Accounting Oversight Board (United States). Thosestandards require that we plan and perform the audit to obtain reasonable assurance about whether effective internal control over finan-cial reporting was maintained in all material respects. Our audit included obtaining an understanding of internal control over financialreporting, assessing the risk that a material weakness exists, testing and evaluating the design and operating effectiveness of internalcontrol based on the assessed risk, and performing such other procedures as we considered necessary in the circumstances. We believethat our audit provides a reasonable basis for our opinion.
A company’s internal control over financial reporting is a process designed to provide reasonable assurance regarding the reliability offinancial reporting and the preparation of financial statements for external purposes in accordance with generally accepted accountingprinciples. A company’s internal control over financial reporting includes those policies and procedures that (1) pertain to the main-tenance of records that, in reasonable detail, accurately and fairly reflect the transactions and dispositions of the assets of the company;(2) provide reasonable assurance that transactions are recorded as necessary to permit preparation of financial statements in accord-ance with generally accepted accounting principles, and that receipts and expenditures of the company are being made only inaccordance with authorizations of management and directors of the company; and (3) provide reasonable assurance regarding pre-vention or timely detection of unauthorized acquisition, use or disposition of the company’s assets that could have a material effect on thefinancial statements.
Because of its inherent limitations, internal control over financial reporting may not prevent or detect misstatements. Also, projections ofany evaluation of effectiveness to future periods are subject to the risk that controls may become inadequate because of changes inconditions, or that the degree of compliance with the policies or procedures may deteriorate.
In our opinion, McDonald’s Corporation maintained, in all material respects, effective internal control over financial reporting as ofDecember 31, 2008, based on the COSO criteria.
We also have audited, in accordance with the standards of the Public Company Accounting Oversight Board (United States), the con-solidated financial statements of McDonald’s Corporation as of December 31, 2008 and 2007 and for each of the three years in theperiod ended December 31, 2008, and our report dated February 18, 2009, expressed an unqualified opinion thereon.
ERNST & YOUNG LLP
Chicago, IllinoisFebruary 18, 2009
58 McDonald’s Corporation Annual Report 2008
BOARD OF DIRECTORS
Ralph AlvarezPresident and Chief Operating OfficerMcDonald’s Corporation
Susan E. ArnoldPresident – Global Business Units (retirement announced)The Procter & Gamble Company
Robert A. EckertChairman and Chief Executive OfficerMattel, Inc.
Enrique Hernandez, Jr.Chairman and Chief Executive OfficerInter-Con Security Systems, Inc.
Jeanne P. JacksonPresident of Direct to ConsumerNIKE, Inc.
Richard H. LennyRetired Chairman, President and Chief Executive OfficerThe Hershey Company
Walter E. MasseyPresident EmeritusMorehouse College
Andrew J. McKennaChairman of the BoardMcDonald’s Corporation
Chairman of the BoardSchwarz Supply Source
Cary D. McMillanChief Executive OfficerTrue Partners Consulting LLC
Sheila A. PenroseChairman of the BoardJones Lang LaSalle Incorporated
John W. Rogers, Jr.Chairman and Chief Executive OfficerAriel Investments, LLC
James A. SkinnerVice Chairman and Chief Executive OfficerMcDonald’s Corporation
Roger W. StoneChairman and Chief Executive OfficerKapStone Paper and Packaging Corporation
McDonald’s Corporation Annual Report 2008 59

Investor information
Common stockTicker symbolMCDStock exchange listingsNew York, Chicago and Swiss
McDonald’s home officeMcDonald’s CorporationOne McDonald’s PlazaOak Brook, IL 605231.630.623.3000
Annual meetingMay 27, 20099:00 a.m. Central TimeThe LodgeMcDonald’s Office CampusOak Brook, IL 60523
McDonald’s onlineInvestor informationwww.investor.mcdonalds.comCorporate governancewww.governance.mcdonalds.comCorporate social responsibilitywww.csr.mcdonalds.comGeneral informationwww.mcdonalds.comU.S. customer feedback/inquiries(select “contact us”)www.mcdonalds.com/usa.html
Key phone numbersInvestor Relations1.630.623.7428MCDirect Shares (direct stock purchase plan)1.800.228.9623U.S. customer comments/inquiries1.800.244.6227Financial media1.630.623.3678Franchising1.630.623.6196
Shareholder account informationStock transfer agent, registrar and MCDirect Shares administratorComputershareAttn: McDonald’s Shareholder Services250 Royall StreetCanton, MA 02021
U.S. and Canada1.800.621.7825International1.312.360.5129TDD (hearing impaired)1.312.588.4110
Onlinewww.computershare.com/mcdonalds
TrademarksAll trademarks used herein are the property of their respectiveowners and are used with permission.
Available informationThe Company’s Chief Executive Officer, James A. Skinner, certifiedto the New York Stock Exchange (NYSE) on June 11, 2008,pursuant to Section 303A.12 of the NYSE’s listing standards, thathe was not aware of any violation by the Company of the NYSE’scorporate governance listing standards as of that date.
Copies of Certifications dated February 25, 2009 of the Compa-ny’s Chief Executive Officer, James A. Skinner, and Chief FinancialOfficer, Peter J. Bensen, pursuant to Rule 13a-14(a) of the Secu-rities Exchange Act of 1934, are attached as Exhibits 31.1 and31.2, respectively, to the Company’s Annual Report on Form 10-Kfor the fiscal year ended December 31, 2008. Shareholders mayobtain a copy of these certifications and/or a complete copy of theCompany’s Annual Report on Form 10-K by following theinstructions below.
McDonald’s Annual Report on Form 10-KThe financial information included in this report was excerptedfrom the Company’s Annual Report on Form10-K for the periodended December 31, 2008, filed with the Securities and ExchangeCommission (SEC) on February 25, 2009. Shareholders mayaccess a complete copy of the 10-K online atwww.investor.mcdonalds.com or www.sec.gov. Shareholders mayalso request a paper copy at no charge by calling 1-630-623-7428 or writing to McDonald’s Corporation, Investor RelationsService Center, Department 300, 2915 Jorie Blvd, Oak Brook,Illinois 60523.
The information in this report is as of March 12, 2009 unlessotherwise indicated.
Reproduction of photography and/or text in whole or in part with-out permission is prohibited.
©2009 McDonald’s Printed in the U.S.A. McD09-4539
Design: VSA Partners, Inc., ChicagoPrinting: Classic Color & R.R. Donnelley
The Annual Report is printed on paper certified to the standards ofthe Forest Stewardship Council (FSC) and includes post-consumerfiber. The FSC trademark identifies products which contain fiberfrom well-managed forests certified in accordance with FSC stan-dards.
Cert no. SCS-COC-00648
30%
60 McDonald’s Corporation Annual Report 2008

Global comparable sales increase
2008 Highlights:
6.9%Total revenues
$23.5 Billion
Cash returned to shareholders via dividends and share repurchases
$5.8 Billion
Ronald McDonald House Charities has grown from a single Ronald McDonald House program in Philadelphia, PA, in 1974 into a global organization. Founded in recognition of McDonald’s founder Ray Kroc, who believed in an individual’s obligation to give back to communities in a relevant and meaningful way, RMHC and its network of local chapters support core programs that help bridge access to health care.
More than 3.7 million children and families are served each year in 285 Ronald McDonald Houses in 30 countries and regions, 35 Ronald McDonald Care Mobiles in six countries and 137 Ronald McDonald Family Rooms in 15 countries and regions.
RMHC is actively supported by McDonald’s Corporation, its owner/operators, suppliers, customers, other companies and the general public. To learn more about RMHC, call 1.630.623.7048 or visit our website at www.rmhc.org.
© 2009 McDonald’s Corporation

McDonald’s Corporation One McDonald’s Plaza Oak Brook, IL 60523 www.mcdonalds.com
2008 Annual Report
McDonald’s Corporation