mayfair 2014 - knight frankcontent.knightfrank.com/research/685/documents/en/2014-2341.pdf · the...
TRANSCRIPT
THE EPICENTRE OF LUXURY LONDON
THE RETAIL EFFECT ON RESIDENTIAL PRICES
RESIDENTIAL RESEARCH
MAYFAIR 2014LONDON MARKET FOCUS
REGAINING ITS STATUS AS LONDON’S LEADING ADDRESS
2
Mayfair has not always justified its status as the premier address on the London Monopoly board.
Construction of its mansions and garden squares began in the early eighteenth century, prompting members of the aristocracy to relocate from smaller properties further east. What was once farmland became London’s most exclusive neighbourhood.
It retained this reputation until last century, attracting Victorian business owners in the nineteenth century, with many undertaking their own building work that enhanced the area’s architectural grandeur.
The Second World War dented its desirability as a residential district, with businesses moving to Mayfair because their offices in the City had been destroyed.
Families in particular began to favour other neighbourhoods like Belgravia and Knightsbridge, including Middle Eastern buyers who began coming to London during the oil boom of the 1970s.
In recent decades, as post-war temporary office permissions expired, properties have been converted back to residential use.
After the financial crash, demand was fuelled by global buyers investing in the safety of prime central London property, demonstrating that although Mayfair may have lost its residential crown after the Second World War it hadn’t lost its international cachet.
The process of converting offices back to residential use has gathered pace across Mayfair but planning rules and space restrictions mean there is a pipeline of fewer than 500 units, as figure 5 shows.
However, there is a more profound change underway. The premium nature of the development pipeline indicates a step-change is taking place in relation to quality and pricing in Mayfair.
With achieved prices for the best new-build schemes approaching, and in some cases exceeding, £5,000 per square foot, Mayfair is on track to regain its status as London’s premier address and merit its position of supremacy on the Monopoly board.
Led by large landowners the Grosvenor Estate and the Crown Estate, there have also been substantial improvements to public areas and a growing focus on luxury retail, which is boosting residential prices (see page 6).
In addition to high-end shopping streets, Mayfair’s history as an office district has helped it attract 29 Michelin starred restaurants, which is almost three times more than any other residential district in London.
It also has 44 five-star hotels, four times more than any other area, and is home to world-famous names like The Dorchester, The Ritz and Claridge’s.
Mayfair, Knightsbridge and Belgravia form the trio of super-prime markets in prime central London. However, Mayfair’s exclusive origins, global reputation for luxury and premium development pipeline give it a particular cachet among buyers that is likely to rise.
BACK IN PRIME POSITIONThe small scale and premium nature of the residential development pipeline in Mayfair suggests the world-famous area is on track to regain its reputation as London’s leading address.
Prices upwards of £5,000 per square foot and predictions of £7,000 suggest Mayfair is on track to regain its crown as London’s premier address
As the epicentre of luxury London, Mayfair has almost three times more Michelin-starred restaurants than any other residential district in London and four times more five-star hotels
Marked acceleration in the share of £10 million-plus properties sold in the last year, with Mayfair accounting for 31% of central London sales in the three months to 1 August 2014
Small development pipeline of 477 units, of which 123 are under construction with the majority of schemes under 10 units
Mayfair has been the strongest performing residential market in prime central London since 1976
KEY FINDINGS
“ Mayfair is on track to regain its status as London’s premier address and merit its position of supremacy on the Monopoly board.”
TOM BILL Head of London Residential Research
FIGURE 1
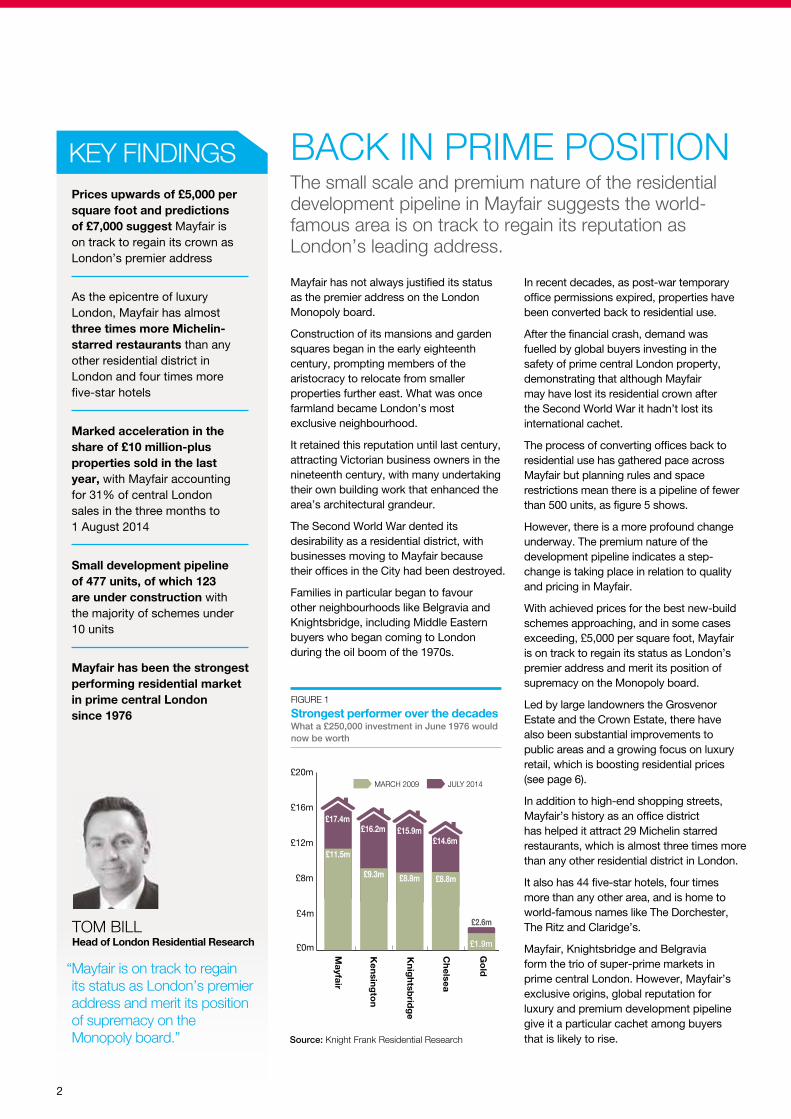
Strongest performer over the decades What a £250,000 investment in June 1976 would now be worth
Source: Knight Frank Residential Research
MARCH 09 JULY 14
MARCH 2009 JULY 2014
Go
ld
Ch
elsea
Kn
igh
tsbrid
ge
Ken
sing
ton
Mayfair
Go
ld
Ch
elsea
Kn
igh
tsbrid
ge
Ken
sing
ton
Mayfair
£0m
£4m
£8m
£12m
£16m
£20m
£0m
£5m
£10m
£15m
£20m
£25m
£30m
£14.6m
£8.8m
£17.4m
£11.5m
£16.2m
£9.3m
£15.9m
£8.8m
£1.9m
£2.6m
£1.9m
£2.6m
£14.6m
£8.8m
£17.4m
£11.5m
£16.2m
£9.3m
£15.9m
£8.8m
£23.48 m
£8.87 m
£28.87 m
£11.48 m
£25.49 m
£9.27 m
£24.69 m
£8.82 m
£24.60 m
£9.13 m
£1.85m
£4.44m
£0m
£5m
£10m
£15m
£20m
£25m
£30m
0
2
4
6
8
10
12
14
16
18
MARCH-09 JULY-14
Go
ld
PC
L average
Chelsea
Knig
htsbrid
ge
Kensing
ton
Mayfair
Chelsea Kensington Knightsbridge Mayfair PCL average GoldMar-09 £8,873,529 £9,273,179 £8,826,542 £11,489,446 £9,130,379 £1,855,000Jul-14 £14,614,721 £16,221,346 £15,876,593 £17,395,636 £15,743,133 £2,590,000
Chelsea Kensington Knightsbridge Mayfair PCL average GoldMar-09 £8.8m £9.3m £8.8m £11.5m £9.1m £1.9mJul-14 £14.6m £16.2m £15.9m £17.4m £15.7m £2.6m
Chelsea Kensington Knightsbridge Mayfair PCL average GoldMar-09 £5.8m £6.9m £7.1m £5.9m 6.6m £0.7mJul-14 £14.6m £16.2m £15.9m £17.4m £15.7m £2.6m
3
Source: Knight Frank Residential Research
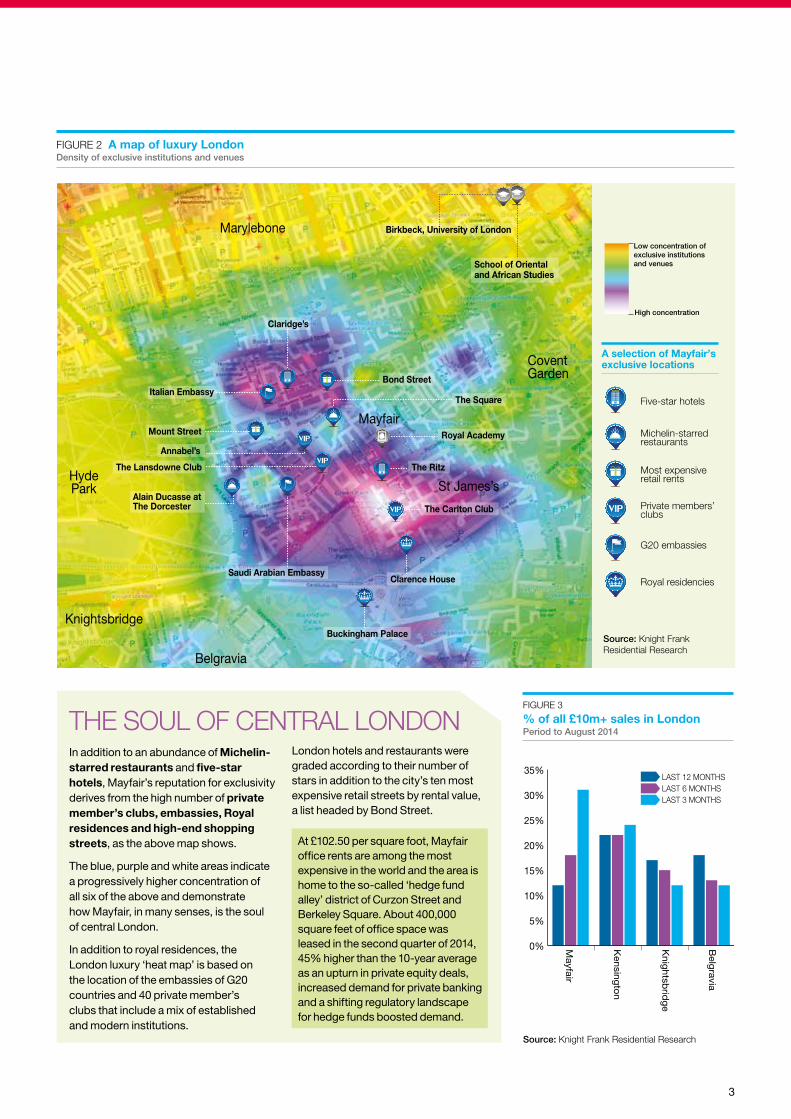
FIGURE 2 A map of luxury London Density of exclusive institutions and venues
FIGURE 3
% of all £10m+ sales in London Period to August 2014
0%
5%
10%
15%
20%
25%
30%
35%LAST 12 MONTHSLAST 6 MONTHSLAST 3 MONTHS
Belg
ravia
Kn
igh
tsbrid
ge
Ken
sing
ton
Mayfair
In addition to an abundance of Michelin-starred restaurants and five-star hotels, Mayfair’s reputation for exclusivity derives from the high number of private member’s clubs, embassies, Royal residences and high-end shopping streets, as the above map shows.
The blue, purple and white areas indicate a progressively higher concentration of all six of the above and demonstrate how Mayfair, in many senses, is the soul of central London.
In addition to royal residences, the London luxury ‘heat map’ is based on the location of the embassies of G20 countries and 40 private member’s clubs that include a mix of established and modern institutions.
THE SOUL OF CENTRAL LONDON
Italian Embassy
Saudi Arabian Embassy
Alain Ducasse atThe Dorcester
Bond Street
Royal Academy
School of Orientaland African Studies
Birkbeck, University of London
CoventGarden
Marylebone
HydePark
Knightsbridge
Belgravia
Mayfair
St James’s
Claridge’s
Buckingham Palace
Clarence House
The Square
Mount Street
The Lansdowne Club
The Carlton Club
The Ritz
Annabel’s
Five-star hotels
Michelin-starredrestaurants
Most expensiveretail rents
Private members’clubs
G20 embassies
Royal residencies
A selection of Mayfair’sexclusive locations
Low concentration ofexclusive institutionsand venues
High concentration
Source: Knight Frank Residential Research
London hotels and restaurants were graded according to their number of stars in addition to the city’s ten most expensive retail streets by rental value, a list headed by Bond Street.
At £102.50 per square foot, Mayfair office rents are among the most expensive in the world and the area is home to the so-called ‘hedge fund alley’ district of Curzon Street and Berkeley Square. About 400,000 square feet of office space was leased in the second quarter of 2014, 45% higher than the 10-year average as an upturn in private equity deals, increased demand for private banking and a shifting regulatory landscape for hedge funds boosted demand.
4
MAYFAIR 2014 RESIDENTIAL RESEARCH
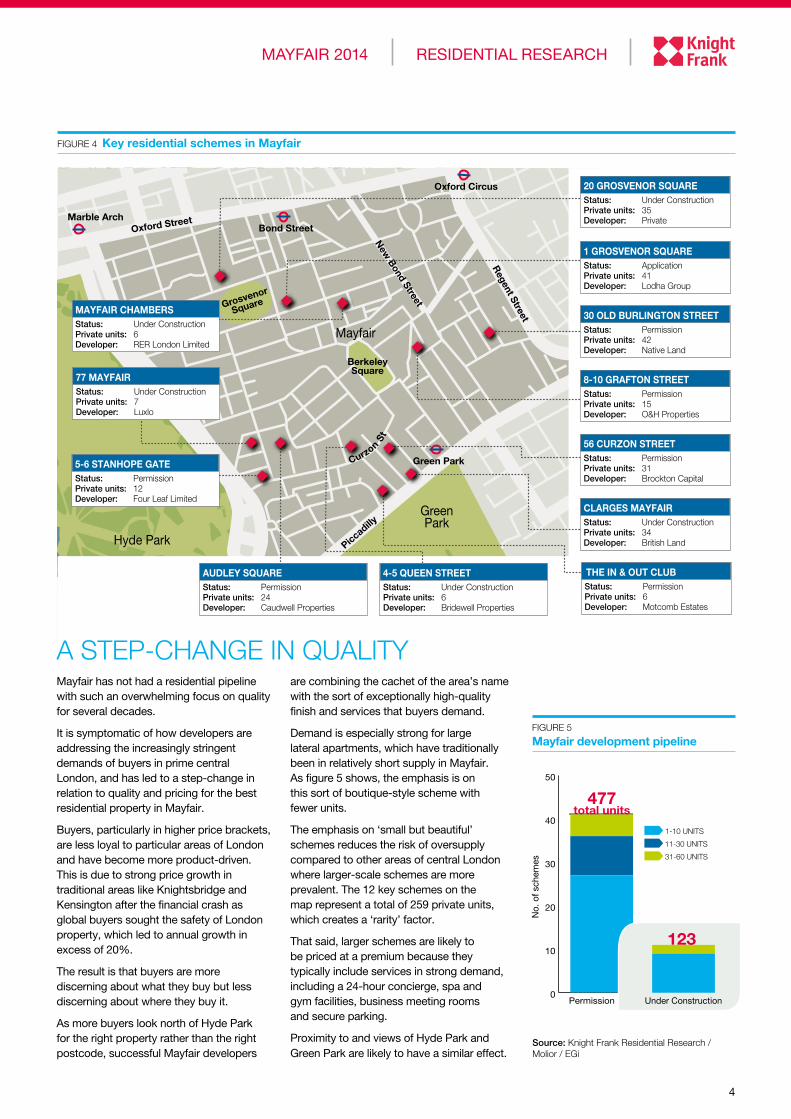
FIGURE 4 Key residential schemes in Mayfair
Mayfair
Oxford Street
Regent Street
Piccadilly
New
Bond Street
GreenPark
Hyde Park
Grosvenor
Square
Bond Street
Green Park
Marble Arch
BerkeleySquare
Oxford Circus
Curzon St
CLARGES MAYFAIRStatus: Under ConstructionPrivate units: 34Developer: British Land
56 CURZON STREETStatus: PermissionPrivate units: 31Developer: Brockton Capital
5-6 STANHOPE GATEStatus: PermissionPrivate units: 12Developer: Four Leaf Limited
77 MAYFAIR Status: Under ConstructionPrivate units: 7Developer: Luxlo
Status: PermissionPrivate units: 6Developer: Motcomb Estates
THE IN & OUT CLUBAUDLEY SQUAREStatus: PermissionPrivate units: 24Developer: Caudwell Properties
1 GROSVENOR SQUAREStatus: ApplicationPrivate units: 41Developer: Lodha Group
20 GROSVENOR SQUAREStatus: Under ConstructionPrivate units: 35Developer: Private
8-10 GRAFTON STREETStatus: PermissionPrivate units: 15Developer: O&H Properties
30 OLD BURLINGTON STREETStatus: PermissionPrivate units: 42Developer: Native Land
4-5 QUEEN STREETStatus: Under ConstructionPrivate units: 6Developer: Bridewell Properties
MAYFAIR CHAMBERSStatus: Under ConstructionPrivate units: 6Developer: RER London Limited
FIGURE 5
Mayfair development pipeline
0
10
20
30
40
50
Under Construction Permission
11-30 UNITS1-10 UNITS 31-60 UNITS
NUMBER OF UNITS
Under Construction 0
10
20
30
40
50
Permission
11-30 UNITS
1-10 UNITS
31-60 UNITS
0
10
20
30
40
50
Permission
11-30 UNITS
1-10 UNITS
31-60 UNITS
463
109
483total units
123
477total units
No.
of s
chem
es
No.
of s
chem
es
No.
of s
chem
es
123
Under Construction
Source: Knight Frank Residential Research / Molior / EGi
Mayfair has not had a residential pipeline with such an overwhelming focus on quality for several decades.
It is symptomatic of how developers are addressing the increasingly stringent demands of buyers in prime central London, and has led to a step-change in relation to quality and pricing for the best residential property in Mayfair.
Buyers, particularly in higher price brackets, are less loyal to particular areas of London and have become more product-driven. This is due to strong price growth in traditional areas like Knightsbridge and Kensington after the financial crash as global buyers sought the safety of London property, which led to annual growth in excess of 20%.
The result is that buyers are more discerning about what they buy but less discerning about where they buy it.
As more buyers look north of Hyde Park for the right property rather than the right postcode, successful Mayfair developers
A STEP-CHANGE IN QUALITYare combining the cachet of the area’s name with the sort of exceptionally high-quality finish and services that buyers demand.
Demand is especially strong for large lateral apartments, which have traditionally been in relatively short supply in Mayfair. As figure 5 shows, the emphasis is on this sort of boutique-style scheme with fewer units.
The emphasis on ‘small but beautiful’ schemes reduces the risk of oversupply compared to other areas of central London where larger-scale schemes are more prevalent. The 12 key schemes on the map represent a total of 259 private units, which creates a ‘rarity’ factor.
That said, larger schemes are likely to be priced at a premium because they typically include services in strong demand, including a 24-hour concierge, spa and gym facilities, business meeting rooms and secure parking.
Proximity to and views of Hyde Park and Green Park are likely to have a similar effect.

MAYFAIR 2014 RESIDENTIAL RESEARCH
5
FIGURE 6
Buyer and tenant nationality in Mayfair (2010 to mid-August 2014)
Source: Knight Frank Residential Research
0.00
0.05
0.10
0.15
0.20
0.25
0.30
0.35
0.40
WEB TRAFFIC
UKINDIARUSSIAUAE
USCHINAITALYFRANCE
QATARGREECEOTHERS
TENANTS
BUYERS
50%
26%
UKINDIARUSSIAUAE
USCHINAITALYFRANCE
QATARGREECEOTHERS
BUYER
50%
UK 50%India 15%Russia 5%United Arab Emirates 5%China 2%Italy 2%Greece 2%Others 17%
United Kingdom 26%USA 10%French 7%Italy 5%Qatar 3%Russia 3%India 3%Others 44%
0 10 20 30 40 50
TENANT
0.00.10.20.30.40.50.60.70.8
FIGURE 7 Buyer profile in Mayfair 2010 to mid August 2014
Source: Knight Frank Residential Research
0%
5%
10%
15%
20%
25%
30%
35%
CITY/FINANCEENTERTAINMENT/SPORTSENTREPRENEURINDUSTRY
INHERITEDOTHERPROFESSIONALPROPERTY
20s 30s 40s 50s 60s 70+
AGE
PROFESSION
FIGURE 8 Scope for growth Price growth since 2009 (rebased)
80
100
120
140
160
180
200
2009 2010 2011 2012 2013 2014
KNIGHTSBRIDGE
KENSINGTON
PCL AVERAGE
CHELSEA
MAYFAIR
Source: Knight Frank Residential Research
As figure 6 shows, buyers come from a diverse range of countries, including 20 different nationalities since January 2010.Finance and property are the two largest groups of buyer category and over a third of buyers are in their 40s, as figure 7 shows.
The lettings market in Mayfair relies on an even broader group of nationalities – 36 in total since the start of 2013.
Rental values range from £5,000 to £50,000 per week for the best properties and the strongest demand, like the sales market, is for large lateral flats with views over Hyde Park and Green Park. Tenants in the top price brackets include Middle Eastern royalty and internationally prominent media figures.
Knight Frank research shows premiums can exceed 50% for residential property located within 50 metres of a central London park, which is the result of stronger demand as well as property size and type.
In addition to new standards of quality, the Mayfair development pipeline is expected to set a new benchmark for pricing.
Given the premium character of the developments, prices for the best properties could exceed top prices achieved in Knightsbridge of £6,500 or £7,000 per square foot.
The behaviour of residential property prices in Mayfair over the last four decades demonstrates the logic of this assumption.
The Knight Frank prime central London index began in 1976 and, as figure 1 shows, Mayfair has been the strongest-performing market over that 38-year period.
A house bought in Mayfair for £250,000 in June 1976 was worth £17.4 million in July this year. That exceeds the same growth in markets like Chelsea, Kensington and Knightsbridge.
It was also the strongest performing area to March 2009, the last low-point in the prime central London index, by which time the £250,000 investment in 1976 had grown to £11.5 million.
As the chart in figure 8 shows, that outperformance has eased since the financial crisis, suggesting there is scope for price growth in Mayfair, which presents
an attractive opportunity for investors and owner-occupiers.
It indicates upwards pressure on prices for the best Mayfair properties will continue, a trend demonstrated in the chart in figure 3.
It shows the percentage of all £10 million-plus sales in central London by area over the last year and underlines how the pace of sales is accelerating to a greater degree in Mayfair than in Kensington, Knightsbridge or Belgravia.
Strength in depth Demand for prime central London property has cooled to some extent in recent months as the prospect of a general election and an interest rate rise provoke a degree of short-term uncertainty.
Though growth may dip next year, we predict a cumulative increase of 20% between 2014 and 2018 in prime central London as supply falls far short of demand, a reality that is a particularly marked in Mayfair, as figure 4 shows.
Furthermore, despite the political and economic backdrop, demand in Mayfair has remained strong versus the prime central London average over the last 12 months, as figure 9 indicates. It shows how the number of viewings, prospective buyers and exchanges are higher in Mayfair than the prime central London average.
Demand is underpinned by a broad range of buyers and tenants.
The area is also popular with international students due to its cachet, vibrancy and the fact it is within walking distance of many of London’s leading universities including University College London and the School of Oriental and African Studies (see figure 2).
Average total investment returns for Mayfair property in the year to July were 7.2%. Some higher-risk property markets have had a better short-term performance in the last 12 months but Mayfair returns are considerably higher than comparable safe haven assets. Ten-year UK government bonds are returning about 2.5% while the price of gold fell about 5% in the year to mid-August 2014.
Mayfair property has also outperformed gold over the last four decades, as figure 1 shows. By July 2014 price growth in Mayfair since 1976 had outpaced growth in the price of gold by a factor of almost seven.

© Knight Frank LLP 2014This report is published for general information only and not to be relied upon in any way. Although high standards have been used in the preparation of the information, analysis, views and projections presented in this report, no responsibility or liability whatsoever can be accepted by Knight Frank LLP for any loss or damage resultant from any use of, reliance on or reference to the contents of this document. As a general report, this material does not necessarily represent the view of Knight Frank LLP in relation to particular properties or projects. Reproduction of this report in whole or in part is not allowed without prior written approval of Knight Frank LLP to the form and content within which it appears. Knight Frank LLP is a limited liability partnership registered in England with registered number OC305934. Our registered office is 55 Baker Street, London, W1U 8AN, where you may look at a list of members’ names.
Knight Frank Residential Research provides strategic advice, consultancy services and forecasting to a wide range of clients worldwide including developers, investors, funding organisations, corporate institutions and the public sector. All our clients recognise the need for expert independent advice customised to their specific needs.
For the latest news, views and analysison the world of prime property, visit
KnightFrankblog.com/global-briefing
GLOBAL BRIEFING
RESIDENTIAL RESEARCH
Tom BillHead of London Residential Research +44 20 7861 1492 [email protected]
Liam Bailey Global Head of Research +44 20 7861 5133 [email protected]
LONDON RESIDENTIAL
Rupert Dawes Head of New Homes +44 20 7861 5445 [email protected]
Harvey Cyzer Head of Mayfair Office +44 20 7647 6608 [email protected]
Tim Wright: +44 20 7861 1719 [email protected]
Richard Cutt: +44 20 7861 1662 [email protected]
FIGURE 9
Mayfair vs prime central London average Year to July 2014 vs year to July 2013 % growth
Source: Knight Frank Residential Research
0%
10%
20%
30%
40%
50%
60%MAYFAIRPCL
0%
10%
20%
30%
40%
50%
60%
ExchangesNew-Applicants
Viewings
MAYFAIRPCL
EXCHANGESNEWPROSPECTIVE
BUYERS
VIEWINGS
55%
41%
15%
20%
2%
7%
THE ‘MOUNT STREET EFFECT’
Knight Frank Research Reports are available at KnightFrank.com/Research
RECENT MARKET-LEADING RESEARCH PUBLICATIONS
The Wealth Report 2014
Prime Central London Sales Index August 2014
Midtown 2014 The London Review Summer 2014
In recent years several of London’s landed estates have adopted the principle that high-quality retail lifts the value of nearby residential property.
From the designer brands of Cadogan Estate’s Sloane Street to the independent boutiques of Marylebone High Street, controlled by the Howard de Walden Estate, getting the retail mix right is one of the most effective ways to increase residential values.
It is often accompanied by an improvement to public areas and thoroughfares and this approach to “place-making” has been used by developers on modern large-scale schemes including King’s Cross and the former Olympic Park.
Mayfair is no exception and Mount Street typifies the changes that have kept upwards pressure on prices and rental values.
The Grosvenor Estate controls 31 of the 49 retail premises on the 540-metre long street that runs east of Park Lane. As part of its wider plan, it attracted high-end fashion houses, jewellers and restaurants to replace a series of empty units and antiques dealers with no street frontage.
In addition, the street was widened, the pavements resurfaced, the parking spaces expanded, a sculptural water feature installed and all street lighting was replaced.
A major redevelopment by the Crown Estate in neighbouring St James’s will have a similar effect.
The Crown, which owns almost half the buildings in St James’s, will invest £500 million over ten years to enhance the area’s reputation as an office market and transform it into a world-class district for shops and restaurants.
To some extent it mirrors the Crown’s transformation of Regent Street. The size of the retail units on the street, which is
the eastern boundary of Mayfair, is being increased to attract international retailers looking for flagship London stores.
A recent Knight Frank commercial research study, which ranked the luxury market position of retailers in London, scored Mount Street 4.8 out of 5 and Bond Street 4.6.
Additionally, 43% of Mount Street’s retailers are independent versus 12% on Bond Street and the fit-out quality of its shops scored a maximum 5 versus 4.5 on Bond Street.
Partially as a result, Mount Street and the surrounding area is among the most in-demand residential property in Mayfair. The average cost per bedroom is just over £2 million on Mount Street compared to £1.7 in the wider Mayfair district, based on average asking prices in the year to June 2014, which represents a premium of 17.5%.
This ‘Mount Street effect’ on residential prices will be replicated across Mayfair as the quality of the retail and public areas continues to improve.
Front cover image reproduced with the kind permission of British Land