maxdb data collector - · pdf fileapplicationmanager – maxdb data collector ... the data...
TRANSCRIPT
MaxDBData Collector
Status: 12/10/2008
Copyright © REALTECH 2008 Page 2 of 12
theGuard! ApplicationManager – MaxDB Data Collector
Contents
Introduction ....................................................................................................................................................... 3Performance Features of the ApplicationManager Data Collector for MaxDB ..................................................... 3Architecture of the MaxDB Database................................................................................................................. 4The MaxDB Data Collector ................................................................................................................................ 5
Monitoring of Data Area and Log Area ........................................................................................................... 6Monitoring of Log Configuration ..................................................................................................................... 7Monitoring of Database Parameters............................................................................................................... 7liveCache Monitoring ..................................................................................................................................... 8Common Qualities ......................................................................................................................................... 9Performance Management........................................................................................................................... 10Management of the Operating System ......................................................................................................... 11Pre-defined Monitoring Policies.................................................................................................................... 11
Appendix: The Data Collector's Object Structure ............................................................................................. 12
Copyright © REALTECH 2008 Page 3 of 12
theGuard! ApplicationManager – MaxDB Data Collector
Introduction
There's more to efficient application management than maximizing availability. Targeted tuning can increase theperformance and stability of business-critical applications without having to invest in additional hardware(processors, RAM, disk space).A number of data collectors have been developed for theGuard! ApplicationManager that providecomprehensive monitoring and generate detailed data analyses. Data collectors do more than simply collectevents according to pre-defined rules. They deliver every performance value and the current status of eachapplication object in real time. They also provide insight into configuration attributes, such as the release statusor the application's parameter settings. Data collectors model an application in objects and sub-objects, enablinga dedicated handling of alerts, monitoring or status messages. This model ensures that information is clearlystructured and that messages are easy to allocate to a problem.Pre-defined and reusable policies for each type of application facilitate the implementation of the solution andthe adaptation of monitoring to dynamic landscapes. The ease with which thresholds are set ensures the earlyrecognition of potential errors. Comprehensive reaction management enables flexible alerting for more than 100different devices and alarm consoles.The automatic discovery of new application instances and objects, including the automatic allocation of policies,enables automatic monitoring even in those cases in which system administrators have completely reconfiguredthe application, for example, by adding new instances or objects.Central reporting at the application instance and application object level provides for a detailed and effectivecapacity management of all resources.Integrated Service Level Management ensures that the service levels for application availability andperformance are achieved, while Operational Level Agreements (OLAs) can be easily defined at the applicationobject level.
Performance Features of the ApplicationManager Data Collectorfor MaxDB
The data collector for MaxDB/SapDB allows monitoring and analysis of MaxDB databases version 7.5 as well asSAP DB databases versions 7.3 and 7.4. The data collector supports monitoring of additional performance-critical values, if MaxDB is configured as liveCache.The database and the trace log file (krnldig.err) are defined and analyzed individually within the framework ofthe CIM model as Managed Objects (MO).Further functionalities such as the monitoring of archiving, data areas and log areas, sessions, databaseparameters, caches as well as trace logs are described in the data collector's online documentation „DC Online.This document gives an overview of the most important functions of the data collector.
Copyright © REALTECH 2008 Page 4 of 12
theGuard! ApplicationManager – MaxDB Data Collector
Architecture of the MaxDB Database
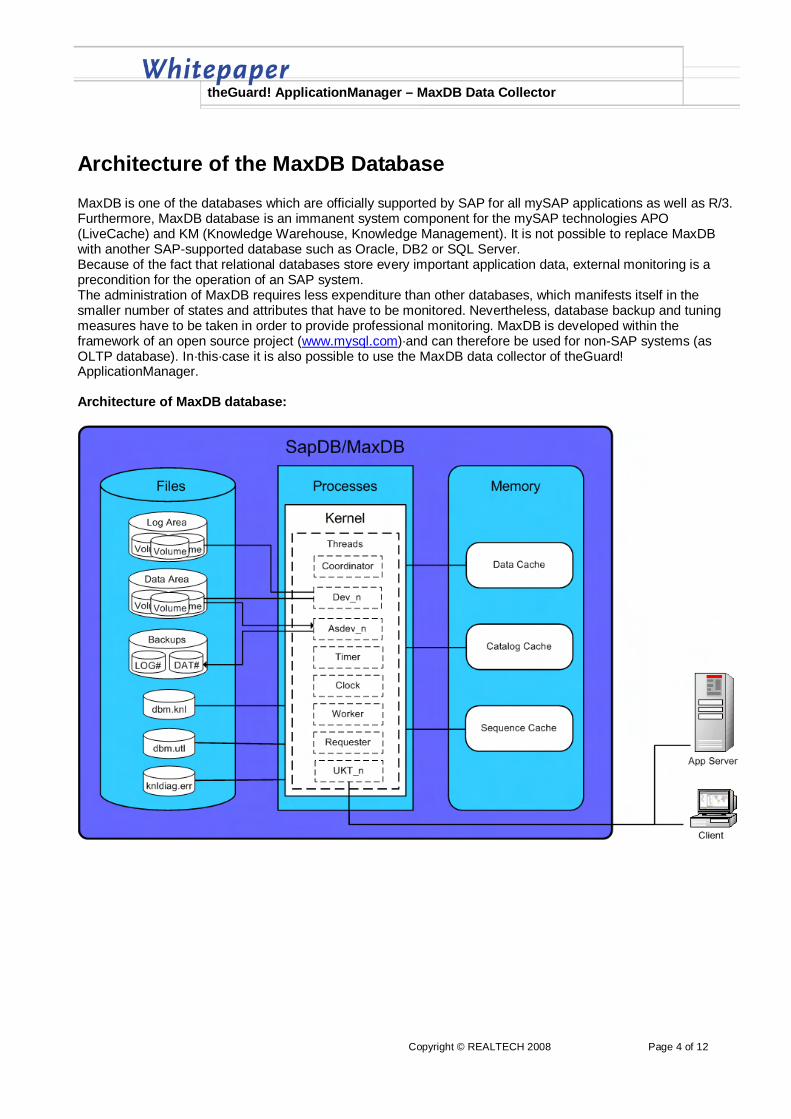
MaxDB is one of the databases which are officially supported by SAP for all mySAP applications as well as R/3.Furthermore, MaxDB database is an immanent system component for the mySAP technologies APO(LiveCache) and KM (Knowledge Warehouse, Knowledge Management). It is not possible to replace MaxDBwith another SAP-supported database such as Oracle, DB2 or SQL Server.Because of the fact that relational databases store every important application data, external monitoring is aprecondition for the operation of an SAP system.The administration of MaxDB requires less expenditure than other databases, which manifests itself in thesmaller number of states and attributes that have to be monitored. Nevertheless, database backup and tuningmeasures have to be taken in order to provide professional monitoring. MaxDB is developed within theframework of an open source project (www.mysql.com)·and can therefore be used for non-SAP systems (asOLTP database). In·this·case it is also possible to use the MaxDB data collector of theGuard!ApplicationManager.
Architecture of MaxDB database:
Copyright © REALTECH 2008 Page 5 of 12
theGuard! ApplicationManager – MaxDB Data Collector
The MaxDB Data Collector
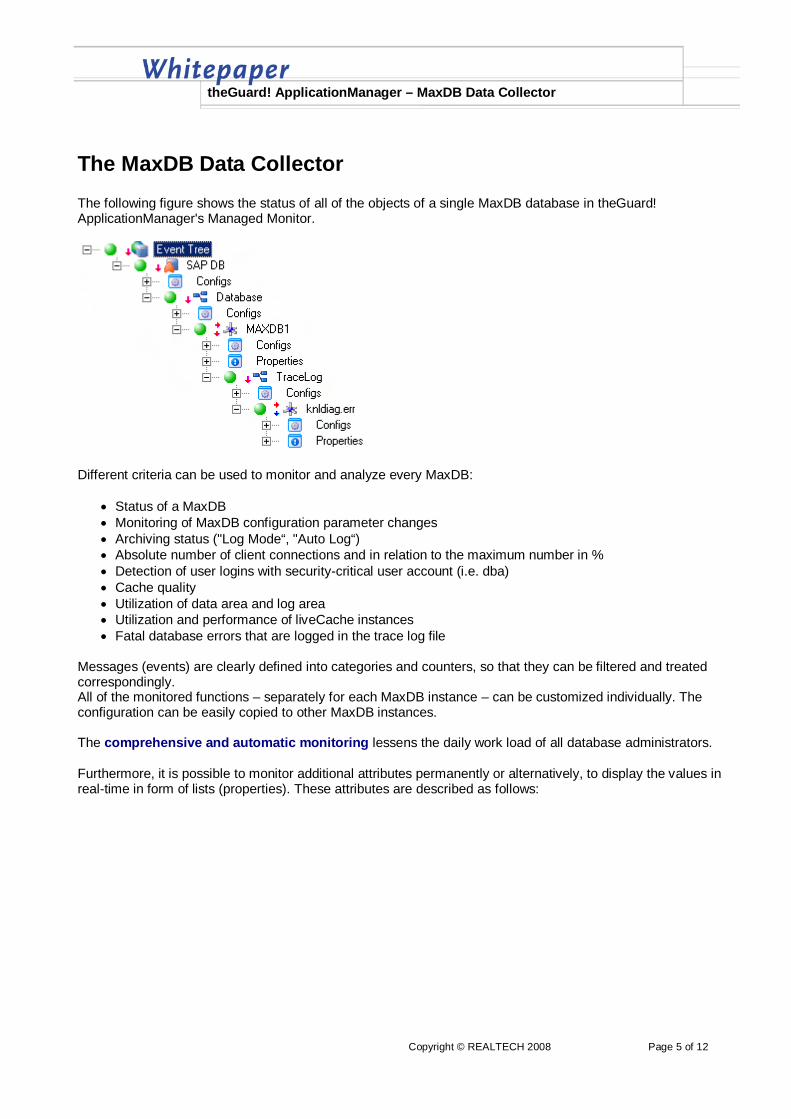
The following figure shows the status of all of the objects of a single MaxDB database in theGuard!ApplicationManager's Managed Monitor.
Different criteria can be used to monitor and analyze every MaxDB:
Status of a MaxDB Monitoring of MaxDB configuration parameter changes Archiving status ("Log Mode“, "Auto Log“) Absolute number of client connections and in relation to the maximum number in % Detection of user logins with security-critical user account (i.e. dba) Cache quality Utilization of data area and log area Utilization and performance of liveCache instances Fatal database errors that are logged in the trace log file
Messages (events) are clearly defined into categories and counters, so that they can be filtered and treatedcorrespondingly.All of the monitored functions – separately for each MaxDB instance – can be customized individually. Theconfiguration can be easily copied to other MaxDB instances.
The comprehensive and automatic monitoring lessens the daily work load of all database administrators.
Furthermore, it is possible to monitor additional attributes permanently or alternatively, to display the values inreal-time in form of lists (properties). These attributes are described as follows:
Copyright © REALTECH 2008 Page 6 of 12
theGuard! ApplicationManager – MaxDB Data Collector
Monitoring of Data Area and Log Area
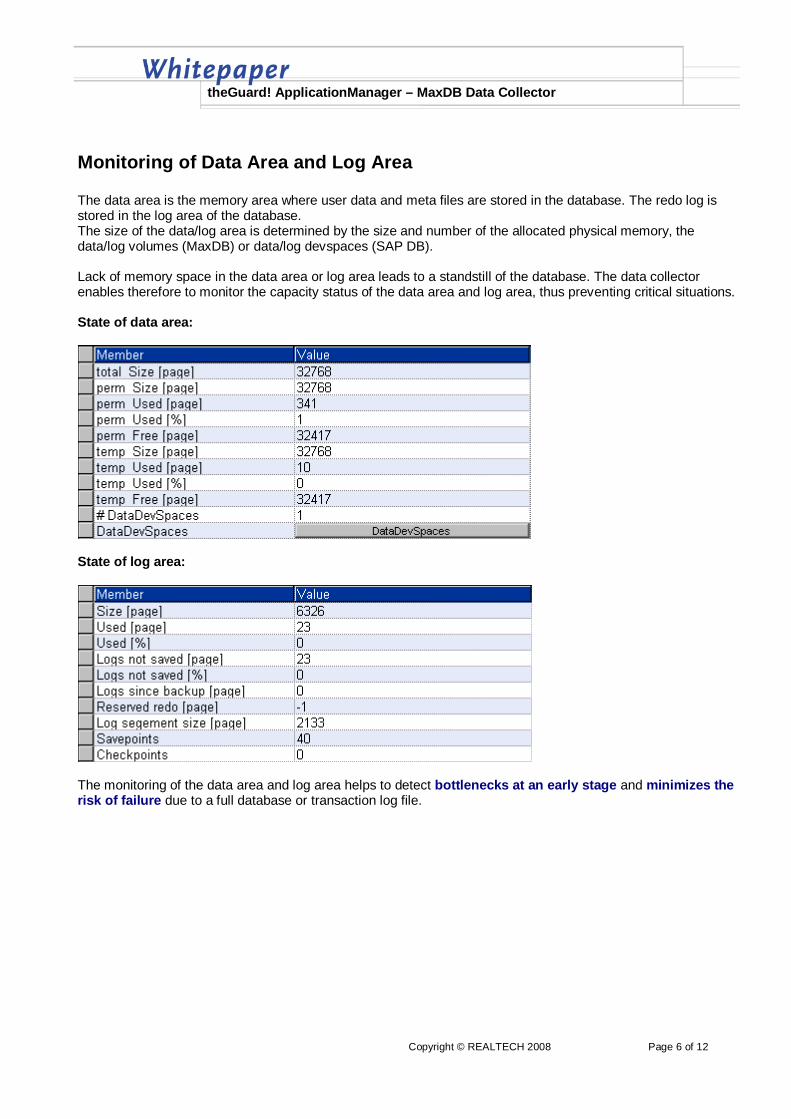
The data area is the memory area where user data and meta files are stored in the database. The redo log isstored in the log area of the database.The size of the data/log area is determined by the size and number of the allocated physical memory, thedata/log volumes (MaxDB) or data/log devspaces (SAP DB).
Lack of memory space in the data area or log area leads to a standstill of the database. The data collectorenables therefore to monitor the capacity status of the data area and log area, thus preventing critical situations.
State of data area:
State of log area:
The monitoring of the data area and log area helps to detect bottlenecks at an early stage and minimizes therisk of failure due to a full database or transaction log file.
Copyright © REALTECH 2008 Page 7 of 12
theGuard! ApplicationManager – MaxDB Data Collector
Monitoring of Log Configuration
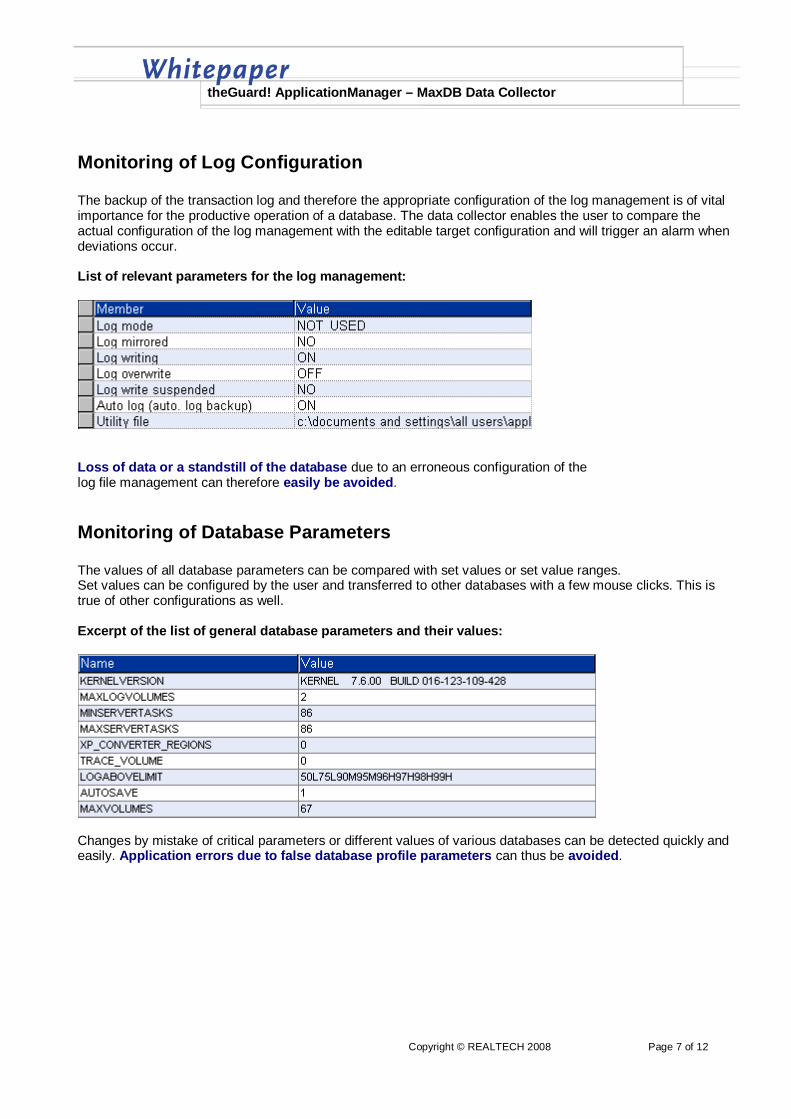
The backup of the transaction log and therefore the appropriate configuration of the log management is of vitalimportance for the productive operation of a database. The data collector enables the user to compare theactual configuration of the log management with the editable target configuration and will trigger an alarm whendeviations occur.
List of relevant parameters for the log management:
Loss of data or a standstill of the database due to an erroneous configuration of thelog file management can therefore easily be avoided.
Monitoring of Database Parameters
The values of all database parameters can be compared with set values or set value ranges.Set values can be configured by the user and transferred to other databases with a few mouse clicks. This istrue of other configurations as well.
Excerpt of the list of general database parameters and their values:
Changes by mistake of critical parameters or different values of various databases can be detected quickly andeasily. Application errors due to false database profile parameters can thus be avoided.
Copyright © REALTECH 2008 Page 8 of 12
theGuard! ApplicationManager – MaxDB Data Collector
liveCache Monitoring
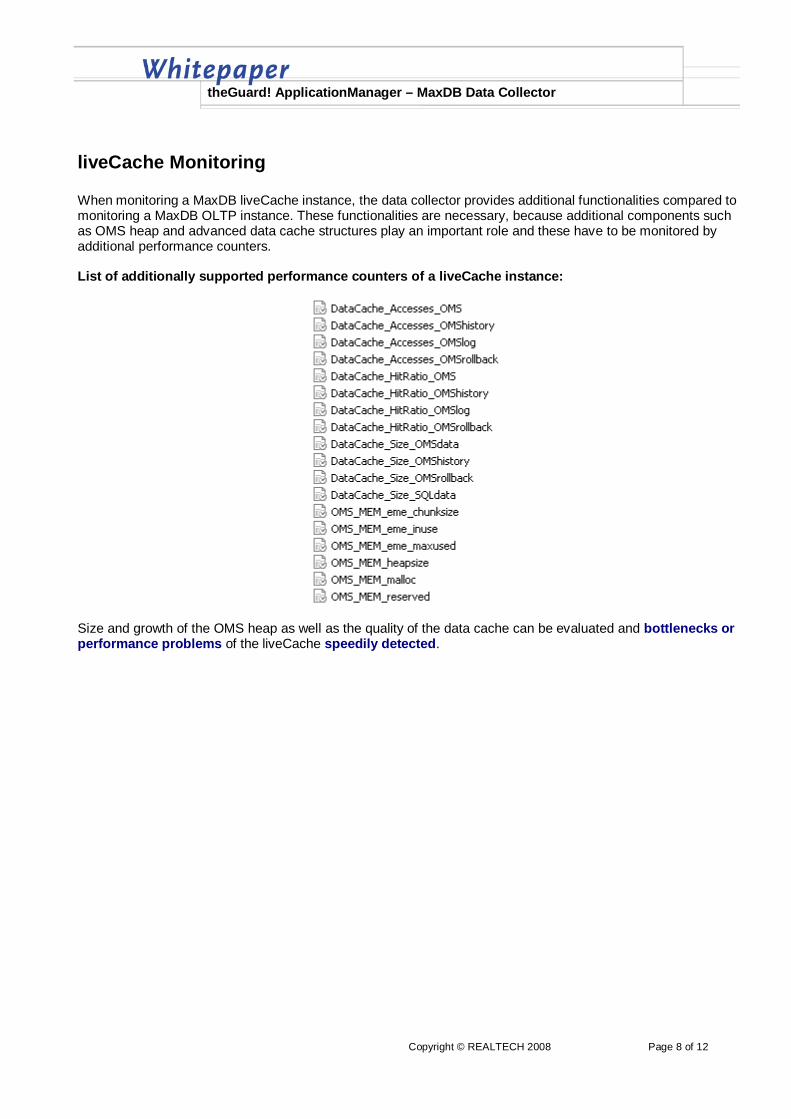
When monitoring a MaxDB liveCache instance, the data collector provides additional functionalities compared tomonitoring a MaxDB OLTP instance. These functionalities are necessary, because additional components suchas OMS heap and advanced data cache structures play an important role and these have to be monitored byadditional performance counters.
List of additionally supported performance counters of a liveCache instance:
Size and growth of the OMS heap as well as the quality of the data cache can be evaluated and bottlenecks orperformance problems of the liveCache speedily detected.
Copyright © REALTECH 2008 Page 9 of 12
theGuard! ApplicationManager – MaxDB Data Collector
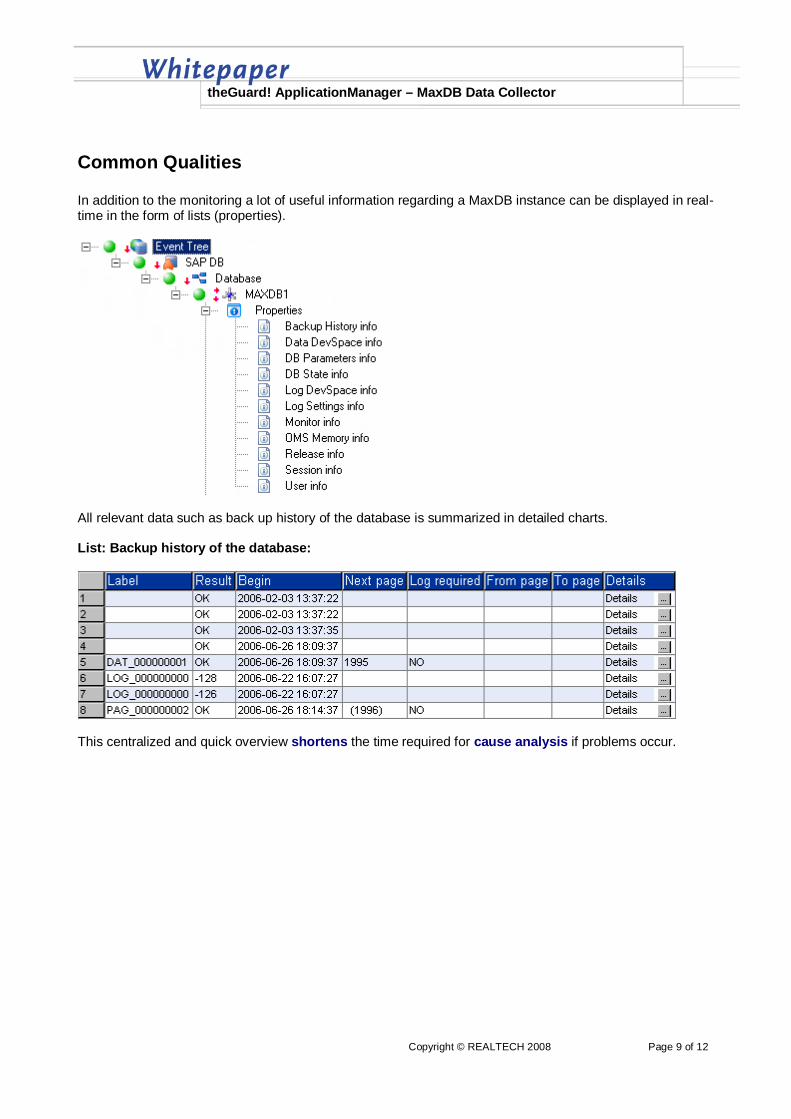
Common Qualities
In addition to the monitoring a lot of useful information regarding a MaxDB instance can be displayed in real-time in the form of lists (properties).
All relevant data such as back up history of the database is summarized in detailed charts.
List: Backup history of the database:
This centralized and quick overview shortens the time required for cause analysis if problems occur.
Copyright © REALTECH 2008 Page 10 of 12
theGuard! ApplicationManager – MaxDB Data Collector
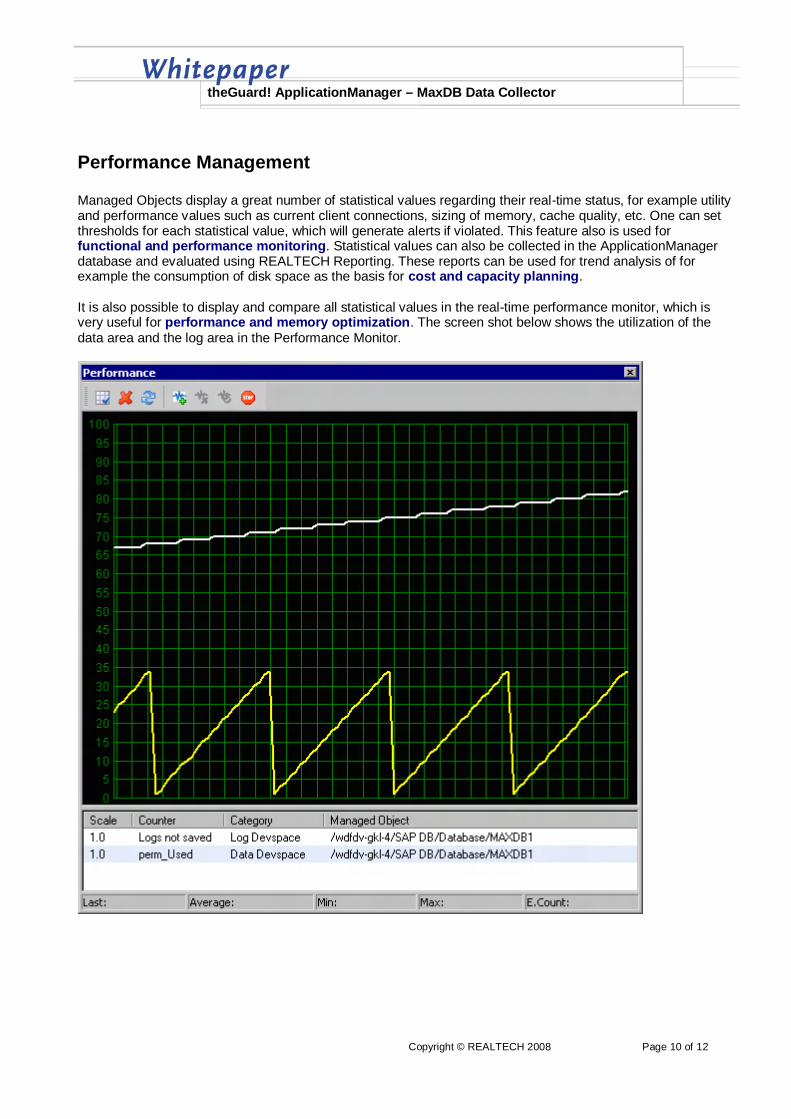
Performance Management
Managed Objects display a great number of statistical values regarding their real-time status, for example utilityand performance values such as current client connections, sizing of memory, cache quality, etc. One can setthresholds for each statistical value, which will generate alerts if violated. This feature also is used forfunctional and performance monitoring. Statistical values can also be collected in the ApplicationManagerdatabase and evaluated using REALTECH Reporting. These reports can be used for trend analysis of forexample the consumption of disk space as the basis for cost and capacity planning.
It is also possible to display and compare all statistical values in the real-time performance monitor, which isvery useful for performance and memory optimization. The screen shot below shows the utilization of thedata area and the log area in the Performance Monitor.
Copyright © REALTECH 2008 Page 11 of 12
theGuard! ApplicationManager – MaxDB Data Collector
Management of the Operating System
In order to provide complete security for a MaxDB one should monitor the essential parameters of the Windowsoperating system, such as physical hard disks, processor utilization, page file, etc. These and other values canbe gathered and evaluated with the help of corresponding data collectors.
Pre-defined Monitoring Policies
The MaxDB data collector contains a number of comprehensive pre-defined policies for each object type, suchas database or trace log.
For more information aboutREALTECH’s software solutions see::
www.realtech.com
REALTECH AGIndustriestr. 39c
69190 Walldorf · GermanyTel +49.6227.837.591Fax +49 6227 837 837
mailto:[email protected]://www.realtech.com
Copyright © REALTECH 2008 Page 12 of 12
theGuard! ApplicationManager – MaxDB Data Collector
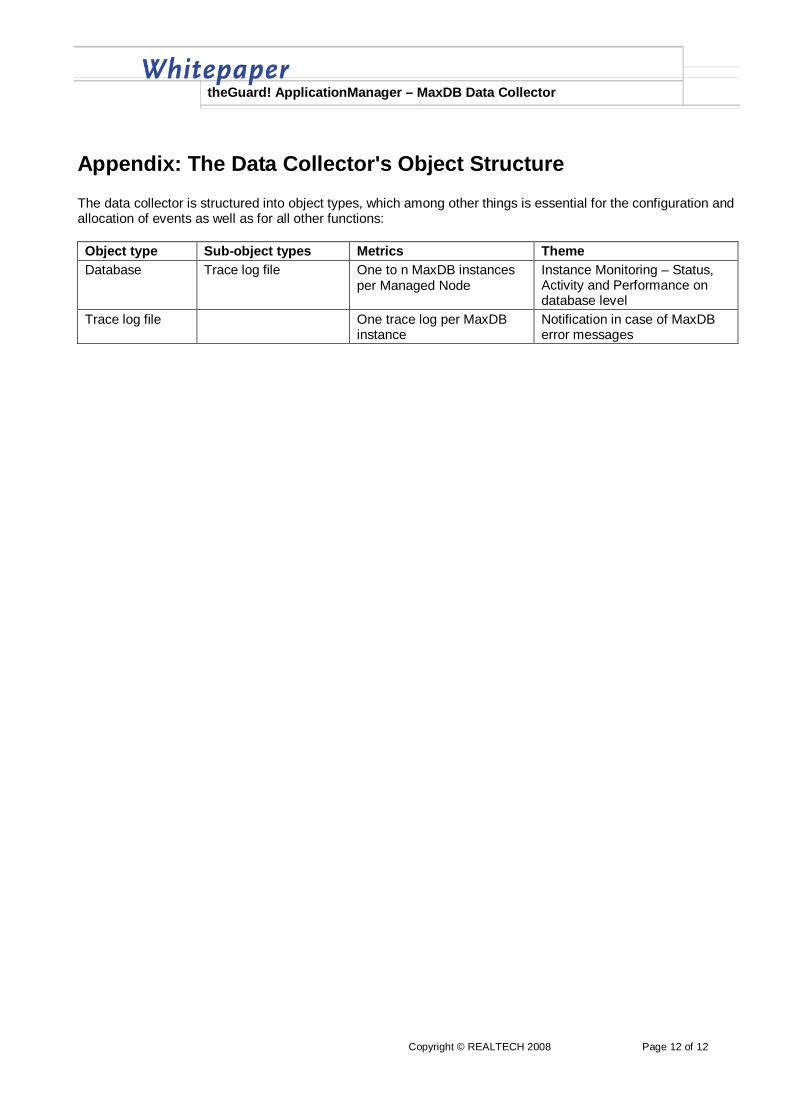
Appendix: The Data Collector's Object Structure
The data collector is structured into object types, which among other things is essential for the configuration andallocation of events as well as for all other functions:
Object type Sub-object types Metrics Theme
Database Trace log file One to n MaxDB instancesper Managed Node
Instance Monitoring – Status,Activity and Performance ondatabase level
Trace log file One trace log per MaxDBinstance
Notification in case of MaxDBerror messages