matteson retail report
DESCRIPTION
Retail & shopping feasibilityTRANSCRIPT
RETAIL MARKET FEASIBILITY STUDY LINCOLN MALL AREA LINCOLN HIGHWAY, CICERO AVENUE & INTERSTATE 57 MATTESON, ILLINOIS PREPARED FOR VILLAGE OF MATTESON MATTESON, ILLINOIS JUNE 2006
TABLE OF CONTENTS
Section Number Title Page Number I. ASSIGNMENT 1 Study Assumptions 2 II. EXECUTIVE SUMMARY 3 General Findings 3 Conclusions 3
Recommended Actions 11 Estimated Retail Sales by Retail Category 11 Prospective Major Retailers 15 Lifestyle Tenants in Lifestyle Center – Not in Lincoln Mall 15 Matteson’s Shopping Centers 16
III. METHODOLOGY AND DEFINITIONS 20 Methodology 20 Definitions 23 IV. LINCOLN MALL AREA’S RETAIL CONCENTRATION 26 Matteson’s Retail Sales 26 Comparison of Lincoln Mall to Eight Other Malls 27 Comparison of Lincoln Mall to Four Lifestyle Centers 29 Matteson Shopping Centers - Part of the Lincoln Mall Area 31 V. RETAIL TRENDS 32 National Trends 32 Chicagoland Retail Situation 33 Retail Development and Vacancy 34 Big Box Discount Department Stores and Supercenters 35 Department Stores 36
Supermarkets and Warehouse Stores 37 Drug Stores 38 Electronics Stores 38 Furniture Stores 38 Home Improvement Stores 39 Restaurant & Quick Service Casual Facilities 39 VI. RETAIL MARKET ANALYSIS 41 Site/Location 41 Accessibility 41 Traffic Counts 42 Driving Time Analysis 43
Trade Area Delineation 44 Trade Area Market Support Factors 44
TABLE OF CONTENTS (Continued)
Section Number Title Page Number VI. RETAIL MARKET ANALYSIS (Continued) Competitive Environment 48 Orland Park 49 Homewood/Glenwood 51 Tinley Park 52 Crestwood 52 Country Club Hills 52 Calumet City 52 Planned and Proposed Shopping Facilities 53 Retail Expenditure Patterns 53 Market Penetration 60 Estimated Retail Sales by Retail Category 63 Home Improvement 63 General Merchandise 63 Food Stores 64 Furniture & Home Furnishings 64 Electronics & Appliances 64 Eating & Drinking 65 Drug and Miscellaneous 65 Prospective Major Retailers 66 Lifestyle Tenants not located in Lincoln Mall 66 Matteson’s Shopping Centers near Lincoln Mall 68 Introduction to Melaniphy & Associates, Inc. Addenda
LIST OF TABLES
Number Title Page Number 2.1 Market Support Factors, Matteson Trade Area 6 2.1 Market Support Factors, Matteson Trade Area (Continued) 7 2.2 2006 Retail Sales and Market Penetration – Matteson, Illinois 8 2.3 Estimated Retail Expenditures, Market Penetration, & Matteson Estimated Retail Sales, 2006, 2010, & 2015 19 4.1 Matteson Retail & Foodservice Sales 2002 – 2005 27 4.2 Comparison of Chicagoland Selected Malls to Matteson’s Lincoln Mall 28 4.3 Comparison of Chicago Lifestyle Center Demographics 30 6.1 Market Support Factors – Lincoln Mall Area Trade Area 46 - 47
6.2 Competitive Retail Facilities 50 6.3 2002 Retail Sales, Cook County, City of Chicago, and Matteson 54 - 57 6.4 Retail Sales by County, Chicago Metropolitan Area, 2003 - 2005 58 6.5 Matteson Retail & Foodservice Sales – 2002 – 2005 58 6.6 Per Capita Retail Expenditures by Retail Category, 2006, 2010, & 2015 60 6.7 Matteson’s Estimated Retail Expenditures by Retail Categories,
2006, 2010, & 2015 61 6.8 Estimated Retail Expenditures, Market Penetration, & Matteson Estimated Retail Sales, 2006, 2010, & 2015 62

LIST OF FIGURES
Figure Page Number Description Number 2.A Matteson Trade Area 4 4.A Lincoln Mall Redevelopment, Matteson, Illinois 26 6.A Aerial View, the Lincoln Highway and Cicero Avenue Interchange Adjacent to Interstate the Interstate 67 Interchange 41 6.B Traffic Counts for Major State and Federal Roads, Illinois Department of Transportation, Matteson, Illinois 42 6.C Driving Time Analysis – 10 & 20 Minutes, Lincoln Mall Area 43 6.D Matteson Trade Area Map 45 6.E 10 Mile Radius Map, Lincoln Mall, Matteson, Illinois Showing Position of Orland Square Mall & River Oaks Center 51
Retail Market Feasibility Study, Lincoln Mall Area, Matteson, Illinois
-1-
SECTION I
ASSIGNMENT
Our assignment has been to undertake a Retail Market Feasibility Study in and around Lincoln Mall at the intersection of Lincoln Highway (U.S. Highway 30), Cicero Avenue (Illinois Highway 50), and Interstate 57 in Matteson, Illinois. Our study included the following: A. Preparation of a Market Feasibility Analysis which determined the extent of the current and
future retail market in and around Lincoln Mall. B. A review of the issue of the “dying Lincoln Mall” image. C. Investigation of the realty of the retail redlining issue, along with actions to eliminate the
issue. D. Determination of Matteson’s overall market penetration and by major retail categories. E. Identification of prospective stores that should be in the Lincoln Mall area retail
concentration. F. Preparation of action recommendations to address the image, market, and prospective new
tenants and big box retailers that can flourish and improve retailing and sales tax revenue in the Village
STUDY ASSUMPTIONS The project was carried out under the following assumptions: 1. No major malls, shopping centers, or major big box competitors, other than those identified
in this report will be constructed within the Primary or Secondary portions of the Trade Area. Any such development would require a reassessment of the conclusions and recommendations contained herein.
2. The economy of the United States will not experience another major recession or inflation
that would result in a significant adjustment in consumer spending or buying attitudes. 3. Gasoline prices will not consistently exceed $3.50 per gallon for an extended period of time.
If this occurs, significant changes may occur in shopping and spending patterns. 4. The United States will not expand the current war on terrorism or escalate military operations
overseas, nor will the United States experience any major catastrophe or terrorist act that would interrupt shopping, driving, mail delivery, or spending patterns.
Retail Market Feasibility Study, Lincoln Mall Area, Matteson, Illinois
-2-
5. A considerable amount of data has been gathered, sorted, and analyzed. Much of the data
has come from agencies of federal, state, county, and the Village of Matteson, along with local real estate companies. Additionally, secondary sources have been utilized, where pertinent. Where possible, our staff has examined the information for its validity and authenticity. Since we have no way of controlling the development of these data sources, we take no responsibility for any inaccuracy. During the course of the study program we have utilized standard statistical techniques involving both subjective and objective judgments in order to arrive at the conclusions and recommendations.
6. We certify that we have no present of prospective interest in the properties in the Matteson
area that are the subject of this report and we have no personal interest or bias with respect to the parties involved. Our compensation is not contingent upon any action or event resulting from this analysis, opinions, or conclusions, in or use of this report.
Retail Market Feasibility Study, Lincoln Mall Area, Matteson, Illinois
-3-
SECTION II
EXECUTIVE SUMMARY The conclusions and recommendations resulting from this market study are contained throughout this report. However, for convenience, this section of the report summarizes our findings. GENERAL FINDINGS 1. Matteson is a dynamic retail Chicagoland suburb. While Matteson only has a population
of approximately 15,000 people, the Community’s retail sales are the 16th largest in the metropolitan area. In 1998, Matteson was in the 21st position with sales of $440 million. In 2005, Matteson’s retail sales amounted to approximately $804.7 million. The sales were down slightly from the 2004 sales of $804.8, but up from the 2003 retail sales of $789.9 million according to the Illinois Department of Revenue, Sale Tax Receipt reports.
2. Matteson has over 2,700,000 square feet of retail space, including Lincoln Mall, numerous
other shopping centers, and large big box stores. 3. Matteson’s population size has been more of a limiting factor in retail sales growth,
than retailer store interest. The Village has a population of approximately 15,000 and a Primary Trade Area population of 151,534 persons. Most major mall areas have higher population numbers. More population growth in Matteson and its adjacent suburbs will have a positive impact upon retail sales.
4. The Lincoln Mall Area has excellent access. Lincoln Highway (U.S. 30) is a major east-
west traffic artery extending from the Indiana-Illinois state line to Frankfort, Illinois and beyond. .Cicero Avenue (Illinois 50) is a major north-south artery that traverses most of the Chicagoland area. Interstate 57 connects the City of Chicago with Memphis, Tennessee and beyond. All of these routes contribute to the importance of retailing in Matteson.
5. Matteson’s current Average Household Income is estimated at approximately $72,500.
By 2010, Average Household Income is expected to rise to approximately $80,000. 6. The planned third Chicagoland Airport, should it be built, will add to the Matteson’s area
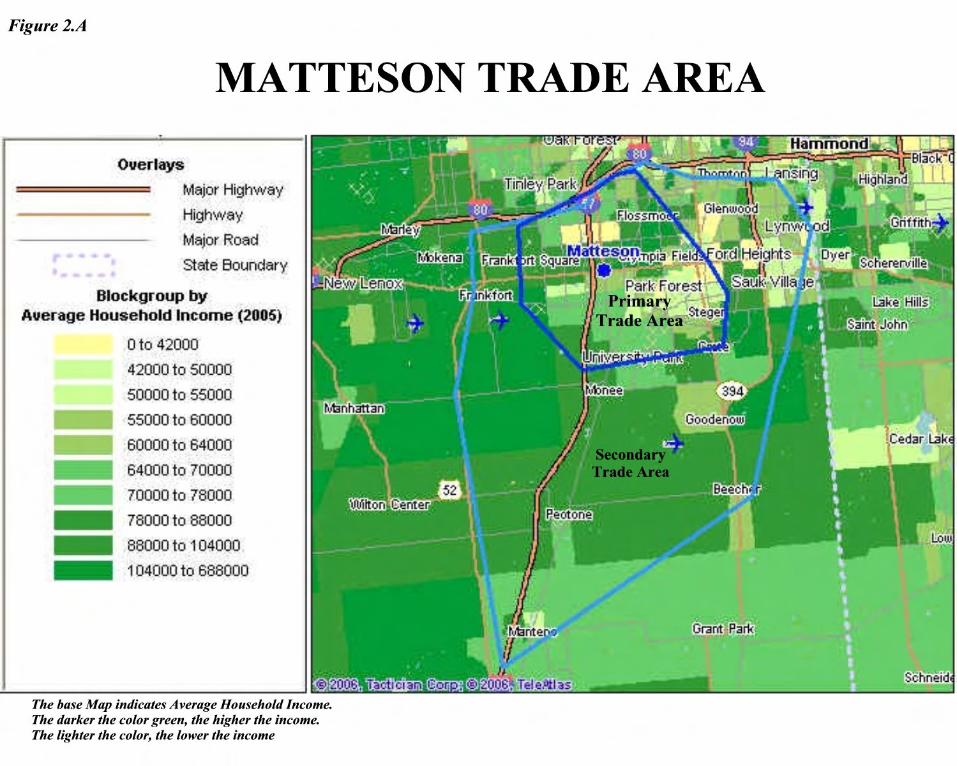
dynamics with new housing, jobs, and increased retail sales. CONCLUSIONS 1. Matteson’s Trade Area extends northward to Interstate 80, eastward to just beyond
Illinois Highway 1, southward to Manteno, and westward to Frankfort. Matteson’s Trade Area is proscribed by major malls and retail concentrations in Orland Park, Homewood, Tinley, Park, Crestwood, Calumet City, and developing retail concentrations in Frankfort and Kankakee. Figure 2.A depicts the Total Trade Area of the Matteson retail concentration emanating from Lincoln Highway, Cicero Avenue and Interstate 57.
Retail Market Feasibility Study, Lincoln Mall Area, Matteson, Illinois
-5-
2. The Primary Trade Area, the segment from which the most frequent customers originate, has a current estimated population of 151,534 persons in 52,006 households. The Average Household Income is estimated at $72,452. By 2010, population of the Primary Trade Area is expected to rise to 158,630 persons in 51,989 households. Average Household Income is expected to rise to approximately $80,000. Table 2.1, entitled, Market Support Factors, provides demographic details for the Trade Area.
The Secondary Trade Area, represents that trade area segment where less frequent shoppers originate, contains a population of 115,293 persons in 38,792 households. The population is forecast to 123,890 persons by 2010 and 131,323 persons by 2015. The median age is moderately younger than the Primary Trade Area amounting to an estimated 36.2 years. The average annual household income within the Secondary Trade Area is slightly higher than the Primary Trade Area amounting to an estimated $74,404. Average household is expected to increase to an estimated $83,383 by 2010. The Total Trade Area, including both trade area segments, contains an estimated population of 266,827 persons in 90,798 households. By 2010, the population within the Total Trade Area is forecast to rise to 282,520 persons in 91,869 households, and by 2015 the population is forecast to rise to 296,300 persons in 96,657 households. The median age is 37.1 years.
3. Lincoln Mall, is not a dying Mall, rather it has been impacted by ever changing retail patterns. Like so many other malls, it had become too large for today’s consumer demand. The Mall has eliminated two department stores and is creating a power center along its newly designed internal roadway. Target will reportedly be the first major big box to relocate to the corner of Cicero Avenue and the Mall Road. Other smaller boxes will follow. The internal Mall Road connects Lincoln Highway at Kostner Avenue and extends along the south side of the Mall to Cicero Avenue.
The following major regional shopping centers have lost department stores and have had to adjust or downsize: Yorktown Center, Hawthorn Center, Old Orchard Center, Stratford Square, The Plaza, Gurnee Mills, Oak Brook Center, Northbrook Court, Charlestown Mall, Randhurst Center, North Riverside Park, Lincolnwood Towne Center, Lakehurst Mall (closed), Fax Valley Mall, Orland Park Place, Stratford Square Mall, and Chicago Ridge Mall. Thus, 16 out of the top 20 malls have had to replace at least one department store. Some have been more successful that others.
4. The Automobile category produces the highest retail sales and sales tax revenues in Matteson. In 2005, Automobile category sales amounted to $285.7 million out of total retail sales of $804.7 million. In 2004, Automotive category sales were $276.2 million.
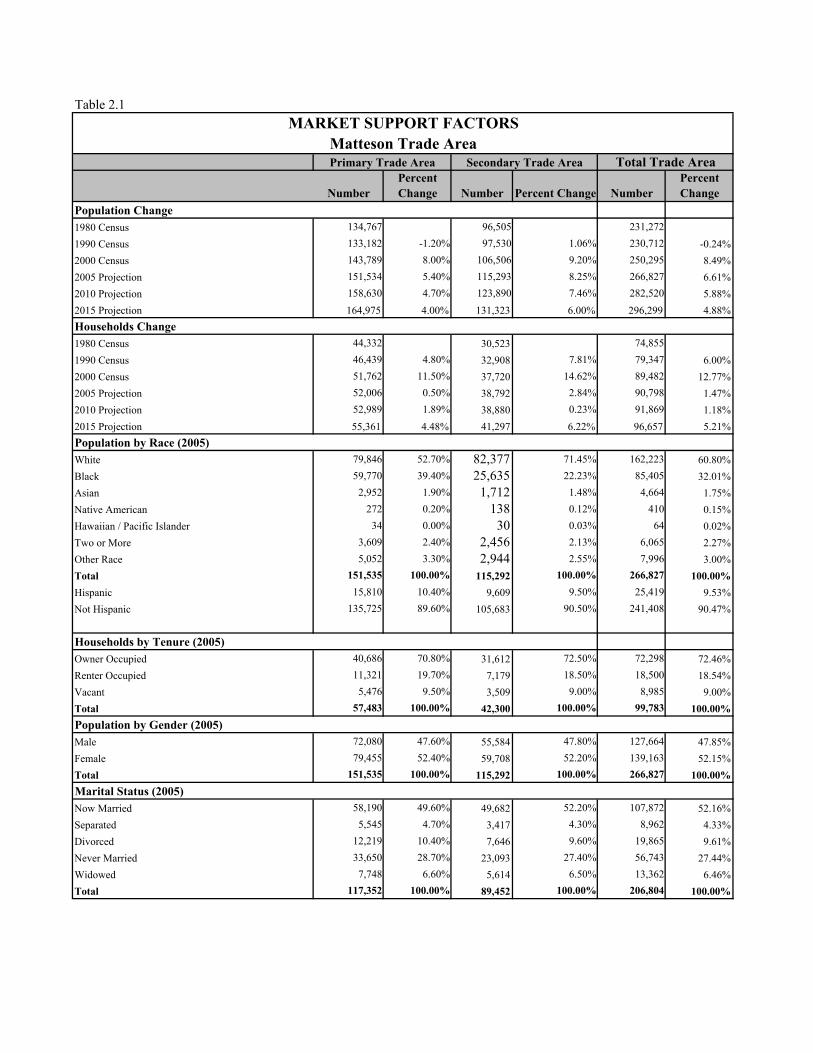
Table 2.1MARKET SUPPORT FACTORS
Matteson Trade AreaTotal Trade Area
NumberPercent Change Number Percent Change Number
Percent Change
1980 Census 134,767 96,505 231,2721990 Census 133,182 -1.20% 97,530 1.06% 230,712 -0.24%2000 Census 143,789 8.00% 106,506 9.20% 250,295 8.49%2005 Projection 151,534 5.40% 115,293 8.25% 266,827 6.61%2010 Projection 158,630 4.70% 123,890 7.46% 282,520 5.88%2015 Projection 164,975 4.00% 131,323 6.00% 296,299 4.88%
1980 Census 44,332 30,523 74,8551990 Census 46,439 4.80% 32,908 7.81% 79,347 6.00%2000 Census 51,762 11.50% 37,720 14.62% 89,482 12.77%2005 Projection 52,006 0.50% 38,792 2.84% 90,798 1.47%2010 Projection 52,989 1.89% 38,880 0.23% 91,869 1.18%2015 Projection 55,361 4.48% 41,297 6.22% 96,657 5.21%
White 79,846 52.70% 82,377 71.45% 162,223 60.80%Black 59,770 39.40% 25,635 22.23% 85,405 32.01%Asian 2,952 1.90% 1,712 1.48% 4,664 1.75%Native American 272 0.20% 138 0.12% 410 0.15%Hawaiian / Pacific Islander 34 0.00% 30 0.03% 64 0.02%Two or More 3,609 2.40% 2,456 2.13% 6,065 2.27%Other Race 5,052 3.30% 2,944 2.55% 7,996 3.00%Total 151,535 100.00% 115,292 100.00% 266,827 100.00%Hispanic 15,810 10.40% 9,609 9.50% 25,419 9.53%Not Hispanic 135,725 89.60% 105,683 90.50% 241,408 90.47%
Owner Occupied 40,686 70.80% 31,612 72.50% 72,298 72.46%Renter Occupied 11,321 19.70% 7,179 18.50% 18,500 18.54%Vacant 5,476 9.50% 3,509 9.00% 8,985 9.00%Total 57,483 100.00% 42,300 100.00% 99,783 100.00%
Male 72,080 47.60% 55,584 47.80% 127,664 47.85%Female 79,455 52.40% 59,708 52.20% 139,163 52.15%Total 151,535 100.00% 115,292 100.00% 266,827 100.00%
Now Married 58,190 49.60% 49,682 52.20% 107,872 52.16%Separated 5,545 4.70% 3,417 4.30% 8,962 4.33%Divorced 12,219 10.40% 7,646 9.60% 19,865 9.61%Never Married 33,650 28.70% 23,093 27.40% 56,743 27.44%Widowed 7,748 6.60% 5,614 6.50% 13,362 6.46%Total 117,352 100.00% 89,452 100.00% 206,804 100.00%
Marital Status (2005)
Households by Tenure (2005)
Population by Gender (2005)
Households Change
Population by Race (2005)
Population Change
Primary Trade Area Secondary Trade Area
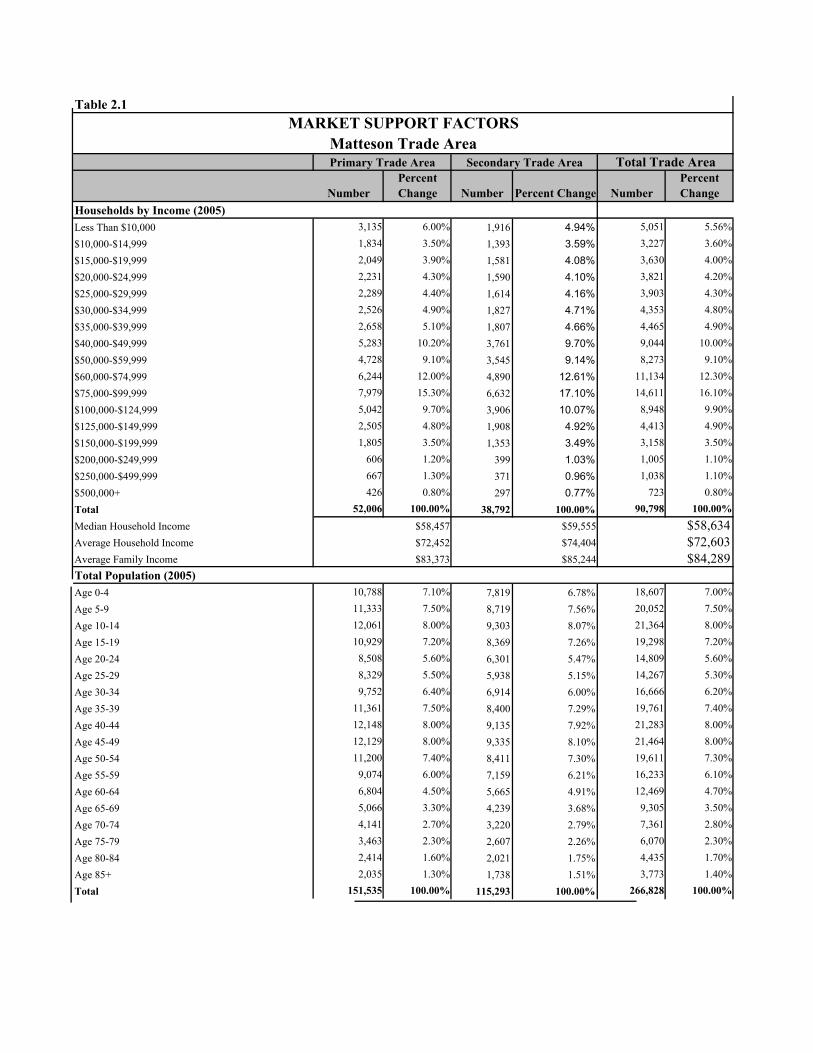
Table 2.1MARKET SUPPORT FACTORS
Matteson Trade AreaTotal Trade Area
NumberPercent Change Number Percent Change Number
Percent Change
Less Than $10,000 3,135 6.00% 1,916 4.94% 5,051 5.56%$10,000-$14,999 1,834 3.50% 1,393 3.59% 3,227 3.60%$15,000-$19,999 2,049 3.90% 1,581 4.08% 3,630 4.00%$20,000-$24,999 2,231 4.30% 1,590 4.10% 3,821 4.20%$25,000-$29,999 2,289 4.40% 1,614 4.16% 3,903 4.30%$30,000-$34,999 2,526 4.90% 1,827 4.71% 4,353 4.80%$35,000-$39,999 2,658 5.10% 1,807 4.66% 4,465 4.90%$40,000-$49,999 5,283 10.20% 3,761 9.70% 9,044 10.00%$50,000-$59,999 4,728 9.10% 3,545 9.14% 8,273 9.10%$60,000-$74,999 6,244 12.00% 4,890 12.61% 11,134 12.30%$75,000-$99,999 7,979 15.30% 6,632 17.10% 14,611 16.10%$100,000-$124,999 5,042 9.70% 3,906 10.07% 8,948 9.90%$125,000-$149,999 2,505 4.80% 1,908 4.92% 4,413 4.90%$150,000-$199,999 1,805 3.50% 1,353 3.49% 3,158 3.50%$200,000-$249,999 606 1.20% 399 1.03% 1,005 1.10%$250,000-$499,999 667 1.30% 371 0.96% 1,038 1.10%$500,000+ 426 0.80% 297 0.77% 723 0.80%Total 52,006 100.00% 38,792 100.00% 90,798 100.00%
Median Household Income $58,634Average Household Income $72,603Average Family Income $84,289
Age 0-4 10,788 7.10% 7,819 6.78% 18,607 7.00%Age 5-9 11,333 7.50% 8,719 7.56% 20,052 7.50%Age 10-14 12,061 8.00% 9,303 8.07% 21,364 8.00%Age 15-19 10,929 7.20% 8,369 7.26% 19,298 7.20%Age 20-24 8,508 5.60% 6,301 5.47% 14,809 5.60%Age 25-29 8,329 5.50% 5,938 5.15% 14,267 5.30%Age 30-34 9,752 6.40% 6,914 6.00% 16,666 6.20%Age 35-39 11,361 7.50% 8,400 7.29% 19,761 7.40%Age 40-44 12,148 8.00% 9,135 7.92% 21,283 8.00%Age 45-49 12,129 8.00% 9,335 8.10% 21,464 8.00%Age 50-54 11,200 7.40% 8,411 7.30% 19,611 7.30%Age 55-59 9,074 6.00% 7,159 6.21% 16,233 6.10%Age 60-64 6,804 4.50% 5,665 4.91% 12,469 4.70%Age 65-69 5,066 3.30% 4,239 3.68% 9,305 3.50%Age 70-74 4,141 2.70% 3,220 2.79% 7,361 2.80%Age 75-79 3,463 2.30% 2,607 2.26% 6,070 2.30%Age 80-84 2,414 1.60% 2,021 1.75% 4,435 1.70%Age 85+ 2,035 1.30% 1,738 1.51% 3,773 1.40%Total 151,535 100.00% 115,293 100.00% 266,828 100.00%
Total Population (2005)$83,373 $85,244
$58,457 $59,555 $72,452 $74,404
Households by Income (2005)
Primary Trade Area Secondary Trade Area
Retail Market Feasibility Study, Lincoln Mall Area, Matteson, Illinois
-8-
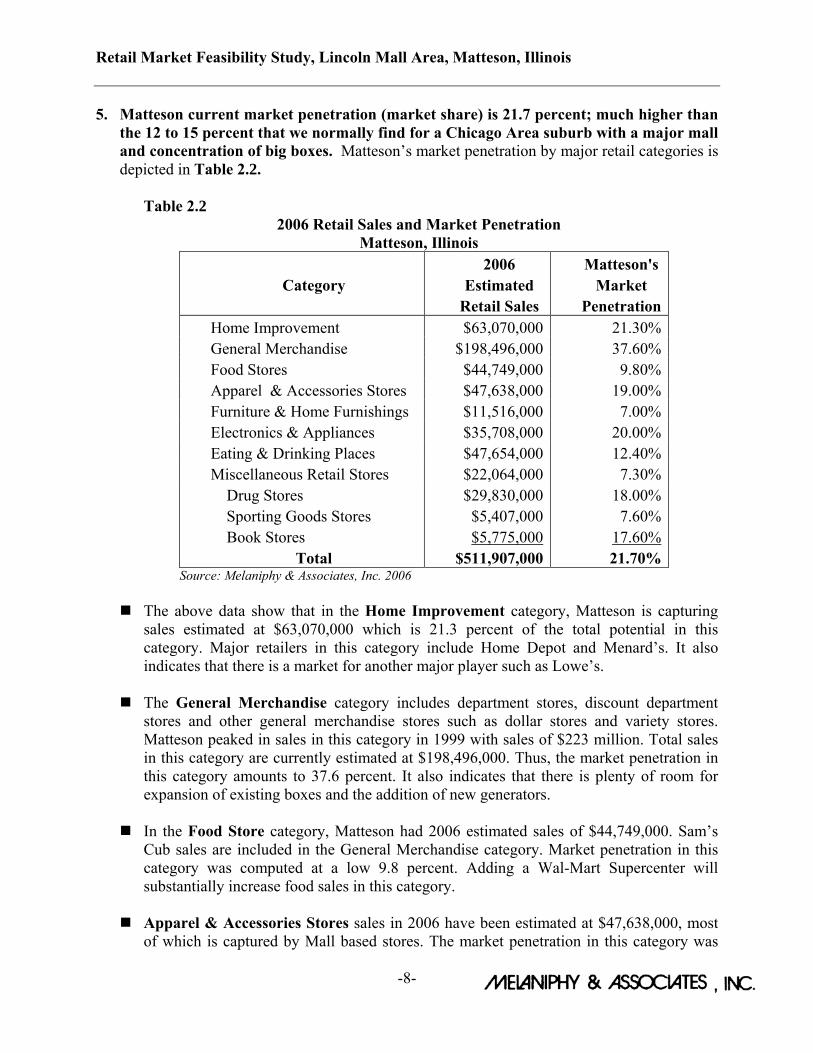
5. Matteson current market penetration (market share) is 21.7 percent; much higher than the 12 to 15 percent that we normally find for a Chicago Area suburb with a major mall and concentration of big boxes. Matteson’s market penetration by major retail categories is depicted in Table 2.2.
Table 2.2
2006 Retail Sales and Market Penetration Matteson, Illinois
2006 Matteson's Category Estimated Market
Retail Sales PenetrationHome Improvement $63,070,000 21.30%General Merchandise $198,496,000 37.60%Food Stores $44,749,000 9.80%Apparel & Accessories Stores $47,638,000 19.00%Furniture & Home Furnishings $11,516,000 7.00%Electronics & Appliances $35,708,000 20.00%Eating & Drinking Places $47,654,000 12.40%Miscellaneous Retail Stores $22,064,000 7.30% Drug Stores $29,830,000 18.00% Sporting Goods Stores $5,407,000 7.60% Book Stores $5,775,000 17.60%
Total $511,907,000 21.70% Source: Melaniphy & Associates, Inc. 2006
The above data show that in the Home Improvement category, Matteson is capturing
sales estimated at $63,070,000 which is 21.3 percent of the total potential in this category. Major retailers in this category include Home Depot and Menard’s. It also indicates that there is a market for another major player such as Lowe’s.
The General Merchandise category includes department stores, discount department stores and other general merchandise stores such as dollar stores and variety stores. Matteson peaked in sales in this category in 1999 with sales of $223 million. Total sales in this category are currently estimated at $198,496,000. Thus, the market penetration in this category amounts to 37.6 percent. It also indicates that there is plenty of room for expansion of existing boxes and the addition of new generators.
In the Food Store category, Matteson had 2006 estimated sales of $44,749,000. Sam’s
Cub sales are included in the General Merchandise category. Market penetration in this category was computed at a low 9.8 percent. Adding a Wal-Mart Supercenter will substantially increase food sales in this category.
Apparel & Accessories Stores sales in 2006 have been estimated at $47,638,000, most
of which is captured by Mall based stores. The market penetration in this category was
Retail Market Feasibility Study, Lincoln Mall Area, Matteson, Illinois
-9-
computed at 19.0 percent. Today, a considerable portion of this category’s sales are captured by big box retailers.
The Furniture & Household Furnishings category had estimated 2006 sales of
$11,516,000 and a market penetration level of 7.0 percent. There is ample room in this category for additional stores. We have talked to Wickes Furniture regarding a new store in Matteson, and they have shown considerable interest doing so.
In the Electronics & Appliances category, we have estimated sales at $35,708,000,
which given both Best Buy and Circuit City in Matteson is low performance. The current level of market penetration is computed at 20.0 percent. One or both of the stores need to expand to capture a larger share of the potential sales.
The Eating & Drinking category has estimated sales captured by Matteson restaurants
and quick service facilities amounting to $47,654,000. This category’s market penetration is computed at 12.4 percent. We expect that there will be additional demand for new restaurants in Matteson, especially with the development of new major big boxes.
In the Miscellaneous Retail Stores category sales have been currently estimated at
$22,064,000. Stores in this category are normally concentrated in the Mall. Market penetration ahs been computed at 7.3 percent. There is a market for additional stores, however, it will not be met until the Mall has completed both external and internal improvements.
Sales in the Drug Store category are estimated at $29,830,000. Market penetration has been computed at 18.0 percent. Some of this market is picked up by Target and Wal-Mart.
In the Sporting Goods category sales have been estimated at $5,407,000. The market
penetration in this category has been computed at 7.60 percent.
Book Stores sales have been estimated at $5,775,000. Market penetration has been computed at 17.6 percent of potential in the Book Store category.
6. Matteson’s principal competition is located in Orland Park with Orland Square Mall,
plus every major big box with the exception of Ikea, Meijer, Costco, and a Wal-Mart Supercenter. Costco is seeking approval for a new store at 159th and LaGrange Road and Wal-Mart is seeking a Supercenter location in Orland Park. Meijer’s has a site ready to go at 143rd Street and Bell Road in Homer Glen, just west of Orland Park. In 2005, retailers in Orland Park captured retail sales exceeding $1.777 billion, up from $1.709 billion in 2004. General Merchandise sales in 2005 amounted to $258.2 million, down from $290.4 million in 2004, for a decrease of $32.2 million. Orland Park contains close to 6,000,000 square feet of retail space.
Retail Market Feasibility Study, Lincoln Mall Area, Matteson, Illinois
-10-
7. A collection of big box retailers has been developed in Homewood and Glenwood on Halsted Street just north of Interstate 80. Boxes include Kohl’s, Target, Wal-Mart, Best Buy, Home Depot, Menard’s, Bed Bath & Beyond, Petco, JoAnn Fabrics, T.J. Maxx, and others. Homewood’s total retail sales in 2005 amounted to $377.2 million up slightly from $363.8 million in 2004.
8. A lifestyle center is currently being leased in Orland Park on LaGrange Road at
approximately 143rd Street. Lifestyle centers are a collection of popular specialty retailers and restaurants that together generate customers on a frequent basis, usually without department stores. Known as Orland Crossing, the center has the beginnings of a lifestyle center featuring Talbot’s, Coldwater Creek, Ann Taylor, Chico’s, Aveda, Aerosoles, along with Starbuck’s, P. F. Chang’s, Francesca’s, White House/ Black Market, Eden Spa, Omaha Steaks, Collections, ECCO, and others. There are numerous vacancies. Lifestyle centers generally require average household incomes above $80,000.
9. Matteson has more retail square feet in some categories than the market can support.
For example, the Apparel and Accessories category has had declining sales since 2002. Unfortunately, there is no simple solution to shifting consumer demand. Consumers are buying more of their apparel in big box stores and less in the Mall. The shift to casual attire has impacted many of these stores. The Miscellaneous Stores Category has also shown weakness. Since most of the stores in this category are located in the Mall, the center has been affected by stores leaving the Mall. The Mall needs to continue with its aggressive marketing plans to attract new stores, as well as improve the facility both in an out to make it more attractive.
10. There is an excess of small vacant retail and service store spaces in Matteson. The slow
down of Mall customer generation has had an impact upon small retailers. More retail dollars are being captured by big box retailers and fewer overall Personal Consumption Expenditures being captured by small retail shops. The market has shifted to services and foodservice. Furthermore, the focus of the market is shifted to Cicero Avenue from Lincoln Highway. Improvement to the Mall and increased retail sales will eliminate some, but not all of the vacancy.
11. Retailer redlining is not ethnic issue; rather it is a reaction to department store closings and the loss of some customer generation. Retailers that we talked to indicated that the market was smaller than other mall areas. Also, Penney’s closing bothered them. Nonetheless, most are interested to see what happens with the Mall redevelopment and new store additions. Matteson’s income is too high and there are too many stores planning expansion or new units to be redlining issue. It is important to get the message out the Matteson is an excellent market. Certainly, the big boxes are moving forward based upon their own experiences. The issue will become moot, as soon as Target opens its new store, Wickes opens a new store, and Wal-Mart announces and builds a Supercenter.
Retail Market Feasibility Study, Lincoln Mall Area, Matteson, Illinois
-11-
RECOMMENDED ACTIONS 1. Lincoln Mall should continue to implement the power center development. When the
current redevelopment plans are complete, the Mall should implement a lifestyle component on the northeast side of the mall. Here, a cinema, restaurants, specialty stores, and entertainment should be added to create excitement. The Mall needs to renovate both the interior and exterior of the Mall. Added improvement in the area will help attract additional merchants.
2. We recommend that Matteson permit big box retailers to expand or build new stores,
such as Wal-Mart, Sam’s Club, and Menard’s, and generally assist in implementing new development plans. Also, encourage Penney’s, Kohl’s, Lowe’s, and Wickes to build new stores.
3. Either Best Buy or Circuit City needs a larger store. As the market penetration indicates one or both need to expand to increase sales. On a combined basis they are only capturing approximately 20 percent of the market in the Electronics & Appliance category.
4. We understand that a user is negotiating to buy the former Builders Square store on Lincoln Highway. We encourage the Village to assist in implementing this action. It will remove a large vacant store, add a viable user, and help to increase activity near many of the smaller shopping centers on Lincoln Highway.
5. Matteson needs to work on its retail image. Regular announcements regarding additions and improvements in Matteson should be communicated to the Chicago area new media. Also, the retail and shopping center media should be informed including Shopping Center Today, Shopping Center Business, Chain Store Age (Shopping Center Addition), Retail Traffic, Heartland Real Estate, Globe Street.Com, and others. Articles should be written regarding Matteson’s dynamics, Mall improvement, market penetration, and retail changes. The issues should be directed toward retailers, making them aware of Matteson’s pro-retailing environment.
Estimated Retail Sales By Retail Category We have estimated retail sales by major retail category and compared the data to the sales actually being captured in the Village. Next, we simulated alternative retail store development scenarios to determine what was realistic. Finally, we estimated the retail sales that are likely should certain actions take place. These are discussed below by retail category. Table 2.3 at the end of Section II presents the potential expenditures by year, trade area segment, major retail category, market penetration percentages, and the estimated retail sales for 2010 and 2015. Home Improvement Matteson’s 2005 retail sales in this category were approximately $63 million. This results in a market penetration in this category estimated at 33 percent for the Primary Trade Area and
Retail Market Feasibility Study, Lincoln Mall Area, Matteson, Illinois
-12-
21.3 percent for the Total Trade Area in relation to Home Improvement expenditures of $296.3 million. Menard’s and Home Depot are the major retailers in this category. Menard’s apparently would like to build a new larger store and it is very likely that Lowe’s will also want to enter this market. In 2010, the potential in this category is forecast to increase to $326.3 million. We forecast that the market penetration should rise to an estimated 27.8 percent, resulting in a sales potential in this category for the existing and added retailers amounting to $90.8 million. By 2015, sales are estimated to rise to approximately $94.8 million. General Merchandise The General Merchandise category includes department stores such as Carson’s and Sears and big box discounters including Wal-Mart, Target, and Value City. These stores generated sales of over $197.4 million in 2005 and are now estimated at $198.5 million. The market penetration in this category amounts to 37.6 percent. Target is planning to build a new store, Wal-Mart would like to build a Supercenter, Penney’s is looking in the market, and Kohl’s may eventually wish to be in this market segment. Our forecasts indicate that the market potential in 2010 in this category will amount to an estimated $615.7 million. We estimate the stores in this category can capture approximately 39.6 percent, resulting in estimated sales of $243.8 million. This assumes the both Sears and Carson’s continue to operate stores in the Mall. By 2015, the potential in General Merchandise is forecast to rise to $707.7 million. We estimate that the General Merchandise stores in Matteson can expect to capture approximately 35.2 percent of the potential, or sales amounting to an estimated $248.8 million. This assumes that Penney’s and Kohl’s enter the market segment and Target and Wal-Mart build new stores. Food Stores The current market penetration in the Food Store category is a low 9.8 percent. Sales in this category in 2005 were $43.4 million, or about $834,000 a week. That is the equivalent of two strong supermarkets. The potential in this category currently amounts to $458.2 million annually. It should be pointed out the Sam’s Club sales are included by the government in the General Merchandise category, so this category is understated. Wal-Mart would like to build a Supercenter which features food. We recommend that they be allowed to do so. The market potential in 2010 is estimated at $502.1 million. We estimate Matteson’s market penetration rise to 15.8 percent, resulting in Food sales of an estimated $79.1 million. By 2015, Food Store sales are estimated at $84.2 million with a market penetration of 15.4 percent.
Retail Market Feasibility Study, Lincoln Mall Area, Matteson, Illinois
-13-
Apparel & Accessories Stores In 2005, Matteson captured retail sales in this category of $47.4 million. We estimate sales currently at $47.6 million, resulting in a market penetration of 19.0 percent. The majority of sales in this category are captured by Lincoln Mall. We have assumed that both Mall department stores will remain and improve their attraction. However, this category has had a difficult time throughout the country. Many stores in this category are affected by big box competition. In 2010, we estimate that sales in this category will be about the same at $47.1 million resulting in a market penetration of 17.0 percent. By 2015, we estimate that sales in this category will be approximately $49.5 million with a market penetration of 16.6 percent. Furniture & Home Furnishings Sales in this category in 2005 amounted to an estimated $11.0 million. The current potential in this category is estimated at $165.4 million, resulting in a current market penetration of 7.0 percent. The data indicate that there is a market in this category for one or two new furniture stores. In 2010, the market potential will increase to an estimated $182.1 million. Furniture stores in this market segment should be capable of capturing a market penetration of 15.1 percent, resulting in estimated retail sales of $27.5 million. By 2015, we estimate that the potential should rise to an estimated $198.2 million and with a market share of 17.3 percent; sales are estimated at $34.3 million. Wickes has already shown an interest in locating a new store in this area. Electronics and Appliances Sales in this category in 2005 amounted to approximately $35.0 million. Given a market potential in this category of an estimated $178.5 million, the market penetration currently amounts to an estimated 20.0 percent. The potential in this category in 2010 amounts to an estimated $209.8 million. We expect either Best Buy or Circuit to expand at there curren location or build a new store in this market area. Sales in this category are estimated at $58.0 million in 2010. In 2015, we expect sales to rise to $64.1 million based upon a market penetration of 26.3 percent. Eating & Drinking This category includes both restaurants and quick service food units (formerly fast-food). Sales in 2005 in this category amounted to $44.9 million. We currently estimate sales at $47.7 million for a market penetration of 12.4 percent based upon a market potential of $385.7 million. In 2010, we estimate that the market potential in this category will rise to an estimated $448.5 million. A considerable portion of these potential dollars are spent where people work and in restaurants outside the Matteson area. Nonetheless, we estimate that Matteson will have a market penetration in 2010 of approximately 13.4 percent, resulting in estimated sales of $60.1 million. By 2015, we estimate that market potential will rise to an estimated $552.7 million and Matteson facilities will capture approximately 13.4 percent, or $70.4 million.
Retail Market Feasibility Study, Lincoln Mall Area, Matteson, Illinois
-14-
Drug Store and Miscellaneous Stores In 2005, this category had retail sales of $65.8 million, up over $10 million from 2004. In our analysis, we have separated the Drug store, Sporting Goods, Book, and Miscellaneous sales from the total category to better see current and future opportunities. Each will be discussed separately.
Drug Stores We estimate that Drug Stores are currently capturing sale amounting to approximately $29.8 million. The market potential in this category amounts to approximately $165.8 million, resulting in a market penetration of 18.0 percent. In the Primary Trade Area the market penetration amounts to 28 percent. By 2010, the potential in this category is forecast to rise to an estimated $184.4 million. Market penetration is expected to decline to 16.7 percent because of additional discount competition, resulting in estimated sales of $30.8 million. In 2015, our estimate of potential sales in this category amounts to $202.3 million, with Matteson capturing sales of 16.3 percent for sales of $32.9 million.
Sporting Goods Sales in this category are currently estimated at $5.4 million. Total market potential in the Sporting Goods category is estimated at $71.1 million, resulting in a market penetration of 7.6 percent. In 2010, we estimate that the market potential will rise to an estimated $79.7 million and with a market share of 9.2 percent; sales will rise to $7.3 million. In 2015, we estimate that the market potential will rise to $87.4 million and with a market share of 9.2 percent; stores in this category should capture sales of an estimated $8.1 million.
Book Stores Currently, we estimate that sales in this category are approximately $5.6 million. With a market potential of $32.9 million, the estimated market penetration is estimated at 17.6 percent. In 2010, we estimate that the market potential will rise to $37.9 million and with a market penetration of 20.3 percent will result in estimated sales of $7.7 million. In 2015, we estimate that the market potential will increase to $42.9 million and with a market penetration of an estimated 20.3 percent; sales are estimated to rise to $8.7 million.
Miscellaneous Retail Stores Sales in this category are currently estimated at $32.1 million of the potential of $301.6 million, resulting in a market penetration of 7.3 percent. By 2010, we estimate the market penetration will decline to approximately 6.3 percent because of big box competition, but potential will rise to $341.8 million because of growth and rising income. Thus, sales in this category are estimated at $21.5 million. By 2015, market potential is forecast to an estimated $382.2 million, resulting in estimated sales of $24.0 million with a market penetration of 6.3 percent.
Retail Market Feasibility Study, Lincoln Mall Area, Matteson, Illinois
-15-
PROSPECTIVE MAJOR RETAILERS
We have evaluated the market potential and the opportunities for retailers not currently in the Matteson portion of the Chicago Metropolitan Area. Listed below are a suggest list of potential retailers.
Barnes & Noble Costco DSW Shoes Ashley Furniture Kohl’s Lowe’s Home Improvement Penney’s new free-standing stores Wickes Furniture Woodman’s Warehouse Foods Wal-Mart Supercenter
LIFESTYLE TENANTS IN LIFESTYLE CENTERS IN THE CHICAGO AREA WHO ARE NOT IN LINCOLN MALL
Lincoln Mall has contacted many of these retailers in an attempt to secure them for the Mall. Usually it takes three interested retailers or restaurants at the same time to get the attention of others. We encourage repeated attempts to obtain some lifestyle tenants. It will be necessary to create and environment that appeals to their objectives. Redevelopment of the former department store at the east end of the Mall into a lifestyle component featuring lifestyle retailers, restaurants, cinema, and entertainment segment would have a positive impact upon the Mall. Some of the lifestyle tenants normally found in lifestyle centers are as follows.
Lifestyle Tenants Abercrombie & Fitch American Eagle Outfitters Ann Taylor and Ann Taylor Loft Anthropologie April Cornell Banana Republic Barnes and Noble Bombay & Bombay Kids Build-A-Bear Chico’s Coach Coldwater Creek Crate & Barrel Eddie Bauer Gap, Baby Gap, Gap Kids Dick’s Sporting Goods H & M
Retail Market Feasibility Study, Lincoln Mall Area, Matteson, Illinois
-16-
Lifestyle Tenants (Continued) Hollister Co. Hot Topic’s J Crew Jos. A. Bank Pottery Barn and Pottery Barn Kids Restoration Hardware Smith & Hawken Steve Madden Talbot's, Talbot's Petites, Talbot's Woman Tommy Bahama Trader Joe’s Williams-Sonoma Yankee Candle Company Z Gallerie Cinema’s
Lifestyle Restaurants The Cheesecake Factory Brio Tuscan Grille P. F. Chang’s China Bistro California Pizza Kitchen Claddagh Irish Pub Cold Stone Creamery Noodles & Company Corner Bakery Café Big Bowl Asian Kitchen Maggiano’s Little Italy Potbelly Sandwich Works Romano’s Macaroni Grill Rockfish Seafood Grill Bar Louis Max & Irma’s
MATTESON’S SHOPPING CENTERS The following are a list of Matteson area shopping centers located principally on Lincoln Highway. They vary in size and condition. Some are aggressive and others are passive, simply waiting for a retailer or service store to call. In this environment, one cannot sit and wait; one must be aggressive a go after retailers. Below is a brief discussion of centers in Matteson other than Lincoln Mall.
Matteson Towncenter is located in the southwest quadrant of Cicero Ave & Lincoln Highway containing 229,041 square feet. The shopping center currently contains Pets Mart,
Retail Market Feasibility Study, Lincoln Mall Area, Matteson, Illinois
-17-
Office Max, Fashion Bug, Old Country Buffet and others. Toys R Us is a separate property, as is Applebee’s and Fuddruckers. A site fronting on Cicero Avenue at the center’s traffic light is being readied for development. The shopping center owner is preparing a redevelopment plan for the shopping center which includes a realigned internal roadway. When complete, it will be submitted to the Village. We encourage Village assistance for this strategic location at the Interstate 57, the Matteson Gateway.
Century Tile Plaza at 20909 S. Cicero Avenue on the east side of Cicero Avenue contains
approximately 49,600 square feet. The primary tenant is Century Tile and a medical office. The vacancies are small store spaces which today are difficult to lease. The owners current focus should be toward service stores and small offices. The supply of small retailers is limited are they are more oriented toward Lincoln Highway. Also, seeing that traffic on Cicero Avenue north of Lincoln Highway is often oriented toward Home Depot, retail stores and service shops that are more men oriented would be best. Furthermore, northbound shoppers who are not destined for Home Depot are leaving the shopping area. Service oriented shops that can be on the back-side of a shopping trip should be considered.
Matteson Town Center is located on the northwest corner of Lincoln Highway and Cicero
Avenue. The center contains approximately 157,885 square feet. Tenants include Border’s Books, Sportmart, Linens ‘N Things, Marshalls, Mattress World, Harris Bank, Panera Bread Company, and others.
Liberty Plaza is located at 4555 Lincoln Highway and contains approximately 64,600
square feet. The center fronts on the south side of Lincoln Highway in front of the Mall and has access to the Mall parking lot. Chernin’s Shoes is the principal retail generator. Ownership has an approximately 22,500 square foot site for development. This is a difficult size for individual retailers and will probably necessitate dividing the space for two or more users. The expansion of Wal-Mart and Menards and the relocation of Target, as well as other retail change should have a positive affect upon this shopping center. Moreover, ownership is focused upon addressing the vacancy and development opportunity.
Matteson Plaza, located in the southwest quadrant of Lincoln Highway and Governor’s
Highway at 4243 Lincoln Highway, contains approximately 280,000 square feet. Major tenants include Dominick’s Finer Foods, Michaels, and Value City Department Store. The center was adversely affected by Safeway’s acquisition of Dominick’s and the changes which they instituted which adversely affected the consumer. Value City has not provided the customer generation expected. They are being affected by Wal-Mart. There are considerable vacancies in the center.
Centel Plaza is located on Lincoln Highway at 4331 W. 211th Street and contains
approximately 23,000 square feet. The principal tenant is Hancock Fabricas. There are approximately 9,000 square feet vacant. As with many of the other centers, filling the small spaces is difficult. The market is primarily for service uses and some small retailers who are not competing directly with the big box retailers. Furthermore, many small centers are avoided because of difficult access. Finally, the vacant former Builder’s Square has been an
Retail Market Feasibility Study, Lincoln Mall Area, Matteson, Illinois
-18-
eyesore. It is our understanding that there may be a buyer and user for the Builder’s Square building. If so, it would have a positive impact upon this area and this center.
The Marketplace Plaza is located on the north side of Lincoln Highway at 4200 211th Street
and contains approximately 309,800 square feet. Principal tenants include Cub Foods, Burlington Coat Factory, A. J. Wright, Aronson’s Furniture, and others. This center has had some retail turnover even though that it has some generative retailers. This is a reflection of the excessive amount of vacant small retail space in Matteson. The market for small spaces is over built. Nonetheless, the amount of traffic on Lincoln Highway will continue to increase and offer opportunities for other retailers and service stores.
Lincoln Square shopping center is located at 4431 W. 211th Street in Matteson and contains
approximately 25,000 square feet. The largest store of approximately 8,000 square feet is currently vacant. Pepe’s Mexican Restaurant is the second largest store. The are other small store vacancies. Here again, the market is producing a limited number of small store retail and service tenants. The focus should be on service and foodservice. That is where the most possibilities will occur.
Rose Plaza is located at 4700 W. 211th in Matteson and contains approximately 25,000
square feet with no vacancies. Should vacancies occur, the focus should be toward retail and service.
The Former Builder’s Square on the north side of Lincoln Highway has remained vacant for several years. The unit contains approximately 90,000 square feet and 450 parking spaces. One of the problems of this property is access. The site does not have a traffic light making it difficult to get out of the property. Also, because of the Creek/Retention Area at the frontage of the property the entry is steep, making it more difficult to enter and exit the property. It is our understanding that a user has expressed an interest in the property. The Village should encourage the redevelopment of the property.
The Village staff should continue to participate in International Council of Shopping Centers
(ICSC) meetings and other development and redevelopment workshops and seminars to develop contacts, networking, and identifying possible retailers for Matteson. Also, to carry the message of how well Matteson is doing with its dynamic market.
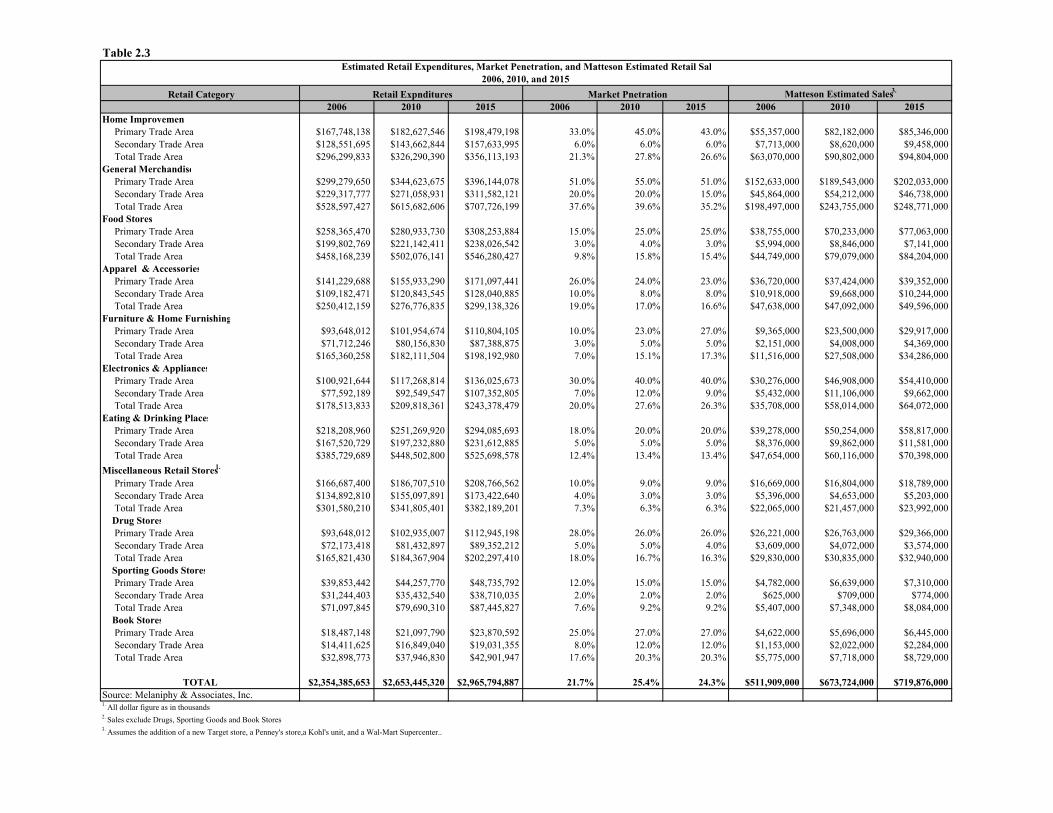
Table 2.3Estimated Retail Expenditures, Market Penetration, and Matteson Estimated Retail Sal
2006, 2010, and 2015
Retail Category Retail Expnditures Market Pnetration Matteson Estimated Sales3.
2006 2010 2015 2006 2010 2015 2006 2010 2015Home Improvemen Primary Trade Area $167,748,138 $182,627,546 $198,479,198 33.0% 45.0% 43.0% $55,357,000 $82,182,000 $85,346,000 Secondary Trade Area $128,551,695 $143,662,844 $157,633,995 6.0% 6.0% 6.0% $7,713,000 $8,620,000 $9,458,000 Total Trade Area $296,299,833 $326,290,390 $356,113,193 21.3% 27.8% 26.6% $63,070,000 $90,802,000 $94,804,000General Merchandise Primary Trade Area $299,279,650 $344,623,675 $396,144,078 51.0% 55.0% 51.0% $152,633,000 $189,543,000 $202,033,000 Secondary Trade Area $229,317,777 $271,058,931 $311,582,121 20.0% 20.0% 15.0% $45,864,000 $54,212,000 $46,738,000 Total Trade Area $528,597,427 $615,682,606 $707,726,199 37.6% 39.6% 35.2% $198,497,000 $243,755,000 $248,771,000Food Stores Primary Trade Area $258,365,470 $280,933,730 $308,253,884 15.0% 25.0% 25.0% $38,755,000 $70,233,000 $77,063,000 Secondary Trade Area $199,802,769 $221,142,411 $238,026,542 3.0% 4.0% 3.0% $5,994,000 $8,846,000 $7,141,000 Total Trade Area $458,168,239 $502,076,141 $546,280,427 9.8% 15.8% 15.4% $44,749,000 $79,079,000 $84,204,000Apparel & Accessories Primary Trade Area $141,229,688 $155,933,290 $171,097,441 26.0% 24.0% 23.0% $36,720,000 $37,424,000 $39,352,000 Secondary Trade Area $109,182,471 $120,843,545 $128,040,885 10.0% 8.0% 8.0% $10,918,000 $9,668,000 $10,244,000 Total Trade Area $250,412,159 $276,776,835 $299,138,326 19.0% 17.0% 16.6% $47,638,000 $47,092,000 $49,596,000Furniture & Home Furnishing Primary Trade Area $93,648,012 $101,954,674 $110,804,105 10.0% 23.0% 27.0% $9,365,000 $23,500,000 $29,917,000 Secondary Trade Area $71,712,246 $80,156,830 $87,388,875 3.0% 5.0% 5.0% $2,151,000 $4,008,000 $4,369,000 Total Trade Area $165,360,258 $182,111,504 $198,192,980 7.0% 15.1% 17.3% $11,516,000 $27,508,000 $34,286,000Electronics & Appliances Primary Trade Area $100,921,644 $117,268,814 $136,025,673 30.0% 40.0% 40.0% $30,276,000 $46,908,000 $54,410,000 Secondary Trade Area $77,592,189 $92,549,547 $107,352,805 7.0% 12.0% 9.0% $5,432,000 $11,106,000 $9,662,000 Total Trade Area $178,513,833 $209,818,361 $243,378,479 20.0% 27.6% 26.3% $35,708,000 $58,014,000 $64,072,000Eating & Drinking Places Primary Trade Area $218,208,960 $251,269,920 $294,085,693 18.0% 20.0% 20.0% $39,278,000 $50,254,000 $58,817,000 Secondary Trade Area $167,520,729 $197,232,880 $231,612,885 5.0% 5.0% 5.0% $8,376,000 $9,862,000 $11,581,000 Total Trade Area $385,729,689 $448,502,800 $525,698,578 12.4% 13.4% 13.4% $47,654,000 $60,116,000 $70,398,000
Miscellaneous Retail Stores1. Primary Trade Area $166,687,400 $186,707,510 $208,766,562 10.0% 9.0% 9.0% $16,669,000 $16,804,000 $18,789,000 Secondary Trade Area $134,892,810 $155,097,891 $173,422,640 4.0% 3.0% 3.0% $5,396,000 $4,653,000 $5,203,000 Total Trade Area $301,580,210 $341,805,401 $382,189,201 7.3% 6.3% 6.3% $22,065,000 $21,457,000 $23,992,000 Drug Stores Primary Trade Area $93,648,012 $102,935,007 $112,945,198 28.0% 26.0% 26.0% $26,221,000 $26,763,000 $29,366,000 Secondary Trade Area $72,173,418 $81,432,897 $89,352,212 5.0% 5.0% 4.0% $3,609,000 $4,072,000 $3,574,000 Total Trade Area $165,821,430 $184,367,904 $202,297,410 18.0% 16.7% 16.3% $29,830,000 $30,835,000 $32,940,000 Sporting Goods Stores Primary Trade Area $39,853,442 $44,257,770 $48,735,792 12.0% 15.0% 15.0% $4,782,000 $6,639,000 $7,310,000 Secondary Trade Area $31,244,403 $35,432,540 $38,710,035 2.0% 2.0% 2.0% $625,000 $709,000 $774,000 Total Trade Area $71,097,845 $79,690,310 $87,445,827 7.6% 9.2% 9.2% $5,407,000 $7,348,000 $8,084,000 Book Stores Primary Trade Area $18,487,148 $21,097,790 $23,870,592 25.0% 27.0% 27.0% $4,622,000 $5,696,000 $6,445,000 Secondary Trade Area $14,411,625 $16,849,040 $19,031,355 8.0% 12.0% 12.0% $1,153,000 $2,022,000 $2,284,000 Total Trade Area $32,898,773 $37,946,830 $42,901,947 17.6% 20.3% 20.3% $5,775,000 $7,718,000 $8,729,000
TOTAL $2,354,385,653 $2,653,445,320 $2,965,794,887 21.7% 25.4% 24.3% $511,909,000 $673,724,000 $719,876,000Source: Melaniphy & Associates, Inc.1. All dollar figure as in thousands2. Sales exclude Drugs, Sporting Goods and Book Stores 3. Assumes the addition of a new Target store, a Penney's store,a Kohl's unit, and a Wal-Mart Supercenter..
Retail Market Feasibility Study, Lincoln Mall Area, Matteson, Illinois
-20-
SECTION III
METHODOLOGY
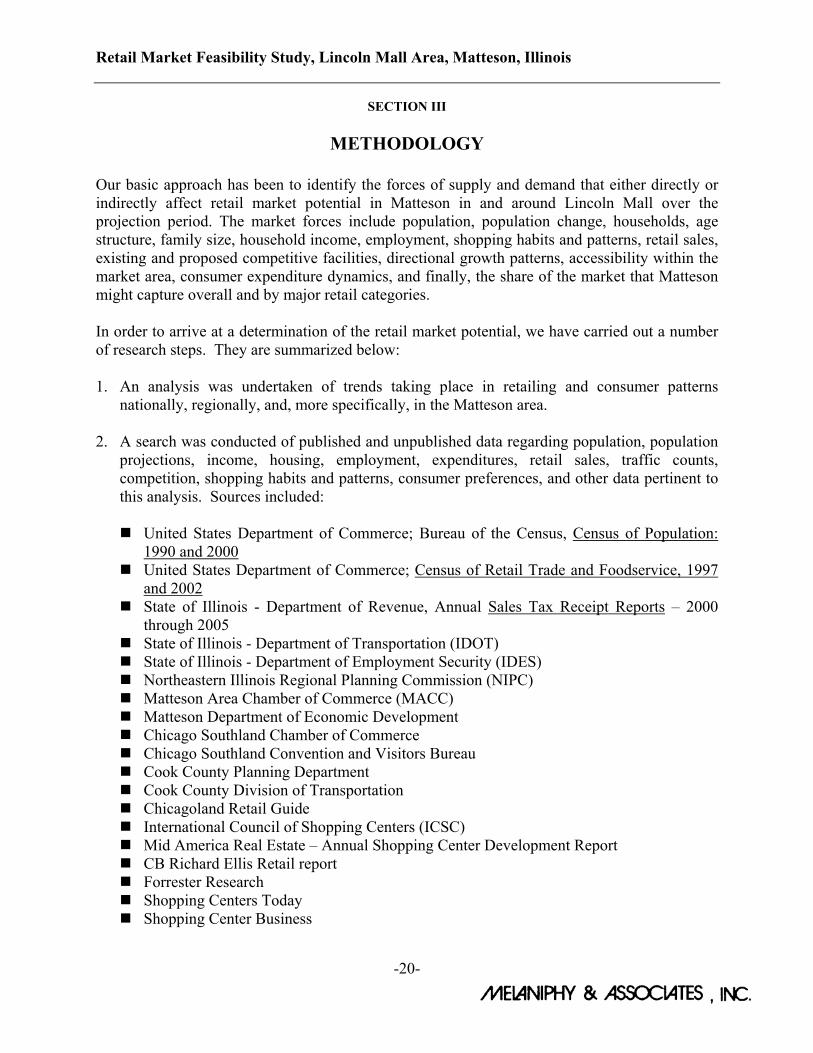
Our basic approach has been to identify the forces of supply and demand that either directly or indirectly affect retail market potential in Matteson in and around Lincoln Mall over the projection period. The market forces include population, population change, households, age structure, family size, household income, employment, shopping habits and patterns, retail sales, existing and proposed competitive facilities, directional growth patterns, accessibility within the market area, consumer expenditure dynamics, and finally, the share of the market that Matteson might capture overall and by major retail categories. In order to arrive at a determination of the retail market potential, we have carried out a number of research steps. They are summarized below: 1. An analysis was undertaken of trends taking place in retailing and consumer patterns
nationally, regionally, and, more specifically, in the Matteson area. 2. A search was conducted of published and unpublished data regarding population, population
projections, income, housing, employment, expenditures, retail sales, traffic counts, competition, shopping habits and patterns, consumer preferences, and other data pertinent to this analysis. Sources included:
United States Department of Commerce; Bureau of the Census, Census of Population:
1990 and 2000 United States Department of Commerce; Census of Retail Trade and Foodservice, 1997
and 2002 State of Illinois - Department of Revenue, Annual Sales Tax Receipt Reports – 2000
through 2005 State of Illinois - Department of Transportation (IDOT) State of Illinois - Department of Employment Security (IDES) Northeastern Illinois Regional Planning Commission (NIPC) Matteson Area Chamber of Commerce (MACC) Matteson Department of Economic Development Chicago Southland Chamber of Commerce Chicago Southland Convention and Visitors Bureau Cook County Planning Department Cook County Division of Transportation Chicagoland Retail Guide International Council of Shopping Centers (ICSC) Mid America Real Estate – Annual Shopping Center Development Report CB Richard Ellis Retail report Forrester Research Shopping Centers Today Shopping Center Business
Retail Market Feasibility Study, Lincoln Mall Area, Matteson, Illinois
-21-
Crain’s Chicago Business Chicago Tribune The Daily Herald www.Globest.com The Melaniphy Commercial Newsletters Claritas, Inc. Tactician, Inc.
3. Members of our staff visited the Subject Area and toured the Village of Matteson and
surrounding communities. We also drove all of the major and many of the minor traffic arteries in and around the Village. Notes were taken regarding housing, schools, parks, commercial facilities, socio-economic levels, employers, and general physical conditions.
4. A senior member of our staff met with Lincoln Mall representatives to discuss the Mall and
the current redevelopment efforts. Mall ownership was helpful in providing performance data, customer characteristics, and trade area coverage.
5. Lincoln Mall executives provided us with a zip code distribution of the Mall’s trade area
determined from an analysis of the department stores sales activity. We obtained additional confidential trade area from other retailers with the provision that we keep their data confidential. We utilized the trade area data within the parameters of confidentially in determining the future trade area of the entire Lincoln Mall, Cicero Avenue, Lincoln Highway, and Interstate 57 interchange retail concentration.
6. Members of our staff either met or discussed via telephone with many of the owners or
managers of existing shopping centers in Matteson. 7. Accessibility was analyzed in terms of ingress and egress to the intersection, Lincoln Mall,
and many of the shopping centers in the area. Also, we reviewed traffic flow and driving times.
8. A Driving Time Analysis was conducted from the Subject Site for 20 minutes in all
directions by 5 minute intervals. The locations reached were recorded and plotted on maps to simulate the experience that shoppers would have in driving to the Study Area. Generally, speed limits were observed except where all traffic was moving beyond the posted speed limits. The objective was to simulate distances to competitive facilities, experience any physical or psychological barriers, and to better understand the overall market area.
9. The socioeconomic characteristics of the Matteson area were evaluated and the changes
which have taken place, determined. The 2000 Census of Population was evaluated. The socioeconomic characteristics include: population, population growth, age structure, household characteristics, income dynamics, ethnic mix, employment, employment change, housing values, retail expenditure potential, and retail sales trends.
10. Members of our staff inventoried the existing and proposed competitive retail facilities that
affect the market at the Subject Site. The evaluation identified the characteristics of shopping
Retail Market Feasibility Study, Lincoln Mall Area, Matteson, Illinois
-22-
centers within the Trade Area including their location, size, tenant mix, degree of success, and general impact of competitive facilities. We also identified proposed retail facilities. This includes proposed shopping centers and freestanding retailers including their location, size, timing, major anchors, and anchor sizes.
11. We delineated the Trade Area for the Subject Intersection on the basis of the 2000 Population
and Housing Census, estimated 2005 demographic characteristics, the existing and proposed retail facilities, the road network, physical and psychological barriers, the detailed driving time analysis, consumer orientation, and our over 40 years of experience in evaluating projects throughout the world.
12. Once the Trade Area was delineated, we evaluated the 2000 Census of Population and
Housing to determine the level of market support available within the Trade Area. Next, we examined the population data and projections from two computer demographic services ─ Claritias, and Tactician. Finally, based upon our local demographic findings, we forecast the demographics of the Trade Area and its subsectors for 2005, 2010, and 2015. Demographics include population, age structure, population growth, households, household size, household income, and other pertinent elements.
13. We analyzed current household income, along with the changes which have taken place since
the 1990 and 2000 Census. Moreover, household income was forecast for 2005, 2010, and 2015.
14. Retail sales data was obtained and studied. The initial data included the Census of Retail
Trade and Foodservice for Matteson for 1997 and 2002 (the latest Census data available). Next, we analyzed the Illinois Department of Revenue Sales Tax Receipt data for Matteson, by retail category from 2003 to 2005. This assisted in determining the changes that had taken place both in total retail sales and major retail categories. Next, we converted the data to a per capita basis and applied our findings to determine the total retail market potential for the Trade Area in 2005, 2010, and 2015. This process permitted us to identify retail categories which represent a future development opportunity for the Village.
15. We calculated the Trade Area resident's Personal Consumption Expenditures by retail store
category. These data were forecast for the projection years. Personal Consumption Expenditures include General Merchandise (including Department stores and big box discounters), Food Stores, Eating and Drinking Places, Women’s Apparel and Accessories, Men’s Apparel and Accessories, Family Apparel, Children’s Apparel, Furniture and Household Furnishings, Appliances including TV and Electronics, Home Improvement, Drugs and Miscellaneous stores, and others. These data represent the dollars spent by Trade Area residents in retail facilities in and around the Matteson Area and were computed for 2005, 2010, and 2015.
16. Based upon the potential expenditures for the projection years, we first determined
Matteson’s current market penetration for the various retail categories within the Trade Area segments. Next, we forecast potential expenditures for the projection years and estimated the market penetration that the Village might capture if the recommended improvements and
Retail Market Feasibility Study, Lincoln Mall Area, Matteson, Illinois
-23-
retailer additions are implemented. The market penetration or capture rates, when applied to the retail sales potential by retail category, provide sales projections by retail category for the Subject Site for 2010 and 2015.
17. Once the expenditure potential and market penetration by individual retail categories were
computed, our staff identified the retail categories which represent an opportunity for the Village. The objective was to identify market opportunities in individual retail categories and then consider specific retailers that "could fill the void". This included an evaluation of the current placement of major retailers in the Trade Area and their respective locations in relation to the Subject Site.
18. We determined the market for retail development in Matteson. Our staff analyzed present and
future trends affecting retail development in Matteson and the likelihood of attracting new retail businesses to the Subject Area.
19. A simulation of alternative retail development improvements was undertaken. This involved
simulating possible market capture rates for varying types of retail development on the Subject Site.
20. Finally, action recommendations were prepared for the Village as a guide to improving the
market for retail, restaurant, and shopping center development. This included the type of development that the market will support; possible phasing of the development; the sales that can be expected in 2006, 2010, and 2015; the types of stores that can be supported; and some of the retailers who should be the center of focus.
DEFINITIONS The following definitions have been gathered from the International Council of Shopping Centers, the National Retail Federation, The Selection of Retail Locations, Market Research for Shopping Centers, Restaurant and Fast Food Site Selection, The Restaurant Site Selection Guidebook, Urban Land Institute’s, The Dollars and Cents of Shopping Centers, the International Council of Shopping Centers’ Dictionary of Shopping Center Terms, and from our own experience over the past 40 years of evaluating markets for retailers and shopping center developers.
A Major Mall or Center can be either open or enclosed and contains at least two department stores anchoring the addition of numerous specialty stores. Malls usually range in size between 400,000 and 1,500,000 square feet. Lincoln Mall falls into this category.
A Super Regional Mall or Center usually range between 1,500,000 and 1,750,000 square
feet with four or more department stores with over 150 specialty stores, food court operators, and restaurants.
Lifestyle Centers usually are a collection of apparel, home, accessory, entertainment, and
other specialty stores located in upper middle or upper income areas along with both quick service and full service restaurants ranging in size from 200,000 to 800,000 square feet.
Retail Market Feasibility Study, Lincoln Mall Area, Matteson, Illinois
-24-
Most do not contain department stores. Presently, there are no lifestyle centers in the South Bend area.
Community Centers are usually older centers with an old Kmart or some other major retail
generator along with a mix of retail stores and service shops. They range in size from 100,000 to 350,000 square feet. Many however have either been converted to Power Centers or have considerable vacancies.
Power Centers or Power Towns are usually a collection of Big Box retailers including
discounters, home improvement, book stores, appliance stores, pet stores, supermarkets, warehouse and club stores, linen stores, sporting goods, computer stores, restaurants, and other box retailers. Stores in this category include Wal-Mart, Wal-Mart Supercenters, Super Target, Target, Meijer, Kohl’s, Home Depot, Lowe’s, Menards, Best Buy, Circuit City, Barnes & Noble, Borders Books, Bed Bath & Beyond, Linens ‘n Things, Ross Dress for Less, The Sports Authority, Dick’s Sporting Goods, Big Kmart, and others. They can range from approximately 300,000 to 1,000,000 square feet.
Outlet Centers usually are a combination of manufacturing company stores and off-price
retailers normally located at an Interstate interchange usually on a highway which connects vacation concentrations with urban areas. There are some very large examples of Outlet Centers on the edge of major metropolitan areas. Gurnee Mill in Gurnee fall into this category.
Big Box Retailers include almost any large retailer such as Wal-Mart, Target, Kohl’s, Home
Depot, Lowe’s, Rooms to Go, Bass Pro Shop, Best Buy, Cabela’s, Circuit City, Barnes & Noble, Border’s Books, Bed Bath & Beyond, Linens ‘n Things, Ross Dress for Less, The Sports Authority, Dick’s Sporting Goods, Kmart, Martin’s, Kroger, Walgreens, CVS, Rite-Aid, Office Max, Office Depot, Staples, Theaters, and others. They can be either part of a power center or freestanding. They normally range in size from 20,000 square feet to over 200,000 square feet. Super Big Box retailers include Cabela’s and Ikea, generate a significant customer base from wide area attraction and operate stores ranging from 200,000 to over 400,000 square feet.
Neighborhood Convenience Centers are usually anchored by a supermarket, a supermarket
combination unit with a drug store, or a major drug store, along with a collection of convenience and service oriented stores, ranging in size from 30,000 square feet up to 150,000 square feet.
Downtown is usually an older part of an urban area where the city first started to grow. It
usually contains a concentration of office, financial, retail, government, restaurants, and civic uses surrounded by a combination of residential, industrial, and some small retail uses.
Strip Service Centers are very small shopping centers typically with a convenience food
mart and other convenience and service shops ranging in size between 7,000 to 20,000 square feet.
Retail Market Feasibility Study, Lincoln Mall Area, Matteson, Illinois
-25-
Convenience Goods and Service Stores are stores directed toward the convenience of the shoppers. These include supermarkets, food marts, drug stores, hardware, stores, liquor shops, video shop, meat markets, fish markets, fast food shops, restaurants, cleaners, laundry, currency exchange, and other shops serving a narrow market. These stores are shopped on a highly frequent basis to meet local everyday needs.
Shopper Goods Stores are stores selling durable goods such as apparel for every member of
the family, shoes, accessories, jewelry, appliances, furniture, home furnishings, toys, books, bedding, office goods, and others durable goods.
Entertainment includes cinemas, comedy clubs, family entertainment centers, bowling,
laser tag, electronic games, electronic sports, and other indoor entertainment venues.
A Trade Area represents that portion of a market area where a retailer or retail concentration can expect to capture between 80 and 90 percent of its customers. Because of driving patterns, visitors, employment, and infrequent shopping visitors, it is difficult, if not impractical, to define a Trade Area more precisely. As more distance is added, the area covered grows geometrically making the assessment beyond 90 percent usually uneconomic.
o Primary Convenience Trade Area is that area from which the most frequent customers
to convenience goods stores originate. o Primary Shoppers Trade Area is that area from which the most frequent customers
originate to purchase shoppers goods items.
o Secondary Trade Area is generally the area from which less frequent customers originate to make purchases.
o Tertiary Trade Area is used with very large and dynamic projects which attract
customers from a very wide area. The Tertiary Trade Area usually defines the area from which very infrequent customers will originate.
Market Penetration, sometimes referred to as “Market Share,” is the percentage of capture
that a retailer, shopping center, or retail complex has of the potential expenditures within its respective Trade Area.
Personal Consumption Expenditures represent the dollars available for the purchase of
goods and services during a year. They usually represent approximately 30 to 40 percent of a household’s income.
Travel or Driving Time Analysis represents the distance that one can drive at five-minute
intervals during normal shopping periods following either posted speed limits or keeping up with traffic. Driving times are usually conducted for 20 minutes in each direction from an area of interest.
Retail Market Feasibility Study, Lincoln Mall Area, Matteson, Illinois
-26-
SECTION IV
THE LINCOLN MALL AREA’S RETAIL CONCENTRATION
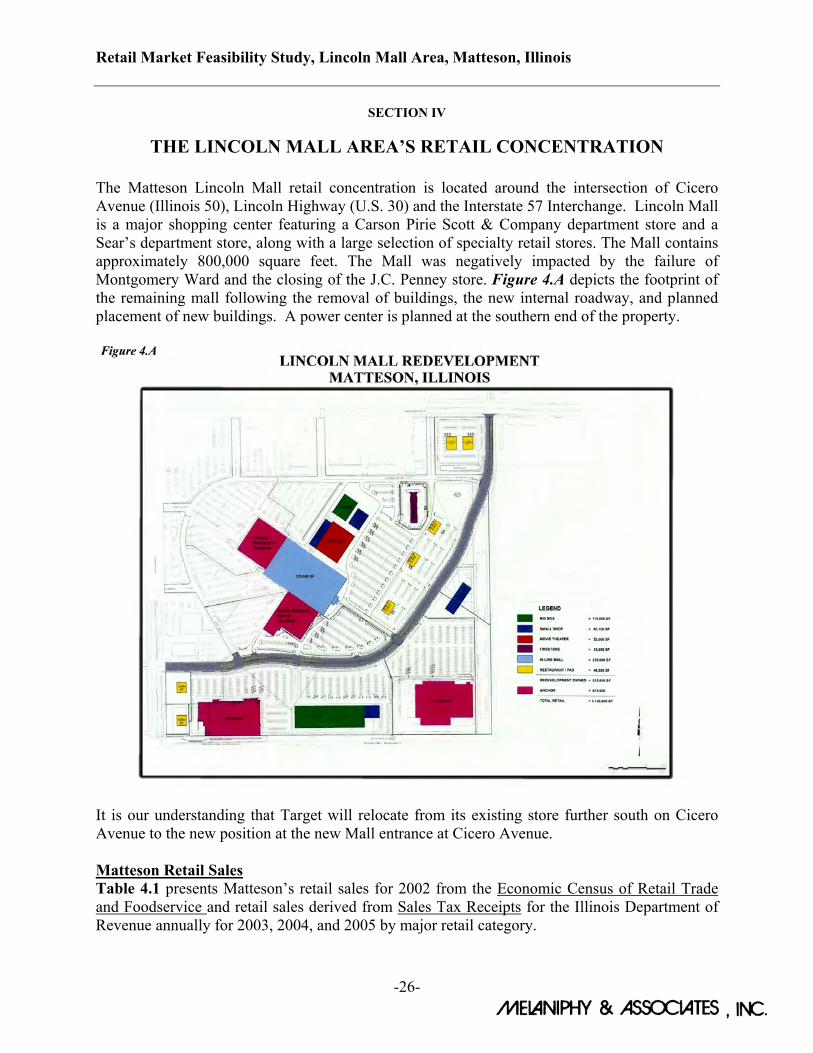
The Matteson Lincoln Mall retail concentration is located around the intersection of Cicero Avenue (Illinois 50), Lincoln Highway (U.S. 30) and the Interstate 57 Interchange. Lincoln Mall is a major shopping center featuring a Carson Pirie Scott & Company department store and a Sear’s department store, along with a large selection of specialty retail stores. The Mall contains approximately 800,000 square feet. The Mall was negatively impacted by the failure of Montgomery Ward and the closing of the J.C. Penney store. Figure 4.A depicts the footprint of the remaining mall following the removal of buildings, the new internal roadway, and planned placement of new buildings. A power center is planned at the southern end of the property.
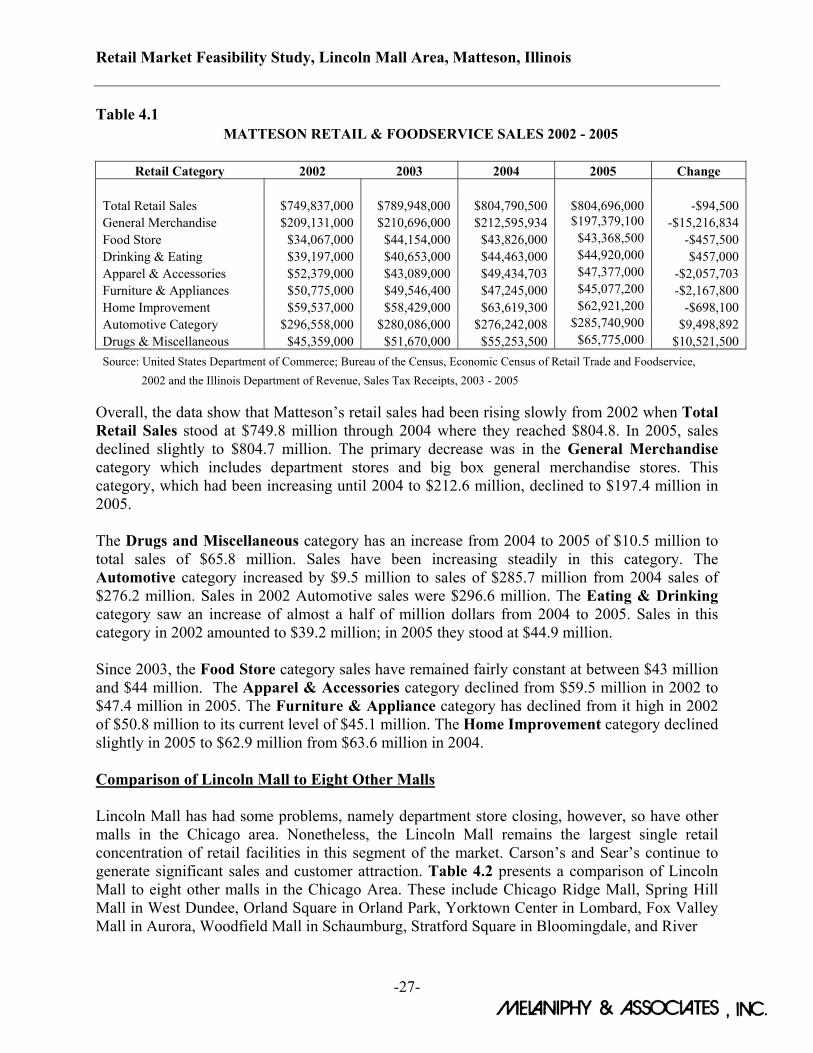
It is our understanding that Target will relocate from its existing store further south on Cicero Avenue to the new position at the new Mall entrance at Cicero Avenue. Matteson Retail Sales Table 4.1 presents Matteson’s retail sales for 2002 from the Economic Census of Retail Trade and Foodservice and retail sales derived from Sales Tax Receipts for the Illinois Department of Revenue annually for 2003, 2004, and 2005 by major retail category.
Retail Market Feasibility Study, Lincoln Mall Area, Matteson, Illinois
-27-
Table 4.1 MATTESON RETAIL & FOODSERVICE SALES 2002 - 2005
Retail Category 2002 2003 2004 2005 Change
Total Retail Sales $749,837,000 $789,948,000 $804,790,500 $804,696,000 -$94,500 General Merchandise $209,131,000 $210,696,000 $212,595,934 $197,379,100 -$15,216,834 Food Store $34,067,000 $44,154,000 $43,826,000 $43,368,500 -$457,500 Drinking & Eating $39,197,000 $40,653,000 $44,463,000 $44,920,000 $457,000 Apparel & Accessories $52,379,000 $43,089,000 $49,434,703 $47,377,000 -$2,057,703 Furniture & Appliances $50,775,000 $49,546,400 $47,245,000 $45,077,200 -$2,167,800 Home Improvement $59,537,000 $58,429,000 $63,619,300 $62,921,200 -$698,100 Automotive Category $296,558,000 $280,086,000 $276,242,008 $285,740,900 $9,498,892 Drugs & Miscellaneous $45,359,000 $51,670,000 $55,253,500 $65,775,000 $10,521,500 Source: United States Department of Commerce; Bureau of the Census, Economic Census of Retail Trade and Foodservice, 2002 and the Illinois Department of Revenue, Sales Tax Receipts, 2003 - 2005
Overall, the data show that Matteson’s retail sales had been rising slowly from 2002 when Total Retail Sales stood at $749.8 million through 2004 where they reached $804.8. In 2005, sales declined slightly to $804.7 million. The primary decrease was in the General Merchandise category which includes department stores and big box general merchandise stores. This category, which had been increasing until 2004 to $212.6 million, declined to $197.4 million in 2005. The Drugs and Miscellaneous category has an increase from 2004 to 2005 of $10.5 million to total sales of $65.8 million. Sales have been increasing steadily in this category. The Automotive category increased by $9.5 million to sales of $285.7 million from 2004 sales of $276.2 million. Sales in 2002 Automotive sales were $296.6 million. The Eating & Drinking category saw an increase of almost a half of million dollars from 2004 to 2005. Sales in this category in 2002 amounted to $39.2 million; in 2005 they stood at $44.9 million. Since 2003, the Food Store category sales have remained fairly constant at between $43 million and $44 million. The Apparel & Accessories category declined from $59.5 million in 2002 to $47.4 million in 2005. The Furniture & Appliance category has declined from it high in 2002 of $50.8 million to its current level of $45.1 million. The Home Improvement category declined slightly in 2005 to $62.9 million from $63.6 million in 2004. Comparison of Lincoln Mall to Eight Other Malls Lincoln Mall has had some problems, namely department store closing, however, so have other malls in the Chicago area. Nonetheless, the Lincoln Mall remains the largest single retail concentration of retail facilities in this segment of the market. Carson’s and Sear’s continue to generate significant sales and customer attraction. Table 4.2 presents a comparison of Lincoln Mall to eight other malls in the Chicago Area. These include Chicago Ridge Mall, Spring Hill Mall in West Dundee, Orland Square in Orland Park, Yorktown Center in Lombard, Fox Valley Mall in Aurora, Woodfield Mall in Schaumburg, Stratford Square in Bloomingdale, and River
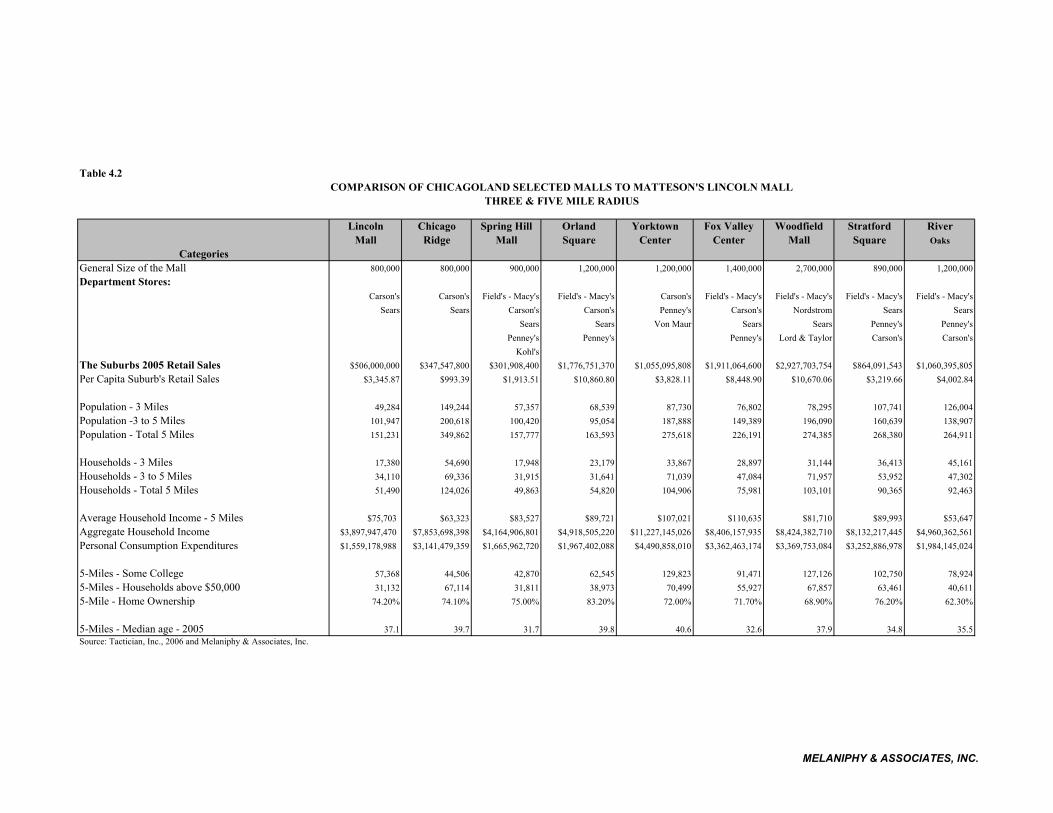
Table 4.2COMPARISON OF CHICAGOLAND SELECTED MALLS TO MATTESON'S LINCOLN MALL
THREE & FIVE MILE RADIUS
Lincoln Chicago Spring Hill Orland Yorktown Fox Valley Woodfield Stratford River Mall Ridge Mall Square Center Center Mall Square Oaks
CategoriesGeneral Size of the Mall 800,000 800,000 900,000 1,200,000 1,200,000 1,400,000 2,700,000 890,000 1,200,000Department Stores:
Carson's Carson's Field's - Macy's Field's - Macy's Carson's Field's - Macy's Field's - Macy's Field's - Macy's Field's - Macy'sSears Sears Carson's Carson's Penney's Carson's Nordstrom Sears Sears
Sears Sears Von Maur Sears Sears Penney's Penney's Penney's Penney's Penney's Lord & Taylor Carson's Carson's
Kohl'sThe Suburbs 2005 Retail Sales $506,000,000 $347,547,800 $301,908,400 $1,776,751,370 $1,055,095,808 $1,911,064,600 $2,927,703,754 $864,091,543 $1,060,395,805Per Capita Suburb's Retail Sales $3,345.87 $993.39 $1,913.51 $10,860.80 $3,828.11 $8,448.90 $10,670.06 $3,219.66 $4,002.84
Population - 3 Miles 49,284 149,244 57,357 68,539 87,730 76,802 78,295 107,741 126,004Population -3 to 5 Miles 101,947 200,618 100,420 95,054 187,888 149,389 196,090 160,639 138,907Population - Total 5 Miles 151,231 349,862 157,777 163,593 275,618 226,191 274,385 268,380 264,911
Households - 3 Miles 17,380 54,690 17,948 23,179 33,867 28,897 31,144 36,413 45,161Households - 3 to 5 Miles 34,110 69,336 31,915 31,641 71,039 47,084 71,957 53,952 47,302Households - Total 5 Miles 51,490 124,026 49,863 54,820 104,906 75,981 103,101 90,365 92,463
Average Household Income - 5 Miles $75,703 $63,323 $83,527 $89,721 $107,021 $110,635 $81,710 $89,993 $53,647Aggregate Household Income $3,897,947,470 $7,853,698,398 $4,164,906,801 $4,918,505,220 $11,227,145,026 $8,406,157,935 $8,424,382,710 $8,132,217,445 $4,960,362,561Personal Consumption Expenditures $1,559,178,988 $3,141,479,359 $1,665,962,720 $1,967,402,088 $4,490,858,010 $3,362,463,174 $3,369,753,084 $3,252,886,978 $1,984,145,024
5-Miles - Some College 57,368 44,506 42,870 62,545 129,823 91,471 127,126 102,750 78,9245-Miles - Households above $50,000 31,132 67,114 31,811 38,973 70,499 55,927 67,857 63,461 40,6115-Mile - Home Ownership 74.20% 74.10% 75.00% 83.20% 72.00% 71.70% 68.90% 76.20% 62.30%
5-Miles - Median age - 2005 37.1 39.7 31.7 39.8 40.6 32.6 37.9 34.8 35.5Source: Tactician, Inc., 2006 and Melaniphy & Associates, Inc.
MELANIPHY & ASSOCIATES, INC.
Retail Market Feasibility Study, Lincoln Mall Area, Matteson, Illinois
-29-
Oaks Center in Calumet City, Some have lost department stores, while others have not. Woodfield Mall has the highest sales of any of these malls. Only Lincoln Mall and Chicago Ridge Mall have two department stores, all of the others have three or four. Matteson had 2005 retail sales of over $804.7 million, while Chicago Ridge had sales of $347.5 million. West Dundee, including Spring Hill Mall with five department stores, had sales of $301.9 million. All of the other communities and malls had sales larger than Matteson. Yorktown Center in Lombard, Stratford Square in Bloomingdale, and River Oaks Center in Calumet City all had sales over a billion dollars. Orland Park, with Orland Square Mall, had 2005 sales of $1.78 billion, while Aurora, with Fox Valley Mall, had 2005 sales of $1.9 billion. Schaumburg, with Woodfield Mall, was clearly the winner with sales of $2.93 billion. Every one of the Table 4.2 examples has a larger Personal Consumption Expenditures within five miles than Matteson. Personal Consumption Expenditures include what households spend for goods and services such as food, drugs, paint and hardware, general merchandise, home improvement, apparel and accessories, furniture, electronics and appliances, sporting goods, jewelry, office supplies, books, eating and drinking, and numerous other retail goods. Services include cleaners, shoe repair, household equipment repair, banking, cinemas, bowling, theater, amusement, and others. Matteson stood at approximately $1.559 billion while all of the others are higher. The closest to Matteson was Spring Hill Mall in West Dundee with five department stores. Finally, Matteson had a Average Household Income estimated at $75,703 within five miles compared to River Oaks’s $53,647 and Chicago Ridge’s $63,323. Orland Park, Matteson’s closest major competitor, had Average Household income within five miles of $89,721. Comparison of Lifestyle Centers We compared Lincoln Mall’s 5 and 10 mile radii with the four existing lifestyle center’s in the Chicago area. A lifestyle center is a collection of popular apparel and accessory stores, specialty shops, home furnishing stores, sporting goods, shoe stores, foodservice facilities, and others. They normally do not contain department stores. The four existing lifestyle centers include Deer Park Town Center in Deer Park, Geneva Commons on Randall Road in Geneva, Algonquin Commons in Algonquin, and Wheaton Town Square in Wheaton. Wheaton Town Center was one of the first lifestyle centers built in the United States. Table 4.3 presents the comparison. Matteson (Lincoln Mall) has a five mile population estimated at 151,231 and a 10 mile population estimated at 518,243. This compares favorably with most of the four lifestyle centers. Matteson (Lincoln Mall) has more people within five miles than Geneva Commons, and more people within 10 miles that Geneva Commons and Algonquin Commons. Wheaton Town Square has the most people within 10 miles with an estimated population of 923,229 persons. Deer Park Town Center also has a larger population with an estimated population within 10 miles of 625,231 persons.
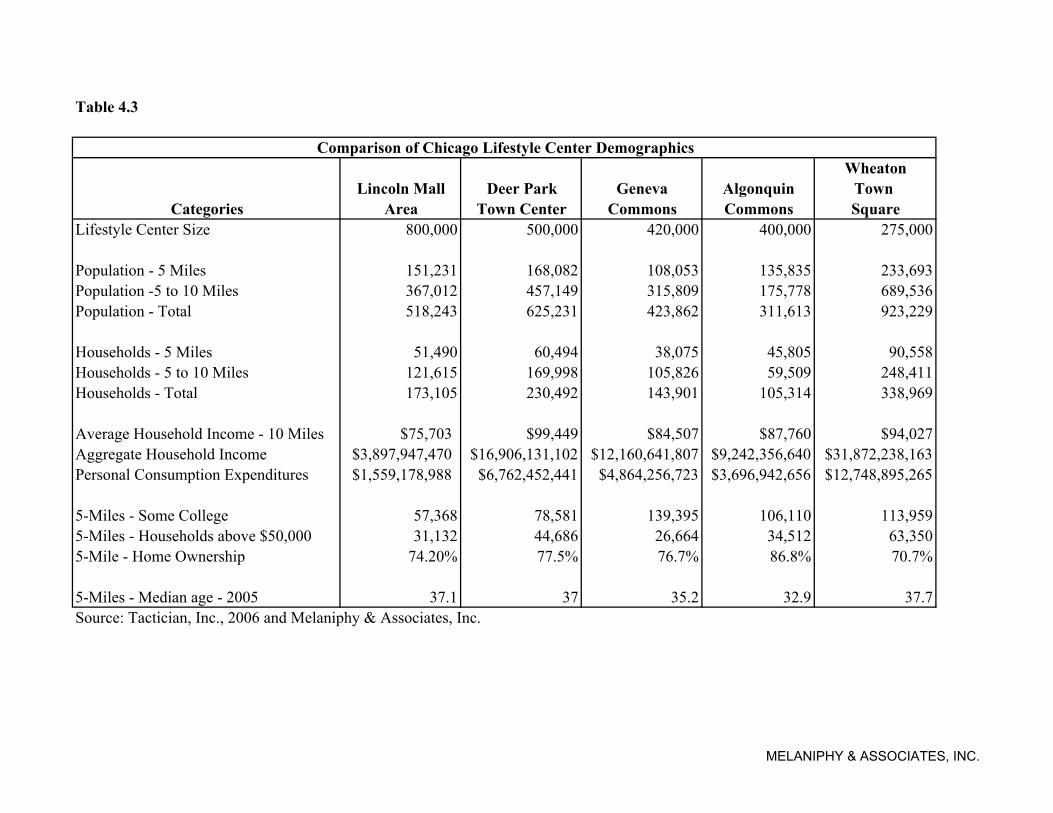
Table 4.3
Comparison of Chicago Lifestyle Center Demographics Wheaton
Lincoln Mall Deer Park Geneva Algonquin Town Categories Area Town Center Commons Commons Square
Lifestyle Center Size 800,000 500,000 420,000 400,000 275,000
Population - 5 Miles 151,231 168,082 108,053 135,835 233,693Population -5 to 10 Miles 367,012 457,149 315,809 175,778 689,536Population - Total 518,243 625,231 423,862 311,613 923,229
Households - 5 Miles 51,490 60,494 38,075 45,805 90,558Households - 5 to 10 Miles 121,615 169,998 105,826 59,509 248,411Households - Total 173,105 230,492 143,901 105,314 338,969
Average Household Income - 10 Miles $75,703 $99,449 $84,507 $87,760 $94,027Aggregate Household Income $3,897,947,470 $16,906,131,102 $12,160,641,807 $9,242,356,640 $31,872,238,163Personal Consumption Expenditures $1,559,178,988 $6,762,452,441 $4,864,256,723 $3,696,942,656 $12,748,895,265
5-Miles - Some College 57,368 78,581 139,395 106,110 113,9595-Miles - Households above $50,000 31,132 44,686 26,664 34,512 63,3505-Mile - Home Ownership 74.20% 77.5% 76.7% 86.8% 70.7%
5-Miles - Median age - 2005 37.1 37 35.2 32.9 37.7Source: Tactician, Inc., 2006 and Melaniphy & Associates, Inc.
MELANIPHY & ASSOCIATES, INC.
Retail Market Feasibility Study, Lincoln Mall Area, Matteson, Illinois
-31-
All of the lifestyle centers have an estimated 10 mile Average Household Income higher than Matteson (Lincoln Mall). Matteson’s Average Household Income within 10 miles is estimated at $75,703. The closest to Matteson is Geneva Commons with a 10 mile Average Household Income of $84,507. High Average Household Income is one of the needed characteristics of successful lifestyle centers. The comparison indicates that it will be difficult to create either a lifestyle expansion of the Mall or a separate lifestyle center in Matteson. Most retailers expect to see Average Household Incomes of over $80,000. Matteson Shopping Center’s which are part of the Retail Concentration In addition to Lincoln Mall, there other shopping centers in the area that are important to the overall well-being of Matteson. These include: Name Location Size Matteson Towncenter SW Quadrant of Cicero Ave & Lincoln Highway 229,041 Century Tile Plaza 20909 S. Cicero Avenue 49,600 Liberty Plaza 4555 Lincoln Highway 64,600 Matteson Plaza 4243 Lincoln Highway 280,000 Centel Plaza 4331 W. 211th Street 9,550 Marketplace Plaza 4200 211th Street 309,000 Lincoln Square 4431 W. 211th Street 24,500 White Hen Plaza 5516 W. Vollmer Road 11,000 Rose Plaza 4700 W. 211th 25,000 Major big box retailers located in Matteson include Wal-Mart, Sam’s Club, Target, Value City, Home Depot, Best Buy, Circuit City, Sportsmart, Borders, Burlington Coat Factory, Pep Boys, Toys R Us, Office Max, Cub Foods, Ultra Foods, and others. Wal-Mart is in discussions to build a new Supercenter and Sam’s Club would like to expand. Reportedly, Menard’s would like to build a new store, Target has plans to relocate to a new store, L A Fitness is in talks to acquire the old Builders Square store on Lincoln Highway, Circuit City would like to relocate, and Wicks Furniture is seeking a location in Matteson. Kohl’s should be in Matteson as should some of the other boxes located in Homewood. Penney’s is considering a new store in the far southern suburbs.
Retail Market Feasibility Study, Lincoln Mall Area, Matteson, Illinois
-32-
SECTION V
NATIONAL AND CHICAGOLAND RETAIL TRENDS
NATIONAL TRENDS At the onset, it is important to understand the changes in retailing that are taking place nationally because they have an impact on the present and future of Matteson’s retailing and store development. Few people like to acknowledge the significant negative impact that high gasoline prices are having upon household discretionally buying power, especially those households with SUV’s. Generally, one member of the average Chicagoland suburban household is driving an SUV, a truck, or a van, and often painfully finding that at the end of the month his or her credit card is maxed-out with gasoline and other charges. Combined with higher heating and medical costs, the consumer is financially pressed. Retail buying decision-making has changed. Today, “Convenience” and “Price/Value” are the primary motivating factors. Moreover, the consumer is driving less distance, staying less time, beginning to think about travel costs, and starting to spend fewer dollars. Consumer patronage to regional malls has been declining while increasing at Wal-Mart, Wal-Mart Supercenters, Target, Super Target, and Kohl’s, and other major big box stores. Nearly 90 percent of consumer’s today shop at big box discount department stores and only 50 percent shop regularly at conventional department stores. This does not mean that malls are no longer needed. Rather, it means that most malls will have to downsize to meet the market demand. Lincoln Mall has already done that and is positioned to continue to serve Matteson and the surrounding suburbs. As we move ahead in the later 2000’s, retail store winners will be retailers who understand their customer, are convenient to them, and offer a quality product at a reasonable price. Losers have been department stores and small retailers. Marshall Field’s and Carson Pirie Scott have been purchased by other national department store companies which are planning to improve them. In a broader view, society is aware of the “aging Baby-Boomer generation,” however, most do not understand the importance of this change. The Country’s dramatic shift in population age structure is having and will continue to have a major impact on the way the consumer will shop, purchase goods, dine-out, select entertainment, and surf the net. The changing patterns and fierce competition for consumer dollars will create new winners and losers. Most non-upscale malls are struggling to maintain their market share, retail sales, tenants, rental rate levels, and overage rents. In contrast, Internet sales during the 2005 Christmas season increased by over 25 percent excluding travel to approximately $20 billion. Moreover, DSL and high speed Cable connections which are now approaching 50 percent of households have substantially reduced the time required to shop online. Combined with convenience, and occasionally price, offered by the Internet on-line vendors have become an acceptable alternative to today’s “time-harassed” consumers who also seek to avoid fighting the crowds in the stores. Even with these dramatic increases and orientation, Internet sales account for less than six percent of total retail sales in the United States. Internet sales (excluding travel, auctions, and
Retail Market Feasibility Study, Lincoln Mall Area, Matteson, Illinois
-33-
stock transactions) reached approximately $250 million per day throughout November and December 2005.
CHICAGOLAND RETAIL SITUATION The Chicago Retail Market is an extremely competitive, yet resilient market. The metropolitan area contains over 195 million square feet of shopping center space. There is over 9.0 million square feet of retail development planned this year, however at this time only 7.8 million square feet is actually under construction. Another 10.0 million square feet is planned for 2007. As some retailers have failed, others have stepped in to recycle their vacant properties. The recent weakness in the economy can be tied directly to lackluster consumer spending, rising oil prices, uneven employment growth, and a slowdown in business investment. Nonetheless, Chicago has faired better than many of the major metropolitan areas in the United States. The six county Chicago Metropolitan Area generated retail sales exceeding $98.0 billion in 2005 an increase of approximately four percent over 2004’s 94 billion. We have witnessed the demise of Montgomery Ward, Venture, Child World, Silo, Highland, Fretter, Today’s Man, Waccamaw Pottery, Service Merchandise, Builder’s Square, Handy Andy, Courtesy Home Centers, the Warehouse Club, BJ’s Warehouse, Sears Homelife, and others. Kmart emerged from bankruptcy after closing nearly 700 stores, merged with Sears. Regional malls have suffered with the onslaught of big box retailers like Wal-Mart, Wal-Mart Supercenters, Target, Super Target, Kohl’s, Costco, Sam’s Club, Meijer, and others have taken market share away from the department stores and some specialty stores in regional malls. The proliferation of big box retailers has created stagnation in regional mall development. In 2005, only two regional malls opened in the United States and only five have opened or expected to open in 2006. However, with all of the negative issues with malls, they nonetheless will remain an important part of the retailing landscape. This is true of Lincoln Mall which lost two department stores and demolished part of the mall and commenced development of a power center on the recovered land. Most of the newest shopping centers are lifestyle centers, power centers, power towns, and supercenters. A lifestyle center is generally between 300,000 and 600,000 square feet. The facility usually contains stores that cater to an upscale lifestyle in a convenient environment with ample parking, usually without department stores. Lifestyle centers are typically open-air with an urban Main Street feel. Many have two story facades to simulate Main Street of the past. Chicago area lifestyle centers include Deer Park Town Center in northern suburban Deer Park, Geneva Commons in western suburb Geneva, Wheaton Town Square in western suburb Wheaton, Algonquin Commons in northwest suburban Algonquin. The Glen in Glenview was planned as a lifestyle center, however because of its proximity to Old Orchard Center, it was unable to obtain the necessary specialty stores. A new lifestyle center is under construction in Hoffman Estates known as the Arboretum of South Barrington, which features most of the typical lifestyle stores, restaurants, and atmosphere. This lifestyle center also has a significant home furnishings orientation featuring several furniture stores in addition to William Sonoma and Pottery Barn.
Retail Market Feasibility Study, Lincoln Mall Area, Matteson, Illinois
-34-
Orland Park has a small lifestyle center developing on LaGrange Road at 143rd Street north of Orland Square Mall. Known as Orland Crossing, the mixed use development currently contains town homes along with retailer and restaurants including Chico’s, Ann Taylor, Coldwater Creek, Aerosoles, Aveda, Talbot’s, White House/Black, P. F. Chang’s, Starbucks, and others. There are also vacant spaces awaiting new retailers. Power centers are typically occupied by big box stores including supercenters, discounters, home improvement retailers, and many others. Most also include restaurants, cinemas, and other entertainment venues. Some of the active big box retailers scouting for sites and building new stores in the Chicago Metropolitan Area market include the following: Barnes & Noble Bass Pro Shop Best Buy Burlington Coat Factory Cabela’s Costco CVS Pharmacy Dick’s Sporting Goods Gander Mountain Home Depot IKEA Jared Jewelers Kohl’s Laz-E-Bay Lowe’s Home Improvement Marshalls Michael’s Meijer’s REI Shoe Carnival Staples Super Target Stein Mart Trader’s Joes Wal-Mart Supercenters Whole Foods Woodman’s Wickes Furniture RETAIL DEVELOPMENT AND VACANCY
According to CB Richard Ellis, the vacancy rate of retail space over 50,000 square feet in the Chicago Metropolitan Area in the First Quarter of 2006 was approximately 7.52 percent, an increase from 7.2 percent in the Fourth Quarter of 2005. According to their data there is a total
Retail Market Feasibility Study, Lincoln Mall Area, Matteson, Illinois
-35-
inventory of 112.3 million square feet of stores in shopping centers over 50,000 square feet, of which approximately 8.1 million square feet is vacant. Chicago’s South Suburbs has a retail inventory of stores and centers over 50,000 square feet of 6.1 million square feet and a vacancy of approximately 500,000 square feet, or 18.4 percent. This is the highest percentage of vacancy in all of the Chicago Area subsectors. Other segments which have larger inventories of retail square feet have higher vacant amounts such as the Far Northwest Suburbs with 1.4 million square feet vacant and the Far Southwest Suburbs with 1.1 million square feet vacant. Next, was Kane County with a vacancy of 1.1 million square feet. This is followed by the City of Chicago – North submarket with over 900,000 square feet vacant, and the Far West Suburbs with a vacancy of 650,000 square feet. There percentages of vacancy are lower because their total retail square footages are higher than the South Suburbs. In the Chicago’s Metropolitan Area the retail market grew at 4.4 percent in 2005. Retail sales exceeded $98.4 billion in 2005 up form $94.2 billion in 2004. Retail sales growth in 2004 amounted to 4.5 percent. In 2003, retail sales in the Chicago Metropolitan Area stood at $90.1 billion. Now let’s examine each of the major retail categories and their trends.
Big Box Discount Department Stores and Supercenters The arrival of new superstores in the Chicago Metropolitan will continue to have a major impact upon the way consumers shop. Target, Wal-Mart, and Meijer’s all operate superstores with between 175,000 and 220,000 square feet featuring food, general merchandise, auto parts and service, and in some cases gasoline. They may give consumers another reason not to go to the mall. There will be seven new Wal-Mart Superstores opened in 2006 that will need sales of over $900 million annually. Wal-Mart Supercenters average over $130 million annually, and they are planning to add about 13 new Supercenters in 2007. The combined 20 stores will need sales of over $2.6 billion. Retail sales growth in 2005 for the entire Chicago Metropolitan amounted to $4.2 billion. The Wal-Mart stores will not simply be capturing newly created business. Rather, it will be taking most of the business away from other retailers. Super Target is also engaged in the process of rolling out superstores which will, no doubt, influence existing Target stores. The first Super Target in the Chicago Metropolitan Area opened in St. Charles in 2002. The other Super Targets are being added throughout the Chicago area. The superstores will have an impact upon the conventional grocery stores as they are expected to generate food sales of $25 to $50 million initially. Kohl’s continues to infill stores in the Chicago Metropolitan Area ranging between 80,000 to 110,000 square feet. Penney’s is planning to add new prototype free-standing 105,000 square foot stores to the market. The Meijer expansion into the Chicago Metropolitan Area has slowed considerably. The latest Meijer’s 190,000 square foot store opened in Rolling Meadows in 2005. Other locations where
Retail Market Feasibility Study, Lincoln Mall Area, Matteson, Illinois
-36-
sites have been acquired include: Bloomingdale, Hoffman Estates, Homer Township, Lisle, and South Barrington, among others. Some of the operating Meijer stores in the metro area include Bolingbrook (2 stores), McHenry, Merrillville, Naperville, Oswego, South Elgin, and St. Charles, among others. Meijer’s performance has been below expectation. Finally, there are additional supercenters proposed in the metro area. Woodman’s opened a 273,000 square foot superstore in Carpentersville. Two new stores are planned in 2006 in North Aurora and Romeoville. Joliet has been rumored as a 2007 location. Woodman’s also operates a superstore in Kenosha at Interstate 94 and Route 50 and others in Wisconsin.
Department Stores Department stores, the major mall generators, have generally experienced flat or declining sales, customer visits, and customer interest. Department store companies have consolidated in recent years with many slashing costs, cutting prices, reducing inventory, and eliminating unprofitable departments. Because of their problems, the number of customer visits to the mall has declined, adversely affecting many mall tenants. Federated Department Stores purchased the May Company in 2005, including Marshall Field’s. Field’s name will be changed to Macy’s; Lord & Taylor sale is currently pending. The continuing decline in fashion apparel sales productivity is disturbing given that most current fashion items are delivered through regional malls. The “Dressing Down of America” which started with “Casual Fridays” has eroded the demand for fashion apparel. Most companies now have a casual dress policy for Fridays, and many have policies permitting casual attire on all but special occasions. These policies have slowed department store sales, especially in men’s suits and women’s dresses. Fashion apparel and accessories were historically the merchandise centerpiece of most conventional department stores. Stores focusing on better casual wear have capitalized upon this trend. Many malls have re-merchandised their vacant department stores with other department stores or a mix of big box stores to broaden their appeal beyond fashion merchandise and accessories. Nordstrom’s continues to be the darling of Chicago area consumers. Neiman Marcus and Saks Fifth Avenue are truly specialty fashion retailers focused principally on North Michigan Avenue. Bloomingdale’s in Chicago has not captured the hearts and minds of area consumers. While the North Michigan Avenue store does well, the Old Orchard store struggles. Von Maur, often referred to as Nordstrom Junior, operates three stores in the Chicago market; Yorktown Center in Lombard, Charlestown Mall in St. Charles, The Glen in Glenview. The Yorktown stores does very well, Charlestown Mall is adequate, while the Glenview store is performing poorly along with The Glen. Carson’s, as part of Sak’s Northern Department Store Group, was acquired by Bon-Ton Stores, including
31 Carson Pirie Scott stores located in Illinois (28) and Indiana (3);
47 Younker’s stores located in Illinois (1), Iowa (18), Michigan (9), Minnesota (2), Nebraska (4), South Dakota (1) and Wisconsin (12);
Retail Market Feasibility Study, Lincoln Mall Area, Matteson, Illinois
-37-
40 Herberger’s stores located in Colorado (1), Iowa (1), Minnesota (16), Montana (6),
Nebraska (5), North Dakota (4), South Dakota (3), Wisconsin (3) and Wyoming (1);
14 Bergner’s stores located in Illinois; and 10 Boston Store locations in Wisconsin. Most of the Carson’s full-line suburban stores are generating over $20 million in sales annually. The Bon-Ton department store’s average approximately $9.4 million in sales. In recent years, Carson’s has not been able to grow and its future depends upon its ability to regain consumer respect and visitation. It also depends somewhat upon the negative impact of Macy’s, and Carson’s ability to overcome Kohl’s and other big box stores. During 2006 and 2007, we will continue to see a loss of Department store market share to boxes and specialty stores. Only one new conventional department store, Von Maur, has opened in the metro area in the last five years.
Supermarkets and Warehouse Stores The Chicago Market is changing dramatically with the shift from supermarkets to food warehouses. Jewel is the supermarket leader in the Chicago Metropolitan Area, followed by Dominick’s and Cub Foods. Jewel, previously owned by Albertson’s, was acquired by Super Value and continues to expand throughout the Chicago market. Cub Food, previously owned by Super Value, was sold to a group of investors as required by the Federal Trade Commission as part of the Super Value agreement to purchase Albertson’s. Nonetheless, Costco, Wal-Mart Supercenters, Sam’s Club, Super Target, Meijer’s, and Woodman’s are planning more stores. Safeway’s decision to keep Dominick’s, which had been for sale, changes the company’s focus on supermarket merchandising in the Chicago market. It is now attempting to regain much of its lost market share. This will be a difficult process. Nevertheless, it is a good decision for Chicagoland consumers who will benefit from the competition. Cub Foods operates over 20 stores in the market. Cub Foods continues to struggle to gain market share in the metro area The decline in Dominick’s market share has helped Cub Foods somewhat. Costco continues to be a big winner in the Chicago market. Nationally, company sales are averaging over $115 million per unit, nearly double the revenue of Sam’s Club at $63 million. Additionally, Costco has some Chicagoland stores generating sales in the neighborhood of $200 million. Costco is capturing sales especially at the higher price points in meats, wines, and bakery. Costco is the nation’s biggest seller of fine wines with sales over $600 million per year. According to recent reports, Costco is the only competitor that worries Wal-Mart. New Costco stores are planned in Chicago, Orland Park, Bolingbrook, Hoffman Estates, and other suburbs. Sam’s Club, a Wal-Mart company, also operates food and general merchandise stores throughout the Chicago market. Sam’s Club continues to take its share but cannot seem to gain additional
Retail Market Feasibility Study, Lincoln Mall Area, Matteson, Illinois
-38-
market penetration primarily because of Costco. Sam’s Club operates a successful unit in Matteson. Ultra Foods also has a successful store on Lincoln Highway. While Wal-Mart is now the biggest food merchant in the country; they are just getting started in the Chicago market area. As previously indicated, they will be adding at least 20 Supercenters over the next two years. Many more are currently being planned. Some specialty grocery stores continue to experience strong sales growth including Whole Foods Market and Trader Joe’s. Whole Foods Market operates 20,000 to 40,000 square foot units and generates sales of $18 to $20 million per unit. Trader Joe’s operates approximately 11,000 square foot with sales of approximately $4.0 to $5.0 million per unit. Aldi’s, a bulk food seller, has over 50 stores in the Chicago Market.
Drug Stores Walgreen’s continues to dominate the Chicagoland retail drug business. Their primary emphasis has been on relocating their stores from shopping centers and business districts into free-standing locations with drive thru facilities. Osco Drugs was sold to CVS, thereby increasing their number of stores in the Chicagoland market. CVS continues to build new stores throughout the city and the suburbs. The new Medicare Drug Program – Part D has been both beneficial and deleterious to both major drug stores and big box discounters. Where prices are close, consumers are opting back to their nearby Walgreen’s, Osco, or CVS because of the cost of gasoline. Where the major big boxes have sharpened their pencils, they are maintaining market share. Only time will tell who will be the winner. Its greatest negative impact has been on buying drugs from Canada, which has declined substantially.
Electronics Stores In 2006, following the slow down in computer sales, we are seeing renewed strength in electronics and appliance stores as the economy rebounds and consumers buy into HDTV and flat panel television screens. We expect to see continued sales growth in wi-fi computers, notebooks, PDA’s, Blackberry’s, cellular telephones with cameras, X Boxes, Hi-Definition televisions, flat screen TV’s, and other electronic gadgets. Best Buy, Circuit City, Comp USA, ABT, and Sears continue to be dominant players, along with mail-order retailers Dell, Gateway, CDW, and others. However, all will experience greater competition from Target, Wal-Mart, Office Max, Office Depot, and others. Home Depot, Lowe’s, and Menards also carry some appliances which places pressure on appliance retailers. Circuit City, which had some sales problems has recovered and is doing better. Best Buy with more stores continues to be the dominant retailer in this category. However, Abt continues to lead the way in single store sales exceeding $350 million.
Furniture Stores
Furniture is experiencing the shift from conventional furniture stores to big box furniture merchandising. Furniture stores are shifting to either upscale, service-oriented, featuring designer
Retail Market Feasibility Study, Lincoln Mall Area, Matteson, Illinois
-39-
goods or they are focusing on limited inventory and quick delivery. Today, the consumer does not want to wait for furniture; they want it now! Thus, the future appears to be with stores that carry a limited merchandise mix that is available every day. Wickes stores converted to this high volume approach following their acquisition. This strategy has been a big success with consumers. Furthermore, we expect to see more existing furniture stores adopt the limited inventory quick delivery approach.
Home Improvement Stores Lowe’s Home Improvement stores continue their proliferation of the Chicago Metropolitan Area. Reportedly, Lowe’s does not intend to match Home Depot store for store. Lowe’s offers brightly lit stores, good signage, excellent organization and presentation of merchandise, and bright tile floors. Lowe’s strategy is to focus more on women who make most of the decisions when it comes to remodeling projects. Home Depot had originally focused upon the small contractor and Lowe’s the do-it-yourself consumer. Home Depot has over 40 stores in the Chicago Metropolitan Area, and continues to add more units where needed. Home Depot improved its stores in anticipation of the entry of Lowe’s. In our opinion, the stores were more contractor oriented and less female friendly. Home Depot has made several improvements including relocation of the paint department to a more prominent location, the lighting in their stores, shiny concrete floors, self-service checkouts, and the overall organization and presentation of merchandise. The elimination of many of their experienced sales people is having a negative impact upon Home Depot sales. The four Expo Design Centers are apparently performing below expectations. Menards has over 30 stores in the Chicago Metropolitan Area. Menards continues to pound price with the “save big money at Menard's” mantra. Menards has a varied merchandise mix. They also sells many items outside home improvement including snacks, candy, soft drinks, barbeque sauce, socks, toys, and apparel that have a broader appeal. The new prototype stores are approximately 170,000 square feet and are stuffed with merchandise. Menards has very narrow isles in comparison to Home Depot and Lowe’s. Thus, far, Menard’s is surviving the competitive nature of the market by going right at its competition. Chicago is a very competitive home improvement market; only time will tell if the market can support three major stores.
Restaurant & Quick Service Casual Facilities
The Foodservice business improved in 2005 and thus far in 2006. Rising gasoline price have the industry extremely concerned. Highway oriented units like Cracker Barrel have already seen their sales decline as more people are postponing trips. The “Quick Service Casual Restaurant” segment continues to show the best overall opportunity for long-range gain. They generally serve smaller trade areas. Some of the major players include McDonald’s, Burger King, Wendy’s, Arby’s, Subway, Portillo’s, Quisnos, Baja Fresh, Chipotle, Q Doba, Panera Bread, Potbelly Sandwich Works, Noodles & Company, Corner Bakery, Wild Noodles, McAllister’s, and Au Bon Pain, among others. Some of the newest restaurants developed in the Chicago Metropolitan Area include Buffalo Wings Wild, Cameron Mitchell’s Seafood in Northbrook, Ram &
Retail Market Feasibility Study, Lincoln Mall Area, Matteson, Illinois
-40-
Restaurant & Brewery in Rosemont, Pete Miller’s Steakhouse in Wheeling, and the Bucca Restaurant in Orland Park, among many others. Summary In summary, retailing and markets are never static; they are always changing. Some categories change more rapidly than other. Nevertheless, one thing is for certain, change will continue to occur and retailers need to be on top of consumer demands and the aging of the population.
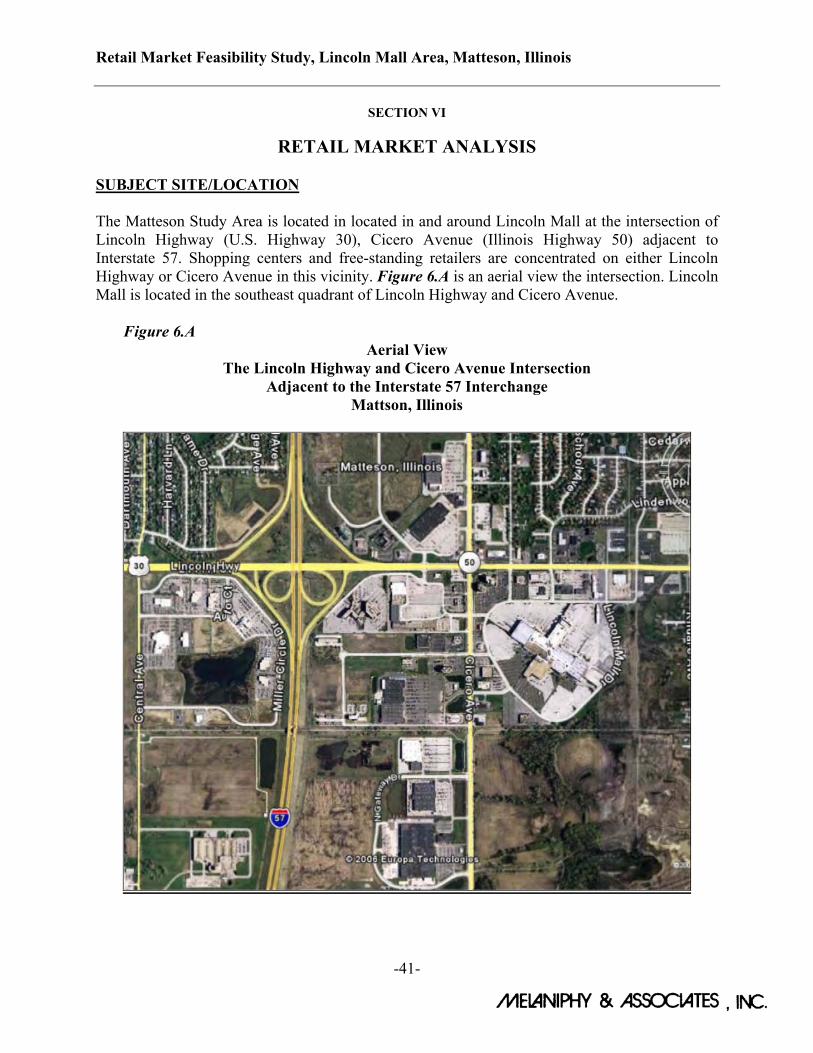
Retail Market Feasibility Study, Lincoln Mall Area, Matteson, Illinois
-41-
SECTION VI
RETAIL MARKET ANALYSIS SUBJECT SITE/LOCATION The Matteson Study Area is located in located in and around Lincoln Mall at the intersection of Lincoln Highway (U.S. Highway 30), Cicero Avenue (Illinois Highway 50) adjacent to Interstate 57. Shopping centers and free-standing retailers are concentrated on either Lincoln Highway or Cicero Avenue in this vicinity. Figure 6.A is an aerial view the intersection. Lincoln Mall is located in the southeast quadrant of Lincoln Highway and Cicero Avenue. Figure 6.A
Aerial View The Lincoln Highway and Cicero Avenue Intersection
Adjacent to the Interstate 57 Interchange Mattson, Illinois
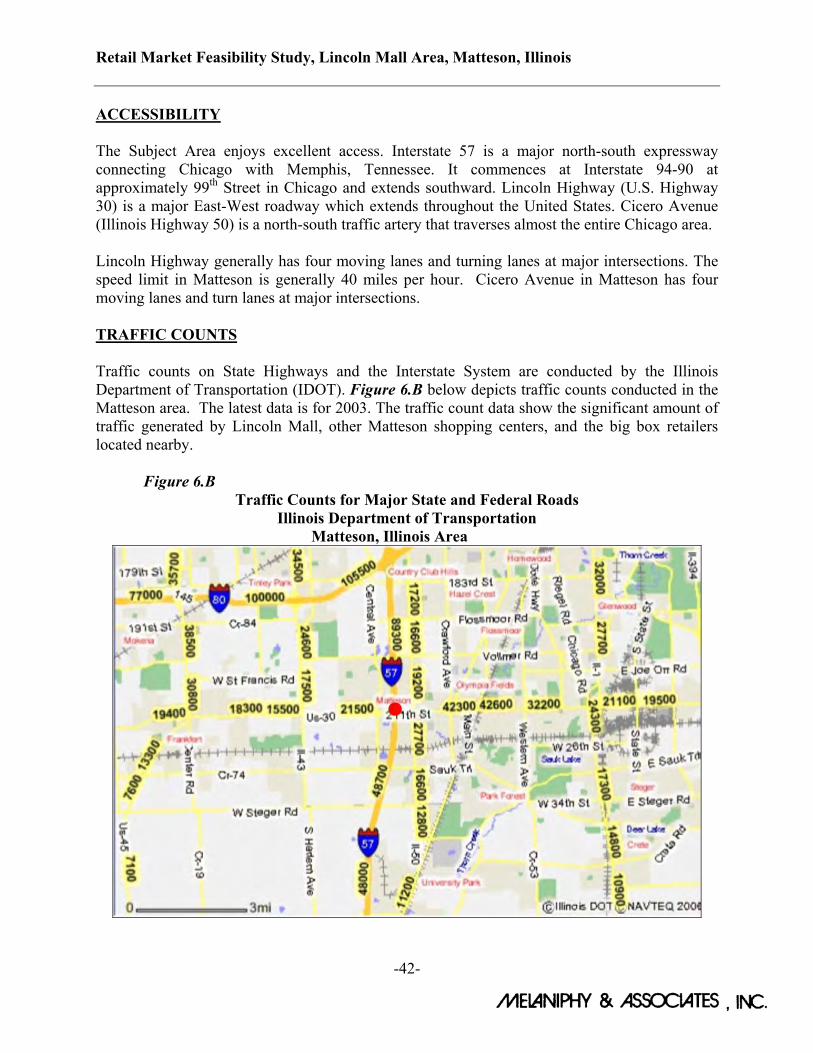
Retail Market Feasibility Study, Lincoln Mall Area, Matteson, Illinois
-42-
ACCESSIBILITY The Subject Area enjoys excellent access. Interstate 57 is a major north-south expressway connecting Chicago with Memphis, Tennessee. It commences at Interstate 94-90 at approximately 99th Street in Chicago and extends southward. Lincoln Highway (U.S. Highway 30) is a major East-West roadway which extends throughout the United States. Cicero Avenue (Illinois Highway 50) is a north-south traffic artery that traverses almost the entire Chicago area. Lincoln Highway generally has four moving lanes and turning lanes at major intersections. The speed limit in Matteson is generally 40 miles per hour. Cicero Avenue in Matteson has four moving lanes and turn lanes at major intersections. TRAFFIC COUNTS Traffic counts on State Highways and the Interstate System are conducted by the Illinois Department of Transportation (IDOT). Figure 6.B below depicts traffic counts conducted in the Matteson area. The latest data is for 2003. The traffic count data show the significant amount of traffic generated by Lincoln Mall, other Matteson shopping centers, and the big box retailers located nearby. Figure 6.B
Traffic Counts for Major State and Federal Roads Illinois Department of Transportation
Matteson, Illinois Area
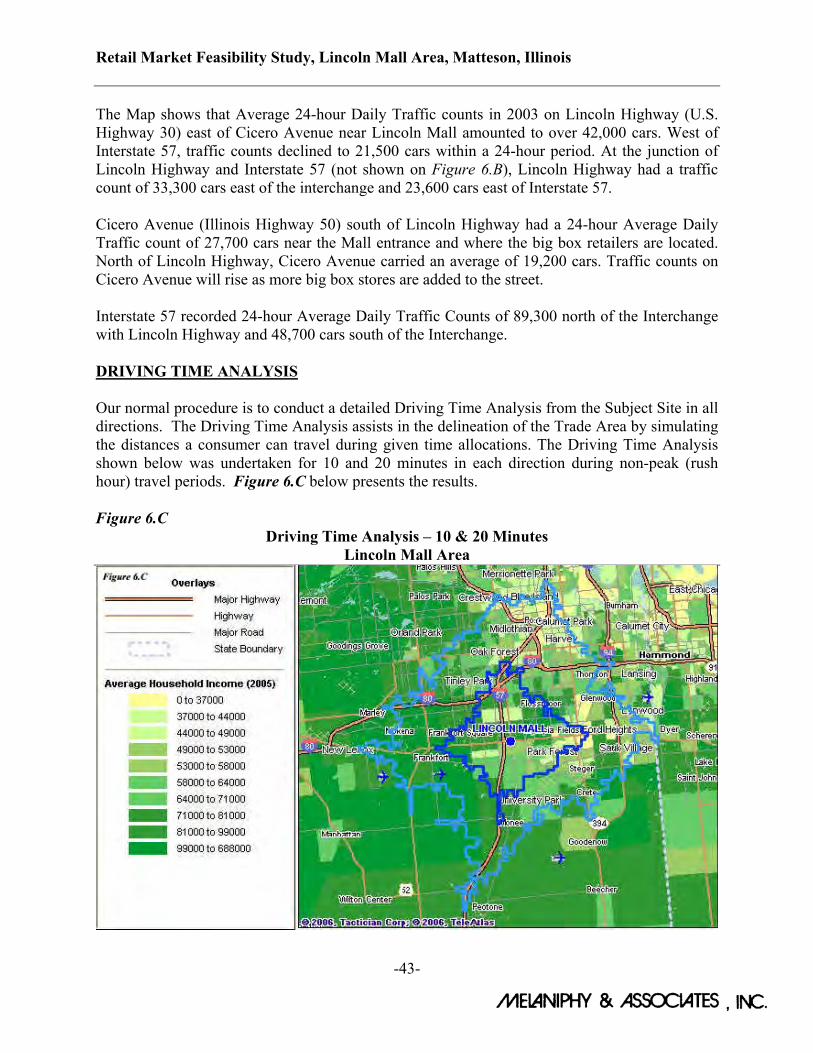
Retail Market Feasibility Study, Lincoln Mall Area, Matteson, Illinois
-43-
The Map shows that Average 24-hour Daily Traffic counts in 2003 on Lincoln Highway (U.S. Highway 30) east of Cicero Avenue near Lincoln Mall amounted to over 42,000 cars. West of Interstate 57, traffic counts declined to 21,500 cars within a 24-hour period. At the junction of Lincoln Highway and Interstate 57 (not shown on Figure 6.B), Lincoln Highway had a traffic count of 33,300 cars east of the interchange and 23,600 cars east of Interstate 57. Cicero Avenue (Illinois Highway 50) south of Lincoln Highway had a 24-hour Average Daily Traffic count of 27,700 cars near the Mall entrance and where the big box retailers are located. North of Lincoln Highway, Cicero Avenue carried an average of 19,200 cars. Traffic counts on Cicero Avenue will rise as more big box stores are added to the street. Interstate 57 recorded 24-hour Average Daily Traffic Counts of 89,300 north of the Interchange with Lincoln Highway and 48,700 cars south of the Interchange. DRIVING TIME ANALYSIS Our normal procedure is to conduct a detailed Driving Time Analysis from the Subject Site in all directions. The Driving Time Analysis assists in the delineation of the Trade Area by simulating the distances a consumer can travel during given time allocations. The Driving Time Analysis shown below was undertaken for 10 and 20 minutes in each direction during non-peak (rush hour) travel periods. Figure 6.C below presents the results. Figure 6.C
Driving Time Analysis – 10 & 20 Minutes Lincoln Mall Area
Retail Market Feasibility Study, Lincoln Mall Area, Matteson, Illinois
-44-
TRADE AREA DELINEATION Matteson’s Trade Area has been delineated on the basis of existing Lincoln Mall’s Trade Area and nearby big box attraction, accessibility, the road network, the Driving Time Analysis, existing and proposed competition, Lincoln Mall’s customer distribution, physical and psychological barriers, shopping habits and patterns, dining-out patterns, as well as our experience in evaluating shopping centers and other commercial developments throughout the world. The Trade Area for the Subject Site is depicted in Figure 6.D on the following page. By definition, Trade Areas account for approximately 85 percent of the anticipated business. Because of visitors, businesspersons, people passing through, and others, it is difficult to identify the last 15 percent. Distances traveled and visitor infrequency makes it uneconomic to attempt to define the last 15 percent, as well as prepare accurate demographics. The Trade Area, as defined, represents the geographic area from which most of Matteson’s sales will be derived. The Primary Trade Area has been delineated to include the geographic area from which the most frequent shoppers reside. Approximately 60 to 70 percent of the consumer expenditures spent in Matteson originate from the Primary Trade Area. Generally, the Primary Trade Area extends northward to Interstate 80. Orland Park Square Mall and the significant retail concentration there proscribe the Trade Area in that direction. Eastward, the Primary Trade Area extends to an area just beyond Halsted Street where the new big box concentration in Homewood/Glenwood affects Matteson’s retail attraction. Southward, the Primary Trade Area extends to include University Park, and westward, the Primary Trade Area extends to 88th Avenue, just east of Frankfort. The Secondary Trade Area has been delineated to include the geographic area indicated in Figure 6.D. The Secondary Trade Area represents the geographic areas from which consumers will originate on a less frequent basis. Approximately 20 to 25 percent of the consumers will be generated from the Secondary Trade Area. The map indicates that the Secondary Trade Area is limited to the north, again, as a result of the Orland Park major retail concentration. To the east, the Secondary trade area extends partially to the Indiana State Line. To the south, the Secondary Trade Area extends to Manteno, and to the west, the Secondary Trade Area extends to Frankfort, Illinois. TRADE AREA MARKET SUPPORT FACTORS The demographic characteristics of the Trade Area were assembled and evaluated. Population, households, average household income, income structure, age structure and other key demographic data have been evaluated for the Primary and Secondary Trade Area segments. Table 6.1 entitled Market Support Factors provides the data.

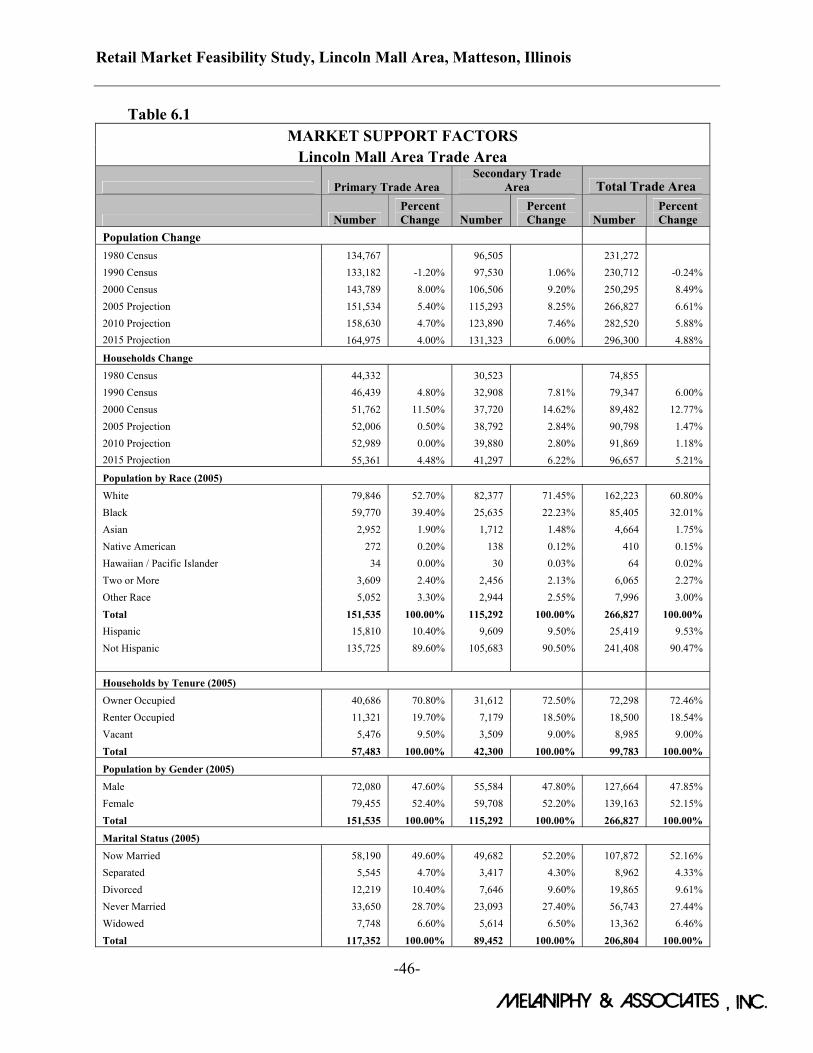
Retail Market Feasibility Study, Lincoln Mall Area, Matteson, Illinois
-46-
Table 6.1 MARKET SUPPORT FACTORS
Lincoln Mall Area Trade Area
Primary Trade Area Secondary Trade
Area Total Trade Area
Number Percent Change Number
Percent Change Number
Percent Change
Population Change 1980 Census 134,767 96,505 231,272 1990 Census 133,182 -1.20% 97,530 1.06% 230,712 -0.24% 2000 Census 143,789 8.00% 106,506 9.20% 250,295 8.49% 2005 Projection 151,534 5.40% 115,293 8.25% 266,827 6.61% 2010 Projection 158,630 4.70% 123,890 7.46% 282,520 5.88% 2015 Projection 164,975 4.00% 131,323 6.00% 296,300 4.88%
Households Change
1980 Census 44,332 30,523 74,855 1990 Census 46,439 4.80% 32,908 7.81% 79,347 6.00% 2000 Census 51,762 11.50% 37,720 14.62% 89,482 12.77% 2005 Projection 52,006 0.50% 38,792 2.84% 90,798 1.47% 2010 Projection 52,989 0.00% 39,880 2.80% 91,869 1.18% 2015 Projection 55,361 4.48% 41,297 6.22% 96,657 5.21%
Population by Race (2005)
White 79,846 52.70% 82,377 71.45% 162,223 60.80% Black 59,770 39.40% 25,635 22.23% 85,405 32.01% Asian 2,952 1.90% 1,712 1.48% 4,664 1.75% Native American 272 0.20% 138 0.12% 410 0.15% Hawaiian / Pacific Islander 34 0.00% 30 0.03% 64 0.02% Two or More 3,609 2.40% 2,456 2.13% 6,065 2.27% Other Race 5,052 3.30% 2,944 2.55% 7,996 3.00% Total 151,535 100.00% 115,292 100.00% 266,827 100.00% Hispanic 15,810 10.40% 9,609 9.50% 25,419 9.53% Not Hispanic 135,725 89.60% 105,683 90.50% 241,408 90.47%
Households by Tenure (2005)
Owner Occupied 40,686 70.80% 31,612 72.50% 72,298 72.46% Renter Occupied 11,321 19.70% 7,179 18.50% 18,500 18.54% Vacant 5,476 9.50% 3,509 9.00% 8,985 9.00% Total 57,483 100.00% 42,300 100.00% 99,783 100.00%
Population by Gender (2005)
Male 72,080 47.60% 55,584 47.80% 127,664 47.85% Female 79,455 52.40% 59,708 52.20% 139,163 52.15% Total 151,535 100.00% 115,292 100.00% 266,827 100.00%
Marital Status (2005)
Now Married 58,190 49.60% 49,682 52.20% 107,872 52.16% Separated 5,545 4.70% 3,417 4.30% 8,962 4.33% Divorced 12,219 10.40% 7,646 9.60% 19,865 9.61% Never Married 33,650 28.70% 23,093 27.40% 56,743 27.44% Widowed 7,748 6.60% 5,614 6.50% 13,362 6.46% Total 117,352 100.00% 89,452 100.00% 206,804 100.00%
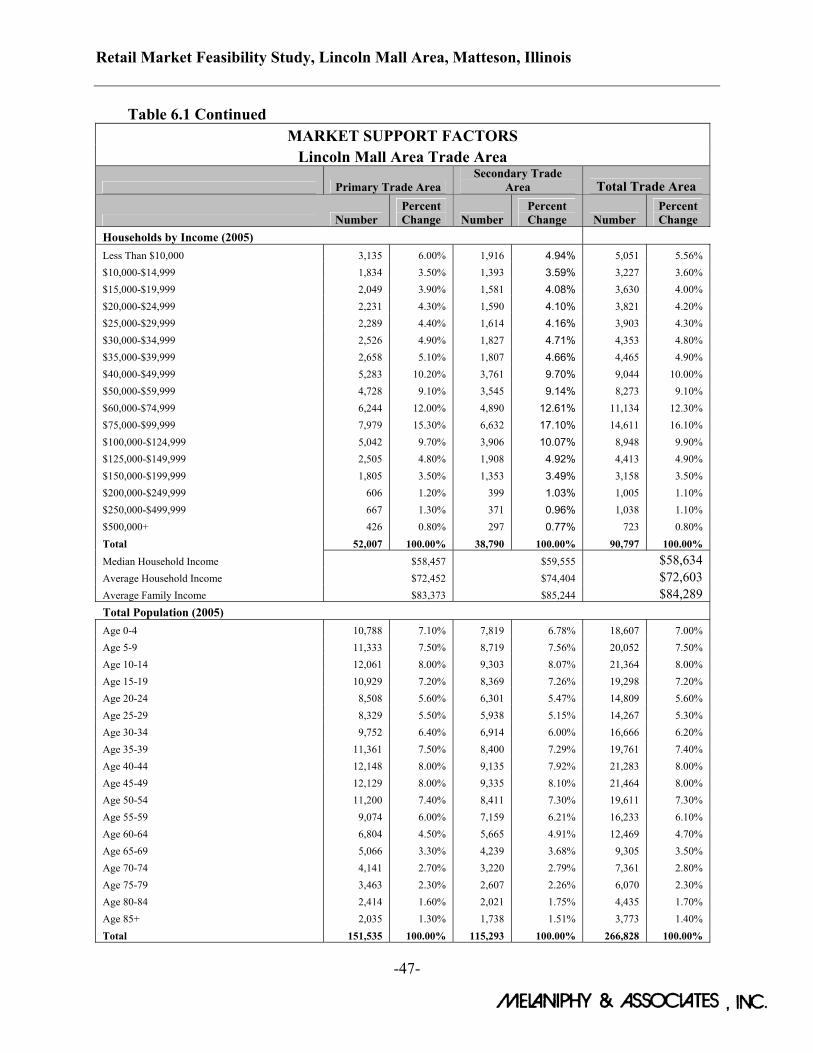
Retail Market Feasibility Study, Lincoln Mall Area, Matteson, Illinois
-47-
Table 6.1 Continued MARKET SUPPORT FACTORS
Lincoln Mall Area Trade Area
Primary Trade Area Secondary Trade
Area Total Trade Area
Number Percent Change Number
Percent Change Number
Percent Change
Households by Income (2005) Less Than $10,000 3,135 6.00% 1,916 4.94% 5,051 5.56% $10,000-$14,999 1,834 3.50% 1,393 3.59% 3,227 3.60% $15,000-$19,999 2,049 3.90% 1,581 4.08% 3,630 4.00% $20,000-$24,999 2,231 4.30% 1,590 4.10% 3,821 4.20% $25,000-$29,999 2,289 4.40% 1,614 4.16% 3,903 4.30% $30,000-$34,999 2,526 4.90% 1,827 4.71% 4,353 4.80% $35,000-$39,999 2,658 5.10% 1,807 4.66% 4,465 4.90% $40,000-$49,999 5,283 10.20% 3,761 9.70% 9,044 10.00% $50,000-$59,999 4,728 9.10% 3,545 9.14% 8,273 9.10% $60,000-$74,999 6,244 12.00% 4,890 12.61% 11,134 12.30% $75,000-$99,999 7,979 15.30% 6,632 17.10% 14,611 16.10% $100,000-$124,999 5,042 9.70% 3,906 10.07% 8,948 9.90% $125,000-$149,999 2,505 4.80% 1,908 4.92% 4,413 4.90% $150,000-$199,999 1,805 3.50% 1,353 3.49% 3,158 3.50% $200,000-$249,999 606 1.20% 399 1.03% 1,005 1.10% $250,000-$499,999 667 1.30% 371 0.96% 1,038 1.10% $500,000+ 426 0.80% 297 0.77% 723 0.80% Total 52,007 100.00% 38,790 100.00% 90,797 100.00% Median Household Income $58,457 $59,555 $58,634 Average Household Income $72,452 $74,404 $72,603 Average Family Income $83,373 $85,244 $84,289 Total Population (2005) Age 0-4 10,788 7.10% 7,819 6.78% 18,607 7.00% Age 5-9 11,333 7.50% 8,719 7.56% 20,052 7.50% Age 10-14 12,061 8.00% 9,303 8.07% 21,364 8.00% Age 15-19 10,929 7.20% 8,369 7.26% 19,298 7.20% Age 20-24 8,508 5.60% 6,301 5.47% 14,809 5.60% Age 25-29 8,329 5.50% 5,938 5.15% 14,267 5.30% Age 30-34 9,752 6.40% 6,914 6.00% 16,666 6.20% Age 35-39 11,361 7.50% 8,400 7.29% 19,761 7.40% Age 40-44 12,148 8.00% 9,135 7.92% 21,283 8.00% Age 45-49 12,129 8.00% 9,335 8.10% 21,464 8.00% Age 50-54 11,200 7.40% 8,411 7.30% 19,611 7.30% Age 55-59 9,074 6.00% 7,159 6.21% 16,233 6.10% Age 60-64 6,804 4.50% 5,665 4.91% 12,469 4.70% Age 65-69 5,066 3.30% 4,239 3.68% 9,305 3.50% Age 70-74 4,141 2.70% 3,220 2.79% 7,361 2.80% Age 75-79 3,463 2.30% 2,607 2.26% 6,070 2.30% Age 80-84 2,414 1.60% 2,021 1.75% 4,435 1.70% Age 85+ 2,035 1.30% 1,738 1.51% 3,773 1.40% Total 151,535 100.00% 115,293 100.00% 266,828 100.00%
Retail Market Feasibility Study, Lincoln Mall Area, Matteson, Illinois
-48-
According to the data presented in Table 6.1, the Primary Trade Area contains a population of 151,534 persons in 52,006 households. By 2010, the population is forecast to increase to 158,630 persons in 52,989 households and by 2015, the population is forecast to 164,975. The average annual household income is estimated at $72,452 within the Primary Trade Area. Median household income is currently estimated at $58,456. The median age is estimated at 38.64 years. The ethnic characteristics are as follows: White 52.7 percent, Black 39.4 percent, and American Indian 0.20 percent. Hispanic accounts for 10.4 percent. Owner occupied households accounted for 70.8 percent, while renter occupied households accounted for 9.50 percent. The balance were vacant, mainly the result of new construction. Female population accounts for approximately 52.4 percent of the population, while Males account for 47.6 percent. The Secondary Trade Area contains a population of 115,293 persons in 38,792 households. The population is forecast to 123,890 persons by 2010 and 131,323 persons by 2015. The median age is moderately younger than the Primary Trade Area amounting to an estimated 36.2 years. The ethnic characteristics are as follows: 71.4 percent White, 22.2 percent Black, 1.48 Asian, and 0.2 percent Native American. Hispanic accounts for approximately 9.5 percent. The average annual household income within the Secondary Trade Area is slightly higher than the Primary Trade Area amounting to an estimated $74,404 while the median household income amounts to an estimated $59,555. Owner occupied household’s amount to approximately 72.5 percent, while renter occupied account for 18.5 percent. Vacant accounted for approximately 9.0 percent. Again, vacant housing is a combination of house for sale and newly constructed housing. Female population accounts for 52.2 percent and Male population accounts for 47.8 percent. The Total Trade Area contains an estimated population of 266,827 persons in 90,798 households. By 2010, the population within the Total Trade Area is forecast to rise to 282,520 persons in 91,869 households, and by 2015 the population is forecast to rise to 296,300 persons in 96,657 households. The median age is 37.1 years. The ethnic characteristics for the Total Trade Area are 60.89 percent White, 32.0 percent Black, 1.75 Asian and 0.15 percent Native American The average household income amounts to an estimated $72,603 while median household income amounts to an estimated $58,634. COMPETITIVE ENVIRONMENT The competitive retail concentrations located both in and outside of the delineated Trade Area of the Village of Matteson are discussed in the following paragraphs. Many of these facilities provide some level of direct and indirect competition to the Subject Site. The primary competitive mall and retail concentration to Matteson is Orland Square Mall and other Orland Park centers and major big box stores. Almost every major retailer is represented in the Orland Park area.
Retail Market Feasibility Study, Lincoln Mall Area, Matteson, Illinois
-49-
The newest major retail concentration is in Homewood/Glenwood area south of the interchange with Halsted Street and Interstate 80 and 294, the Illinois Tollway around the Chicago area. Table 6.2 on the following pages presents the Competitive Retail Inventory. The table highlights the name of the shopping center, location, size, approximate occupancy rate, major anchors, and anchor sizes, where available. The major shopping centers and freestanding retailers directly influencing the Subject Sites are briefly discussed in the following paragraphs. Orland Park Orland Square Mall is located approximately 10 miles north-northwest of Matteson. The Mall has over 1,200,000 square feet and features department stores operated by Marshall Field (Macy’s), Carson Pirie Scott & Company, Sears, and J.C. Penney. Figure 6.E on the following page shows a 10-Mile radius from Lincoln Mall and the relationship to Orland Square Mall in Orland Park and River Oaks Mall in Calumet City. Orland Square Mall is approximately 10 miles and River Oaks Mall is approximately 13 miles as the crow flies. The base map depicts average household income. The darker the color green, the higher the income, conversely, the lighter the color to yellow, the lower the income. In 2005, retailers in Orland Park captured retail sales exceeding $1.777 billion, up from $1.709 billion in 2004. General Merchandise sales in 2005 amounted to $258.2 million, down from $290.4 million in 2004, for a decrease of $32.2 million. Orland Park contains over 4,000,000 square feet of retail space. Almost all of the major big box general merchandise retailers are located in Orland Park, either on LaGrange Road (U.S. 45) or on 159th Street (U.S. 6). Costco is expected to develop a unit on the southwest quadrant of LaGrange Road and 159th Street. Meijer’s is planning a unit at 143rd and Bell in Homer Glen. Major big boxes located in Orland Park include Wal-Mart, Target Greatland, Kohl’s, Value City, Best Buy, Circuit City, Home Depot, Menard’s, Sports Authority, Wickes Furniture, World Market, DSW Shoes, Bed Bath & Beyond, Marshall’s, Office Depot, Office Max, Value City Furniture, Barnes & Noble, Borders, Stein Mart, Dick Sporting Goods, Toys R Us, Michael’s, Shoe Carnival, David Bridal, Cub Foods, and others. Lowe’s will be opening its new store shortly. Wal-Mart is apparently searching for a location for a Supercenter in this area.
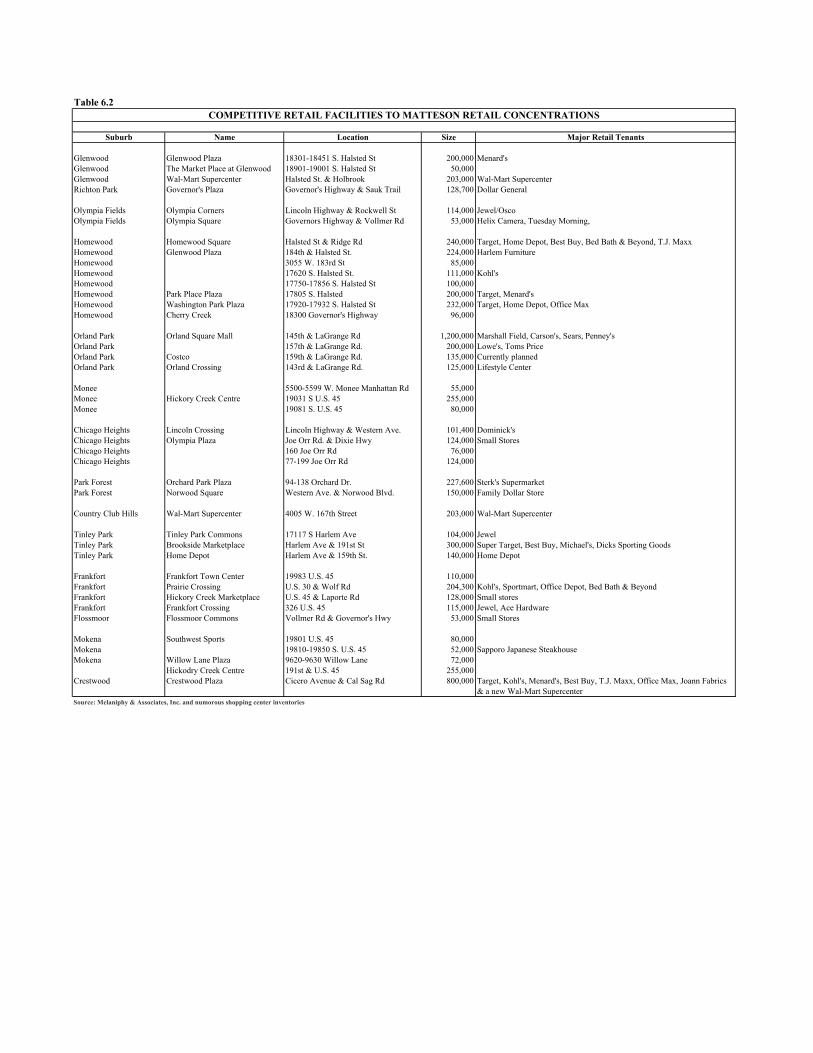
Table 6.2COMPETITIVE RETAIL FACILITIES TO MATTESON RETAIL CONCENTRATIONS
Suburb Name Location Size Major Retail Tenants
Glenwood Glenwood Plaza 18301-18451 S. Halsted St 200,000 Menard'sGlenwood The Market Place at Glenwood 18901-19001 S. Halsted St 50,000Glenwood Wal-Mart Supercenter Halsted St. & Holbrook 203,000 Wal-Mart SupercenterRichton Park Governor's Plaza Governor's Highway & Sauk Trail 128,700 Dollar General
Olympia Fields Olympia Corners Lincoln Highway & Rockwell St 114,000 Jewel/OscoOlympia Fields Olympia Square Governors Highway & Vollmer Rd 53,000 Helix Camera, Tuesday Morning, Homewood Homewood Square Halsted St & Ridge Rd 240,000 Target, Home Depot, Best Buy, Bed Bath & Beyond, T.J. MaxxHomewood Glenwood Plaza 184th & Halsted St. 224,000 Harlem FurnitureHomewood 3055 W. 183rd St 85,000Homewood 17620 S. Halsted St. 111,000 Kohl'sHomewood 17750-17856 S. Halsted St 100,000Homewood Park Place Plaza 17805 S. Halsted 200,000 Target, Menard'sHomewood Washington Park Plaza 17920-17932 S. Halsted St 232,000 Target, Home Depot, Office MaxHomewood Cherry Creek 18300 Governor's Highway 96,000
Orland Park Orland Square Mall 145th & LaGrange Rd 1,200,000 Marshall Field, Carson's, Sears, Penney'sOrland Park 157th & LaGrange Rd. 200,000 Lowe's, Toms PriceOrland Park Costco 159th & LaGrange Rd. 135,000 Currently plannedOrland Park Orland Crossing 143rd & LaGrange Rd. 125,000 Lifestyle Center
Monee 5500-5599 W. Monee Manhattan Rd 55,000Monee Hickory Creek Centre 19031 S U.S. 45 255,000Monee 19081 S. U.S. 45 80,000
Chicago Heights Lincoln Crossing Lincoln Highway & Western Ave. 101,400 Dominick'sChicago Heights Olympia Plaza Joe Orr Rd. & Dixie Hwy 124,000 Small StoresChicago Heights 160 Joe Orr Rd 76,000Chicago Heights 77-199 Joe Orr Rd 124,000
Park Forest Orchard Park Plaza 94-138 Orchard Dr. 227,600 Sterk's SupermarketPark Forest Norwood Square Western Ave. & Norwood Blvd. 150,000 Family Dollar Store
Country Club Hills Wal-Mart Supercenter 4005 W. 167th Street 203,000 Wal-Mart Supercenter
Tinley Park Tinley Park Commons 17117 S Harlem Ave 104,000 JewelTinley Park Brookside Marketplace Harlem Ave & 191st St 300,000 Super Target, Best Buy, Michael's, Dicks Sporting GoodsTinley Park Home Depot Harlem Ave & 159th St. 140,000 Home Depot
Frankfort Frankfort Town Center 19983 U.S. 45 110,000Frankfort Prairie Crossing U.S. 30 & Wolf Rd 204,300 Kohl's, Sportmart, Office Depot, Bed Bath & BeyondFrankfort Hickory Creek Marketplace U.S. 45 & Laporte Rd 128,000 Small storesFrankfort Frankfort Crossing 326 U.S. 45 115,000 Jewel, Ace HardwareFlossmoor Flossmoor Commons Vollmer Rd & Governor's Hwy 53,000 Small Stores
Mokena Southwest Sports 19801 U.S. 45 80,000Mokena 19810-19850 S. U.S. 45 52,000 Sapporo Japanese SteakhouseMokena Willow Lane Plaza 9620-9630 Willow Lane 72,000
Hickodry Creek Centre 191st & U.S. 45 255,000Crestwood Crestwood Plaza Cicero Avenue & Cal Sag Rd 800,000 Target, Kohl's, Menard's, Best Buy, T.J. Maxx, Office Max, Joann Fabrics
& a new Wal-Mart SupercenterSource: Melaniphy & Associates, Inc. and numorous shopping center inventories
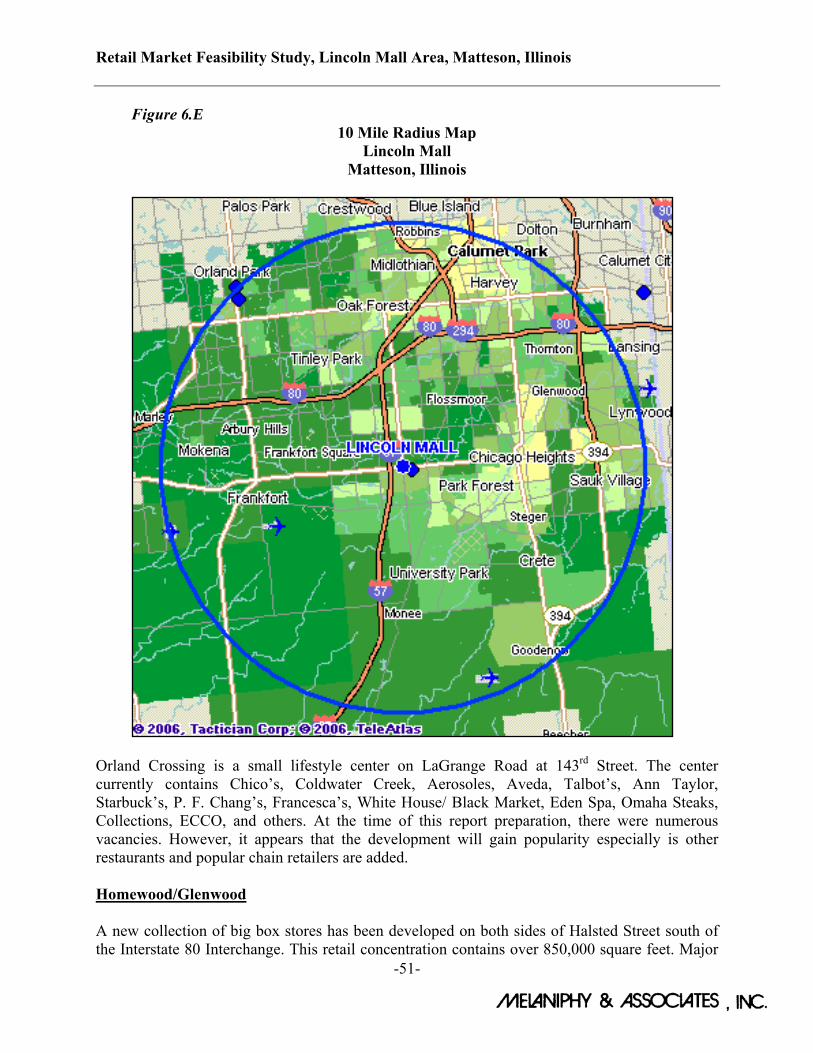
Retail Market Feasibility Study, Lincoln Mall Area, Matteson, Illinois
-51-
Figure 6.E 10 Mile Radius Map
Lincoln Mall Matteson, Illinois
Orland Crossing is a small lifestyle center on LaGrange Road at 143rd Street. The center currently contains Chico’s, Coldwater Creek, Aerosoles, Aveda, Talbot’s, Ann Taylor, Starbuck’s, P. F. Chang’s, Francesca’s, White House/ Black Market, Eden Spa, Omaha Steaks, Collections, ECCO, and others. At the time of this report preparation, there were numerous vacancies. However, it appears that the development will gain popularity especially is other restaurants and popular chain retailers are added. Homewood/Glenwood A new collection of big box stores has been developed on both sides of Halsted Street south of the Interstate 80 Interchange. This retail concentration contains over 850,000 square feet. Major
Retail Market Feasibility Study, Lincoln Mall Area, Matteson, Illinois
-52-
stores located here include Kohl’s, Target, Wal-Mart, Home Depot, Menard’s, Best Buy, Circuit City, Bed Bath & Beyond, and others. Homewood total 2005 retail sales amounted to $377.2 million, of which $73.5 million was in General Merchandise. Glenwood had total retail sales of $73.3 million in 2005 Tinley Park Tinley Park’s, located approximately five and one-half miles north of Matteson, has primarily big box stores at major intersections. These include Sam’s Club and Super K at 161st Street and Harlem; the retail concentration at Harlem Avenue and 167th Street; and the new Super Target with 175,000 square feet and Best Buy with 50,000 square feet at Harlem Avenue and 191st Street. Home Depot is located at 159th Street and Harlem Avenue along with other retailers at the intersection including Cub Foods, Value City, Staples, and Hobby Lobby. Tinley Park’s retail sales in 2005 amounted to $870.5 million, of which $128 million was in General Merchandise. Automobile sales accounted for $403.7 million, or close to half of the total retail sales. Crestwood The retail concentration in Crestwood is in and around Crestwood Plaza at Cicero Avenue and Cal Sag Road. The area contains Target, Kohl’s, Menard’s, Best Buy, T.J. Maxx, Office Max, and numerous other stores. Wal-Mart is located nearby. The area has over 800,000 square feet of big box and retail space. Retail sales in Crestwood in 2005 amounted to $370.4 million. The General Merchandise category captured sales of $91.5 million. This was split by at least three major stores; Target, Kohl’s, Kmart, and Wal-Mart. The new Wal-Mart Supercenter will increase sales in Crestwood. Country Club Hills A new Wal-Mart Supercenter has been opened on 167th Street near Crawford Avenue with approximately 200,000 square feet. Calumet City – River Oaks Mall Northeast of Matteson, the largest retail concentration is around the River Oaks Mall at 159th Street and Torrance Avenue in Calumet City. River Oaks contains department stores operated by Marshall Field, Carson’s, Sears, and Penney’s. Again, most major big box stores are located in the vicinity of the mall. The Mall contains over 1,200,000 square feet. Big boxes and other retailers add another 3,000,000 square feet of retail space.
Retail Market Feasibility Study, Lincoln Mall Area, Matteson, Illinois
-53-
PLANNED AND PROPOSED SHOPPING CENTERS Our staff investigated planned and proposed shopping centers and freestanding retailers that may influence the Subject Properties. There are some small shopping centers and freestanding retailers proposed or planned within the delineated Trade Area. They are discussed in the following paragraphs.
A shopping center is proposed in Matteson at Lincoln Highway and Harlem which will have approximately 200,000+ square feet of retail space. No tenants have been announced.
Target is apparently planning to build a new store in Lincoln Mall’s new development area
which will replace their existing store further south on Cicero Avenue.
Wal-Mart is considering a Supercenter in Matteson to replace their existing store. The new store would be south of the Mall on the east side of Cicero Avenue. We have considered this proposal in our analysis.
Menard’s has indicated that they would like a larger store and is apparently considering
developing a new store south of the new Wal-Mart Supercenter.
Penney’s is planning on developing numerous new prototype stores in the Chicago area. We expect them to consider the Matteson or Homewood areas
We have considered all of the above in our analysis. RETAIL EXPENDITURE PATTERNS The analysis thus far has brought into focus the factors which directly and indirectly affect the retail market potential and the attraction of consumer dollars to Lincoln Mall and the surrounding retail concentration, as opposed to competitive complexes. The Trade Area has been delineated and the demographics characteristics of the Trade Area segments have been analyzed. Next, per capita expenditures by retail category have been calculated utilizing the Economic Census of Retail Trade 1997 and 2002, the Economic Census of Accommodations and Foodservice 1997 and 2002, and the Illinois Department of Revenue annual Sales Tax Receipts data by major retail categories for incorporated communities for 2003, 2004, and 2005. Finally, all of the factors which have an impact on the market potential of the Subject Sites have been analyzed including competition, proposed facilities, accessibility, traffic counts, road patterns, retail sales trends, spending patterns, and local development activity. The combined 2002 Economic Census of Retail Trade and Accommodations and Foodservice, assembled by the United States Department of Commerce; Bureau of the Census, are the principal sources of retail sales and foodservice revenue data. The Economic Census is compiled and published every five years. Table 6.3 on the following pages presents the 2002 retail sales data for Cook County, the City of Chicago, and Matteson.
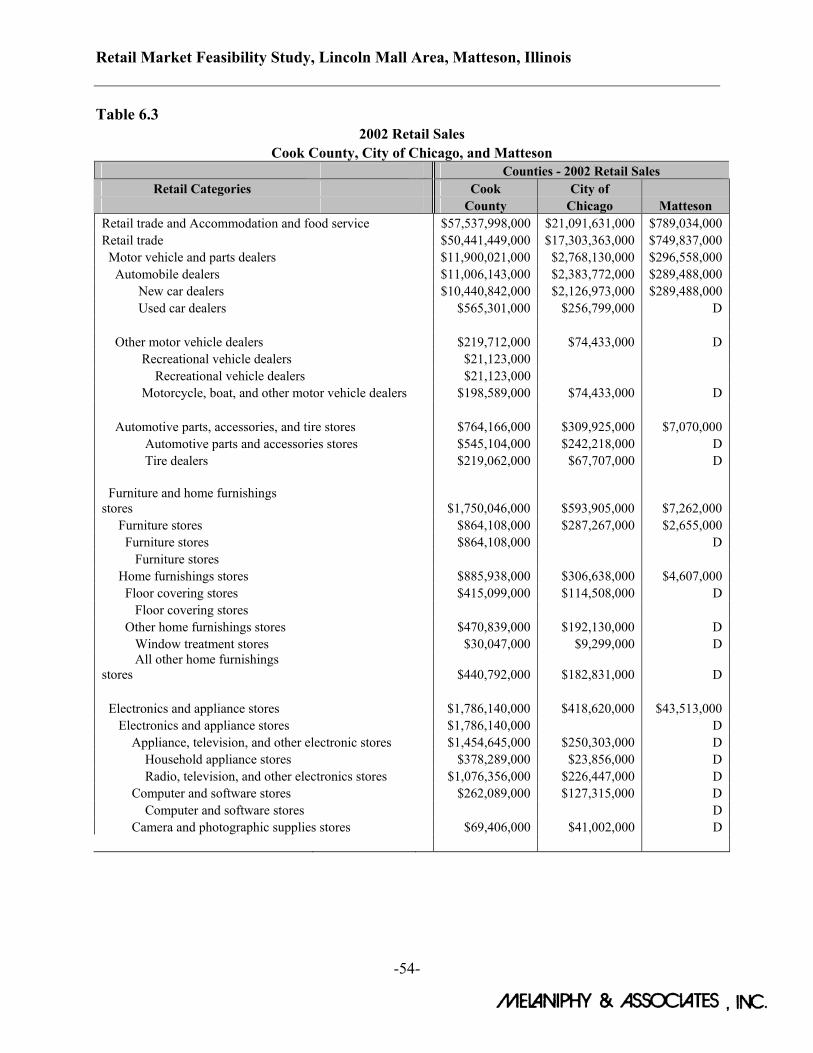
Retail Market Feasibility Study, Lincoln Mall Area, Matteson, Illinois
-54-
Table 6.3 2002 Retail Sales
Cook County, City of Chicago, and Matteson Counties - 2002 Retail Sales
Retail Categories Cook City of County Chicago Matteson Retail trade and Accommodation and food service $57,537,998,000 $21,091,631,000 $789,034,000 Retail trade $50,441,449,000 $17,303,363,000 $749,837,000 Motor vehicle and parts dealers $11,900,021,000 $2,768,130,000 $296,558,000 Automobile dealers $11,006,143,000 $2,383,772,000 $289,488,000 New car dealers $10,440,842,000 $2,126,973,000 $289,488,000 Used car dealers $565,301,000 $256,799,000 D Other motor vehicle dealers $219,712,000 $74,433,000 D Recreational vehicle dealers $21,123,000 Recreational vehicle dealers $21,123,000 Motorcycle, boat, and other motor vehicle dealers $198,589,000 $74,433,000 D Automotive parts, accessories, and tire stores $764,166,000 $309,925,000 $7,070,000 Automotive parts and accessories stores $545,104,000 $242,218,000 D Tire dealers $219,062,000 $67,707,000 D Furniture and home furnishings stores $1,750,046,000 $593,905,000 $7,262,000 Furniture stores $864,108,000 $287,267,000 $2,655,000 Furniture stores $864,108,000 D Furniture stores Home furnishings stores $885,938,000 $306,638,000 $4,607,000 Floor covering stores $415,099,000 $114,508,000 D Floor covering stores Other home furnishings stores $470,839,000 $192,130,000 D Window treatment stores $30,047,000 $9,299,000 D All other home furnishings stores $440,792,000 $182,831,000 D Electronics and appliance stores $1,786,140,000 $418,620,000 $43,513,000 Electronics and appliance stores $1,786,140,000 D Appliance, television, and other electronic stores $1,454,645,000 $250,303,000 D Household appliance stores $378,289,000 $23,856,000 D Radio, television, and other electronics stores $1,076,356,000 $226,447,000 D Computer and software stores $262,089,000 $127,315,000 D Computer and software stores D Camera and photographic supplies stores $69,406,000 $41,002,000 D
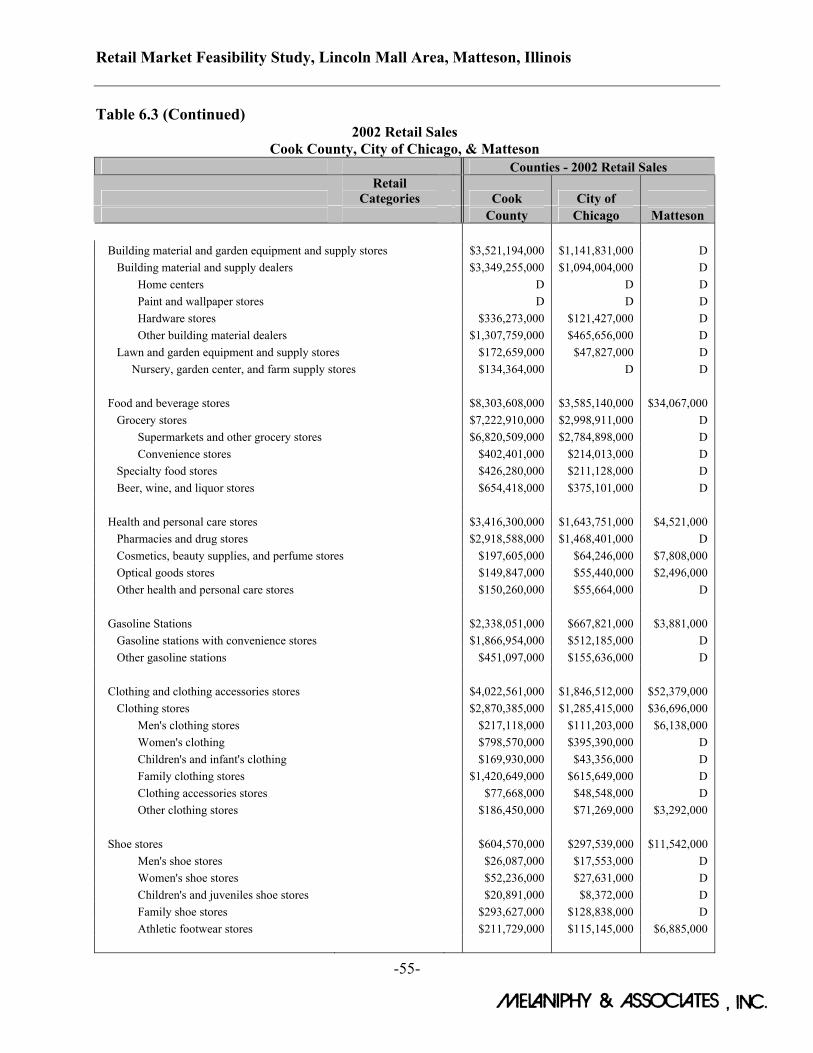
Retail Market Feasibility Study, Lincoln Mall Area, Matteson, Illinois
-55-
Table 6.3 (Continued) 2002 Retail Sales
Cook County, City of Chicago, & Matteson Counties - 2002 Retail Sales
Retail
Categories Cook City of County Chicago Matteson Building material and garden equipment and supply stores $3,521,194,000 $1,141,831,000 D Building material and supply dealers $3,349,255,000 $1,094,004,000 D Home centers D D D Paint and wallpaper stores D D D Hardware stores $336,273,000 $121,427,000 D Other building material dealers $1,307,759,000 $465,656,000 D Lawn and garden equipment and supply stores $172,659,000 $47,827,000 D Nursery, garden center, and farm supply stores $134,364,000 D D Food and beverage stores $8,303,608,000 $3,585,140,000 $34,067,000 Grocery stores $7,222,910,000 $2,998,911,000 D Supermarkets and other grocery stores $6,820,509,000 $2,784,898,000 D Convenience stores $402,401,000 $214,013,000 D Specialty food stores $426,280,000 $211,128,000 D Beer, wine, and liquor stores $654,418,000 $375,101,000 D Health and personal care stores $3,416,300,000 $1,643,751,000 $4,521,000 Pharmacies and drug stores $2,918,588,000 $1,468,401,000 D Cosmetics, beauty supplies, and perfume stores $197,605,000 $64,246,000 $7,808,000 Optical goods stores $149,847,000 $55,440,000 $2,496,000 Other health and personal care stores $150,260,000 $55,664,000 D Gasoline Stations $2,338,051,000 $667,821,000 $3,881,000 Gasoline stations with convenience stores $1,866,954,000 $512,185,000 D Other gasoline stations $451,097,000 $155,636,000 D Clothing and clothing accessories stores $4,022,561,000 $1,846,512,000 $52,379,000 Clothing stores $2,870,385,000 $1,285,415,000 $36,696,000 Men's clothing stores $217,118,000 $111,203,000 $6,138,000 Women's clothing $798,570,000 $395,390,000 D Children's and infant's clothing $169,930,000 $43,356,000 D Family clothing stores $1,420,649,000 $615,649,000 D Clothing accessories stores $77,668,000 $48,548,000 D Other clothing stores $186,450,000 $71,269,000 $3,292,000 Shoe stores $604,570,000 $297,539,000 $11,542,000 Men's shoe stores $26,087,000 $17,553,000 D Women's shoe stores $52,236,000 $27,631,000 D Children's and juveniles shoe stores $20,891,000 $8,372,000 D Family shoe stores $293,627,000 $128,838,000 D Athletic footwear stores $211,729,000 $115,145,000 $6,885,000
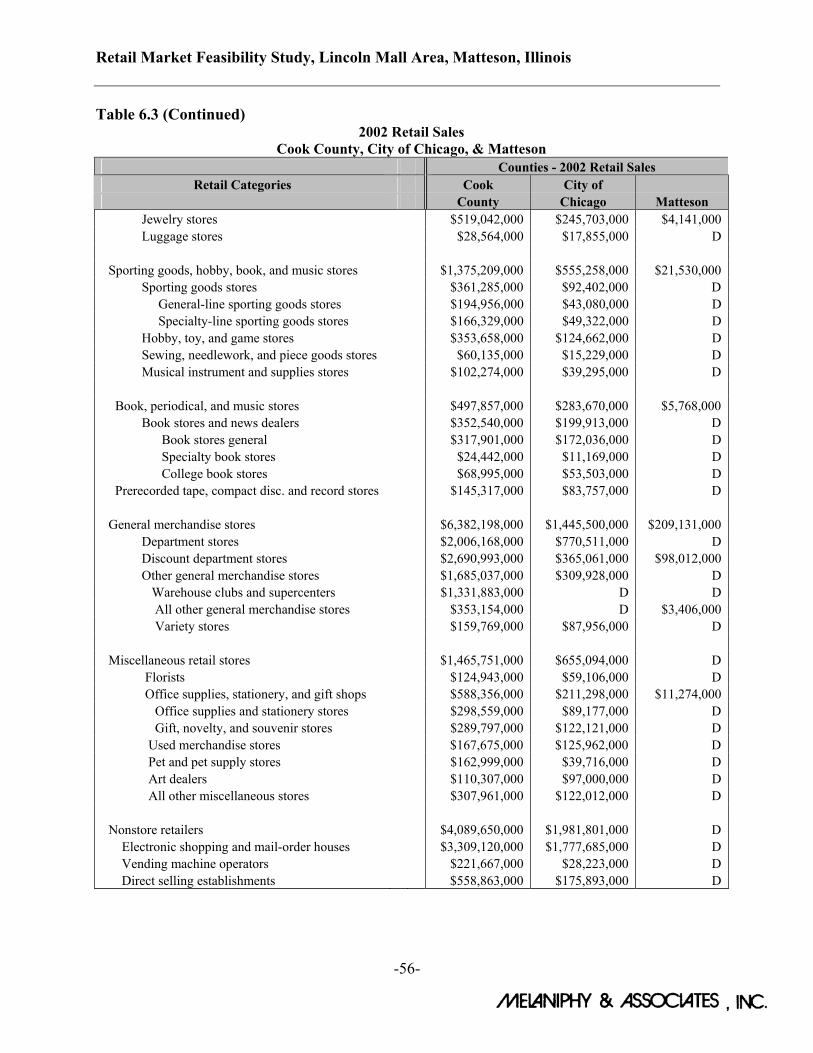
Retail Market Feasibility Study, Lincoln Mall Area, Matteson, Illinois
-56-
Table 6.3 (Continued) 2002 Retail Sales
Cook County, City of Chicago, & Matteson Counties - 2002 Retail Sales
Retail Categories Cook City of County Chicago Matteson Jewelry stores $519,042,000 $245,703,000 $4,141,000 Luggage stores $28,564,000 $17,855,000 D Sporting goods, hobby, book, and music stores $1,375,209,000 $555,258,000 $21,530,000 Sporting goods stores $361,285,000 $92,402,000 D General-line sporting goods stores $194,956,000 $43,080,000 D Specialty-line sporting goods stores $166,329,000 $49,322,000 D Hobby, toy, and game stores $353,658,000 $124,662,000 D Sewing, needlework, and piece goods stores $60,135,000 $15,229,000 D Musical instrument and supplies stores $102,274,000 $39,295,000 D Book, periodical, and music stores $497,857,000 $283,670,000 $5,768,000 Book stores and news dealers $352,540,000 $199,913,000 D Book stores general $317,901,000 $172,036,000 D Specialty book stores $24,442,000 $11,169,000 D College book stores $68,995,000 $53,503,000 D Prerecorded tape, compact disc. and record stores $145,317,000 $83,757,000 D General merchandise stores $6,382,198,000 $1,445,500,000 $209,131,000 Department stores $2,006,168,000 $770,511,000 D Discount department stores $2,690,993,000 $365,061,000 $98,012,000 Other general merchandise stores $1,685,037,000 $309,928,000 D Warehouse clubs and supercenters $1,331,883,000 D D All other general merchandise stores $353,154,000 D $3,406,000 Variety stores $159,769,000 $87,956,000 D Miscellaneous retail stores $1,465,751,000 $655,094,000 D Florists $124,943,000 $59,106,000 D Office supplies, stationery, and gift shops $588,356,000 $211,298,000 $11,274,000 Office supplies and stationery stores $298,559,000 $89,177,000 D Gift, novelty, and souvenir stores $289,797,000 $122,121,000 D Used merchandise stores $167,675,000 $125,962,000 D Pet and pet supply stores $162,999,000 $39,716,000 D Art dealers $110,307,000 $97,000,000 D All other miscellaneous stores $307,961,000 $122,012,000 D Nonstore retailers $4,089,650,000 $1,981,801,000 D Electronic shopping and mail-order houses $3,309,120,000 $1,777,685,000 D Vending machine operators $221,667,000 $28,223,000 D Direct selling establishments $558,863,000 $175,893,000 D
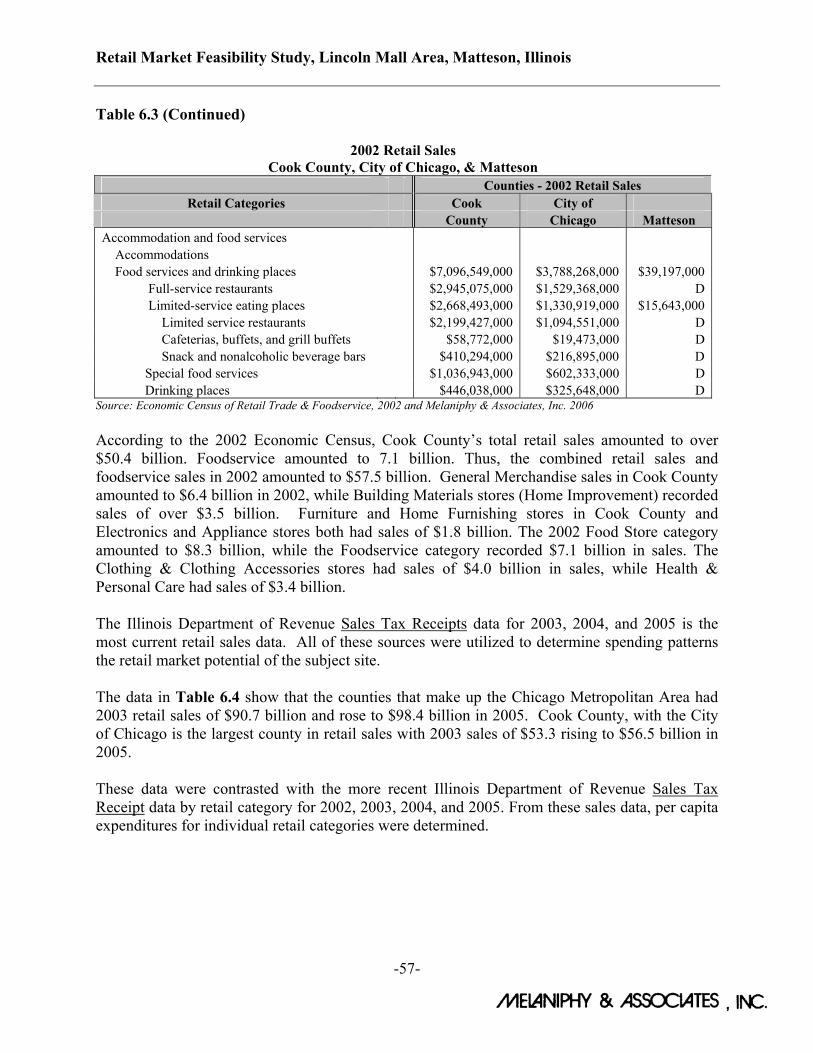
Retail Market Feasibility Study, Lincoln Mall Area, Matteson, Illinois
-57-
Table 6.3 (Continued)
2002 Retail Sales Cook County, City of Chicago, & Matteson
Counties - 2002 Retail Sales Retail Categories Cook City of
County Chicago Matteson Accommodation and food services Accommodations Food services and drinking places $7,096,549,000 $3,788,268,000 $39,197,000 Full-service restaurants $2,945,075,000 $1,529,368,000 D Limited-service eating places $2,668,493,000 $1,330,919,000 $15,643,000 Limited service restaurants $2,199,427,000 $1,094,551,000 D Cafeterias, buffets, and grill buffets $58,772,000 $19,473,000 D Snack and nonalcoholic beverage bars $410,294,000 $216,895,000 D Special food services $1,036,943,000 $602,333,000 D Drinking places $446,038,000 $325,648,000 D
Source: Economic Census of Retail Trade & Foodservice, 2002 and Melaniphy & Associates, Inc. 2006 According to the 2002 Economic Census, Cook County’s total retail sales amounted to over $50.4 billion. Foodservice amounted to 7.1 billion. Thus, the combined retail sales and foodservice sales in 2002 amounted to $57.5 billion. General Merchandise sales in Cook County amounted to $6.4 billion in 2002, while Building Materials stores (Home Improvement) recorded sales of over $3.5 billion. Furniture and Home Furnishing stores in Cook County and Electronics and Appliance stores both had sales of $1.8 billion. The 2002 Food Store category amounted to $8.3 billion, while the Foodservice category recorded $7.1 billion in sales. The Clothing & Clothing Accessories stores had sales of $4.0 billion in sales, while Health & Personal Care had sales of $3.4 billion. The Illinois Department of Revenue Sales Tax Receipts data for 2003, 2004, and 2005 is the most current retail sales data. All of these sources were utilized to determine spending patterns the retail market potential of the subject site. The data in Table 6.4 show that the counties that make up the Chicago Metropolitan Area had 2003 retail sales of $90.7 billion and rose to $98.4 billion in 2005. Cook County, with the City of Chicago is the largest county in retail sales with 2003 sales of $53.3 rising to $56.5 billion in 2005. These data were contrasted with the more recent Illinois Department of Revenue Sales Tax Receipt data by retail category for 2002, 2003, 2004, and 2005. From these sales data, per capita expenditures for individual retail categories were determined.
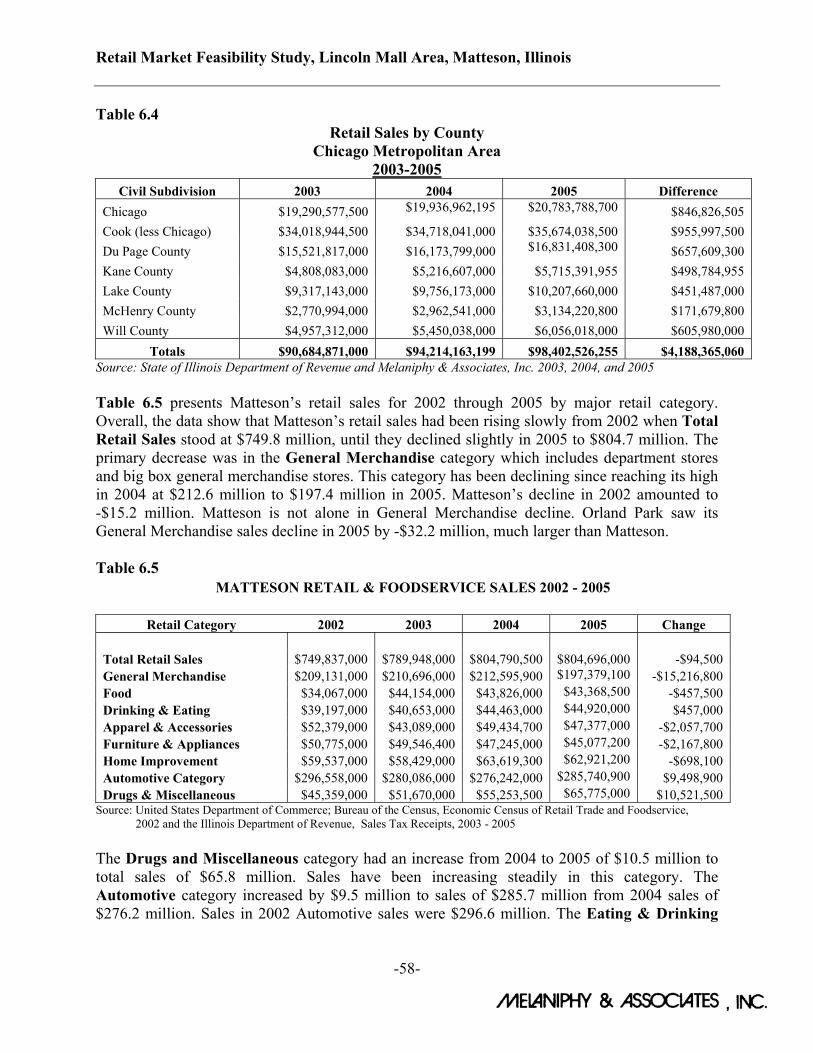
Retail Market Feasibility Study, Lincoln Mall Area, Matteson, Illinois
-58-
Table 6.4 Retail Sales by County
Chicago Metropolitan Area 2003-2005
Civil Subdivision 2003 2004 2005 Difference Chicago $19,290,577,500 $19,936,962,195 $20,783,788,700 $846,826,505 Cook (less Chicago) $34,018,944,500 $34,718,041,000 $35,674,038,500 $955,997,500 Du Page County $15,521,817,000 $16,173,799,000 $16,831,408,300 $657,609,300 Kane County $4,808,083,000 $5,216,607,000 $5,715,391,955 $498,784,955 Lake County $9,317,143,000 $9,756,173,000 $10,207,660,000 $451,487,000 McHenry County $2,770,994,000 $2,962,541,000 $3,134,220,800 $171,679,800 Will County $4,957,312,000 $5,450,038,000 $6,056,018,000 $605,980,000
Totals $90,684,871,000 $94,214,163,199 $98,402,526,255 $4,188,365,060 Source: State of Illinois Department of Revenue and Melaniphy & Associates, Inc. 2003, 2004, and 2005 Table 6.5 presents Matteson’s retail sales for 2002 through 2005 by major retail category. Overall, the data show that Matteson’s retail sales had been rising slowly from 2002 when Total Retail Sales stood at $749.8 million, until they declined slightly in 2005 to $804.7 million. The primary decrease was in the General Merchandise category which includes department stores and big box general merchandise stores. This category has been declining since reaching its high in 2004 at $212.6 million to $197.4 million in 2005. Matteson’s decline in 2002 amounted to -$15.2 million. Matteson is not alone in General Merchandise decline. Orland Park saw its General Merchandise sales decline in 2005 by -$32.2 million, much larger than Matteson. Table 6.5
MATTESON RETAIL & FOODSERVICE SALES 2002 - 2005
Retail Category 2002 2003 2004 2005 Change Total Retail Sales $749,837,000 $789,948,000 $804,790,500 $804,696,000 -$94,500 General Merchandise $209,131,000 $210,696,000 $212,595,900 $197,379,100 -$15,216,800 Food $34,067,000 $44,154,000 $43,826,000 $43,368,500 -$457,500 Drinking & Eating $39,197,000 $40,653,000 $44,463,000 $44,920,000 $457,000 Apparel & Accessories $52,379,000 $43,089,000 $49,434,700 $47,377,000 -$2,057,700 Furniture & Appliances $50,775,000 $49,546,400 $47,245,000 $45,077,200 -$2,167,800 Home Improvement $59,537,000 $58,429,000 $63,619,300 $62,921,200 -$698,100 Automotive Category $296,558,000 $280,086,000 $276,242,000 $285,740,900 $9,498,900 Drugs & Miscellaneous $45,359,000 $51,670,000 $55,253,500 $65,775,000 $10,521,500
Source: United States Department of Commerce; Bureau of the Census, Economic Census of Retail Trade and Foodservice, 2002 and the Illinois Department of Revenue, Sales Tax Receipts, 2003 - 2005 The Drugs and Miscellaneous category had an increase from 2004 to 2005 of $10.5 million to total sales of $65.8 million. Sales have been increasing steadily in this category. The Automotive category increased by $9.5 million to sales of $285.7 million from 2004 sales of $276.2 million. Sales in 2002 Automotive sales were $296.6 million. The Eating & Drinking
Retail Market Feasibility Study, Lincoln Mall Area, Matteson, Illinois
-59-
category saw an increase of almost a half of million dollars from 2004 to 2005. Sales in this category in 2002 amounted to $39.2 million; in 2005 they stood at $44.9 million. In the Food Store category, since 2003, sales have remained fairly constant at between $43 million and $44 million. The Apparel & Accessories category has declined from $59.5 million in 2002 to $47.4 million. Sales in 2004 were $49.4 million. The Furniture & Appliance category has varied from its current level of $45.1 million to a high of $50.1 million in 2002. The Home Improvement category declined slightly in 2005 to $62.9 million from $63.6 million in 2004. We have analyzed the changes in retail sales by retail category for Matteson, the surrounding suburbs, Cook County, and the Chicago Metropolitan Area. Next, it was necessary to forecast these expenditures for the projections years. These forecasts were accomplished several ways. First, household income data were evaluated. Since consumers tend to spend fairly consistent percentages of their household income for specific types of goods and services, household income dynamics were analyzed. The income composition also provided insight into the expenditures within individual retail categories. Next, we computed Per Capita Retail Expenditures by major retail categories for Cook County, the Metropolitan Area, and Matteson for 2005. Finally, we compared expenditures in various segments of the Chicago area to see how the data compared by income variations. Finally, we established per capita expenditures which represent the characteristics of the Matteson Trade Area including income, household size, occupation, spending dynamics, and other factors. Table 6.6 on the following page presents the per capita expenditures by retail category in each segment of the Trade Area for 2006, 2010, and 2015, respectively. The per capita expenditures were then applied to the estimated population within the respective Trade Area Segments to compute the total retail expenditure potential within each segment of the Trade Area. Although many of our judgments are necessarily subjective, they are based upon recognized techniques and methodology, understood and accepted by shopping center developers and retailers across the country. Table 6.7 on Page 61 presents the total retail expenditure potential for 2006, 2010, and 2015 in each individual retail category for the respective Trade Area Segments. Application of the Per Capita Expenditures by major retail category, to the population of each Trade Area segment, provides estimates of retail expenditures. The figures represent the retail expenditure potential by retail categories for which the Subject Area would be competing.
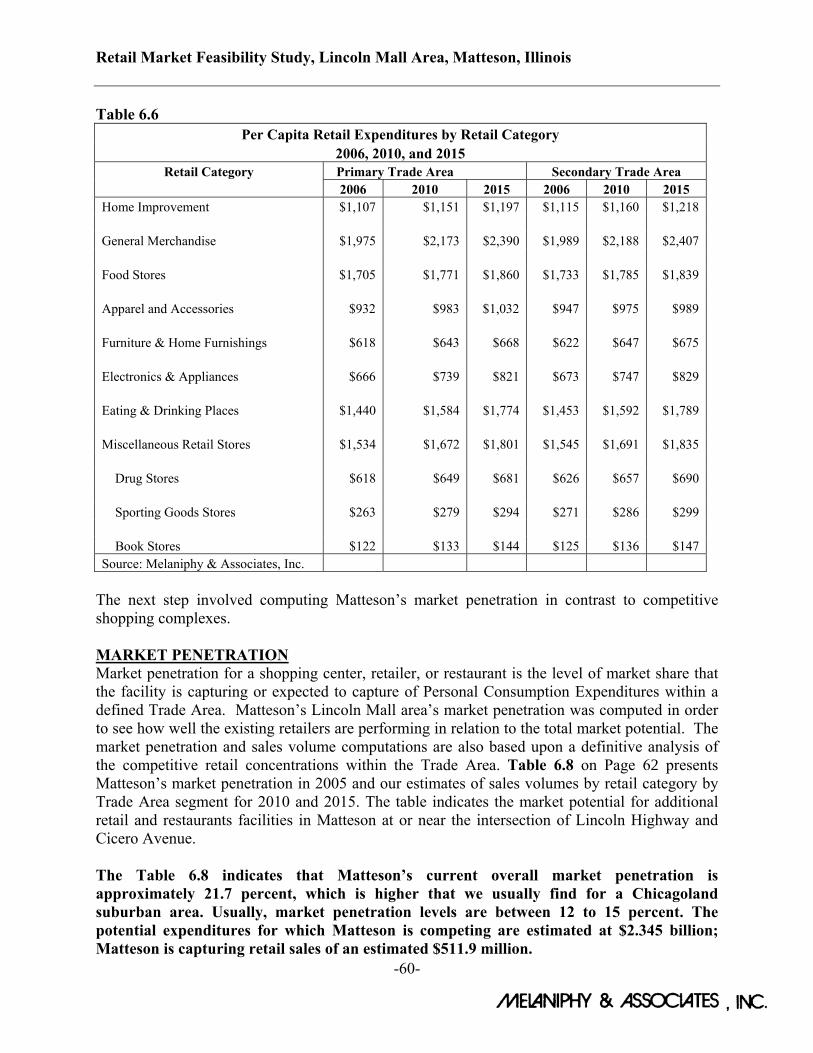
Retail Market Feasibility Study, Lincoln Mall Area, Matteson, Illinois
-60-
Table 6.6 Per Capita Retail Expenditures by Retail Category
2006, 2010, and 2015 Retail Category Primary Trade Area Secondary Trade Area
2006 2010 2015 2006 2010 2015 Home Improvement $1,107 $1,151 $1,197 $1,115 $1,160 $1,218 General Merchandise $1,975 $2,173 $2,390 $1,989 $2,188 $2,407 Food Stores $1,705 $1,771 $1,860 $1,733 $1,785 $1,839 Apparel and Accessories $932 $983 $1,032 $947 $975 $989 Furniture & Home Furnishings $618 $643 $668 $622 $647 $675 Electronics & Appliances $666 $739 $821 $673 $747 $829 Eating & Drinking Places $1,440 $1,584 $1,774 $1,453 $1,592 $1,789 Miscellaneous Retail Stores $1,534 $1,672 $1,801 $1,545 $1,691 $1,835 Drug Stores $618 $649 $681 $626 $657 $690 Sporting Goods Stores $263 $279 $294 $271 $286 $299 Book Stores $122 $133 $144 $125 $136 $147 Source: Melaniphy & Associates, Inc.
The next step involved computing Matteson’s market penetration in contrast to competitive shopping complexes. MARKET PENETRATION Market penetration for a shopping center, retailer, or restaurant is the level of market share that the facility is capturing or expected to capture of Personal Consumption Expenditures within a defined Trade Area. Matteson’s Lincoln Mall area’s market penetration was computed in order to see how well the existing retailers are performing in relation to the total market potential. The market penetration and sales volume computations are also based upon a definitive analysis of the competitive retail concentrations within the Trade Area. Table 6.8 on Page 62 presents Matteson’s market penetration in 2005 and our estimates of sales volumes by retail category by Trade Area segment for 2010 and 2015. The table indicates the market potential for additional retail and restaurants facilities in Matteson at or near the intersection of Lincoln Highway and Cicero Avenue. The Table 6.8 indicates that Matteson’s current overall market penetration is approximately 21.7 percent, which is higher that we usually find for a Chicagoland suburban area. Usually, market penetration levels are between 12 to 15 percent. The potential expenditures for which Matteson is competing are estimated at $2.345 billion; Matteson is capturing retail sales of an estimated $511.9 million.
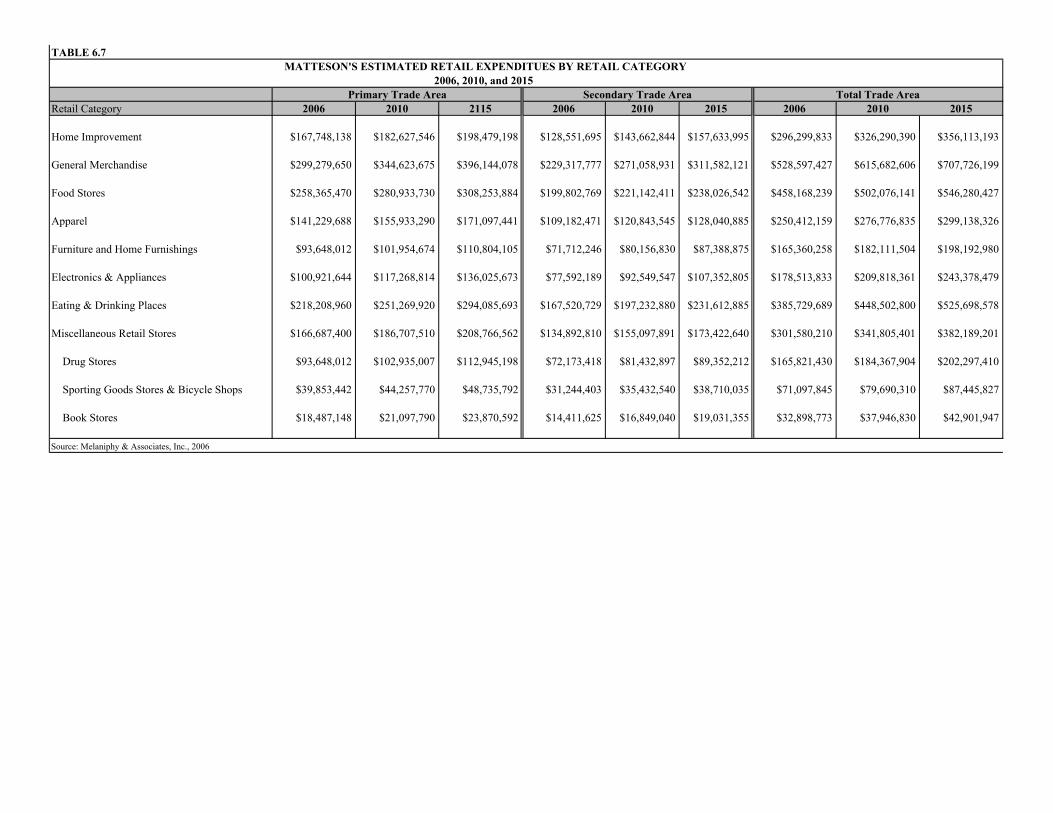
TABLE 6.7MATTESON'S ESTIMATED RETAIL EXPENDITUES BY RETAIL CATEGORY
2006, 2010, and 2015Primary Trade Area Secondary Trade Area Total Trade Area
Retail Category 2006 2010 2115 2006 2010 2015 2006 2010 2015
Home Improvement $167,748,138 $182,627,546 $198,479,198 $128,551,695 $143,662,844 $157,633,995 $296,299,833 $326,290,390 $356,113,193
General Merchandise $299,279,650 $344,623,675 $396,144,078 $229,317,777 $271,058,931 $311,582,121 $528,597,427 $615,682,606 $707,726,199
Food Stores $258,365,470 $280,933,730 $308,253,884 $199,802,769 $221,142,411 $238,026,542 $458,168,239 $502,076,141 $546,280,427
Apparel $141,229,688 $155,933,290 $171,097,441 $109,182,471 $120,843,545 $128,040,885 $250,412,159 $276,776,835 $299,138,326
Furniture and Home Furnishings $93,648,012 $101,954,674 $110,804,105 $71,712,246 $80,156,830 $87,388,875 $165,360,258 $182,111,504 $198,192,980
Electronics & Appliances $100,921,644 $117,268,814 $136,025,673 $77,592,189 $92,549,547 $107,352,805 $178,513,833 $209,818,361 $243,378,479
Eating & Drinking Places $218,208,960 $251,269,920 $294,085,693 $167,520,729 $197,232,880 $231,612,885 $385,729,689 $448,502,800 $525,698,578
Miscellaneous Retail Stores $166,687,400 $186,707,510 $208,766,562 $134,892,810 $155,097,891 $173,422,640 $301,580,210 $341,805,401 $382,189,201
Drug Stores $93,648,012 $102,935,007 $112,945,198 $72,173,418 $81,432,897 $89,352,212 $165,821,430 $184,367,904 $202,297,410
Sporting Goods Stores & Bicycle Shops $39,853,442 $44,257,770 $48,735,792 $31,244,403 $35,432,540 $38,710,035 $71,097,845 $79,690,310 $87,445,827
Book Stores $18,487,148 $21,097,790 $23,870,592 $14,411,625 $16,849,040 $19,031,355 $32,898,773 $37,946,830 $42,901,947
Source: Melaniphy & Associates, Inc., 2006
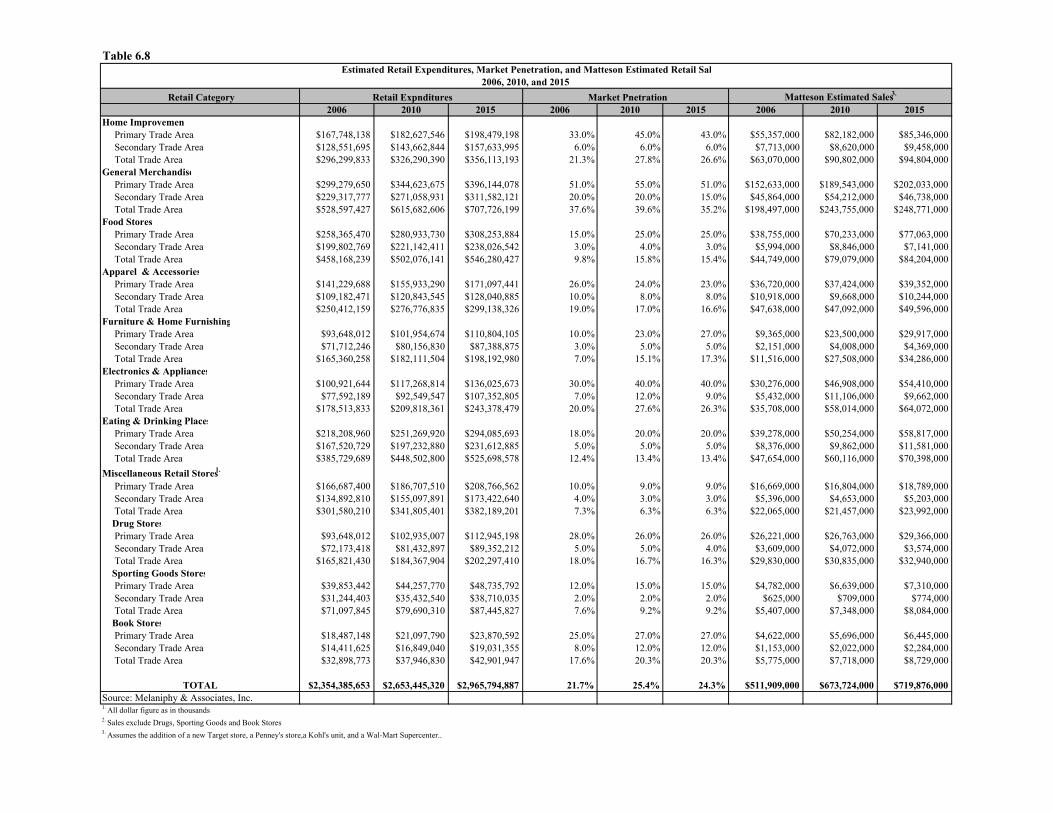
Table 6.8Estimated Retail Expenditures, Market Penetration, and Matteson Estimated Retail Sal
2006, 2010, and 2015Retail Category Retail Expnditures Market Pnetration Matteson Estimated Sales3.
2006 2010 2015 2006 2010 2015 2006 2010 2015Home Improvemen Primary Trade Area $167,748,138 $182,627,546 $198,479,198 33.0% 45.0% 43.0% $55,357,000 $82,182,000 $85,346,000 Secondary Trade Area $128,551,695 $143,662,844 $157,633,995 6.0% 6.0% 6.0% $7,713,000 $8,620,000 $9,458,000 Total Trade Area $296,299,833 $326,290,390 $356,113,193 21.3% 27.8% 26.6% $63,070,000 $90,802,000 $94,804,000General Merchandise Primary Trade Area $299,279,650 $344,623,675 $396,144,078 51.0% 55.0% 51.0% $152,633,000 $189,543,000 $202,033,000 Secondary Trade Area $229,317,777 $271,058,931 $311,582,121 20.0% 20.0% 15.0% $45,864,000 $54,212,000 $46,738,000 Total Trade Area $528,597,427 $615,682,606 $707,726,199 37.6% 39.6% 35.2% $198,497,000 $243,755,000 $248,771,000Food Stores Primary Trade Area $258,365,470 $280,933,730 $308,253,884 15.0% 25.0% 25.0% $38,755,000 $70,233,000 $77,063,000 Secondary Trade Area $199,802,769 $221,142,411 $238,026,542 3.0% 4.0% 3.0% $5,994,000 $8,846,000 $7,141,000 Total Trade Area $458,168,239 $502,076,141 $546,280,427 9.8% 15.8% 15.4% $44,749,000 $79,079,000 $84,204,000Apparel & Accessories Primary Trade Area $141,229,688 $155,933,290 $171,097,441 26.0% 24.0% 23.0% $36,720,000 $37,424,000 $39,352,000 Secondary Trade Area $109,182,471 $120,843,545 $128,040,885 10.0% 8.0% 8.0% $10,918,000 $9,668,000 $10,244,000 Total Trade Area $250,412,159 $276,776,835 $299,138,326 19.0% 17.0% 16.6% $47,638,000 $47,092,000 $49,596,000Furniture & Home Furnishing Primary Trade Area $93,648,012 $101,954,674 $110,804,105 10.0% 23.0% 27.0% $9,365,000 $23,500,000 $29,917,000 Secondary Trade Area $71,712,246 $80,156,830 $87,388,875 3.0% 5.0% 5.0% $2,151,000 $4,008,000 $4,369,000 Total Trade Area $165,360,258 $182,111,504 $198,192,980 7.0% 15.1% 17.3% $11,516,000 $27,508,000 $34,286,000Electronics & Appliances Primary Trade Area $100,921,644 $117,268,814 $136,025,673 30.0% 40.0% 40.0% $30,276,000 $46,908,000 $54,410,000 Secondary Trade Area $77,592,189 $92,549,547 $107,352,805 7.0% 12.0% 9.0% $5,432,000 $11,106,000 $9,662,000 Total Trade Area $178,513,833 $209,818,361 $243,378,479 20.0% 27.6% 26.3% $35,708,000 $58,014,000 $64,072,000Eating & Drinking Places Primary Trade Area $218,208,960 $251,269,920 $294,085,693 18.0% 20.0% 20.0% $39,278,000 $50,254,000 $58,817,000 Secondary Trade Area $167,520,729 $197,232,880 $231,612,885 5.0% 5.0% 5.0% $8,376,000 $9,862,000 $11,581,000 Total Trade Area $385,729,689 $448,502,800 $525,698,578 12.4% 13.4% 13.4% $47,654,000 $60,116,000 $70,398,000Miscellaneous Retail Stores1. Primary Trade Area $166,687,400 $186,707,510 $208,766,562 10.0% 9.0% 9.0% $16,669,000 $16,804,000 $18,789,000 Secondary Trade Area $134,892,810 $155,097,891 $173,422,640 4.0% 3.0% 3.0% $5,396,000 $4,653,000 $5,203,000 Total Trade Area $301,580,210 $341,805,401 $382,189,201 7.3% 6.3% 6.3% $22,065,000 $21,457,000 $23,992,000 Drug Stores Primary Trade Area $93,648,012 $102,935,007 $112,945,198 28.0% 26.0% 26.0% $26,221,000 $26,763,000 $29,366,000 Secondary Trade Area $72,173,418 $81,432,897 $89,352,212 5.0% 5.0% 4.0% $3,609,000 $4,072,000 $3,574,000 Total Trade Area $165,821,430 $184,367,904 $202,297,410 18.0% 16.7% 16.3% $29,830,000 $30,835,000 $32,940,000 Sporting Goods Stores Primary Trade Area $39,853,442 $44,257,770 $48,735,792 12.0% 15.0% 15.0% $4,782,000 $6,639,000 $7,310,000 Secondary Trade Area $31,244,403 $35,432,540 $38,710,035 2.0% 2.0% 2.0% $625,000 $709,000 $774,000 Total Trade Area $71,097,845 $79,690,310 $87,445,827 7.6% 9.2% 9.2% $5,407,000 $7,348,000 $8,084,000 Book Stores Primary Trade Area $18,487,148 $21,097,790 $23,870,592 25.0% 27.0% 27.0% $4,622,000 $5,696,000 $6,445,000 Secondary Trade Area $14,411,625 $16,849,040 $19,031,355 8.0% 12.0% 12.0% $1,153,000 $2,022,000 $2,284,000 Total Trade Area $32,898,773 $37,946,830 $42,901,947 17.6% 20.3% 20.3% $5,775,000 $7,718,000 $8,729,000
TOTAL $2,354,385,653 $2,653,445,320 $2,965,794,887 21.7% 25.4% 24.3% $511,909,000 $673,724,000 $719,876,000Source: Melaniphy & Associates, Inc.1. All dollar figure as in thousands2. Sales exclude Drugs, Sporting Goods and Book Stores 3. Assumes the addition of a new Target store, a Penney's store,a Kohl's unit, and a Wal-Mart Supercenter..
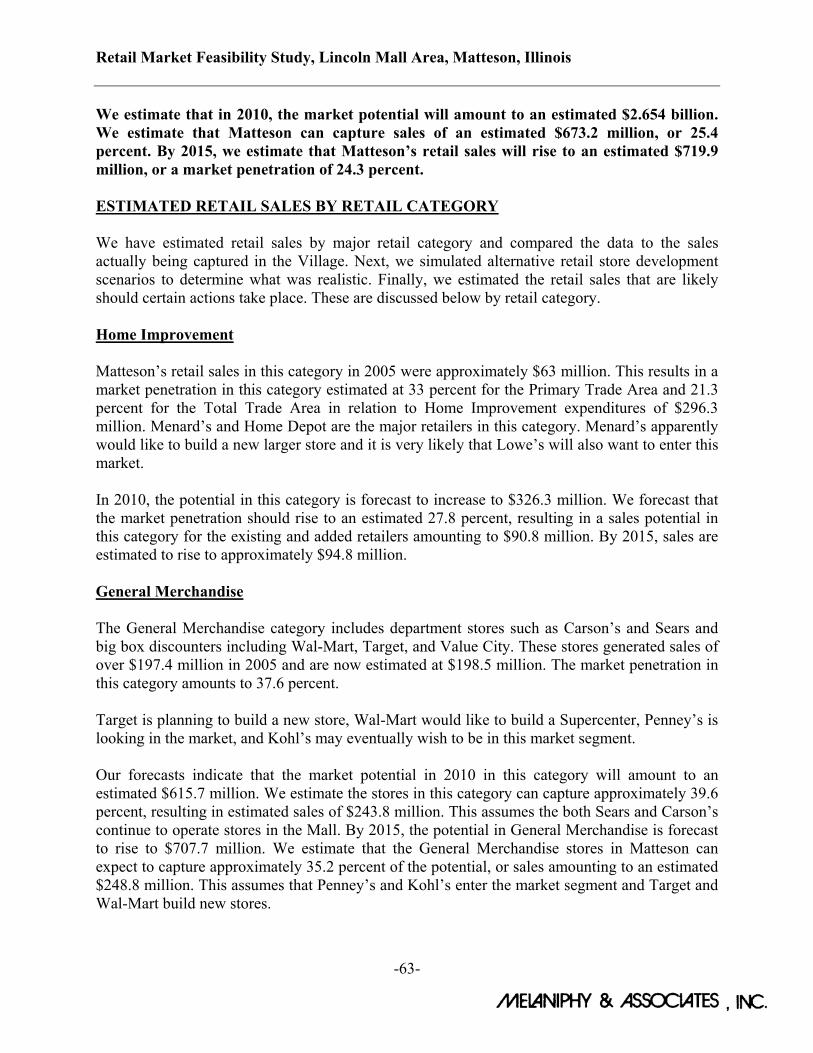
Retail Market Feasibility Study, Lincoln Mall Area, Matteson, Illinois
-63-
We estimate that in 2010, the market potential will amount to an estimated $2.654 billion. We estimate that Matteson can capture sales of an estimated $673.2 million, or 25.4 percent. By 2015, we estimate that Matteson’s retail sales will rise to an estimated $719.9 million, or a market penetration of 24.3 percent. ESTIMATED RETAIL SALES BY RETAIL CATEGORY We have estimated retail sales by major retail category and compared the data to the sales actually being captured in the Village. Next, we simulated alternative retail store development scenarios to determine what was realistic. Finally, we estimated the retail sales that are likely should certain actions take place. These are discussed below by retail category. Home Improvement Matteson’s retail sales in this category in 2005 were approximately $63 million. This results in a market penetration in this category estimated at 33 percent for the Primary Trade Area and 21.3 percent for the Total Trade Area in relation to Home Improvement expenditures of $296.3 million. Menard’s and Home Depot are the major retailers in this category. Menard’s apparently would like to build a new larger store and it is very likely that Lowe’s will also want to enter this market. In 2010, the potential in this category is forecast to increase to $326.3 million. We forecast that the market penetration should rise to an estimated 27.8 percent, resulting in a sales potential in this category for the existing and added retailers amounting to $90.8 million. By 2015, sales are estimated to rise to approximately $94.8 million. General Merchandise The General Merchandise category includes department stores such as Carson’s and Sears and big box discounters including Wal-Mart, Target, and Value City. These stores generated sales of over $197.4 million in 2005 and are now estimated at $198.5 million. The market penetration in this category amounts to 37.6 percent. Target is planning to build a new store, Wal-Mart would like to build a Supercenter, Penney’s is looking in the market, and Kohl’s may eventually wish to be in this market segment. Our forecasts indicate that the market potential in 2010 in this category will amount to an estimated $615.7 million. We estimate the stores in this category can capture approximately 39.6 percent, resulting in estimated sales of $243.8 million. This assumes the both Sears and Carson’s continue to operate stores in the Mall. By 2015, the potential in General Merchandise is forecast to rise to $707.7 million. We estimate that the General Merchandise stores in Matteson can expect to capture approximately 35.2 percent of the potential, or sales amounting to an estimated $248.8 million. This assumes that Penney’s and Kohl’s enter the market segment and Target and Wal-Mart build new stores.
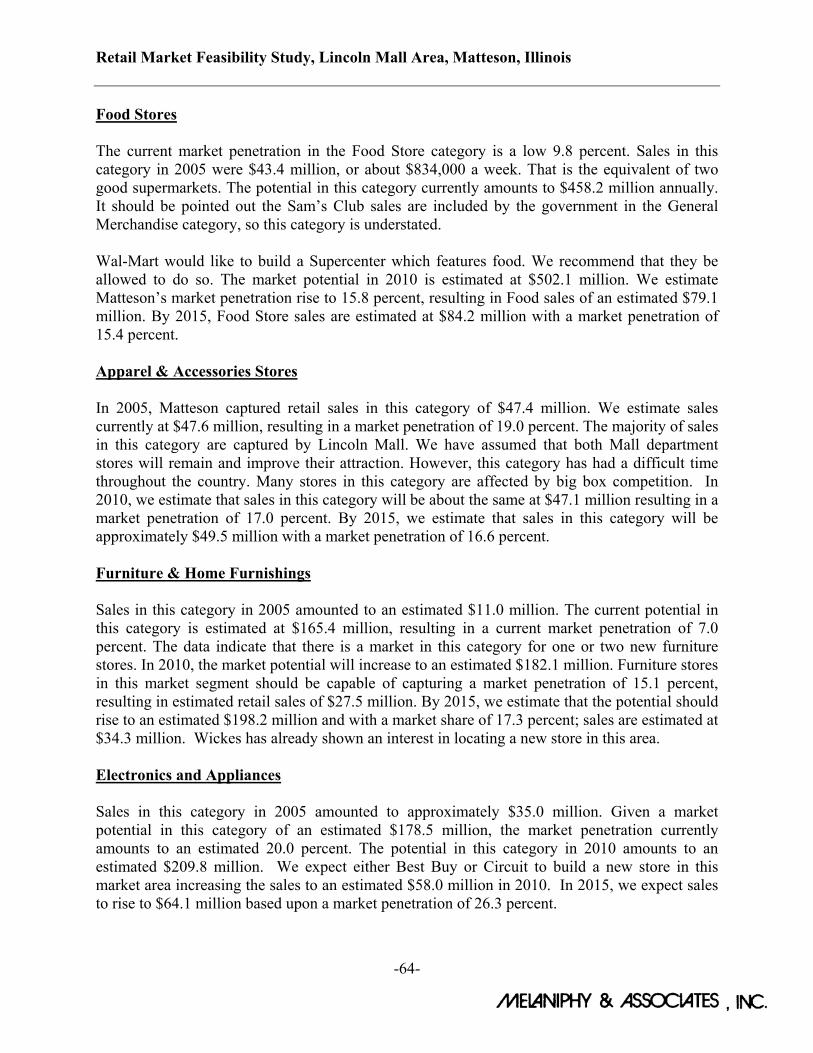
Retail Market Feasibility Study, Lincoln Mall Area, Matteson, Illinois
-64-
Food Stores The current market penetration in the Food Store category is a low 9.8 percent. Sales in this category in 2005 were $43.4 million, or about $834,000 a week. That is the equivalent of two good supermarkets. The potential in this category currently amounts to $458.2 million annually. It should be pointed out the Sam’s Club sales are included by the government in the General Merchandise category, so this category is understated. Wal-Mart would like to build a Supercenter which features food. We recommend that they be allowed to do so. The market potential in 2010 is estimated at $502.1 million. We estimate Matteson’s market penetration rise to 15.8 percent, resulting in Food sales of an estimated $79.1 million. By 2015, Food Store sales are estimated at $84.2 million with a market penetration of 15.4 percent. Apparel & Accessories Stores In 2005, Matteson captured retail sales in this category of $47.4 million. We estimate sales currently at $47.6 million, resulting in a market penetration of 19.0 percent. The majority of sales in this category are captured by Lincoln Mall. We have assumed that both Mall department stores will remain and improve their attraction. However, this category has had a difficult time throughout the country. Many stores in this category are affected by big box competition. In 2010, we estimate that sales in this category will be about the same at $47.1 million resulting in a market penetration of 17.0 percent. By 2015, we estimate that sales in this category will be approximately $49.5 million with a market penetration of 16.6 percent. Furniture & Home Furnishings Sales in this category in 2005 amounted to an estimated $11.0 million. The current potential in this category is estimated at $165.4 million, resulting in a current market penetration of 7.0 percent. The data indicate that there is a market in this category for one or two new furniture stores. In 2010, the market potential will increase to an estimated $182.1 million. Furniture stores in this market segment should be capable of capturing a market penetration of 15.1 percent, resulting in estimated retail sales of $27.5 million. By 2015, we estimate that the potential should rise to an estimated $198.2 million and with a market share of 17.3 percent; sales are estimated at $34.3 million. Wickes has already shown an interest in locating a new store in this area. Electronics and Appliances Sales in this category in 2005 amounted to approximately $35.0 million. Given a market potential in this category of an estimated $178.5 million, the market penetration currently amounts to an estimated 20.0 percent. The potential in this category in 2010 amounts to an estimated $209.8 million. We expect either Best Buy or Circuit to build a new store in this market area increasing the sales to an estimated $58.0 million in 2010. In 2015, we expect sales to rise to $64.1 million based upon a market penetration of 26.3 percent.
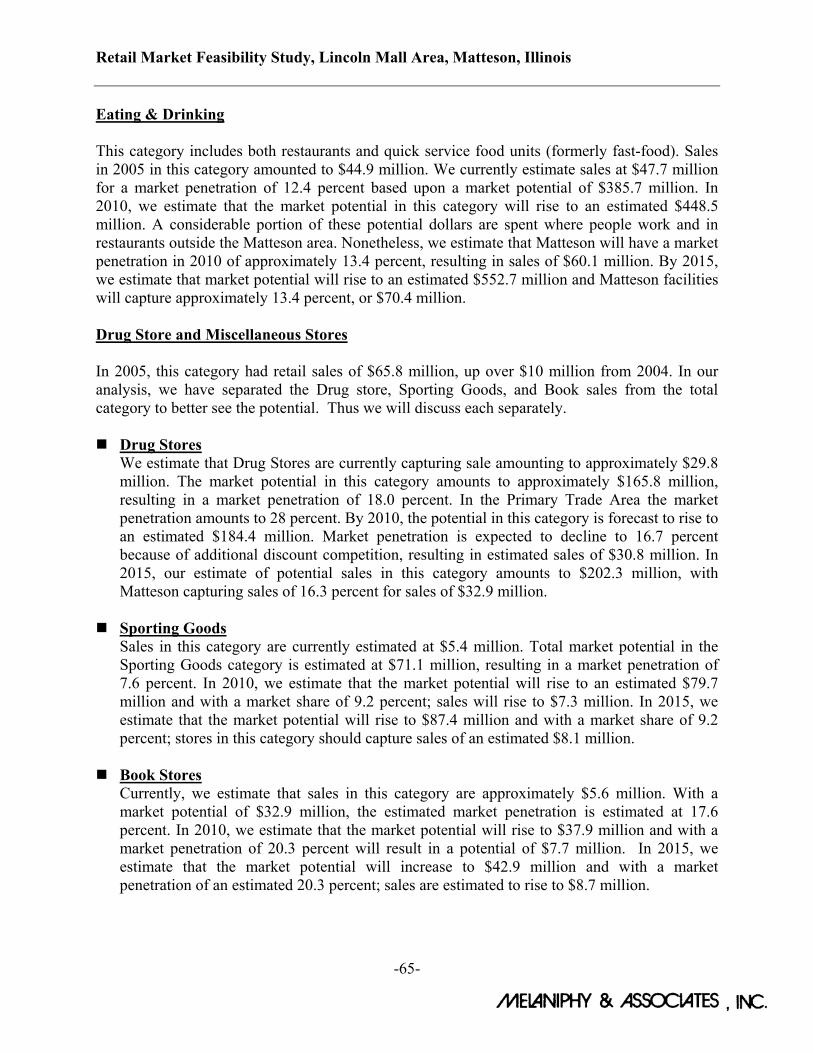
Retail Market Feasibility Study, Lincoln Mall Area, Matteson, Illinois
-65-
Eating & Drinking This category includes both restaurants and quick service food units (formerly fast-food). Sales in 2005 in this category amounted to $44.9 million. We currently estimate sales at $47.7 million for a market penetration of 12.4 percent based upon a market potential of $385.7 million. In 2010, we estimate that the market potential in this category will rise to an estimated $448.5 million. A considerable portion of these potential dollars are spent where people work and in restaurants outside the Matteson area. Nonetheless, we estimate that Matteson will have a market penetration in 2010 of approximately 13.4 percent, resulting in sales of $60.1 million. By 2015, we estimate that market potential will rise to an estimated $552.7 million and Matteson facilities will capture approximately 13.4 percent, or $70.4 million. Drug Store and Miscellaneous Stores In 2005, this category had retail sales of $65.8 million, up over $10 million from 2004. In our analysis, we have separated the Drug store, Sporting Goods, and Book sales from the total category to better see the potential. Thus we will discuss each separately.
Drug Stores We estimate that Drug Stores are currently capturing sale amounting to approximately $29.8 million. The market potential in this category amounts to approximately $165.8 million, resulting in a market penetration of 18.0 percent. In the Primary Trade Area the market penetration amounts to 28 percent. By 2010, the potential in this category is forecast to rise to an estimated $184.4 million. Market penetration is expected to decline to 16.7 percent because of additional discount competition, resulting in estimated sales of $30.8 million. In 2015, our estimate of potential sales in this category amounts to $202.3 million, with Matteson capturing sales of 16.3 percent for sales of $32.9 million.
Sporting Goods Sales in this category are currently estimated at $5.4 million. Total market potential in the Sporting Goods category is estimated at $71.1 million, resulting in a market penetration of 7.6 percent. In 2010, we estimate that the market potential will rise to an estimated $79.7 million and with a market share of 9.2 percent; sales will rise to $7.3 million. In 2015, we estimate that the market potential will rise to $87.4 million and with a market share of 9.2 percent; stores in this category should capture sales of an estimated $8.1 million.
Book Stores Currently, we estimate that sales in this category are approximately $5.6 million. With a market potential of $32.9 million, the estimated market penetration is estimated at 17.6 percent. In 2010, we estimate that the market potential will rise to $37.9 million and with a market penetration of 20.3 percent will result in a potential of $7.7 million. In 2015, we estimate that the market potential will increase to $42.9 million and with a market penetration of an estimated 20.3 percent; sales are estimated to rise to $8.7 million.
Retail Market Feasibility Study, Lincoln Mall Area, Matteson, Illinois
-66-
Miscellaneous Retail Stores Sales in this category are currently estimated at $32.1 million of the potential of $301.6 million, resulting in a market penetration of 7.3 percent. By 2010, we estimate the market penetration will decline to approximately 6.3 percent because of big box competition, but potential will rise to $341.8 million because of growth and rising income. Thus, sales in this category are estimated at $21.5 million. By 2015, market potential is forecast to an estimated $382.2 million, resulting in estimated sales of $24.0 million with a market penetration of 6.3 percent.
Prospective Major Retailers We have evaluated the market potential and the opportunities for retailers not currently in the Matteson portion of the Chicago Metropolitan Area. Listed below are a suggest list of potential retailers. Barnes & Noble Costco DSW Shoes Ashley Furniture Kohl’s Lowe’s Home Improvement Penney’s new free-standing stores Wickes Furniture Woodman’s Warehouse Foods Wal-Mart Supercenter Lifestyle Tenants in Lifestyle Centers in the Chicago Area who are not in Lincoln Mall Lincoln Mall has contacted many of these retailers in an attempt to secure them for the Mall. Usually it takes three interested retailers or restaurants at the same time to get the attention of others. We encourage repeated attempts to obtain some lifestyle tenants. It will be necessary to create and environment that appeals to their objectives. Redevelopment of the former department store at the east end of the Mall into a lifestyle component featuring lifestyle retailers, restaurants, cinema, and entertainment segment would have a positive impact upon the Mall. Some of the lifestyle tenants normally found in lifestyle centers are as follows.
Abercrombie & Fitch American Eagle Outfitters Ann Taylor and Ann Taylor Loft Anthropologie April Cornell Banana Republic Barnes and Noble Bombay & Bombay Kids Build-A-Bear
Retail Market Feasibility Study, Lincoln Mall Area, Matteson, Illinois
-67-
Lifestyle Tenants (Continued)
Chico’s Coach Coldwater Creek Crate & Barrel Eddie Bauer Gap, Baby Gap, Gap Kids Dick’s Sporting Goods H & M Hollister Co. Hot Topic’s J Crew Jos. A. Bank Pottery Barn and Pottery Barn Kid Restoration Hardware Smith & Hawken Steve Madden Talbot's, Talbot's Petites, Talbot's Woman Tommy Bahama Trader Joe’s Williams-Sonoma Yankee Candle Company Z Gallerie Cinema’s
Lifestyle Restaurants
The Cheesecake Factory Brio Tuscan Grille P.F. Chang’s China Bistro California Pizza Kitchen Claddagh Irish Pub Cold Stone Creamery Noodles & Company Corner Bakery Café Big Bowl Asian Kitchen Maggiano’s Little Italy Potbelly Sandwich Works Romano’s Macaroni Grill Rockfish Seafood Grill Bar Louis Max & Irma’s
Retail Market Feasibility Study, Lincoln Mall Area, Matteson, Illinois
-68-
Matteson’s Shopping Centers The following is a list of Matteson area shopping centers located principally on Lincoln Highway and Cicero Avenue. They vary in size and condition. Most have some vacant smaller stores. Below is a brief discussion of centers in Matteson other than Lincoln Mall.
Matteson Marketplace is located on the northwest corner of Lincoln Highway and Cicero Avenue. The center contains approximately 157,885 square feet. Tenants include Border’s Books, Sportmart, Linens ‘N Things, Marshalls, Mattress World, Harris Bank, Panera Bread Company, and others.
Matteson Towncenter is located in the southwest quadrant of Cicero Avenue and Lincoln
Highway containing 229,041 square feet. The shopping center currently contains Pets Mart, Office Max, Fashion Bug, Old Country Buffet and others. Toys R Us is a separate property, as is Applebee’s and Fuddruckers. A site fronting on Cicero Avenue at the center’s traffic light is being readied for development. The shopping center owner is preparing a redevelopment plan for the shopping center which includes a realigned internal roadway. When complete, it will be submitted to the Village. We encourage Village assistance for this strategic location at the Interstate 57, which is the Matteson Gateway.
Century Tile Plaza, located on the east side of Cicero Avenue at 20909 S. Cicero Avenue,
contains approximately 49,600 square feet. The primary tenants are Century Tile and medical offices. The vacancies are small store spaces which today are difficult to lease. The owners current focus should be toward service stores and small offices. The supply of small retailers is limited and most are they are more oriented toward Lincoln Highway. Also, traffic northbound on Cicero Avenue north of Lincoln Highway is often oriented toward Home Depot. Home Depot is very male oriented, and thus, retail stores and service shops that are more men oriented should be sought our. Furthermore, northbound shoppers who are not destined for Home Depot are leaving the shopping area. Service oriented shops that can be on the back-side of a shopping trip should be considered.
Liberty Plaza is located at 4555 Lincoln Highway and contains approximately 64,600
square feet. The center fronts on the south side of Lincoln Highway in front of the Mall. We have been told by Ownership that Liberty Plaza has access to the Mall parking lot. Chernin’s Shoes is the principal retail generator. Ownership has an approximately 22,500 square foot site for development. This is a difficult size for individual retailers and will probably necessitate dividing the space for two or more users. The expansion of Wal-Mart and Menards and the relocation of Target, as well as other retail change should have a positive affect upon this shopping center. Moreover, ownership is focused upon addressing the vacancy and development opportunity.
Matteson Plaza, located in the southwest quadrant of Lincoln Highway and Governor’s
Highway at 4243 Lincoln Highway, contains approximately 280,000 square feet. Major tenants include Dominick’s Finer Foods, Michaels, and Value City Department Store. The center was adversely affected following the Safeway’s acquisition of Dominick’s. New merchandising policies were not received well by the consumer. Value City has not provided
Retail Market Feasibility Study, Lincoln Mall Area, Matteson, Illinois
-69-
the customer generation expected. They are probably being negatively affected by Wal-Mart. There are considerable vacancies in the center. Ownership needs to focus on smaller box stores and service-oriented stores. It will take some time to fill the vacant spaces because of the limited number of retailers seeking space and the large number of vacant smaller store spaces.
Centel Plaza, located on Lincoln Highway at 4331 W. 211th Street, contains approximately
23,000 square feet. The principal tenant is Hancock Fabricas. There are approximately 9,000 square feet vacant. As with many of the other centers, filling the small spaces is difficult. The market is primarily for service uses and some small retailers who are not competing directly with the big box retailers. Furthermore, many small centers are avoided because of difficult access. Finally, the vacant former Builder’s Square has been an eyesore. It is our understanding that there may be a buyer and user for the Builder’s Square building. If so, it would have a positive impact upon this area and this center.
The Marketplace Plaza is located on the north side of Lincoln Highway at 4200 West 211th
Street and contains approximately 309,800 square feet. Principal tenants include Cub Foods, Burlington Coat Factory, A. J. Wright, Aronson’s Furniture, and others. This center has had some retail turnover even though that it has some generative retailers. This is a reflection of the excessive amount of vacant small retail space in Matteson. The market for small spaces is overbuilt. Nonetheless, the amount of traffic on Lincoln Highway will continue to increase and offer opportunities for other retailers and service stores.
Lincoln Square shopping center is located at 4431 W. 211th Street in Matteson and contains
approximately 25,000 square feet. The largest store of approximately 8,000 square feet is currently vacant. Pepe’s Mexican Restaurant is the second largest store. The are other small store vacancies. Here again, the market is producing a limited number of small store retail and service tenants. The focus should be on service and foodservice. That is where the most possibilities will occur.
Rose Plaza is located at 4700 W. 211th in Matteson and contains approximately 25,000
square feet with no apparent vacancies. Should vacancies occur, the focus should be toward retail and service.
The Former Builder’s Square on the north side of Lincoln Highway has remained vacant
for several years. The unit contains approximately 90,000 square feet and approximately 450 parking spaces. One of the problems of this property is access. The site does not have a traffic light making it difficult to get out of the property. Also, because of the Bridge over the Creek/Retention Area at the front of the property, entry is steep, making it more difficult to enter and exit the property. It is our understanding that a user has expressed an interest in the property. The Village should encourage the redevelopment of the property.

ADDENDA
INTRODUCTION TO MELANIPHY & ASSOCIATES, INC. ____________________________________________________________________________ Melaniphy & Associates, Inc. is a firm of real estate counselors, site selection specialists, market analysts, retail consultants, and international investment advisors who practice their specialties throughout the world. Members of the firm, evaluate both problems and opportunities involving urban and suburban development and redevelopment. Since its beginning in 1971, the company has successfully advised thousands of national and international clients in both the private and public sectors regarding solutions to their individual needs. In the private sector, the firm's activities include market and locational feasibility studies, retail store and restaurant development strategies, revenue potential analysis, market development strategies, locational criteria, prioritization, site selection, long range planning, redevelopment alternatives, and financial analysis. Clients include: major retailers, restaurants, supermarkets, fast food chains, shopping centers owners and developers, manufacturing companies, casino’s, convenience stores, family entertainment centers, leisure-time attractions, hotels and hotel developers, resorts, sports organizations, financial institutions, insurance companies, pension funds, foreign investment trusts, major and minor mixed use developers, residential developers, condominium converters, industrial park developers, congregate care facilities planners, office complexes, business parks, housing, hospital administrators, and many others. Additional programs include: demographic projections, highest and best use studies, tax impact programs, tax increment financing, rehabilitation programs, mixed-use development analyses, adaptive re-use, and merger and acquisition programs. In the public sector, services include: neighborhood needs studies, resident shopping surveys, downtown revitalization programs, industrial opportunity identification, job-oriented analyses, community assets, stadium and arena feasibility, convention and meeting facilities, demographic forecasts, festival marketplaces, waterfront developments, leisure attractions, and airport spatial and expansion requirements. The staff consists of market analysts, site selection specialists, financial analysts, urbanologists, economists, marketing professionals, planners, real estate experts, and real estate professionals. Melaniphy & Associates, Inc. has both the depth and breadth of experience to provide comprehensive and innovative consultation. The firm is often engaged with clientele throughout the United States, Canada, México, South America, Europe, the Middle East, and the Far East. PHILOSOPHY ___________________________________________________________________________ The philosophy of Melaniphy & Associates, Inc. is to analyze a client's problems and provide expert advice and recommendations. Also, the company's mission is to help the client implement the advice to ensure the attainment of his or her goals. We often work with our clients from concept planning to project completion to provide our client with maximum benefit of our experience. Our staff of experts come from a wide variety of disciplines which are financially and economically oriented; thus, our philosophy dictates that we look at each recommended action as though we were spending our own money. Thus, if we were hesitant to invest our money, then we certainly would not recommend risking our clients' resources on a marginal or uneconomic project. This entrepreneurial approach is critical to the consulting business and absolutely essential in providing sound economic investment advice. Most consultants have never had to implement their own recommendations nor build the project as recommended. Members of our staff have. As a result, we have a profound respect for risk/resources and returns on invested capital.
ABOUT OUR FOUNDER AND PRESIDENT John C. Melaniphy has been a real estate counselor; restaurant, quick service food and retail site selection specialist; and market analyst for over 40 years. During this time, he has been involved in almost every type of urban and suburban restaurant and retail development and redevelopment problem and opportunity. He began his career with, at that time, the largest market analysis and site selection firm in the world and worked on all phases of the company's business over a 12 year span. The last three years, he was Senior Vice President of Real Estate Research Corporation, in charge of its commercial analyses and the operation of 13 world-wide offices.
In 1969, Mr. Melaniphy resigned from Real Estate Research Corporation to become Corporate Vice President of Kentucky Fried Chicken Corporation. His duties were to establish a real estate and construction division and assist in Financial Management. He was responsible for the selection and development of over 400 KFC units, as well as commissaries, warehouses, office buildings, and other facilities. Mr. Melaniphy became aware of the need in the corporate world for the unique background he possesses - a combination of both sound theory and practical application in acquiring and developing real estate, estimating sales and strategic market planning and prioritization. With the acquisition of KFC by Heublein, Mr. Melaniphy resigned to establish his own market-oriented consulting firm in 1971. He also assisted in packaging a $50,000,000 loan for corporate expansion. With the merger of company with Heublein, Melaniphy resigned to start Melaniphy & Associates, Inc. Mr. Melaniphy is aware of the need in the corporate world for the unique background he possesses; a combination of both scientific analysis and extensive business experience resulting in sound decision making. Mr. Melaniphy has counseled thousands of companies throughout the world. Some of these include: Marshall Field & Company, J.C. Penney Company, Wal-Mart, Sears Roebuck & Company, Macy's, Lord & Taylor, Saks Fifth Avenue, Dayton Hudson (now Marshall Field’s), Neiman Marcus, Federated Department Stores, Target, Meijer, the Hudson Bay Company, El Puerto de Liverpool, Fabricas de Francia, International Multifoods, the Jewel Companies, the House of Escada, Marshalls, Wickes Furniture, the Rouse Company, G.E. Capital, Heller Financial, Household Commercial, Aetna Life Insurance Company, Travelers Life Insurance Company, Hollywood Casinos, Huizenga Capital Management, The Simon Property Group, Birtcher Realty Advisors, General Growth Properties, Bain Capital, Iowa Electric, Corrigan Properties, Gerald D. Hines Interests, Heitman Capital Management, Avatar Properties, Forest City Enterprises, Zale Construction Company, Concord Development, Amoco, Fondo Opcion, S.A., ICA Asociadas, FRISA Division Comercial, Mobile, Union, USX Realty, the Kuwait Bank, Marriott, Sheraton, Hilton, Embassy Suites, Baymont Inns, Hampton Inns, , Fitness USA, and many others. Some of the foodservice related clients include: Marriott Corporation, Lettuce Entertain You Enterprises, Schwartz Brothers, Bennigan's, Maggiano’s Little Italy, Sir Walter Raleigh, Shaw’s Crab House, P F Chang, Friendly's, Restaurant Associates, Arigato Steak House, Charlie Brown's, Big Bowl Asian Café, Columbia Restaurants, Max & Irma's, TGI Friday's, Shorty Small's, Pepe's, Superdawg, Border Cafe, County Line Barbecue, Steak and Stein, Pizza Hut, Pizza Delight, McDonald’s, Burger King, Hardee’s, Taco Bell, Arby’s, Church's, Popeye’s, Dunkin Donut, Baja Fresh, and numerous others individual restaurants and fast food operators. Municipalities assisted include: Chicago, Minneapolis, Cleveland, San Antonio, Charlestown, Louisville, Milwaukee, Omaha, Seattle, Los Angeles, Boston, Atlanta, Dallas, Tampa, and numerous others.
His affiliations have included: The Counselors of Real Estate, Urban Land Institute, International Council of Shopping Centers, Lambda Alpha International Real Estate Economics Fraternity, the National Restaurant Association, the National Retail Federation, Realty Club of Chicago, and many others. He is the author of Commercial and Industrial Condominiums published by Urban Land Institute and Restaurant and Fast Food Site Selection published by John Wiley & Sons. He is also a contributing author of the book entitled Shopping Centers and Other Properties also published by John Wiley & Sons. Mr. Melaniphy’s new book The Restaurant Site Selection Guidebook will be published in 2006. The author of over 100 articles, Mr. Melaniphy, also presents seminars covering real estate, mixed-use development, site selection, store development strategies, shopping center opportunities, restaurant and fast food market analysis and site selection, and long range development planning. The seminars are presented throughout the world for associations and private companies. Mr. Melaniphy is an expert witness in all levels of the judicial system. Moreover, he is a much sought after speaker on a wide variety of subjects. For further information, please visit the company’s Website @ www.melaniphy.com where over 40 articles are posted, along with January Retail Trends newsletter and the Chicagoland Retail Sales Newsletter.
MELANIPHY & ASSOCIATES, INC. 6333 NORTH MILWAUKEE AVENUE
SUITE 106 CHICAGO, ILLINOIS 60646-3744
E-mail - [email protected] Fax: 773-774-0454
Phone: 773-467-1212
REPRESENTATIVE LIST OF CLIENTS
MAJOR DEVELOPERS AND OWNERS MAJOR RETAILERS U.S.X. Realty Development Corp. Marshall Field & Company The Simon Property Group Saks Fifth Avenue The Rouse Company Sears, Roebuck & Company Upland Industries (Union Pacific RR) J.C. Penney Company Corrigan Properties, Inc. The May Company Merrill Lynch Realty Macy’s The RREEF Funds Marshalls/ TJ Maxx Gerald D. Hines Interests The Jewel Companies Forest City Enterprises Meijer Superstores Mills Development Corporation Wal-Mart Birtcher Realty Advisors Federated Department Stores Tucker Properties Corporation Dayton-Hudson Company CMC Heartland Partners Neiman Marcus The Commonfund Wickes Furniture McCaffery Interests, Inc. Target Stores Aetna Life Insurance Company Teachers Insurance and Annuity Assoc. INTERNATIONAL RETAILERS Metropolitan Real Estate Co. Cifra/Wal-Mart Trammel Crow Company The House of Escada Inland Real Estate El Puerto de Liverpool Fabricas de Francia CITIES Atlantic Wholesalers New York, New York Chicago, Illinois FINANCIAL ORGANIZATIONS Milwaukee, Wisconsin Bank of America San Antonio, Texas First National Bank of Chicago Charleston, West Virginia Harris Trust & Savings Bank Cleveland, Ohio Northern Trust & Savings Bank Boston, Massachusetts Citibank Denver, Colorado Chase Manhattan Madison, Wisconsin G.E. Capital Corp. Lawrence, Kansas Bain Capital Partners Olathe, Kansas Heller Financial Manhattan, Kansas Household Commercial Glen Ellyn, Illinois The RREEF Funds Oak Park, Illinois Huizenga Capital Management St. Charles, Illinois Park Ridge, Illinois RESTAURANTS/FAST FOOD Highland Park, Illinois Restaurant Selection - Virginia Beach Glenwood, Illinois Lettuce Entertain You Enterprises Brookfield, Wisconsin Schwartz Brothers Arby’s CITY OF CHICAGO PROJECTS Sir Walter Raleigh Inns Navy Pier Redevelopment Shoney’s Neighborhood Needs Analysis- Friendly’s All of Chicago’s Neighborhoods Brinker Analysis of over 25 Business Districts Restaurant Associates Industrial Park Development Analysis Burger King
REPRESENTATIVE LIST OF CLIENTS (Continued)
CITY OF CHICAGO PROJECTS RESTAURANTS/FAST FOOD (Continued) (Continued) Potential for a New Stadium Piccadilly Cafeterias Mayor's Special Projects Baja Fresh Waste Resource Recovery Analysis Steak and Stein O'Hare International Airport Expansion Brennan's Housing Development on Urban Pizza Delight - Canada Renewal Properties Marriott Corporation Objectives Analysis-Economic Shorty Small's Development Commission Popeye's Analysis of Property Disposition- Hardee's Chicago Board of Education Pizza Hut Exposition Authority Wendy's MANUFACTURERS/PRODUCERS SPECIAL W.W. Grainger Wal-Mart Zoning Issues Atlantic Richfield Company National Restaurant Association ITW/Magnaflux International Council of TDW/Hercules Tires Shopping Centers International Multifoods Fitness Management Corp. IBM Catholic Archdiocese of Chicago Iowa Electric (IE) Industries Illinois Masonic Medical Center William C. Brown Group SBC Ameritech Booth Fisheries Chicago Cubs Campbell Soup Company U.S. Postal Service Griffith Laboratories Illinois Law Enforcement Commission Exxon Mobil Oil Santa Fe Railroad Texaco United Parcel Service Standard Oil Chicago Northwestern Railroad Dresser Industries Hammond Railroad Consolidation IBM Project INTERNATIONAL INVESTMENT FUNDS STATES Ivanhoe Investment Funds - Canada IL Dept. of Transportation Coast Investment & Development IL Capital Development Board Company-Kuwait IL Dept. of Commerce and Merrill Lynch Capital Markets Community Affairs Iowa Dept. of Transportation HOTELS IN Dept. of Transportation MI Dept. of Transportation Hyatt WI Dept. of Transportation Sheridan Holiday Inn WATERFRONT PROJECTS Marriott Embassy Suites Navy Pier-Chicago Baymont Inns North Coast Harbor-Cleveland, Ohio Days Inn Miami Beach Marina Redevelopment
6333 N. Milwaukee Avenue
Suite 106 Chicago, Illinois 60646-3744
Phone 773-467-1212 Facsimile 773-774-0454