mathematical modelling, simulation and ... modelling, simulation and experimental verification of a...
TRANSCRIPT

European Journal of Engineering and Technology Vol. 6 No. 1, 2018 ISSN 2056-5860
Progressive Academic Publishing, UK Page 1 www.idpublications.org
MATHEMATICAL MODELLING, SIMULATION AND EXPERIMENTAL
VERIFICATION OF A PNEUMATIC SYSTEM
Msc.Eng. Spartak Poçari1
"Harry Fultz" Institute in Tirana
ALBANIA
Prof.PhD.Eng. Andonaq Londo2
Mechanical Engineering Faculty
Polytechnic University of Tirana
ALBANIA
ABSTRACT
In this article we have introduced the mathematical model of a typical pneumatic system, consisting
of pneumatic cylinder, proportional electromagnetic valve, connecting tubes. Based on this
mathematical model we have built in LabView a simulation program. We compared the results
obtained from the simulation with the experimental measurements made in the experimental panel.
The matching of the displacement and pressure characteristics in the cylinder chambers indicate the
authenticity of the mathematical model which can be used for the constructive improvement of
these components as well as for their PID control.
Keywords: Pneumatics, Simulation, Mathematical Model, Pneumatic Cylinder, LabView.
INTRODUCTION
A typical pneumatic system includes a force element (the pneumatic cylinder), a command
device (valve), connecting tubes, and position, pressure and force sensors. The external load
consists of the mass of external mechanical elements connected to the piston and perhaps a
force produced by environmental interaction. A schematic representation of the pneumatic
actuator system is shown in Fig. (1), with variables of interest specified for each component.
Figure.1. Schematic representation of the pneumatic cylinder-valve system
For our study we have take in consideration one proportional pneumatic electro vale of the type
VER 2000 product of the SMC company, One pneumatic cylinder with diameter D=25mm. That
valve is of the type 2/3 with 5 holes and can be commanded through the electric signals and it’s

European Journal of Engineering and Technology Vol. 6 No. 1, 2018 ISSN 2056-5860
Progressive Academic Publishing, UK Page 2 www.idpublications.org
outlet depend by the intensity of electric current. Fig.2 tells the experimental panel composed by
VER 2000 electro valve, pneumatic cylinder, tubes, sensors, electric drivers etc.
Figure.2. Experimental panel
The construction of this valves presents a number of advantages, such as: almost linear flow
characteristics of the air flowing through it, good sealing to internal leaks, the ability to balance
both rooms under pressure using only one control signal, Very small internal friction between
friction elements.
The pneumatic cylinder is of the type dual acting with diameter D=25mm and the piston rod length
L=70mm.
MATHEMATIC MODEL
The equation of motion for the piston-rod-load assembly can be expressed as,
(ML+MP)ẍ+βẋ+Ff+FL = P1A1-P2A2-PaAr ( 1 )
where ML is the external load mass, Mp is the piston and rod assembly mass, x is the piston position,
β is the viscous friction coefficient, Ff is the Coulomb friction force, FL is the external force, P1 and
P2 are the absolute pressures in actuator’s chambers, Pa is the absolute ambient pressure, A1 and A2
are the piston effective areas, and Ar is the rod cross sectional area. The right hand side of Eq. (1)
represents the actuator active force, produced by the different pressures acting on the opposite sides
of the piston. In order to control the actuator force output, one has to finely tune the pressure levels
in the cylinder chambers using the command element (the pneumatic valve). This requires detailed
models for the dynamics of pressure in both chambers of the actuator, valve dynamics, and
connecting tubes.
For the construction of the mathematical model of the cylinder chambers, we will refer to the
connection between the pressure change, the flow mass and the displacement velocity of the
cylinder.
The mathematical model for the gas volume in the most general form consists of three equations:
Equation of state (ideal gas law)
Conservation of mass (continuity)
Energy equation

European Journal of Engineering and Technology Vol. 6 No. 1, 2018 ISSN 2056-5860
Progressive Academic Publishing, UK Page 3 www.idpublications.org
Considering that: a) the gas is perfect, b) the pressure and temperature inside the room are
homogeneous, and c) the potential and kinetic energy are negligible. These equations can be written
for each cylinder chamber.
Considering the controlled volume V, the density ρ, the mass m, the pressure P and the temperature
T, the ideal gas law can be written as:
P= ρRT (2)
Where, R is the ideal gas constant. Referring to the continuity equation, mass flow may be
expressed as:
(3)
Which can also be expressed as,
V+ (4)
Where, ṁin and ṁout out are the mass flow of the fluid entering and leaving the room
The energy equation can be written as follows:
(5)
Where qin and qout are the quantities of heat transferred, k is the specific coefficient of heat, is
the specific heat at constant volume, is the incoming gas temperature, is the change at work,
and is the change in the internal energy.
If we consider the process adiabatic , the change in time of the chamber pressure is,
(6)
(7)
Where , and taking values between 1 and k, depending on the actual heat transfer
during the process. Choosing the origin of the piston displacement at the middle of the stroke, the
volume of each chamber can be expressed as,
(8)
Where i = 1.2 is the cylinder chambers index, V0i is the inactive volume at the end of stroke and
admission ports, Ai is the piston effective area, L is the piston stroke, and x is the piston position.
The difference between the piston effective areas for each chamber A1 and A2 is due to the piston
rod. Substituting Eq. (8) into (7), the time derivative for the pressure in the pneumatic cylinder
chambers becomes:
(9)
European Journal of Engineering and Technology Vol. 6 No. 1, 2018 ISSN 2056-5860
Progressive Academic Publishing, UK Page 4 www.idpublications.org
The first term in the equation represents the effect on pressure of the air flow in or out of the
chamber, and the second term accounts for the effect of piston motion.
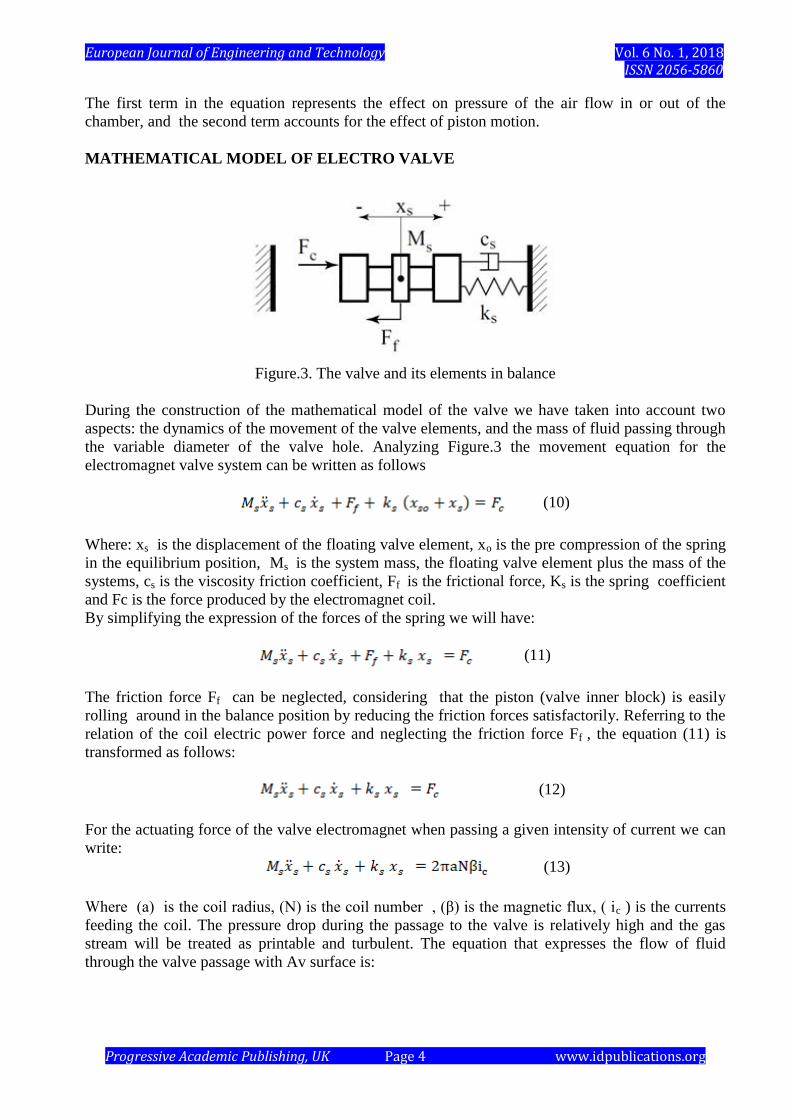
MATHEMATICAL MODEL OF ELECTRO VALVE
Figure.3. The valve and its elements in balance
During the construction of the mathematical model of the valve we have taken into account two
aspects: the dynamics of the movement of the valve elements, and the mass of fluid passing through
the variable diameter of the valve hole. Analyzing Figure.3 the movement equation for the
electromagnet valve system can be written as follows
(10)
Where: xs is the displacement of the floating valve element, xo is the pre compression of the spring
in the equilibrium position, Ms is the system mass, the floating valve element plus the mass of the
systems, cs is the viscosity friction coefficient, Ff is the frictional force, Ks is the spring coefficient
and Fc is the force produced by the electromagnet coil.
By simplifying the expression of the forces of the spring we will have:
(11)
The friction force Ff can be neglected, considering that the piston (valve inner block) is easily
rolling around in the balance position by reducing the friction forces satisfactorily. Referring to the
relation of the coil electric power force and neglecting the friction force Ff , the equation (11) is
transformed as follows:
(12)
For the actuating force of the valve electromagnet when passing a given intensity of current we can
write:
(13)
Where (a) is the coil radius, (N) is the coil number , (β) is the magnetic flux, ( ic ) is the currents
feeding the coil. The pressure drop during the passage to the valve is relatively high and the gas
stream will be treated as printable and turbulent. The equation that expresses the flow of fluid
through the valve passage with Av surface is:
European Journal of Engineering and Technology Vol. 6 No. 1, 2018 ISSN 2056-5860
Progressive Academic Publishing, UK Page 5 www.idpublications.org
(14)
Where is the mass flow passing through the valve, is the exhaust coefficient, is the
pressure at the valve inlet, is the pressure in the flow direction and
; ;
Are fluid constants , for the air (k=1.4) we have C1 =0.040418, C2 =0.156174, and Pcr= 0.528.
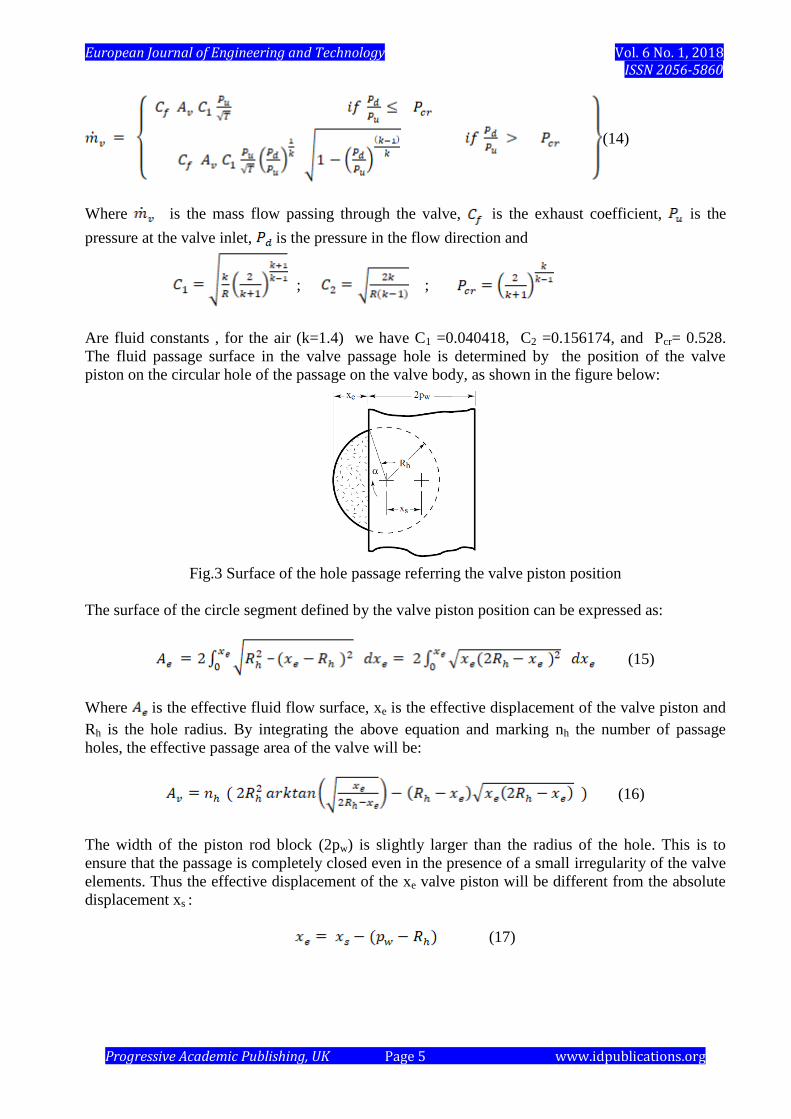
The fluid passage surface in the valve passage hole is determined by the position of the valve
piston on the circular hole of the passage on the valve body, as shown in the figure below:
Fig.3 Surface of the hole passage referring the valve piston position
The surface of the circle segment defined by the valve piston position can be expressed as:
(15)
Where is the effective fluid flow surface, xe is the effective displacement of the valve piston and
Rh is the hole radius. By integrating the above equation and marking nh the number of passage
holes, the effective passage area of the valve will be:
(16)
The width of the piston rod block (2pw) is slightly larger than the radius of the hole. This is to
ensure that the passage is completely closed even in the presence of a small irregularity of the valve
elements. Thus the effective displacement of the xe valve piston will be different from the absolute
displacement xs :
(17)
European Journal of Engineering and Technology Vol. 6 No. 1, 2018 ISSN 2056-5860
Progressive Academic Publishing, UK Page 6 www.idpublications.org
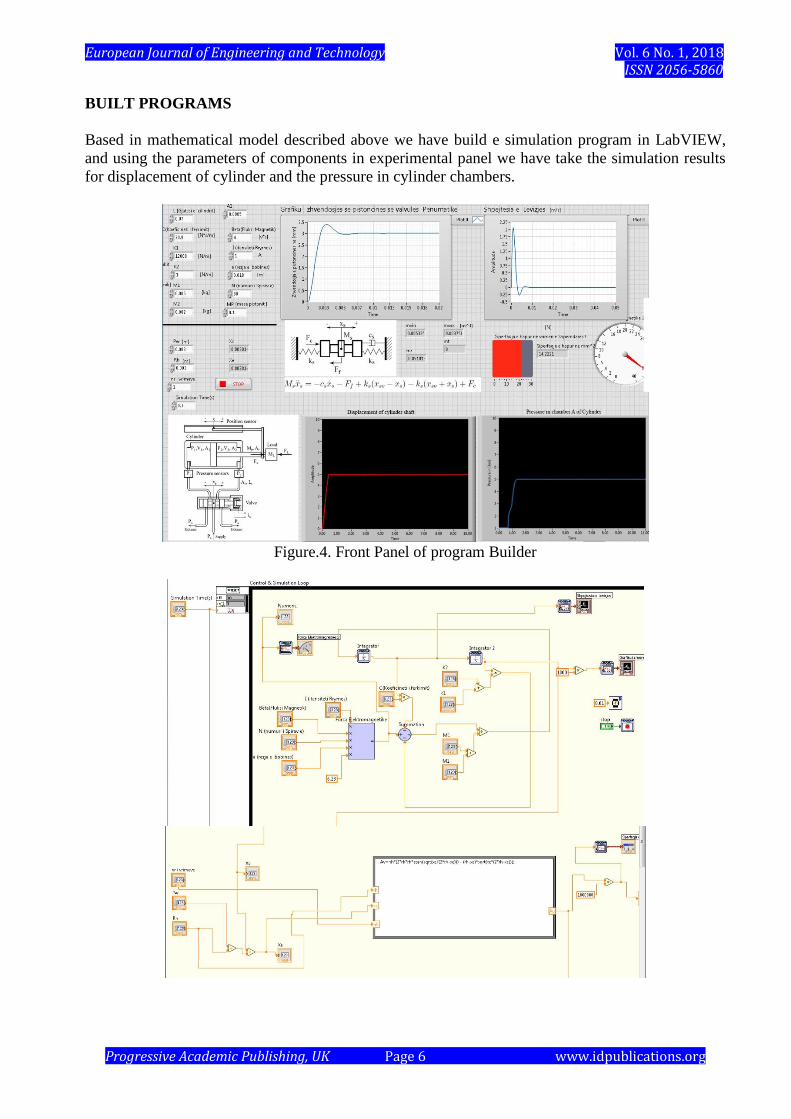
BUILT PROGRAMS
Based in mathematical model described above we have build e simulation program in LabVIEW,
and using the parameters of components in experimental panel we have take the simulation results
for displacement of cylinder and the pressure in cylinder chambers.
Figure.4. Front Panel of program Builder

European Journal of Engineering and Technology Vol. 6 No. 1, 2018 ISSN 2056-5860
Progressive Academic Publishing, UK Page 7 www.idpublications.org
European Journal of Engineering and Technology Vol. 6 No. 1, 2018 ISSN 2056-5860
Progressive Academic Publishing, UK Page 8 www.idpublications.org
Figure.5. Bock Diagram of program Builder
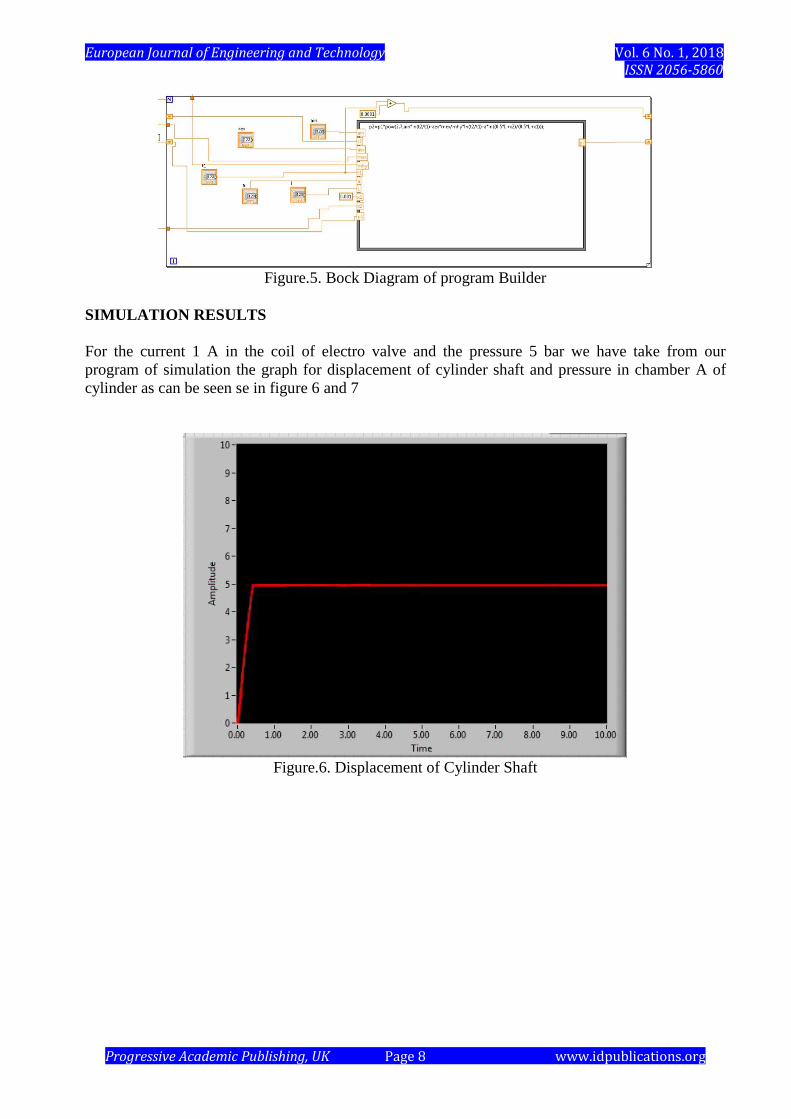
SIMULATION RESULTS
For the current 1 A in the coil of electro valve and the pressure 5 bar we have take from our
program of simulation the graph for displacement of cylinder shaft and pressure in chamber A of
cylinder as can be seen se in figure 6 and 7
Figure.6. Displacement of Cylinder Shaft

European Journal of Engineering and Technology Vol. 6 No. 1, 2018 ISSN 2056-5860
Progressive Academic Publishing, UK Page 9 www.idpublications.org
Figure.7. Pressure in the chamber A of cylinder
Figure.8. Displacement of Cylinder Shaft for exit and return
EXPERIMENTAL RESULTS
In the experimental panel we have installed a displacement sensor and a pressure sensor of them
we have received displacement and pressure graphs as shown in Figures 9 and 10.

European Journal of Engineering and Technology Vol. 6 No. 1, 2018 ISSN 2056-5860
Progressive Academic Publishing, UK Page 10 www.idpublications.org
Figure.9. Displacement of cylinder measured from experimental panel
Figure.10. Pressure in the chamber A of cylinder measured from experimental panel

European Journal of Engineering and Technology Vol. 6 No. 1, 2018 ISSN 2056-5860
Progressive Academic Publishing, UK Page 11 www.idpublications.org
COMPARISON OF RESULTS
Below we are comparing results obtained from numerical simulation and experimental
measurements
Figure.11. Displacement of cylinder (simulation and experimental)
Figure.12. Pressure in chamber A of cylinder (simulation and experimental)
CONCLUSIONS
By comparing the simulation graphs with the experimental measurements graphs, respectively for
the displacement of the cylinder shaft and the pressure in the cylinder chamber, we notice a
considerable correlation, thus proving the authenticity of the mathematical model and the built
program. Since the built program has like inputs the physical parameters of the cylinder valve
European Journal of Engineering and Technology Vol. 6 No. 1, 2018 ISSN 2056-5860
Progressive Academic Publishing, UK Page 12 www.idpublications.org
system, provides the possibility of realizing virtual experiments. The built mathematical model can
also be used for PID control of these plants.
REFERENCES
Books A. Londo (2008) “Transmisionet Hidropneumatike” Tirana Sh.B.L.U
A. Zecchi (1999) “Controllo ed Elaborazione Numerica dei Segnali Con LabVIEW” Milano:
Tecniche Nuove.
Andrew Parr (2011) “Hydraulics and Pneumatics” Third edition
I. Ninka (1983) “Metoda Numerike” Tirana:
F. Hoxha (1997) “Analiza Numerike” Tirana: Sh.B.U.
R.B. Walters(1994) ''Sistemi di Regolazione Idraulici ed Elettroidraulici'' Milano:Tecniche Nuove
Maggio
R.F.Steidel (1971) ''An Introduction to Mechanical Vibrations'' Berkeley, California: August
David J.Griffiths (1999) “ Introduction to ElectroDynamics” Prentice Hall
Manuals
National Instruments (2016) "G Programming Reference Manual"
National Instruments. (2016) "Function and VI Reference Manual"
National Instruments. (2016) "User Manual".
National Instruments(2016) "Data Acquistion Basics Manual".
Nuovo Colombo(1985) “Manuale dell’Ingegnere” Torino:
SMC (2017) “Electro Pneumatic Proportional Valve” product catalog