mathematical modeling for ship evacuation from tsunami attack
TRANSCRIPT
Mathematical Modeling for Ship Evacuation from Tsunami Attack
Ei-ichi Kobayashi1, Shota Yoneda1, Masako Murayama2, Yuuki Taniguchi1, Hirotada Hashimoto1 and Shunichi Koshimura3
1Graduate School of Maritime Sciences, Kobe University, 5-1-1 Fukae-minami, Higashinada-ku, Kobe, Japan 2Toyama National College of Technology, 1-2 Ebie-neriya, Imizu city, Toyama, Japan
3International Research Institute for Disaster Science, Tohoku University, Sendai, Tohoku, Japan
Keywords: Tsunami Disaster, Ship Evacuation, Maneuverability.
Abstract: When a tsunami warning is officially announced, as a measure for safeguarding ships from tsunami attacks, it is recommended that large ships in harbors be maneuvered to sheltered areas outside the ports until the tsunami subsides. In this paper, we develop mathematical simulation models to describe the dynamic behavior of a ship. Then, the evacuation maneuvers of a cruise ship and a cargo ship in a tsunami flow are analyzed and characterized. Finally, it is concluded that this kind of simulation could be very great help useful to evaluate the safety of ship evacuation methods against for the tsunami attacks.
1 INTRODUCTION
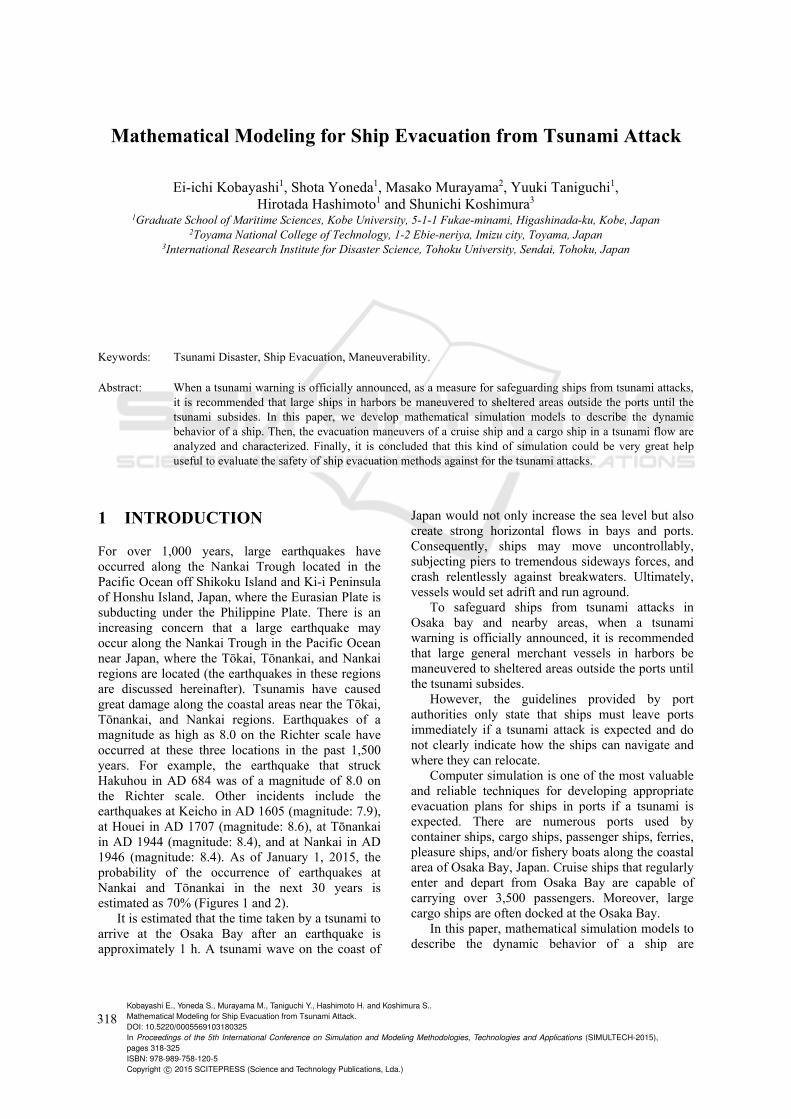
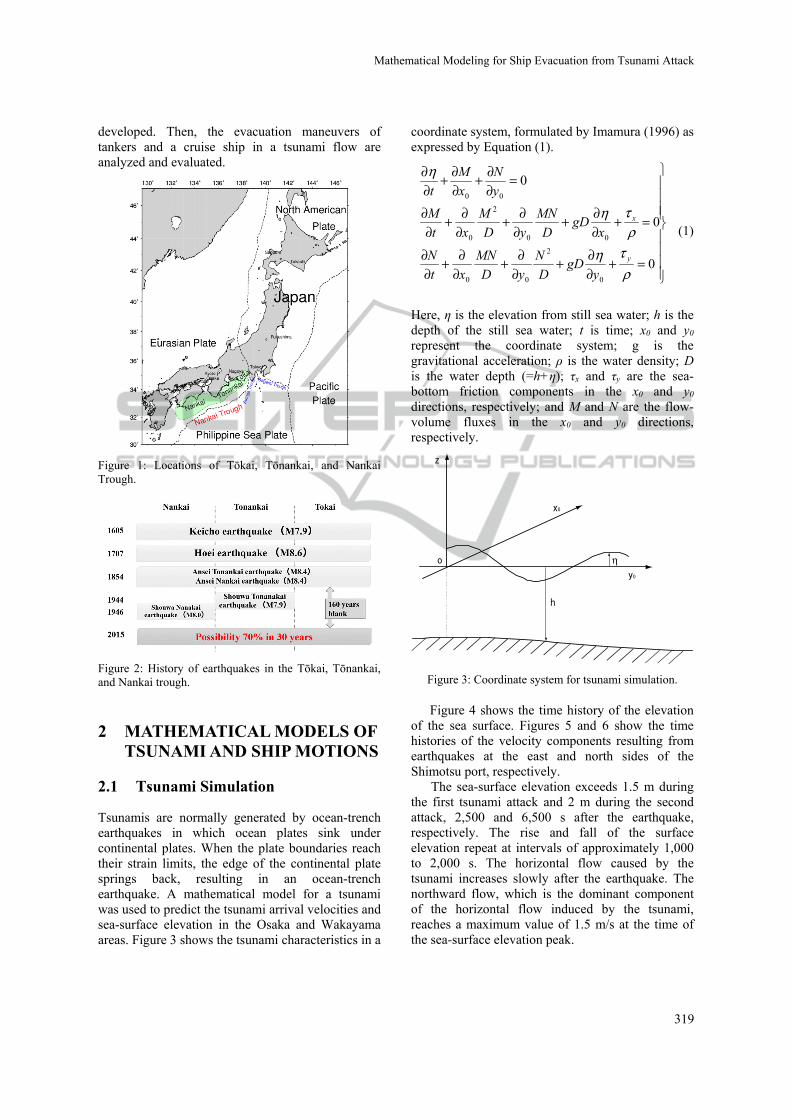
For over 1,000 years, large earthquakes have occurred along the Nankai Trough located in the Pacific Ocean off Shikoku Island and Ki-i Peninsula of Honshu Island, Japan, where the Eurasian Plate is subducting under the Philippine Plate. There is an increasing concern that a large earthquake may occur along the Nankai Trough in the Pacific Ocean near Japan, where the Tōkai, Tōnankai, and Nankai regions are located (the earthquakes in these regions are discussed hereinafter). Tsunamis have caused great damage along the coastal areas near the Tōkai, Tōnankai, and Nankai regions. Earthquakes of a magnitude as high as 8.0 on the Richter scale have occurred at these three locations in the past 1,500 years. For example, the earthquake that struck Hakuhou in AD 684 was of a magnitude of 8.0 on the Richter scale. Other incidents include the earthquakes at Keicho in AD 1605 (magnitude: 7.9), at Houei in AD 1707 (magnitude: 8.6), at Tōnankai in AD 1944 (magnitude: 8.4), and at Nankai in AD 1946 (magnitude: 8.4). As of January 1, 2015, the probability of the occurrence of earthquakes at Nankai and Tōnankai in the next 30 years is estimated as 70% (Figures 1 and 2).
It is estimated that the time taken by a tsunami to arrive at the Osaka Bay after an earthquake is approximately 1 h. A tsunami wave on the coast of
Japan would not only increase the sea level but also create strong horizontal flows in bays and ports. Consequently, ships may move uncontrollably, subjecting piers to tremendous sideways forces, and crash relentlessly against breakwaters. Ultimately, vessels would set adrift and run aground.
To safeguard ships from tsunami attacks in Osaka bay and nearby areas, when a tsunami warning is officially announced, it is recommended that large general merchant vessels in harbors be maneuvered to sheltered areas outside the ports until the tsunami subsides.
However, the guidelines provided by port authorities only state that ships must leave ports immediately if a tsunami attack is expected and do not clearly indicate how the ships can navigate and where they can relocate.
Computer simulation is one of the most valuable and reliable techniques for developing appropriate evacuation plans for ships in ports if a tsunami is expected. There are numerous ports used by container ships, cargo ships, passenger ships, ferries, pleasure ships, and/or fishery boats along the coastal area of Osaka Bay, Japan. Cruise ships that regularly enter and depart from Osaka Bay are capable of carrying over 3,500 passengers. Moreover, large cargo ships are often docked at the Osaka Bay.
In this paper, mathematical simulation models to describe the dynamic behavior of a ship are
318Kobayashi E., Yoneda S., Murayama M., Taniguchi Y., Hashimoto H. and Koshimura S..Mathematical Modeling for Ship Evacuation from Tsunami Attack.DOI: 10.5220/0005569103180325In Proceedings of the 5th International Conference on Simulation and Modeling Methodologies, Technologies and Applications (SIMULTECH-2015),pages 318-325ISBN: 978-989-758-120-5Copyright c 2015 SCITEPRESS (Science and Technology Publications, Lda.)
developed. Then, the evacuation maneuvers of tankers and a cruise ship in a tsunami flow are analyzed and evaluated.
Figure 1: Locations of Tōkai, Tōnankai, and Nankai Trough.
Figure 2: History of earthquakes in the Tōkai, Tōnankai, and Nankai trough.
2 MATHEMATICAL MODELS OF TSUNAMI AND SHIP MOTIONS
2.1 Tsunami Simulation
Tsunamis are normally generated by ocean-trench earthquakes in which ocean plates sink under continental plates. When the plate boundaries reach their strain limits, the edge of the continental plate springs back, resulting in an ocean-trench earthquake. A mathematical model for a tsunami was used to predict the tsunami arrival velocities and sea-surface elevation in the Osaka and Wakayama areas. Figure 3 shows the tsunami characteristics in a
coordinate system, formulated by Imamura (1996) as expressed by Equation (1).
=+∂∂+
∂∂+
∂∂+
∂∂
=+∂∂+
∂∂+
∂∂+
∂∂
=∂∂+
∂∂+
∂∂
0
0
0
0
2
00
00
2
0
00
ρτη
ρτη
η
y
x
ygD
D
N
yD
MN
xt
N
xgD
D
MN
yD
M
xt
M
y
N
x
M
t
(1)
Here, η is the elevation from still sea water; h is the depth of the still sea water; t is time; x0 and y0 represent the coordinate system; g is the gravitational acceleration; ρ is the water density; D is the water depth (=h+η); τx and τy are the sea-bottom friction components in the x0 and y0 directions, respectively; and M and N are the flow-volume fluxes in the x0 and y0 directions, respectively.
Figure 3: Coordinate system for tsunami simulation.
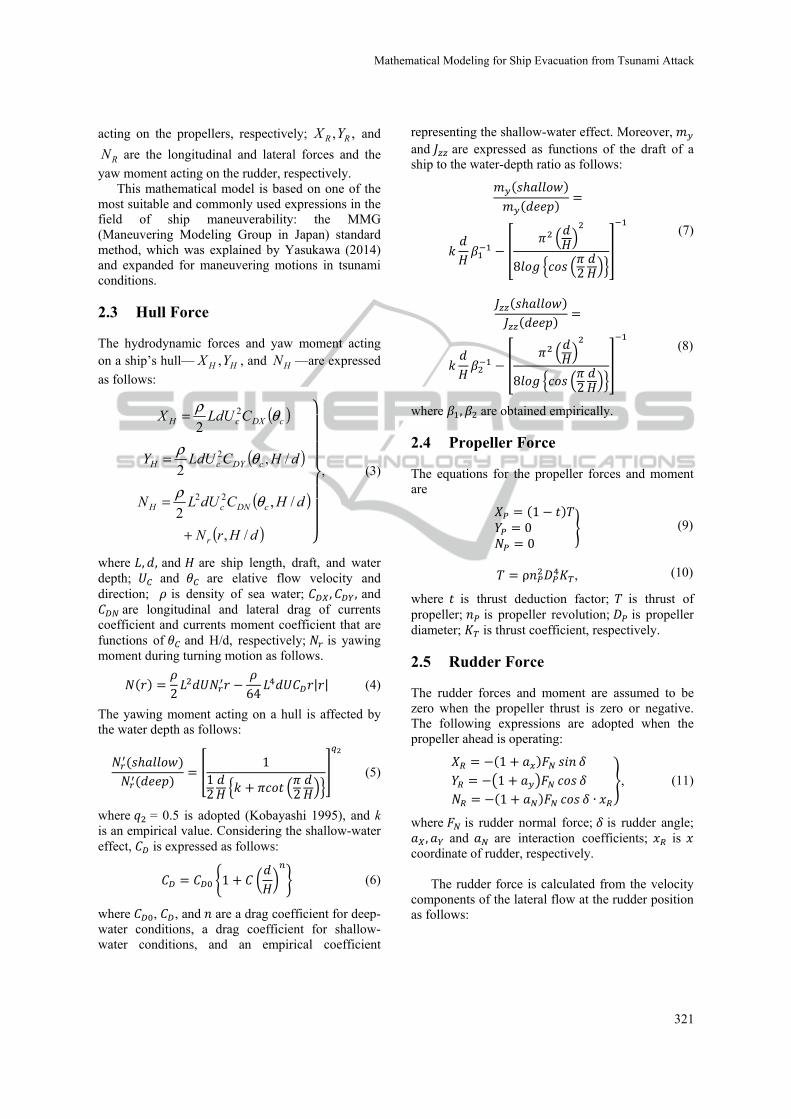
Figure 4 shows the time history of the elevation of the sea surface. Figures 5 and 6 show the time histories of the velocity components resulting from earthquakes at the east and north sides of the Shimotsu port, respectively.
The sea-surface elevation exceeds 1.5 m during the first tsunami attack and 2 m during the second attack, 2,500 and 6,500 s after the earthquake, respectively. The rise and fall of the surface elevation repeat at intervals of approximately 1,000 to 2,000 s. The horizontal flow caused by the tsunami increases slowly after the earthquake. The northward flow, which is the dominant component of the horizontal flow induced by the tsunami, reaches a maximum value of 1.5 m/s at the time of the sea-surface elevation peak.
h
ηy0
x0
z
o
Mathematical�Modeling�for�Ship�Evacuation�from�Tsunami�Attack
319
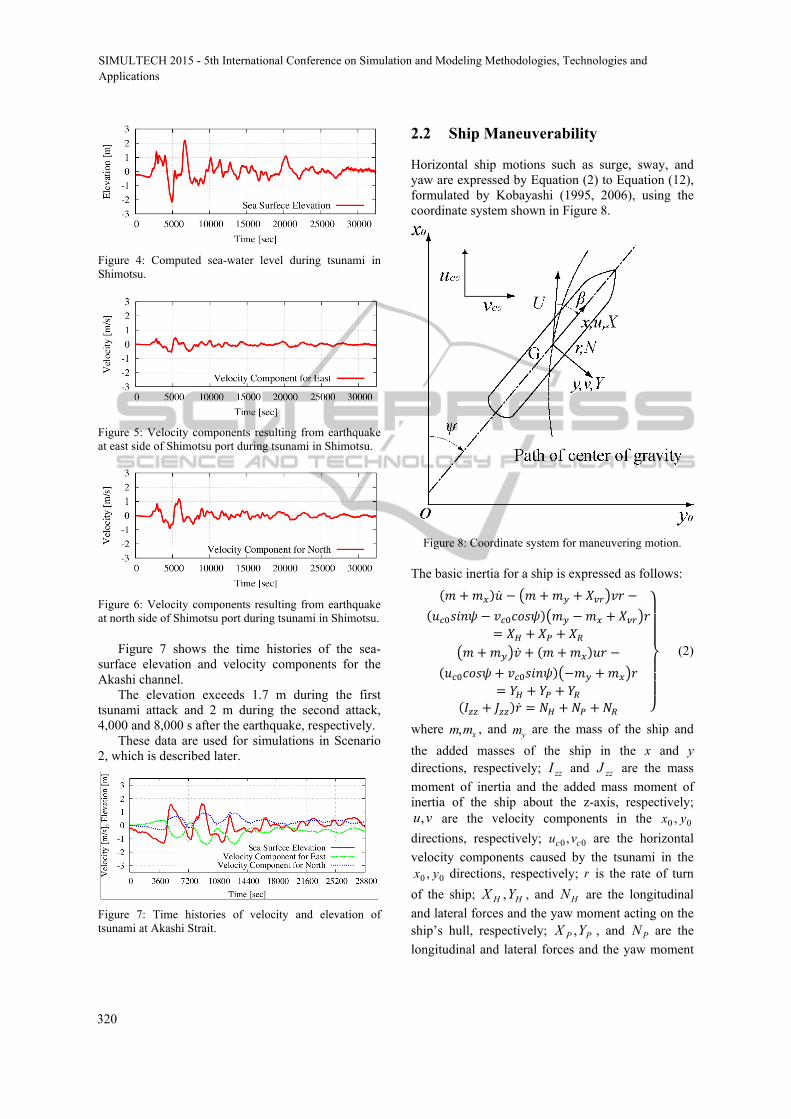
Figure 4: Computed sea-water level during tsunami in Shimotsu.
Figure 5: Velocity components resulting from earthquake at east side of Shimotsu port during tsunami in Shimotsu.
Figure 6: Velocity components resulting from earthquake at north side of Shimotsu port during tsunami in Shimotsu.
Figure 7 shows the time histories of the sea-surface elevation and velocity components for the Akashi channel.
The elevation exceeds 1.7 m during the first tsunami attack and 2 m during the second attack, 4,000 and 8,000 s after the earthquake, respectively.
These data are used for simulations in Scenario 2, which is described later.
Figure 7: Time histories of velocity and elevation of tsunami at Akashi Strait.
2.2 Ship Maneuverability
Horizontal ship motions such as surge, sway, and yaw are expressed by Equation (2) to Equation (12), formulated by Kobayashi (1995, 2006), using the coordinate system shown in Figure 8.
Figure 8: Coordinate system for maneuvering motion.
The basic inertia for a ship is expressed as follows: ( + ) − + + −( − ) − += + ++ + ( + ) −( + ) − += + +( + ) = + + (2)
where xmm, , and ym are the mass of the ship and
the added masses of the ship in the x and y directions, respectively; zzI and zzJ are the mass
moment of inertia and the added mass moment of inertia of the ship about the z-axis, respectively;
vu, are the velocity components in the 00 , yx
directions, respectively; 00 , cc vu are the horizontal
velocity components caused by the tsunami in the
00 , yx directions, respectively; r is the rate of turn
of the ship; HH YX , , and HN are the longitudinal
and lateral forces and the yaw moment acting on the ship’s hull, respectively; PP YX , , and PN are the
longitudinal and lateral forces and the yaw moment
SIMULTECH�2015�-�5th�International�Conference�on�Simulation�and�Modeling�Methodologies,�Technologies�andApplications
320
acting on the propellers, respectively; ,, RR YX and
RN are the longitudinal and lateral forces and the
yaw moment acting on the rudder, respectively. This mathematical model is based on one of the
most suitable and commonly used expressions in the field of ship maneuverability: the MMG (Maneuvering Modeling Group in Japan) standard method, which was explained by Yasukawa (2014) and expanded for maneuvering motions in tsunami conditions.
2.3 Hull Force
The hydrodynamic forces and yaw moment acting on a ship’s hull— HH YX , , and HN —are expressed
as follows:
( )cDXcH CLdUX θρ 2
2=
( )dHCLdUY cDYcH /,2
2 θρ=
( )dHCdULN cDNcH /,2
22 θρ=
( )dHrNr /,+
, (3)
where , , and are ship length, draft, and water depth; and are elative flow velocity and direction; is density of sea water; , , and
are longitudinal and lateral drag of currents coefficient and currents moment coefficient that are functions of and H/d, respectively; is yawing moment during turning motion as follows. ( ) = 2 − 64 | | (4)
The yawing moment acting on a hull is affected by the water depth as follows: ( ℎ )( ) = 112 + 2 (5)
where = 0.5 is adopted (Kobayashi 1995), and k is an empirical value. Considering the shallow-water effect, is expressed as follows: = 1 + (6)
where , , and are a drag coefficient for deep-water conditions, a drag coefficient for shallow-water conditions, and an empirical coefficient
representing the shallow-water effect. Moreover, and are expressed as functions of the draft of a ship to the water-depth ratio as follows: ( ℎ )( ) =
− 8 2 (7)
( ℎ )( ) =− 8 2
(8)
where , are obtained empirically.
2.4 Propeller Force
The equations for the propeller forces and moment are = (1 − )= 0= 0 (9)
= ρ , (10)
where is thrust deduction factor; is thrust of propeller; is propeller revolution; is propeller diameter; is thrust coefficient, respectively.
2.5 Rudder Force
The rudder forces and moment are assumed to be zero when the propeller thrust is zero or negative. The following expressions are adopted when the propeller ahead is operating: = −(1 + )= − 1 += −(1 + ) ∙ , (11)
where is rudder normal force; is rudder angle; , and are interaction coefficients; is coordinate of rudder, respectively.
The rudder force is calculated from the velocity
components of the lateral flow at the rudder position as follows:
Mathematical�Modeling�for�Ship�Evacuation�from�Tsunami�Attack
321
= 12 sin= += −(1 + ) cos ∙= ∙ 1 + 8= ∙ ( + ∙ ′)= − tan (− / )
, (12)
where is rudder area; is gradient coefficient of
rudder normal force = .. ; is effective
rudder angle; is velocity toward rudder; is component of velocity; is y component of velocity; and are propeller acceleration coefficients; is empirical coefficient; ( + ) is experimental characteristics on inflow direction to rudder, respectively.
We solved the differential equations above and calculated time histories for values such as the ship velocity, position, and yawing. Then, we simulated an evacuation maneuver of the ship, assuming the condition of the currents. This condition was added as a horizontal flow, which was determined according to the tidal currents and tsunami calculation. In these simulations, we ensured the auto-preservation of the route using a simple autopilot function. The following automatic rudder-control algorithm was adopted for the ship to navigate along the designated route: ∗ = − Δ − Δ − , (13)
where ∗ , Δy, Δψ, and r are the command rudder angle, lateral deviation from the route, deviation from the designated course, and yaw rate, respectively; and , , and are the empirical feedback gains.
As the result, the ship in this simulation was directed along the designated evacuation course.
3 SHIP-EVACUATION SIMULATION
3.1 Scenarios of Ship Evacuation from Tsunami Attack
We apply the proposed mathematical model to evaluate the possibility of safe ship evacuation in three cases.
3.2 Scenario 1
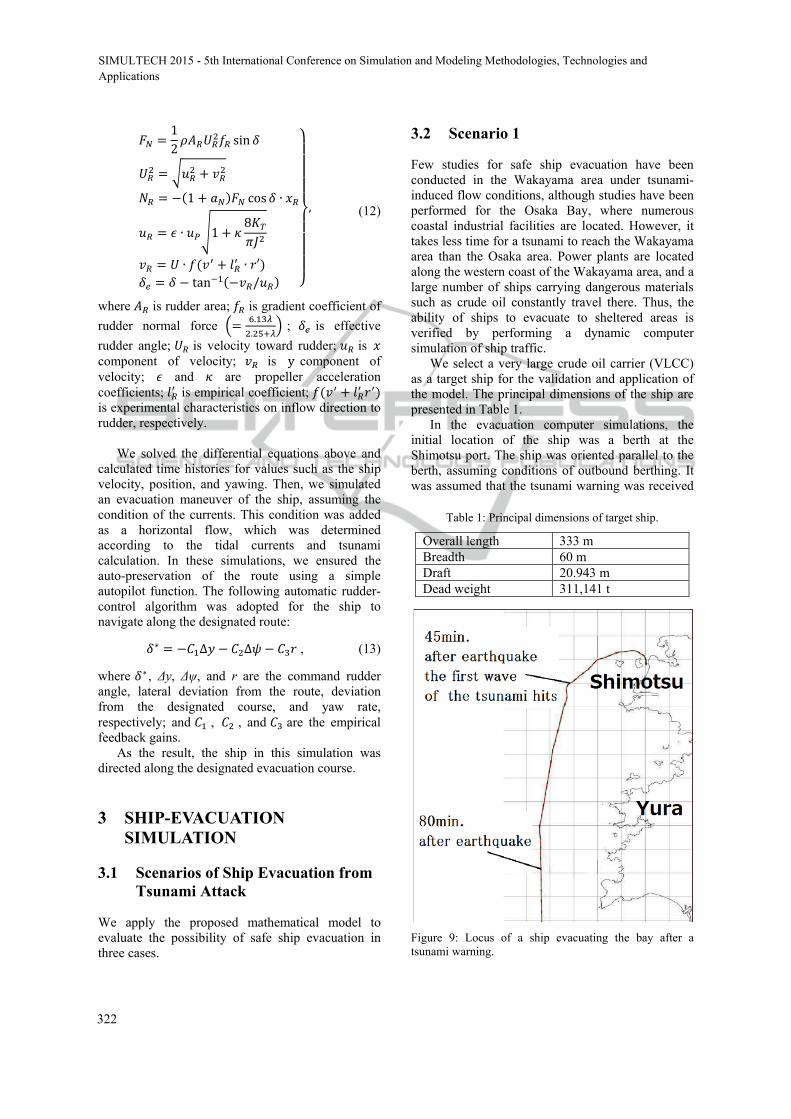
Few studies for safe ship evacuation have been conducted in the Wakayama area under tsunami-induced flow conditions, although studies have been performed for the Osaka Bay, where numerous coastal industrial facilities are located. However, it takes less time for a tsunami to reach the Wakayama area than the Osaka area. Power plants are located along the western coast of the Wakayama area, and a large number of ships carrying dangerous materials such as crude oil constantly travel there. Thus, the ability of ships to evacuate to sheltered areas is verified by performing a dynamic computer simulation of ship traffic.
We select a very large crude oil carrier (VLCC) as a target ship for the validation and application of the model. The principal dimensions of the ship are presented in Table 1.
In the evacuation computer simulations, the initial location of the ship was a berth at the Shimotsu port. The ship was oriented parallel to the berth, assuming conditions of outbound berthing. It was assumed that the tsunami warning was received
Table 1: Principal dimensions of target ship.
Overall length 333 m Breadth 60 m Draft 20.943 m Dead weight 311,141 t
Figure 9: Locus of a ship evacuating the bay after a tsunami warning.
SIMULTECH�2015�-�5th�International�Conference�on�Simulation�and�Modeling�Methodologies,�Technologies�andApplications
322
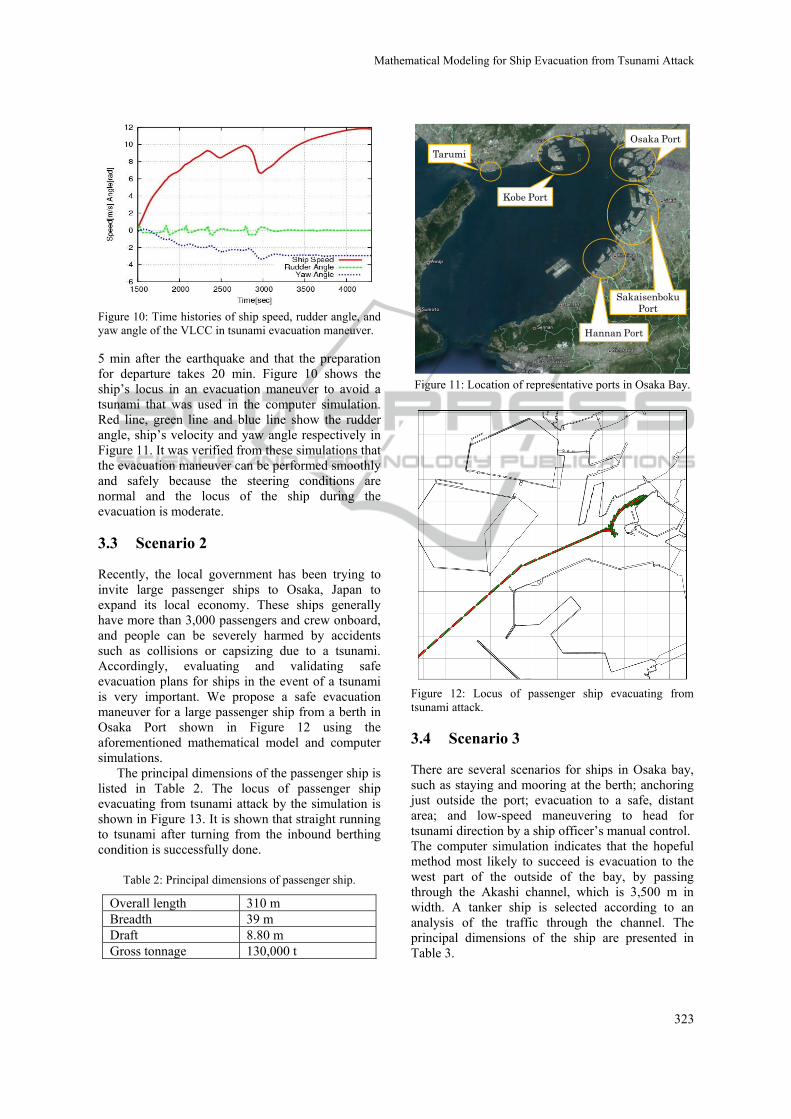
Figure 10: Time histories of ship speed, rudder angle, and yaw angle of the VLCC in tsunami evacuation maneuver.
5 min after the earthquake and that the preparation for departure takes 20 min. Figure 10 shows the ship’s locus in an evacuation maneuver to avoid a tsunami that was used in the computer simulation. Red line, green line and blue line show the rudder angle, ship’s velocity and yaw angle respectively in Figure 11. It was verified from these simulations that the evacuation maneuver can be performed smoothly and safely because the steering conditions are normal and the locus of the ship during the evacuation is moderate.
3.3 Scenario 2
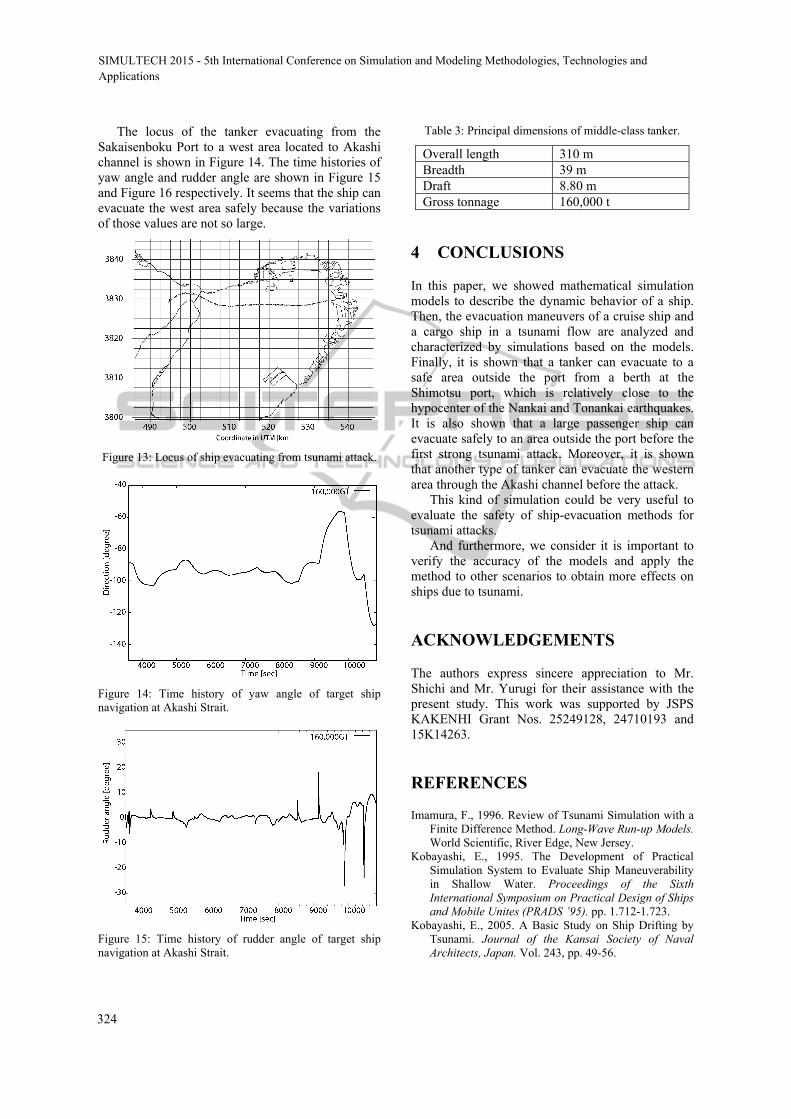
Recently, the local government has been trying to invite large passenger ships to Osaka, Japan to expand its local economy. These ships generally have more than 3,000 passengers and crew onboard, and people can be severely harmed by accidents such as collisions or capsizing due to a tsunami. Accordingly, evaluating and validating safe evacuation plans for ships in the event of a tsunami is very important. We propose a safe evacuation maneuver for a large passenger ship from a berth in Osaka Port shown in Figure 12 using the aforementioned mathematical model and computer simulations.
The principal dimensions of the passenger ship is listed in Table 2. The locus of passenger ship evacuating from tsunami attack by the simulation is shown in Figure 13. It is shown that straight running to tsunami after turning from the inbound berthing condition is successfully done.
Table 2: Principal dimensions of passenger ship.
Overall length 310 m Breadth 39 m Draft 8.80 m Gross tonnage 130,000 t
Figure 11: Location of representative ports in Osaka Bay.
Figure 12: Locus of passenger ship evacuating from tsunami attack.
3.4 Scenario 3
There are several scenarios for ships in Osaka bay, such as staying and mooring at the berth; anchoring just outside the port; evacuation to a safe, distant area; and low-speed maneuvering to head for tsunami direction by a ship officer’s manual control. The computer simulation indicates that the hopeful method most likely to succeed is evacuation to the west part of the outside of the bay, by passing through the Akashi channel, which is 3,500 m in width. A tanker ship is selected according to an analysis of the traffic through the channel. The principal dimensions of the ship are presented in Table 3.
Mathematical�Modeling�for�Ship�Evacuation�from�Tsunami�Attack
323
The locus of the tanker evacuating from the Sakaisenboku Port to a west area located to Akashi channel is shown in Figure 14. The time histories of yaw angle and rudder angle are shown in Figure 15 and Figure 16 respectively. It seems that the ship can evacuate the west area safely because the variations of those values are not so large.
Figure 13: Locus of ship evacuating from tsunami attack.
Figure 14: Time history of yaw angle of target ship navigation at Akashi Strait.
Figure 15: Time history of rudder angle of target ship navigation at Akashi Strait.
Table 3: Principal dimensions of middle-class tanker.
Overall length 310 m Breadth 39 m Draft 8.80 m Gross tonnage 160,000 t
4 CONCLUSIONS
In this paper, we showed mathematical simulation models to describe the dynamic behavior of a ship. Then, the evacuation maneuvers of a cruise ship and a cargo ship in a tsunami flow are analyzed and characterized by simulations based on the models. Finally, it is shown that a tanker can evacuate to a safe area outside the port from a berth at the Shimotsu port, which is relatively close to the hypocenter of the Nankai and Tonankai earthquakes. It is also shown that a large passenger ship can evacuate safely to an area outside the port before the first strong tsunami attack. Moreover, it is shown that another type of tanker can evacuate the western area through the Akashi channel before the attack.
This kind of simulation could be very useful to evaluate the safety of ship-evacuation methods for tsunami attacks.
And furthermore, we consider it is important to verify the accuracy of the models and apply the method to other scenarios to obtain more effects on ships due to tsunami.
ACKNOWLEDGEMENTS
The authors express sincere appreciation to Mr. Shichi and Mr. Yurugi for their assistance with the present study. This work was supported by JSPS KAKENHI Grant Nos. 25249128, 24710193 and 15K14263.
REFERENCES
Imamura, F., 1996. Review of Tsunami Simulation with a Finite Difference Method. Long-Wave Run-up Models. World Scientific, River Edge, New Jersey.
Kobayashi, E., 1995. The Development of Practical Simulation System to Evaluate Ship Maneuverability in Shallow Water. Proceedings of the Sixth International Symposium on Practical Design of Ships and Mobile Unites (PRADS ’95). pp. 1.712-1.723.
Kobayashi, E., 2005. A Basic Study on Ship Drifting by Tsunami. Journal of the Kansai Society of Naval Architects, Japan. Vol. 243, pp. 49-56.
SIMULTECH�2015�-�5th�International�Conference�on�Simulation�and�Modeling�Methodologies,�Technologies�andApplications
324
Kobayashi, E., 2006 A Basic Study on Evacuation Maneuver from Tsunami Attack, Journal of Japan Institution of Navigation. Vol. 114, pp. 157-163.
Yasukawa, H., 2014. Introduction of MMG standard method for ship maneuvering predictions, Journal of Marine Science and Technology. March 2015, Vol. 20, Issue 1, pp. 37-52.
Mathematical�Modeling�for�Ship�Evacuation�from�Tsunami�Attack
325