materials science - dbc.wroc.pl · materials science 4th international ... intitute of materials...
TRANSCRIPT
Wrocław University of TechnologyCentre of Advanced Materials and Nanotechnology
Materials Science
4 t h International Conferenceon Electronic Processes in Organic Materials
ICEPOM-4
Lviv, Ukraine, 3-8 June, 2002
Guest Editor: Andrzej Miniewicz
Vol. 20 • No. 3 • 2002
Oficyna Wydawnicza Politechniki Wrocławskiej

Materials Science is an interdisciplinary journal devoted to experimental and theoretical researchinto the synthesis, structure, properties and applications of materials.
Among the materials of interest are:• glasses and ceramics• sol-gel materials• photoactive materials (including materials for nonlinear optics)• laser materials• photonic crystals• semiconductormicro- and nanostructures• piezo-, pyro- and ferroelectric materials• high-Tc, superconductors• magnetic materials• molecular materials (including polymers) for use in electronics and photonics• novel solid phases• other novel and unconventional materials
The broad spectrum of the areas of interest reflects the interdisciplinary nature of materials research.Papers covering the modelling of materials, their synthesis and characterisation, physicochemical aspectsof their fabrication, properties and applications are welcome. In addition to regular papers, the journalfeatures issues containing conference papers, as well as special issues on key topics in materials science.
Materials Science is published under the auspices of the Centre of Advanced Materials andNanotechnology of the Wrocław University of Technology, in collaboration with the Institute of LowTemperatures and Structural Research of the Polish Academy of Sciences and the Wroclaw University ofEconomics.
All accepted papers are placed on the Web page of the journal and are available at the address:http://MaterialsScience.pwr.wroc.pl
Editor-in- Chief
Juliusz Sworakowski
Institute of Physical and Theoretical ChemistryWrocław University of Technology
Wybrzeże Wyspiańskiego 2750-370 Wrocław, Polandsworakowski@pwr. wroc.pl
Associate Editors
Wiesław Stręk
Institute of Low Temperatureand Structure Research
Polish Academy of SciencesP.O.Box 1410
50-950 Wrocław 2, Polandstrek@int. pan.wroc. pl
Jerzy Hanuza
Department of Bioorganic ChemistryFaculty of Industry and EconomicsWrocław University of Economics
Komandorska 118/12053-345 Wrocław, [email protected]
Scientific Secretary
Krzysztof MaruszewskiIntitute of Materials Science and Applied Mechanics
Wrocław University of TechnologyWybrzeże Wyspiańskiego 27
50-370 Wrocław, Polandmaruszewski@pwr .wroc.pl
Advisory Editorial Board
Michel A. Aegerter, Saarbrücken, GermanyLudwig J. Balk, Wuppertal, GermanyVictor E. Borisenko, Minsk, BelarusMikhaylo S. Brodyn, Kyiv, UkraineMaciej Bugajski, Warszawa, PolandAlexander Bulinski, Ottawa, CanadaRoberto M. Faria, Sao Carlos, BrazilReimund Gerhard-Multhaupt, Potsdam, GermanyPaweł Hawrylak, Ottawa, CanadaJorma Hölsä, Turku, FinlandAlexander A. Kaminskii, Moscow, RussiaWacław Kasprzak, Wrocław, PolandAndrzej Kłonkowski, Gdańsk, PolandSeiji Kojima, Tsukuba, JapanShin-ya Koshihara, Tokyo, JapanMarian Kryszewski, Łódź, PolandKrzysztof J. Kurzydłowski, Warsaw, PolandJerzy M. Langer, Warsaw, PolandJanina Legendziewicz, Wrocław, PolandBenedykt Licznerski, Wrocław, Poland
Tadeusz Luty, Wrocław, PolandJoop H. van der Maas, Utrecht, The NetherlandsBolesław Mazurek, Wrocław, PolandGerd Meyer, Cologne, GermanyJan Misiewicz, Wrocław, PolandJerzy Mroziński, Wrocław, PolandRobert W. Munn, Manchester, U.K.Krzysztof Nauka, Palo Alto, CA, U.S.A.Stanislav Nešpůrek, Prague, Czech RepublicRomek Nowak, Santa Clara, CA, U.S.A.Tetsuo Ogawa, Osaka, JapanRenata Reisfeld, Jerusalem, IsraelMarek Samoć, Canberra, AustraliaJan Stankowski, Poznań, PolandLeszek Stoch, Cracow, PolandJan van Turnhout, Delft, The NetherlandsJacek Ulański, Łódź, PolandWalter Wojciechowski, Wrocław, PolandVladislav Zolin, Moscow, Russia
The Journal is supported by the State Committee for Scientific Research
Editorial Office
Anna SofińskaŁukasz Maciejewski
Editorial layout
Hanna Basarowa
Cover design
Zofia i Dariusz Godlewscy
Printed in Poland
Copyright by Oficyna Wydawnicza Politechniki Wrocławskiej, Wrocław 2002
Drukarnia Oficyny Wydawniczej Politechniki WrocławskiejZam. nr 664/2002.
Contents
Papers presented at the 4 International Conference
on Electronic Processes in Organic Materials, ICEPOM-4, Lviv, Ukraine
L. Yu. Gryshchuk, L.O. Vretik, V.G. Syromyatnikov, Dependence of polymerization abilityof maleimidophenyl methacrylates on л-electron structure of maleimide fragments 5 [257]
F. Ragot, S. Belin, V.G. Ivanov, D.L. Perry, M. Ortega, T.V. Ignatova, I.G. Kolobov,E.S. Masalitin, G.V. Kamarchuk, A.V. Yeremenko, P. Molinie, J. Wéry, E. Faulques,Electronic and magnetic dynamic properties of imidazolate complexes 13 [265]
V. Zaitsev, В. Kebbecus, Use of vibronic phenomena in adsorption phase for developing ofsemiconductor gas sensors 29 [281]
A. V. Zaitseva, V. M. Rudoy, O.V. Dement'eva, M.E. Kartseva, Study of polystyrene surfacelocal mechanical properties by the atomic force microscopy 37 [289]
K. Janus, K. Matczyszyn, J. Sworakowski, Kinetics of photochemical processes in photo-chromic azobenzene derivatives. Effect of matrix and of the phase stability 45 [297]
V. B. Zaitsev, A.N. Nevzorov, G.S. Plotnikov, Optical properties of ferroelectric Langmuir-Blodgett films impregnated with dye molecules 57 [309]
A. P. Pospelov, M.V. Ved, N.D. Sakhnenko, Y.L. Alexandrov, V.V. Shtefan, A.V. Kravchenko,G.V. Kamarchuk, High-conductivity organic metals as electrode materials 65 [317]
V. I. Kalchenko, I.A.Koshets, E.P. Matsas, O.N. Kopylov, A. Solovyov, Z.I. Kazantseva,Yu.M. Shirshov, Calixarene-based QCM sensors array and its response to volatile or-ganic vapours 73 [325]
Materials Science, Vol. 20, No. 3, 2002
Dependence of polymerization ability of maleimidophenyl methacrylates on π-electron
structure of maleimide fragments
L.YU. GRYSHCHUK*, L.O. VRETIK, V.G. SYROMYATNIKOV
Kyiv Taras Shevchenko University, Volodimirs’ka Str., 64, 01033, Kyiv-33, Ukraine
New maleimidophenyl methacrylates with different substituents in maleimide fragments were syn-thesized and their structures were confirmed by nuclear magnetic resonance spectroscopy. The kinetics of radical thermoinitiated homopolymerization of these monomers in N,N-dimethylformamide (DMF) solutions in the presence of AIBN at 80 °C have been investigated with dilatometry. Substituents varia-tion in the maleimide units gave us the opportunity to systematize the results obtained. It was found that not only the unsubstituted maleimide groups take part in a cross-linking processes during the thermoiniti-ated radical polymerization of these monomers, but also the monomer with X1 = H, X2 = CH3. Other monomers formed linear polymers. For monomers with tetrahydrophthalimide larger substituent cross-linking processes are observed after homopolymerization of methacrylic group. The activity of synthe-sized compounds has been discussed.
Key words: phenyl methacrylates; radical polymerization; self-copolymerization; cross-linking
1. Introduction
Significant interest has been focused on monomers that contain two or more differ-ent reactive groups, which can independently take part in diverse polymerization processes. Such polyfunctional monomers afford the possibility, at least at principle, of carrying out selective polymerization reactions consecutively involving each type of active group while keeping other groups intact. It is along these lines that efficient routes exist for the preparation of graft-copolymers, reactive homopolymers and co-polymers which can be modified by means of polymer-analogous transformations, curing or vulcanization without the introduction of any additives.
_________ *Corresponding author, e-mail: [email protected], tel. (38044) 221-02-82.
L.YU. GRYSHCHUK et al.
6
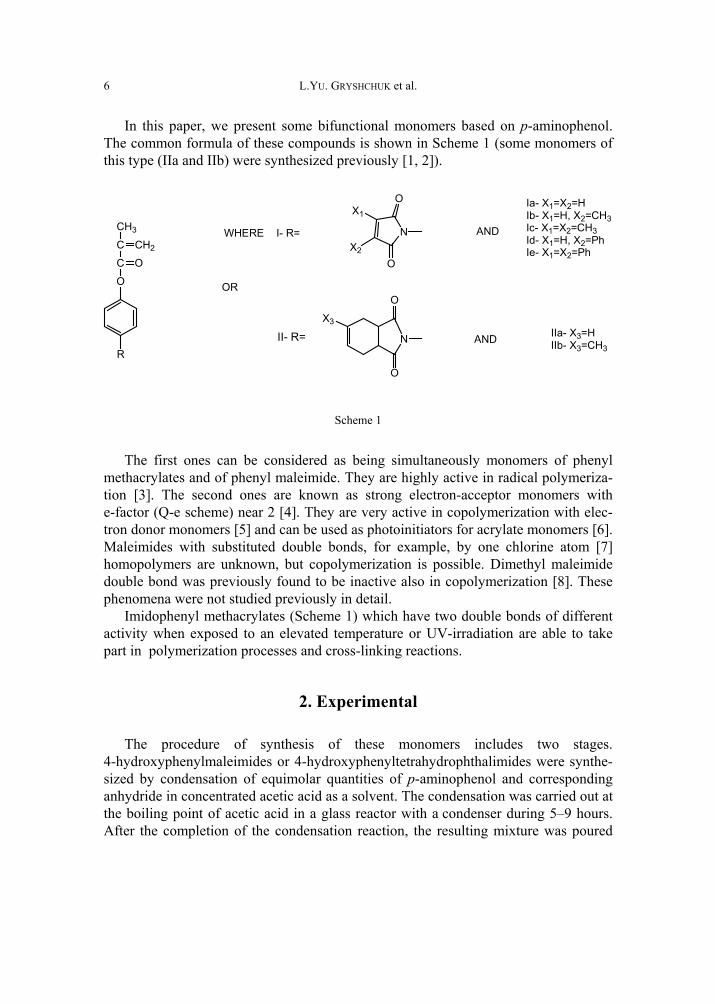
In this paper, we present some bifunctional monomers based on p-aminophenol. The common formula of these compounds is shown in Scheme 1 (some monomers of this type (IIa and IIb) were synthesized previously [1, 2]).
O
R
C OC CH2
CH3 I- R= NX2
X1
O
O
O
O
X3
N
OR
II- R=
AND
Ia- X1=X2=HIb- X1=H, X2=CH3Ic- X1=X2=CH3Id- X1=H, X2=PhIe- X1=X2=Ph
AND IIa- X3=HIIb- X3=CH3
WHERE
Scheme 1
The first ones can be considered as being simultaneously monomers of phenyl methacrylates and of phenyl maleimide. They are highly active in radical polymeriza-tion [3]. The second ones are known as strong electron-acceptor monomers with e-factor (Q-e scheme) near 2 [4]. They are very active in copolymerization with elec-tron donor monomers [5] and can be used as photoinitiators for acrylate monomers [6]. Maleimides with substituted double bonds, for example, by one chlorine atom [7] homopolymers are unknown, but copolymerization is possible. Dimethyl maleimide double bond was previously found to be inactive also in copolymerization [8]. These phenomena were not studied previously in detail.
Imidophenyl methacrylates (Scheme 1) which have two double bonds of different activity when exposed to an elevated temperature or UV-irradiation are able to take part in polymerization processes and cross-linking reactions.
2. Experimental
The procedure of synthesis of these monomers includes two stages. 4-hydroxyphenylmaleimides or 4-hydroxyphenyltetrahydrophthalimides were synthe-sized by condensation of equimolar quantities of p-aminophenol and corresponding anhydride in concentrated acetic acid as a solvent. The condensation was carried out at the boiling point of acetic acid in a glass reactor with a condenser during 5–9 hours. After the completion of the condensation reaction, the resulting mixture was poured
Polymerization ability of maleimidophenyl methacrylates
7
into water. In the case of maleic, citraconic and phenylmaleic anhydrides correspond-ing monoamides were formed.
The synthesis of the monomers was carried out by heating appropriate initial im-ides or monoamides with 30 mass. % excess of methacrylic anhydride in the presence of concentrated sulphuric acid (H2SO4) as a catalyst and phenothiazine as the inhibitor of polymerization. For 4-hydroxyphenylmaleamide, 4-hydroxyphenyl- citraconylamide, and 4-hydroxyphenyl-2-phenylmaleamide imides cycles were formed at the same time of the methacrylation. After the completion of the reaction of methacrylation the resulting mixture was poured into water. Recrystallization was carried out in a toluene–hexane (1:1) mixture. Monomers are soluble at room tempera-ture in acetone, alcohols, 1,4-dioxane, DMF, under the heating in toluene, CCl4 and insoluble in hexane and water.
The structures of the synthesized compounds were confirmed by nuclear magnetic resonance spectroscopy (H1 NMR; Bruker-100 NMR spectrometer). The solvent used for sample preparation was acetone-d6. Tetramethylsilane was used as a reference for peak assignments.
In H1 NMR spectra of monomers Ia–Ie the fragment of methacrylate group was found as signals of methyl protons at 2.07, 2.05, 2.02, 2.06, 2.28 ppm and signals of methylene protons at 5.77, 5.88, 5.84, 5.85, 5.86 ppm (trans-protons) and 6.35, 6.33, 6.31, 6.33, 6.34 ppm (cis-protons) for (Ia), (Ib), (Ic), (Id) and (Ie), respectively. The maleimide fragments of Ia, Ib and Id were found by the signals of protons X1 (see Scheme 1) at 6.85, 6.68 and 7.04 ppm for these monomers, respectively. The substitu-ents in maleimide cycles were found by the signals of methyl protons at 2.12 ppm for Ib, at 2.05 ppm for Ic, or by the signals of phenyl protons at 7.55–7.8 ppm for Id. For Ie the substituents in maleimide cycle were found by signals of phenyl protons at 7.3–7.68 ppm, which give common signals with protons of phenylene ring. For other monomers, the protons of phenylene ring were found as multiplets at 7.22–7.48 ppm for Ia, at 7.25–7.52 ppm for Ib, at 7.1–7.38 ppm for Ic, at 7.23–7.5 ppm for Id.
For study the polymerization ability of these monomers, the kinetics of radical thermoinitiated homopolymerization in solutions with addition of AIBN were investigated with dilatometry. The polymerization was carried out in DMF solutions (5 mass. % con-centration to monomer) at the temperature of 80 °C in the atmosphere of argon.
3. Results and discussion
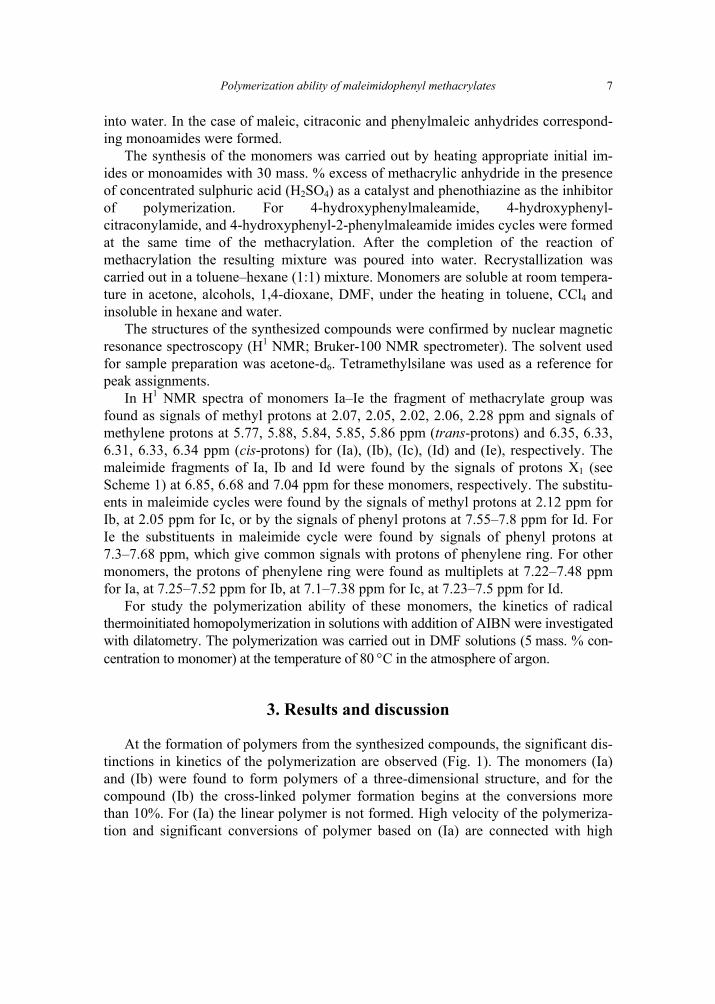
At the formation of polymers from the synthesized compounds, the significant dis-tinctions in kinetics of the polymerization are observed (Fig. 1). The monomers (Іa) and (Іb) were found to form polymers of a three-dimensional structure, and for the compound (Іb) the cross-linked polymer formation begins at the conversions more than 10%. For (Іa) the linear polymer is not formed. High velocity of the polymeriza-tion and significant conversions of polymer based on (Іa) are connected with high
L.YU. GRYSHCHUK et al.
8
activity of non-substituted maleimide double bond, which allows it to enter the proc-esses of copolymerization [9]. Actually, this is a ‘self-copolymerization’ of the monomer on two bonds. For the monomer (Ib) the completion of the reaction at earlier stages and slower polymerization (in comparison with (Іa)) are possible to be ex-plained by a dominant interaction of methacrylic double bond and rather small participation in polymerization processes of the double bond of citraconylimide. Thus, the introduction even of a small substituent essentially reduces the activity of double bond of such a type. The formation of a cross-linked structure indicates that the double bond of citraconylimide is capable of copolymerization. Cross-linking at later stages allows one to select conditions of a selective course of the reaction with the purpose of reception of linear polymers extremely on the methacrylic bond.
0
20
40
60
80
100
0 100 200 300 400
Time, min
Con
vers
ion,
%
5
4
1
2
3
Fig. 1. Kinetic curves of thermoinitiated radical homopolymerization of:
1) Ia, 2) Ib, 3) Ic, 4) Id, 5) Ie in solutions at 80 °C (5 mass. % concentration to monomer in DMF, 1 mass. % AIBN from weight of monomer)
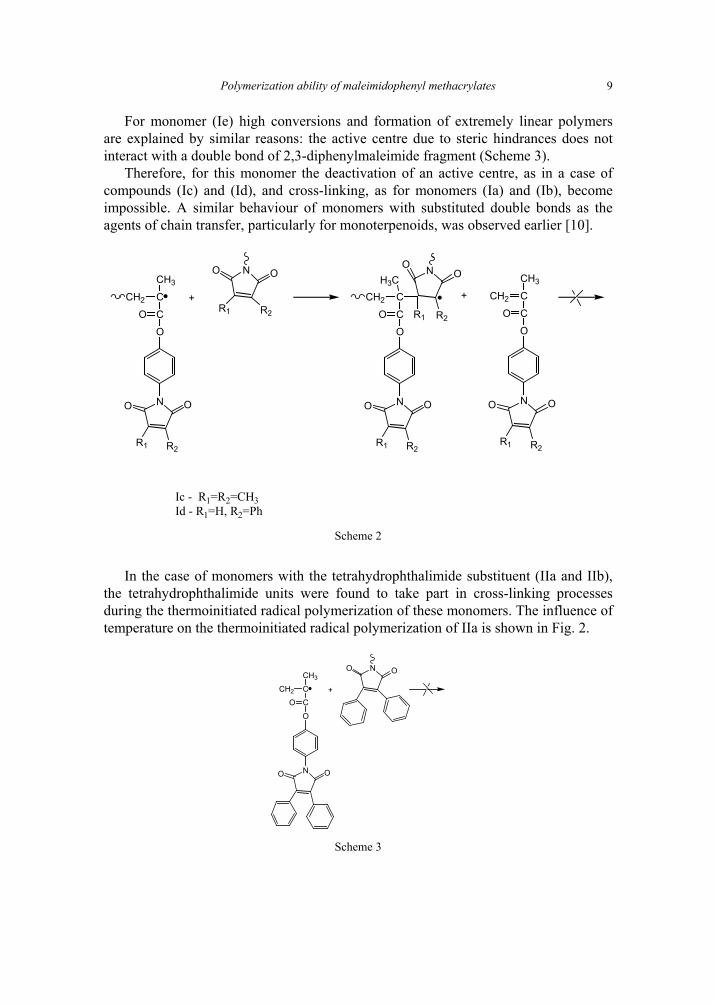
Anther case is observed for monomers (Іc) and (Іd), which in such conditions are polymerized with low rates and yields (no more than 15%). The compound (Ie) is polymerized with a high yield (40%). This fact seems to be rather unusual (especially if one compares the polymerization ability of (Іb) and (Іc), (Іd) and (Ie)). By a more detailed analysis of the results obtained, it is possible to make the following sugges-tions. The first one is that in compounds of such structures both bonds (methacrylic and maleimide) can participate in polymerization. The second one is that the character of the interaction on these bonds depends on the presence and nature of the substituent near a double bond of maleimide. For monomers (Іc) and (Іd), low polymerization ability may be explained by the fact that the deactivation of a growing or starting initi-ating radical occurs owing to the addition to a replaced maleimide. A new radical, due to steric hindrances, is unable to continue both kinetic and material chains (Scheme 2).
Polymerization ability of maleimidophenyl methacrylates
9
For monomer (Ie) high conversions and formation of extremely linear polymers are explained by similar reasons: the active centre due to steric hindrances does not interact with a double bond of 2,3-diphenylmaleimide fragment (Scheme 3).
Therefore, for this monomer the deactivation of an active centre, as in a case of compounds (Іc) and (Іd), and cross-linking, as for monomers (Іa) and (Іb), become impossible. A similar behaviour of monomers with substituted double bonds as the agents of chain transfer, particularly for monoterpenoids, was observed earlier [10].
CH2 CCH3
CO
N OO
R2R1
+
N OO
R2R1OCH2 C
CO
N OO
R2R1
O
N
R2
O
R1
H3CO
+ CH2 CCH3
CO
N OO
R2R1
O
Ic - R1=R2=CH3Id - R1=H, R2=Ph
Scheme 2
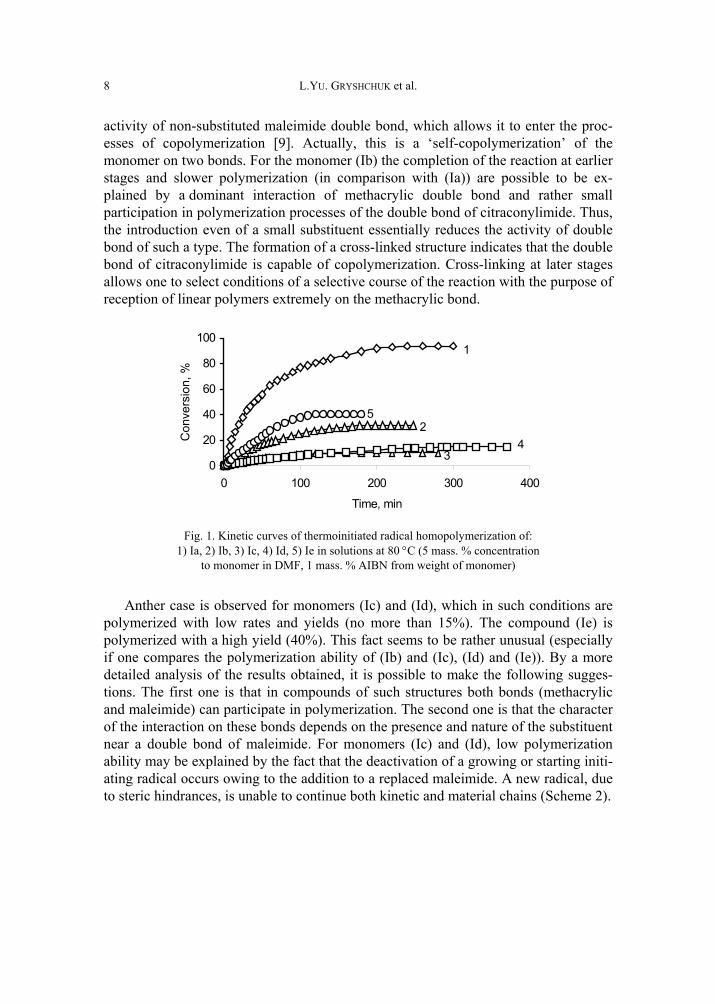
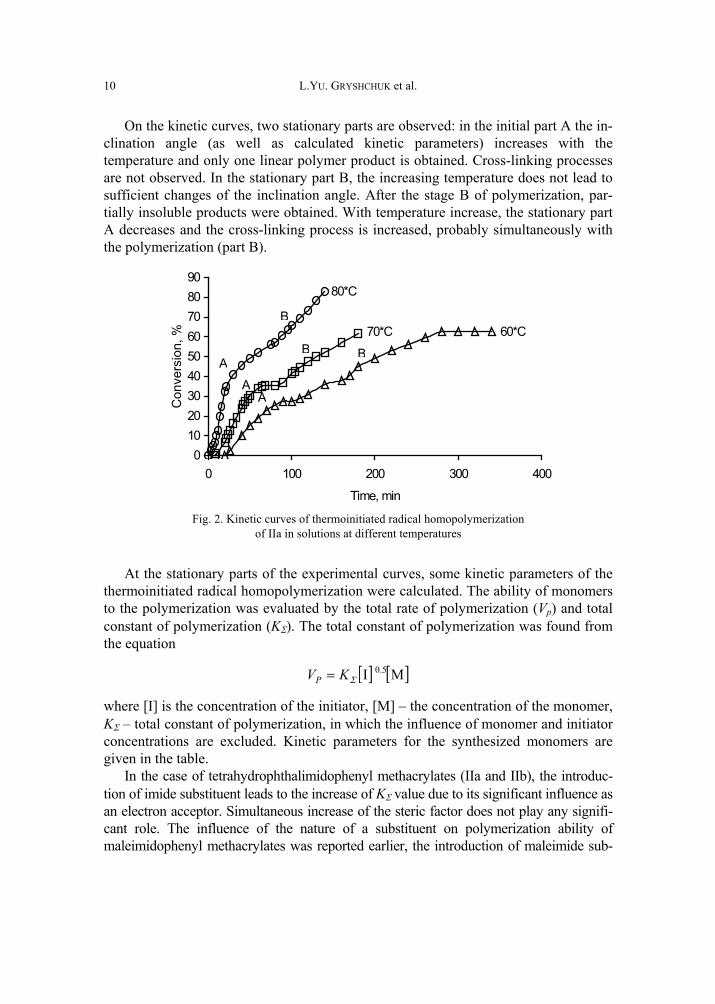
In the case of monomers with the tetrahydrophthalimide substituent (IIa and IIb), the tetrahydrophthalimide units were found to take part in cross-linking processes during the thermoinitiated radical polymerization of these monomers. The influence of temperature on the thermoinitiated radical polymerization of IIa is shown in Fig. 2.
CH2 CCH3
C
O
N OO
+
N OO
O
Scheme 3
L.YU. GRYSHCHUK et al.
10
On the kinetic curves, two stationary parts are observed: in the initial part A the in-clination angle (as well as calculated kinetic parameters) increases with the temperature and only one linear polymer product is obtained. Cross-linking processes are not observed. In the stationary part B, the increasing temperature does not lead to sufficient changes of the inclination angle. After the stage B of polymerization, par-tially insoluble products were obtained. With temperature increase, the stationary part A decreases and the cross-linking process is increased, probably simultaneously with the polymerization (part B).
0102030405060708090
0 100 200 300 400
Time, min
Con
vers
ion,
% 60*C70*C
80*C
A
B
B B
AA
Fig. 2. Kinetic curves of thermoinitiated radical homopolymerization
of IIa in solutions at different temperatures
At the stationary parts of the experimental curves, some kinetic parameters of the thermoinitiated radical homopolymerization were calculated. The ability of monomers to the polymerization was evaluated by the total rate of polymerization (Vp) and total constant of polymerization (KΣ). The total constant of polymerization was found from the equation
[ ] [ ]MI 5.0ΣKVP =
where [I] is the concentration of the initiator, [M] – the concentration of the monomer, KΣ – total constant of polymerization, in which the influence of monomer and initiator concentrations are excluded. Kinetic parameters for the synthesized monomers are given in the table.
In the case of tetrahydrophthalimidophenyl methacrylates (IIa and IIb), the introduc-tion of imide substituent leads to the increase of KΣ value due to its significant influence as an electron acceptor. Simultaneous increase of the steric factor does not play any signifi-cant role. The influence of the nature of a substituent on polymerization ability of maleimidophenyl methacrylates was reported earlier, the introduction of maleimide sub-
Polymerization ability of maleimidophenyl methacrylates
11
stituent also increases KΣ, but the character of changes of total constants of the polymeri-zation depends on the nature of the substituent in maleimide cycle.
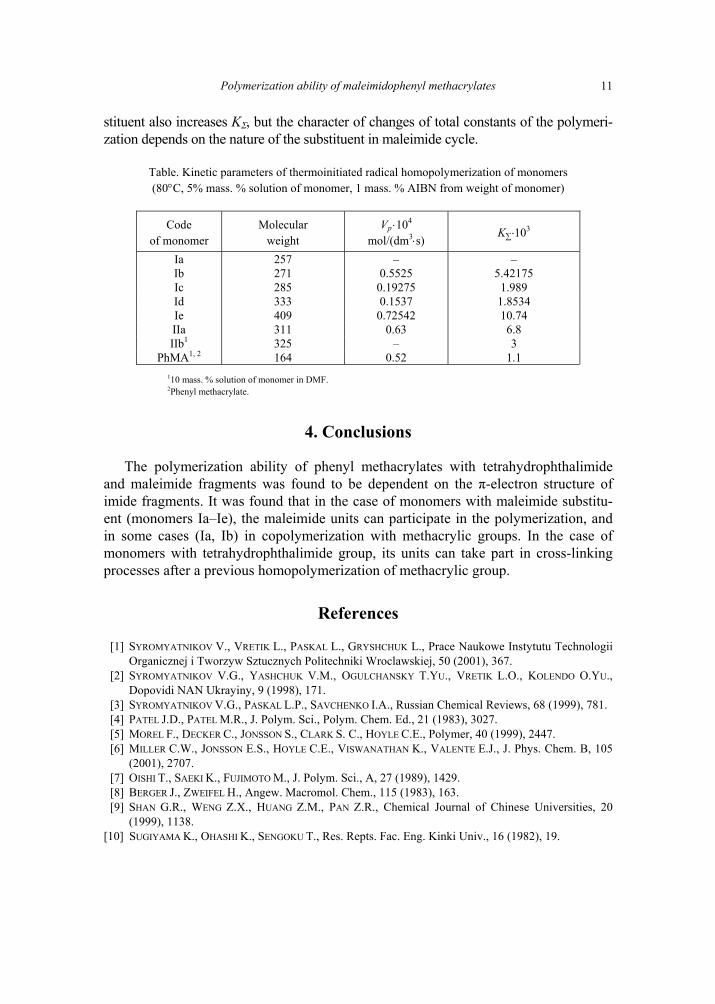
Table. Kinetic parameters of thermoinitiated radical homopolymerization of monomers (80°C, 5% mass. % solution of monomer, 1 mass. % AIBN from weight of monomer)
Code of monomer
Molecular weight
Vp ⋅104 mol/(dm3⋅s)
K∑⋅103
Ia 257 – – Ib 271 0.5525 5.42175 Ic 285 0.19275 1.989 Id 333 0.1537 1.8534 Ie 409 0.72542 10.74 IIa 311 0.63 6.8 IIb1 325 – 3
PhMA1, 2 164 0.52 1.1 110 mass. % solution of monomer in DMF. 2Phenyl methacrylate.
4. Conclusions
The polymerization ability of phenyl methacrylates with tetrahydrophthalimide and maleimide fragments was found to be dependent on the π-electron structure of imide fragments. It was found that in the case of monomers with maleimide substitu-ent (monomers Ia–Ie), the maleimide units can participate in the polymerization, and in some cases (Ia, Ib) in copolymerization with methacrylic groups. In the case of monomers with tetrahydrophthalimide group, its units can take part in cross-linking processes after a previous homopolymerization of methacrylic group.
References
[1] SYROMYATNIKOV V., VRETIK L., PASKAL L., GRYSHCHUK L., Prace Naukowe Instytutu Technologii Organicznej i Tworzyw Sztucznych Politechniki Wroclawskiej, 50 (2001), 367.
[2] SYROMYATNIKOV V.G., YASHCHUK V.M., OGULCHANSKY T.YU., VRETIK L.O., KOLENDO O.YU., Dopovidi NAN Ukrayiny, 9 (1998), 171.
[3] SYROMYATNIKOV V.G., PASKAL L.P., SAVCHENKO I.A., Russian Chemical Reviews, 68 (1999), 781. [4] PATEL J.D., PATEL M.R., J. Polym. Sci., Polym. Chem. Ed., 21 (1983), 3027. [5] MOREL F., DECKER C., JONSSON S., CLARK S. C., HOYLE C.E., Polymer, 40 (1999), 2447. [6] MILLER C.W., JONSSON E.S., HOYLE C.E., VISWANATHAN K., VALENTE E.J., J. Phys. Chem. B, 105
(2001), 2707. [7] OISHI T., SAEKI K., FUJIMOTO M., J. Polym. Sci., A, 27 (1989), 1429. [8] BERGER J., ZWEIFEL H., Angew. Macromol. Chem., 115 (1983), 163. [9] SHAN G.R., WENG Z.X., HUANG Z.M., PAN Z.R., Chemical Journal of Chinese Universities, 20
(1999), 1138. [10] SUGIYAMA K., OHASHI K., SENGOKU T., Res. Repts. Fac. Eng. Kinki Univ., 16 (1982), 19.

L.YU. GRYSHCHUK et al.
12
Received 7 June 2002 Revised 7 July 2002
Materials Science, Vol. 20, No. 3, 2002
Electronic and magnetic dynamic properties of imidazolate complexes
F. RAGOT1, S. BELIN2, V.G. IVANOV3, D.L. PERRY4, M. ORTEGA4, T.V. IGNATOVA5, I.G. KOLOBOV5, E.A. MASALITIN 5, G.V. KAMARCHUK5,
A.V. YEREMENKO5, P. MOLINIÉ1, J. WÉRY1, E. FAULQUES1∗
1 Institut des Matériaux Jean Rouxel, 2 rue de la Houssinière, BP 32229, 44322 Nantes, France 2LURE, 91898 Orsay, France
3Faculty of Physics, University of Sofia, 5 James Bourchier Blvd., BG1147 Sofia, Bulgaria 4Lawrence Berkeley National Laboratory, 1 Cyclotron Road, Berkeley, CA 94720 USA
5B. Verkin Institute for Low Temperature Physics and Engineering, 47 Lenin Ave., Kharkov 61103, Ukraine
Transition-metal complexes of imidazole ImH (C3H4N2) are relevant for the study of metalloen-zymes and protein folding. Moreover, these materials could lead to potential applications such as electrochromic displays, photovoltaic cells and biomaterials. A series of metal–imidazole complexes of general formula −+
xx ImM (where x = 1, 2, M = Ag, Zn, Co, Cu and Im– = C3H3N2 is the deprotonated
form of ImH) was synthesized and comprehensively studied as model materials for metalloproteins and molecular magnets. Their atomic dynamic properties were investigated with X-ray diffraction, XANES, EXAFS, vibrational spectroscopy and magnetic techniques. Metal–ligand bond lengths and force con-stants were estimated. The relationship between these structural data and rich spin dynamics revealed for M = Cu, Co bis-imidazolate compounds is discussed.
Key words: transition metal imidazolates; EXAFS; vibrations; magnetism; ultrasound velocity
1. Introduction
The heterocyclic imidazole molecule C3H4N2 (ImH) and its parent forms (histidine, histamine, Fig. 1A) are found to be ligands forming complexes with transition metal ions in a great variety of biological molecules such as metalloproteins and enzymes _________
∗Corresponding author, e-mail: [email protected].
F. RAGOT et al.
14
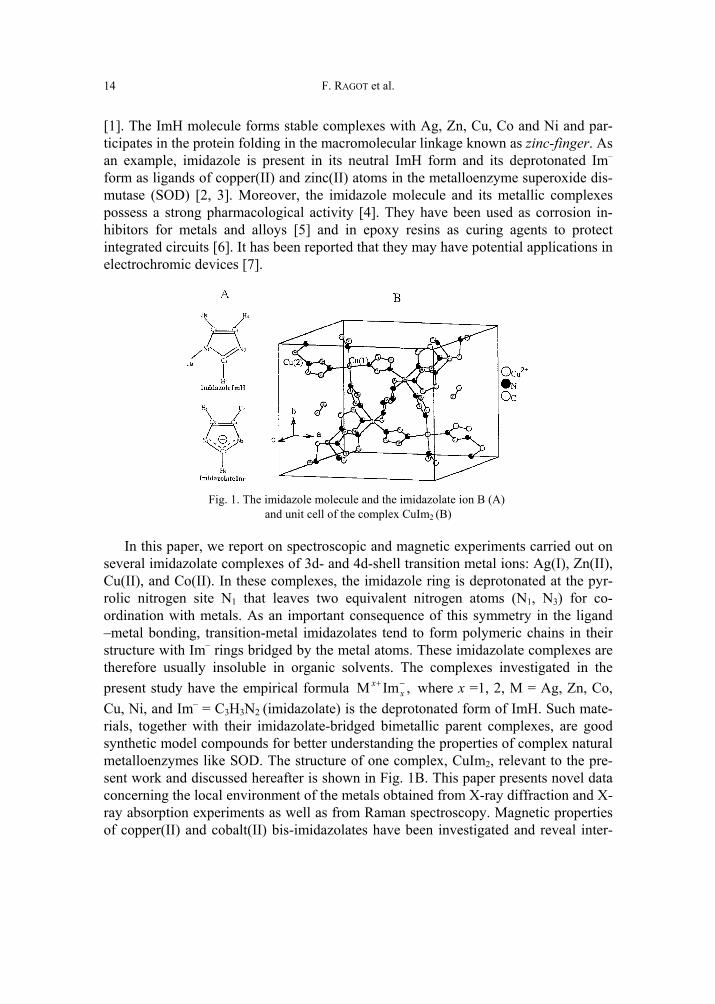
[1]. The ImH molecule forms stable complexes with Ag, Zn, Cu, Co and Ni and par-ticipates in the protein folding in the macromolecular linkage known as zinc-finger. As an example, imidazole is present in its neutral ImH form and its deprotonated Im– form as ligands of copper(II) and zinc(II) atoms in the metalloenzyme superoxide dis-mutase (SOD) [2, 3]. Moreover, the imidazole molecule and its metallic complexes possess a strong pharmacological activity [4]. They have been used as corrosion in-hibitors for metals and alloys [5] and in epoxy resins as curing agents to protect integrated circuits [6]. It has been reported that they may have potential applications in electrochromic devices [7].
Fig. 1. The imidazole molecule and the imidazolate ion B (A)
and unit cell of the complex CuIm2 (B)
In this paper, we report on spectroscopic and magnetic experiments carried out on several imidazolate complexes of 3d- and 4d-shell transition metal ions: Ag(I), Zn(II), Cu(II), and Co(II). In these complexes, the imidazole ring is deprotonated at the pyr-rolic nitrogen site N1 that leaves two equivalent nitrogen atoms (N1, N3) for co-ordination with metals. As an important consequence of this symmetry in the ligand –metal bonding, transition-metal imidazolates tend to form polymeric chains in their structure with Im– rings bridged by the metal atoms. These imidazolate complexes are therefore usually insoluble in organic solvents. The complexes investigated in the present study have the empirical formula ,ImM −+
xx where x =1, 2, M = Ag, Zn, Co,
Cu, Ni, and Im– = C3H3N2 (imidazolate) is the deprotonated form of ImH. Such mate-rials, together with their imidazolate-bridged bimetallic parent complexes, are good synthetic model compounds for better understanding the properties of complex natural metalloenzymes like SOD. The structure of one complex, CuIm2, relevant to the pre-sent work and discussed hereafter is shown in Fig. 1B. This paper presents novel data concerning the local environment of the metals obtained from X-ray diffraction and X-ray absorption experiments as well as from Raman spectroscopy. Magnetic properties of copper(II) and cobalt(II) bis-imidazolates have been investigated and reveal inter-
Dynamic properties of imidazolate complexes
15
esting spin dynamics, not published so far to our knowledge. All these properties are discussed in relation to the structure of the materials investigated.
2. Experimental
Imidazolate complexes of transition metals were synthesized following the Bau-man and Wang method by mixing imidazole with metallic nitrate hydrates in aqueous solutions [8], followed by the subsequent de-protonation of the imidazole molecule with the addition of a base. The complexes are obtained in powder forms of generic formula ,ImM −+
xx whose composition was checked by elemental analysis at the
Vernaison CNRS Centre, France. Raman spectra at room temperature were recorded using the λL= 457.9 nm line of an Ar+ ion laser with a Jobin–Yvon T64000 spec-trometer equipped with a multichannel charge-coupled device (CCD) detector cooled to 77 K. The samples were analyzed under an Olympus confocal microscope with an objective of 100-fold magnification, giving 2 µm spatial resolution. The experimental spectral resolution was 2 cm–1. The samples were extremely sensitive to light illumi-nation, and laser power on crystallites was kept below 1 mW.
Fourier-transform Raman spectra were carried out with a Bruker instrument using the 1064 nm excitation line of a Nd:YAG laser. Reflectance Fourier-transform infrared (FTIR) spectra were taken with a 20 SXC Nicolet bench with 4 cm–1 resolution. X-ray diffraction patterns were recorded with an Inel CPS 120 diffractometer by using the Kα1 line of copper. Refinements were performed by the Rietveld method with the Jana 2000 software [9]. EXAFS and XANES spectra were obtained in a transmission mode at LURE, Orsay, on the XAS4 spectrometer. Spectral analysis was carried out with the FEFF7-software [10]. Magnetic data were acquired in the 5–300 K temperature range with a SQUID apparatus in zero-field cooling and field-cooling modes with applied fields varying between 0 and 5000G. SQUID outputs were corrected for the magnetization of the sample holder and for atomic diamagnetism with Pascal constants.
The sound velocity absolute values, the relative changes of the velocity, and the at-tenuation were measured by the phase method at the frequency of about 55 MHz. The apparatus is a phase and amplitude self-balanced high frequency bridge working in the pulsed mode. The samples (pellets) were placed between germanium delay lines. The phase-frequency characteristics of the delay lines with or without sample between them were taken for the absolute velocities measurements. The difference of these phase-frequency curves is a straight line with a slope determined by the sound velocity that is sought. The absolute values of sound velocities have been measured at 77 K, and they were equal (within the error limit) to vl = 4.9⋅105 cm/sec and vt = 2.5⋅105 cm/sec for all complexes. A similar technique was used recently for the in-vestigations of MgB2 acoustic properties [11]. The temperature was measured with a carbon resistance thermometer. For the measurements in the external magnetic field, a superconducting solenoid was used with the field parallel to the sound-wave vector.
F. RAGOT et al.
16
3. Results and discussion
3.1. Structural data
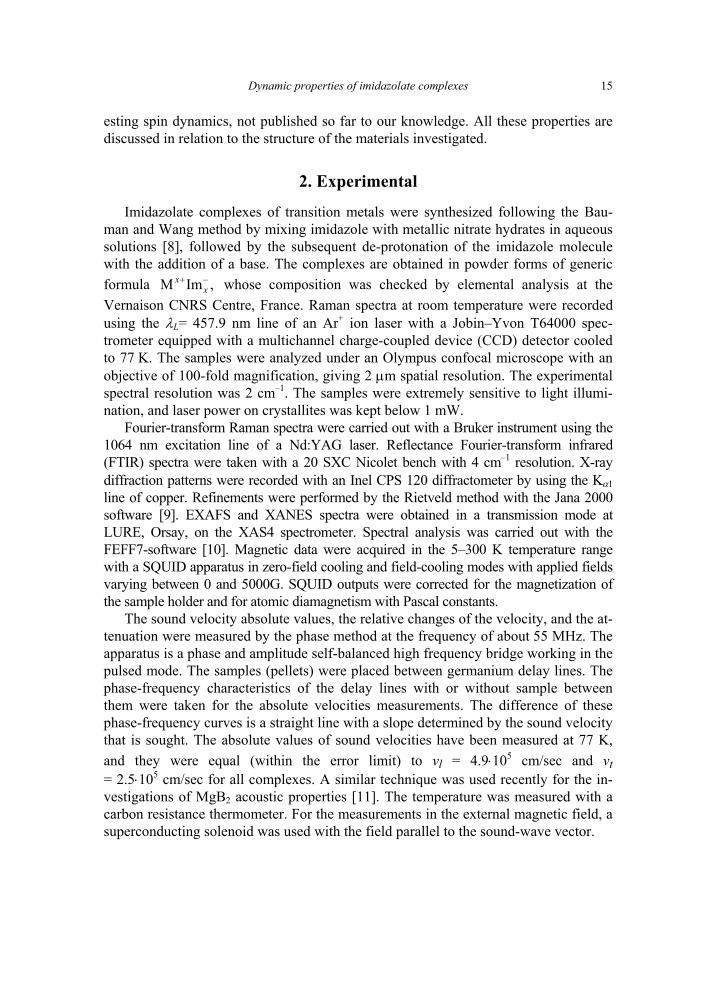
The powder X-ray diffractograms (XRD) recorded on imidazolate complexes gave d values matching very well those listed in an early work [12] and confirming that the syntheses of the complexes were properly achieved (Fig. 2). In particular, the XRD pattern of ZnIm2 has been refined with modern ab-initio softwares, and this sample was found to belong to the tetrahedral space group I41cd with cell parameters a = b = 23.48 Å and c = 12.44 Å, close to those given in a previous study [13]. The structure can be described by four imidazolate anions linked to the Zn atom via N–Zn bonds in tetrahedral environment. The crystal consists of a complicated three-dimensional network with a preferential orientation of the polymeric Im–Zn–Im–Zn chain along the a and c-axes. A more detailed description will be published elsewhere [14].
Fig. 2. X-ray diffractograms of CoIm2 (a), ZnIm2 (b), NiIm2 (c), CuIm2 (d), AgIm (e).
Stars indicate reflections not observed in Ref. [12]
The compound AgIm yields the same XRD patterns as previously reported. It be-longs to the orthorhombic space group P212121, with a = 5.5759 Å, b = 6.7452 Å,
Dynamic properties of imidazolate complexes
17
c = 22.174 Å [15]. In this structure, polymeric quasi-one-dimensional chains [AgIm]n are preferentially oriented along the c-axis with linearly co-ordinated Ag atoms linked by imidazolate rings.
The X-ray diffractogram of CoIm2 could not be exploited, since reflections were absent. For CuIm2, our discussion will be based on previous structural refinements. Scanning electron microscope (SEM) photos show that CuIm2 microcrystals are nee-dles of 10–20×100 nm2 in size. CoIm2 powder consists of spheroids with diameter of 50 nm. This compound seems to be nanostructured with the synthesis route choosen. To probe the local environment of copper and cobalt in these complexes, XANES and EXAFS analyses of both samples were performed. They are summarized in the table. Particulars relative to spectra and radial distribution functions will be provided in a forthcoming paper.
Table. EXAFS results for CuIm2 and CoIm2
CuO CuIm2 Co(NO3)3.6H2O CoIm2
N = 4 ρ = 0.9%
N = 3.6 ρ = 0.05%
N = 6 ρ = 0.6%
N = 3.13 ρ = 0.5%
σ = 5.8×10⁻² σ = 6.4×10⁻² σ = 9.1×10⁻² σ = 6.2×10⁻² Γ = 1 Γ = 0 Γ = 0.732 Γ = 0.732
R = 1.95 Å R = 1.96 Å R = 2.066 Å R = 1.972 Å
N – number of first neighbours (± 10%), σ – Debye–Waller factor (± 20%), Γ = k/λ(k), where k is the photoelectron wavevector and λ(k) its mean-free path, R – distance between metal atoms and the absorber (N or O atom) with uncertainty of 0.01 Å, ρ – reliability factor.
The complete determination of the CoIm2 structure was reported by Sturm et al. [16] and includes H co-ordinates. They found that the compound crystallizes in the tetragonal space group I41 with a = b = 22.8724 Å, c = 12.9813 Å, and Z = 32. The structure is quite complicated. The imidazolate molecules form helices with Co atoms in tetrahedral envi-ronment. The XANES spectrum which we have recorded on CoIm2 exhibits a strong pre-peak around 7711 eV which is absent for the cobalt nitrate standard and characteristic of a non-centrosymmetrical environment (Td or C4v). The results of our EXAFS analysis compiled in the table reveal that the Co atoms are in perfect tetrahedral environment. In particular, the R distance we have calculated (1.972 ± 0.01 Å) confirms a number of Co–N bond lengths listed in Ref. [16]: Co(2)–N(13) – 1.973(13) Å, Co(1)–N(11) – 1.972(14) Å, Co(4)–N(41) – 1.970(13) Å.
The structure of CuIm2 was first described by Jarvis and Wells (1960) to possess a unit cell in space group I2/c and re-evaluated later by Freeman as being of space group C2/c with a = 15.51 Å, b = 14.07 Å, c = 8.77 Å, β = 131.3° and Z = 8 [17]. Copper was found to occupy two different sites, Cu(1) and Cu(2). The arrangement of the imidazolate ligands around Cu(1) is strictly square-planar, while the co-ordination around Cu(2) is flattened tetrahedral. The N–Cu(1)–N angles are 89.09° and 90.91°, while the N–Cu(2)–N angles of the tetrahedron are 95.85°, 96.65°, and 97.80°. The
F. RAGOT et al.
18
crystalline structure may be seen as –Cu(1)–Im–Cu(2)–Im–Cu(1)– infinite chains kinked at the Cu(2) atoms. The unit cell of CuIm2 is shown in Fig. 1B. This structure is certainly consistent with a very peculiar needle-shaped crystalline morphology ob-served in SEM. The structural data might benefit from reassessment with modern techniques, but they are well supported by our X-ray absorption measurements. In-deed, our XANES spectra show a weak pre-peak at 8982 eV and an absorption edge peak near 8989 eV for the CuO standard and CuIm2 indicative of a D4h local symme-try. EXAFS radial distribution functions confirm that the first co-ordination sphere of Cu is similar for CuO and CuIm2. The refined results (cf. the table) are in agreement with Cu atoms in square-planar environment. Note that the R value (1.96 ± 0.01 Å) matches Cu(2)–N bond lengths obtained from XRD (1.96 Å and 1.97 Å) and is lower than Cu(1)–N bond lengths (1.99 Å and 2.00 Å) found in 1967.
3.2. Vibrational spectra
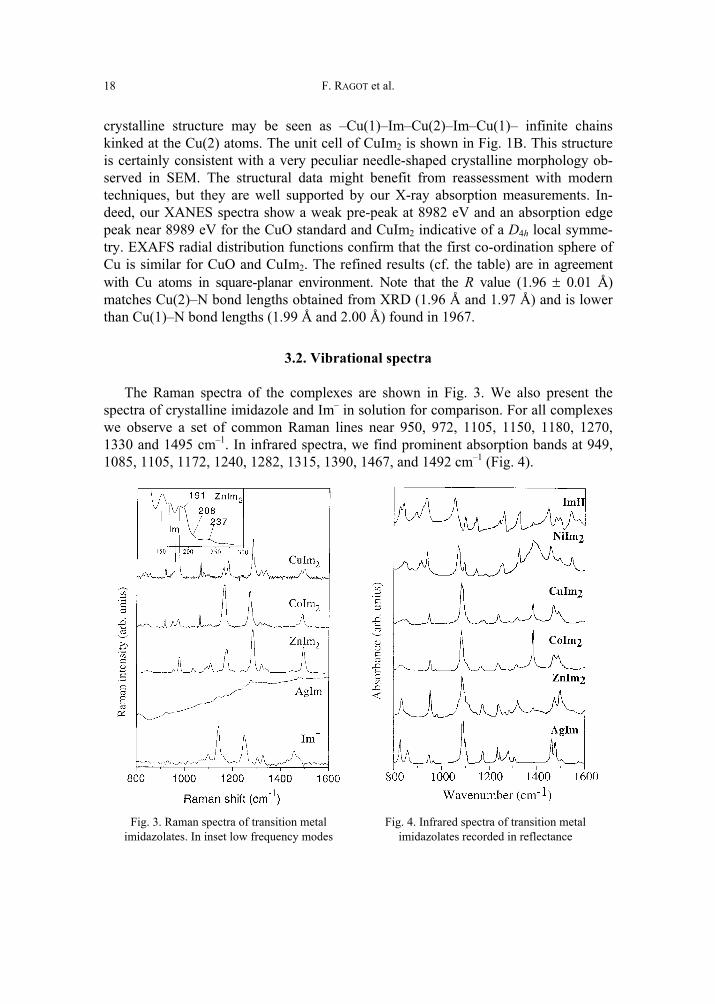
The Raman spectra of the complexes are shown in Fig. 3. We also present the spectra of crystalline imidazole and Im– in solution for comparison. For all complexes we observe a set of common Raman lines near 950, 972, 1105, 1150, 1180, 1270, 1330 and 1495 cm–1. In infrared spectra, we find prominent absorption bands at 949, 1085, 1105, 1172, 1240, 1282, 1315, 1390, 1467, and 1492 cm–1 (Fig. 4).
Fig. 3. Raman spectra of transition metal imidazolates. In inset low frequency modes
Fig. 4. Infrared spectra of transition metal imidazolates recorded in reflectance
Dynamic properties of imidazolate complexes
19
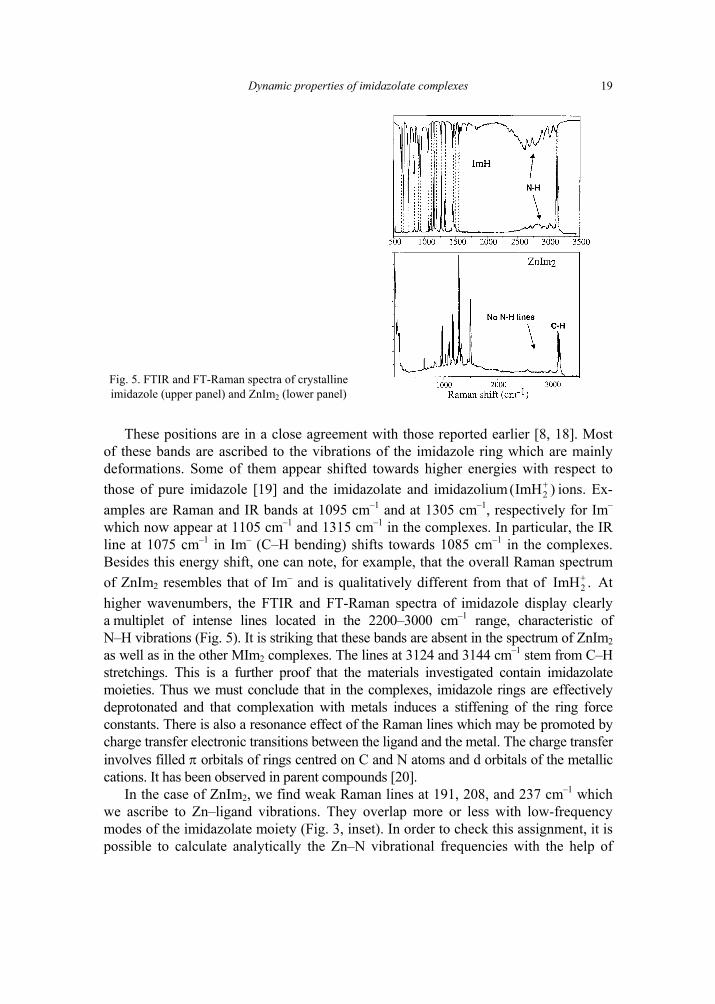
Fig. 5. FTIR and FT-Raman spectra of crystalline imidazole (upper panel) and ZnIm2 (lower panel)
These positions are in a close agreement with those reported earlier [8, 18]. Most of these bands are ascribed to the vibrations of the imidazole ring which are mainly deformations. Some of them appear shifted towards higher energies with respect to those of pure imidazole [19] and the imidazolate and imidazolium )ImH( 2
+ ions. Ex-amples are Raman and IR bands at 1095 cm–1 and at 1305 cm–1, respectively for Im– which now appear at 1105 cm–1 and 1315 cm–1 in the complexes. In particular, the IR line at 1075 cm–1 in Im– (C–H bending) shifts towards 1085 cm–1 in the complexes. Besides this energy shift, one can note, for example, that the overall Raman spectrum of ZnIm2 resembles that of Im– and is qualitatively different from that of .ImH2
+ At higher wavenumbers, the FTIR and FT-Raman spectra of imidazole display clearly a multiplet of intense lines located in the 2200–3000 cm–1 range, characteristic of N–H vibrations (Fig. 5). It is striking that these bands are absent in the spectrum of ZnIm2 as well as in the other MIm2 complexes. The lines at 3124 and 3144 cm–1 stem from C–H stretchings. This is a further proof that the materials investigated contain imidazolate moieties. Thus we must conclude that in the complexes, imidazole rings are effectively deprotonated and that complexation with metals induces a stiffening of the ring force constants. There is also a resonance effect of the Raman lines which may be promoted by charge transfer electronic transitions between the ligand and the metal. The charge transfer involves filled π orbitals of rings centred on C and N atoms and d orbitals of the metallic cations. It has been observed in parent compounds [20].
In the case of ZnIm2, we find weak Raman lines at 191, 208, and 237 cm–1 which we ascribe to Zn–ligand vibrations. They overlap more or less with low-frequency modes of the imidazolate moiety (Fig. 3, inset). In order to check this assignment, it is possible to calculate analytically the Zn–N vibrational frequencies with the help of
F. RAGOT et al.
20
a simplified model assuming a quasi-square-planar geometry around the Zn atom. In this geometry, the vibrational in-plane modes are represented by Γ = A1g + B1g + B2g + 2Eu. The B2g vibration is a pure N–Zn–N bending and has a very low frequency. The other modes involve substantial Zn–N stretching and are much more energetic. It is easy to show that in symmetrized co-ordinates the Zn–N stretching frequencies are:
2/12/1
)1(1)1(1 ,
=
=
N
EuEu
N
gBgAgBgA m
Fm
Fωω (1)
where FA1g, FB1g, FEu are the force constants in symmetrized internal co-ordinates which can be expressed as
FA1g = F0 + 2F1 + F2
FB1g = F0 – 2F1 + F2 (2)
FEu = F0 – F2
F0, F1, F2 are the force constants, respectively, associated with the internal co-ordinates defined by the Zn–N stretching, the (Zn–N, Zn–N) interaction between pairs of bonds at the angle of 90° and the (N–Zn, Zn–N) interaction between pairs of bonds at the angle of 180°; mN is the atomic mass of nitrogen.
The force constants FA1g, FB1g, FEu of the ZnN4 model were derived from an ab-initio calculation with the MOPAC software [21] which yields: F0 = 1.785 mdyn/Å, F1 = 0.156 mdyn/Å, F2 = 0.066 mdyn/Å. To obtain the metal–ligand frequencies in the complexes, we keep the interactions of the ZnN4 model by replacing each N atom by an imidazolate group, where mN is substituted by mIm– = 67.07 uma, which finally gives:
ωA1g = 234 cm–1, ωB1g = 197 cm–1, and ωEu = 208 cm–1
These calculated values are very near to the experimental ones. This preliminary model is able to explain the low-frequency lines of the vibrational spectra and to ac-count for an estimate of the dynamical interactions between the ligands and the metal. Since the atomic radii of Zn, Cu, and Co are close (1.53 Å, 1.57 Å, and 1.67 Å, re-spectively), the metal–ligand force constants and frequencies should not vary significantly from one compound to another.
3.3. Magnetic properties
Magnetic susceptibility experiments reveal that CuIm2 exhibits an antiferromag-netic (AF) behaviour with a temperature maximum at TN = 111 K. Between 200 K and 300 K, the 1/χ(T) dependence resembles a Curie–Weiss law, and the spins are in a disordered, paramagnetic state due to the dominant contribution of the kT factor. When T decreases, the spins undergo a progressive antiferromagnetic ordering up to
Dynamic properties of imidazolate complexes
21
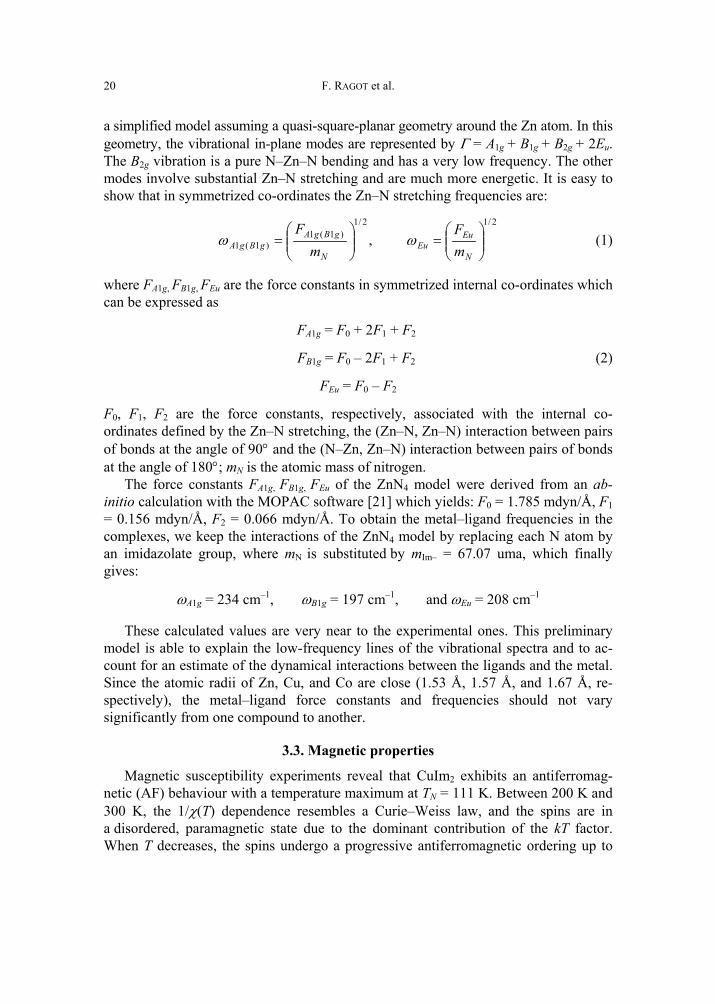
the transition temperature TN. At low temperatures (T < 20 K), the system is purely Curie C/T-dependent with C = 7.746×10⁻³ cm3⋅mol–1 (Fig. 6). This Curie contribution arises most likely from a small fraction of paramagnetic moieties such as chain ends or non-deprotonated imidazole molecules.
Fig. 6. Molar paramagnetic susceptibility of CuIm2
in emu per one mole of copper plotted as a function of temperature. The solid line is a fit to the data with the Bonner–Fisher–Hall law taking into account the contribution of paramagnetic Curie centres at low temperature (S = ½, A = 0.25, B = 0.14995, C′ = 0.30094, D = 1.9862, E = 0.68854, F = 6.0626, ρ = 0.25). The dashed line
is an attempt to fit the data with the Bleaney–Bowers model
In the intermediate temperature range (20 K < T < 250 K), we find that χ(T) cannot be modelled with the analytic Bleaney–Bowers model characterizing isolated copper
F. RAGOT et al.
22
dimers. On the other hand, a non-analytic Bonner–Fisher–Hall law is able to success-fully reproduce the χ(T) data with reliable parameters when T > 20 K [22]:
32
222
0 1'
)1(FxExDx
xCBxAkT
NgTC B
+++
++×−++=
µρρχχ (3)
In Equation (3), ρ represents the amount of paramagnetic centres responsible for the Curie behaviour at low temperature, while A, B, C′, D, E, F are the dimensionless Hall parameters, x = |J|/kT measures the exchange constant, and other symbols have their usual meaning. In this model, invoking antiferromagnetically (J < 0) or ferro-magnetically (J > 0) exchange-coupled uniform copper chains (S = ½), J denotes in fact the nearest-neighbour exchange interaction between copper atoms on the chain, and Eq. (3) derives from a fit based on the Heisenberg Hamiltonian. In our case, we estimate the antiferromagnetic exchange constant around |J|/k = 95 K (J = –66 cm–1) when the Landé factor g is fixed at 2.10 from ESR experiments (not shown here and confirming Cu(II)).
The existence of a quasi-1D magnetism with high uniform spin-chain order in CuIm2 is strongly supported by the crystalline structure of this compound consisting of infinite –Cu(1)–Im–Cu(2)–Im–Cu(1)– chains if we assume indirect exchange between adjacent copper(1) and copper(2) atoms mediated by the nitrogen atoms of the imida-zolate bridge (Fig. 1B). Indeed, depending on copper co-ordinates, the distances between the Cu(1) and Cu(2) atoms along the CuIm2 chain are either 5.889 Å or 5.914 Å. They are smaller than that found, e.g., in copper SOD (6 Å, J = –26 cm–1). The variation of copper distances does not exceed 0.025 Å, so that the spin chains must be seen as quasi-uniform, therefore obeying Eq. (3). On the other hand, the value of J is related to the overlap of the magnetic orbitals of copper atoms and should de-pend on the structural parameters of the bis-imidazolato copper complex: the distances between Cu(1) and Cu(2), the angle α between copper atoms and the Im bridge (Cu–N–C) [23], the angle β between the two Cu–Im bonds, and the dihedral angle θ be-tween the Im ring and the copper co-ordination plane [24]. Considering that imidazolate rings are quasi-planar, the torsional angles θ between the N–C–N ring plane, the Cu(1)–N and the Cu(2)–N bonds are 173.05° and 167.88°, respectively. The angle β between Cu(1)–N and Cu(2)–N is thus evaluated as 160.93°. Finally, the an-gles α are 125.4° (Cu(2)) and 126.33° (Cu(1)). These angles are large with respect to other parent complex structures. In addition, the Cu(1)–Cu(2) distances are on average smaller than in other antiferromagnetic copper complexes containing imidazolate bridges with J values ranging from –2 to –30 cm–1 [23]. We believe that the structural parameters qualitatively well explain the relatively strong antiferromagnetic coupling found in CuIm2.
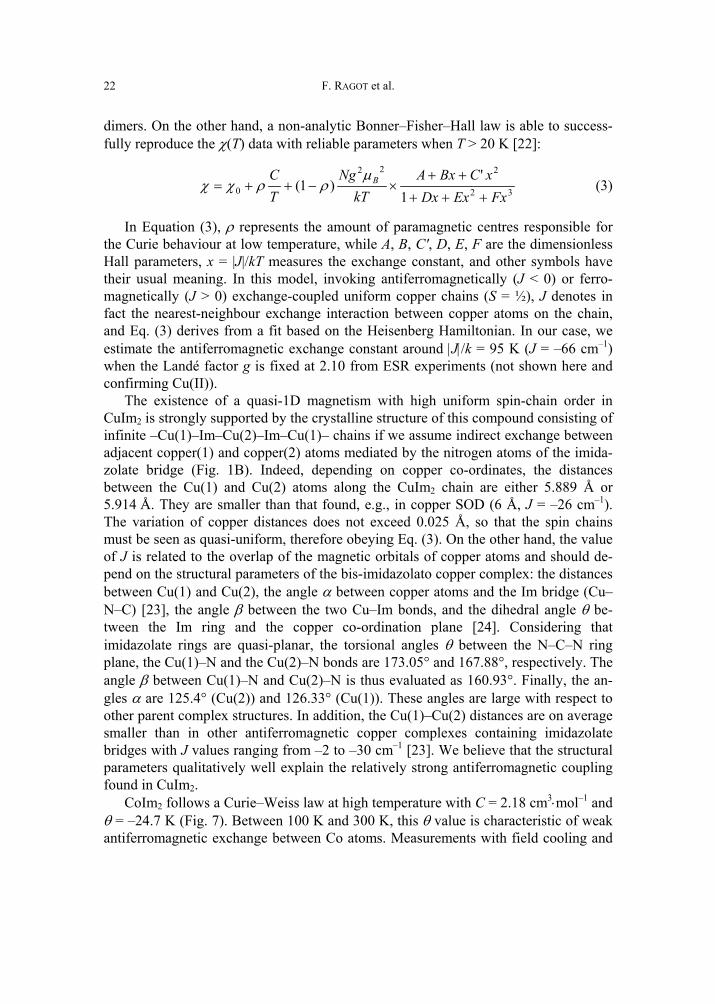
CoIm2 follows a Curie–Weiss law at high temperature with C = 2.18 cm3⋅mol–1 and θ = –24.7 K (Fig. 7). Between 100 K and 300 K, this θ value is characteristic of weak antiferromagnetic exchange between Co atoms. Measurements with field cooling and
Dynamic properties of imidazolate complexes
23
zero-field cooling do not coincide. Indeed, for T = 5 K, it is possible to observe in this sample an hysteresis cycle which is symmetric when the field is varied from –20000 Gauss to 20000 Gauss. Furthermore, it appears that the sample is not paramagnetic at 5 K. The coercive field is weak and amounts to Hc = 152 Gauss, with a remanent mag-netization Mr = 120 Oe⋅mol–1 (Fig. 7). This irreversibility shows that there is no antiferromagnetic behaviour at very low temperature. At high temperature (T > 200 K) no hysteresis cycle appears, since the sample follows the Curie–Weiss law in this range. The 20 K anomaly in χ(T) is most likely due to a change of magnetic regime signalling the appearance of a ferromagnetic order. The results are consistent with the assumption of ferromagnetic domain walls in the sample at low temperature. Thus, CoIm2 behaves like a weak ferromagnet. The role of imidazolate bridges inducing weak and intermediate ferromagnetic interactions was demonstrated by Gupta et al. [25] in a Fe(III)–porphyrin–Cu(II)–Im complex and has been recently confirmed in a polymeric layered bimetallic Mn(II)Fe(III) imidazolate network with intralayer cou-pling [26].
Fig. 7. Molar paramagnetic susceptibility of CoIm2 in emu per one mole of cobalt plotted
as a function of temperature. In the lower panel, the spin magnetization
versus magnetic field is shown
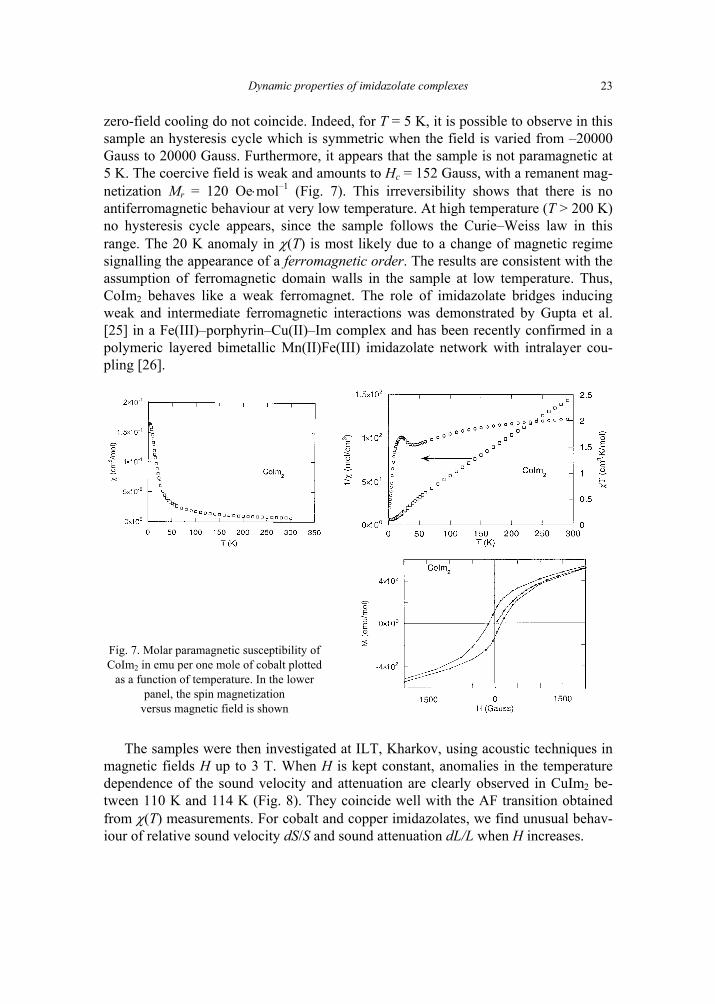
The samples were then investigated at ILT, Kharkov, using acoustic techniques in magnetic fields H up to 3 T. When H is kept constant, anomalies in the temperature dependence of the sound velocity and attenuation are clearly observed in CuIm2 be-tween 110 K and 114 K (Fig. 8). They coincide well with the AF transition obtained from χ(T) measurements. For cobalt and copper imidazolates, we find unusual behav-iour of relative sound velocity dS/S and sound attenuation dL/L when H increases.
F. RAGOT et al.
24
Fig. 8. Temperature dependence of ultrasound velocity
and attenuation in CuIm2 at constant magnetic field
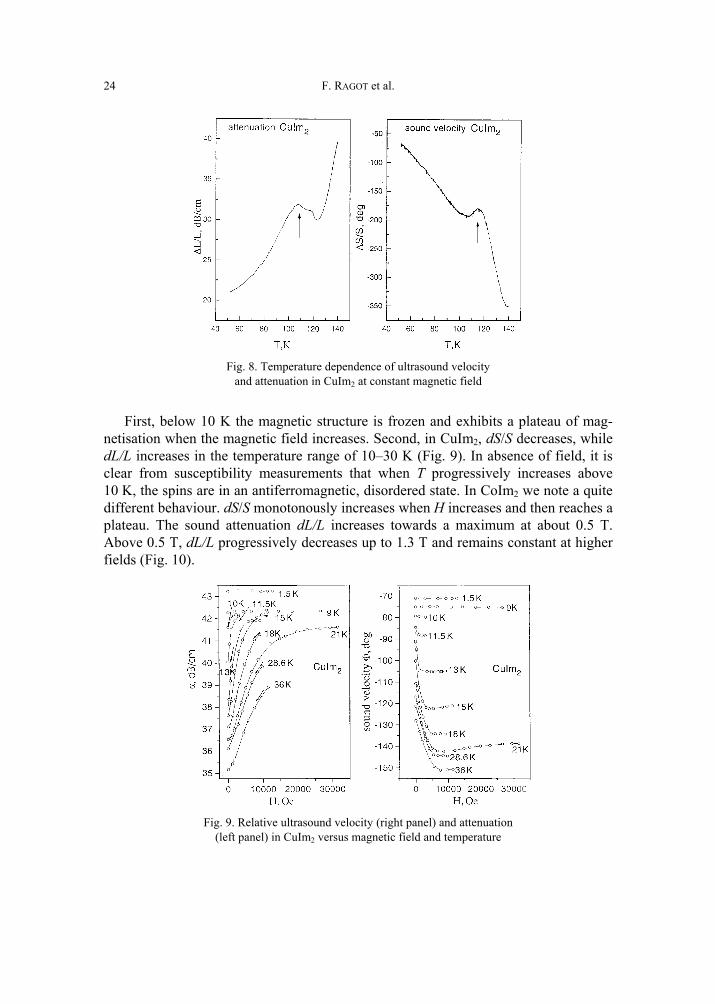
First, below 10 K the magnetic structure is frozen and exhibits a plateau of mag-netisation when the magnetic field increases. Second, in CuIm2, dS/S decreases, while dL/L increases in the temperature range of 10–30 K (Fig. 9). In absence of field, it is clear from susceptibility measurements that when T progressively increases above 10 K, the spins are in an antiferromagnetic, disordered state. In CoIm2 we note a quite different behaviour. dS/S monotonously increases when H increases and then reaches a plateau. The sound attenuation dL/L increases towards a maximum at about 0.5 T. Above 0.5 T, dL/L progressively decreases up to 1.3 T and remains constant at higher fields (Fig. 10).
Fig. 9. Relative ultrasound velocity (right panel) and attenuation
(left panel) in CuIm2 versus magnetic field and temperature
Dynamic properties of imidazolate complexes
25
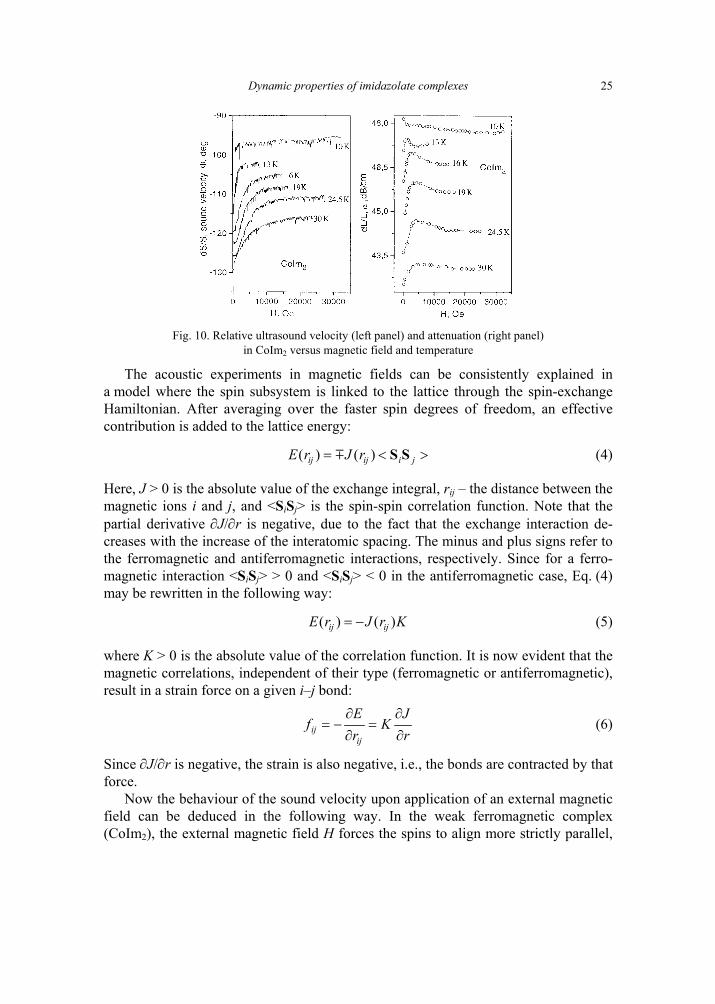
Fig. 10. Relative ultrasound velocity (left panel) and attenuation (right panel)
in CoIm2 versus magnetic field and temperature
The acoustic experiments in magnetic fields can be consistently explained in a model where the spin subsystem is linked to the lattice through the spin-exchange Hamiltonian. After averaging over the faster spin degrees of freedom, an effective contribution is added to the lattice energy:
><= jiijij rJrE SS)()( m (4)
Here, J > 0 is the absolute value of the exchange integral, rij – the distance between the magnetic ions i and j, and <SiSj> is the spin-spin correlation function. Note that the partial derivative ∂J/∂r is negative, due to the fact that the exchange interaction de-creases with the increase of the interatomic spacing. The minus and plus signs refer to the ferromagnetic and antiferromagnetic interactions, respectively. Since for a ferro-magnetic interaction <SiSj> > 0 and <SiSj> < 0 in the antiferromagnetic case, Eq. (4) may be rewritten in the following way:
KrJrE ijij )()( −= (5)
where K > 0 is the absolute value of the correlation function. It is now evident that the magnetic correlations, independent of their type (ferromagnetic or antiferromagnetic), result in a strain force on a given i–j bond:
rJ
KrE
fij
ij ∂∂
=∂∂
−= (6)
Since ∂J/∂r is negative, the strain is also negative, i.e., the bonds are contracted by that force.
Now the behaviour of the sound velocity upon application of an external magnetic field can be deduced in the following way. In the weak ferromagnetic complex (CoIm2), the external magnetic field H forces the spins to align more strictly parallel,
F. RAGOT et al.
26
i.e., K increases. It means that the strain on the bonds increases in magnitude and that they further contract compared to the H = 0 case. In turn, the contraction makes the effective interatomic force constants stronger, and the sound velocity is enhanced. We believe that this mechanism is responsible for the increase of dS/S up to 0.3 T ≥ H ≥ 0.1 T. The plateau in the dS/S curves for greater H values is naturally explained in this model, since in strong magnetic fields, the spins are already aligned, and K reaches its maximum value. Similarly, at the lowest temperature in our experiment (T = 10 K), the spins are almost completely aligned due to the exchange interactions and the effect of the magnetic field on the sound velocity is therefore negligible.
In contrast, the field application on the CuIm2 antiferromagnetic complex tries to destroy the antiferromagnetic order, and the spin–spin correlation function K drops, resulting in a strain diminution. Subsequently, the interatomic bonds lengthen com-pared to the H = 0 case, and, consequently, the sound velocity decreases as observed experimentally. We believe ultrasound propagation would be hampered if isolated dimers are formed in this compound, reinforcing the hypothesis that spin chains exist. It follows that ultrasound measurements under magnetic fields corroborate SQUID measurements and evidence spin-reorientational ordering at T > 10 K in high magnetic fields for the cobalt and copper bis-imidazolate complexes.
4. Conclusion
A series of transition metal–imidazole complexes of general formula −+x
x ImM (where M = Ag, Zn, Co, Cu) was synthesised and comprehensively studied as model materials for metalloproteins and molecular magnets. Vibrational spectra directly demonstrate the de-protonated nature of the imidazole ligands in the complexes. An estimate of metal–ligand force constants and frequencies has been supplied. From XANES/EXAFS spectra, it has been possible to track the local environment of the metals and to provide average metal–ligand bonding distances in CuIm2 and CoIm2 which fully agree with X-ray diffraction structural determinations. Magnetic and acoustic measurements in a wide range of tem-peratures and magnetic fields have revealed rich spin dynamics of the materials under investigation and their flexibility with respect to the 3d shell metals used. From these ex-periments the ability of the imidazolate bridge for fostering long-range indirect magnetic exchange interactions has been confirmed. In summary, we note that several magnetic experiments reported in this paper have not yet been explored previously in this class of materials. They potentially could be applied to better scrutinize the biophysics of more complicated protein active sites.
Acknowledgements
The authors acknowledge support of NATO (grant PST.CLG972846), STCU (2276) and Ministry of Education and Science of Ukraine (201/2001). Two of the authors (D.L.P. and M.O) wish to acknowl-edge support through the Centre for Science and Engineering Education (CSEE) at the Lawrence
Dynamic properties of imidazolate complexes
27
Berkeley National Laboratory with support from the Director, Office of Energy Research, Division of University and Science Education Programs of the U.S. Department of Energy under Contract Number DE-AC03-76SF00098.
References [1] SUNDBERG R. J., MARTIN B., Chem. Rev., 74 (1974), 471. [2] PATEL R. N., PANDEYA K. B., J. Inorg. Chem., 72 (1998), 109. [3] OHTSU H., SHIMAZAKI Y., ODANI A., YAMAUCHI O., Chem. Commun. (1999), 2393–2394. [4] MULLER M., LINDMARK D.G., Antimicrob. Agents Chemother., 9 (1976), 696; HODGKISS R. J.,
JONES G. W., J. Med. Chem., 34 (1991), 2268 . [5] BERGER J., KAHN K., NEUMANN R., Korrosion (Dresden), 10 (1979), 312. [6] YOSHIDA S., ISHIDA H., J. Chem. Phys., 78 (1983), 6960; CHEN Y.-C., CHIU W.-Y., Macromolecules
33 (2000), 6672–6684; BROWN J., HAMERTON I., HOWLIN B.J., J. Appl. Polym. Sci., 75 (2000), 201. [7] KREUER K.D., FUCHS A., ISE M., SPAETH M., MAIER J., Electrochim. Acta, 43 (1998), 1281. [8] BAUMAN J. E. JR., WANG J.C., Inorg. Chem. 3 (1964), 368. [9] PETRICEK V., DUSEK M., Institute of Physics, Academy of Sciences, Prague, Czech Republic.
[10] MICHALOWICZ A., Logiciels pour la Chimie, Société Française de Chimie, Paris 1991, 102; REHR J. J., MUSTRE DE LEON J., ZABINSKY S. I., ALBERS R. C., Theoretical X-ray Absorption Fine Structure Standards, J. Am. Chem. Soc., 113 (1991), 5135.
[11] IGNATOVA T.V., ZVYAGINA G.A., KOLOBOV I.G., MASALITIN E.A., FIL’ V.D., PADERNO YU.B., BYKOV A.N., PADERNO V.N., LYASHENKO V.I., Fiz. Nizk. Temp., 28 (2002), 270.
[12] BROWN G. P., AFTERGUT S., J. Polym. Sci., Part A 2 (1964), 1839–1845. [13] LEHNERT R., SEEL F., Z. Anorg. Allg. Chem., 464 (1980), 187. [14] DENIARD P., RAGOT F., FAULQUES E., to be published. [15] MASCIOCCHI N., MORET M., CAIRATI P., SIRONI A., ATTILIO ARDIZZOIA G., LA MONICA G., J. Chem.
Soc. Dalton Trans. (1995), 1671. [16] STURM M., BRANDL F., ENGEL D., HOPPE W., Acta Cryst., B31 (1975), 2369. [17] JARVIS J.A.J., WELLS A.F., Acta Crystallogr., 13 (1960), 1027; FREEMAN H. C., Crystal Structures
of Metal-Peptide Complexes, [in:] C. Anfinsen, M. L. Anson, J. T. Edsall, F. M. Richards (Eds.), Advances in Protein Chemistry 22, Academic Press, New York, 1967, p. 257.
[18] YOSHIDA C. M., FREEDMAN T. B., LOEHR T. M., J. Am. Chem. Soc., 97 (1975), 1028; BAUMAN J. E. JR, WANG J.C., ibid.
[19] CORDES M., WALTER J.L., Spectrochimica Acta, 24A, (1968), 237. [20] CASWELL D. G., SPIRO T. G., J. Am. Chem. Soc., 108 (1986), 6470. [21] STEWART J.J.P., MOPAC 93 Manual (1993), and MOPAC 2000 Manual, Fujitsu Limited (1999). [22] CARLIN R., Magnetochemistry, Springer-Verlag, Berlin 1986; HATFIELD W. E., TROJAN K. L., Novel
One-dimensional Copper(II) Magnetic Systems, [in:] C. J. O’Connor (Ed.), Research Frontiers in Magnetochemistry, World Scientific, Singapore, 1993, pp. 1–66.
[23] PETTY R. H., WELCH B. R., WILSON L. J., BOTTOMLEY L. A., KADISH K. M., J. Am. Chem. Soc., 102 (1980), 611.
[24] PIERRE J. L., CHAUTEMPS P., REFAIF S., BEGUIN C., EL MARZOUKI A., SERRATRICE G., SAINT-AMAN E., REY P., J. Am. Chem. Soc., 117 (1995), 1965.
[25] GUPTA G. P., LANG G., KOCH C. A., WANG B., SCHEID W. R., REED C. A., Inorg. Chem., 29 (1990), 4234. [26] LAMBERT F., RENAULT J-P., POLICAR C., MORGENSTERN-BADARAU I., CESARIO M., Chem. Com-
mun., (2000), 35–36.
Received 3 June 2002 Revised 19 July 2002

F. RAGOT et al.
28
Materials Science, Vol. 20, No. 3, 2002
Use of vibronic phenomena in adsorption phase for developing of semiconductor gas sensors
VLADIMIR ZAITSEV1*, BARBARA KEBBECUS2
1M. V. Lomonosov Moscow State University, Physics Department 2New Jersey Institute of Technology
Semiconductor sensor selectivity is of the most importance for environment monitoring. The surface modifications and multi-sensor systems are widely used for the selectivity increasing in commercial sensors. The work presented is an experimental study aimed to show the use of fine vibrational phenom-ena on the semiconductor surface for the increase of the sensor selectivity. Our experiments showed that resonant vibrational energy transfer from the photoexcited adsorbed dye may occur if gas molecules have correspondent vibrational modes. This energy transfer controls both the luminescent signal from the dye and electrical response of the semiconductor substrate. The sensor selectivity in this case is due to the overlapping of rich vibrational spectra of the molecules. We have shown that isotopes can be distin-guished from each other in this way since they have different vibrational frequencies. This could not be done with traditional ‘chemiresistors’. Selective sensors for specific gas molecules could be produced in this way by depositing organic dye molecules on the semiconductor surface with vibrational modes ‘tuned’ to the vibrations of those gas molecules.
Key words: gas sensors; semiconductor surface; dye molecules; vibronic interactions; photoconductiv-ity; vibrational energy transfer
1. Introduction
Gas analysis has become a major issue for industry and government agencies con-cerned with public health and environment. Current methods based on sorbent traps or canisters [1] to collect samples to be analyzed in the laboratory do not provide rapid information. For this reason the development of highly sensitive gas sensors to pro-vide continuous monitoring of the concentration of particular gases in the environment in a quantitative and selective way is of the most importance. Solid-state semiconduc-tor-based sensors promise much more rapid results, but suffer from a lack of specificity [2]. The most common types of semiconductor gas sensors are based on
_________ *Corresponding author, e-mail: [email protected].
V. ZAITSEV, B. KEBBECUS
30
recording of adsorption-induced changes in integral characteristics of the surface, such as dark- (σd) and photoconductivity (σp), or the surface potential Y. These integral characteristics are determined by equilibrium surface electron states (SES) that pri-mary depend on the structure of terminal chemisorbed molecular groups [3]. In the case of van der Waals adsorption, the energy parameters of biographical SES change only insignificantly [4]. The energy spectrum of all the states on a real disordered sur-face has a quasi-continuous nature and barely reflects the specificity of adsorbed molecules. All these factors restrict the variety of molecules that can be detected and result in extremely low selectivity of these sensors. The fabrication of selective com-mercial sensors involves their surface modification or the use of catalysts [5].
The equilibrium response of the electronic semiconductor subsystem (variation of σd, σp, Y, etc.) to the adsorption process is traditionally believed to be a result of change in the occupation of its SES. This purely ‘charge-controlled’ approach can hardly solve the selectivity problem. In the present work, contrary to the ‘traditional’ semiconductor approach [2, 3], we try to solve this problem by encompassing our efforts towards the study of fine vibronic effects caused by adsorption. The issue can be successfully addressed, in our opinion, by the combination of traditional semicon-ductor sensor technique and fine vibronic effects caused by adsorption. The electron-vibrational coupling leads to a strong influence of gas environment on photosensitiza-tion of electronic processes in semiconductors. Vibrational and rotational spectra of a molecule, considered as its signature, determine the vibronic interactions.
Photo-induced singlet–singlet S0→S1 transitions in the adsorbed dye molecules are known to initiate electronic transitions in solids [6]. Two paths of such a spectral sensitiza-tion are feasible: (i) resonant transfer of the reverse S1→S0 transition energy from a molecule to charged SES and (ii) electron transition from an excited molecule to the solid conduction band. It was found that in the insulator–semiconductor structures based on Ge and Si, as well as ZnO and CdS, only the first mechanism takes place [6].
The overall deactivation rate constant (k) of the photo-excited molecule is known to be determined by energy transfer through the following five channels: (1) lumines-cence (kl); (2) non-radiative energy transfer to near adsorbed molecules through the Förster–Dexter induction-resonance mechanism (kFD); (3) intromolecular singlet –triplet transfer (kst); (4) electron-vibrational coupling (internal energy conversion to vibrational modes) (kic); (5) non-radiative energy transfer to the solid (ks), i.e.:
k = kl + kFD + kst + kic + ks (1)
In semiconductors, ks is determined by the charge exchange efficiency between the conductive band and different groups of SES and by band-to-band transitions.
Combined electrophysical measurements of the surface charge and spectral meas-urements of molecular luminescence provide unique possibilities between studying fine vibronic effects in the semiconductor–dielectric–dye structures. The semiconduc-tor electronic subsystem may be very sensitive to any changes in the adsorbed phase due to strong competition of two energy transfer channels: 1) inside the molecular
Developing of semiconductor gas sensors
31
phase (channel M) and 2) into the semiconductor substrate (channel S). An inten- sive fluorescence quenching occurs and the SES emptying rate decreases, when molecules with overlapping luminescence and absorption bands are present on the surface. In this case there is no resonance between electron transitions in molecular phase, the energy migrates through other alternative pathways in channel M: reabsorption of emitted pho-tons and electron-vibrational coupling. In the latter case, the energy of an excited electron of donor molecule transfers to vibrational modes of this molecule via internal conversion and then – to adjacent acceptor molecules if their vibrational spectra overlap [7].
2. Experimental
Experiments were performed with single crystal of germanium (Ge) and zinc oxide (ZnO) specimens as well as with polycrystalline ZnO and CdS films. ZnO films were prepared by oxidation of Zn films on an insulator substrate, and CdS films were de-posited onto the insulator surface from water solution. Sapphire, quartz or glass substrates were used. Dye molecules of rhodamine B (RhB) or rhodamine 6G (Rh6G) were adsorbed on the surface of specimens from an ethanol solution. The surface con-centration of rhodamine molecules was determined by means of a piezoresonance balance, and was chosen to be 2×10¹³ molecules/cm2 that made the efficiency of the channel S greater than that of channel M. SES in germanium-oxide structure were first charged by exposition of specimens to light. A xenon lamp and a monochromator were used to obtain the proper wavelength.
The value of surface charge representing the electron subsystem response in Ge was measured by the field effect on a high sine wave signal – the standard method for measuring semiconductor surface potential. This field effect, first observed by Shockley and Pearson, consists essentially in the following. The sine wave voltage is applied to the capacitor having one metal plate and the other plate of semiconductor. The weak DC current is being measured along the semiconductor plate while modu-lated by the transverse voltage. This I(V) dependence provides the information on the value of the surface charge [4]. In ZnO and CdS the electron subsystem response was detected as a change in photoconductivity. The conductivity of the samples is chang-ing while they are illuminated, in the same way as it happens when these materials are used in industrial light sensors. In order to obtain photosensitized effects, the speci-mens were illuminated with monochromatic light to excite the dye molecules. After dye deposition the sample shows additional band of photoconductivity in the region where it was not sensitive to light before. This new band of photoconductivity corre-sponds to the dye absorption and it is due to the energy transfer from the dye molecules to the semiconductor [6]. To study the influence of ambient gases, the sam-ples were exposed to a low-pressure vapour of naphthalene and ethanol, as well as deuterated naphthalene. The molecular electronic spectra of these species differ sub-stantially from those of RhB, while vibrational spectra of CH groups in ethanol and
V. ZAITSEV, B. KEBBECUS
32
naphthalene molecules partially overlap with some vibrational modes of RhB. The vibrational modes in deuterated molecules are shifted, thus no resonance transfer is expected.
3. Results and discussion
In general, the results were similar for all systems studied, being independent of the substrate type. Consider the effect of naphthalene molecules on the RhB fluores-cence. In the presence of naphthalene, the RhB fluorescence was quenched. According to [1], this can be explained only in terms of electron-vibrational coupling in RhB molecule because the strong mismatch of the naphthalene and RhB electron spectra does not allow the direct electron energy transfer. The presence of the deuterated naphthalene molecules, with vibrational modes that differ from those of naphthalene, did not produce fluorescence quenching. This fact confirmed the resonant vibronic nature of the observed phenomenon.
In the case of GeO2 samples after optical charging of SES, the surface charge relaxes for about 30 min in darkness before reaching a stable value. The surface charge relaxation rate increases if, after charging, the specimen were additionally illuminated in the RhB absorption band. This effect is related to the additional photosensitized emptying of traps in the dielectric at the expense of the electronic excitation energy of the RhB molecules. We apply the term ‘efficiency of SES photo-emptying’ to the quantity Φ = (Q0 – Q)/Q0, where Q and Q0 are the surface charge remaining after 10-minute relaxation under and without an additional illumination in the absorption band of the dye, respectively. Ex-periments showed that no photo-ejection happened if the structure, either with a dye or without, were exposed to light aside the absorption band.
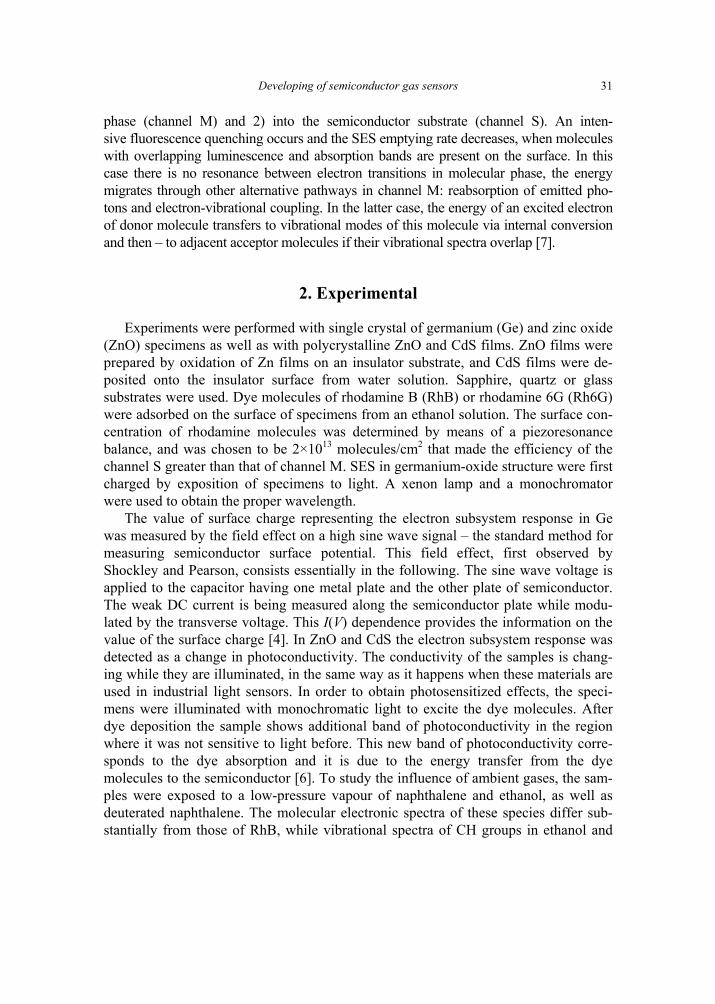
Adsorption of the naphthalene molecules significantly reduces the value of Φ owing to vibrational deactivation of some RhB molecules. Figure 1 shows the decrease of the parameter Φ and the intensity of luminescence I versus naphthalene vapour pressure. No effect was observed in the presence of deuterated naphthalene molecules.
The observed quenching of RhB fluorescence and the change in the efficiency of the photo-ejection can only be attributed to the internal conversion of the electronic excitation of the RhB molecules to vibrational modes accompanied by subsequent energy transfer to the guest molecules. It is due to the fact that their vibrational mode energy comes very close to that of the RhB molecules interacting with them. The fact that the system shows no sensitivity to deuterated molecules indicates that the vibra-tional modes of the interacting molecules must be the same.
Of the two discussed parameters, I and Φ, the latter has proved to be more sensi-tive to the presence of guest molecules. This implies that the electrophysical method is more promising for gas detection than the optical one. It may well provide a basis for new high-performance, low-concentration sensors. Furthermore, this will substantially
Developing of semiconductor gas sensors
33
extend the class of detectable molecules, including isotopically substituted ones. We previously observed a similar effect with H2O, D2O.
Fig.1. Fluorescence intensity of rhodamine B (1, 1′ ) and efficiency of SES photo discharge (2, 2′) in Ge–GeO2–RhB system as functions of naphthalene (1, 2) and the deuterated naphthalene (1′, 2′)
vapour pressure. The SES photo discharge data were extracted from the surface potential measurements
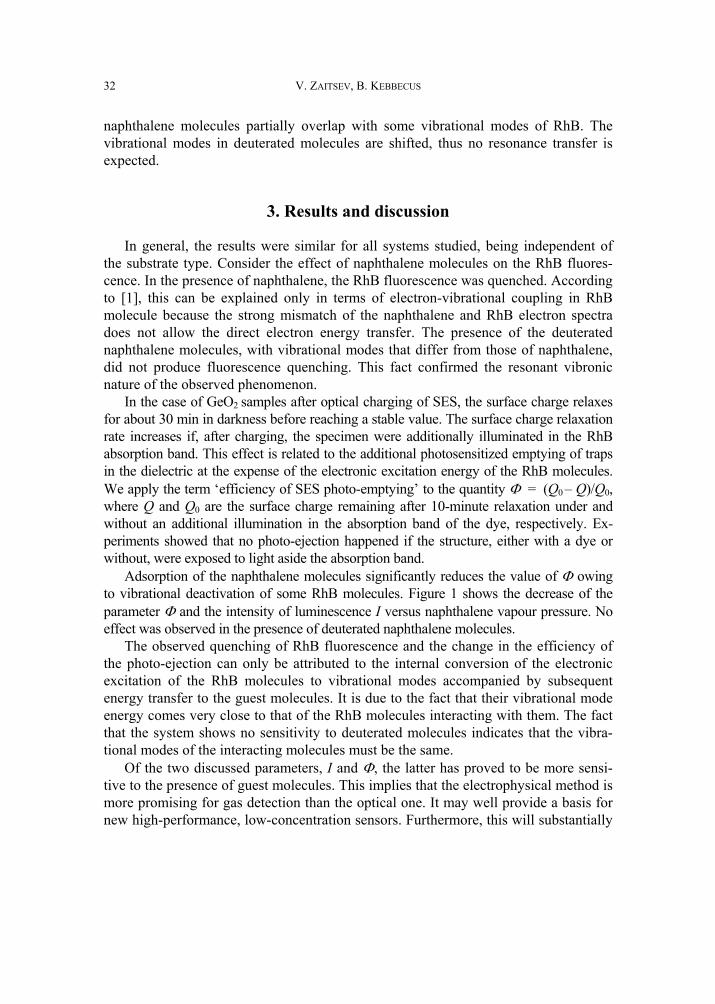
Fig. 2. Photoconductivity spectra of single crystal (1, 3)
and polycrystalline (2, 4) ZnO: without dye (1, 2) and after RhB deposition (3, 4)
We have performed similar experiments using a popular material for photosensiti-zation studies: zinc oxide single crystals and polycrystalline films with rhodami- ne B molecules adsorbed on the surface. Figure 2 shows spectral dependencies of the photoconductivity of ZnO specimens without and with adsorbed dye. The photocon-ductivity spectra of ZnO crystals represent a sharp edge of fundamental absorption at hv = 3.3 eV, i.e. at the energy corresponding to the gap of ZnO (Fig. 2, curve 1). Here
V. ZAITSEV, B. KEBBECUS
34
σp is the ratio of the photo- and dark conductivity. This edge smears out for the poly-crystalline film.
When evacuated crystal with adsorbed dye was illuminated in the spectral range of RhB absorption, hv = 2.3–2.5 eV, we observed a typical spectral sensitization effect (Fig.2, curve 3), that is the steep increase in σp. This effect is less prominent for the polycrystalline film (Fig. 2, curve 2, 4).
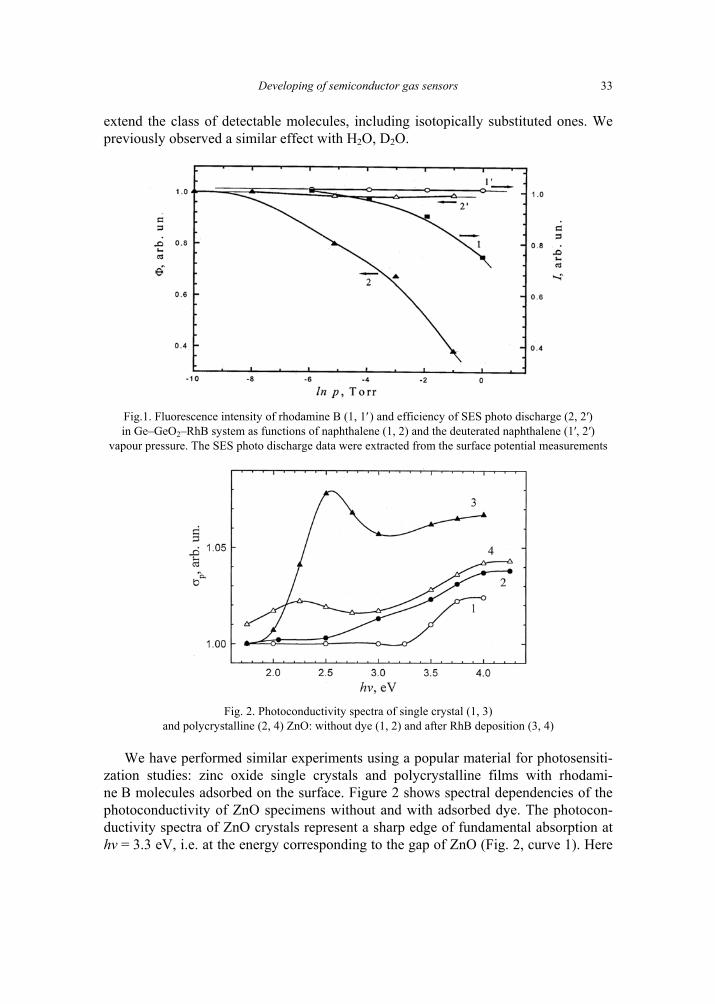
Admission of naphthalene vapours to the surface reduced the sensitization efficiency. The effect was observed when the naphthalene vapour pressure exceeded the value of 0.1 Pa. Figure 3 demonstrates the pressure dependence of the ratio Φ = σp/σp0, where σp0 and σp are the values of photoconductivity at the maximum of the RhB absorption band before and after adsorption of the ‘guest’ naphthalene molecules, respectively.
Fig. 3. Efficiency of conductivity photosensitization as a function of naphthalene
vapour pressure for ZnO single crystal (1) and polycrystalline film (2) with adsorbed RhB molecules. The same with deuterated naphthalene (3)
As an attempt to build a sensor capable of detecting hydrocarbons in ambient con-ditions, we have chosen a system based on thin polycrystalline film of CdS with adsorbed dye molecules. Spectra of dark and photoconductivity of CdS films of dif-ferent thickness and grain sizes are similar to those of ZnO shown in Fig. 2 and differ from the ZnO curves by specific for CdS main absorption band. The band of sensi-tized conductivity due to RhB molecules reaches a maximum at 2.3 eV. The conductivity of the films tested was slightly dependent on water vapour concentration allowing hydrocarbons measurements under real atmospheric conditions. Admission of naphthalene and ethanol vapours to a camera with the sensor has changed photo-conductivity in a wide region of light energies. However, the system was much more sensitive to the ambient hydrocarbon concentration in the conductivity band photosen-sitized by RhB molecules, where the sensor is very selective because of above-mentioned vibration resonance. An example of the system spectral response to naph-
Developing of semiconductor gas sensors
35
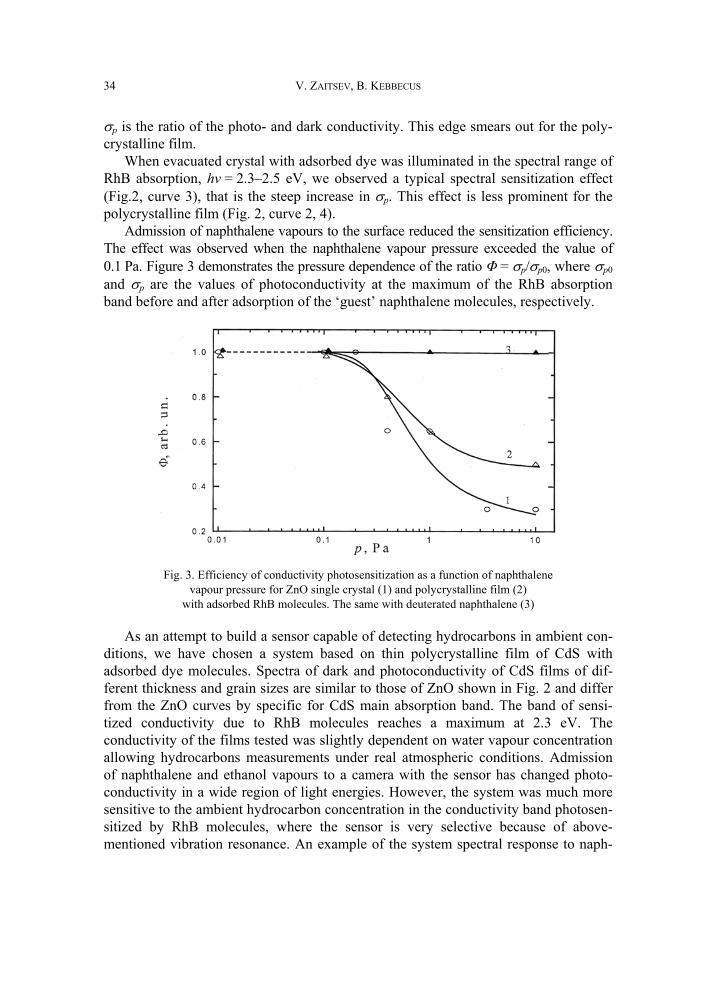
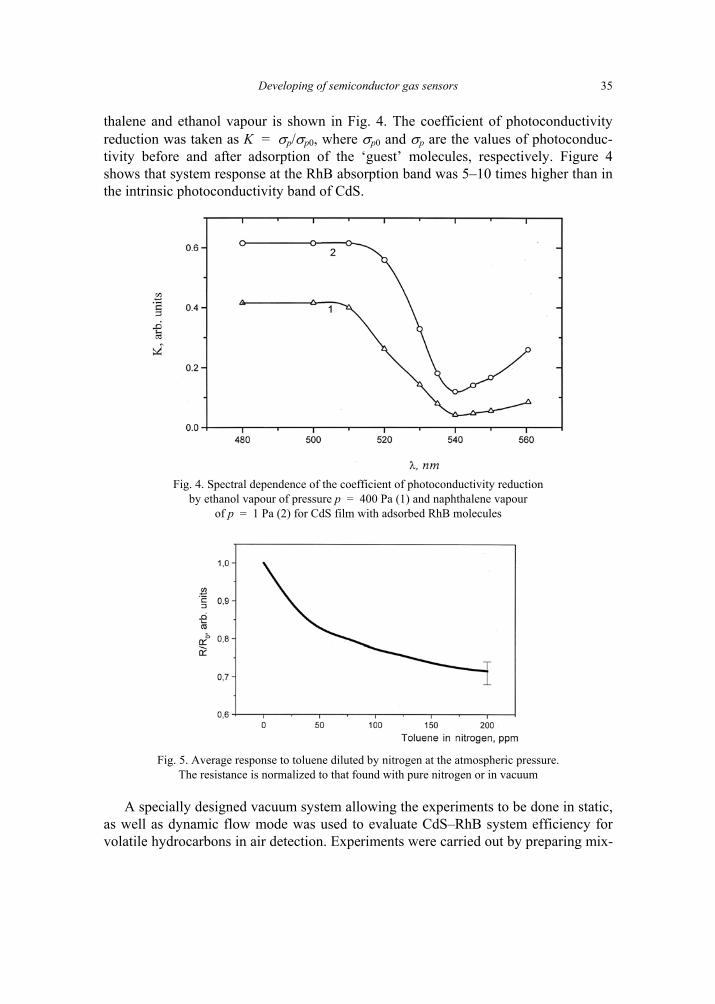
thalene and ethanol vapour is shown in Fig. 4. The coefficient of photoconductivity reduction was taken as K = σp/σp0, where σp0 and σp are the values of photoconduc-tivity before and after adsorption of the ‘guest’ molecules, respectively. Figure 4 shows that system response at the RhB absorption band was 5–10 times higher than in the intrinsic photoconductivity band of CdS.
Fig. 4. Spectral dependence of the coefficient of photoconductivity reduction
by ethanol vapour of pressure p = 400 Pa (1) and naphthalene vapour of p = 1 Pa (2) for CdS film with adsorbed RhB molecules
Fig. 5. Average response to toluene diluted by nitrogen at the atmospheric pressure.
The resistance is normalized to that found with pure nitrogen or in vacuum
A specially designed vacuum system allowing the experiments to be done in static, as well as dynamic flow mode was used to evaluate CdS–RhB system efficiency for volatile hydrocarbons in air detection. Experiments were carried out by preparing mix-
V. ZAITSEV, B. KEBBECUS
36
tures of toluene in nitrogen or air in a stainless steel canister. Then the chamber was filled with the prepared gas mixture. For lower concentrations the chamber was partly filled with nitrogen and then brought to the final pressure with the gas mixture. The proportions for these dilutions were monitored by measuring the pressure within the chamber with an accurate pressure gauge. Between measurements the sensor was each time conditioned by several nitrogen purges with vacuum pumping between them.
The first results observed with the test toluene/nitrogen mixture at the atmospheric pressure are presented in Fig. 5. The plot indicates that the best sensitivity (largest slope) is reached at lower concentrations. In other experiments, the sensor was proved to show a clear response to toluene in nitrogen concentrations as low as 2.6 ppm.
4. Conclusions
We have investigated a new physical principle that can be used for building selec-tive gas sensors. The sensor selectivity in this case is due to the overlapping of rich vibrational spectra of gas molecules with those of adsorbed dye. The selective sensor for specific gas molecules could be produced by depositing on the semiconductor sur-face organic dye molecules with vibrational modes ‘tuned’ to the vibration of those gas molecules. We have shown that isotopes can be distinguished in this way. This could not be done with traditional chemiresistors. The results obtained with a ‘CdS –adsorbed dye’ system are especially promising in terms of new design for gas sensors based on physical principles of selectivity. The other semiconductors could be used as well, such as SnO2 – one of the most important semiconductor gas sensor materials. Modern organic synthesis offers ample scope of possibilities for building dye mole-cules with vibrational modes selective to specific gas molecules.
References
[1] KEBBEKUS B., MITRA S., Environmental Analytical Chemistry, Stanley Thornes Publ. Ltd, Chelten-ham, UK, 1998, p. 209.
[2] CHRISTOFIDES C., MANDELIS A., Physics, Chemistry and Technology of Solid State Gas Sensor De-vices, J. D. Winefordner (Ed.), Wiley, 1995.
[3] GRABER N., LUDI H., WIDMER H. M., Sens. Actuators, B1 (1990), 239. [4] KISELEV V. F., KRYLOV O. V., Electronic Phenomena in Adsorption and Catalysis, Springer-Verlag,
New York, 1987. [5] Semiconductor Sensors, S. M. Sze (Ed.), Wiley, 1994. [6] AKIMOV I. A., CHERKASOV JU. A., CHERKASHIN M. I., Sensitized Photoeffect, Nauka, Moscow, 1980. [7] ZAITSEV V. B., KISELEV V. F., PLOTNIKOV G. S., Moscow University Physics Bull., 47 (1992), 4.
Received 3 June 2002 Revised 23 July 2002

Developing of semiconductor gas sensors
37
Materials Science, Vol. 20, No. 3, 2002
Study of polystyrene surface local mechanical properties by the atomic force microscopy
ANNA V. ZAITSEVA1*, VICTOR M. RUDOY2, OLGA V. DEMENT’EVA2, MARIA E. KARTSEVA2
1M. V. Lomonosov Moscow State University, Physics Department 2Institute of Physical Chemistry RAS, Moscow
Composites with polymer surface layer serving as a matrix for metal nanoparticles stabilization are very promising materials for modern nano- and optoelectronics, nonlinear optics, catalysis, chemical sensors and biosensors. Successful development of such nanocomposites is impossible without intimate knowledge of polymer surface layer properties (structural, mechanical, chemical, electrical, etc.) at a nanolevel. In this study, local mechanical properties (elastic modulus, wearing qualities) of polystyrene surface layer were investigated by means of atomic force microscopy (AFM). Elastic modulus was de-termined from the analysis of force–distance curves within the framework of Johnson–Kendall–Roberts model. A significant decrease of elastic modulus near the polystyrene surface relative to its bulk value was observed. Strong dependence of the surface layer mechanical properties on the polymer molecular weight was found. The influence of different types of treatment (annealing, UV-irradiation) on the poly-styrene surface layer mechanical properties was investigated. Strong correlations between PS surface layer mechanical properties and its glass transition temperature variations (studied in our previous works) are discussed.
Key words: nanostructures; polymer surface; glass transition; nanomechanics; atomic-force microscopy
1. Introduction
Composites consisting of polymer matrix reinforced with metal nanoparticles have recently begun to attract increasing attention of researchers. It is desirable in many cases that specific properties of a material (electrical, optical, catalytic etc.) be exhib-ited by its surface or thin near-surface layer while the polymer bulk should retain its initial properties.
One of the most promising routes of formation of such systems is, in our opinion, the deposition of nanoparticles onto polymer from the metal hydro- or organosols followed by the heat treatment of the system. Such an approach allows us to deal with _________
*Corresponding author, e-mail: [email protected].
A. ZAITSEVA et al.
38
almost monodisperse particles, varying (with high accuracy and over a wide range) their concentration on a polymer surface as well as size and surface chemistry of nanoparticles. Alongside with preliminary modification of a polymer surface layer, it provides a basic capability to create ‘two-dimensional’ ordered arrays of nanoparticles that are completely or partially embedded into the polymer. In the case of glassy polymer the possibility of designing such ‘two-dimensional’ nanocomposites arises from the significant difference in polymer surface (Tg,s) and bulk (Tg,b) glass tempera-ture [1–3] in a system thermally treated at the temperature T between Tg,s and Tg,b (this opportunity was shown by us earlier in [4]).
The information on the properties of polymer surface layer (in particular, mechanical ones) at a nanolevel is necessary for realization of the above-mentioned approach to nano-composites design. Local probing of surface structure and mechanical properties (elastic modulus, frictional and adhesive forces, shear stress, etc.) with a submicron resolution became possible after the introduction of atomic force microscopy (AFM) [5].
2. Experimental
The experiments were performed with polystyrene (PS) films of different molecu-lar weights (M = 270 000, 50 000 and 8700) cast from toluene solutions onto silicon plates (the films thickness was ~1 µm). The samples were stored at ambient conditions during 1–2 days for solvent evaporation. Then some of the high-molecular-weight samples (M = 270 000) were irradiated over 30–120 min in air with a full light of a PRK-4 mercury lamp or annealed at 120 °C during 2.5 hours, while others were left untreated.
The polymer surfaces were investigated using a ‘Nanoscope IIIa’ (Digital Instru-ments, USA) atomic-force microscope (AFM) operated in air. To evaluate nanomechanical properties of the polymer surface layers we analyzed 10–20 force-distance curves measured at 5–10 randomly selected locations, using an approach-retract frequency in the range of 0.1–1.0 Hz. We limited ourselves to the analysis of the approaching part of the force–distance curves during intimate repulsive contact. Silicon cantilevers (Digital Instruments) with spring constants varied in the range of 20–50 N/m and tip radii in the range of 20–50 nm were used.
The PS surface native microroughness was observed in the non-disturbing tapping mode AFM while the surface wear experiments were performed in contact mode ac-cording to the following scheme: at first, square region (1×1 µm) was scanned with the 50 nN loading force, then the loading force was minimized and a larger image of the surface (around before-scanned region) was taken. After that the residual deforma-tions could be clearly observed.
The analysis of all AFM images was performed with the FemtoScan00l software [6].
Polystyrene surface local mechanical properties
39
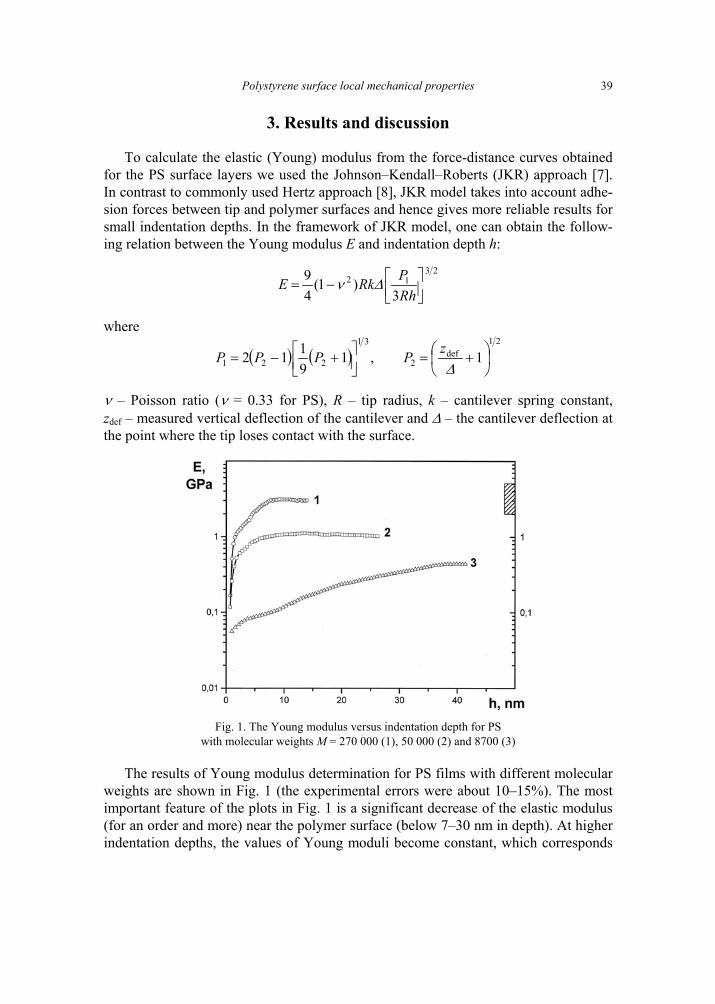
3. Results and discussion
To calculate the elastic (Young) modulus from the force-distance curves obtained for the PS surface layers we used the Johnson–Kendall–Roberts (JKR) approach [7]. In contrast to commonly used Hertz approach [8], JKR model takes into account adhe-sion forces between tip and polymer surfaces and hence gives more reliable results for small indentation depths. In the framework of JKR model, one can obtain the follow-ing relation between the Young modulus E and indentation depth h:
2312
3)1(
49
−=
RhPRkE ∆ν
where
( ) ( ) ,19112
31
221
+−= PPP
21def
2 1
+=∆
zP
ν – Poisson ratio (ν = 0.33 for PS), R – tip radius, k – cantilever spring constant, zdef – measured vertical deflection of the cantilever and ∆ – the cantilever deflection at the point where the tip loses contact with the surface.
Fig. 1. The Young modulus versus indentation depth for PS
with molecular weights M = 270 000 (1), 50 000 (2) and 8700 (3)
The results of Young modulus determination for PS films with different molecular weights are shown in Fig. 1 (the experimental errors were about 10–15%). The most important feature of the plots in Fig. 1 is a significant decrease of the elastic modulus (for an order and more) near the polymer surface (below 7–30 nm in depth). At higher indentation depths, the values of Young moduli become constant, which corresponds
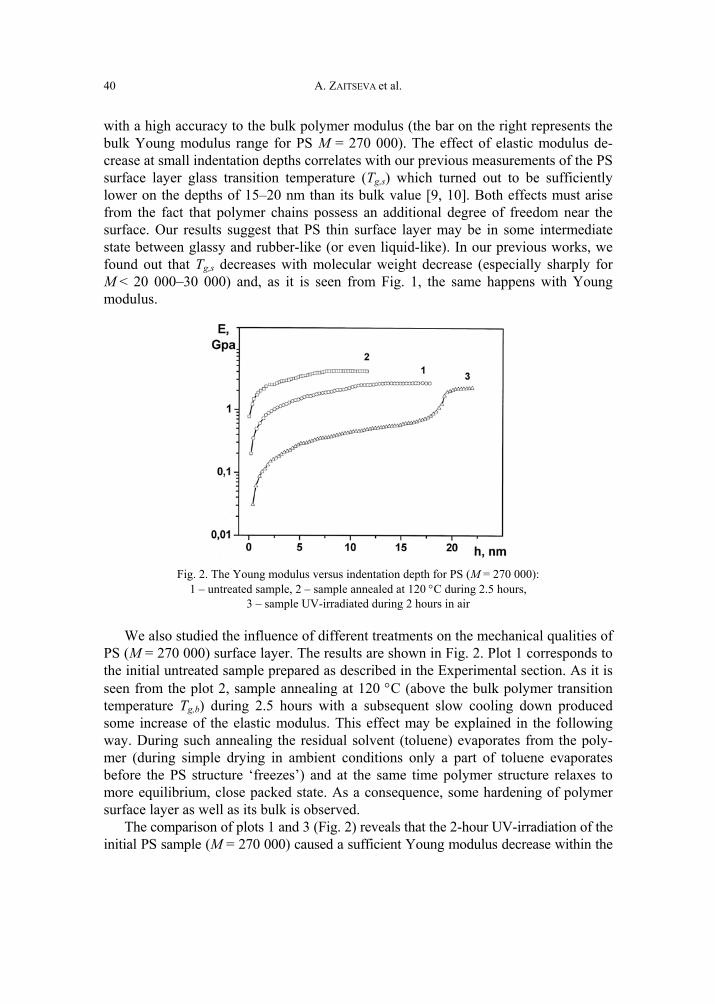
A. ZAITSEVA et al.
40
with a high accuracy to the bulk polymer modulus (the bar on the right represents the bulk Young modulus range for PS M = 270 000). The effect of elastic modulus de-crease at small indentation depths correlates with our previous measurements of the PS surface layer glass transition temperature (Tg,s) which turned out to be sufficiently lower on the depths of 15–20 nm than its bulk value [9, 10]. Both effects must arise from the fact that polymer chains possess an additional degree of freedom near the surface. Our results suggest that PS thin surface layer may be in some intermediate state between glassy and rubber-like (or even liquid-like). In our previous works, we found out that Tg,s decreases with molecular weight decrease (especially sharply for M < 20 000–30 000) and, as it is seen from Fig. 1, the same happens with Young modulus.
Fig. 2. The Young modulus versus indentation depth for PS (M = 270 000):
1 – untreated sample, 2 – sample annealed at 120 °C during 2.5 hours, 3 – sample UV-irradiated during 2 hours in air
We also studied the influence of different treatments on the mechanical qualities of PS (M = 270 000) surface layer. The results are shown in Fig. 2. Plot 1 corresponds to the initial untreated sample prepared as described in the Experimental section. As it is seen from the plot 2, sample annealing at 120 °C (above the bulk polymer transition temperature Tg,b) during 2.5 hours with a subsequent slow cooling down produced some increase of the elastic modulus. This effect may be explained in the following way. During such annealing the residual solvent (toluene) evaporates from the poly-mer (during simple drying in ambient conditions only a part of toluene evaporates before the PS structure ‘freezes’) and at the same time polymer structure relaxes to more equilibrium, close packed state. As a consequence, some hardening of polymer surface layer as well as its bulk is observed.
The comparison of plots 1 and 3 (Fig. 2) reveals that the 2-hour UV-irradiation of the initial PS sample (M = 270 000) caused a sufficient Young modulus decrease within the
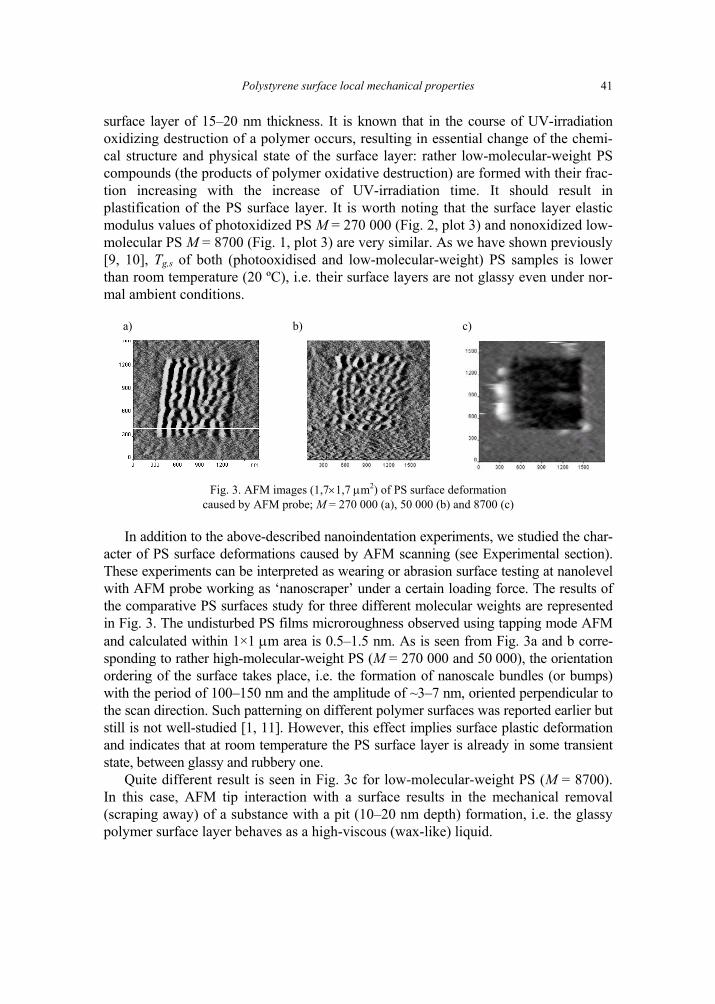
Polystyrene surface local mechanical properties
41
surface layer of 15–20 nm thickness. It is known that in the course of UV-irradiation oxidizing destruction of a polymer occurs, resulting in essential change of the chemi-cal structure and physical state of the surface layer: rather low-molecular-weight PS compounds (the products of polymer oxidative destruction) are formed with their frac-tion increasing with the increase of UV-irradiation time. It should result in plastification of the PS surface layer. It is worth noting that the surface layer elastic modulus values of photoxidized PS M = 270 000 (Fig. 2, plot 3) and nonoxidized low-molecular PS M = 8700 (Fig. 1, plot 3) are very similar. As we have shown previously [9, 10], Tg,s of both (photooxidised and low-molecular-weight) PS samples is lower than room temperature (20 ºC), i.e. their surface layers are not glassy even under nor-mal ambient conditions.
a) b) c)
Fig. 3. AFM images (1,7×1,7 µm2) of PS surface deformation
caused by AFM probe; M = 270 000 (a), 50 000 (b) and 8700 (c)
In addition to the above-described nanoindentation experiments, we studied the char-acter of PS surface deformations caused by AFM scanning (see Experimental section). These experiments can be interpreted as wearing or abrasion surface testing at nanolevel with AFM probe working as ‘nanoscraper’ under a certain loading force. The results of the comparative PS surfaces study for three different molecular weights are represented in Fig. 3. The undisturbed PS films microroughness observed using tapping mode AFM and calculated within 1×1 µm area is 0.5–1.5 nm. As is seen from Fig. 3a and b corre-sponding to rather high-molecular-weight PS (M = 270 000 and 50 000), the orientation ordering of the surface takes place, i.e. the formation of nanoscale bundles (or bumps) with the period of 100–150 nm and the amplitude of ~3–7 nm, oriented perpendicular to the scan direction. Such patterning on different polymer surfaces was reported earlier but still is not well-studied [1, 11]. However, this effect implies surface plastic deformation and indicates that at room temperature the PS surface layer is already in some transient state, between glassy and rubbery one.
Quite different result is seen in Fig. 3c for low-molecular-weight PS (M = 8700). In this case, AFM tip interaction with a surface results in the mechanical removal (scraping away) of a substance with a pit (10–20 nm depth) formation, i.e. the glassy polymer surface layer behaves as a high-viscous (wax-like) liquid.
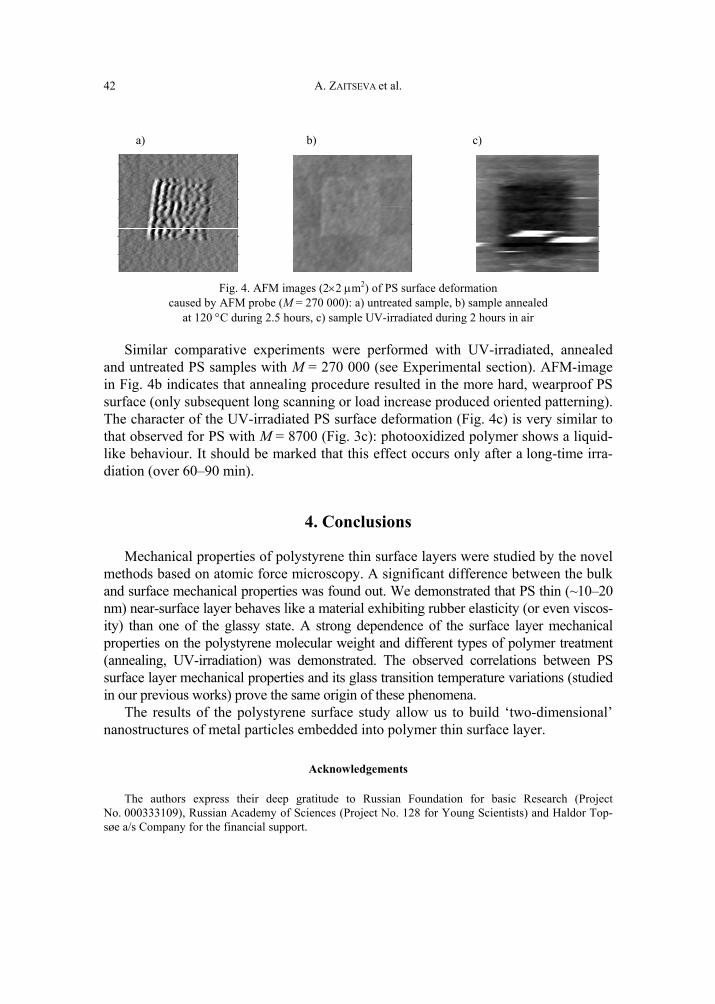
A. ZAITSEVA et al.
42
a) b) c)
Fig. 4. AFM images (2×2 µm2) of PS surface deformation caused by AFM probe (M = 270 000): a) untreated sample, b) sample annealed
at 120 °C during 2.5 hours, c) sample UV-irradiated during 2 hours in air
Similar comparative experiments were performed with UV-irradiated, annealed and untreated PS samples with M = 270 000 (see Experimental section). AFM-image in Fig. 4b indicates that annealing procedure resulted in the more hard, wearproof PS surface (only subsequent long scanning or load increase produced oriented patterning). The character of the UV-irradiated PS surface deformation (Fig. 4c) is very similar to that observed for PS with M = 8700 (Fig. 3c): photooxidized polymer shows a liquid-like behaviour. It should be marked that this effect occurs only after a long-time irra-diation (over 60–90 min).
4. Conclusions
Mechanical properties of polystyrene thin surface layers were studied by the novel methods based on atomic force microscopy. A significant difference between the bulk and surface mechanical properties was found out. We demonstrated that PS thin (~10–20 nm) near-surface layer behaves like a material exhibiting rubber elasticity (or even viscos-ity) than one of the glassy state. A strong dependence of the surface layer mechanical properties on the polystyrene molecular weight and different types of polymer treatment (annealing, UV-irradiation) was demonstrated. The observed correlations between PS surface layer mechanical properties and its glass transition temperature variations (studied in our previous works) prove the same origin of these phenomena.
The results of the polystyrene surface study allow us to build ‘two-dimensional’ nanostructures of metal particles embedded into polymer thin surface layer.
Acknowledgements
The authors express their deep gratitude to Russian Foundation for basic Research (Project No. 000333109), Russian Academy of Sciences (Project No. 128 for Young Scientists) and Haldor Top-søe a/s Company for the financial support.
Polystyrene surface local mechanical properties
43
References
[1] MEYERS G.F., DEKOVEN B.M., SEITZ J.T., Langmuir, 8 (1992), 2330. [2] KAJIYAMA T., TANAKA K., TAKAHARA A., Polymer, 39 (1998), 4665. [3] SATOMI N., TAKAHARA A., KAJIYAMA T., Macromolecules, 32 (1999), 4474. [4] RUDOY V.M., YAMINSKY I.V., DEMENT’EVA O.V., OGAREV V.A., Colloid. J., 61 (1999), 861. [5] BINNIG G., QUATE C.F., GERBER C., Phys. Rev. Lett., 12 (1986), 930. [6] FILONOV A.S., YAMINSKY I.V., User’s Manual of the Software for Scanning Probe Microscopy
Control and Image Processing FemtoScan 001’, Moscow, Advanced Technologies Centre, 1999. [7] JOHNSON K.L., KENDALL K., ROBERTS A.D., Proc. R. Soc. London, A324 (1971), 301. [8] HERTZ H., REINE J., Angew. Math., 92 (1882), 156. [9] DEMENT’EVA O.V., RUDOY V.M., YAMINSKY I.V. et al., Molecular Systems Structure and
Dynamics, 7 (2000), 268.
[10] RUDOY V.M., DEMENT’EVA O.V., YAMINSKY I.V., SUHOV V.M., KARTSEVA M.E., OGAREV V.A., to be published in Colloid. J. (2002).
[11] PICKERING J.P., VANCSO G.J., Appl. Surf. Sci., 148 (1999), 147.
Received 3 June 2002 Revised 23 July 2002
Materials Science, Vol. 20, No. 3, 2002
Kinetics of photochemical processes in photochromic azobenzene derivatives. Effect of matrix and of the phase stability
KRZYSZTOF JANUS, KATARZYNA MATCZYSZYN, JULIUSZ SWORAKOWSKI*
Institute of Physical and Theoretical Chemistry, Wrocław University of Technology, Wybrzeże Wyspiańskiego 27, PL-50-370 Wrocław 51, Poland
The contribution discusses the effect of environmental constraints on the kinetics of photochromic processes occurring in two groups of azobenzene derivatives: azobenzene-containing crown ethers dis-solved in various polymer matrices, and para-disubstituted azobenzenes dissolved in liquid-crystalline matrices. In the azobenzene-containing crown ethers, the presence of the crown is expected to affect the isomerisation kinetics. The experiments demonstrated that the crown create constraints which modify the molecular structure, thus influencing the isomerisation kinetics as was indeed found in our experiments. In the shortest crown, the room-temperature rate constant of the thermal isomerisation is c.a. two orders of magnitude lower than the respective rate in the parent azobenzene. Measurements of the kinetics of isomerisation of photochromic 4-fluoro-4΄-methoxyazobenzene dissolved in the liquid-crystalline penty-locyanobiphenyl (5CB) were carried out. Deviations from the expected Arrhenius behaviour were observed for the thermal cis–trans reaction near the phase transition temperature of 5CB (308 K). It was also found that the isomerisation reaction may trigger the nematic-to-isotropic phase transition at the temperature substantially lower than the thermodynamic transition temperature.
Key words: photochromism; azobenzene derivative; kinetics
1. Introduction
Recent years have brought a revival of interest in photochromic molecular systems due to their potential use as components of information-processing media [1]. For practical purposes, photoactive species are often used as solid solutions (e.g., in poly-mer matrices). There has also been a growing interest in properties of photoactive dye-doped liquid crystals owing to their emerging applications in information processing [2, 3]. As most photochromic reactions are space-demanding processes, a possible existence of a distribution of microenvironments of reactive species (due to defects, _________
* Corresponding author, e-mail: [email protected].
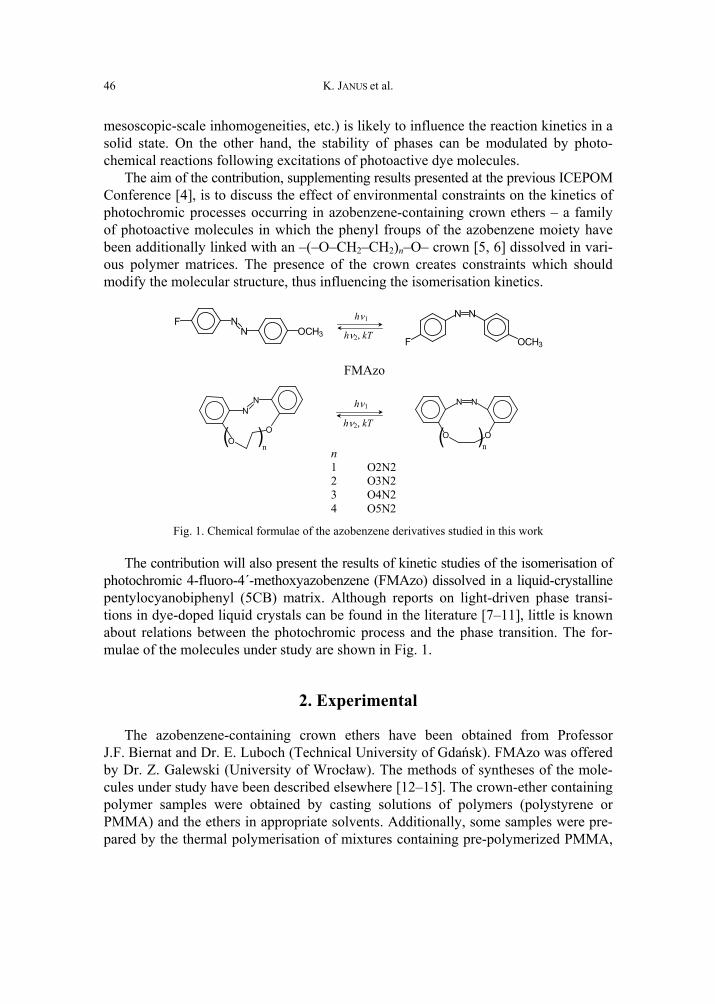
K. JANUS et al.
46
mesoscopic-scale inhomogeneities, etc.) is likely to influence the reaction kinetics in a solid state. On the other hand, the stability of phases can be modulated by photo-chemical reactions following excitations of photoactive dye molecules.
The aim of the contribution, supplementing results presented at the previous ICEPOM Conference [4], is to discuss the effect of environmental constraints on the kinetics of photochromic processes occurring in azobenzene-containing crown ethers – a family of photoactive molecules in which the phenyl froups of the azobenzene moiety have been additionally linked with an –(–O–CH2–CH2)n–O– crown [5, 6] dissolved in vari-ous polymer matrices. The presence of the crown creates constraints which should modify the molecular structure, thus influencing the isomerisation kinetics.
NN
FOCH3
N N
F OCH3
hν1
hν2, kT
FMAzo N
N
OO( )
n( )
N N
O On
hν1
hν2, kT
n1 O2N22 O3N23 O4N24 O5N2
Fig. 1. Chemical formulae of the azobenzene derivatives studied in this work
The contribution will also present the results of kinetic studies of the isomerisation of photochromic 4-fluoro-4΄-methoxyazobenzene (FMAzo) dissolved in a liquid-crystalline pentylocyanobiphenyl (5CB) matrix. Although reports on light-driven phase transi-tions in dye-doped liquid crystals can be found in the literature [7–11], little is known about relations between the photochromic process and the phase transition. The for-mulae of the molecules under study are shown in Fig. 1.
2. Experimental
The azobenzene-containing crown ethers have been obtained from Professor J.F. Biernat and Dr. E. Luboch (Technical University of Gdańsk). FMAzo was offered by Dr. Z. Galewski (University of Wrocław). The methods of syntheses of the mole-cules under study have been described elsewhere [12–15]. The crown-ether containing polymer samples were obtained by casting solutions of polymers (polystyrene or PMMA) and the ethers in appropriate solvents. Additionally, some samples were pre-pared by the thermal polymerisation of mixtures containing pre-polymerized PMMA,
Photochemical processes in photochromic azobenzene derivatives
47
monomer MMA (1:1), an initiator (benzoyl peroxide) and a suitable amount of the crown ether. As will be shown later, some features of the kinetics of the thermal isom-erisation in samples prepared in such a way (hereafter referred to as ‘polymerized PMMA’) differ from those in cast samples. Typically, the thicknesses of the samples were of the order of 10–100 µm, the concentrations of the photoactive molecules be-ing of the order of 10–2 M.
Solutions of FMAzo in 5CB were prepared in two concentration ranges: the mole fraction of FMAzo (xAzo) in those used in spectroscopic and kinetic measurements was of the order of 10–3, whereas xAzo in samples used in optical experiments ranged be-tween 0 and 0.02. The samples were placed in cells 5 µm or 10 µm thick.
The measurements of UV-VIS absorption spectra and of the isomerisation kinetics were performed with Perkin Elmer Lambda 20 spectrophotometer. The samples were irradiated using a high-pressure mercury lamp equipped with an appropriate combination of colour glass filters. The isomerisation was measured by monitoring changes of the spectra.
To investigate optical properties of the system, a polarising microscope Olympus BX60 was used, equipped with a Linkam 350 thermostated stage. UV or VIS irradia-tion was performed in situ with a mercury lamp or a halogen lamp via appropriate combinations of colour filters.
3. Results
The spectra of all molecules used in the present study are shown in Fig. 2. In their main features, all spectra resemble that of parent azobenzene displayed in the upper-most section of the figure. Under irradiation with UV light (λ = 365 nm), the stable trans form of an azobenzene derivative converts into the metastable cis form (cf. Fig. 1), the reverse reaction may occur either thermally or upon illumination with visi-ble light (λ = 440 nm). It has been well documented that the thermal isomerisation in all systems under study follows the first-order kinetics [4, 16–19] although a disper-sion of rate constants has been observed in some matrices. Thus the momentary concentration of the reactant (nR(t)) should follow the equation
)exp()0()( ktntn RR −= (1)
where nR(0) is the initial concentration and k stands for the rate constant. The isomerisation kinetics was investigated by monitoring the absorbance of the
trans forms of the substituted azobenzenes at ca. 350 nm (see infra). Making use of the Lambert–Beer law, it is straightforward to demonstrate that the concentration ratio nR(t)/nR(0) is given by the equation
)0()()()(
)0()(
AAtAA
ntn
R
R
−∞−∞
= (2)
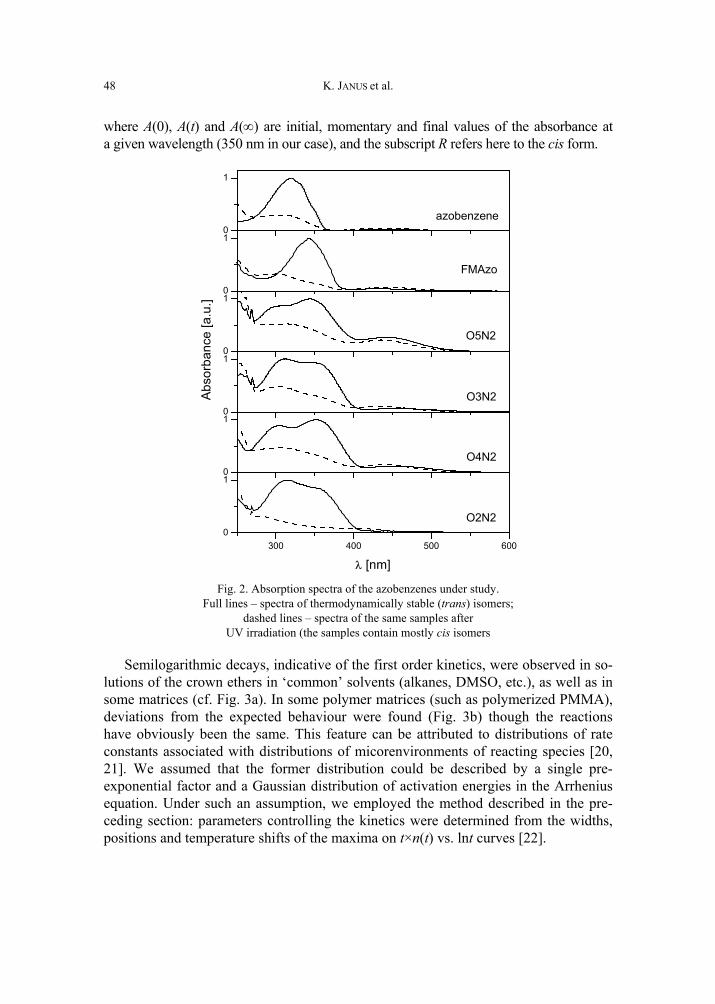
K. JANUS et al.
48
where A(0), A(t) and A(∞) are initial, momentary and final values of the absorbance at a given wavelength (350 nm in our case), and the subscript R refers here to the cis form.
300 400 500 6000
1
0
1
0
1
O2N2
λ [nm]
0
1
Abs
orba
nce
[a.u
.]
O4N2
0
1
O3N2
0
1
O5N2
azobenzene
FMAzo
Fig. 2. Absorption spectra of the azobenzenes under study.
Full lines – spectra of thermodynamically stable (trans) isomers; dashed lines – spectra of the same samples after
UV irradiation (the samples contain mostly cis isomers
Semilogarithmic decays, indicative of the first order kinetics, were observed in so-lutions of the crown ethers in ‘common’ solvents (alkanes, DMSO, etc.), as well as in some matrices (cf. Fig. 3a). In some polymer matrices (such as polymerized PMMA), deviations from the expected behaviour were found (Fig. 3b) though the reactions have obviously been the same. This feature can be attributed to distributions of rate constants associated with distributions of micorenvironments of reacting species [20, 21]. We assumed that the former distribution could be described by a single pre-exponential factor and a Gaussian distribution of activation energies in the Arrhenius equation. Under such an assumption, we employed the method described in the pre-ceding section: parameters controlling the kinetics were determined from the widths, positions and temperature shifts of the maxima on t×n(t) vs. lnt curves [22].
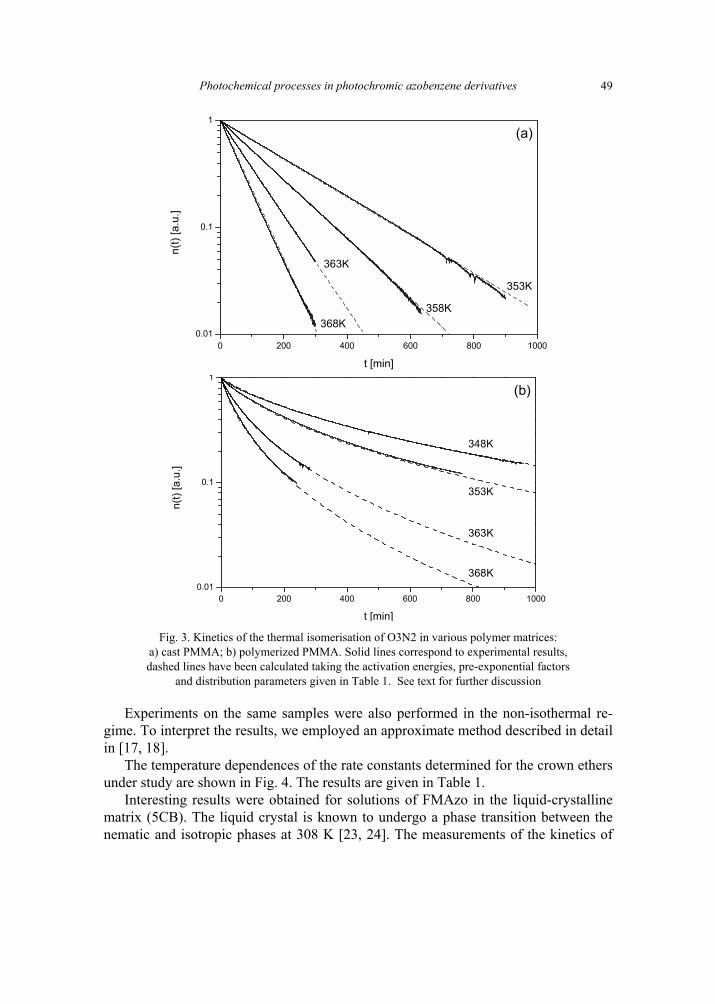
Photochemical processes in photochromic azobenzene derivatives
49
0 200 400 600 800 10000.01
0.1
1(a)
368K
363K
358K
353K
n(t)
[a.u
.]
t [min]
0 200 400 600 800 10000.01
0.1
1(b)
368K
363K
353K
348K
n(t)
[a.u
.]
t [min] Fig. 3. Kinetics of the thermal isomerisation of O3N2 in various polymer matrices:
a) cast PMMA; b) polymerized PMMA. Solid lines correspond to experimental results, dashed lines have been calculated taking the activation energies, pre-exponential factors
and distribution parameters given in Table 1. See text for further discussion
Experiments on the same samples were also performed in the non-isothermal re-gime. To interpret the results, we employed an approximate method described in detail in [17, 18].
The temperature dependences of the rate constants determined for the crown ethers under study are shown in Fig. 4. The results are given in Table 1.
Interesting results were obtained for solutions of FMAzo in the liquid-crystalline matrix (5CB). The liquid crystal is known to undergo a phase transition between the nematic and isotropic phases at 308 K [23, 24]. The measurements of the kinetics of
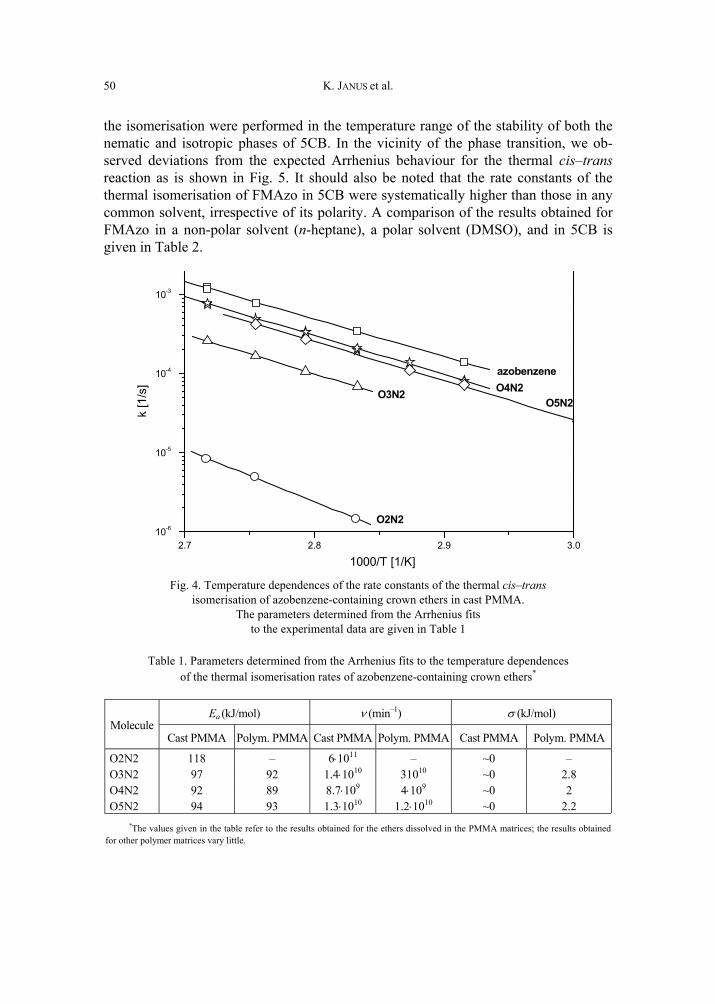
K. JANUS et al.
50
the isomerisation were performed in the temperature range of the stability of both the nematic and isotropic phases of 5CB. In the vicinity of the phase transition, we ob-served deviations from the expected Arrhenius behaviour for the thermal cis–trans reaction as is shown in Fig. 5. It should also be noted that the rate constants of the thermal isomerisation of FMAzo in 5CB were systematically higher than those in any common solvent, irrespective of its polarity. A comparison of the results obtained for FMAzo in a non-polar solvent (n-heptane), a polar solvent (DMSO), and in 5CB is given in Table 2.
2.7 2.8 2.9 3.010-6
10-5
10-4
10-3
O2N2
azobenzene
O3N2O5N2
O4N2
k [1
/s]
1000/T [1/K] Fig. 4. Temperature dependences of the rate constants of the thermal cis–trans
isomerisation of azobenzene-containing crown ethers in cast PMMA. The parameters determined from the Arrhenius fits
to the experimental data are given in Table 1
Table 1. Parameters determined from the Arrhenius fits to the temperature dependences of the thermal isomerisation rates of azobenzene-containing crown ethers*
Ea (kJ/mol) ν (min–1) σ (kJ/mol) Molecule
Cast PMMA Polym. PMMA Cast PMMA Polym. PMMA Cast PMMA Polym. PMMA
O2N2 118 – 6⋅1011 – ~0 – O3N2 97 92 1.4⋅1010 31010 ~0 2.8 O4N2 92 89 8.7⋅109 4⋅109 ~0 2 O5N2 94 93 1.3⋅1010 1.2⋅1010 ~0 2.2
*The values given in the table refer to the results obtained for the ethers dissolved in the PMMA matrices; the results obtainedfor other polymer matrices vary little.
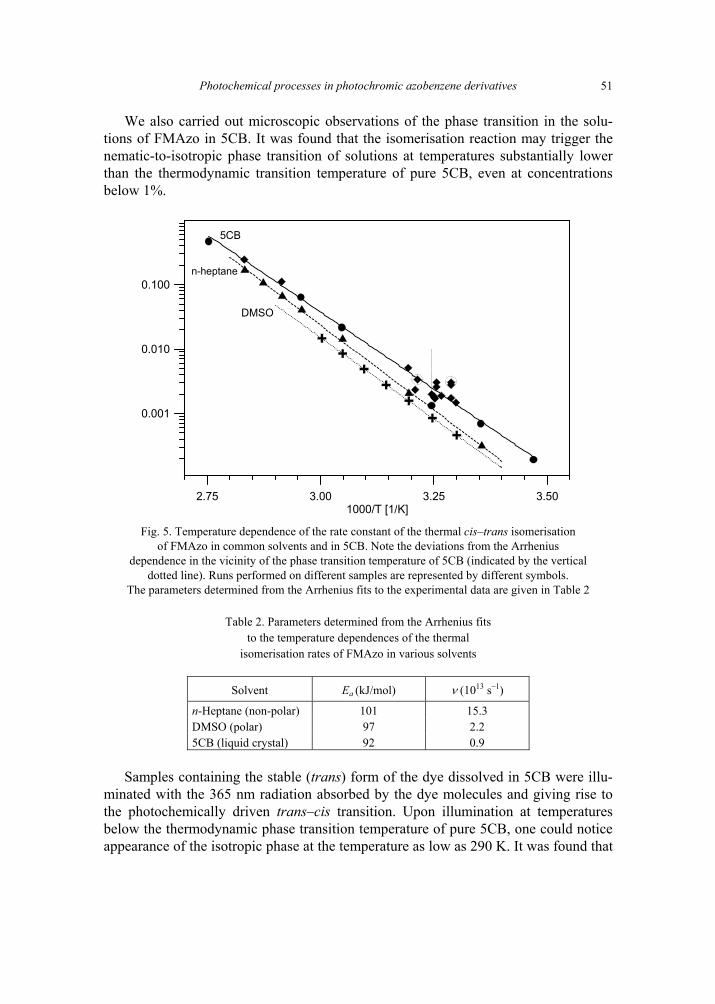
Photochemical processes in photochromic azobenzene derivatives
51
We also carried out microscopic observations of the phase transition in the solu-tions of FMAzo in 5CB. It was found that the isomerisation reaction may trigger the nematic-to-isotropic phase transition of solutions at temperatures substantially lower than the thermodynamic transition temperature of pure 5CB, even at concentrations below 1%.
2.75 3.00 3.25 3.501000/T [1/K]
0.001
0.010
0.100n-heptane
5CB
DMSO
Fig. 5. Temperature dependence of the rate constant of the thermal cis–trans isomerisation
of FMAzo in common solvents and in 5CB. Note the deviations from the Arrhenius dependence in the vicinity of the phase transition temperature of 5CB (indicated by the vertical
dotted line). Runs performed on different samples are represented by different symbols. The parameters determined from the Arrhenius fits to the experimental data are given in Table 2
Table 2. Parameters determined from the Arrhenius fits to the temperature dependences of the thermal
isomerisation rates of FMAzo in various solvents
Solvent Ea (kJ/mol) ν (1013 s–1)
n-Heptane (non-polar) 101 15.3 DMSO (polar) 97 2.2 5CB (liquid crystal) 92 0.9
Samples containing the stable (trans) form of the dye dissolved in 5CB were illu-
minated with the 365 nm radiation absorbed by the dye molecules and giving rise to the photochemically driven trans–cis transition. Upon illumination at temperatures below the thermodynamic phase transition temperature of pure 5CB, one could notice appearance of the isotropic phase at the temperature as low as 290 K. It was found that
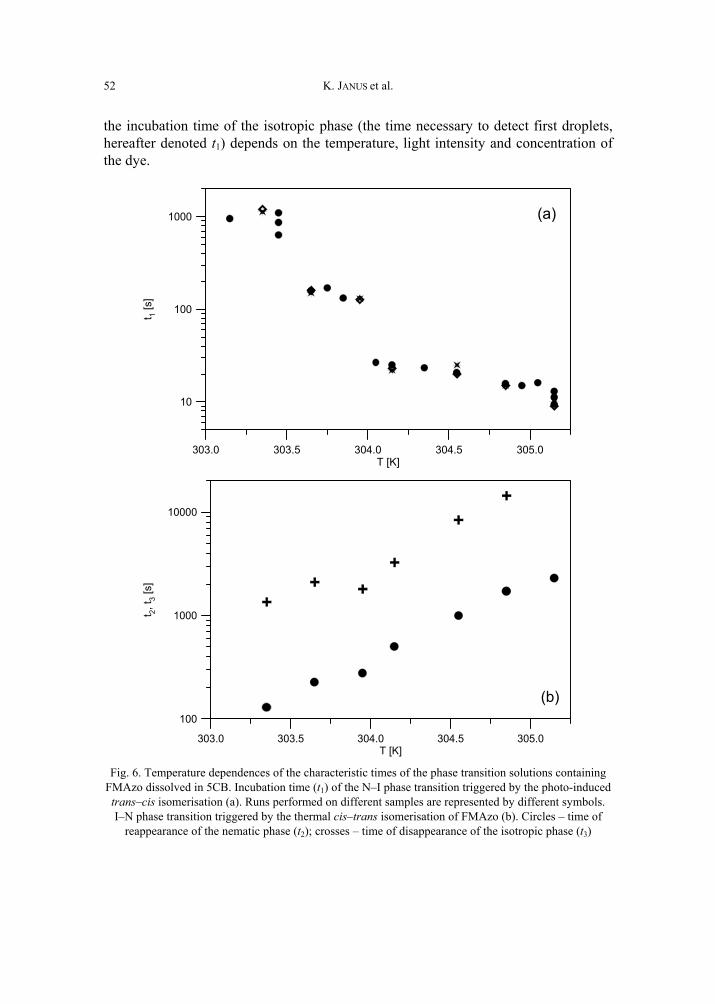
K. JANUS et al.
52
the incubation time of the isotropic phase (the time necessary to detect first droplets, hereafter denoted t1) depends on the temperature, light intensity and concentration of the dye.
303.0 303.5 304.0 304.5 305.0T [K]
10
100
1000
t 1 [s]
(a)
303.0 303.5 304.0 304.5 305.0T [K]
100
1000
10000
t 2, t 3 [
s]
(b)
Fig. 6. Temperature dependences of the characteristic times of the phase transition solutions containing
FMAzo dissolved in 5CB. Incubation time (t1) of the N–I phase transition triggered by the photo-induced trans–cis isomerisation (a). Runs performed on different samples are represented by different symbols. I–N phase transition triggered by the thermal cis–trans isomerisation of FMAzo (b). Circles – time of
reappearance of the nematic phase (t2); crosses – time of disappearance of the isotropic phase (t3)
Photochemical processes in photochromic azobenzene derivatives
53
Experiments reported in this paper were performed on a diluted system (xAzo
= 0.011), in order to avoid any possible effects associated with aggregation of the dye. The dependences of the incubation time on the temperature and light intensity are shown in Fig. 6a. A further illumination was found to result in disappearance of the nematic phase inside the illuminated region of the sample. Pre-irradiated samples, when kept in the dark, were found to undergo a reverse process: after a certain time, depending on the temperature of the experiment, the nematic phase reappears. Both, the time of reappearance of first droplets of the nematic phase (t2) and time of disap-pearance of last portions of the isotropic phase (t3) were temperature-dependent, as is shown in Fig. 6b.
4. Discussion
It is interesting to note that the rate constants determined for O2N2 are systematically lower than the rate constants in the other crown ethers under study. The analysis of the results obtained on the series of azobenene-containing crown ethers in various matrices, given in Table 1, shows that the activation energy of the thermal cis–trans isomerisation in O2N2 is much higher than in other systems, being also practically independent of the matrix used (though in some matrices we observed a dispersion of the rate constants). Thus, for sufficiently large crowns, the height of the energy barrier for the thermal isomer-isation appears weakly dependent on the size of the crown (and hence on the conformation of the crown). A relation between the experimental values determined in our experiments and microscopic parameters characterizing the isomerisation of the azoben-zene-containing crown ethers remains, however, to be determined.
The dependence of the temperature of the nematic-to-isotropic phase transition on the isomerisation reaction can be rationalized based on a simple model taking into account differences in the solubility of FMAzo in 5CB, due to the differences in mo-lecular shapes of the trans and cis forms of the dye. The photochemical trans–cis reaction results in production of cis molecules, incompatible with 5CB, and hence poorly soluble in the matrix. Thus the increase of the concentration of the former molecules should result in saturation of the solution, followed by a phase separation and, finally, by a disappearance of the nematic phase.
The validity of the model can be assessed as the concentration of cis molecules can be calculated from the equation describing the first-order kinetics provided the initial concentration and the rate constants are known. Assuming that the forward (trans–cis) reaction is only photochemically driven and the sample is uniformly illuminated, Eq. (1) can be transformed to the form
( ))exp(1)0(transcis tkxx ph−−= (3)
where x is the mole fraction of either the cis or trans form of FMAzo, and kph stands for effective rate constant of the photochemical trans–cis reaction, depending on the
K. JANUS et al.
54
light intensity and quantum yield of the reaction. Thus the incubation time t1 is di-rectly related to the concentration of cis-FMAzo in its saturated solution in the nematic phase of 5CB. Similarly, changes of the concentration of cis-FMAzo during the thermally driven cis–trans reaction are described by the equation
( )tTkxx )(exp)0(ciscis −= (4)
Consequently, the time of reappearance of first droplets of the nematic phase (t2) should be related to the concentration of cis-FMA in its saturated solution in the iso-tropic phase of 5CB, whereas the time of disappearance of last portions of the isotropic phase (t3) should be related to the concentration of cis-FMA in its saturated solution in the nematic phase of 5CB.
The results obtained explain on a semi-quantitative basis photochemically driven phase transition appearing below the thermodynamic temperature. One should realize, however, that the model contains several simplifications. First, the model neglects all but chemical processes occurring in the system. Secondly, it takes into considerations only the binary system 5CB–cis-FMAzo, neglecting the presence of the trans form of FMAzo in the system. We believe, however, that all neglected factors may qualita-tively modify the dependence but its general form will remain unchanged.
Acknowledgements
The authors thank Professor J.F. Biernat and Dr E. Luboch (Technical University of Gdańsk), and Dr Z. Galewski (University of Wrocław) for the gift of the materials used in the present study. Merck KGaA are greatly acknowledged for the gift of 5CB. The research reported in this paper was sup-ported by the Polish State Committee for Scientific Research (Grants No 3 T09A 144 19 (KJ) and 7 T09A 012 21 (KM)).
References
[1] IRIE M. (Ed.), Photo-Reactive Materials for Ultra-High Density Optical Memory, Elsevier, Amster-dam, 1994.
[2] YEH C., Applied Photonics, Academic Press, San Diego, 1994. [3] BLINOV L.M., CHIGRINOV V.G., Electrooptic Effects in Liquid Crystal Materials, Springer-Verlag,
New York, 1996. [4] JANUS K., MATCZYSZYN K., SWORAKOWSKI J., BIERNAT J.F., GALEWSKI Z., Mol. Cryst. Liq. Cryst.,
361 (2001) 143. [5] SHIGA M., TAKAGI M., UENO K., Chem. Lett. (1980), 1201. [6] SHINKAI S., MINAMI T., KUSANO Y., MANABE O., J. Am. Chem. Soc., 105 (1983), 1851. [7] RUSLIM CH., ICHIMURA K., J. Mater. Chem., 9 (1999), 673. [8] IKEDA T, SASAKI T., ICHIMURA K., Nature, 361 (1993), 428. [9] IKEDA T., TSUTSUMI O., Science, 268 (1995), 1873.
[10] TSUTSUMI O., KANAZAWA A., SHIONO T., IKEDA T., PARK L-S., Phys. Chem. Chem. Phys., 1 (1999), 4219.
[11] PRASAD K., NAIR G.G., Adv. Mater., 13 (2001), 40. [12] LUBOCH E., KRAVTSOV V.CH, KONITZ A., J. Supramol. Chem., 1 (2001), 101.
Photochemical processes in photochromic azobenzene derivatives
55
[13] BIERNAT J.F., LUBOCH E., CYGAN A., SIMONOV Y.A., DVORKIN A.A., MUSZALSKA E., BILEWICZ R., Tetrahedron, 48 (1992), 4399.
[14] LUBOCH E., BIERNAT J.F., SIMONOV Y.A., DVORKIN A.A., Tetrahedron, 54 (1998), 4977. [15] GALEWSKI Z., Liquid Crystalline Polymorphism of Schiff Bases and Azobenzenes, University of
Wrocław, Wrocław, 1999. [16] JANUS K., SWORAKOWSKI J., OLSZOWSKI A., LEWANOWICZ A., LIPIŃSKI J., LUBOCH E., BIERNAT J.F.,
Adv. Mater. Opt. Electron., 9 (1999), 181. [17] SWORAKOWSKI J., JANUS K., NEŠPŮREK S., IEEE Trans. Diel. Electr. Insul., 8 (2001), 543. [18] JANUS K., KOSHETS I.A., SWORAKOWSKI J., NEŠPŮREK S., J. Mater. Chem., 12 (2002), 1657. [19] JANUS K., SWORAKOWSKI J., LUBOCH E., Chem. Phys., in print (2002). [20] RICHERT R., BÄSSLER H., Chem. Phys. Lett., 116 (1985), 302. [21] RICHERT R., Chem. Phys. Lett., 118 (1985), 534. [22] SWORAKOWSKI J., NEŠPŮREK S., Chem. Phys. Lett., 298 (1998), 21. [23] ORWOLL R.A., SULLIVAN V.J., CAMPBELL G.C., Mol. Cryst. Liq. Cryst., 149 (1987), 121. [24] PORTER R.S., SCHELL K.T., Mol. Cryst. Liq. Cryst., 182 (1990), 185.
Received 3 June 2002 Revised 23 July 2002
Materials Science, Vol. 20, No. 3, 2002
Optical properties of ferroelectric Langmuir–Blodgett films impregnated with dye molecules
VLADIMIR B. ZAITSEV∗, ALEXANDER N. NEVZOROV, GENNADY S. PLOTNIKOV
M. V. Lomonosov Moscow State University, Physics Department
Ferroelectric polymer films are very promising materials for modern microelectronics, molecular electronics and nonlinear optics. Langmuir–Blodgett films of poly vinylidene fluoride copolymer im-pregnated with organic dye molecules were studied experimentally. Ferroelectric films of this type undergo a phase transition at the Curie temperature. Fluorescence spectra of the structures were investi-gated. A strong influence of the phase transition onto the position and shape of the fluorescence spectrum was observed. A new effect of photosensitized shift of the Curie temperature was found. Besides the main ferroelectric transition, a low-temperature structural transition in super thin films was discovered for the first time by the optical method. Possible mechanisms of the effects observed are discussed.
Key words: ferroelectric polymer film; structural transition; organic dye molecules; fluorescence; photo-sensitization
1. Introduction
Ferroelectric polymer films are very promising materials for modern microelec-tronics, molecular electronics and nonlinear optics. Ferroelectric polymer poly (vinylidene fluoride) and its copolymers (deposited by spin coating with thickness from 0.6 to several microns) have been under intense study for about 30 years, provid-ing fundamental data [1] and practical applications [2]. New interest to this material rose after extremely thin films of copolymer obtained built by Langmuir –Blodgett (LB) method. It was found [3] that the films save their ferroelectric proper-ties down to thickness of about 4 nm. This technology can well provide very thin active dielectric films of controllable thickness.
Our interest in ferroelectric polymer films is inspired by the fact that they can pro-vide a novel material with unusual optical properties when being impregnated with polar dye molecules. The use of a ferroelectric film as a matrix for the dye applies
_________ *Corresponding author, e-mail: [email protected].
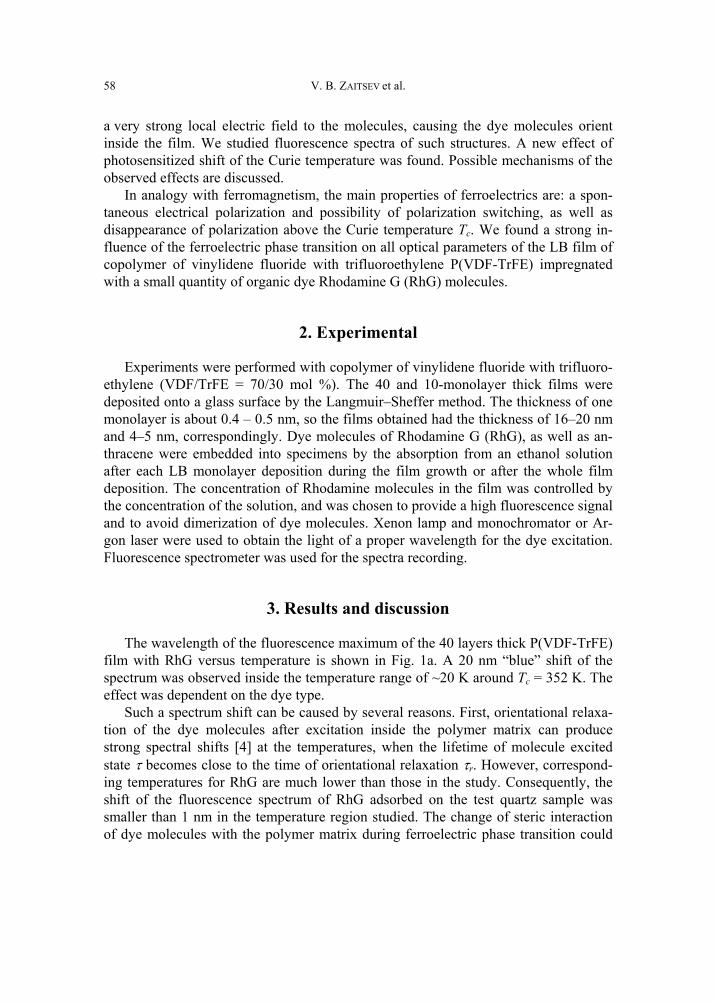
V. B. ZAITSEV et al.
58
a very strong local electric field to the molecules, causing the dye molecules orient inside the film. We studied fluorescence spectra of such structures. A new effect of photosensitized shift of the Curie temperature was found. Possible mechanisms of the observed effects are discussed.
In analogy with ferromagnetism, the main properties of ferroelectrics are: a spon-taneous electrical polarization and possibility of polarization switching, as well as disappearance of polarization above the Curie temperature Tc. We found a strong in-fluence of the ferroelectric phase transition on all optical parameters of the LB film of copolymer of vinylidene fluoride with trifluoroethylene P(VDF-TrFE) impregnated with a small quantity of organic dye Rhodamine G (RhG) molecules.
2. Experimental
Experiments were performed with copolymer of vinylidene fluoride with trifluoro-ethylene (VDF/TrFE = 70/30 mol %). The 40 and 10-monolayer thick films were deposited onto a glass surface by the Langmuir–Sheffer method. The thickness of one monolayer is about 0.4 – 0.5 nm, so the films obtained had the thickness of 16–20 nm and 4–5 nm, correspondingly. Dye molecules of Rhodamine G (RhG), as well as an-thracene were embedded into specimens by the absorption from an ethanol solution after each LB monolayer deposition during the film growth or after the whole film deposition. The concentration of Rhodamine molecules in the film was controlled by the concentration of the solution, and was chosen to provide a high fluorescence signal and to avoid dimerization of dye molecules. Xenon lamp and monochromator or Ar-gon laser were used to obtain the light of a proper wavelength for the dye excitation. Fluorescence spectrometer was used for the spectra recording.
3. Results and discussion
The wavelength of the fluorescence maximum of the 40 layers thick P(VDF-TrFE) film with RhG versus temperature is shown in Fig. 1a. A 20 nm “blue” shift of the spectrum was observed inside the temperature range of ~20 K around Tc = 352 K. The effect was dependent on the dye type.
Such a spectrum shift can be caused by several reasons. First, orientational relaxa-tion of the dye molecules after excitation inside the polymer matrix can produce strong spectral shifts [4] at the temperatures, when the lifetime of molecule excited state τ becomes close to the time of orientational relaxation τr. However, correspond-ing temperatures for RhG are much lower than those in the study. Consequently, the shift of the fluorescence spectrum of RhG adsorbed on the test quartz sample was smaller than 1 nm in the temperature region studied. The change of steric interaction of dye molecules with the polymer matrix during ferroelectric phase transition could
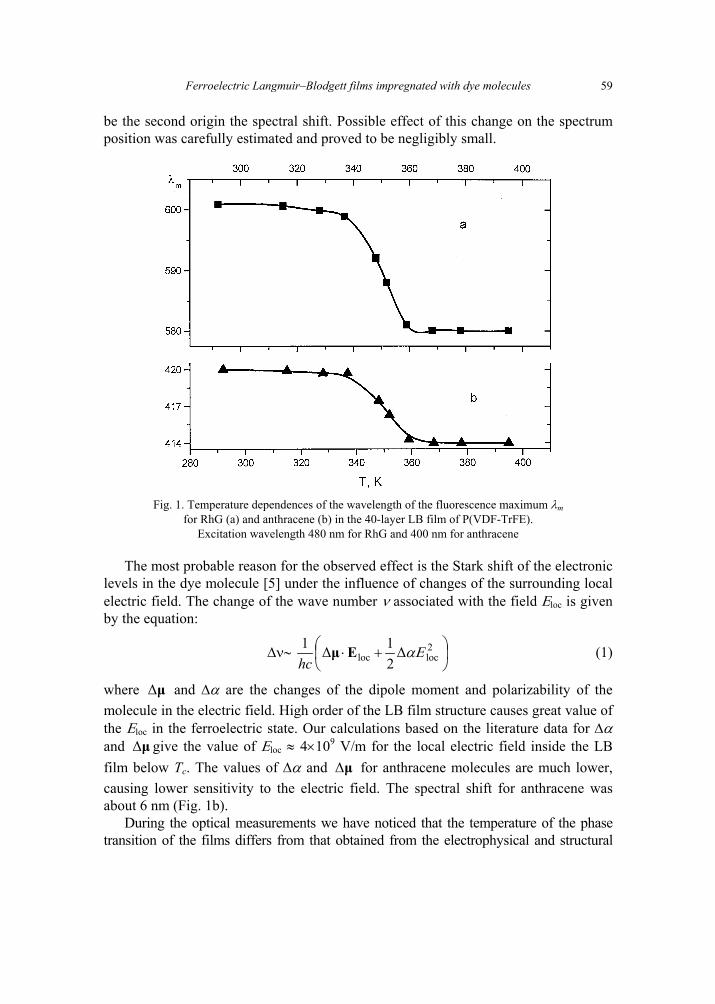
Ferroelectric Langmuir–Blodgett films impregnated with dye molecules
59
be the second origin the spectral shift. Possible effect of this change on the spectrum position was carefully estimated and proved to be negligibly small.
Fig. 1. Temperature dependences of the wavelength of the fluorescence maximum λm
for RhG (a) and anthracene (b) in the 40-layer LB film of P(VDF-TrFE). Excitation wavelength 480 nm for RhG and 400 nm for anthracene
The most probable reason for the observed effect is the Stark shift of the electronic levels in the dye molecule [5] under the influence of changes of the surrounding local electric field. The change of the wave number ν associated with the field Εloc is given by the equation:
∆ν∼
+⋅ 2
locloc ∆21∆1 ΕαΕµ
hc (1)
where µ∆ and ∆α are the changes of the dipole moment and polarizability of the molecule in the electric field. High order of the LB film structure causes great value of the Εloc in the ferroelectric state. Our calculations based on the literature data for ∆α and µ∆ give the value of Εloc ≈ 4×10⁹ V/m for the local electric field inside the LB film below Tc. The values of ∆α and µ∆ for anthracene molecules are much lower, causing lower sensitivity to the electric field. The spectral shift for anthracene was about 6 nm (Fig. 1b).
During the optical measurements we have noticed that the temperature of the phase transition of the films differs from that obtained from the electrophysical and structural
V. B. ZAITSEV et al.
60
measurements of other authors. The Curie temperature obtained from the spectral data is about 20 K lower. This may be due to the non-radiative energy transfer from the dye molecules to the polymer chains. The dye molecule excited by a light quantum, has a possibility to discharge the energy through several channels: (1) luminescence; (2) non-radiative energy transfer to near adsorbed molecules through the Förster–Dexter induc-tion-resonance mechanism; (3) intramolecular singlet-triplet transfer; (4) non-radiative electron energy transfer to the matrix; (5) electron-vibrational coupling (internal energy conversion to vibrational modes). The channels (4) and (5) can cause the energy transfer to the polymer chains either directly or via vibrational modes. In both cases it may be the reason of the shift of the Curie point to lower values. Photo-induced transitions in the adsorbed dye molecules are known to cause the shift of the semiconductor–metal phase transition in VO2 to lower temperatures [6].
To prove our assumption, we carried out a special experiment. We have built a capacitor structure sputtering a metal (Sn) layer before the film deposition and on the surface of LB film with dye molecules. The temperature dependences of the capaci-tance of such a structure are shown in Fig. 2. As is seen from the picture, the capacitance has a local maximum at 378 K in the dark. This local maximum is unam-biguously identified with the ferroelectric phase transition [3]. The local maximum of the capacitance shifts to 352 K when the sample is illuminated by the light of Argon laser for the dye excitation. A control experiment has proven that the direct heating of the sample by the Argon laser was lower than 1 K.
Fig. 2. Temperature dependences of the relative capacitance
of the 40-layer LB film impregnated with the RhG dye molecules in the dark (1) and when illuminated at the wavelength of the RhG absorption (2)
The spectral maximum shifts were accompanied by strong changes of the band widths (Fig. 3). Despite different Stark shifts of the spectra for the RhG and anthra-
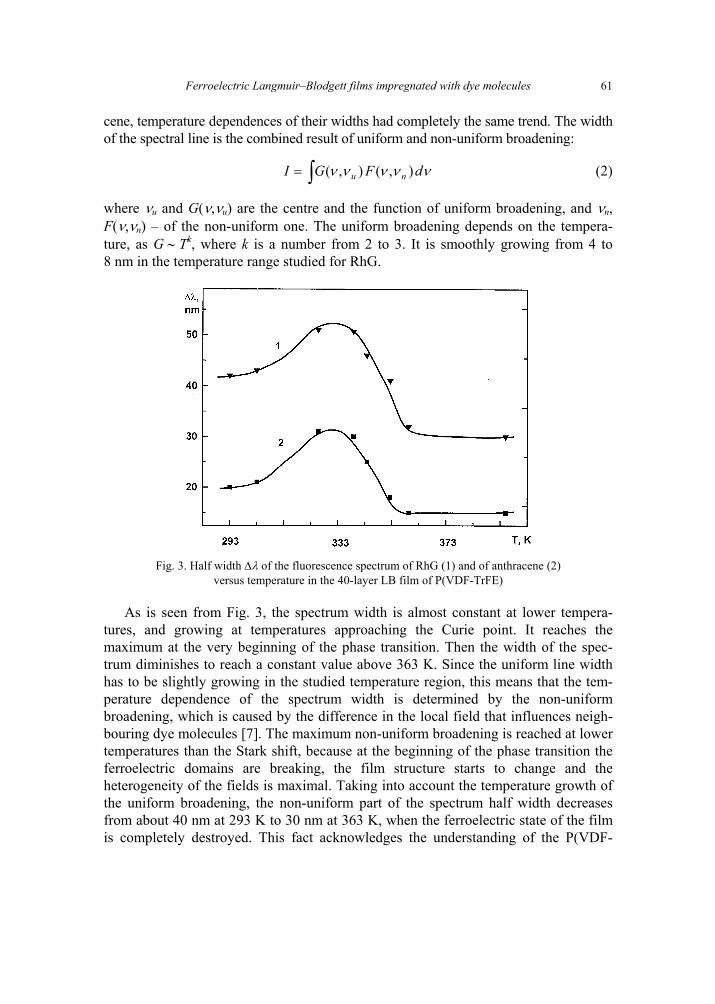
Ferroelectric Langmuir–Blodgett films impregnated with dye molecules
61
cene, temperature dependences of their widths had completely the same trend. The width of the spectral line is the combined result of uniform and non-uniform broadening:
ννννν dFGI nu ),(),(∫= (2)
where νu and G(ν,νu) are the centre and the function of uniform broadening, and νn, F(ν,νn) – of the non-uniform one. The uniform broadening depends on the tempera-ture, as G ∼ Тk, where k is a number from 2 to 3. It is smoothly growing from 4 to 8 nm in the temperature range studied for RhG.
Fig. 3. Half width ∆λ of the fluorescence spectrum of RhG (1) and of anthracene (2)
versus temperature in the 40-layer LB film of P(VDF-TrFE)
As is seen from Fig. 3, the spectrum width is almost constant at lower tempera-tures, and growing at temperatures approaching the Curie point. It reaches the maximum at the very beginning of the phase transition. Then the width of the spec-trum diminishes to reach a constant value above 363 K. Since the uniform line width has to be slightly growing in the studied temperature region, this means that the tem-perature dependence of the spectrum width is determined by the non-uniform broadening, which is caused by the difference in the local field that influences neigh-bouring dye molecules [7]. The maximum non-uniform broadening is reached at lower temperatures than the Stark shift, because at the beginning of the phase transition the ferroelectric domains are breaking, the film structure starts to change and the heterogeneity of the fields is maximal. Taking into account the temperature growth of the uniform broadening, the non-uniform part of the spectrum half width decreases from about 40 nm at 293 K to 30 nm at 363 K, when the ferroelectric state of the film is completely destroyed. This fact acknowledges the understanding of the P(VDF-
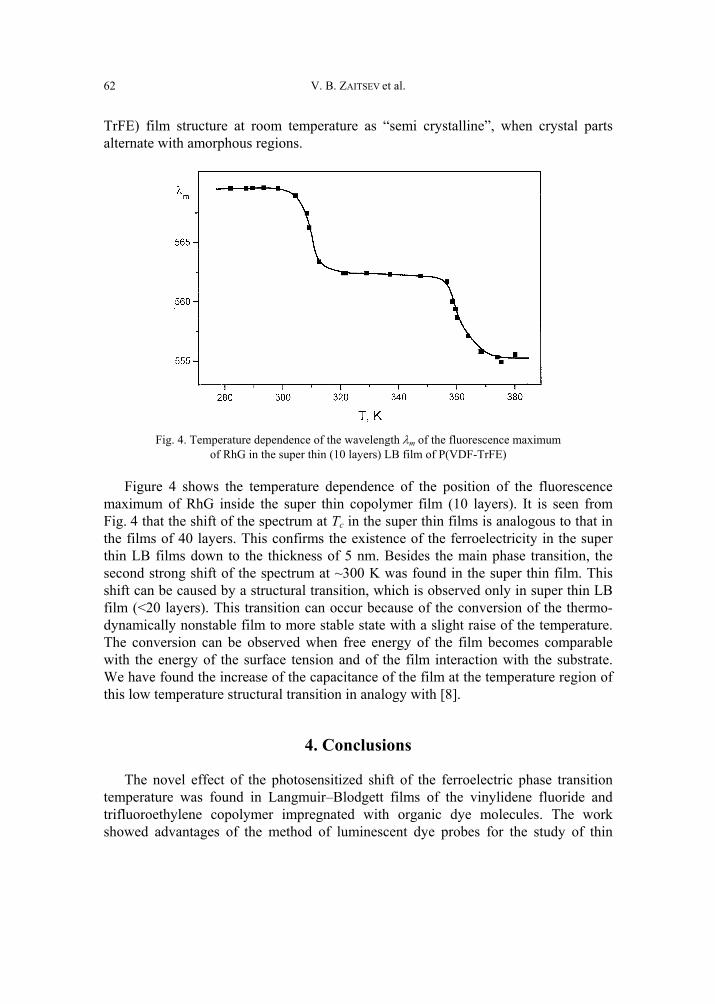
V. B. ZAITSEV et al.
62
TrFE) film structure at room temperature as “semi crystalline”, when crystal parts alternate with amorphous regions.
Fig. 4. Temperature dependence of the wavelength λm of the fluorescence maximum
of RhG in the super thin (10 layers) LB film of P(VDF-TrFE)
Figure 4 shows the temperature dependence of the position of the fluorescence maximum of RhG inside the super thin copolymer film (10 layers). It is seen from Fig. 4 that the shift of the spectrum at Tc in the super thin films is analogous to that in the films of 40 layers. This confirms the existence of the ferroelectricity in the super thin LB films down to the thickness of 5 nm. Besides the main phase transition, the second strong shift of the spectrum at ~300 K was found in the super thin film. This shift can be caused by a structural transition, which is observed only in super thin LB film (<20 layers). This transition can occur because of the conversion of the thermo-dynamically nonstable film to more stable state with a slight raise of the temperature. The conversion can be observed when free energy of the film becomes comparable with the energy of the surface tension and of the film interaction with the substrate. We have found the increase of the capacitance of the film at the temperature region of this low temperature structural transition in analogy with [8].
4. Conclusions
The novel effect of the photosensitized shift of the ferroelectric phase transition temperature was found in Langmuir–Blodgett films of the vinylidene fluoride and trifluoroethylene copolymer impregnated with organic dye molecules. The work showed advantages of the method of luminescent dye probes for the study of thin
Ferroelectric Langmuir–Blodgett films impregnated with dye molecules
63
polymer films which undergo structural transitions. This helps to accomplish one of the most important tasks of the surface and thin films science – the heterogeneity study. We have detected, by the optical method, the existence of a low-temperature structural transition in super thin films of P(VDF-TrFE) copolymer. We have also shown the influence of the ferroelectric phase transition in the thin LB P(VDF-TrFE) films impregnated with RhG molecules on the parameters of the fluorescence of the dopant. An extremely strong effect of the electric field in the film changing during the phase transition on the optical properties of the adsorbed molecules makes it possible to produce novel materials for micro- and molecular electronics, as well as for nonlin-ear optics. The possibility of the photosensitization of the phase transition in the material studied makes it especially interesting.
Acknowledgements
The authors express their deep gratitude to Professor S. G. Yudin for the preparation of the samples.
References
[1] FURUKAWA T., Phase Trans., 18 (1989), 143. [2] WANG T.T., HERBERT J.M., GLASS A.M., The Applications of Ferroelectric Polymers, Blackie,
Glasgow, 1987. [3] BUNE A. DUCHARME S., FRIDKIN V.M., BLINOV L., PALTO S., PETUKHOVA N., YUDIN S., Appl. Phys.
Lett., 67 (1995), 3975. [4] BESPALOV V.A., ZAITSEV V.B., LEVSHIN L.V., PLOTNIKOV G.S., SALETSKY A.M., J. Appl Spectro-
scopy, 56 (1992), 478. [5] ZAITSEV V.B., ZHIDOMIROVA S.G., PLOTNIKOV G.S., Sov. J. Chem. Phys., 8 (1991), 804. [6] ZAITSEV V. B. et al., Doklady Akad. Nauk SSSR (in Russian), 304 (1989), 649. [7] ZAITSEV V.B., KISELEV V.F., PETRUKHIN A.G., PLOTNIKOV G.S., STAROSTIN V.V., Phys. Mech.
Surfaces, 11 (1995), 1093. [8] BUNE A.V. FRIDKIN V.M., DUCHARME S., BLINOV L.M., PALTO S.P., SOROKIN A.V., YUDIN S.G.,
ZLATKIN A., Nature, 391 (1998), 874.
Received 3 June 2002 Revised 23 July 2002
Materials Science, Vol. 20, No. 3, 2002
High-conductivity organic metals as electrode materials
ALEXANDER P. POSPELOV1*, MARINA V. VED1, NIKOLAY D. SAKHNENKO1, YURIY L. ALEXANDROV1, VIKTORIA V. SHTEFAN1, ANDREY V. KRAVCHENKO2
GENNADIY V. KAMARCHUK3
1National Technical University Kharkov Polytechnical Institute, Kharkov, Ukraine 2V. Karazine Kharkov National University, Kharkov, Ukraine
3B. Verkin Institute for Low Temperature Physics and Engineering, Kharkov, Ukraine
Electrode properties of TCNQ (7,7,8,8-tetracyanoquinodimethane) and BEDT-TTF (bis-(ethylenedithio)tetrathiafulvalene) derivatives are considered. The BEDT-TTF-based organic electrode materials were produced by electrochemical technique. Electrodes with TCNQ salts were obtained by ther-mal or evaporation method. Polarization and impedance investigations have shown the high electrode activity of the BEDT-TTF based materials in irreversible electrochemical processes. TCNQ-based OM sensitivity to pH as well as electrode surface resistance vary depending on gaseous phase composition. The latter circumstance is quite prospective for applications of organic metals in analytical control devices.
Key words: TCNQ molten salts; H-function; impedance spectroscopy; evaporation technique; electro-chemical synthesis
1. Introduction
Extensive data on highly conducting organic substances [1, 2] are accumulated at present. A lot of fundamental papers describe synthesis technique, structural character-istics, physical and chemical properties of the organic metals (OM). These fundamental investigations provide a basis for the development of advanced technolo-gies. The key element of the instruments and devices used in such a technique is a single electrode, or electrode system containing modern materials. Therefore, the analysis of the performance of the OM electrode under various conditions is of a spe-cial interest. It permits to make a step from theoretical investigations to creation and testing the compounds of desired properties.
_________ * Corresponding author, e-mail: [email protected].
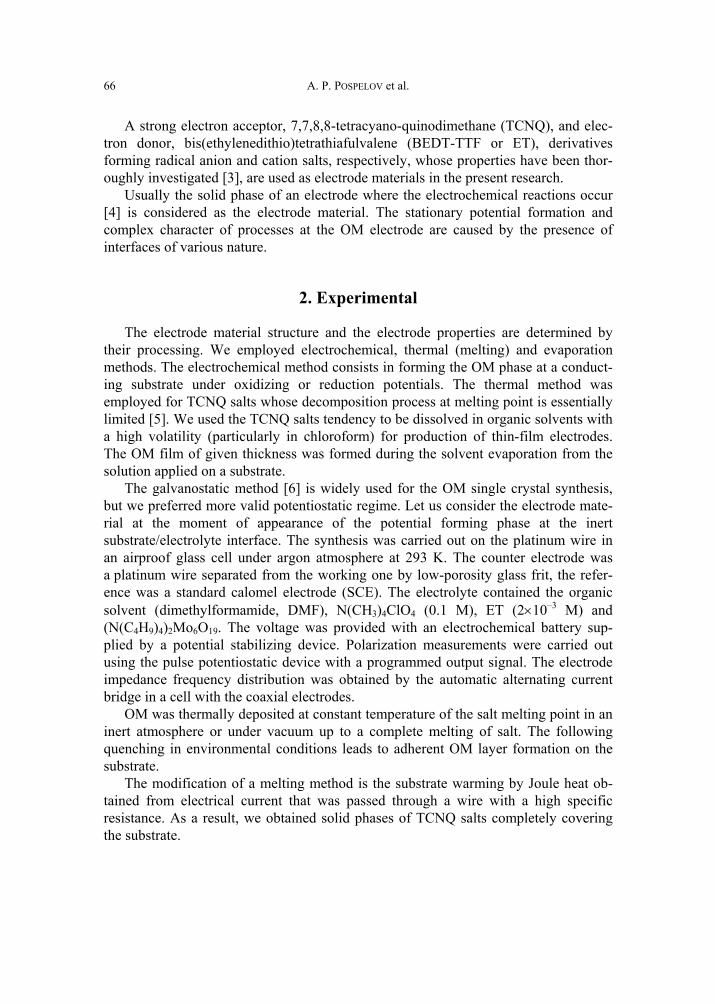
A. P. POSPELOV et al.
66
A strong electron acceptor, 7,7,8,8-tetracyano-quinodimethane (TCNQ), and elec-tron donor, bis(ethylenedithio)tetrathiafulvalene (BEDT-TTF or ET), derivatives forming radical anion and cation salts, respectively, whose properties have been thor-oughly investigated [3], are used as electrode materials in the present research.
Usually the solid phase of an electrode where the electrochemical reactions occur [4] is considered as the electrode material. The stationary potential formation and complex character of processes at the OM electrode are caused by the presence of interfaces of various nature.
2. Experimental
The electrode material structure and the electrode properties are determined by their processing. We employed electrochemical, thermal (melting) and evaporation methods. The electrochemical method consists in forming the OM phase at a conduct-ing substrate under oxidizing or reduction potentials. The thermal method was employed for TCNQ salts whose decomposition process at melting point is essentially limited [5]. We used the TCNQ salts tendency to be dissolved in organic solvents with a high volatility (particularly in chloroform) for production of thin-film electrodes. The OM film of given thickness was formed during the solvent evaporation from the solution applied on a substrate.
The galvanostatic method [6] is widely used for the OM single crystal synthesis, but we preferred more valid potentiostatic regime. Let us consider the electrode mate-rial at the moment of appearance of the potential forming phase at the inert substrate/electrolyte interface. The synthesis was carried out on the platinum wire in an airproof glass cell under argon atmosphere at 293 K. The counter electrode was a platinum wire separated from the working one by low-porosity glass frit, the refer-ence was a standard calomel electrode (SCE). The electrolyte contained the organic solvent (dimethylformamide, DMF), N(CH3)4ClO4 (0.1 M), ET (2×10⁻³ M) and (N(C4H9)4)2Mo6O19. The voltage was provided with an electrochemical battery sup-plied by a potential stabilizing device. Polarization measurements were carried out using the pulse potentiostatic device with a programmed output signal. The electrode impedance frequency distribution was obtained by the automatic alternating current bridge in a cell with the coaxial electrodes.
OM was thermally deposited at constant temperature of the salt melting point in an inert atmosphere or under vacuum up to a complete melting of salt. The following quenching in environmental conditions leads to adherent OM layer formation on the substrate.
The modification of a melting method is the substrate warming by Joule heat ob-tained from electrical current that was passed through a wire with a high specific resistance. As a result, we obtained solid phases of TCNQ salts completely covering the substrate.
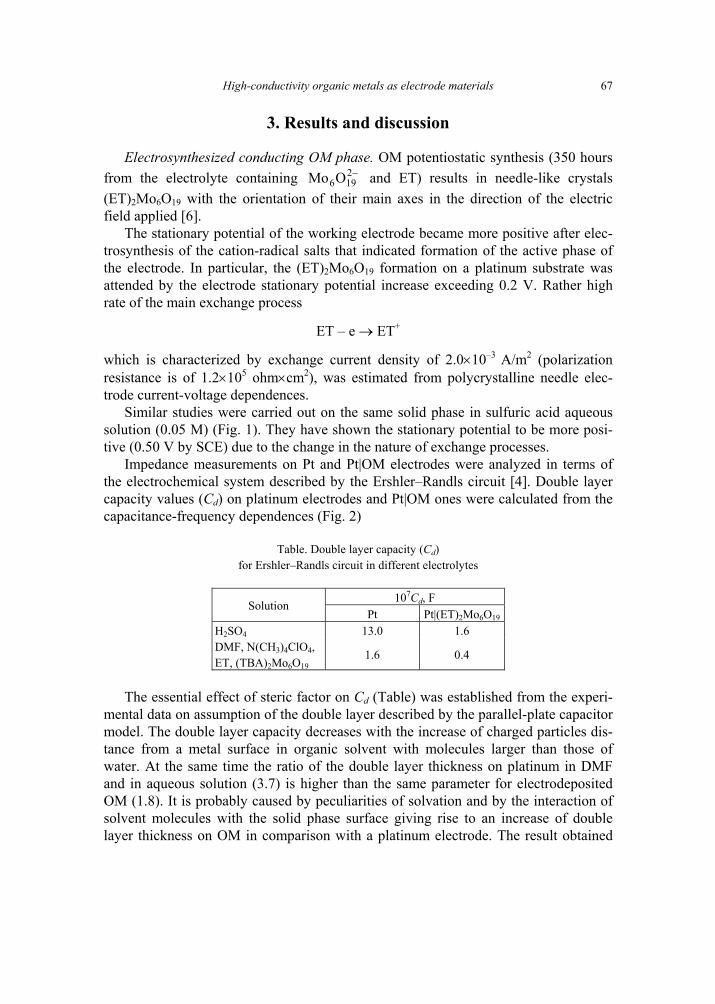
High-conductivity organic metals as electrode materials
67
3. Results and discussion
Electrosynthesized conducting OM phase. OM potentiostatic synthesis (350 hours from the electrolyte containing −2
196OMo and ET) results in needle-like crystals (ET)2Mo6O19 with the orientation of their main axes in the direction of the electric field applied [6].
The stationary potential of the working electrode became more positive after elec-trosynthesis of the cation-radical salts that indicated formation of the active phase of the electrode. In particular, the (ET)2Mo6O19 formation on a platinum substrate was attended by the electrode stationary potential increase exceeding 0.2 V. Rather high rate of the main exchange process
ET – e → ET+
which is characterized by exchange current density of 2.0×10⁻³ A/m2 (polarization resistance is of 1.2×10⁵ ohm×cm2), was estimated from polycrystalline needle elec-trode current-voltage dependences.
Similar studies were carried out on the same solid phase in sulfuric acid aqueous solution (0.05 M) (Fig. 1). They have shown the stationary potential to be more posi-tive (0.50 V by SCE) due to the change in the nature of exchange processes.
Impedance measurements on Pt and Pt|OM electrodes were analyzed in terms of the electrochemical system described by the Ershler–Randls circuit [4]. Double layer capacity values (Cd) on platinum electrodes and Pt|OM ones were calculated from the capacitance-frequency dependences (Fig. 2)
Table. Double layer capacity (Сd) for Ershler–Randls circuit in different electrolytes
107Сd, F Solution
Pt Pt|(ET)2Mo6O19
H2SO4 13.0 1.6 DMF, N(CH3)4ClO4, ET, (ТBА)2Mo6O19
1.6 0.4
The essential effect of steric factor on Сd (Table) was established from the experi-
mental data on assumption of the double layer described by the parallel-plate capacitor model. The double layer capacity decreases with the increase of charged particles dis-tance from a metal surface in organic solvent with molecules larger than those of water. At the same time the ratio of the double layer thickness on platinum in DMF and in aqueous solution (3.7) is higher than the same parameter for electrodeposited OM (1.8). It is probably caused by peculiarities of solvation and by the interaction of solvent molecules with the solid phase surface giving rise to an increase of double layer thickness on OM in comparison with a platinum electrode. The result obtained
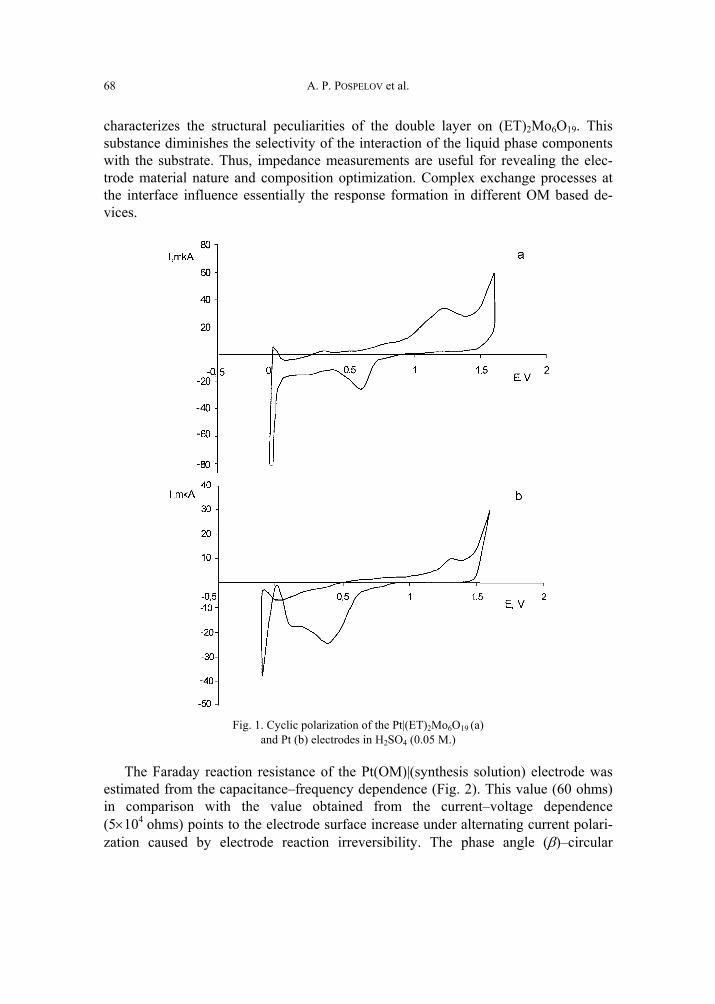
A. P. POSPELOV et al.
68
characterizes the structural peculiarities of the double layer on (ET)2Mo6O19. This substance diminishes the selectivity of the interaction of the liquid phase components with the substrate. Thus, impedance measurements are useful for revealing the elec-trode material nature and composition optimization. Complex exchange processes at the interface influence essentially the response formation in different OM based de-vices.
Fig. 1. Cyclic polarization of the Pt|(ET)2Mo6O19 (a)
and Pt (b) electrodes in H2SO4 (0.05 M.)
The Faraday reaction resistance of the Pt(OM)|(synthesis solution) electrode was estimated from the capacitance–frequency dependence (Fig. 2). This value (60 ohms) in comparison with the value obtained from the current–voltage dependence (5×10⁴ ohms) points to the electrode surface increase under alternating current polari-zation caused by electrode reaction irreversibility. The phase angle (β)–circular
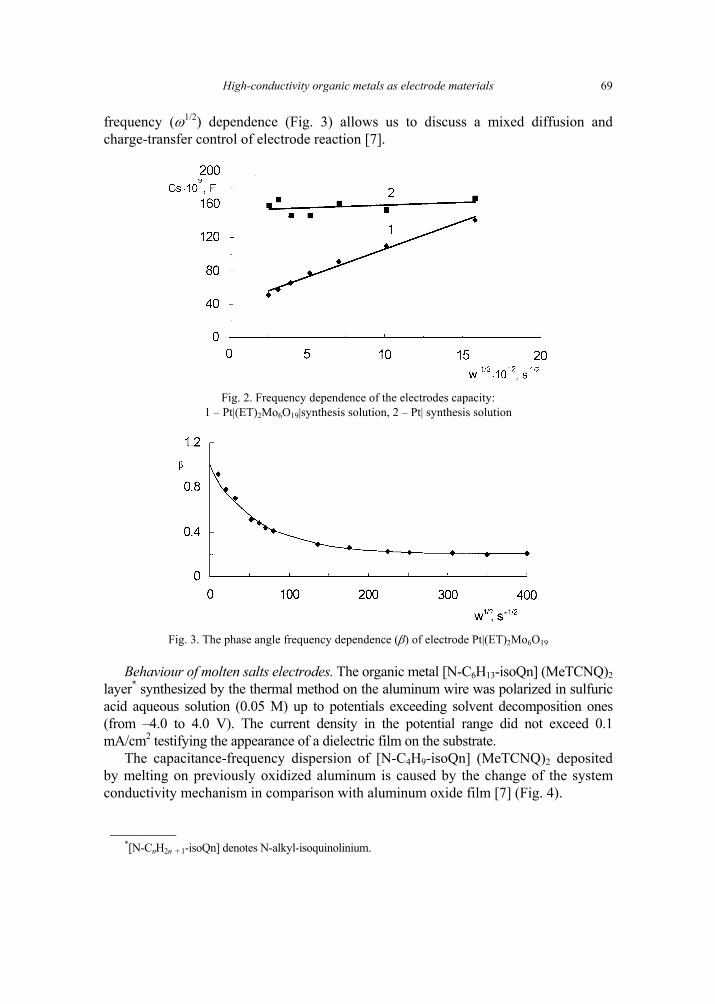
High-conductivity organic metals as electrode materials
69
frequency (ω1/2) dependence (Fig. 3) allows us to discuss a mixed diffusion and charge-transfer control of electrode reaction [7].
Fig. 2. Frequency dependence of the electrodes capacity:
1 – Pt|(ET)2Mo6O19|synthesis solution, 2 – Pt| synthesis solution
Fig. 3. The phase angle frequency dependence (β) of electrode Pt|(ET)2Mo6O19
Behaviour of molten salts electrodes. The organic metal [N-C6H13-isoQn] (MeTCNQ)2 layer* synthesized by the thermal method on the aluminum wire was polarized in sulfuric acid aqueous solution (0.05 M) up to potentials exceeding solvent decomposition ones (from –4.0 to 4.0 V). The current density in the potential range did not exceed 0.1 mA/cm2 testifying the appearance of a dielectric film on the substrate.
The capacitance-frequency dispersion of [N-C4H9-isoQn] (MeTCNQ)2 deposited by melting on previously oxidized aluminum is caused by the change of the system conductivity mechanism in comparison with aluminum oxide film [7] (Fig. 4).
_________ *[N-CnH2n + 1-isoQn] denotes N-alkyl-isoquinolinium.
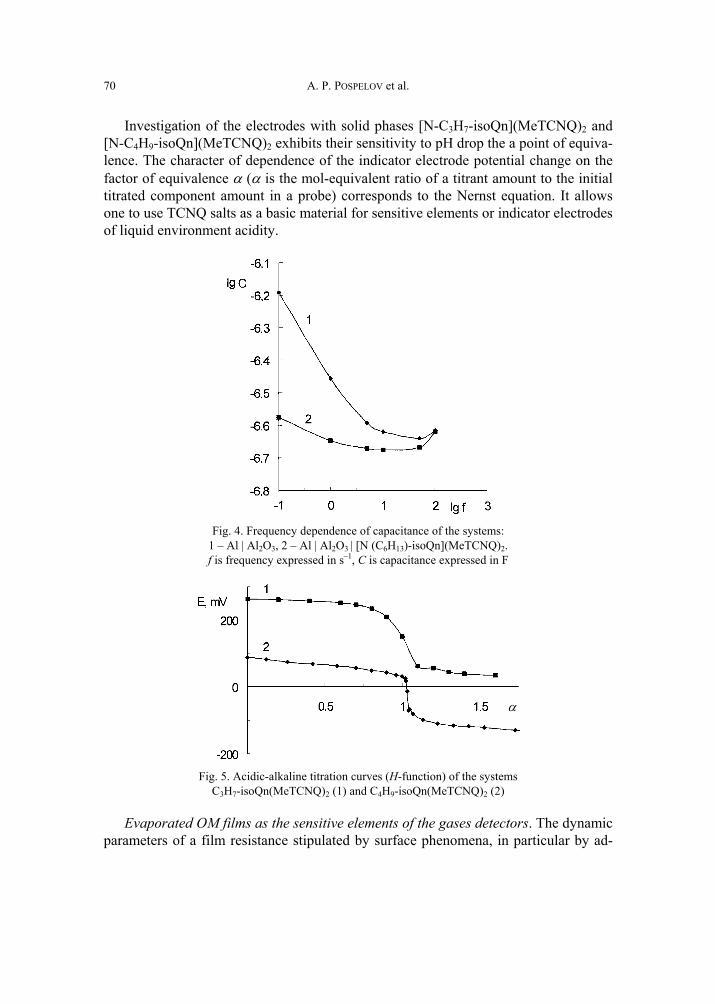
A. P. POSPELOV et al.
70
Investigation of the electrodes with solid phases [N-C3H7-isoQn](MeTCNQ)2 and [N-C4H9-isoQn](MeTCNQ)2 exhibits their sensitivity to pH drop the a point of equiva-lence. The character of dependence of the indicator electrode potential change on the factor of equivalence α (α is the mol-equivalent ratio of a titrant amount to the initial titrated component amount in a probe) corresponds to the Nernst equation. It allows one to use TCNQ salts as a basic material for sensitive elements or indicator electrodes of liquid environment acidity.
Fig. 4. Frequency dependence of capacitance of the systems:
1 – Al | Al2O3, 2 – Al | Al2O3 | [N (C6H13)-isoQn](MeTCNQ)2. f is frequency expressed in s–1, C is capacitance expressed in F
Fig. 5. Acidic-alkaline titration curves (Н-function) of the systems
C3H7-isoQn(MeTCNQ)2 (1) and C4H9-isoQn(MeTCNQ)2 (2)
Evaporated OM films as the sensitive elements of the gases detectors. The dynamic parameters of a film resistance stipulated by surface phenomena, in particular by ad-
α
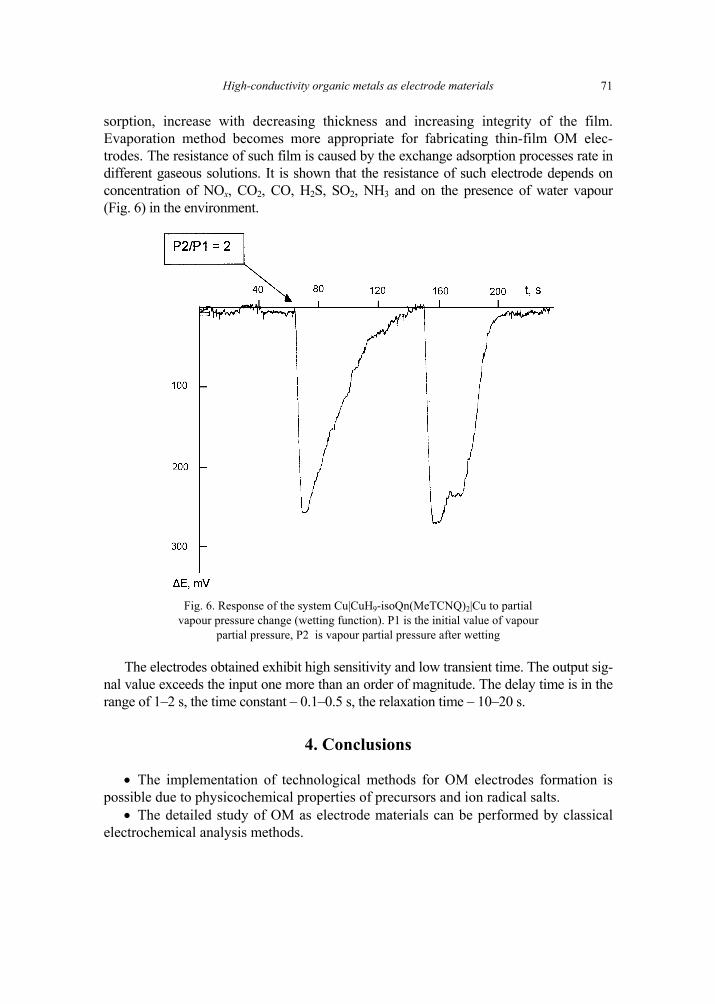
High-conductivity organic metals as electrode materials
71
sorption, increase with decreasing thickness and increasing integrity of the film. Evaporation method becomes more appropriate for fabricating thin-film OM elec-trodes. The resistance of such film is caused by the exchange adsorption processes rate in different gaseous solutions. It is shown that the resistance of such electrode depends on concentration of NOx, CO2, CO, H2S, SO2, NH3 and on the presence of water vapour (Fig. 6) in the environment.
Fig. 6. Response of the system Cu|CuH9-isoQn(MeTCNQ)2|Cu to partial
vapour pressure change (wetting function). P1 is the initial value of vapour partial pressure, P2 is vapour partial pressure after wetting
The electrodes obtained exhibit high sensitivity and low transient time. The output sig-nal value exceeds the input one more than an order of magnitude. The delay time is in the range of 1–2 s, the time constant – 0.1–0.5 s, the relaxation time – 10–20 s.
4. Conclusions
• The implementation of technological methods for OM electrodes formation is possible due to physicochemical properties of precursors and ion radical salts.
• The detailed study of OM as electrode materials can be performed by classical electrochemical analysis methods.
A. P. POSPELOV et al.
72
The usage of the OM-based electrodes, in particular as the electronic engineering elements base and analytical instrument production, is a prospective technical direc-tion. Such approach will allow creating original devices with extended spectrum of working parameters.
References
[1] CASSOUX P., Coord. Chem. Rev., 185–186 (1999), 213. [2] CANADELL E., Coord. Chem. Rev, 185–186 (1999), 629. [3] LAPINSKI A., STARODUB V., GOLUB M., KRAVCHZENKO A., BAUMER V., FAULQUES E., GRAJA A.,
Synthetic Metals (in press). [4] FRUMKIN А.N., Selected works: Electrode processes (in Russian), Nauka, Моscow, 1987. [5] BOCER K., STARODUB V., SWIETLIK R., Adv. Mater. Optics Electr., 8 (1998), 97. [6] DOOLING C.M., RICHARDSON T.H., VALLI L., RELLA R., JIANG J., Colloid Surf. A: Physicochem. Eng.
Aspects, 198–200 (2002), 791. [7] STOYNOV Z.B., GRAFOV B.M., SAVOVA-STOYNOV B.S., ELKIN V.V., Electrochemical Impedance (in
Russian), Nauka, Moscow, 1991.
Received 3 June 2002 Revised 25 July 2002
Materials Science, Vol. 20, No. 3, 2002
Calixarene-based QCM sensors array and its response to volatile organic vapours
V.I. KALCHENKO1, I.A. KOSHETS 2* , E.P. MATSAS2, O.N. KOPYLOV2, A. SOLOVYOV1, Z.I. KAZANTSEVA2, YU. M. SHIRSHOV2
1Institute of Organic Chemistry, NAS of Ukraine, 2, Murmanskaya Str., Kiev, 252167, Ukraine
2Institute of Semiconductor Physics, NAS of Ukraine, 41, Prospekt Nauki, Kiev, 03028, Ukraine
This work reports on the results of investigation of quartz crystal microbalance (QCM) sensors array re-sponse to wide range of volatile organic molecules. Three different gas-supplying systems (regimes) have been involved in our experiments. Shape and magnitude of kinetic sensor response turned out to depend on chosen measuring regime and gas cell size. Several calixarene derivatives of different types were used as sensitive layers. Various techniques of deposition have been studied with the aim to obtain good-quality films.
Key words: QCM sensor; gas sensing system; artificial receptor centres; calixarene
1. Introduction
Nowadays a great attention is paid to creation and development of miniaturized, low-cost, smart chemical sensing systems based on various physical and chemical principles, which provide accurate and reliable real-time control of ambient medium. Among a large amount of aspects regarding this branch of sensor application and technology, we may emphasize such main direction as:
• introducing new types of transducers and developing those existing, • synthesizing new organic materials to be used as artificial receptor centres to in-
crease sensitivity and improve selectivity of sensor and sensor array, • optimizing gas cell parameters and choosing appropriate gas supplying regime
for better functionality of sensing system as a whole, • involving various statistical approaches (PCA, Neural Network, etc.) for pattern
recognition of gas components.
_________ *Corresponding author, e-mail: [email protected].
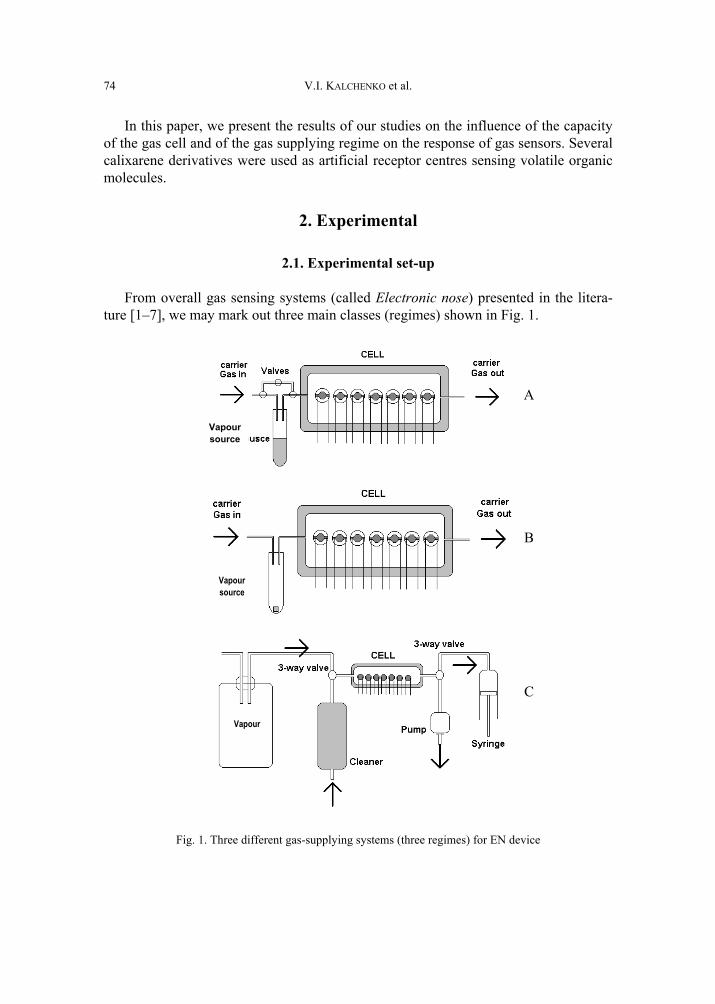
V.I. KALCHENKO et al.
74
In this paper, we present the results of our studies on the influence of the capacity of the gas cell and of the gas supplying regime on the response of gas sensors. Several calixarene derivatives were used as artificial receptor centres sensing volatile organic molecules.
2. Experimental
2.1. Experimental set-up
From overall gas sensing systems (called Electronic nose) presented in the litera-ture [1–7], we may mark out three main classes (regimes) shown in Fig. 1.
Fig. 1. Three different gas-supplying systems (three regimes) for EN device
Vapoursource
Vapour source
Vapour
A
B
C
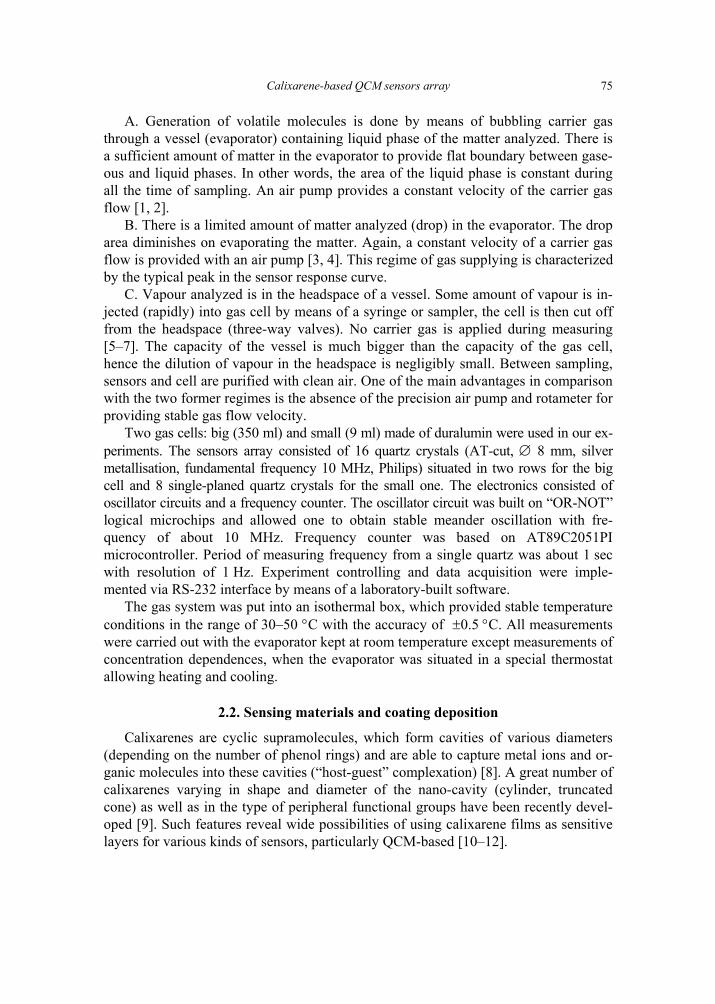
Calixarene-based QCM sensors array
75
A. Generation of volatile molecules is done by means of bubbling carrier gas through a vessel (evaporator) containing liquid phase of the matter analyzed. There is a sufficient amount of matter in the evaporator to provide flat boundary between gase-ous and liquid phases. In other words, the area of the liquid phase is constant during all the time of sampling. An air pump provides a constant velocity of the carrier gas flow [1, 2].
B. There is a limited amount of matter analyzed (drop) in the evaporator. The drop area diminishes on evaporating the matter. Again, a constant velocity of a carrier gas flow is provided with an air pump [3, 4]. This regime of gas supplying is characterized by the typical peak in the sensor response curve.
C. Vapour analyzed is in the headspace of a vessel. Some amount of vapour is in-jected (rapidly) into gas cell by means of a syringe or sampler, the cell is then cut off from the headspace (three-way valves). No carrier gas is applied during measuring [5–7]. The capacity of the vessel is much bigger than the capacity of the gas cell, hence the dilution of vapour in the headspace is negligibly small. Between sampling, sensors and cell are purified with clean air. One of the main advantages in comparison with the two former regimes is the absence of the precision air pump and rotameter for providing stable gas flow velocity.
Two gas cells: big (350 ml) and small (9 ml) made of duralumin were used in our ex-periments. The sensors array consisted of 16 quartz crystals (AT-cut, ∅ 8 mm, silver metallisation, fundamental frequency 10 MHz, Philips) situated in two rows for the big cell and 8 single-planed quartz crystals for the small one. The electronics consisted of oscillator circuits and a frequency counter. The oscillator circuit was built on “OR-NOT” logical microchips and allowed one to obtain stable meander oscillation with fre-quency of about 10 MHz. Frequency counter was based on AT89C2051PI microcontroller. Period of measuring frequency from a single quartz was about 1 sec with resolution of 1 Hz. Experiment controlling and data acquisition were imple-mented via RS-232 interface by means of a laboratory-built software.
The gas system was put into an isothermal box, which provided stable temperature conditions in the range of 30–50 °C with the accuracy of ±0.5 °C. All measurements were carried out with the evaporator kept at room temperature except measurements of concentration dependences, when the evaporator was situated in a special thermostat allowing heating and cooling.
2.2. Sensing materials and coating deposition
Calixarenes are cyclic supramolecules, which form cavities of various diameters (depending on the number of phenol rings) and are able to capture metal ions and or-ganic molecules into these cavities (“host-guest” complexation) [8]. A great number of calixarenes varying in shape and diameter of the nano-cavity (cylinder, truncated cone) as well as in the type of peripheral functional groups have been recently devel-oped [9]. Such features reveal wide possibilities of using calixarene films as sensitive layers for various kinds of sensors, particularly QCM-based [10–12].
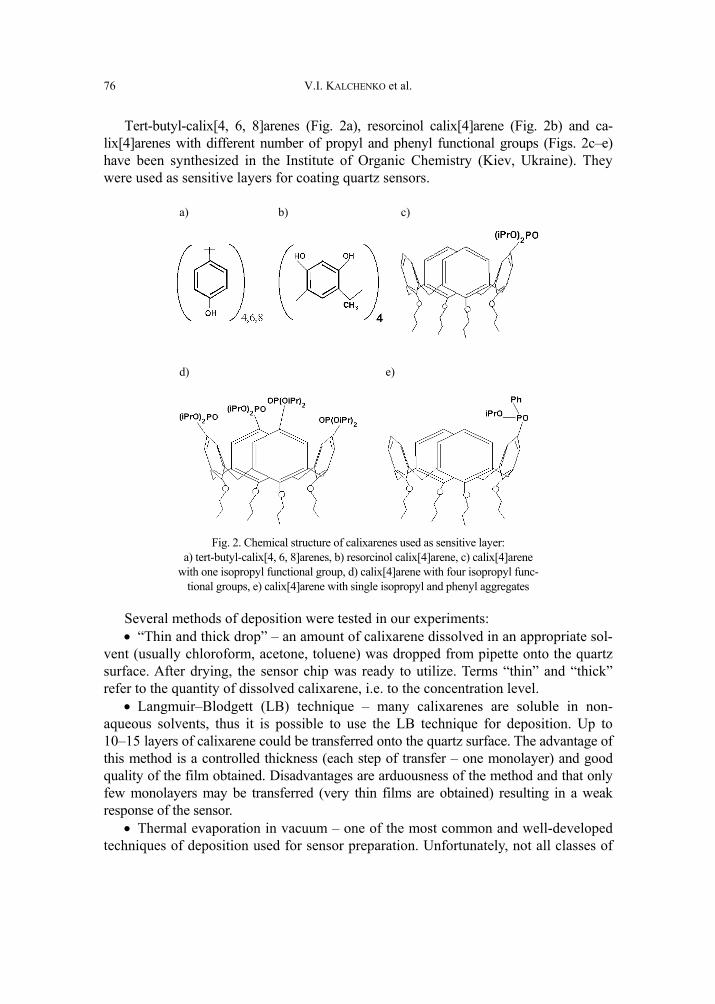
V.I. KALCHENKO et al.
76
Tert-butyl-calix[4, 6, 8]arenes (Fig. 2a), resorcinol calix[4]arene (Fig. 2b) and ca-lix[4]arenes with different number of propyl and phenyl functional groups (Figs. 2c–e) have been synthesized in the Institute of Organic Chemistry (Kiev, Ukraine). They were used as sensitive layers for coating quartz sensors.
a) b) c)
d) e)
Fig. 2. Chemical structure of calixarenes used as sensitive layer:
a) tert-butyl-calix[4, 6, 8]arenes, b) resorcinol calix[4]arene, c) calix[4]arene with one isopropyl functional group, d) calix[4]arene with four isopropyl func-
tional groups, e) calix[4]arene with single isopropyl and phenyl aggregates
Several methods of deposition were tested in our experiments: • “Thin and thick drop” – an amount of calixarene dissolved in an appropriate sol-
vent (usually chloroform, acetone, toluene) was dropped from pipette onto the quartz surface. After drying, the sensor chip was ready to utilize. Terms “thin” and “thick” refer to the quantity of dissolved calixarene, i.e. to the concentration level.
• Langmuir–Blodgett (LB) technique – many calixarenes are soluble in non-aqueous solvents, thus it is possible to use the LB technique for deposition. Up to 10–15 layers of calixarene could be transferred onto the quartz surface. The advantage of this method is a controlled thickness (each step of transfer – one monolayer) and good quality of the film obtained. Disadvantages are arduousness of the method and that only few monolayers may be transferred (very thin films are obtained) resulting in a weak response of the sensor.
• Thermal evaporation in vacuum – one of the most common and well-developed techniques of deposition used for sensor preparation. Unfortunately, not all classes of
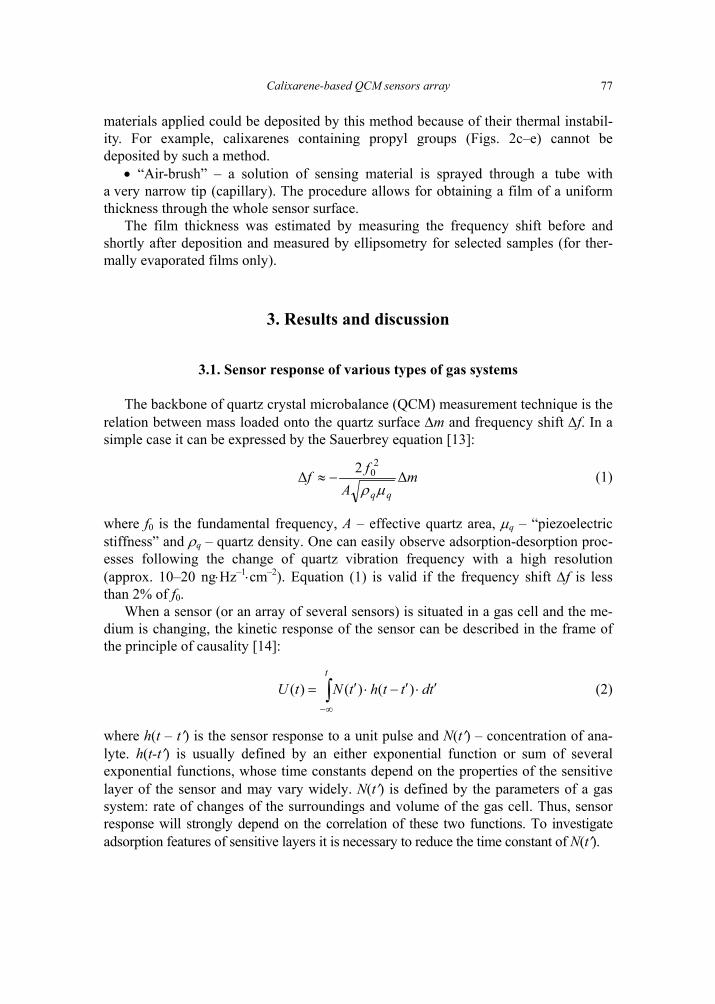
Calixarene-based QCM sensors array
77
materials applied could be deposited by this method because of their thermal instabil-ity. For example, calixarenes containing propyl groups (Figs. 2c–e) cannot be deposited by such a method.
• “Air-brush” – a solution of sensing material is sprayed through a tube with a very narrow tip (capillary). The procedure allows for obtaining a film of a uniform thickness through the whole sensor surface.
The film thickness was estimated by measuring the frequency shift before and shortly after deposition and measured by ellipsometry for selected samples (for ther-mally evaporated films only).
3. Results and discussion
3.1. Sensor response of various types of gas systems
The backbone of quartz crystal microbalance (QCM) measurement technique is the relation between mass loaded onto the quartz surface ∆m and frequency shift ∆f. In a simple case it can be expressed by the Sauerbrey equation [13]:
mA
ffqq∆2∆
20
µρ−≈ (1)
where f0 is the fundamental frequency, A – effective quartz area, µq – “piezoelectric stiffness” and ρq – quartz density. One can easily observe adsorption-desorption proc-esses following the change of quartz vibration frequency with a high resolution (approx. 10–20 ng⋅Hz–1⋅cm–2). Equation (1) is valid if the frequency shift ∆f is less than 2% of f0.
When a sensor (or an array of several sensors) is situated in a gas cell and the me-dium is changing, the kinetic response of the sensor can be described in the frame of the principle of causality [14]:
∫∞−
′⋅′−⋅′=t
tdtthtNtU )()()( (2)
where h(t – t′) is the sensor response to a unit pulse and N(t′) – concentration of ana-lyte. h(t-t′) is usually defined by an either exponential function or sum of several exponential functions, whose time constants depend on the properties of the sensitive layer of the sensor and may vary widely. N(t′) is defined by the parameters of a gas system: rate of changes of the surroundings and volume of the gas cell. Thus, sensor response will strongly depend on the correlation of these two functions. To investigate adsorption features of sensitive layers it is necessary to reduce the time constant of N(t′).
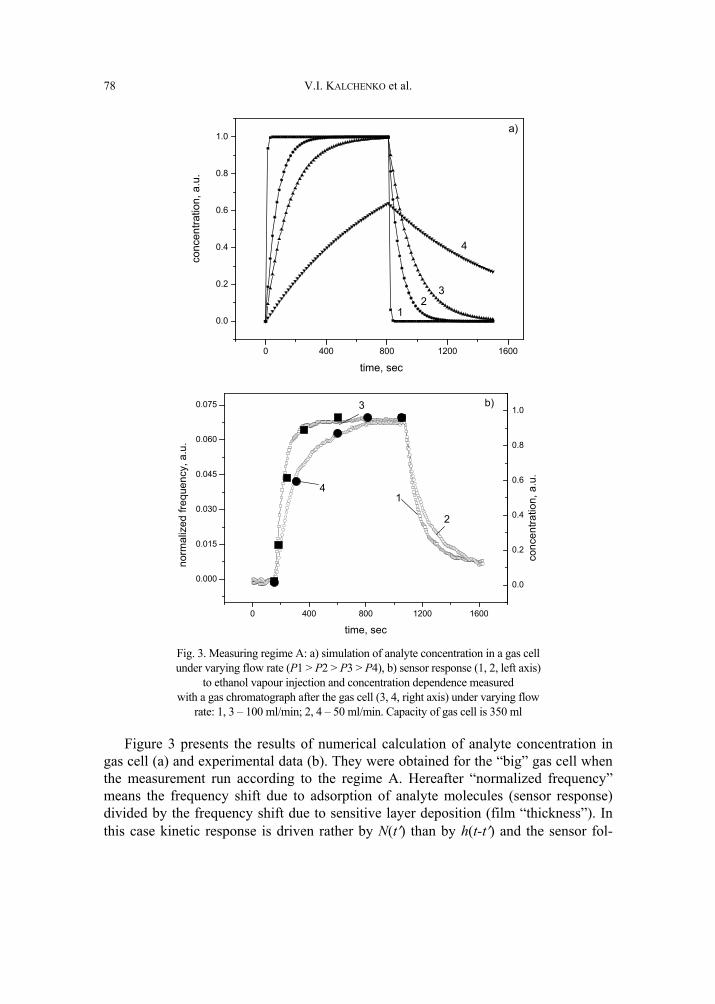
V.I. KALCHENKO et al.
78
0 400 800 1200 1600
0.0
0.2
0.4
0.6
0.8
1.0a)
4
32
1
conc
entra
tion,
a.u
.
time, sec
0 400 800 1200 1600
0.000
0.015
0.030
0.045
0.060
0.075
0.0
0.2
0.4
0.6
0.8
1.0
conc
entra
tion,
a.u
.
4
3
2
1
norm
aliz
ed fr
eque
ncy,
a.u
.
time, sec
b)
Fig. 3. Measuring regime A: a) simulation of analyte concentration in a gas cellunder varying flow rate (P1 > P2 > P3 > P4), b) sensor response (1, 2, left axis)
to ethanol vapour injection and concentration dependence measured with a gas chromatograph after the gas cell (3, 4, right axis) under varying flow
rate: 1, 3 – 100 ml/min; 2, 4 – 50 ml/min. Capacity of gas cell is 350 ml
Figure 3 presents the results of numerical calculation of analyte concentration in gas cell (a) and experimental data (b). They were obtained for the “big” gas cell when the measurement run according to the regime A. Hereafter “normalized frequency” means the frequency shift due to adsorption of analyte molecules (sensor response) divided by the frequency shift due to sensitive layer deposition (film “thickness”). In this case kinetic response is driven rather by N(t′) than by h(t-t′) and the sensor fol-
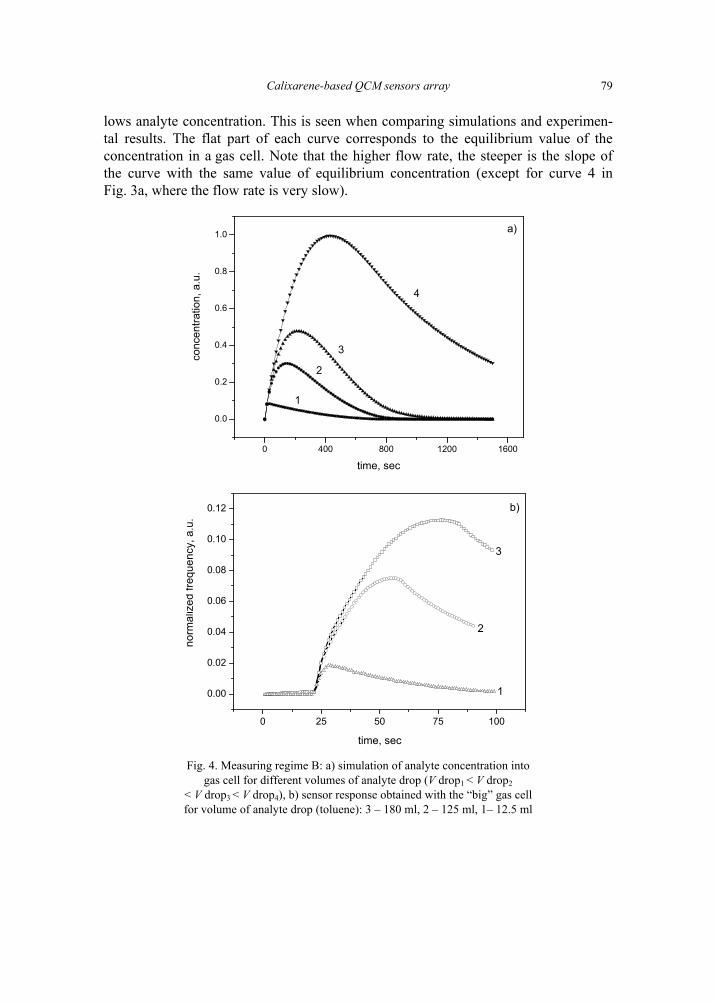
Calixarene-based QCM sensors array
79
lows analyte concentration. This is seen when comparing simulations and experimen-tal results. The flat part of each curve corresponds to the equilibrium value of the concentration in a gas cell. Note that the higher flow rate, the steeper is the slope of the curve with the same value of equilibrium concentration (except for curve 4 in Fig. 3a, where the flow rate is very slow).
0 400 800 1200 1600
0.0
0.2
0.4
0.6
0.8
1.0 a)
4
3
2
1
conc
entra
tion,
a.u
.
time, sec
0 25 50 75 100
0.00
0.02
0.04
0.06
0.08
0.10
0.12 b)
3
2
1
norm
aliz
ed fr
eque
ncy,
a.u
.
time, sec
Fig. 4. Measuring regime B: a) simulation of analyte concentration into gas cell for different volumes of analyte drop (V drop1 < V drop2
< V drop3 < V drop4), b) sensor response obtained with the “big” gas cell for volume of analyte drop (toluene): 3 – 180 ml, 2 – 125 ml, 1– 12.5 ml
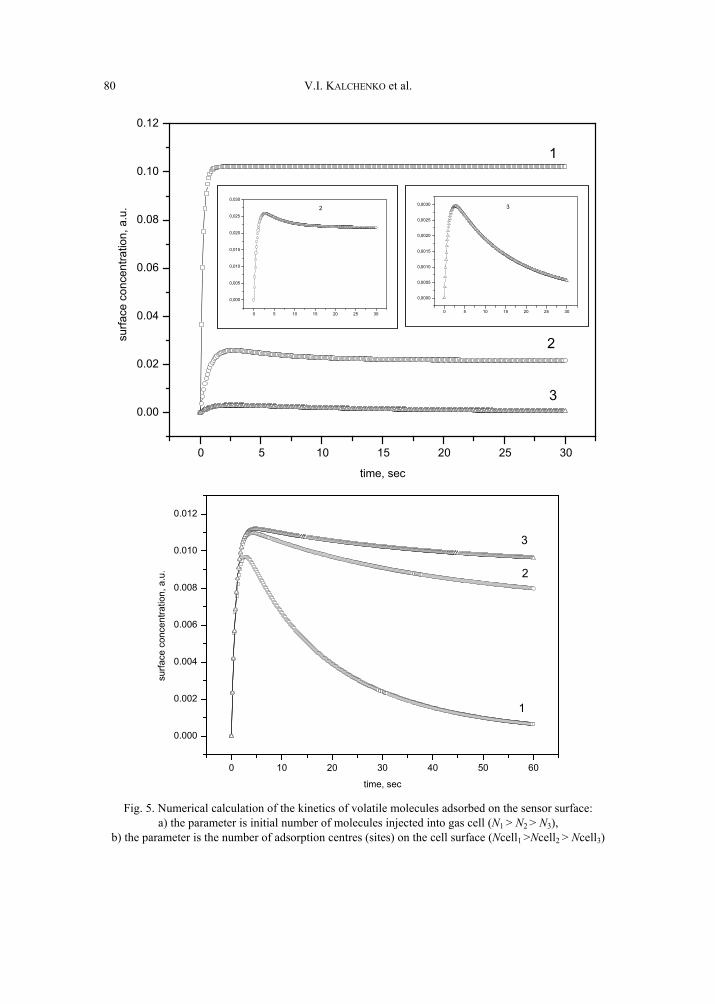
V.I. KALCHENKO et al.
80
0 5 10 15 20 25 30
0.00
0.02
0.04
0.06
0.08
0.10
0.12
0 5 10 15 20 25 30
0,0000
0,0005
0,0010
0,0015
0,0020
0,0025
0,0030 3
0 5 10 15 20 25 30
0,000
0,005
0,010
0,015
0,020
0,025
0,030
2
3
2
1
surfa
ce c
once
ntra
tion,
a.u
.
time, sec
0 10 20 30 40 50 60
0.000
0.002
0.004
0.006
0.008
0.010
0.012
3
2
1
surfa
ce c
once
ntra
tion,
a.u
.
time, sec Fig. 5. Numerical calculation of the kinetics of volatile molecules adsorbed on the sensor surface:
a) the parameter is initial number of molecules injected into gas cell (N1 > N2 > N3), b) the parameter is the number of adsorption centres (sites) on the cell surface (Ncell1 >Ncell2 > Ncell3)
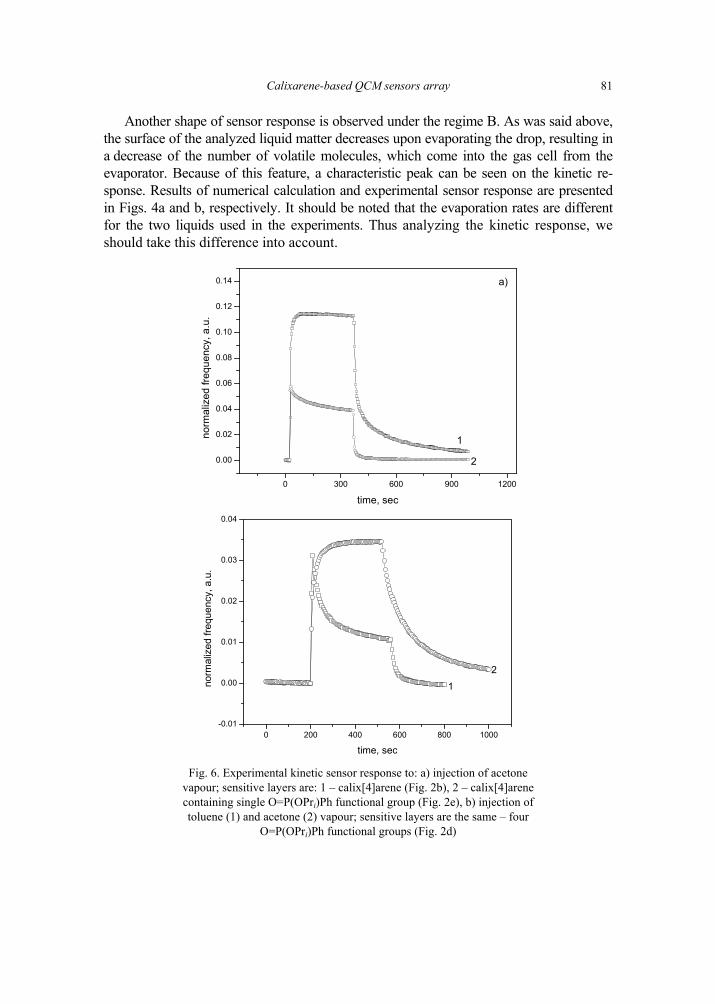
Calixarene-based QCM sensors array
81
Another shape of sensor response is observed under the regime B. As was said above, the surface of the analyzed liquid matter decreases upon evaporating the drop, resulting in a decrease of the number of volatile molecules, which come into the gas cell from the evaporator. Because of this feature, a characteristic peak can be seen on the kinetic re-sponse. Results of numerical calculation and experimental sensor response are presented in Figs. 4a and b, respectively. It should be noted that the evaporation rates are different for the two liquids used in the experiments. Thus analyzing the kinetic response, we should take this difference into account.
0 300 600 900 1200
0.00
0.02
0.04
0.06
0.08
0.10
0.12
0.14 a)
2
1norm
aliz
ed fr
eque
ncy,
a.u
.
time, sec
0 200 400 600 800 1000-0.01
0.00
0.01
0.02
0.03
0.04
21no
rmal
ized
freq
uenc
y, a
.u.
time, sec Fig. 6. Experimental kinetic sensor response to: a) injection of acetone
vapour; sensitive layers are: 1 – calix[4]arene (Fig. 2b), 2 – calix[4]arene containing single O=P(OPri)Ph functional group (Fig. 2e), b) injection of toluene (1) and acetone (2) vapour; sensitive layers are the same – four
O=P(OPri)Ph functional groups (Fig. 2d)
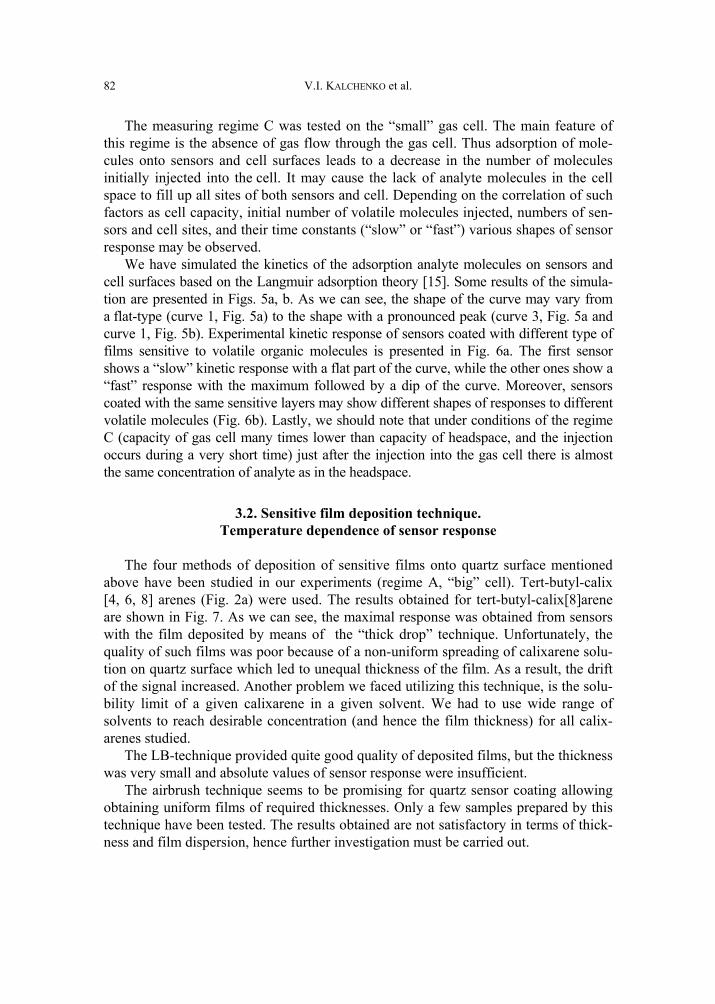
V.I. KALCHENKO et al.
82
The measuring regime C was tested on the “small” gas cell. The main feature of this regime is the absence of gas flow through the gas cell. Thus adsorption of mole-cules onto sensors and cell surfaces leads to a decrease in the number of molecules initially injected into the cell. It may cause the lack of analyte molecules in the cell space to fill up all sites of both sensors and cell. Depending on the correlation of such factors as cell capacity, initial number of volatile molecules injected, numbers of sen-sors and cell sites, and their time constants (“slow” or “fast”) various shapes of sensor response may be observed.
We have simulated the kinetics of the adsorption analyte molecules on sensors and cell surfaces based on the Langmuir adsorption theory [15]. Some results of the simula-tion are presented in Figs. 5a, b. As we can see, the shape of the curve may vary from a flat-type (curve 1, Fig. 5a) to the shape with a pronounced peak (curve 3, Fig. 5a and curve 1, Fig. 5b). Experimental kinetic response of sensors coated with different type of films sensitive to volatile organic molecules is presented in Fig. 6a. The first sensor shows a “slow” kinetic response with a flat part of the curve, while the other ones show a “fast” response with the maximum followed by a dip of the curve. Moreover, sensors coated with the same sensitive layers may show different shapes of responses to different volatile molecules (Fig. 6b). Lastly, we should note that under conditions of the regime C (capacity of gas cell many times lower than capacity of headspace, and the injection occurs during a very short time) just after the injection into the gas cell there is almost the same concentration of analyte as in the headspace.
3.2. Sensitive film deposition technique. Temperature dependence of sensor response
The four methods of deposition of sensitive films onto quartz surface mentioned above have been studied in our experiments (regime A, “big” cell). Tert-butyl-calix [4, 6, 8] arenes (Fig. 2a) were used. The results obtained for tert-butyl-calix[8]arene are shown in Fig. 7. As we can see, the maximal response was obtained from sensors with the film deposited by means of the “thick drop” technique. Unfortunately, the quality of such films was poor because of a non-uniform spreading of calixarene solu-tion on quartz surface which led to unequal thickness of the film. As a result, the drift of the signal increased. Another problem we faced utilizing this technique, is the solu-bility limit of a given calixarene in a given solvent. We had to use wide range of solvents to reach desirable concentration (and hence the film thickness) for all calix-arenes studied.
The LB-technique provided quite good quality of deposited films, but the thickness was very small and absolute values of sensor response were insufficient.
The airbrush technique seems to be promising for quartz sensor coating allowing obtaining uniform films of required thicknesses. Only a few samples prepared by this technique have been tested. The results obtained are not satisfactory in terms of thick-ness and film dispersion, hence further investigation must be carried out.
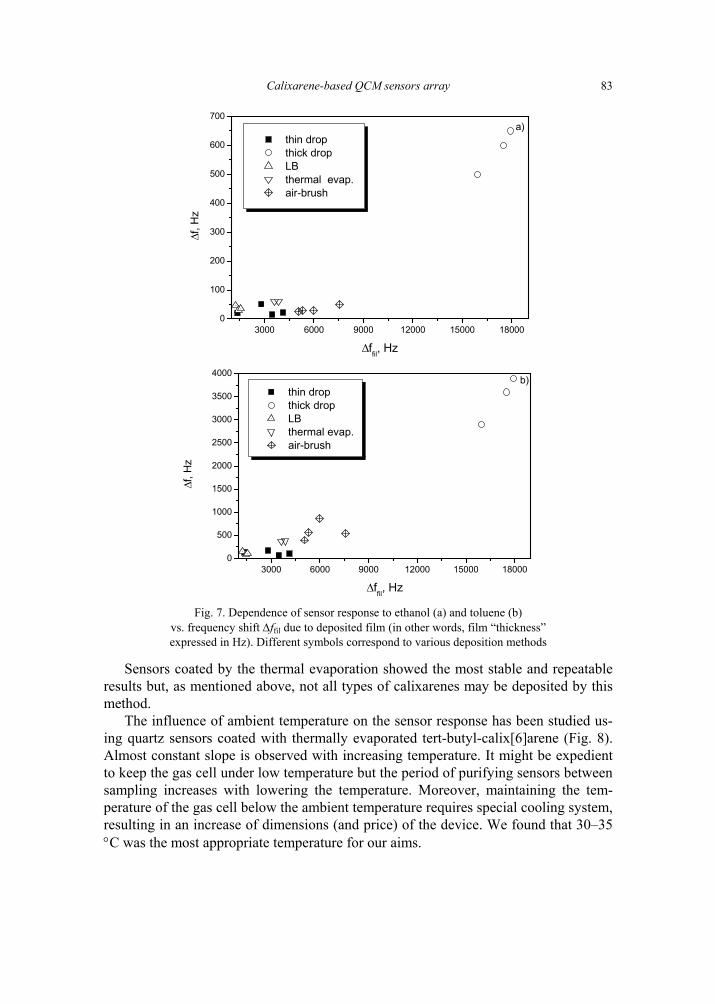
Calixarene-based QCM sensors array
83
3000 6000 9000 12000 15000 180000
100
200
300
400
500
600
700a)
thin drop thick drop LB thermal evap. air-brush
∆f, H
z
∆ffil, Hz
3000 6000 9000 12000 15000 180000
500
1000
1500
2000
2500
3000
3500
4000b)
thin drop thick drop LB thermal evap. air-brush
∆f, H
z
∆ffil, Hz Fig. 7. Dependence of sensor response to ethanol (a) and toluene (b)
vs. frequency shift ∆ffil due to deposited film (in other words, film “thickness” expressed in Hz). Different symbols correspond to various deposition methods
Sensors coated by the thermal evaporation showed the most stable and repeatable results but, as mentioned above, not all types of calixarenes may be deposited by this method.
The influence of ambient temperature on the sensor response has been studied us-ing quartz sensors coated with thermally evaporated tert-butyl-calix[6]arene (Fig. 8). Almost constant slope is observed with increasing temperature. It might be expedient to keep the gas cell under low temperature but the period of purifying sensors between sampling increases with lowering the temperature. Moreover, maintaining the tem-perature of the gas cell below the ambient temperature requires special cooling system, resulting in an increase of dimensions (and price) of the device. We found that 30–35 °C was the most appropriate temperature for our aims.
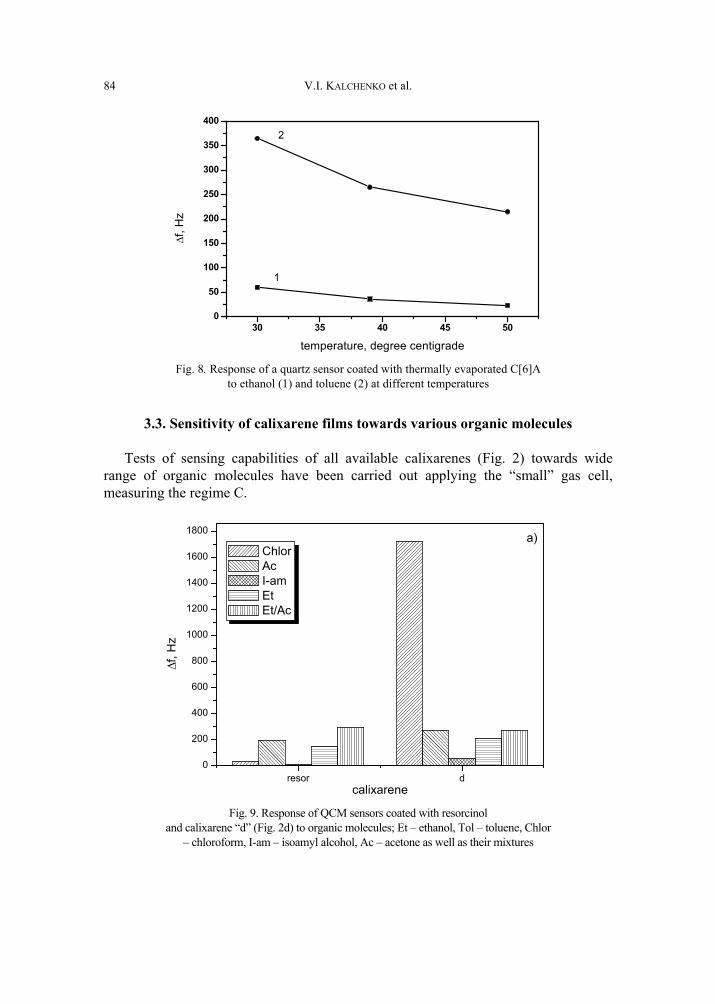
V.I. KALCHENKO et al.
84
30 35 40 45 500
50
100
150
200
250
300
350
4002
1
∆f, H
z
temperature, degree centigrade
Fig. 8. Response of a quartz sensor coated with thermally evaporated C[6]Ato ethanol (1) and toluene (2) at different temperatures
3.3. Sensitivity of calixarene films towards various organic molecules
Tests of sensing capabilities of all available calixarenes (Fig. 2) towards wide range of organic molecules have been carried out applying the “small” gas cell, measuring the regime C.
resor d0
200
400
600
800
1000
1200
1400
1600
1800 a)
∆f, H
z
calixarene
Chlor Ac I-am Et Et/Ac
Fig. 9. Response of QCM sensors coated with resorcinol and calixarene “d” (Fig. 2d) to organic molecules; Et – ethanol, Tol – toluene, Chlor
– chloroform, I-am – isoamyl alcohol, Ac – acetone as well as their mixtures
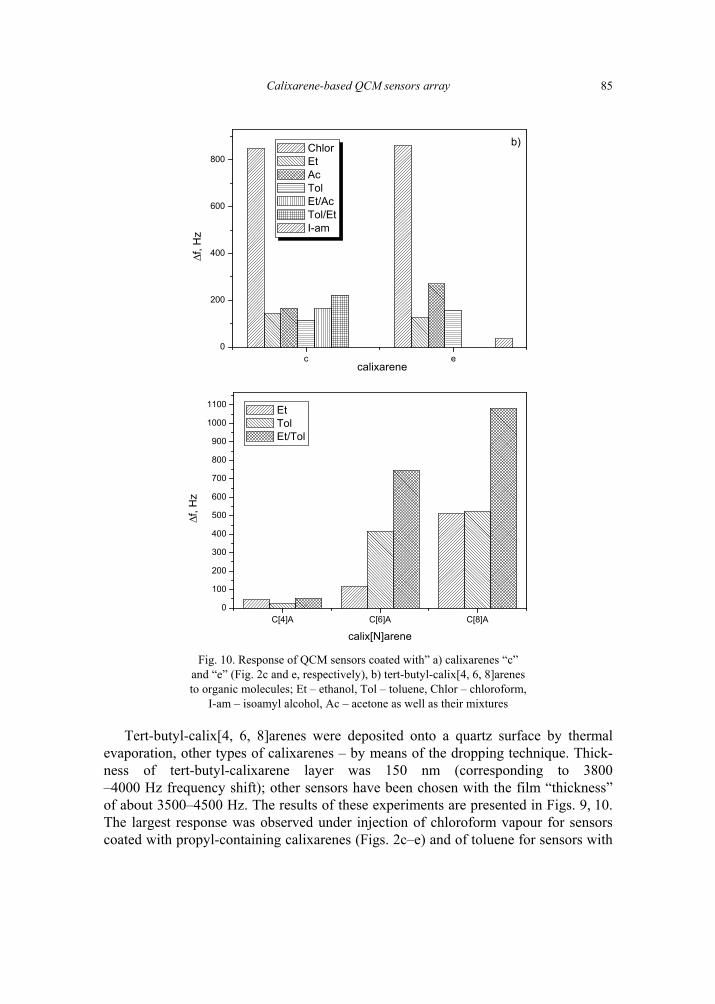
Calixarene-based QCM sensors array
85
c e0
200
400
600
800
b)
∆f, H
z
calixarene
Chlor Et Ac Tol Et/Ac Tol/Et I-am
C[4]A C[6]A C[8]A0
100
200
300
400
500
600
700
800
900
1000
1100
∆f, H
z
calix[N]arene
Et Tol Et/Tol
Fig. 10. Response of QCM sensors coated with” a) calixarenes “c”
and “e” (Fig. 2c and e, respectively), b) tert-butyl-calix[4, 6, 8]arenes to organic molecules; Et – ethanol, Tol – toluene, Chlor – chloroform,
I-am – isoamyl alcohol, Ac – acetone as well as their mixtures
Tert-butyl-calix[4, 6, 8]arenes were deposited onto a quartz surface by thermal evaporation, other types of calixarenes – by means of the dropping technique. Thick-ness of tert-butyl-calixarene layer was 150 nm (corresponding to 3800 –4000 Hz frequency shift); other sensors have been chosen with the film “thickness” of about 3500–4500 Hz. The results of these experiments are presented in Figs. 9, 10. The largest response was observed under injection of chloroform vapour for sensors coated with propyl-containing calixarenes (Figs. 2c–e) and of toluene for sensors with
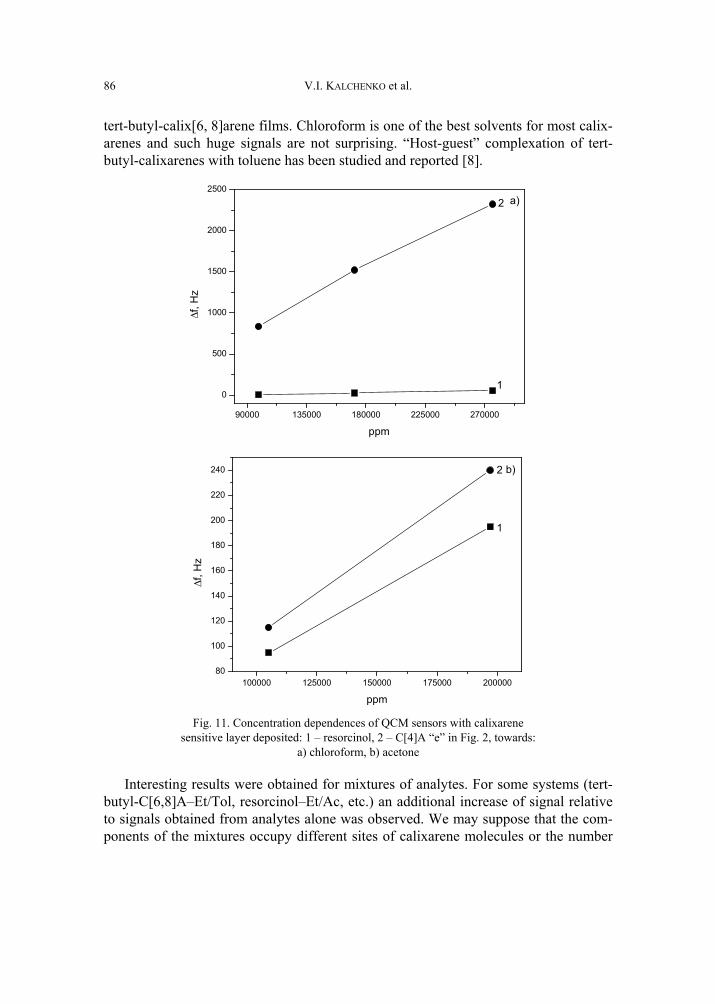
V.I. KALCHENKO et al.
86
tert-butyl-calix[6, 8]arene films. Chloroform is one of the best solvents for most calix-arenes and such huge signals are not surprising. “Host-guest” complexation of tert-butyl-calixarenes with toluene has been studied and reported [8].
90000 135000 180000 225000 270000
0
500
1000
1500
2000
2500a)2
1
∆f, H
z
ppm
100000 125000 150000 175000 20000080
100
120
140
160
180
200
220
240 b)2
1
∆f, H
z
ppm Fig. 11. Concentration dependences of QCM sensors with calixarene
sensitive layer deposited: 1 – resorcinol, 2 – C[4]A “e” in Fig. 2, towards: a) chloroform, b) acetone
Interesting results were obtained for mixtures of analytes. For some systems (tert-butyl-C[6,8]A–Et/Tol, resorcinol–Et/Ac, etc.) an additional increase of signal relative to signals obtained from analytes alone was observed. We may suppose that the com-ponents of the mixtures occupy different sites of calixarene molecules or the number
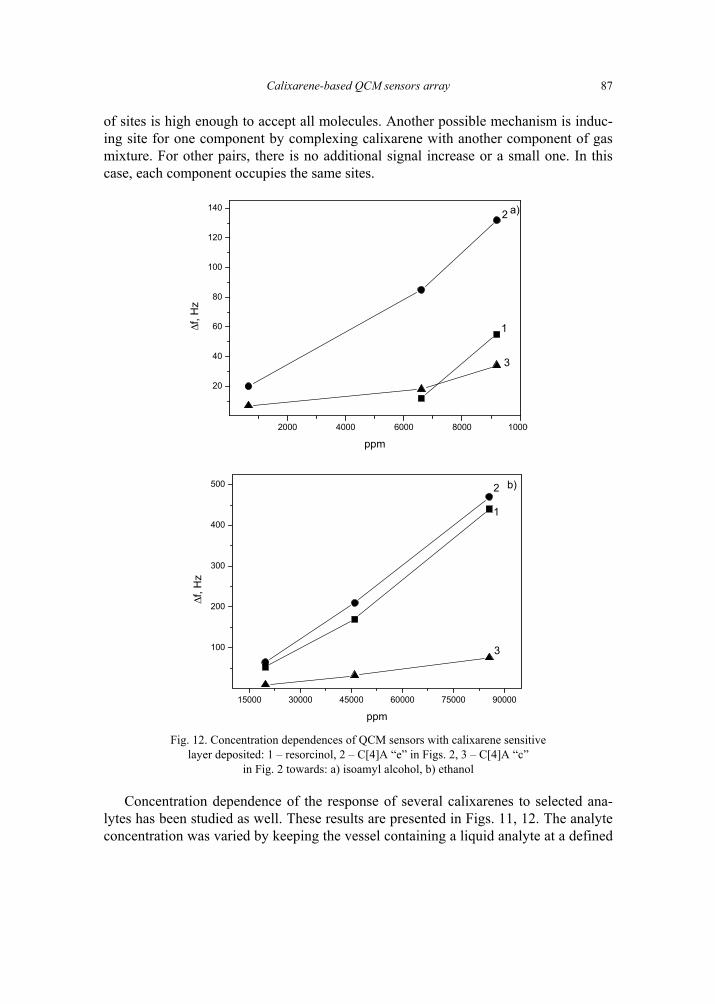
Calixarene-based QCM sensors array
87
of sites is high enough to accept all molecules. Another possible mechanism is induc-ing site for one component by complexing calixarene with another component of gas mixture. For other pairs, there is no additional signal increase or a small one. In this case, each component occupies the same sites.
2000 4000 6000 8000 10000
20
40
60
80
100
120
140 a)
3
2
1∆f, H
z
ppm
15000 30000 45000 60000 75000 90000
100
200
300
400
500 b)
3
2
1
∆f, H
z
ppm Fig. 12. Concentration dependences of QCM sensors with calixarene sensitive
layer deposited: 1 – resorcinol, 2 – C[4]A “e” in Figs. 2, 3 – C[4]A “c” in Fig. 2 towards: a) isoamyl alcohol, b) ethanol
Concentration dependence of the response of several calixarenes to selected ana-lytes has been studied as well. These results are presented in Figs. 11, 12. The analyte concentration was varied by keeping the vessel containing a liquid analyte at a defined
V.I. KALCHENKO et al.
88
temperature in the thermostat. As saturated vapour pressure depends on temperature, we were able to obtain required concentration by setting a preselected temperature. Unfortunately, the thermostat did not allow to attain the temperature below 0 °C, therefore concentration level was very high (especially for chloroform and acetone). Nevertheless, the relations obtained may be useful for creation of vapour pressure transducers towards different organic molecules.
4. Conclusion
QCM-based sensors and sensor arrays are promising devices for the detection of organic volatile molecules in ambient air. Use of different types of calixarenes as sen-sitive layers reveals wide possibilities in control of sensitivity and selectivity of sensors. Treating of data obtained from sensors with special statistical methods (Neu-ral Network, PCA, etc.) gives reliable and quick recognition of volatile organic molecule.
References [1] DICKERT F. L., BRUCKDORFER TH., FEIGL H., HAUNSCHILD A., KUSCHOW V., OBERMEIER E., BULST W.-
E., KNAUER U., MEGES G., Sensors and Actuators, В13–14 (1993), 297. [2] MATZ G., HUNTE T., DOHREN S., JENSEN A., WALTE A., MUNCHMEYER W., Proc. ISOEN 99, Tubin-
gen, Germany, 1999, p. 49. [3] QUETTERIE L., CHANIE E., DUTHEIL O., TZE TZUNG TAN, BAZZO S., Proc. ISOEN 99, Tubingen,
Germany, 1999, p. 53. [4] LUISIER J.-L., BENE A., PICHLER P., VILLETTAZ J.C., Proc. ISOEN 99, Tubingen, Germany,
1999, p. 80. [5] MIELLE P., MARQUIS F., Sensors and Actuators, B58 (1999), 526. [6] HATFIELD J. V., NEAVES P., HICKS P. J., PERSAUD K., TRAVERS P., Sensors and Actuators, В18–19
(1994), 221. [7] NANTO H., DOUGUCHI Y., YOKOI K., MUKAI T., FUJIOKA J., OGAWA T., KUSANO E., KINBARA A.,
Proc. ISOEN 99, Tubingen, Germany, 1999, p. 45. [8] GUTSCHE C.D., Calixarene, The Royal Society of Chemistry, 1989, p. 172. [9] Macrocycle Synthesis. A practical Approach, D. Parker (Ed.), Oxford University Press, 1996, p. 378.
[10] DICKERT F.L., BAUMLER U.P.A., STATOPULOS H., Anal. Chem., 69 (1997), 1000. [11] ROSLER S., LUCKLUM R., BORNGRABER R., HARTMANN J., HAUPTMANN P., Sensors and Actuators,
В48 (1998), 415. [12] ISMAIL G.M., MARSHALL R.H.J., BYFIELD M.P., Proc. Eurosensors XIII, Hague, Netherland, 1999, p. 807. [13] EICHELBAUM F., BORNGRABER R., SCHRODER J., LUCKLUM R., HAUPTMANN P., Rev. Sci. Instr., 70,
May 1999. [14] MADELUNG E., Die Matematischen Hilfsmittel des Physikers, Springer-Verlag, Berlin, 1957, p. 496. [15] CZARNIECKI J., JARONIEC M., Surface Sci. Reports, 3 (1983), 301.
Received 3 June 2002 Revised 2 September 2002