materials flows through industry (mfi) tool – amo … review... · materials flows through...
TRANSCRIPT
Materials Flows through Industry (MFI) Tool –
AMO Analysis Review
Margaret Mann, Alberta Carpenter, Joshua Martens, David Benson
This presentation does not contain any proprietary, confidential, or otherwise restricted information.
NREL is a national laboratory of the U.S. Department of Energy, Office of Energy Efficiency and Renewable Energy, operated by the Alliance for Sustainable Energy, LLC.

Outline
• Overview
• Description
• Methodology
• Tool structure and functionality
• Example
2

Overview
• Industry represents a diverse range of process technologies that use energy to take raw materials through a sequence of transformations to finished products.
• Analytically tracking the lifecycle energy impacts of current and proposed changes to the materials that flow through industry will provide a significantly more complete understanding of the energy impacts of different technologies of interest to DOE.
Critical Materials Direct Thermal Energy Conversion Sustainable Manufacturing /
Materials, Devices and Systems Flow of Materials through Industry
Wide Bandgap Semiconductors for Combined Heat and Power Power Electronics
Systems
Materials for Harsh Waste Heat Recovery Service Conditions
Systems
Advanced Materials Advanced Sensors, Controls, Manufacturing Platforms and Modeling for
Manufacturing Additive Manufacturing
Process Heating Composite
Process Intensification Materials
Roll-to-Roll Processing
3

Description
The Materials Flows through Industry (MFI) tool is a scenario tool for the evaluation of the energy use, greenhouse gas emissions, fuel costs, and macro-economic impacts of the industrial production of commodity materials
• Embodied energy and GHGs of 500 commodity products and > 1100 processes, from mine-to-product
• Process efficiency impacts within and throughout the manufacturing and chemical industry
• Impacts of novel materials (e.g., carbon fiber, biomaterials, advanced alloys) as replacements for existing manufacturing and use
• Multiple process and manufacturing pathways for industrial materials • Cost contribution of energy use along the supply chain • Alternative energy sources and multiple grid scenarios
4

Description: Questions to answer o What materials and energy are required in the life cycle to make
commodities of interest in the industrial sector?
o What are the bulk materials that use the most energy per ton of material?
o What are the bulk materials that use the most energy per year (taking into account volume of production)?
o How do process efficiency improvements reduce energy use per material?
o What are the NET energy and GHG savings per unit of material substituted?
o Also can
o What is the effect of different electricity grid mixes?
o What is the effect of different process fuel mixes?
o Of the various ways to make a material, which are the most energy efficient?
o What are the effects of market changes in demand?
5
6
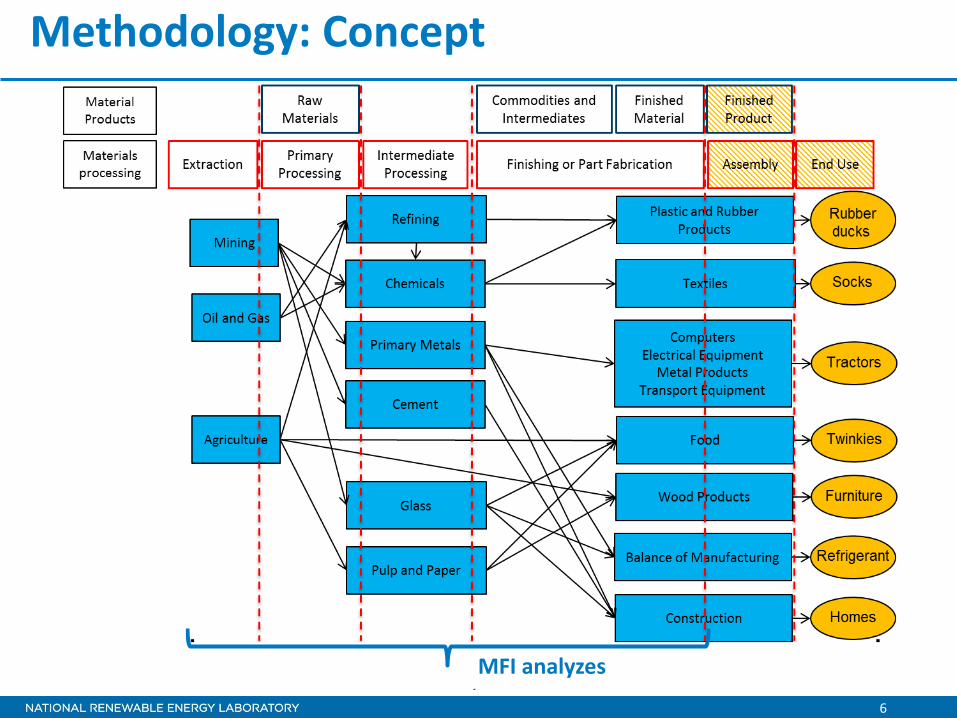
Methodology: Concept
MFI analyzes

Methodology: Multiple Pathways
LO N
J
D
G
A
H
M
K
B C
I
F
Co-product
Desired Material
The tool allows the user to evaluate multiple pathways up the supply chain to produce products and includes co-products. M. Mann, NREL
7

8
Methodology: approach • Product by material matrix (Xpm) is created based on inputs of process weightings (wip), sector
efficiency potential (jn) implementation and grid selection 𝑦𝑛• =𝑋𝑝𝑚 𝑖=1 𝑤𝑖𝑝𝑐𝑖𝑝𝑚𝑗𝑛
o X = full matrix of all products (p) and materials (m)
o p = products and m = the total number of unique products and materials
o Xpm = matrix element for the mth material input for the manufacture of the pth product
o the mth material input for the pth product by way of the ith process pathway cipm =
o the ith process pathway weighting for manufacturing the pth product wip =
o yn = the number of process pathways for manufacturing the pth product
o jn = the percent implementation of the SEP for the pth product sector.
• The grid selection is done by process weighting the electricity product.
• Defaults for the grid is the national grid and for products are either market based or equally distributed amongst all available processes.
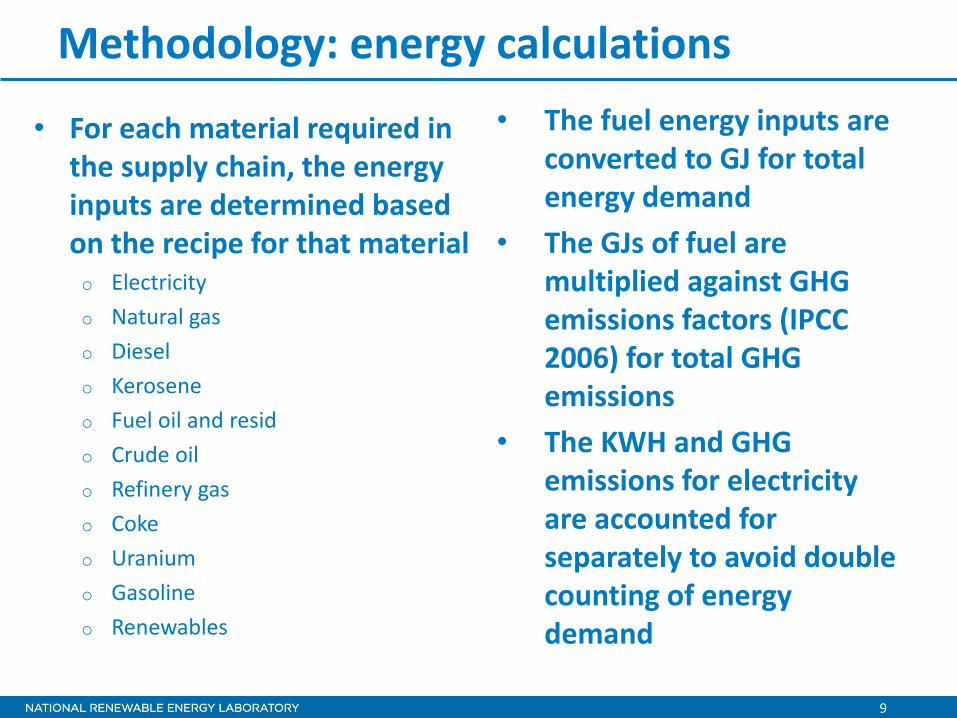
Methodology: energy calculations
• For each material required in the supply chain, the energy inputs are determined based on the recipe for that material o Electricity
o Natural gas
o Diesel
o Kerosene
o Fuel oil and resid
o Crude oil
o Refinery gas
o Coke
o Uranium
o Gasoline
o Renewables
• The fuel energy inputs are converted to GJ for total energy demand
• The GJs of fuel are multiplied against GHG emissions factors (IPCC 2006) for total GHG emissions
• The KWH and GHG emissions for electricity are accounted for separately to avoid double counting of energy demand
9

Excel Tool Structure and Functionality
• User Inputs
o Product selection and quantity
o Process selection and allocation
o Sector efficiency potential implementation
o Grid selection
• Results
o Electricity, mass, total energy, and carbon dioxide
o Fuel use in manufacturing and transportation
10
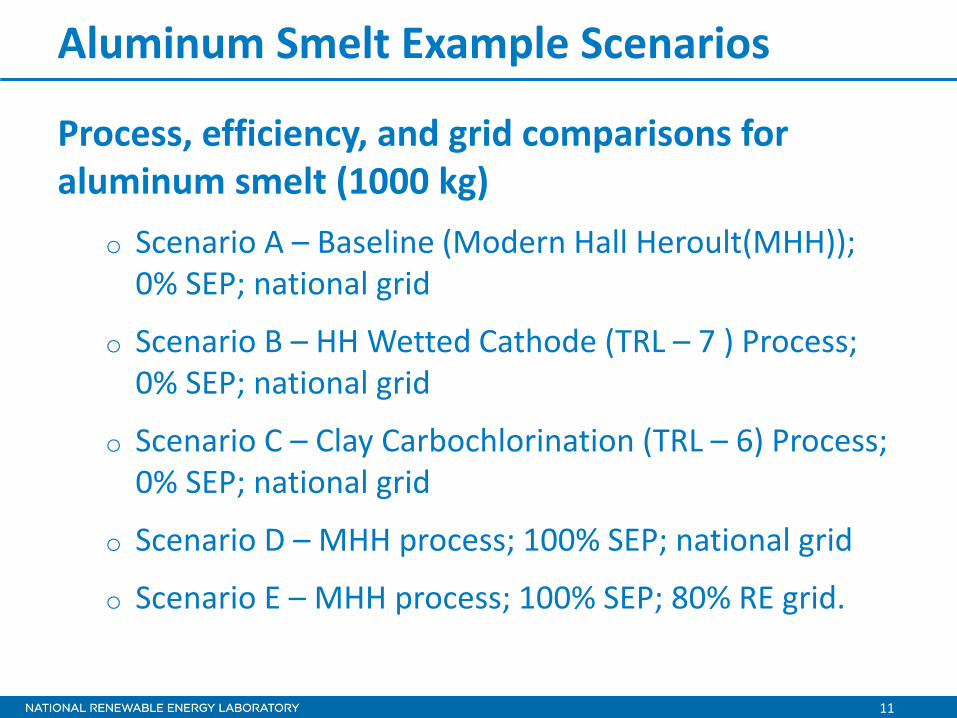
Aluminum Smelt Example Scenarios
Process, efficiency, and grid comparisons for aluminum smelt (1000 kg)
o Scenario A – Baseline (Modern Hall Heroult(MHH)); 0% SEP; national grid
o Scenario B – HH Wetted Cathode (TRL – 7 ) Process; 0% SEP; national grid
o Scenario C – Clay Carbochlorination (TRL – 6) Process; 0% SEP; national grid
o Scenario D – MHH process; 100% SEP; national grid
o Scenario E – MHH process; 100% SEP; 80% RE grid.
11
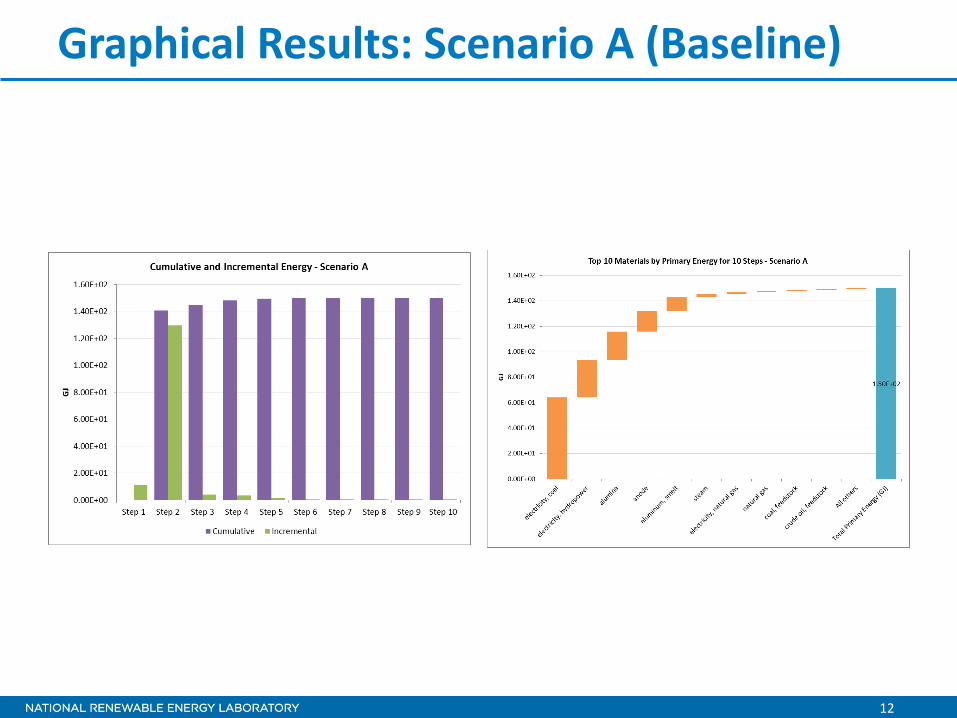
Graphical Results: Scenario A (Baseline)
12
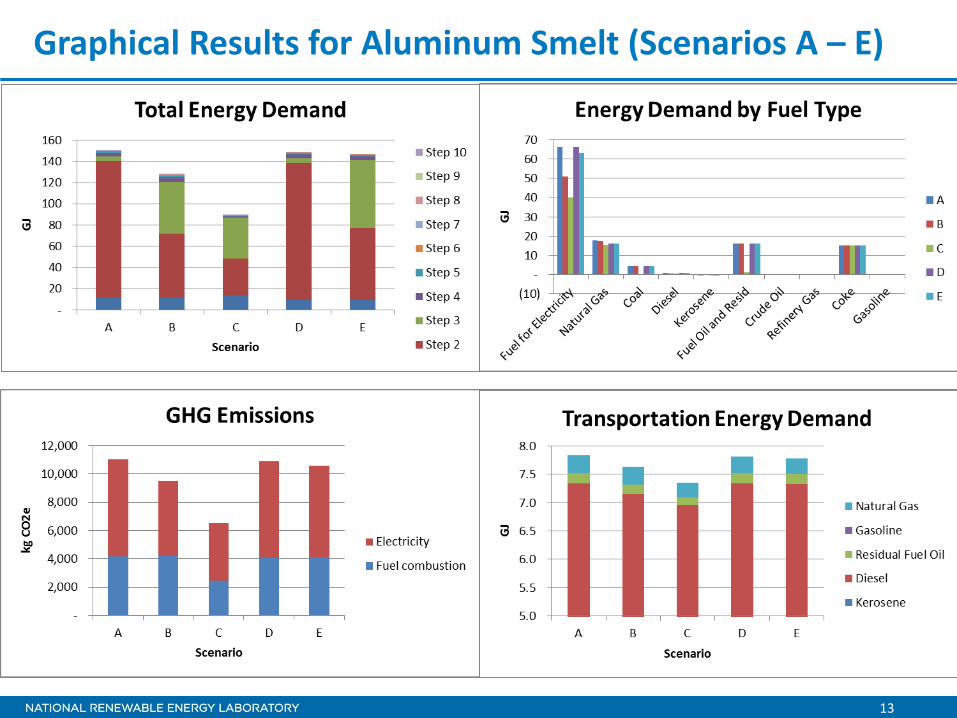
Graphical Results for Aluminum Smelt (Scenarios A – E)
13

Limitations
• Currently only addresses energy and energy related carbon impacts
• Currently only evaluates through the commodity product. Use phase is covered under LIGHTEnUP
• Data availability and uncertainty
14
Next Steps
• Peer review comments have been received and are being processed.
• Evaluation of data gaps
• Primarily the next steps will be focused on meeting goals and objectives for the Department of Energy Advanced Manufacturing Office
• Applying competitiveness metrics
15
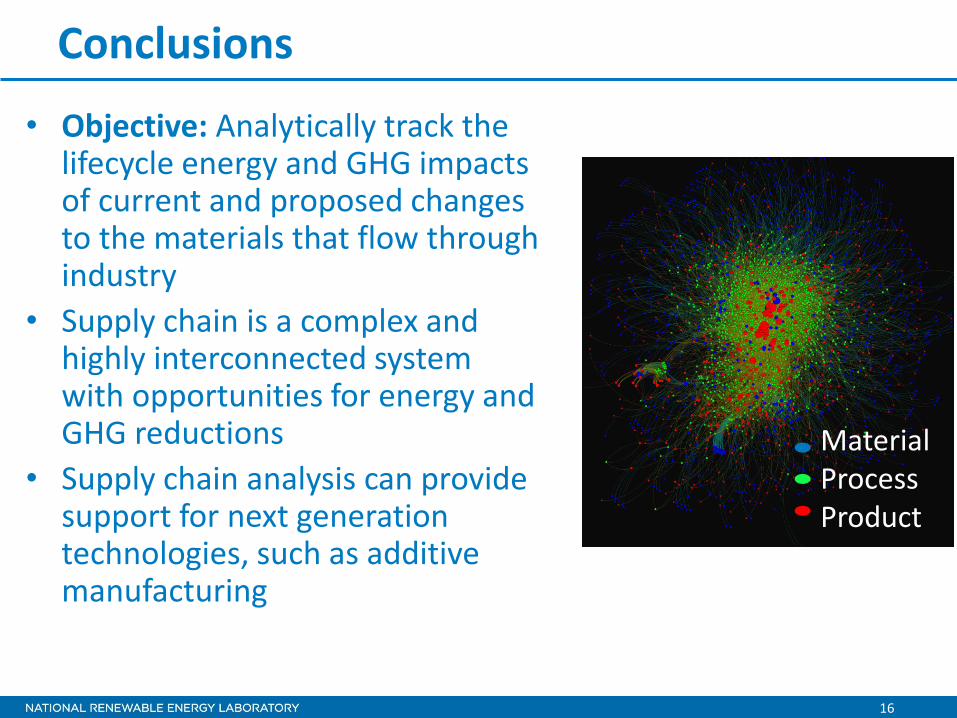
Conclusions
• Objective: Analytically track the lifecycle energy and GHG impacts of current and proposed changes to the materials that flow through industry
• Supply chain is a complex and highly interconnected system with opportunities for energy and GHG reductions
• Supply chain analysis can provide support for next generation technologies, such as additive manufacturing
Material Process Product
16


Market analysis of SEP implementation
Relative Total energy demand from SEP optimized supply chain 118.6%
120.0%
% r
ela
tive
to
bas
elin
e
100.0%
80.0%
60.0%
40.0%
20.0%
0.0%
100.0%
92.5%
80.9%
100.0%
75.0%
100.0% 98.8%
96.2% 100.0%
93.9% 86.9%
100.0% 106.1%
92.4%
100.0% 95.4%
90.3%
100.0% 94.9%
87.7%
100.0% 94.2%
88.4%
100.0%
92.1%
83.7%
100.0% 93.2%
87.7%
100.0%
90.8%
81.1%
Bas
elin
e
50
% S
EP
10
0%
SEP
Bas
elin
e
50
% S
EP
10
0%
SEP
Bas
elin
e
50
% S
EP
10
0%
SEP
Bas
elin
e
50
% S
EP
10
0%
SEP
Bas
elin
e
50
% S
EP
10
0%
SEP
Bas
elin
e
50
% S
EP
10
0%
SEP
Bas
elin
e
50
% S
EP
10
0%
SEP
Bas
elin
e
50
% S
EP
10
0%
SEP
Bas
elin
e
50
% S
EP
10
0%
SEP
Bas
elin
e
50
% S
EP
10
0%
SEP
Bas
elin
e
50
% S
EP
10
0%
SEP
Chemical Sector
(production data for 37% of
products)
Crop Sector (production
data for 50% of
products)
Ferrous Sector
(production data for 69% of
products)
Food Sector (production
data for 67% of
products)
Mining Sector
(production data for 48% of
products)
Nonferrous Sector
(production data for 39% of
products)
Nonmetallic Sector
(production data for 41% of
products)
Oil and Gas Sector
(production data for 20% of
products)
Paper Sector
(production data for 84% of
products)
Petroleum and Coal
Sector (production
data for 58% of
products)
Plastics and Rubber
Sector (production
data for 29% of
products)
18

Methodology - approach
• Process based matrix approach o Step wise calculation of material demand and associated energy
and green house gas impact o Transportation – single aggregated calculation.
• Matrix is constructed in a product by material structure o 500+ products - any material having a recipe or upstream data o 1100+ materials - anything being used in a recipe
• 1200+ recipe - defines the process for manufacturing a product, inputs (energy and material) and outputs (product and co-products)
• Co-products are non-primary products of a process and are given a negative accounting (discussed later).
19
Methodology – database / tool interface
• The calculations for the tool occur in two locations, the database and the excel tool
• The matrix is created in the database based on the user inputs (user input page in the excel tool).
• The database sends this matrix to the tool for the step wise demand vector and energy calculations.
20

Methodology: database
• The database holds all the recipes for the tool (see figure below), sector increased energy efficiency potential data, links to sectors and baseline process weightings and unit conversions
• Recipes can be added and modified from the database website user interface.
• Access is currently restricted to NREL users only, but will ultimately be available for external users but with restricted access due to proprietary data.
21

Methodology: approach
• A demand vector based on the product of interest and a user defined quantity is multiplied against the matrix to determine the material demand required and creates a demand vector for the 2nd step in the supply chain.
• This 2nd demand vector is then also multiplied by the matrix to create a 3rd demand vector.
• This is repeated for 10 steps (to represent the full supply chain).
• Each step is then added together to get the material (and energy demand) for the supply chain.
• This step wise calculation allows us to determine which step in the supply chain has the greatest energy impact.
• This final vector is in kg or kwh of product or electricity.
22

Methodology: Co-product management
• Co-products are included in the calculations as offsets and are considered negative inputs to recipes (see ethylene from GTL naphtha cracking example below).
• Co-products of co-products are not included due to creation of a double negative accounting.
23
Results per 1000 kg of ALUMINUM, SMELT for 10 Steps
Electricity Coal
Natural
Gas Diesel Kerosene
Fuel Oil
and Resid Crude Oil Refinery Gas Coke Uranium
Primary
Non-
renewable
Primary
Renewable
Energy Total energy
Carbon
Dioxide
(FUEL)
Carbon
Dioxide
(ELEC)
Fuel Use in
Transportati
on
Material kWh GJ GJ GJ GJ GJ GJ GJ GJ GJ GJ GJ KG KG KG (GJ)
A ALUMINUM, SMELT 2.13E+02 4.51E+00 1.10E+01 2.95E-01 -1.06E-01 9.10E+00 0.00E+00 0.00E+00 1.51E+01 8.07E-02 3.993E+01 9.10E-04 3.99E+01 2.14E+03 1.29E+02 6.31E+00
B ALUMINUM, SMELT 2.13E+02 4.51E+00 1.10E+01 2.95E-01 -1.06E-01 9.10E+00 0.00E+00 0.00E+00 1.51E+01 8.07E-02 3.993E+01 3.62E+00 3.99E+01 2.14E+03 1.29E+02 6.31E+00
C ALUMINUM, SMELT 1.25E+02 3.22E-02 2.14E+00 2.92E-01 -1.04E-01 5.96E-01 0.00E+00 0.00E+00 1.51E+01 4.20E-02 1.809E+01 3.07E-02 1.81E+01 2.32E+02 7.61E+01 6.07E+00
Scenario Inputs: From the User Input Page
Scenario A Scenario B Scenario C Scenario A Scenario B Scenario C Scenario A Scenario B Scenario C
Process Weighting Weighting Weighting Efficiency Efficiency Efficiency Grid Weighting Grid WeightingGrid WeightingGrid Weighting
CARBOTHERMIC 0% 0% 0% 0% 0% 0% ELECTRICITY GRID, FRCC 0% 0% 0%
CLAY CARBOCHLORINATION 0% 0% 100% 0% 0% 0% ELECTRICITY GRID, MRO 0% 0% 0%
HH WETTED CATHODE 0% 100% 0% 0% 0% 0% ELECTRICITY GRID, NATIONAL 100% 100% 100%
H-H/INERT ANODE 0% 0% 0% 0% 0% 0% ELECTRICITY GRID, NPCC 0% 0% 0%
MODERN HALL HEROULT PROCESS 100% 0% 0% 0% 0% 0% ELECTRICITY GRID, RFC 0% 0% 0%
SMELTING OF REFINED ALUMINA TO METALLIC ALUMINUM0% 0% 0% 0% 0% 0% ELECTRICITY GRID, SERC 0% 0% 0%
ELECTRICITY GRID, SPP 0% 0% 0%
ELECTRICITY GRID, TRE 0% 0% 0%
ELECTRICITY GRID, WECC 0% 0% 0%
ELECTRICITY, 80PCT RE CONSTRAINED TRANSMISSION0% 0% 0%
ELECTRICITY, 80% RENEWABLES CONSTRAINED RESOURCES0% 0% 0%
ELECTRICITY, 80PCT RE INCREMENTAL TECHNOLOGY IMPROVEMENTS0% 0% 0%
ELECTRICITY, 70PCT RE INCREMENTAL TECHNOLOGY IMPROVEMENTS0% 0% 0%
ELECTRICITY, 60PCT RE INCREMENTAL TECHNOLOGY IMPROVEMENTS0% 0% 0%
ELECTRICITY, 50PCT RE INCREMENTAL TECHNOLOGY IMPROVEMENTS0% 0% 0%
ELECTRICITY, 40PCT RE INCREMENTAL TECHNOLOGY IMPROVEMENTS0% 0% 0%
ELECTRICITY, 30PCT RE INCREMENTAL TECHNOLOGY IMPROVEMENTS0% 0% 0%
Tabular Results for Scenarios A – C
24

Data sources and Verification
• Data sources: o IHS/SRI Process Economics Program yearbook o Life cycle inventory databases – US LCI database – US based data – Simapro LCI datbase – international data – Journal articles – LBNL sector efficiency study – ORNL next gen process and materials data – Commodity Flow Survey
• Verification o Market allocation and processes verified by ICF o Verify against publish embodied energy o Reviewed by IEF team o Data gap analysis
25
Pro
cess
wei
ghti
ng
Un
it c
on
vers
ion
B
ase
reci
pe
and
eff
icie
ncy
to
kg
or
kwh
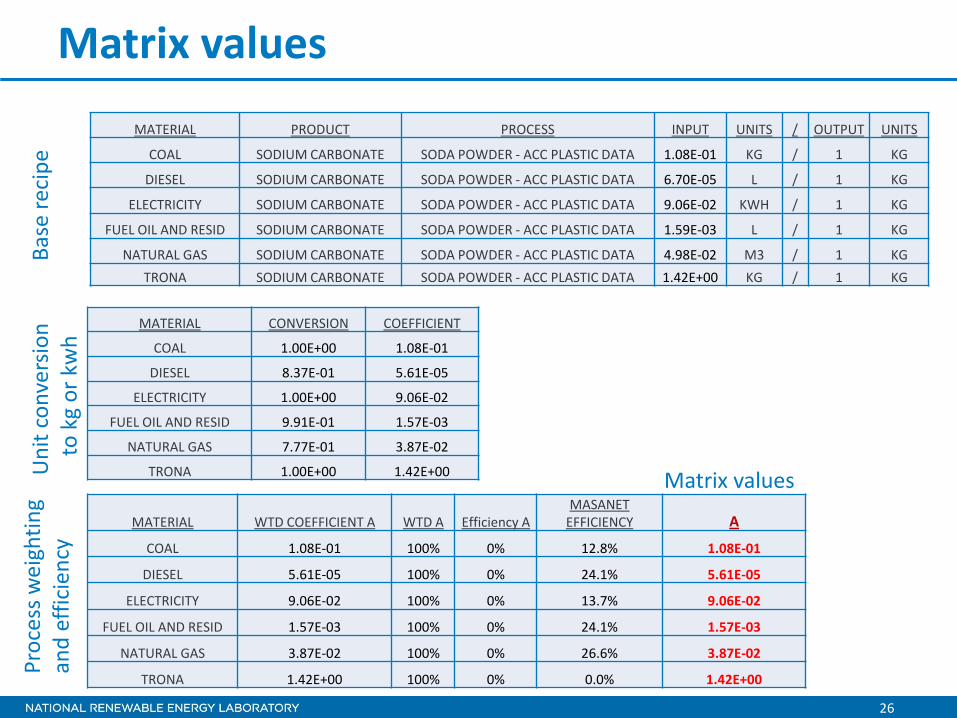
Matrix values
MATERIAL PRODUCT PROCESS INPUT UNITS / OUTPUT UNITS
COAL SODIUM CARBONATE SODA POWDER - ACC PLASTIC DATA 1.08E-01 KG / 1 KG
DIESEL SODIUM CARBONATE SODA POWDER - ACC PLASTIC DATA 6.70E-05 L / 1 KG
ELECTRICITY SODIUM CARBONATE SODA POWDER - ACC PLASTIC DATA 9.06E-02 KWH / 1 KG
FUEL OIL AND RESID SODIUM CARBONATE SODA POWDER - ACC PLASTIC DATA 1.59E-03 L / 1 KG
NATURAL GAS SODIUM CARBONATE SODA POWDER - ACC PLASTIC DATA 4.98E-02 M3 / 1 KG
TRONA SODIUM CARBONATE SODA POWDER - ACC PLASTIC DATA 1.42E+00 KG / 1 KG
MATERIAL CONVERSION COEFFICIENT
COAL 1.00E+00 1.08E-01
DIESEL 8.37E-01 5.61E-05
ELECTRICITY 1.00E+00 9.06E-02
FUEL OIL AND RESID 9.91E-01 1.57E-03
NATURAL GAS 7.77E-01 3.87E-02
TRONA 1.00E+00 1.42E+00 Matrix values
MATERIAL WTD COEFFICIENT A WTD A Efficiency A MASANET
EFFICIENCY A
COAL 1.08E-01 100% 0% 12.8% 1.08E-01
DIESEL 5.61E-05 100% 0% 24.1% 5.61E-05
ELECTRICITY 9.06E-02 100% 0% 13.7% 9.06E-02
FUEL OIL AND RESID 1.57E-03 100% 0% 24.1% 1.57E-03
NATURAL GAS 3.87E-02 100% 0% 26.6% 3.87E-02
TRONA 1.42E+00 100% 0% 0.0% 1.42E+00
26
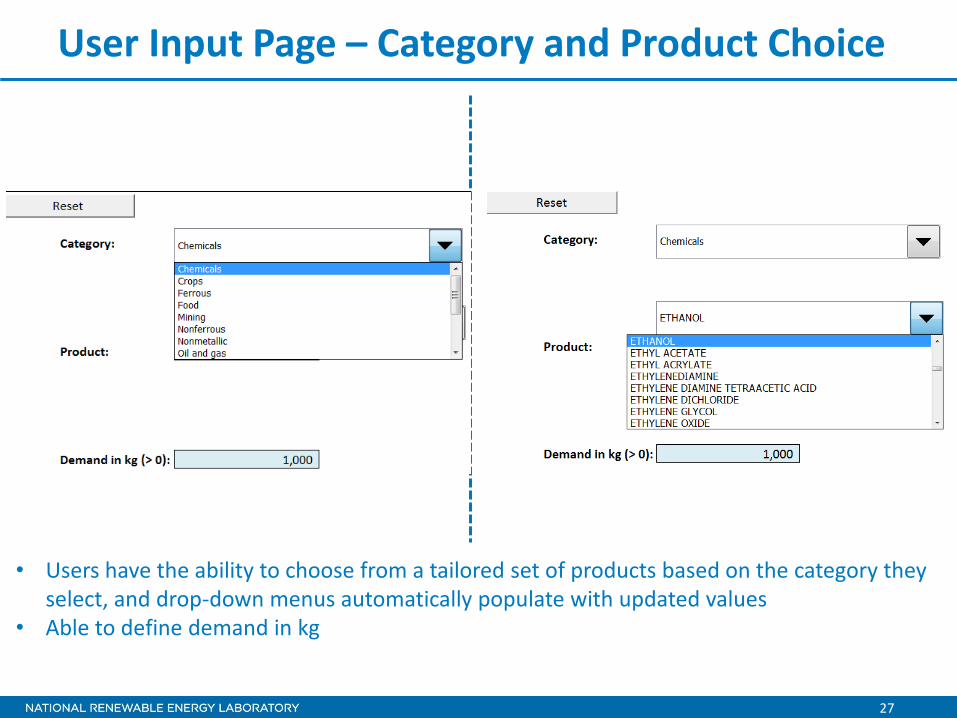
User Input Page – Category and Product Choice
• Users have the ability to choose from a tailored set of products based on the category they select, and drop-down menus automatically populate with updated values
• Able to define demand in kg
27

User Input Page – Process Weightings
• Process choices automatically populate based on the product chosen, along with the baseline (market defined) weighting and the equal weighting percentages
• Users may choose baseline (market) weighting, equal weighting, or input a user-defined weighting for three different scenarios by using the buttons in the grey box
• Users may input their own process weightings in the blue cells
28

User Input Page – Efficiency Implementation
Sector Efficiency Potential (SEP) is the potential energy efficiency improvement within different sectors, assuming all possible improvements are achieved
• Users may define the percentage of the SEP that they would like to implement, or use the baseline implementation via the buttons in the grey box
• Baseline implementation is always 0% and assumes no efficiency improvements • Selection of 50% of SEP indicates that half of the potential efficiency improvements are
implemented. 29
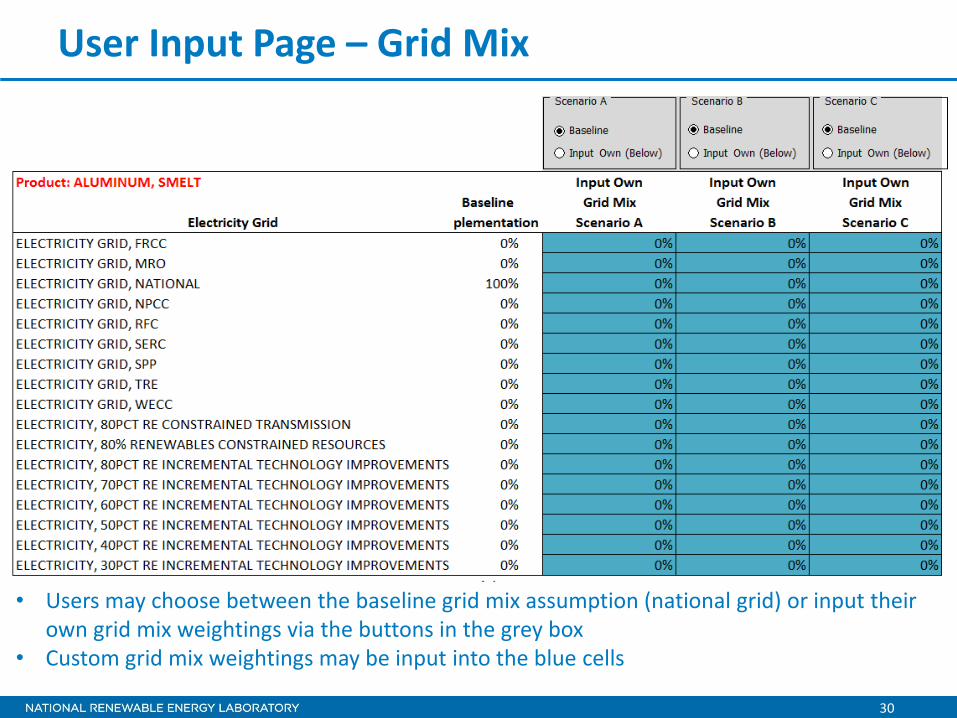
User Input Page – Grid Mix
• Users may choose between the baseline grid mix assumption (national grid) or input their own grid mix weightings via the buttons in the grey box
• Custom grid mix weightings may be input into the blue cells
30