mass spectrometry analytical chemistry. instrument
TRANSCRIPT
Mass Spectrometry
Analytical Chemistry
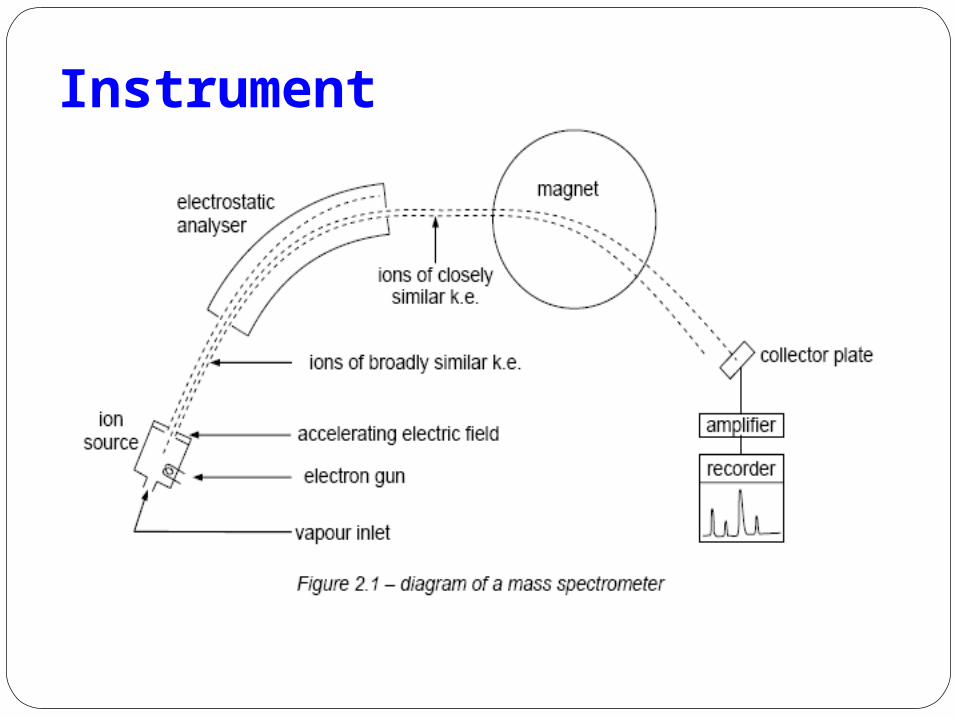
Instrument
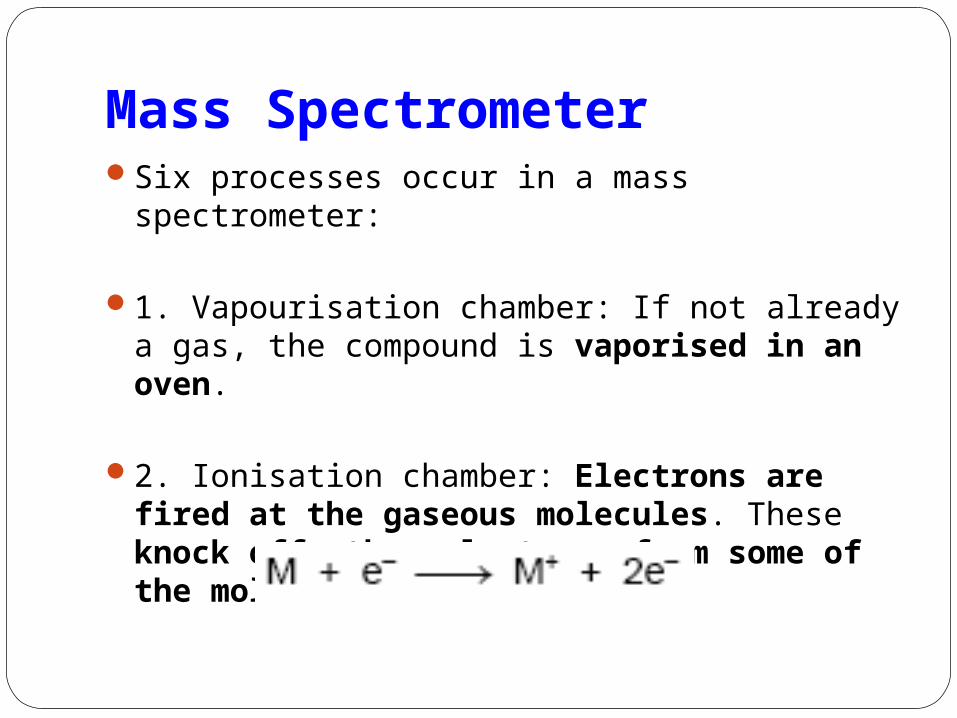
Mass SpectrometerSix processes occur in a mass spectrometer:
1. Vapourisation chamber: If not already a gas, the compound is vaporised in an oven.
2. Ionisation chamber: Electrons are fired at the gaseous molecules. These knock off other electrons from some of the molecules.
Mass Spectrometer3. Acceleration chamber: The gaseous ions are
accelerated by passing through an electric field.
4. Electrostatic analyser: select ions of kinetic energy within a narrow range by using an electric field.
5. Deflection chamber: The fast-moving ions now pass through the poles of an electromagnet, where they are deflected.
6. The deflected ions pass through a narrow slit and are collected on a metallic plate connected to an amplifier.
DeterminationUsing Mass Spectrometry
Is used to identify unknown or new compounds.
When a molecule is ionised it forms a MOLECULAR ION which can also undergo FRAGMENTATION or RE-ARRANGEMENT to produce particles of smaller mass.
Only particles with a positive charge will be deflected and detected.
The resulting spectrum has many peaks.
DeterminationUsing Mass SpectrometryThe final peak (M+) shows the molecular ion
(highest m/e or m/z value) and indicates the molecular mass.
The rest of the spectrum provides information about the structure.
Mass spectrumA mass spectrum is produced, which plots
(relative abundance) against (mass/charge (m/e) ratio).
In practice, most ions that are formed in a mass spectrometer have a charge of +1, and so the x-axis is a measure of the masses of the ions.
The y-axis normally shows the abundances of the respective peaks.
The base peak usually corresponds to a particularly stable fragment (most abundant) of the molecules under investigation.
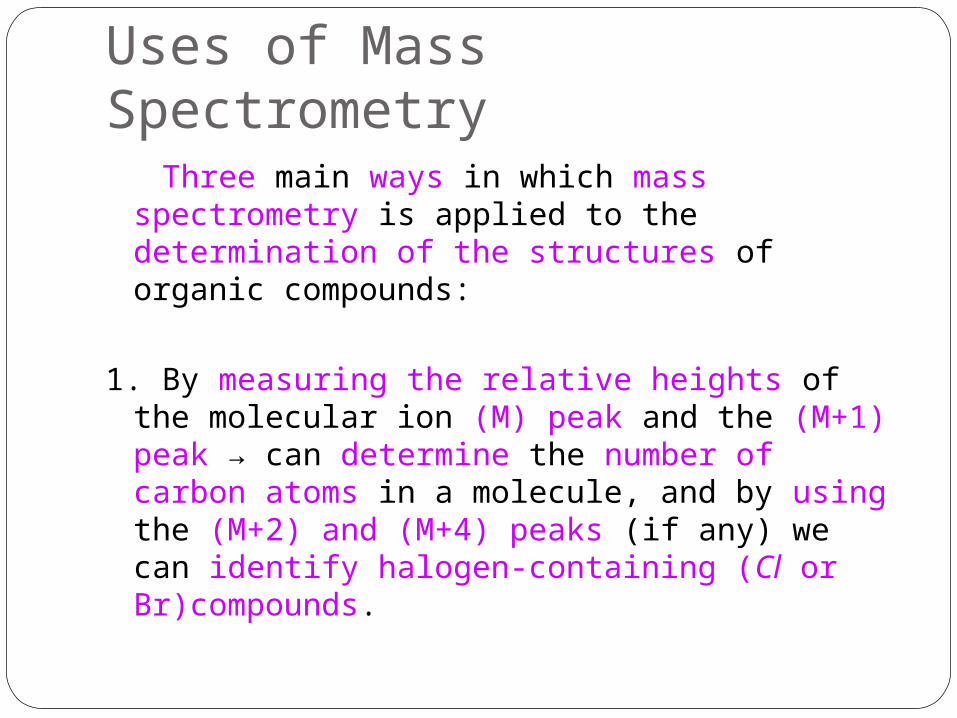
Uses of Mass Spectrometry Three main ways in which mass spectrometry
is applied to the determination of the structures of organic compounds:
1. By measuring the relative heights of the molecular ion (M) peak and the (M+1) peak → can determine the number of carbon atoms in a molecule, and by using the (M+2) and (M+4) peaks (if any) we can identify halogen-containing (Cl or Br)compounds.
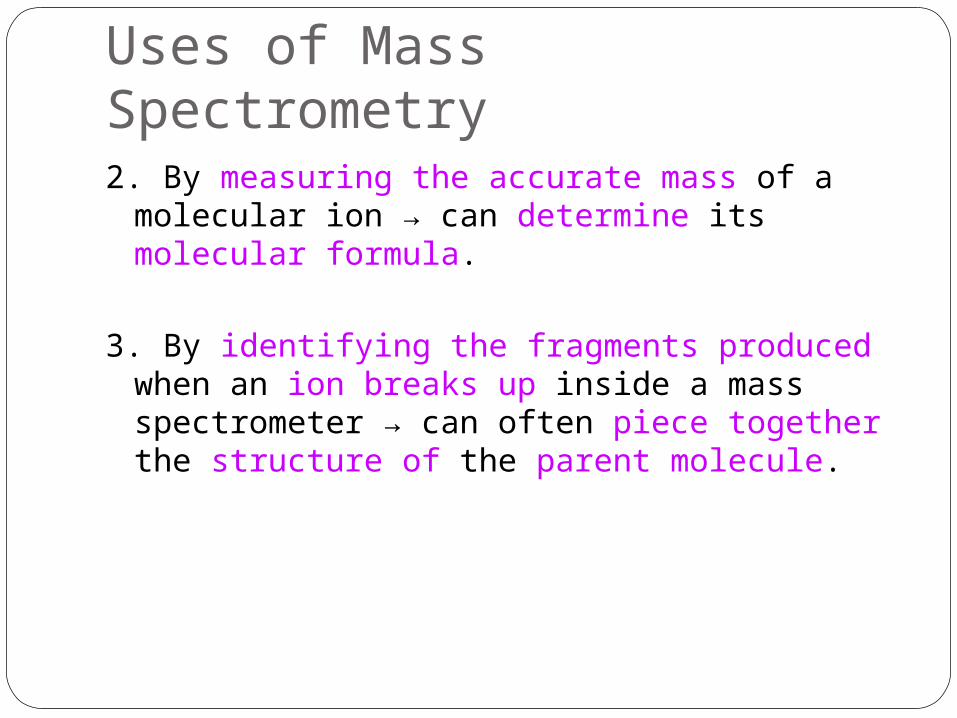
Uses of Mass Spectrometry2. By measuring the accurate mass of a
molecular ion → can determine its molecular formula.
3. By identifying the fragments produced when an ion breaks up inside a mass spectrometer → can often piece together the structure of the parent molecule.
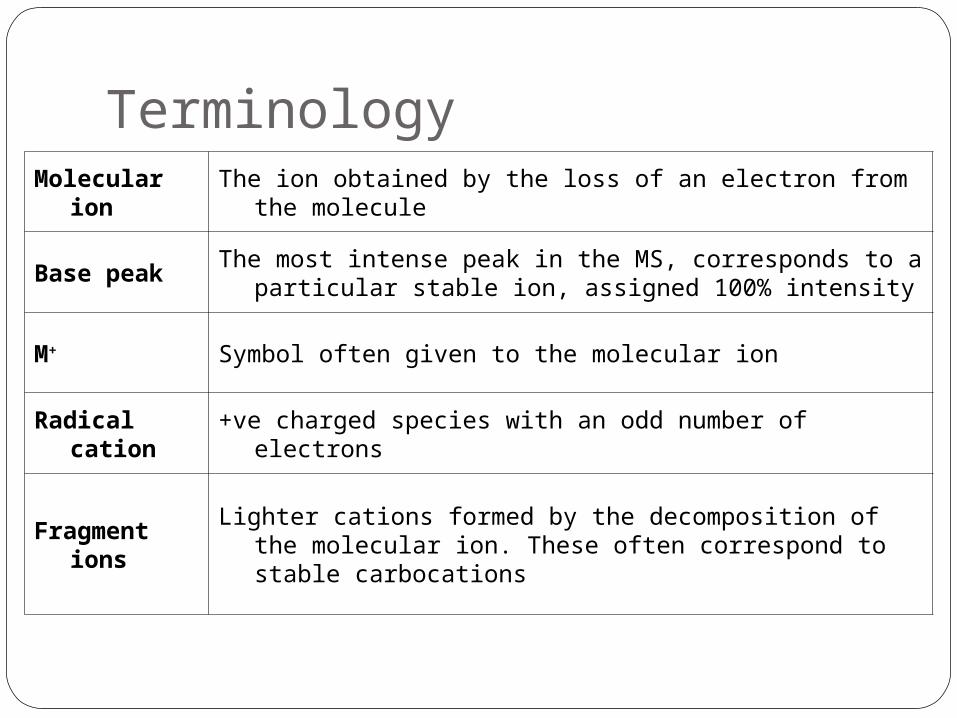
Molecular ion The ion obtained by the loss of an electron from the molecule
Base peakThe most intense peak in the MS, corresponds to a particular
stable ion, assigned 100% intensity
M+ Symbol often given to the molecular ion
Radical cation +ve charged species with an odd number of electrons
Fragment ionsLighter cations formed by the decomposition of the molecular
ion. These often correspond to stable carbocations
Terminology
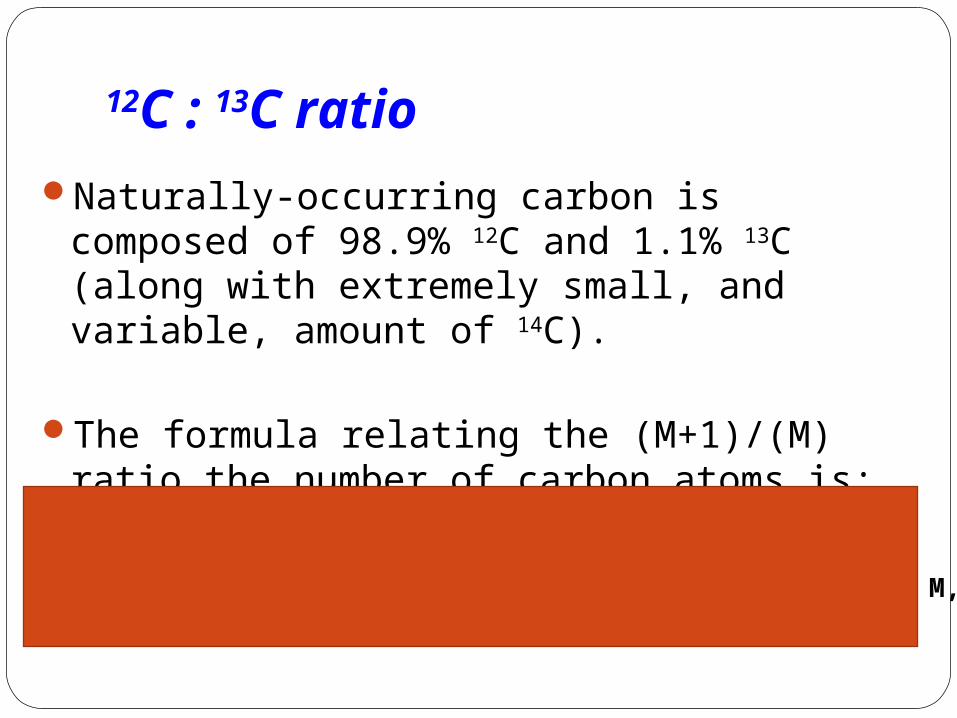
12C : 13C ratioNaturally-occurring carbon is composed of
98.9% 12C and 1.1% 13C (along with extremely small, and variable, amount of 14C).
The formula relating the (M+1)/(M) ratio the number of carbon atoms is:
where n = number of carbon atomsAM+1 = the abundance of the M+1 peakAM = the abundance of the molecular ion, M, peak.
Example 1(pg 58)Compound A has a molecular ion at an m/e value of 120, and relative abundance 23%, and a peak at m/e 121 with a relative abundance of 2%. How many carbon atoms are in a molecule of A?
SAQ 1. pg 58Compound B contains carbon, hydrogen
and oxygen only. Its mass spectrum contains a molecular ion peak at m/e = 102 (relative abundance 35%) and an M+1 peak at m/e 103 (1.5%).
Calculate the number of carbon atoms in the molecule, and hence deduce the number of oxygen atoms it contains, and its molecular formula.

Answer
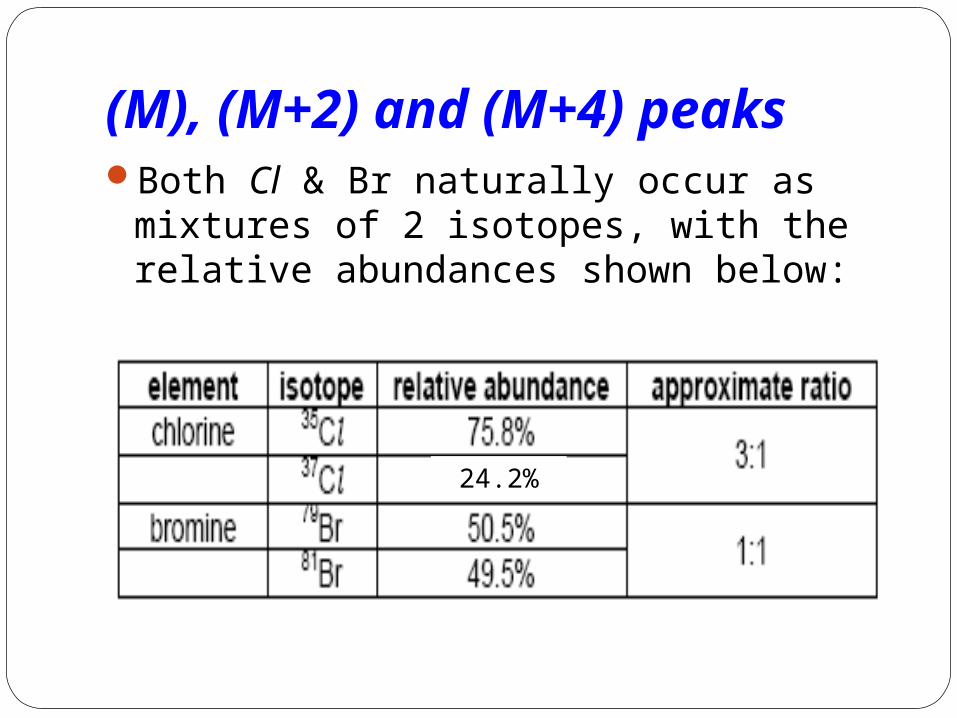
(M), (M+2) and (M+4) peaksBoth Cl & Br naturally occur as mixtures
of 2 isotopes, with the relative abundances shown below:
24.2%
If the molecule contains two chlorine atoms, (or two bromine atoms, or one of each) we should expect to see three molecular ions, at m/e values of M, M+2 and M+4.
The ratio of the M:(M+2) peak should reflect the natural abundances given in the table (i.e. 3:1 for chlorine; 1:1 for bromine)
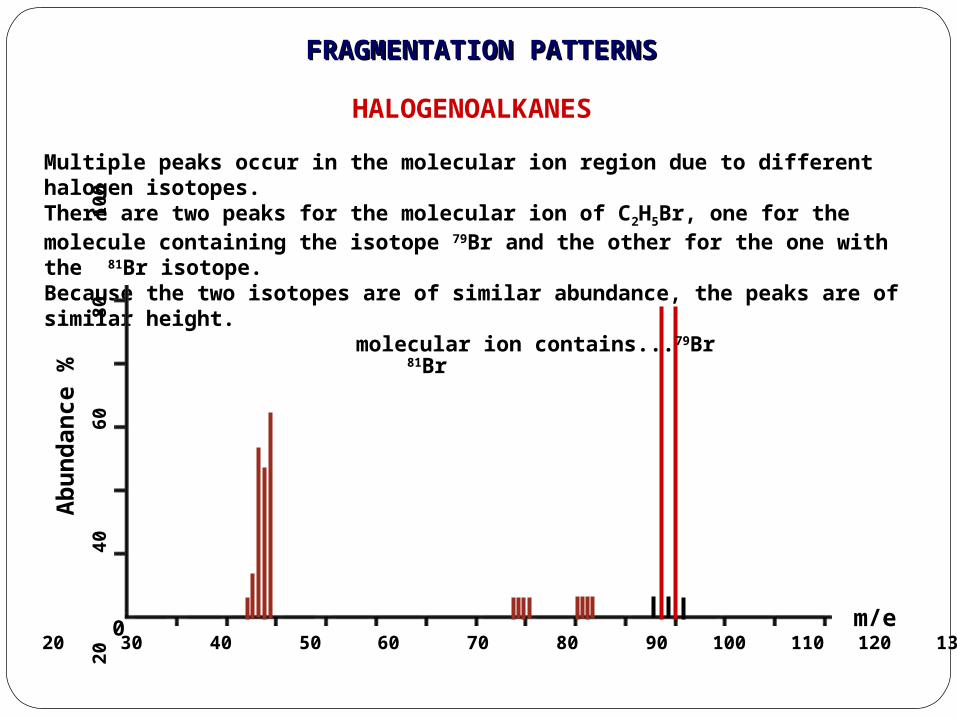
HALOGENOALKANES
FRAGMENTATION PATTERNSFRAGMENTATION PATTERNS
Multiple peaks occur in the molecular ion region due to different halogen isotopes.There are two peaks for the molecular ion of C2H5Br, one for the molecule containing the isotope 79Br and the other for the one with the 81Br isotope. Because the two isotopes are of similar abundance, the peaks are of similar height.
10 20 30 40 50 60 70 80 90 100 110 120 130 140 0 m/e
20
40
6
0
80
100
Ab
un
dan
ce %
molecular ion contains...79Br 81Br
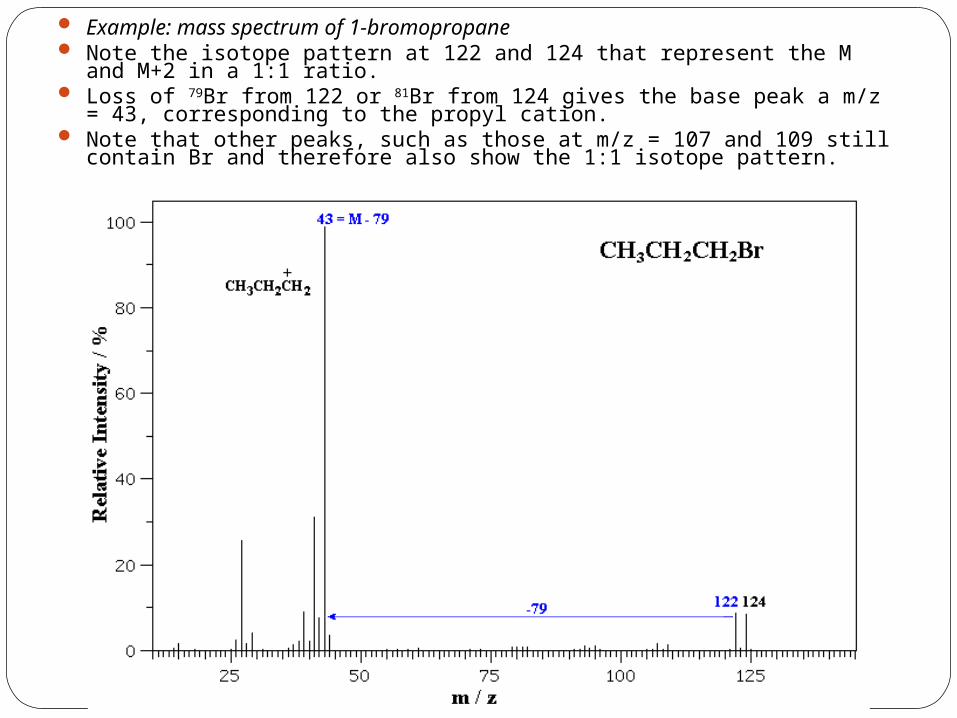
Example: mass spectrum of 1-bromopropane Note the isotope pattern at 122 and 124 that represent the M and M+2 in a
1:1 ratio. Loss of 79Br from 122 or 81Br from 124 gives the base peak a m/z = 43,
corresponding to the propyl cation. Note that other peaks, such as those at m/z = 107 and 109 still contain Br
and therefore also show the 1:1 isotope pattern.
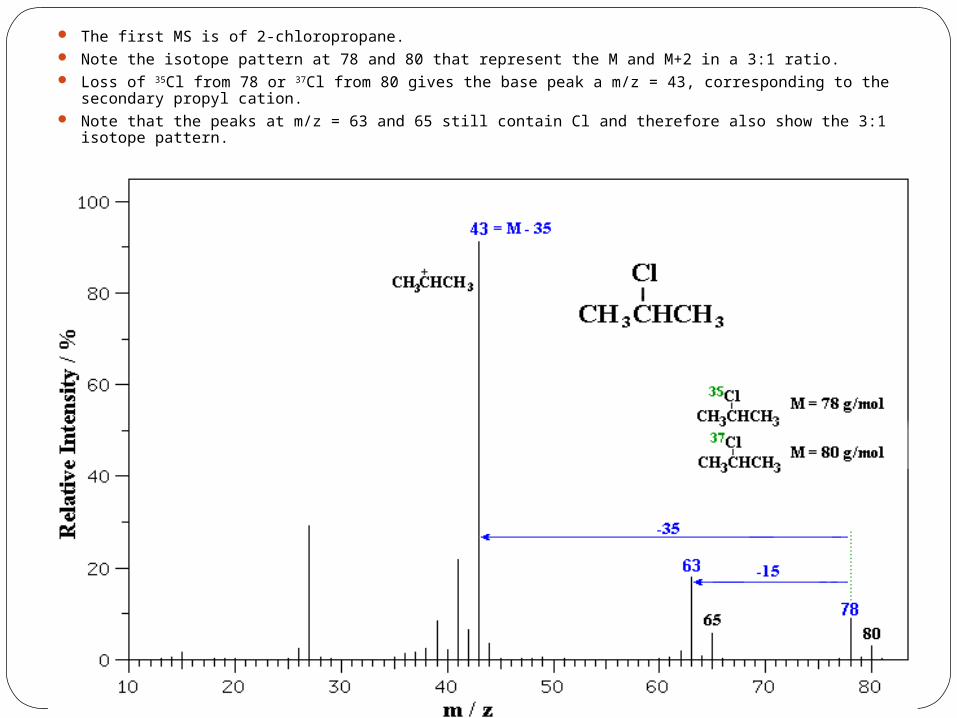
The first MS is of 2-chloropropane. Note the isotope pattern at 78 and 80 that represent the M and M+2 in a 3:1 ratio. Loss of 35Cl from 78 or 37Cl from 80 gives the base peak a m/z = 43, corresponding to the secondary
propyl cation. Note that the peaks at m/z = 63 and 65 still contain Cl and therefore also show the 3:1 isotope
pattern.
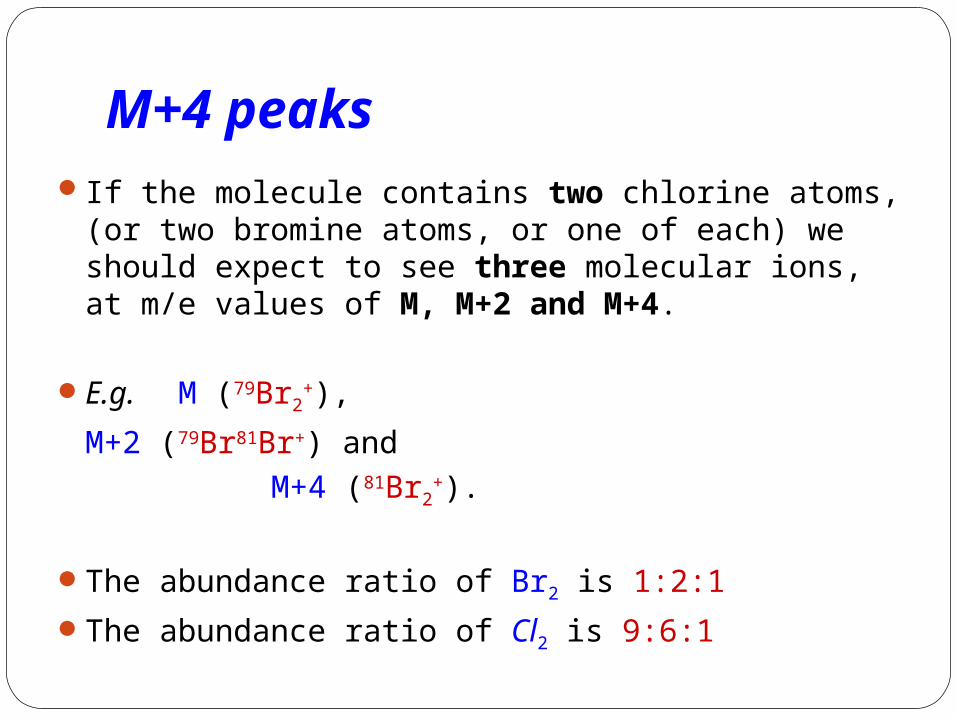
M+4 peaksIf the molecule contains two chlorine atoms, (or
two bromine atoms, or one of each) we should expect to see three molecular ions, at m/e values of M, M+2 and M+4.
E.g. M (79Br2+),
M+2 (79Br81Br+) and M+4 (81Br2
+).
The abundance ratio of Br2 is 1:2:1
The abundance ratio of Cl2 is 9:6:1
Example (pg 58)dibromomethane, CH2Br2,
three molecular ion peaks at m/e 172, 174 and 176 in the ratio 1:2:1,
dibromomethane, CH2Br2,three molecular ion peaks at m/e 172, 174 and
176 in the ratio 1:2:1,
Example (pg 58)dichloromethane, CH2Cl2,ratio 9:6:1,due to the greater natural abundance of
the 35Cl isotope.
dichloromethane, CH2Cl2, (remember ratio)
Hence, ratio 9:6:1,due to the greater natural abundance of
the 35Cl isotope.
SAQ 2 (pg 58)Calculate the M : M+2 : M+4 ratio for
CH2BrCl
Ans: 3 : 4 : 1

Answer:
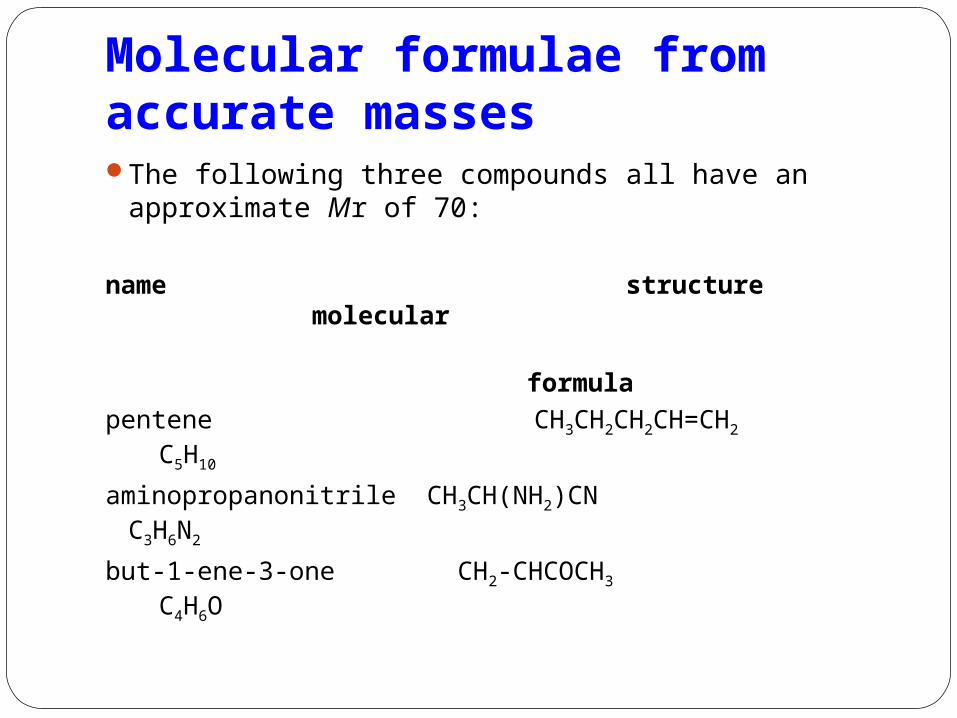
Molecular formulae from accurate massesThe following three compounds all have an
approximate Mr of 70:
name structure molecular
formula
pentene CH3CH2CH2CH=CH2 C5H10
aminopropanonitrile CH3CH(NH2)CN C3H6N2
but-1-ene-3-one CH2-CHCOCH3 C4H6O
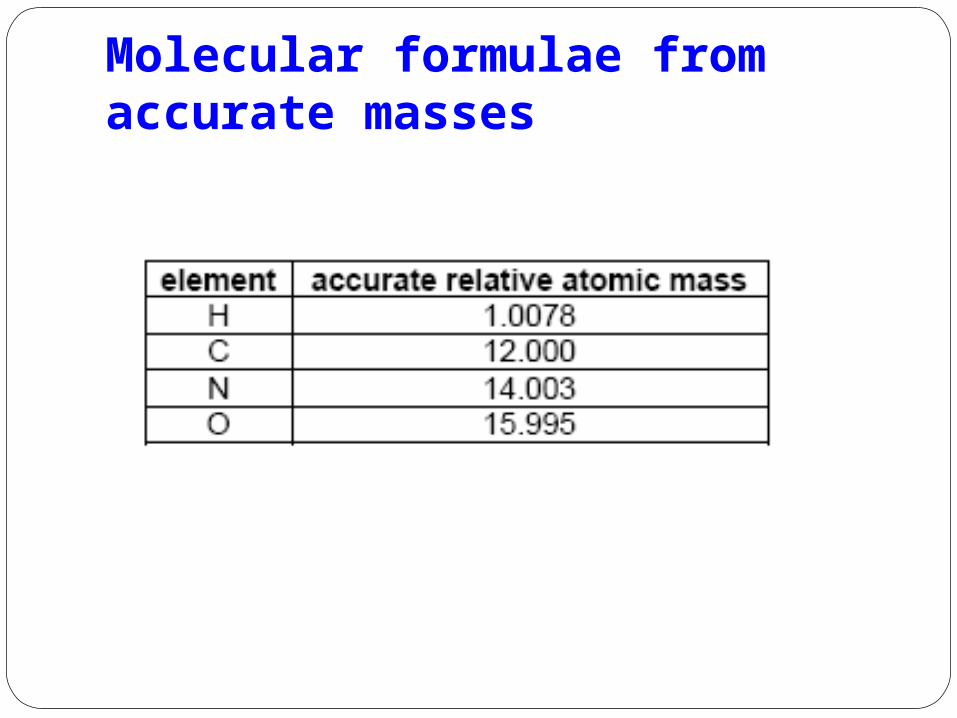
Molecular formulae from accurate masses
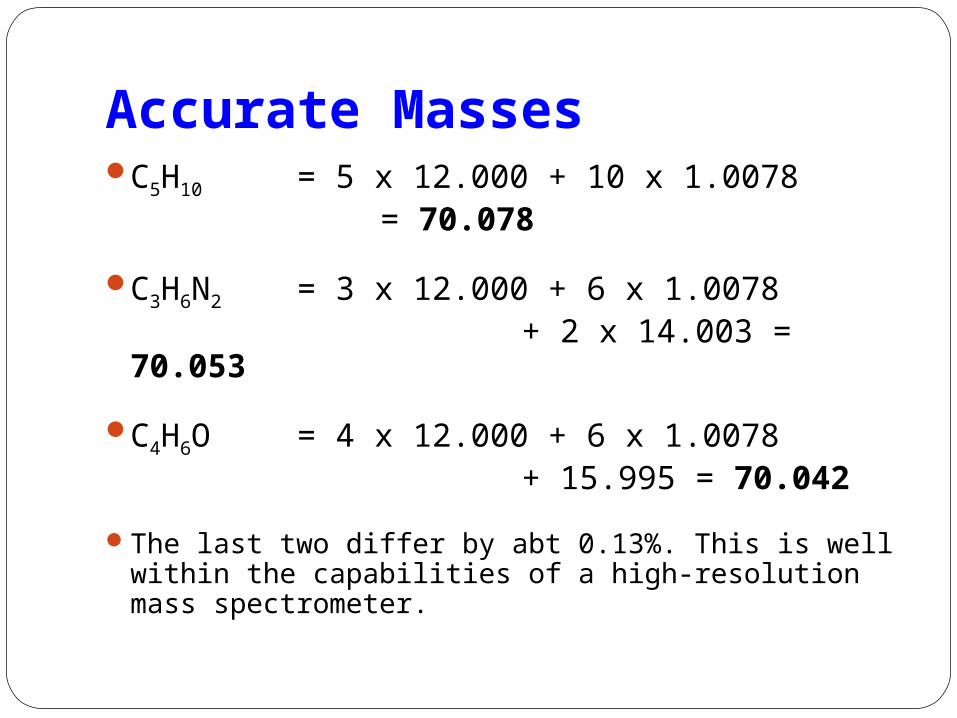
Accurate MassesC5H10 = 5 x 12.000 + 10 x 1.0078 = 70.078
C3H6N2 = 3 x 12.000 + 6 x 1.0078 + 2 x 14.003 = 70.053
C4H6O = 4 x 12.000 + 6 x 1.0078 + 15.995 = 70.042
The last two differ by abt 0.13%. This is well within the capabilities of a high-resolution mass spectrometer.
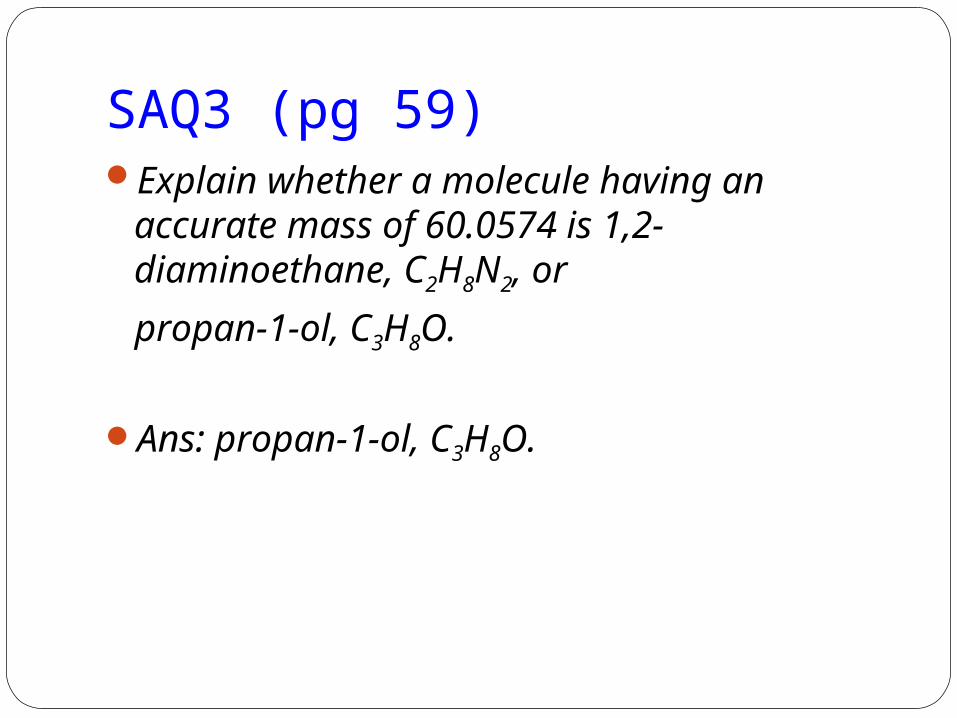
SAQ3 (pg 59)Explain whether a molecule having an
accurate mass of 60.0574 is 1,2-diaminoethane, C2H8N2, or
propan-1-ol, C3H8O.
Ans: propan-1-ol, C3H8O.
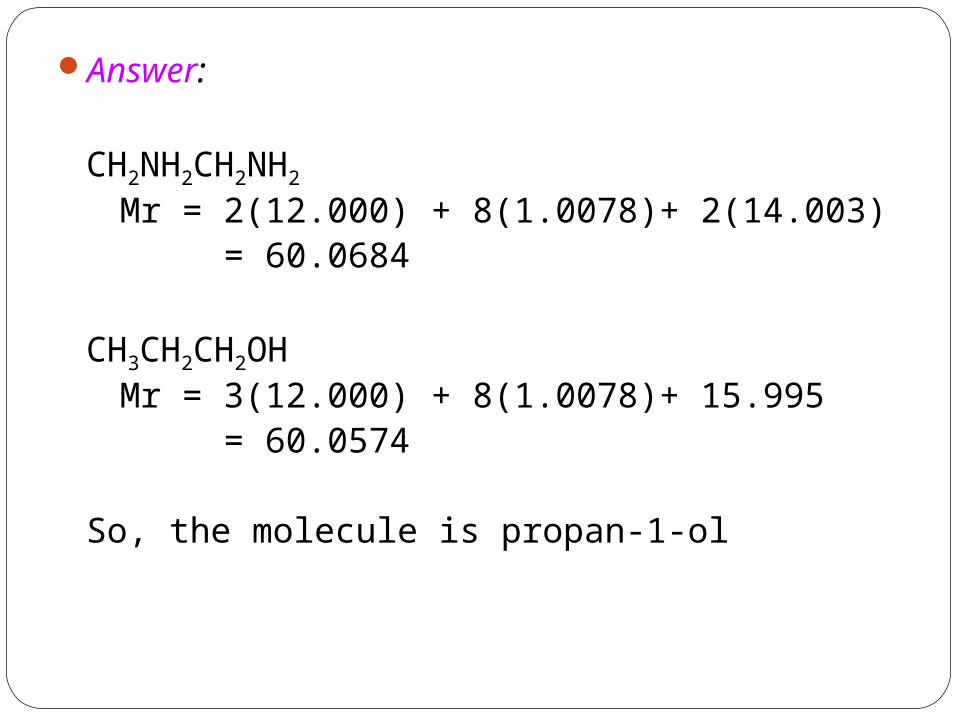
Answer:
CH2NH2CH2NH2 Mr = 2(12.000) + 8(1.0078)+ 2(14.003) = 60.0684
CH3CH2CH2OH Mr = 3(12.000) + 8(1.0078)+ 15.995 = 60.0574
So, the molecule is propan-1-ol
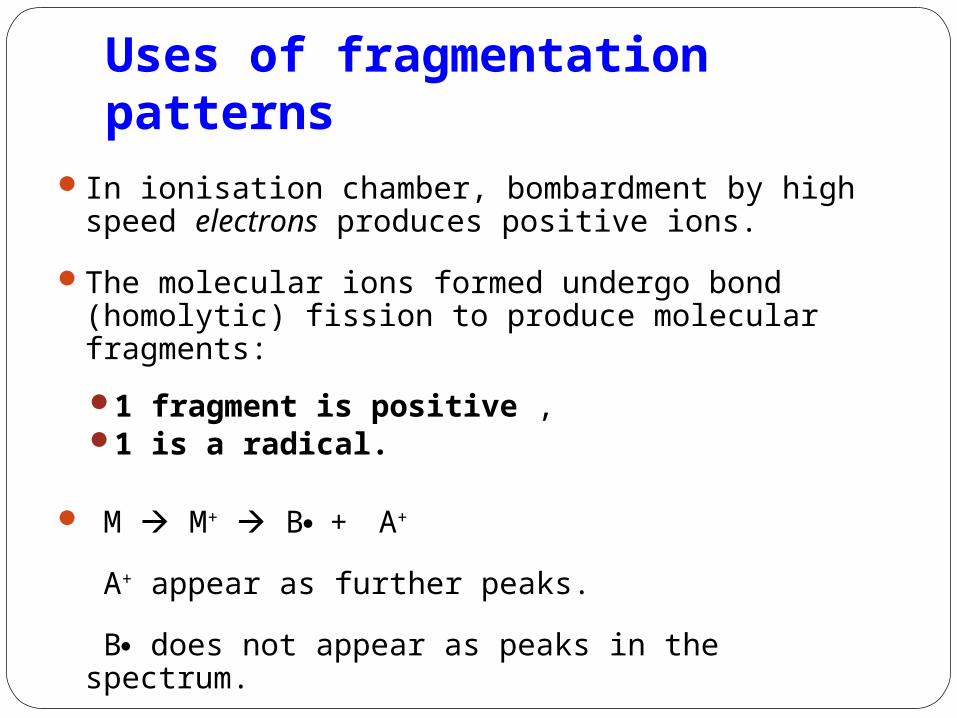
Uses of fragmentation patterns
In ionisation chamber, bombardment by high speed electrons produces positive ions.
The molecular ions formed undergo bond (homolytic) fission to produce molecular fragments:
1 fragment is positive , 1 is a radical.
M M+ B + A+
A+ appear as further peaks.
B does not appear as peaks in the spectrum.
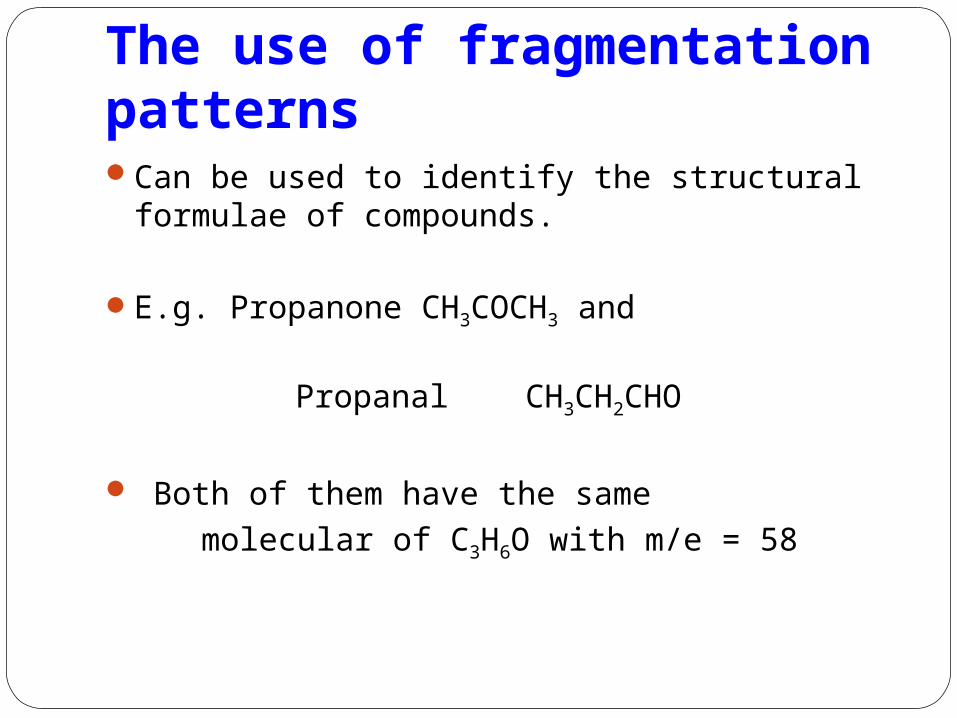
The use of fragmentation patternsCan be used to identify the structural formulae
of compounds.
E.g. Propanone CH3COCH3 and
Propanal CH3CH2CHO
Both of them have the same molecular of C3H6O with m/e = 58
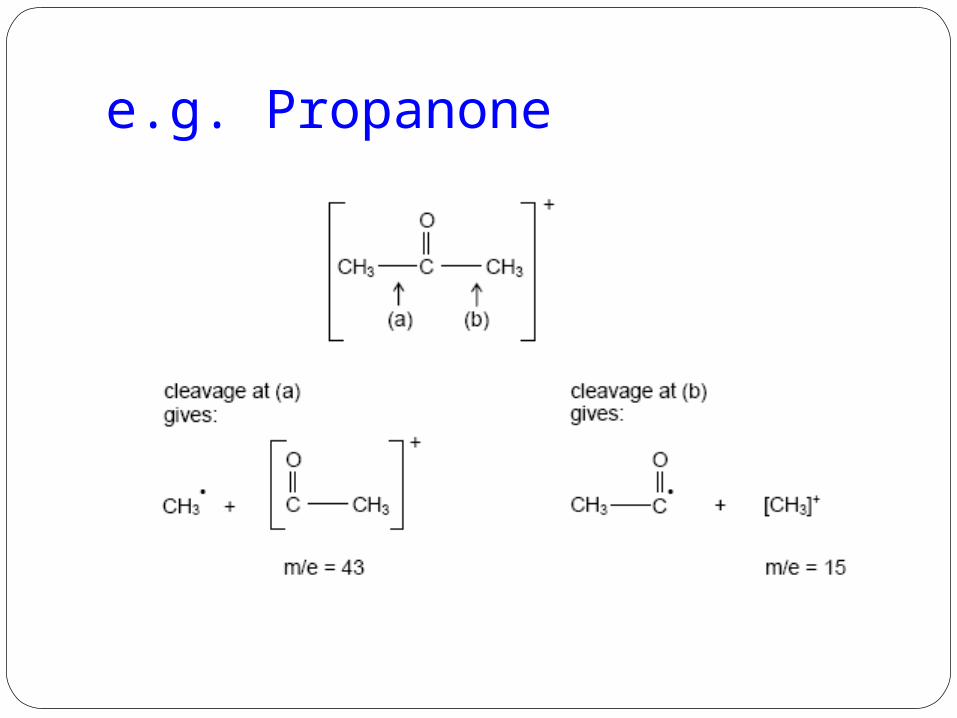
e.g. Propanone
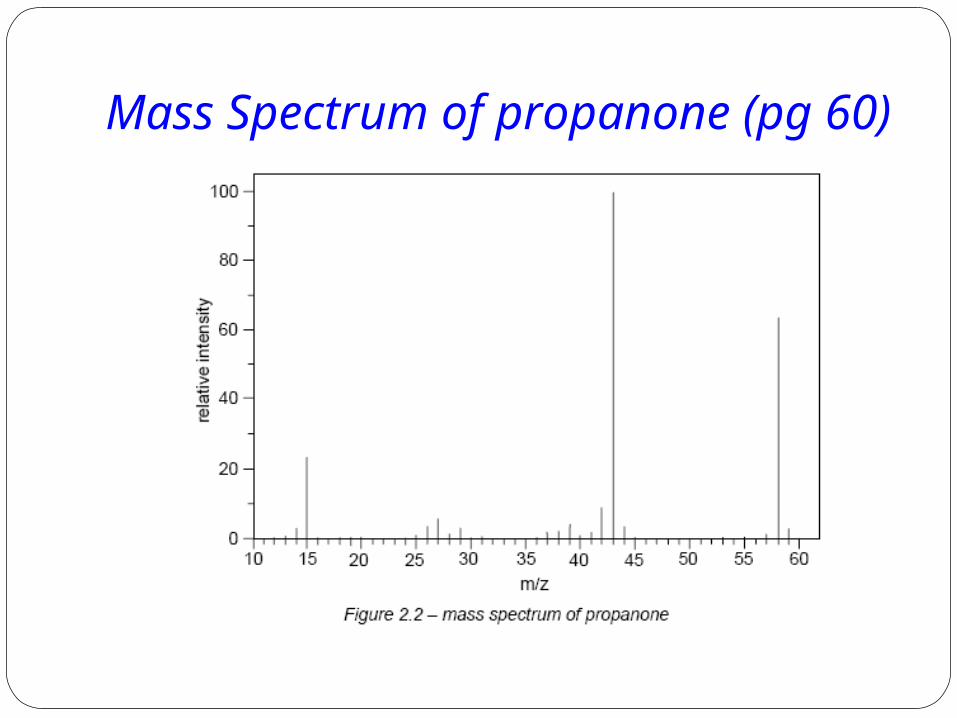
Mass Spectrum of propanone (pg 60)
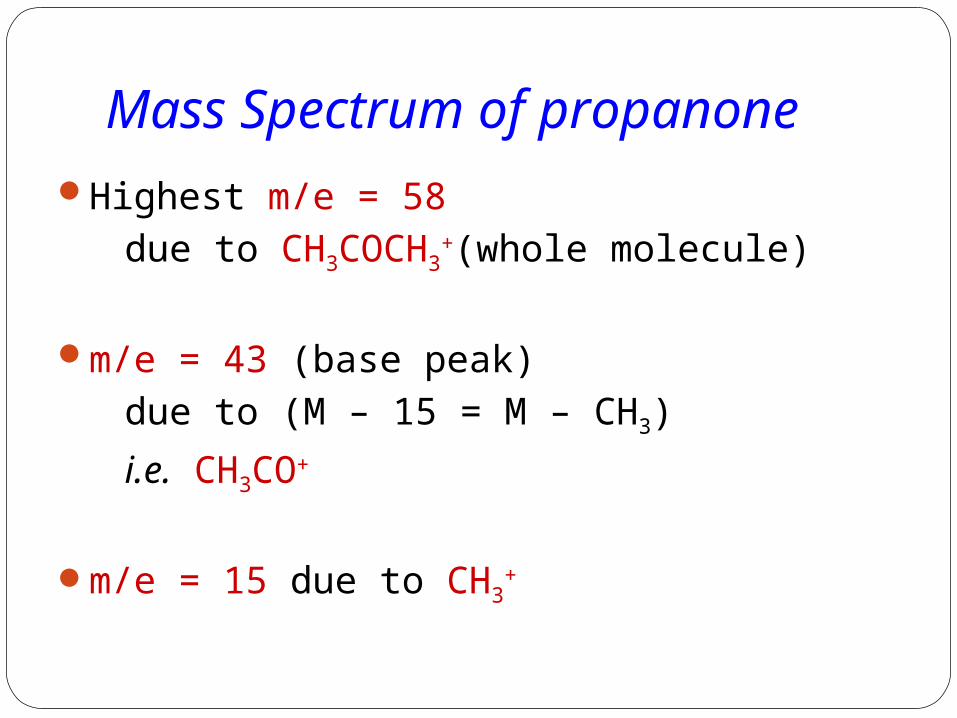
Mass Spectrum of propanoneHighest m/e = 58 due to CH3COCH3
+(whole molecule)
m/e = 43 (base peak) due to (M – 15 = M – CH3)
i.e. CH3CO+
m/e = 15 due to CH3+
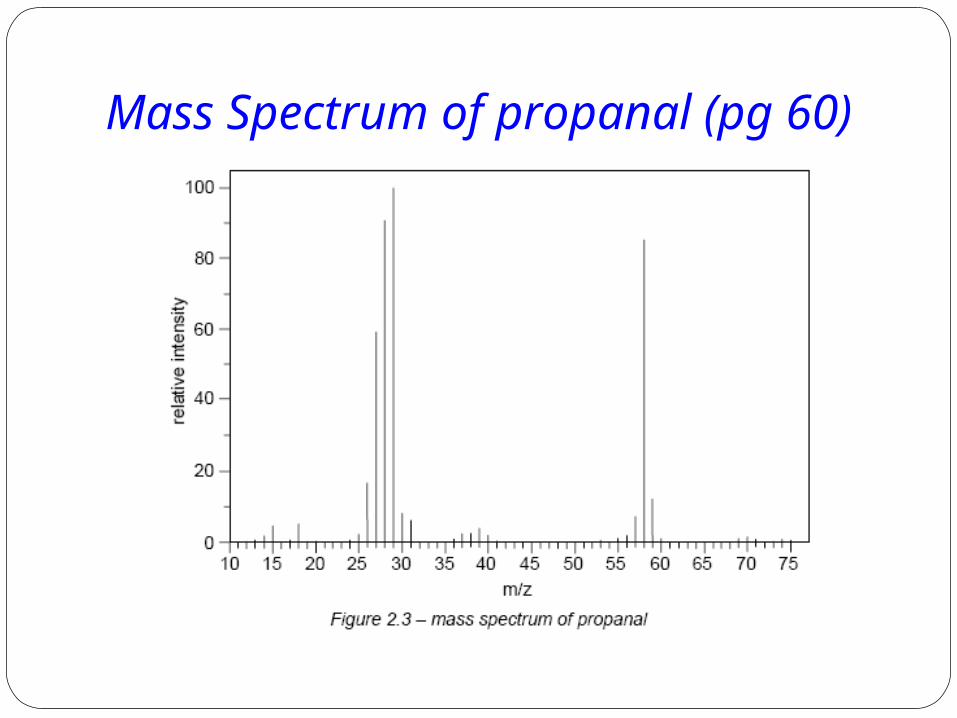
Mass Spectrum of propanal (pg 60)
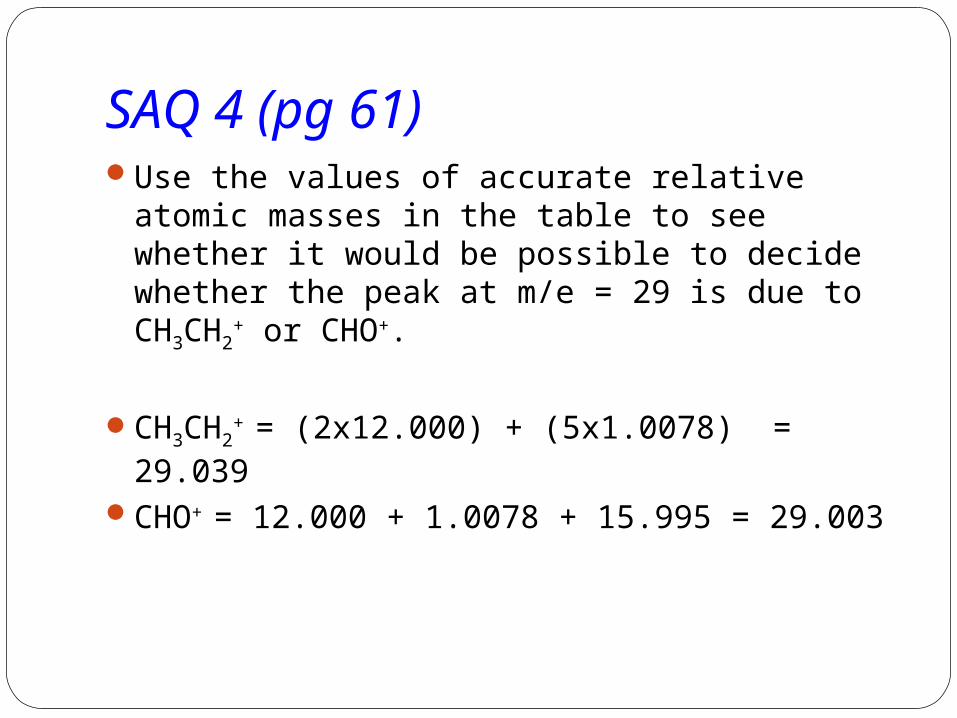
SAQ 4 (pg 61)Use the values of accurate relative atomic
masses in the table to see whether it would be possible to decide whether the peak at m/e = 29 is due to CH3CH2
+ or CHO+.
CH3CH2+ = (2x12.000) + (5x1.0078) = 29.039
CHO+ = 12.000 + 1.0078 + 15.995 = 29.003
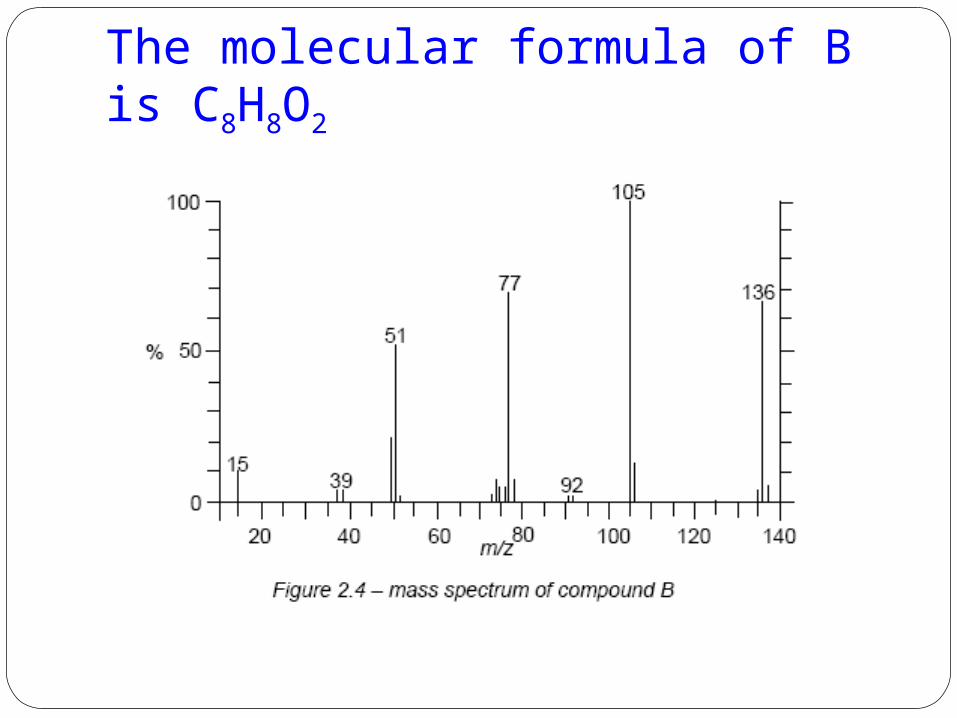
The molecular formula of B is C8H8O2
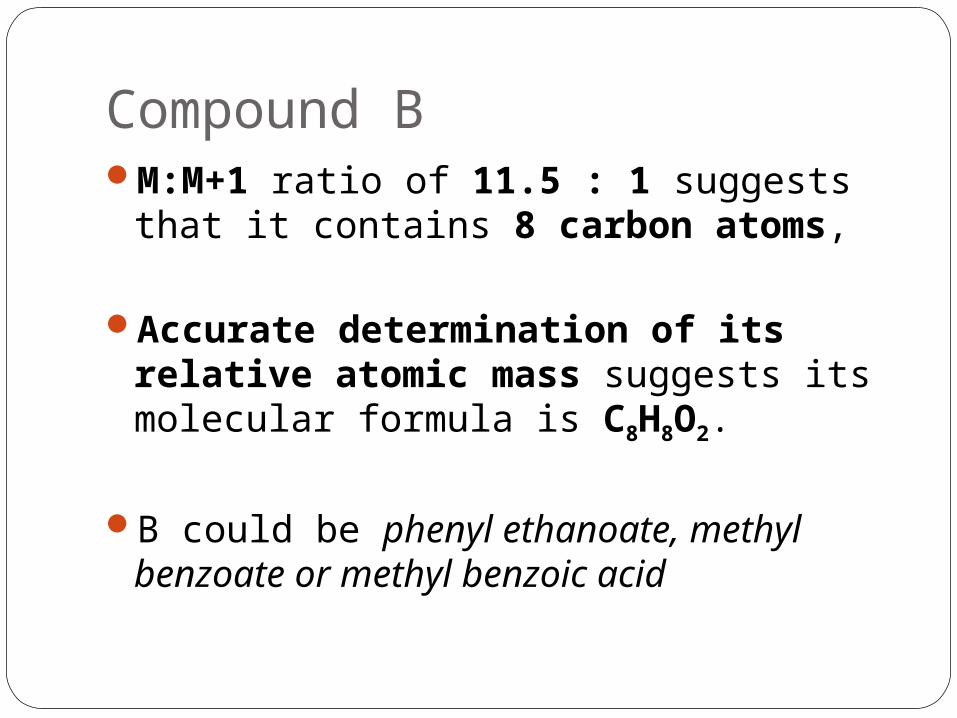
Compound BM:M+1 ratio of 11.5 : 1 suggests that
it contains 8 carbon atoms,
Accurate determination of its relative atomic mass suggests its molecular formula is C8H8O2.
B could be phenyl ethanoate, methyl benzoate or methyl benzoic acid
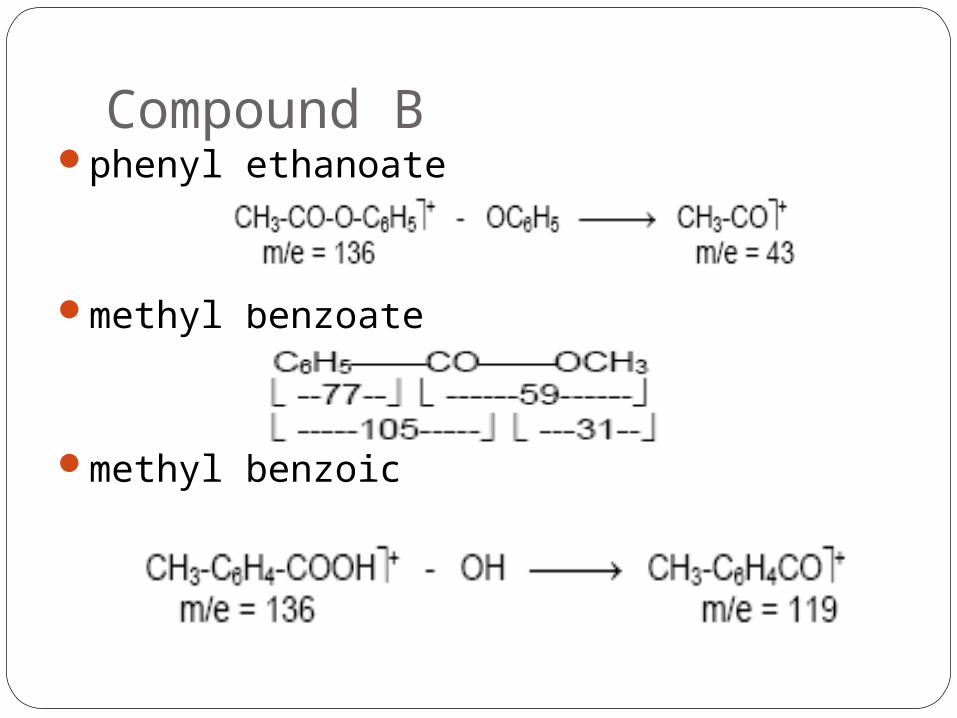
Compound Bphenyl ethanoate
methyl benzoate
methyl benzoic
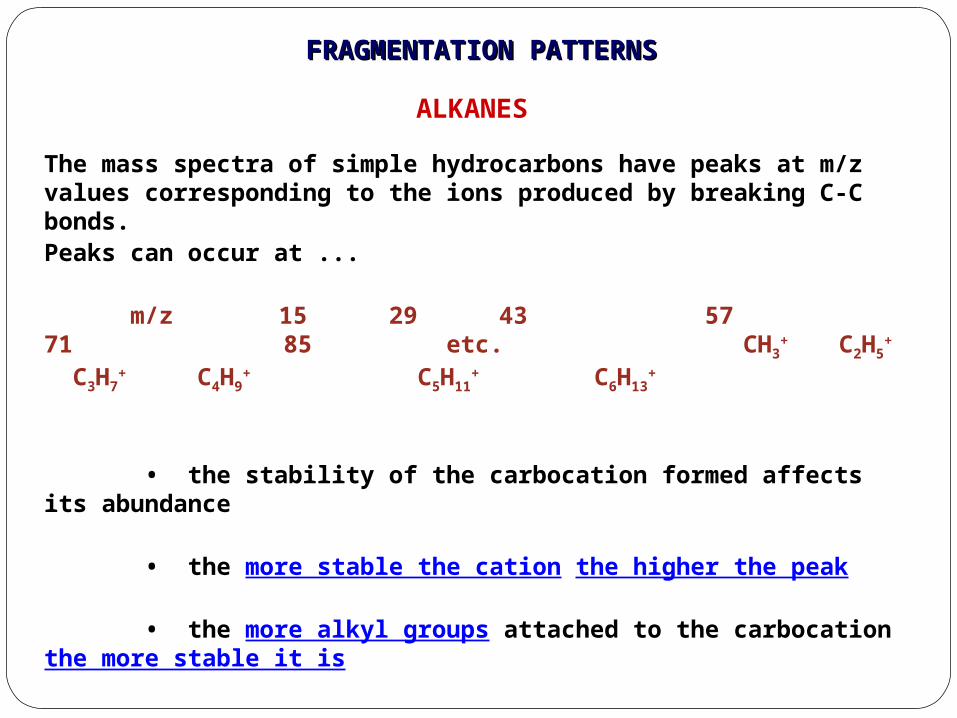
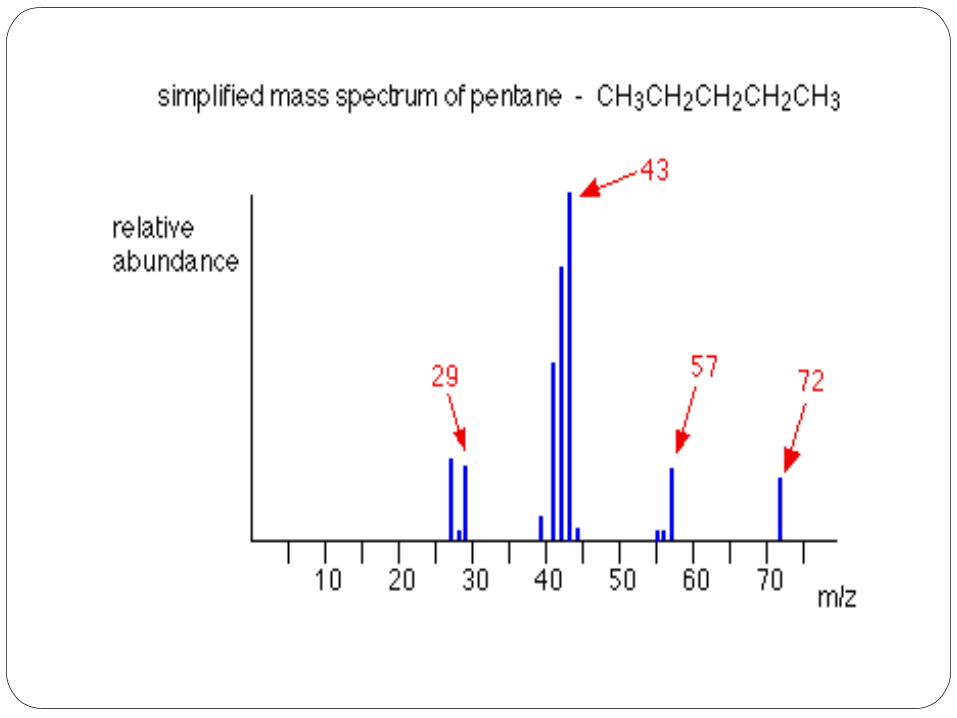
The mass spectra of simple hydrocarbons have peaks at m/z values corresponding to the ions produced by breaking C-C bonds. Peaks can occur at ...
m/z 15 29 43 57 71 85 etc. CH3
+ C2H5+ C3H7
+ C4H9+
C5H11+ C6H13
+
• the stability of the carbocation formed affects its abundance
• the more stable the cation the higher the peak
• the more alkyl groups attached to the carbocation the more stable it is
most stable tertiary 3° > secondary 2° > primary 1° least stable
alkyl groups are electron releasing and stabilise the cation
ALKANES
FRAGMENTATION PATTERNSFRAGMENTATION PATTERNS
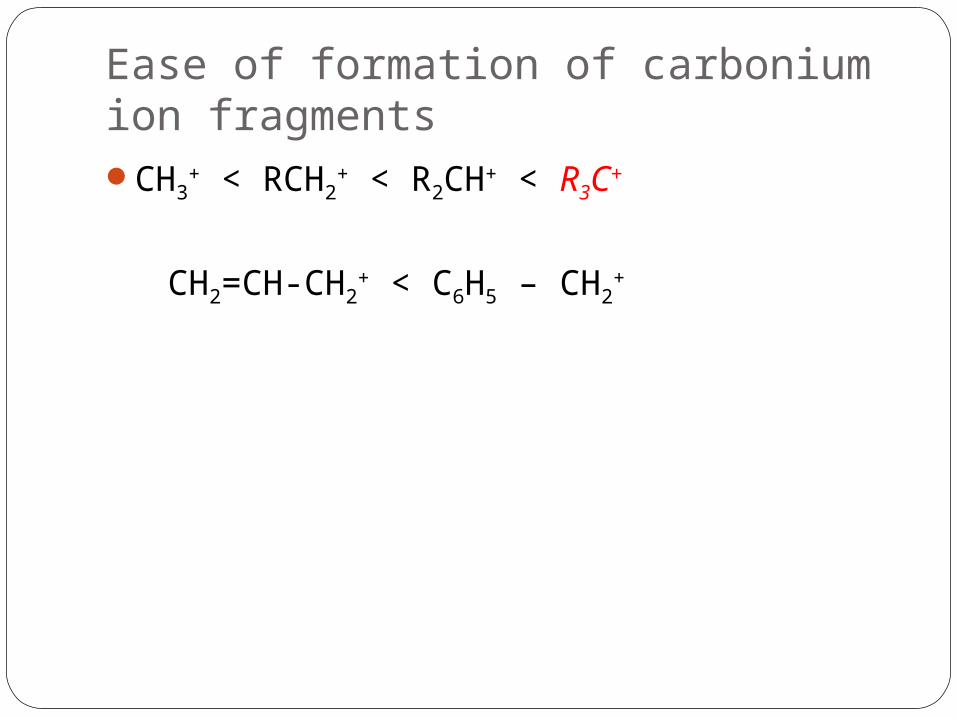
Ease of formation of carbonium ion fragmentsCH3
+ < RCH2+ < R2CH+ < R3C+
CH2=CH-CH2+ < C6H5 – CH2
+
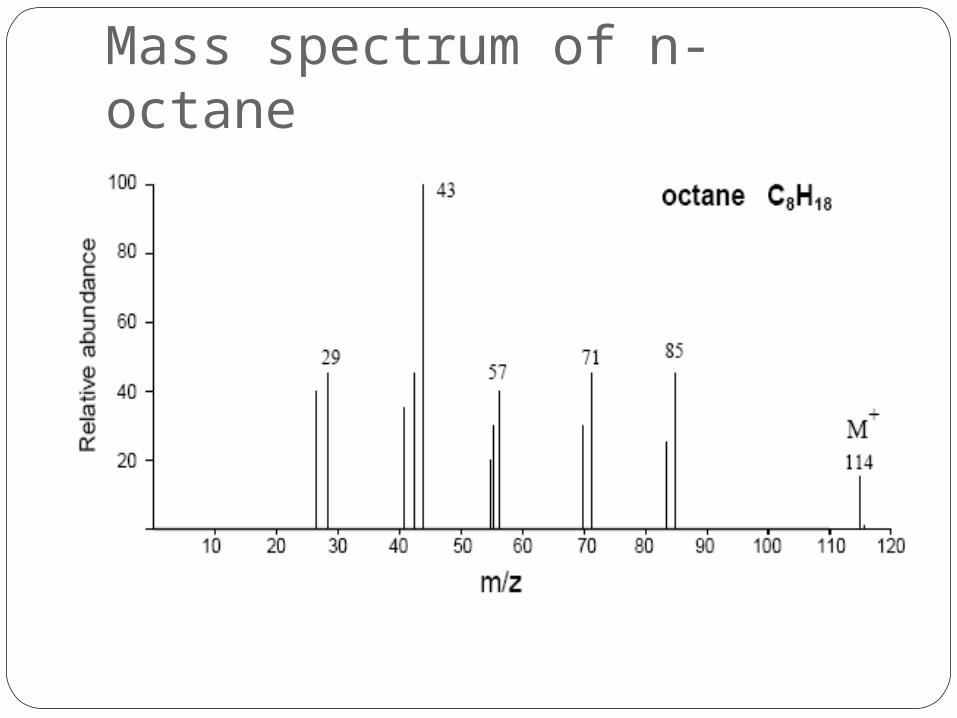
Mass spectrum of n-octane
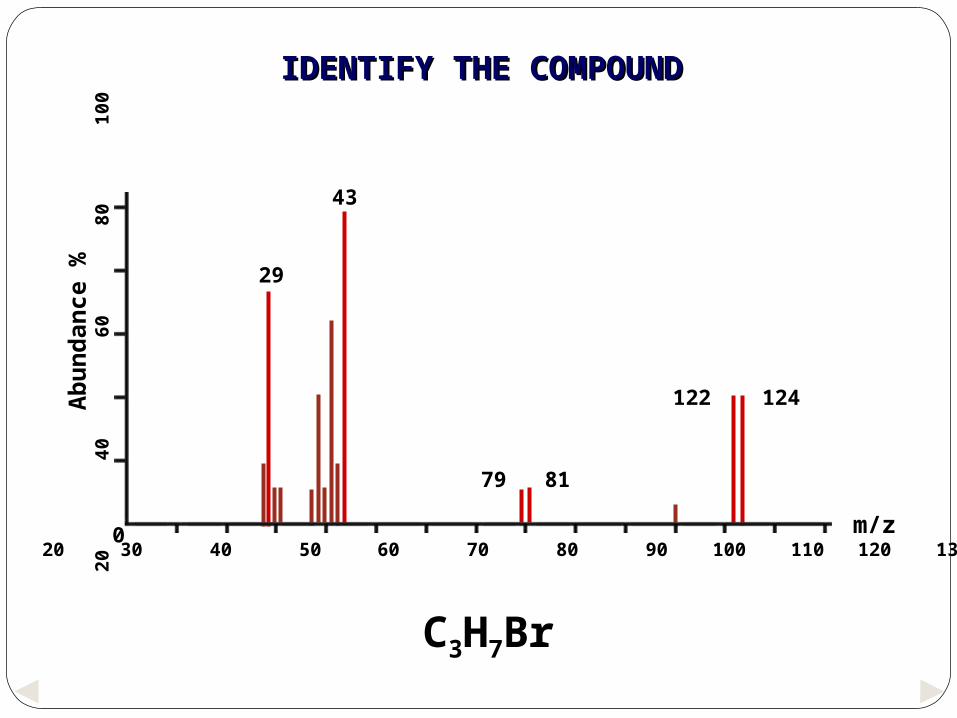
IDENTIFY THE COMPOUNDIDENTIFY THE COMPOUND
122 124
29
79 81
43
10 20 30 40 50 60 70 80 90 100 110 120 130 140 0 m/z
Ab
un
dan
ce %
20
40
6
0
80
100
C3H7Br
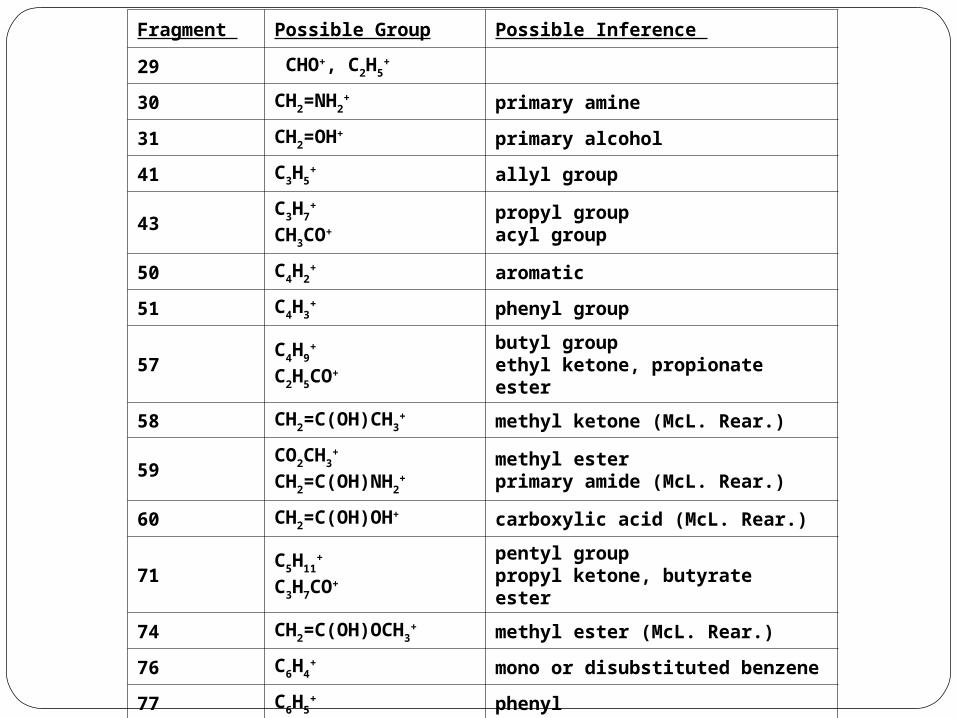
Fragment Possible Group Possible Inference
29 CHO+, C2H5+
30 CH2=NH2+ primary amine
31 CH2=OH+ primary alcohol
41 C3H5+ allyl group
43C3H7
+
CH3CO+
propyl group acyl group
50 C4H2+ aromatic
51 C4H3+ phenyl group
57C4H9
+
C2H5CO+
butyl group ethyl ketone, propionate ester
58 CH2=C(OH)CH3+ methyl ketone (McL. Rear.)
59CO2CH3
+
CH2=C(OH)NH2+
methyl ester primary amide (McL. Rear.)
60 CH2=C(OH)OH+ carboxylic acid (McL. Rear.)
71C5H11
+
C3H7CO+
pentyl group propyl ketone, butyrate ester
74 CH2=C(OH)OCH3+ methyl ester (McL. Rear.)
76 C6H4+ mono or disubstituted benzene
77 C6H5+ phenyl
85, 99 CcH2c+1+ benzyl group
91 C7H7+ alkyl group
105 C6H5CO+ benzoyl group
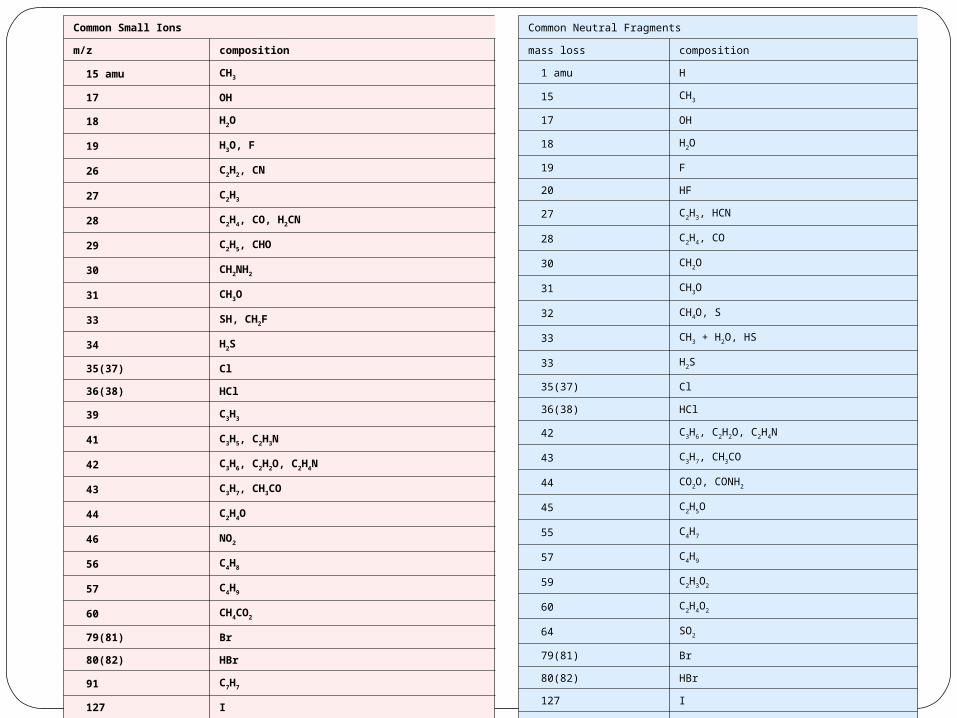
Common Small Ions
m/z composition
15 amu CH3
17 OH
18 H2O
19 H3O, F
26 C2H2, CN
27 C2H3
28 C2H4, CO, H2CN
29 C2H5, CHO
30 CH2NH2
31 CH3O
33 SH, CH2F
34 H2S
35(37) Cl
36(38) HCl
39 C3H3
41 C3H5, C2H3N
42 C3H6, C2H2O, C2H4N
43 C3H7, CH3CO
44 C2H4O
46 NO2
56 C4H8
57 C4H9
60 CH4CO2
79(81) Br
80(82) HBr
91 C7H7
127 I
128 HI
Common Neutral Fragments
mass loss composition
1 amu H
15 CH3
17 OH
18 H2O
19 F
20 HF
27 C2H3, HCN
28 C2H4, CO
30 CH2O
31 CH3O
32 CH4O, S
33 CH3 + H2O, HS
33 H2S
35(37) Cl
36(38) HCl
42 C3H6, C2H2O, C2H4N
43 C3H7, CH3CO
44 CO2O, CONH2
45 C2H5O
55 C4H7
57 C4H9
59 C2H3O2
60 C2H4O2
64 SO2
79(81) Br
80(82) HBr
127 I
128 HI
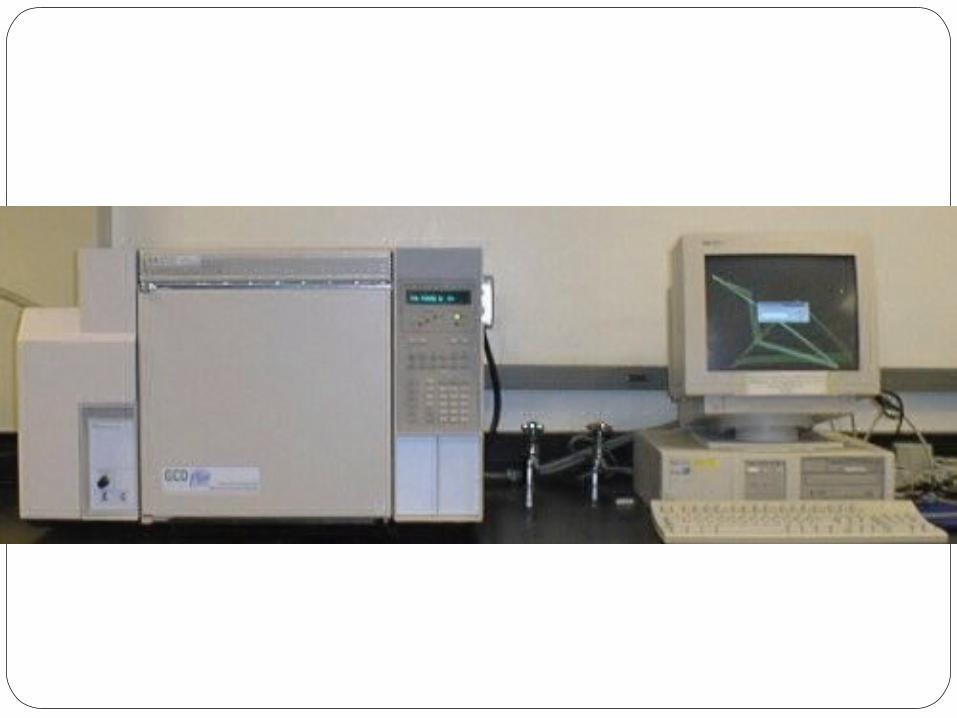
APPLICATIONSBy coupling a GLC in conjunction with a
mass spectrometer, rapid analysis of complex mixtures is possible.
This is particularly useful for determining the products and relative yields from organic reactions and for monitoring industrial processes.
Mass spec. are suitable for analyzing volatile compounds.
It can also be used to analyze proteins and polypeptides. This is achieved by methylating the –N-H groups which disrupts the HB, hence more volatile. This allows a very rapid method of determining the a. a sequence in the molecules.
This technique is usually computer-linked and has the advantage that very small quantities are required and sequences of amino acids may be rapidly established.