mass media and public policy: global evidence from...
TRANSCRIPT
Mass Media and Public Policy:
Global Evidence from Agricultural Policies
Alessandro Olper Department of Agricultural, Food and Environmental Economics
Università degli Studi di Milano [email protected].
Johan F.M. Swinnen
LICOS Centre for Institutions and Economic Performance University of Leuven (KUL)
Contributed Paper prepared for presentation at the International Association of Agricultural Economists Conference, Beijing, China, August 16-22, 2009
Copyright 2009 by [Alessandro Olper and Jo Swinnen]. All rights reserved. Readers may make verbatim copies of this document for non-commercial purposes by any means, provided that this copyright notice appears on all such copies.

2
Mass Media and Public Policy:
Global Evidence from Agricultural Policies
Alessandro Olper* and Johan F.M. Swinnen**
Version: 25 June 2009
Abstract Mass media plays a crucial role in information distribution and thus in the political market and public policy making. Theory predicts that information provided by mass media reflects the media’s incentives to provide news to different types of groups in society, and affects these groups’ influence in policy-making. We use data on agricultural policy from 67 countries, spanning a wide range of development stages and media markets, to test these predictions. We find that, in line with theoretical hypotheses, public support to agriculture is strongly affected by the mass media. In particular, an increase in the share of informed voters, and a greater role of the private televisions in society is associated with policies which benefit the majority more: it reduces taxation of agriculture in poor countries and reduces subsidization of agriculture in rich countries, ceteris paribus. The evidence is also consistent with the hypothesis that increased competition in commercial media reduces transfers to special interest groups and contributes to more efficient public policies.
JEL classification: D72, D83, Q18 Keywords: Mass Media; Media Structure; Information; Agricultural Protection; Political Economy
* Department of Agricultural, Food and Environmental Economics, Università degli Studi di Milano,
[email protected]. ** LICOS Centre for Institutions and Economic Performance, University of Leuven (KUL),

3
Mass Media and Public Policy:
Global Evidence from Agricultural Policies
1. Introduction
There is a rapidly growing literature on the economics of the mass media, leading to a
series of important new hypotheses and insights in an area which for a long time was
neglected by economists (McCluskey and Swinnen, 2008). An important part of this
literature concerns the role of mass media in political markets and its effect on public
policy-making. Most of this literature on the relationship between mass media and
public policy is theoretical. A few empirical studies have tried to assess the effect of
media on policy outcomes. Some key findings from this literature suggests that access
to mass-media empowers people politically and, as such, increases their benefit from
government programs (Strömberg and Snyder, 2008). This influence has been found for
different types of government programs and different countries, such as unemployment
relief in the United States (Strömberg, 2004b), public food provision and calamity relief
in India (Besley and Burgess, 2001, 2002), and educational spending in Uganda and
Madagascar (Reinikka and Svensson, 2005; Francken et al., 2009). All of these studies
measure the effect within a single country, which has the benefit of keeping many other
factors fixed but has the potential disadvantage of having limited variation in policy and
media.
Our paper wants to contribute to this empirical literature by analyzing the
impact of mass media on policy-making for a specific type of policy across a wide
variety of countries and years. We use a new dataset which has been produced by the
World Bank which includes measures of agricultural subsidization and taxation for a
4
much wider set of countries and longer period of time than has been available before
(Anderson and Valenzuela, 2008). We use these data as dependent variables.
Agricultural policy (subsidization or taxation) is an excellent policy instrument
to study the impact of media on policy choice across a wide variation of countries for
both empirical and theoretical reasons. Empirically, agricultural policy is an important
policy for governments in both rich and poor countries. In poor countries where
agriculture is a very important share of the economy and where food is a major
consumption item the importance of agricultural policy as a public policy issue is
obvious. However, also in rich countries agricultural policy remains disproportionately
important compared to the relatively small share of agriculture in terms of economic
output. For example in the EU, the Common Agricultural Policy continues to absorb
40% of the entire EU budget. Another symptom of this continued importance of
agricultural policy for rich countries is the stand-off in the current WTO negotiations
where disagreements over agricultural policies is now threatening to undermine the
entire WTO agreement.
Also from a theoretical perspective agricultural policy is an interesting case. The
literature on the political economy of agricultural policy identifies group size (the
number of farmers versus the number of food consumers in the economy) as an
important causal factor. Group size is argued to play an important role because it affects
collective action costs (based on Olson, 1965) and because it affects per capita costs
and benefits of agricultural policy, which then affects political outcomes in the presence
of voter information costs (based on Downs, 1957), or if political activities are
proportional to the size of the potential policy costs and benefits (Swinnen 1994).
Recent papers in the media economics literature claim that mass media can play an
5
important role in public policy, precisely by altering these political economy
mechanisms (Stromberg 2001, 2004a; Kuzyk and Mc Cluskey, 2006). In fact,
Oberholzer-Gee and Waldfogel (2005) argue that the link between group size and
political mobilization depends on the structure of media markets. In a series of
influential papers, Strömberg (2001; 2004a) has shown that competition among the
mass media leads to the provision of more news/information to large groups such as
taxpayers and dispersed consumer interests, altering the trade-off in political
competition, and thus influencing public policy. He refers to this outcome as ‘mass
media-competition-induced political bias’.
The purpose of our paper is to evaluate whether mass media has an impact on
the political economy of agricultural policies exploiting taxation and subsidization data
from 67 countries, observed from 1975 to 2004. The paper contributes to an emerging
literature analyzing whether the diffusion of free and independent media are key
ingredients to more efficient public policies. Besley and Burgess (2001, 2002) use a
political agency model to show that having a more informed and politically active
electorate increases the incentives for a government to be responsive. Prat and
Strömberg (2005) show, for Sweden, that people who start watching commercial TV
news programs increase their level of political knowledge and their political
participation. Overall, this and other evidence support the idea that mass media
weakens the power of special interest in lobbies relative to unorganized interests.
The paper also contributes to the literature on the political economy of
agricultural policies. While there is an extensive literature, both theoretical and
empirical, on what determines agricultural policy-making (see de Gorter and Swinnen

6
(2002) and Swinnen (2009) for surveys), no study so far has looked at the role of the
media in this process. Our paper is the first to do so.
Our analysis, exploiting both the across-countries and time-series variation in
the data, indicates that mass media may have a substantive impact on public policy
towards agriculture. In the developing world, agricultural taxation is reduced by the
presence of mass-media, while in developed countries agricultural support is reduced.
A key implication of our results is that by increasing government accountability,
competition in the media market will reduce distortions in agricultural policy.
2. Conceptual framework
In this section we first present a theoretical framework based on Strömberg’s
(2004a) model of mass media and political competition. Then we discuss the main
implication of the model in the light of the worldwide characteristics and regularities on
agricultural policies. Next, we identify testable hypotheses about the effect of mass
media competition on agricultural policy outcomes.
2.1 Theory
Two parties, L and R, make binding announcements about the amount zs of
public money they plan to spend on each of S > 2 government programs. The two
parties set zs with the objective to maximize the number of votes. Given N = Σ ns the
total number of voters, and ns the voters in group s who benefit from the program s, the
assumption is that each voter benefits from exactly one program. Government spending
is constrained by the usual budget rule, Σ nszs ≤ I, with I the total budget.

7
Two media firms, A and B, called, for simplicity, newspapers, are the only
channel through which the parties’ platforms are announced to the voters. The media
firms allocate the space quantity, qA and qB, on the S spending levels, with the objective
of maximizing the number of readers, identical to N voters. Each voter buys only one
newspaper, A or B, and, by reading it, will develop some expectations concerning party
spending; they will then vote for party L or R (no abstention). The party that wins the
election implements the promised expenditure plan.
Voters are assumed to use the media information from newspapers to fully
realize the potential gains embedded in the government program. Thus, more precise
information on future policies increases the probability that voters will choose the right
action. Specifically, voters realize utility ui(zs) = θi u(zs) from the program, when
information on zs is known in advance. On the contrary, uniformed voters receive the
utility ui(zs) = θi u(zs) − vs, where vs is the (exogenous) utility loss. The parameter θi
captures the idea that the program can be more valuable to some individuals than to
others.
It is assumed that all the voters who use program s have an incentive to read any
article they find on zs, while voters that do not use program s do not read the relevant
articles. Thus, the probability that a reader will spot some news in the newspaper, ρ,
increases with the space allocated for this news, but at decreasing rate: ρ′ (qs) > 0, ρ′′
(qs) < 0. Next, by denoting the expected utility from a newspaper with news profile q to
a reader in group s as ws (qs) = ρ (qs) vs, we have w′s (qs) > 0 and w′′s (qs) < 0.
The reader’s newspaper evaluation also depends on other (exogenous) fixed
characteristics, like ideology, captured by parameters ai and bi. The news profile of

8
newspapers A and B then give expected utility ws (qsA) + ai and ws (qs
B) + bi
respectively to the voter i using program s. The voter buys newspaper A when Δws = ws
(qsA) − ws (qs
B) ≥ bi − ai, and newspaper B otherwise. The newspapers assign a
probability distribution Gs (⋅), with density gs (⋅), to the difference bi − ai. The
probability the newspaper attaches to individual i reading newspaper A is Gs (Δws).
The newspapers have the same cost function, with newspaper A’s expected cost
function, C, assumed as the following linear form
( ) ∑ +=s
Asq
BA qcqqC , ∑ Δs
ssss cwGn ,][ (1)
first copy costs reproduction/distribution costs
where cq is the cost of producing one unit of news space, and cs is the average cost of
reproducing and delivering a newspaper to readers in group s. This costs function
summarize the idea of a media firms that operate under increasing return to scale, and is
central to the key result of the model. In fact, in the media industry the first copy of a
product (TVs program or newspaper) have high fixed costs, differently the additional
costs of distributing and delivering it is very small.
Let ps be the increase in marginal profit from selling an additional newspaper to
a voter in group s. This includes the price of the newspaper plus the price per reader in
group s paid for by advertisers, minus the average cost of reproducing and delivering a
newspaper to a person in group s. The expected profit function of newspaper A is then
( ) [ ] ∑∑ −Δ= Asqssss
A qcwGnpE π . (2)

9
Under this setting, Strömberg (2004a) shows that the Nash Equilibrium in the
competition between the two newspapers implies that the ratio w′s (qsA)/w′s (qs
B) = 1 for
all s, and both newspapers set the same news profiles, qA = qB. For all s, the equilibrium
condition is
qssss cqvpn =)(' *ρ . (3)
Relation (3) defines the equilibrium news profile, qs*, as a function of several variables.
More specifically, qs* will be higher for groups more valuable for advertising, groups
with a higher private value of news and for news that concerns large groups.
How do these results affect policy bias in the political market ? Assume that a
voter i derives utility ui (zsL) + li and ui (zs
R) + ri from the implemented platform of
parties L and R, respectively; with li and ri describing preferences for other fixed
policies or candidate characteristics. The model assumption is that the voters are unable
to resolve a unique political equilibrium spending level, which thus makes media
information concerning these spending levels valuable to them. Thus, voter i votes for
party L if Δui = Ei [ui (zsL) − ui (zs
R)] ≥ ri − li, and for party R otherwise. Voters
informed about party policy announcements have Δui = ui (zsL) − ui (zs
R), which
represents the differences in the party platforms. Instead, for the uninformed voters,
iuΔ remains constant as it is independent from party announcements.
Political parties, in maximizing the chance of re-election, assign a probability
distribution Fs to the difference ri − li. The probability that individual i votes for party L
is Fs [Δui]. Thus, the expected number of voters for party L is given by

10
( ) [ ] ( ) [ ]∑ Δ−+Δ=i
ississL uFuFnE ρρ 1 . (4)
At equilibrium, parties L and R equate the ratio between average marginal utility u′s
(zsL)/u′s (zs
R), for all s. It follows that both parties will set the same platform, i.e. zsL = zs
R
= zs*, for all s, and for some constant λ > 0, λρ sssss nzuqn =′ )()( ** .
This equilibrium condition implies that the equilibrium spending levels equate
marginal utilities weighted by the share of voters in the group who find news on
election platforms. As a corollary, it follows that equilibrium spending on program s,
zs*, is increasing in the share of informed voters, ρs, the size of the group, ns, the
revenue per reader in the group, ps, and the private value of news, vs:
),,,(**sssss vpnzz ρ= . (5)
In summary, the media competition will induce a policy bias towards large
groups because the voters in these groups are more informed, since the mass media
targets these groups. It is important to note that the size of the group, ns, as well as the
revenue per reader in the group, ps, only affect spending via the media market. Put
differently, the bias towards large groups is indirect, and only a consequence of media
competition.
11
2.3 Implications for agricultural policy
The most important stylized fact about agricultural protection and support is the
so called ‘development paradox’, namely the taxation-protection switch of agriculture
associated with economic development.1 The classic interpretation for this pattern is
that, on moving from developing to industrialized countries, the farm groups, compared
to the consumer and taxpayer groups, become more effective in collective action, as a
consequence of the smaller farm numbers and the lower communication and
transportation costs inherent in industrial development, all factors that reduce
organizational costs and free rider problems for collective action (Olson, 1965).
Moreover, since the per capita cost on the rest of society falls with less farmers, the
opposition of taxpayers and consumers to (agricultural) subsidies decreases as the
number of farmers decreases with economic development (Becker, 1983; Swinnen,
1994; Anderson 1995).
The model developed here suggests that the relationship between agricultural
protection and economic development will be affected by the introduction of media
competition in the political market. Voter preferences and government policies will be
affected by how the media industry provides information to the people. The key
prediction of the model is that, ceteris paribus, government transfers like agricultural
protection should, as an effect of media competition, be biased toward large groups2.
Because the agricultural group is relatively large in poor countries and relatively small
in richer ones, an important implication of the model is that, all other things constant,
1 See Anderson (2008) for recent evidence. 2 Interestingly, this prediction goes exactly in the opposite direction with respect to the traditional political economy model that does not consider the effect of media bias, like the Becker (1983) and the Swinnen (1994) models. In fact, in those models government transfers tend to be biased toward small groups, in line with the well known ‘paradox of numbers’ of Marcur Olson (1965).

12
the effect of media competition on agricultural protection should be different in poor vs.
rich countries. More specifically, we expect that the impact on agricultural protection
induced by mass media competition should be positive in poor countries, and negative
in rich countries. Thus, we can formulate the following key empirical prediction:
Hypothesis 1: Mass media-competition-induced political bias should reduce
agricultural protection in rich-(developed) countries, but it should increase it in poor-
(developing) countries, ceteris paribus.
The empirical test of the prediction above is the main focus of the next sections
of the paper. Nevertheless, the above hypothesis comes from a model where the mass
media companies maximize profit, disregarding that the objective function of state vs.
commercial media could be different. For example, Prat and Strömberg (2005) show
that a shift from state-control to private-control of TV news, attract viewers previously
undersupplied with information and contribute to increase both voter information and
political participation. Hence, also changes in media structure may have important
implications for public policy.
We consider two different assumptions about the behavior of state media (Prat
and Strömberg, 2005): (i) the public media is unbiased and/or the bias is randomly
distributed across countries or, (ii) the public media reflects the political optimum for
the government in the absence of commercial media, as the government control causes
the public media to present the governments preferences.
The first assumption, normally used in existing theoretical comparisons between
state TV and commercial TV, is based on the idea that the former is managed by a
13
social planner (see Anderson and Coate, 2005). This translates into a situation where
the state media-induced political-bias is zero. Thus, an increase in private media should
benefit agricultural groups in poor countries (who are taxed) and urban groups in rich
countries (who are taxed), as these groups are the targets of profit maximizing media.
Under the second assumption, when the media is controlled by the state, there is
bias towards government preferences. In agricultural policy, government preferences
are biased to favor urban interest in poor countries and agricultural interests in rich
countries. Hence, an increase in the share of commercial media should reinforce the
effect of hypothesis 1 by increasing the information available and the political
participation of (large) groups of voters who, under the mass media state monopoly,
had less information. In summary, this leads to the following empirical prediction:
Hypothesis 2: An increase in the share of private (state) media should be associated
with higher (lower) agricultural protection in poor countries, and with lower (higher)
protection in rich ones, ceteris paribus.
3. Data and empirical specification
We test our predictions on a sample of about 67 developing and developed
countries observed from 1975 to 2004. Overall, we have more than 1,600 observations
but the panel structure is unbalanced, due especially to the partial time coverage of
transition countries where, the starting year observation is, for obviously reasons,
around the 1992.
3.1 Dependent variable
14
Our dependent variable is the relative rate of assistance (rra) to agriculture,
calculated as the ratio between the agricultural and non-agricultural nominal rate of
assistance: rra = [(1 + nraag)/(1 + nranonag) −1], where nraag is the nominal assistance to
agriculture and nranonag is the nominal assistance to non-agricultural sectors. The nraag
measures the total transfer to agriculture as a percentage of the undistorted unit value. It
is positive when agriculture is subsidized, negative when it is taxed and 0 when net
transfers are zero (see Anderson and Valenzuela 2008 for calculation details). One of
the key advantages of using rra (instead of nra) as our dependent variable is that,
especially in developing countries, an important indirect taxation source for agriculture
is the positive protection given to the manufacturing sector as an effect of import-
substitution policies. Thus, rra is a more useful indicator in undertaking an
international comparison of the extent to which a country’s policy regime has an anti-
or pro-agricultural bias.
3.2 Mass media variables
To test the predictions about the effect of the mass media on agricultural policy
we needed data on both the share of informed voters, ρs, and on the state vs. private
structure of the media markets. The share of informed voters, ρs, is proxied using two
alternative media variables: the penetration of TV sets and Radios. More specifically,
our media variables are based on the natural logarithm of TV sets and Radios per 1000
inhabitant, based on data from the Arthur S. Banks Cross National Time-Series Data
Archive. The rationale for using these proxies comes from the argument that, while the
share of informed voters, ρs, is not observed, we in fact observe the share of media
15
users, rs(qs), that is increasing in news coverage qs. Because rs, ρs and qs move in the
same direction, it is sufficient to look at the levels and changes in the share of media
users, rs, to test the effect of media bias (see Strömberg, 2004b). Moreover, in our
specific contest, another justification for the use of these indicators derive from the
Strömberg’s consideration that “the emergence of broadcast media increased the
proportion of rural and low-education media consumers as it became less expensive to
distribute radio waves than newspapers to remote areas, and as these groups preferred
audible and visual entertainment to reading. As politicians could reach rural and low-
education voters more efficiently, the model predicts an expansion in programmes that
benefit these voters” (2004, p. 266).
The variable characterizing the structure of the media market is based on the
Djankov et al (2003) media ownership data set. This paper examines the patterns of
media ownership in 97 countries around the world, disentangled from state and private
ownership of both newspaper and broadcasting media. From this data set, we use the
top five shares of private television (tvpsh) under the plausible hypothesis that
ownership shapes the information provided to voters and consumers. Of course, as
suggested by Djankov et al (2003), ownership is not the only determinant of media
content, as in many countries government regulates private media. Thus, our
identification assumption is correct only if government regulations do not, in our
sample, strongly bias the information coverage of private TVs.
The share of private TVs refers to 1998-99. Thus in regressions testing the
effect of media structure the panel start in 1994, or later. In doing so we are assuming
that the media structure remains quite stable over the observed period, as suggested by
Djankov et al (2003). However, the same authors highlight that timing could be an

16
issue, especially in transition economies where many media enterprises were privatized
during the transition period or have increasing rates of foreign ownership. To reduce
this potential source of bias the time coverage for these countries in these additional
regressions will start in 1996 or later, thus six years from the initial transition period.
Moreover we also control for the status of transition country through a regional
dummy.
Finally, to reduce potential bias induced by differences in government control
and regulation of private TV, we also use in some regressions an index of press media
freedom. It assumes values equal to 0, 0.5 and 1 for countries that are respectively not-
free, partially-free and free, based on information taken from Freedom House.
3.3 Other variables
In the empirical specifications we include, apart from the mass media variables
discussed above, additional controls that are likely to affect the level of agricultural
protection, as suggested by previous literature. Specifically, we start with a
parsimonious specification where, as structural control, we include only the level of
development, gdppc, measured by the real per capita GDP in PPP taken from the World
Bank, World Development Indicators. The inclusion of the level of development allows
us to control for the so-called ‘development paradox’ – namely the strong positive
correlation between agricultural protection and per capita GDP – that represents one of
the most important stylized fact about agricultural protection patterns (see Swinnen,
1994; Anderson, 1995). The second key covariate is the share of agricultural
employment, emps, based on Food and Agriculture Organization (FAO) data. The

17
inclusion of the agricultural employment share acts as a control for the well known idea
that small groups normally receive more protection and support.
Next we tested the robustness of our finding by adding to the specifications
other controls like proxies for comparative advantage, and political institutions.
Specifically, to control for comparative advantage we include the agricultural land per
capita, landpc, and the agricultural export share, exps, measured as net-export over
production. These two variable are based on data from FAO and World Bank
Agricultural Distortions database. Finally, we proxy for political institutions by adding
the Polity2 index of democracy taken from the Polity IV data base. This index assigns a
value ranging from -10 (autocracy) to +10 (democracy) to each country and year, with
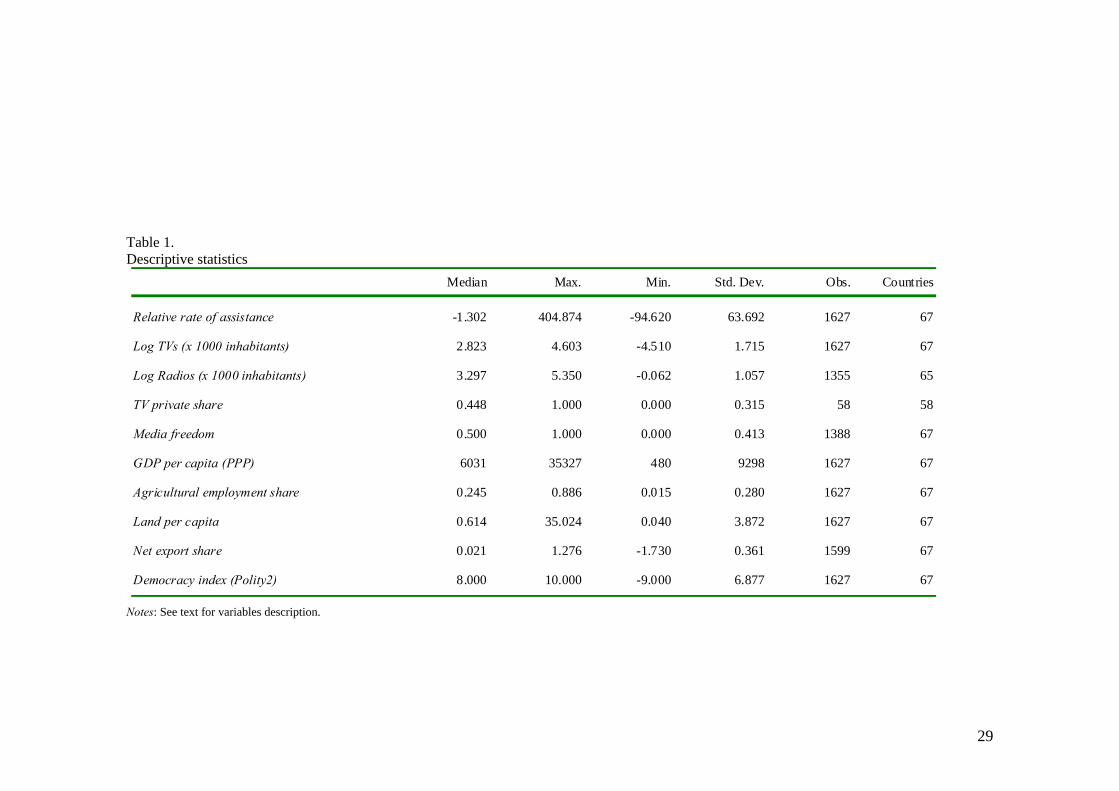
higher values associated with better democracies. Table 1 shows summary statistics of
the variables used in the empirical section of the paper.
4. Econometric strategy and results
The hypotheses put forward in section (2.3) emphasize that the relationship
between media variables and agricultural protection is conditional upon the level of
development. In countries with low gdppc, media variables and agricultural protection
should be positive related, but when the gdppc is high there should be an inverse
relationship between these two variables. A priori, we do not know at what level of
gdppc the relationship changes sign. The following general specification takes care of
this issue allowing the data to tell us, endogenously, the exact gdppc value of the
turning point:
itititititit εgdppcαgdppcmediaαmediaααrra +++×++= 3210 βXit (6)
18
where rrait is our indicator of relative agricultural protection in country i and year t,
mediait refers to the media variable of interest, and X is a vector of additional controls.
Taking the partial derivative of rra with respect to the media variable we have
itit
it gdppcααmedia
rra21 +=
∂
∂ (7)
Given our hypotheses we expect that α1 > 0 and α2 < 0, such that α1 + α2 gdppc is
positive or negative as gdppc is higher or lower gdppc* with gdppc* = α1/–α2 the
critical turning point level of development at which our media-protection relationship
change sign. Note that, a key requirement for the prediction to hold is that gdppc*
should lie within the range of values of gdppc in the dataset, namely gdppcMAX >
gdppc* > gdppcMIN.
Regarding identification issues, our main concern is omitted variable bias.
Indeed, if media variables are correlated with unobserved determinants of protection
level, then our estimates will be inconsistent. Note that, a priori, the direction of the
bias is not predictable. This potential issue is complicated by the fact that our media
structure variable, tvps, is time invariant. For that reason, we decide to start estimating
separately the two hypotheses. Specifically, in testing the hypothesis 1 we treats
differences in media structure as unobserved fixed effects, thus running fixed effects
specifications that control for both country and time heterogeneities. This strategy
allow also to better understand which kind of sample variation – across or within
countries – are driving the media-development-protection-effect hypothesis. However
in a final section we propose an extension taking care also of our hypothesis 2, by
testing the effect of media structure on agricultural protection.

19
4.1 The effect of media penetration
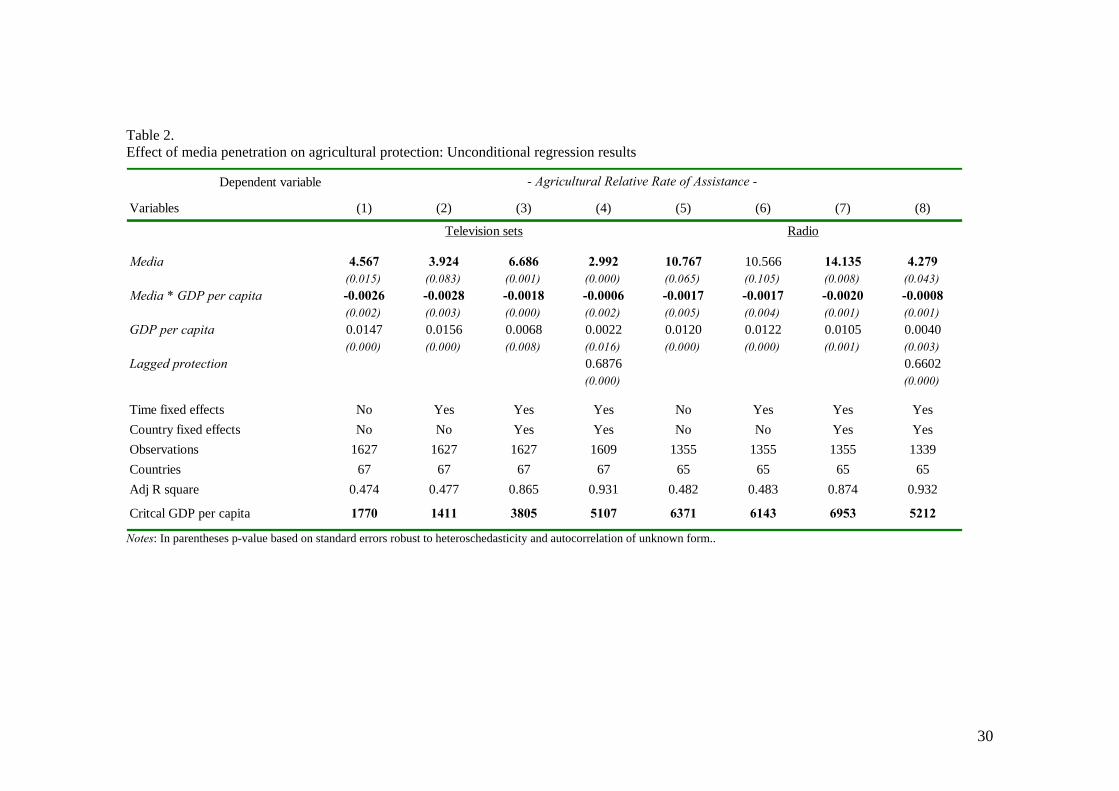
Table 2, reports estimates of (6) without any additional control other than the
media variable, per capita GDP, and the interaction term between them. Columns (1)–
(4), use as media variable TVs penetration, while columns (5)–(8) Radios penetration.
The pooled OLS specification in column (1) yields statistically significant media
coefficients for both the linear and the interaction effect. A positive sign on the linear
term and a negative one on the interaction effect means that the penetration of TV sets
increase protection at low level of development, but decrease it when a certain amount
of economic development is reach, a results totally consistent with our prediction. The
critical turning point of the media-development-protection relationship is a per capita
GDP of 1,770 US dollars. Thus, while it is quite far from the median value, equal to
about 6,000 US dollars, it lies largely within the range of the distribution (see Table 1).
In Column (2) we control for global shocks adding time fixed effects. The media
coefficients are now less precise estimated especially with regard to the linear term (p-
value = 0.08). Although the estimate is still significant, the time fixed effects model
reduce both the magnitude of the coefficients and the critical turning point, suggesting
that the media effect seems especially driven by within country variation in the data.
This is largely confirmed in column (3) where we isolate the within media effect adding
a vector of country fixed effects. Now the media coefficients increase in both (absolute)
magnitude and significant level (p-value < 0.01) and, moreover, the critical turning
point (about 3800) is now more close to the median value.
In column (4) to check for robustness, we display results of a dynamic version
of the equation (6), estimating autoregressive specifications that control for persistency

20
in agricultural protection.3 As expected the magnitude of media coefficients shrink
substantially as the protection dynamic is now largely captured by the lagged dependent
variable, showing that actual protection is a strong predictor of future protection.
However what is interesting here is that the significant level of media variables is still
very high (p-value < 0.01) and the critical turning point increase substantially, been
now very close to the median value.
In columns (5)–(8) of Table 2 we repeat the same exercise for Radios
penetration. In these regressions we lost some observations as the country and time
coverage for Radios is lower than for TVs. Overall, the findings for Radios are similar:
Radios penetration significantly increase protection in countries with a level of
development, approximately, below 6,000 US dollars, but it reduce protection when per
capita GDP is above this critical level. Thus, this patterns are strongly consistent with
our hypothesis, with the only qualification that for Radios penetration the precision of
the estimate in some regressions is lower than for TV regressions, but still remarkable
high.
Quantitatively, the estimated marginal impact of our media variables on
protection, based on the estimated coefficients from columns (4) and (8), ranges from
2.7 (4.01) for the poorest country in 1975, to –18.3 (–22.7) for the richest country in
2004, for TVs sets and Radios, respectively. Since the standard deviation of the (log)
TVs and Radios penetration is about 1.72 and 1.05, the estimates imply that a one-
standard-deviation increase in our media variables would affect the typical country’s
protection level on impact by a magnitude of around 18 percent for TVs and 14 percent
3 Note that, although the joint presence of fixed effects and the lagged protection level could yield inconsistent estimates, our large time period (22 years for the average countries) strongly reduces this potential source of bias.

21
for Radios (negatively for rich countries and positively for poor ones). Thus our media
effect is not only statistically significant but also relevant from an economic point of
view.
4.2 Conditional effect results
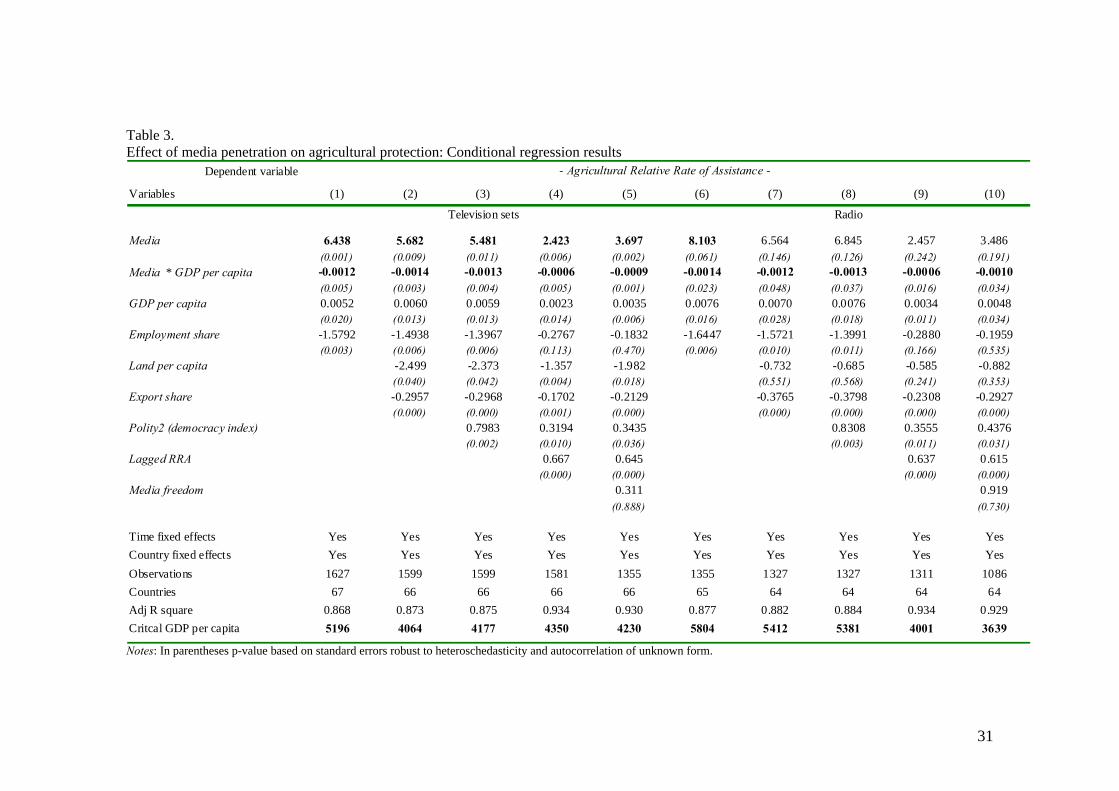
The empirical literature has considered numerous variables to explain cross-
country differences in agricultural protection. Thus in Table 3 we report regressions
that control for standard protection covariates. The main objective here is to asses the
robustness of our finding, as well as to explore (potential) channels through which our
media variable exert its effect on protection.
In Column (1) we control for the share of agricultural workers and the media
variable considered is TVs penetration. Its estimated coefficient is, as expected,
negatively and significant. Most importantly the media coefficient and its interaction
term retains significance at the 1% level, suffering only a slight (absolute) reduction in
magnitude (compare column 3 of Table 2). In column (2) we control for comparative
advantage using land per capita and the agricultural net export share. In line with
previous works, comparative advantage variables enter with significantly negative
coefficients. The coefficients on media variables remain significantly at 1% level,
however now especially the linear term suffer a reduction of about 11% and, as a result,
the critical turning point shrink some what.
In columns (3) and (4) we control for democratic institutions and policy
persistence, respectively. Controlling for democracy appears important here, as a
potential reason for the above results is that our media variables are capturing the effect
of (omitted) political institutions that are themselves important determinants of policy

22
outcomes (see Persson and Tabellini, 2003). The Polity2 index of democracy is positive
and strongly significant (p-value = 0.002). This evidence are consistent with other
studies who find that democratization have a causal positive effect on agricultural
protection (see Olper and Raimondi, 2009). Important for our analysis, the inclusion of
the democracy index has only a minor effect on the media coefficients. A similar
pattern emerge controlling for persistency in protection with the only qualification that
now the coefficient of relative size of the agricultural group shrink substantially and is
insignificant. Finally, in column (5), we control for the degree of media freedom to
reduce the potential bias induced by differences in government control and regulation
of the mass media. The media freedom coefficient is positive but insignificant and, if
any, increase some what the absolute magnitude and significance level of the media
coefficients.4
Next, column (6)-(10) repeat the same battery of regressions using as media
variable Radios penetration. The overall results are similar, in the sense that once again
the mass media linear term exert a positive effect on protection, and its interaction with
per capita GDP turn out to be negative. However, the regression results when Radios is
used as media variable are weaker. Indeed, once comparative advantage and other
controls are added to the specification, only the media interaction effect retains its
significant level, while the linear term do not. Note however that in almost all
specifications the estimated media coefficients are jointly significant at usual critical
level (Wald test).
4 Note that the increase in the absolute magnitude of the media coefficients in regression (5) (as well as in regression (10)) is partially due to the reduction of the overall observations of the sample.
23
Summarizing, the evidence discussed above on the effect of the mass media-
competition-induce political bias on agricultural protection gives a strong overall
support to our argument. The share of informed voters, here proxied by the TVs and
Radios penetration, positively affect agricultural protection in ‘poor’ developing
countries, and have a negative effect on protection in countries with higher
development levels. In the ‘low’ income countries sample the average level of
protection is negative. Therefore these results also indicate that mass media induce an
overall reduction of agriculture policy distortions. Finally, the results also suggest that
the media bias exerted by TVs on agricultural protection significantly dominate that of
Radios.
4.2 Extension: the role of the media structure
The above evidence comes from a model where mass media companies
maximize profit. However, many countries in our dataset have also state controlled
media. Thus, understanding how the media owner structure affects the mass media-
protection relationship (our hypothesis 2), represents a natural extension of the analysis.
We test this additional prediction following exactly the same strategy than before, with
the only differences that now the country fixed effect (when included) are substituted
by regional fixed effects. Moreover as our proxy for the share of private Television,
tvpsh, is measured around 1998-1999, we are forced to work with a shorten panel
starting in 1994.
Columns (1) of table (4), reports unconditional pooled regressions. Both the
linear and the interaction effect are significant and with their expected signs. The share
of private TVs affects protection positively for per capita GDP below 7,451 US dollar,

24
and negatively for per capita GDP above this critical level. The inclusion of time
(Column 2) and regional (column 3) fixed effects, leave the results totally unaffected. A
similar pattern emerges when we add all the other standard covariates to the
specification.
Next, a fundamental question is now to understand if the share of private TVs
and its interaction effect with per capita GDP, are capturing an independent effect of
the media structure on agricultural protection or, differently, they are simply proxy for
the (omitted) effect induced by the media penetration. Indeed, the share of private TVs
present a positive correlation (r = 0.40) with the penetration of TV sets.
To address this potential source of bias, in column (5) we add to the regression
also this last variable and its interaction effect with per capita GDP. Their estimated
coefficients are positive for the linear term and negative for the interaction term,
although barely significant,5 and have an order of magnitude virtually identical to the
fixed effects regression reported in Table 3 (see column (3)). Most interesting,
however, is the fact that the estimated coefficients of private TVs share and its
interaction term are virtually unaffected, suggesting that these variables are capturing
an independent effect of the media structure on agricultural protection.
As a further check on the results, Column (6) and (7) run two separate
regressions, using the estimated critical GDP per capita (8,721) of column (5) as the
break point between ‘poor’ (GDP per capita below 8,721) and ‘rich’ (GDP per capita
above 8,721) countries. Thus in these regressions our media variables are introduced
5 There are two good reasons for the lost of significance of this effect. First, as show before the hypothesis 1 hold especially within countries, a dimension largely lost in the short panel of table 4; second there are obviously some collinearity between TVs penetration and the share of private TVs. Indeed, if we run the same regression omitting the TVs private share variables, then the TVs penetration coefficients turn out to be significant at 5 percent level.

25
linearly. The results are that the estimated media coefficients in the ‘poor’ country
regression are significant positive, while they are negative and significant in the ‘rich’
country regression. Thus, this piecewise-linear form tells as a similar story to that found
in the representation that includes interaction between media variables and per capita
GDP, confirming that the share of private TVs have an independent and significant
effect on agricultural protection, giving an overall support to our prediction.
Summarizing, keeping in mind data limitations that preclude less parsimonious
specifications, this section gives support the notion that agricultural protection is
affected by both the share of informed voters and the share of private television, but not
in a linear fashion. Both these media variables tend to increase protection (or reduce
taxation) in poor countries but strongly reduce it in rich ones, and, thus, reduce
distortions in all countries.
5. Concluding remarks
This paper provides evidence on the relationship between mass media
competition and agricultural protection for a large group of countries. Strömberg’s
(2004a) theory predicts that information provided by mass media reflects the media’s
incentives to provide news to different groups in society, affecting the groups’
influence in policy-making. As a consequence mass media competition will induce a
policy bias towards large groups because these groups are more informed voters as the
mass media target them.
We apply this theory to agricultural policy. This results in the hypotheses that
(a) the impact of mass media competition on agricultural policy will be conditional to
the level of development, and (b) that this effect is opposite to the so called
26
‘development paradox’ of agricultural policies. Thus, the traditional switch of
agricultural policy from taxation to subsidization which is associated with economic
development will be smoothed in the presence of mass media competition.
We use data on agricultural policy from about 67 countries, spanning a wide
range of development stages and media markets, to test these predictions. In line with
the theoretical hypotheses, we find that public support to agriculture is strongly affected
by TVs and Radios penetration, as well as by the structure of the mass media markets.
In particular, an increase in the share of informed voters, proxy by media penetration,
and a greater role of the private mass media in society is associated with policies which
benefit the majority more: it reduces taxation of agriculture in poor countries and
reduces subsidization of agriculture in rich countries, ceteris paribus.
This evidence is consistent with the idea that increased competition in
commercial media reduces transfers to special interest groups and contributes to more
efficient public policies, as a better informed electorate increases government
accountability.
References
Anderson, K. (1995). Lobbying incentives and the pattern of protection in rich and poor countries. Economic Development and Cultural Change 43(2), 401-23.
Anderson, K. (2008). Five Decades of Distortions to Agricultural Incentives, in Kym Anderson (ed.) Distortions to Agricultural Incentives, The World Bank, Washington, D.C.. (forthcoming).
Anderson, K., and Valenzuela E. (2008). Estimates of Distortions to Agricultural Incentives, 1955 to 2007. World Bank, Washington DC, forthcoming October. www.worldbank.org/agdistortions.
Anderson, S.P. and S. Coate, (2005). Market Provision of Broadcasting: A Welfare Analysis, Review of Economic Studies 72(4): 947-972.
27
Becker, G. S. (1983). A Theory of Competition Among Pressure Groups for Political Influence, Quarterly Journal of Economics, 98: 371-400.
Besley, T. and R. Burgess, (2001). Political Agency, Government Responsiveness and the Role of the Media, European Economic Review 45: 629-640.
Besley, T. and R. Burgess, (2002). The Political Economy of Government Responsiveness: Theory and Evidence from India, The Quarterly Journal of Economics 117(4): 1415-1451.
De Gorter, H. and Swinnen, J. (2002). Political economy of agricultural policy, in Gardner, B. and Rausser, G. (eds), Handbook of Agricultural Economics, Vol. 2B, 1893-1943.
Downs, A. (1957). An Economic Theory of Democracy, New York, Harper and Row.
Djankov, S., McLiesh, C., Nenova, T. and A. Shleifer, (2003). Who Owns The Media? Journal of Law and Economics 46: 341-381.
Francken, N., Minten, B. and J. Swinnen, (2009). Media, Monitoring, and Capture of Public Funds: Evidence from Madagascar, World Development, Vol. 37, No. 1: 242-255.
Kuzyk, P. and J.J. McCluskey (2006). The Political Economy of the Media: Coverage of the U.S.-Canadian Lumber Trade Dispute, World Economy 29(5): 637-654.
Lindbeck, A. and Weibull, J.W. (1987). Balanced-Budget Redistribution as the Outcome of Political Competition, Public Choice 52: 273-297.
McCluskey, J. and Swinnen, J. (2008). Media Economics and the Political Economy of Information. Chapter prepared for The Oxford Handbook of Business and Government, August 15.
Oberholzer-Gee, R. and J. Waldfogel (2005) Strengh in Numbers: Group Size and Political Mobilization, Journal of Law and Economics, vol. XLVIII: 73-91.
Olper, A. and Raimondi, V. (2009). Constitutional Rules and Agricultural Policy Outcomes, in Kym Anderson (ed.) Political Economy of Distortions to Agricultural Incentives, The World Bank, Washington, D.C.. (forthcoming).
Olson, M. Jr. (1965). The Logic of Collective Action. Public Goods and the Theory of Groups. Cambridge: Harvard University Press.
Persson, T. and Tabellini, G. (2003). The Economic Effect of Constitutions. Cambridge, The MIT Press.

28
Prat, A. and D. Stromberg. (2005). Commercial Television and Voter Information, CEPR Discussion Papers: 4989.
Reinikka, R. and Svensson, J. (2005). Fighting Corruption to Improve Schooling: Evidence from a Newspaper Campaign in Uganda, European Economic Review 3(2-3): 259-267.
Strömberg, D. (2001). Mass Media and Public Policy. European Economic Review 45: 652-663.
Strömberg, D., (2004a). Mass Media Competition, Political Competition, and Public Policy. Review of Economic Studies 71: 265-284.
Strömberg, D., (2004b). Radio’s Impact on Public Spending. Quarterly Journal of Economics 119: 189-221.
Strömberg, D. and Snyder, J.M. (2008). The Media’s Influence on Public Policy Decisions, in Islam, R. (ed.) Information and Public Choice. From Media Markets to Policy Making, The World Bank, Washington, D.C.: 17-31.
Swinnen, J. (1994). A Positive Theory of Agricultural Protection, American Journal of Agricultural Economics, 76(1): 1-14.
Swinnen, J. (2009). The Political Economy of Agricultural Distortions: The Literature to Date, in Kym Anderson (ed.), Political Economy of Distortions to Agricultural Incentives, Washington, DC: The World Bank. (forthcoming).
29
Table 1. Descriptive statistics
Median Max. Min. Std. Dev. Obs. Countries
Relative rate of assistance -1.302 404.874 -94.620 63.692 1627 67
Log TVs (x 1000 inhabitants) 2.823 4.603 -4.510 1.715 1627 67
Log Radios (x 1000 inhabitants) 3.297 5.350 -0.062 1.057 1355 65
TV private share 0.448 1.000 0.000 0.315 58 58
Media freedom 0.500 1.000 0.000 0.413 1388 67
GDP per capita (PPP) 6031 35327 480 9298 1627 67
Agricultural employment share 0.245 0.886 0.015 0.280 1627 67
Land per capita 0.614 35.024 0.040 3.872 1627 67
Net export share 0.021 1.276 -1.730 0.361 1599 67
Democracy index (Polity2) 8.000 10.000 -9.000 6.877 1627 67
Notes: See text for variables description.
30
Table 2. Effect of media penetration on agricultural protection: Unconditional regression results
Dependent variable
Variables (1) (2) (3) (4) (5) (6) (7) (8)
Media 4.567 3.924 6.686 2.992 10.767 10.566 14.135 4.279(0.015) (0.083) (0.001) (0.000) (0.065) (0.105) (0.008) (0.043)
Media * GDP per capita -0.0026 -0.0028 -0.0018 -0.0006 -0.0017 -0.0017 -0.0020 -0.0008(0.002) (0.003) (0.000) (0.002) (0.005) (0.004) (0.001) (0.001)
GDP per capita 0.0147 0.0156 0.0068 0.0022 0.0120 0.0122 0.0105 0.0040(0.000) (0.000) (0.008) (0.016) (0.000) (0.000) (0.001) (0.003)
Lagged protection 0.6876 0.6602(0.000) (0.000)
Time fixed effects No Yes Yes Yes No Yes Yes YesCountry fixed effects No No Yes Yes No No Yes YesObservations 1627 1627 1627 1609 1355 1355 1355 1339Countries 67 67 67 67 65 65 65 65Adj R square 0.474 0.477 0.865 0.931 0.482 0.483 0.874 0.932
Critcal GDP per capita 1770 1411 3805 5107 6371 6143 6953 5212
- Agricultural Relative Rate of Assistance -
RadioTelevision sets
Notes: In parentheses p-value based on standard errors robust to heteroschedasticity and autocorrelation of unknown form..
31
Table 3. Effect of media penetration on agricultural protection: Conditional regression results
Dependent variable
Variables (1) (2) (3) (4) (5) (6) (7) (8) (9) (10)
Media 6.438 5.682 5.481 2.423 3.697 8.103 6.564 6.845 2.457 3.486(0.001) (0.009) (0.011) (0.006) (0.002) (0.061) (0.146) (0.126) (0.242) (0.191)
Media * GDP per capita -0.0012 -0.0014 -0.0013 -0.0006 -0.0009 -0.0014 -0.0012 -0.0013 -0.0006 -0.0010(0.005) (0.003) (0.004) (0.005) (0.001) (0.023) (0.048) (0.037) (0.016) (0.034)
GDP per capita 0.0052 0.0060 0.0059 0.0023 0.0035 0.0076 0.0070 0.0076 0.0034 0.0048(0.020) (0.013) (0.013) (0.014) (0.006) (0.016) (0.028) (0.018) (0.011) (0.034)
Employment share -1.5792 -1.4938 -1.3967 -0.2767 -0.1832 -1.6447 -1.5721 -1.3991 -0.2880 -0.1959(0.003) (0.006) (0.006) (0.113) (0.470) (0.006) (0.010) (0.011) (0.166) (0.535)
Land per capita -2.499 -2.373 -1.357 -1.982 -0.732 -0.685 -0.585 -0.882(0.040) (0.042) (0.004) (0.018) (0.551) (0.568) (0.241) (0.353)
Export share -0.2957 -0.2968 -0.1702 -0.2129 -0.3765 -0.3798 -0.2308 -0.2927(0.000) (0.000) (0.001) (0.000) (0.000) (0.000) (0.000) (0.000)
Polity2 (democracy index) 0.7983 0.3194 0.3435 0.8308 0.3555 0.4376(0.002) (0.010) (0.036) (0.003) (0.011) (0.031)
Lagged RRA 0.667 0.645 0.637 0.615(0.000) (0.000) (0.000) (0.000)
Media freedom 0.311 0.919(0.888) (0.730)
Time fixed effects Yes Yes Yes Yes Yes Yes Yes Yes Yes YesCountry fixed effects Yes Yes Yes Yes Yes Yes Yes Yes Yes YesObservations 1627 1599 1599 1581 1355 1355 1327 1327 1311 1086Countries 67 66 66 66 66 65 64 64 64 64Adj R square 0.868 0.873 0.875 0.934 0.930 0.877 0.882 0.884 0.934 0.929Critcal GDP per capita 5196 4064 4177 4350 4230 5804 5412 5381 4001 3639
Television sets Radio
- Agricultural Relative Rate of Assistance -
Notes: In parentheses p-value based on standard errors robust to heteroschedasticity and autocorrelation of unknown form.

32
Table 4. Effect of TV private share on agricultural protection: Pooled regression results
Dependent variableVariables (1) (2) (3) (4) (5) (6) (7)
TVs private share (tvps) 37.562 37.413 32.718 33.318 34.257 16.880 -67.086(0.000) (0.000) (0.006) (0.004) (0.006) (0.030) (0.010)
tvps * GDP per capita -0.0050 -0.0050 -0.0048 -0.0044 -0.0039(0.000) (0.000) (0.000) (0.000) (0.001)
GDP per capita 0.0054 0.0054 0.0052 0.0050 0.0113 -0.0001 0.0059(0.000) (0.000) (0.000) (0.000) (0.007) (0.944) (0.003)
Employment share -0 .0742 0.2114 -0.1557 2.5017(0.736) (0.492) (0.409) (0.215)
Land per capita -1.458 -1.472 -6.860 -1.043(0.022) (0.022) (0.004) (0.083)
Export share -0 .2958 -0.3070 -0.0938 -0 .3753(0.000) (0.000) (0.030) (0.000)
Polity2 (democracy index) 0.1172 -0.0143 0.6667 -11.4930(0.810) (0.981) (0.142) (0.120)
log (TVs) 6.015 7.079 -37.918(0.086) (0.006) (0.092)
log (TVs) * GDP per capita -0.0014(0.128)
Sample Full Full Full Full Full gdppc < 8,721
gdppc > 8,721
Time fixed effects No Yes Yes Yes Yes Yes YesRegional fixed effects No No Yes Yes Yes Yes YesObservations 605 605 605 600 546 284 262Countries 58 58 58 58 58 33 32Adj R square 0.479 0.482 0.490 0.553 0.565 0.460 0.481Critcal GDP per capita 7451 7423 6765 7564 8721
- Agricultural Relative Rate of Assistance -
Notes: In parentheses p-value based on standard errors robust to heteroschedasticity and autocorrelation of unknown form. Regressions (3)-(5) include regional fixed effects for Latin American, African, Asian and transition countries.