martian surface mineralogy from observatoire pour la … · martian surface mineralogy from...
TRANSCRIPT
Martian surface mineralogy from Observatoire pour la Mineralogie,
l’Eau, les Glaces et l’Activite on board the Mars Express
spacecraft (OMEGA/MEx): Global mineral maps
F. Poulet,1 C. Gomez,1 J.-P. Bibring,1 Y. Langevin,1 B. Gondet,1 P. Pinet,2 G. Belluci,3
and J. Mustard4
Received 6 October 2006; revised 4 January 2007; accepted 1 May 2007; published 18 July 2007.
[1] After 2 years of operation the Observatoire pour la Mineralogie, l’Eau, les Glaces etl’Activite (OMEGA) imaging spectrometer on board Mars Express has acquired datacoverage of the Martian surface with spatial resolution varying between 300 m and4.8 km, depending on the pericenter altitude of the spacecraft’s elliptical orbit. We reportthe global surface distributions of some minerals using the OMEGA observations in thevisible and near infrared (VNIR) wavelength domains (0.35–2.5 mm). Global maps offerric phases, mafic minerals (pyroxenes and olivines), and hydrated minerals have beenderived from spectral parameters. The limits of detection in terms of abundance forsome minerals of different grain size distributions are given. The distribution of pyroxenesis in general agreement with the mineral maps of previous telescopic and spaceobservations. The Fe3+ absorption feature in the visible wavelength region is presenteverywhere on the surface. The spectra of the bright regions compare with anhydrousnanophase ferric oxides. Terrains with water-bearing minerals cover a very small fraction ofthe Martian surface. Olivine (Mg-rich compositions) is detected in more extensive regionsof the pyroxene-rich zones than previously reported. Olivine with higher iron contentand/or larger grain size (>100 mm) is only detected in isolated areas. The mineralogy of thenorthern low-albedo regions is discussed in the light of these mineral maps. Chemicalalteration or oxidation during extrusion producing a coating or varnish of anhydrous ferricphases over a dark basaltic surface best accounts for the VNIR spectral properties of theseregions, although a glassy composition resulting from impact is also considered.
Citation: Poulet, F., C. Gomez, J.-P. Bibring, Y. Langevin, B. Gondet, P. Pinet, G. Belluci, and J. Mustard (2007), Martian surface
mineralogy from Observatoire pour la Mineralogie, l’Eau, les Glaces et l’Activite on board the Mars Express spacecraft (OMEGA/
MEx): Global mineral maps, J. Geophys. Res., 112, E08S02, doi:10.1029/2006JE002840.
1. Introduction
[2] The Observatoire pour la Mineralogie, l’Eau, lesGlaces et l’Activite (OMEGA) investigation is designed tostudy the surface and the atmosphere of Mars by couplingcompositional measurements through visible and near in-frared (VNIR) spectroscopy to imagery. The OMEGAinstrument started its operation on January 2004, andachieved its prime objective over the nominal (1 Martianyear) mission: to locate and map several key minerals ofmajor importance to trace Mars evolution [Arvidson et al.,
2005; Bibring et al., 2005, 2006; Gendrin et al., 2005;Langevin et al., 2005a; Poulet et al., 2005].[3] A global map produced from the OMEGA data will
provide a more complete and planetary view of the Martianmaterials. In this study, we summarize the global distribu-tions of Martian surface materials based on 1 Martian yearof observation. This summary complements previous andongoing efforts that focused on regional distribution ofmaterials based on their spectral signatures. These inves-tigations are presented in several other papers that revealunique regional mineralogical units (e.g., phyllosilicates inMawrth Vallis and olivine/phyllosilicate in Nili Fossae).
2. Previous Works
[4] Telescopic observations and early Mars space mis-sions gave initial insights into the global surface composi-tion of Mars (see, e.g., Bandfield [2002] and Yen et al.[2005] for recent reviews). Significant high-calcium pyrox-ene absorption bands in the low-albedo regions have beendetected, while the high-albedo regions are spectrally char-acterized by poorly crystalline iron oxides as first reported
JOURNAL OF GEOPHYSICAL RESEARCH, VOL. 112, E08S02, doi:10.1029/2006JE002840, 2007ClickHere
for
FullArticle
1Institut d’Astrophysique Spatiale, CNRS/Universite Paris-Sud, Orsay,France.
2Laboratoire Dynamique Terrestre et Planetaire/UMR5562, CentreNational de la Recherche Scientifique, Toulouse, France.
3Istituto Nazionale Di Astrofiscia dello Spazio Interplanetario, Rome,Italy.
4Geological Sciences, Brown University, Providence, Rhode Island,USA.
Copyright 2007 by the American Geophysical Union.0148-0227/07/2006JE002840$09.00
E08S02 1 of 15
by Singer and McCord [1979]. Data from the recent Marsmissions show that the mafic regions have much morediversity than previously recognized (see Christensen etal. [2005] for a review of the Mars Global Surveyor/Thermal Emission Spectrometer (MGS/TES) and MarsOdyssey/Thermal Emission Imaging System (THEMIS)results, and Mustard et al. [2005] for OMEGA). Forinstance, olivine that can provide clues to the Martianpetrology was first identified in a few locations by TES[Hoefen et al., 2003] and THEMIS [Christensen et al.,2003]; then, OMEGA data has confirmed and extended theidentification of this mineral to several additional areas[Mustard et al., 2005]. Of special interest are the unambig-uous detections of secondary minerals including variousphyllosilicates [Poulet et al., 2005], Ca-Mg-Fe sulphates[Squyres et al., 2004; Arvidson et al., 2005; Gendrin et al.,2005; Langevin et al., 2005a] and other Fe3+ O-H phases[Klingelhofer et al., 2004; Morris et al., 2004].
3. Data Set Overview
[5] Following the 25 December 2003 orbit insertion ofthe Mars Express spacecraft (MEx), the Martian global-scale mapping by OMEGA was initiated. The instrumentoperates from the visible (0.35 mm) to the thermal infrared(5.1 mm). The present analysis focuses on VNIR reflectancemeasurements (0.35–2.5 mm). With a fixed IFOV of1.2 mrad, OMEGA has the flexibility to accommodatemodes of operations through cross track swaths of 16, 32,64, or 128 IFOV in width [Bibring et al., 2004]. Operationsof OMEGA are primarily nadir pointed, making surfaceswath widths ranging from 1.1� to 8.8�. The global maps areprimarily derived from observations for which the altitudeof the spacecraft ranges from 1500 to 4000 km. In this case,the swath width is 128 pixels, with a pixel size varying from1.8 to 4.8 km accordingly. The high spatial resolutionobservations acquired for spacecraft altitudes lower than450 km and with a swath of 16 pixels width are not
considered here, because these tracks are too narrow(�6 km) to contribute to the mapping at a planetary scale.[6] In this work, maps of the near-infrared (NIR) albedo
and global mineralogical distributions are built by using thefirst 22 months of OMEGA operations, from Ls = 330� toLs = 315�. This corresponds to 429 orbits and 1468OMEGA cubes (i.e., �50 million of spectra) which providecoverage of about 90% of the Martian surface. The OME-GA radiance data are corrected for solar irradiance andatmospheric absorptions in the VNIR using the standarddata reduction schemes [Bibring et al., 2005; Belluci et al.,2006], which produces reflectance I/F spectra. I/F corre-sponds to the ratio of the observed radiance to the incomingsolar flux per unit of surface. We have used the OMEGAreflectance data recorded when the operation mode is nadirand the calibration lamp is switched off. The observationsthat have saturated the detectors are not considered. Fromorbit number 513, the 128 pixel observation mode producedspurious values for some pixels which were not mappedbecause a systematic correction of this problem is not yetpossible. The northern and southern high-latitude regionsare strongly affected by the presence of seasonal icy frostsas well as strong atmospheric variations that precludedsystematic mapping [Langevin et al., 2007]. Therefore ourmapping was restricted to the latitudes range between �50�and 50�.
4. Identification and Mapping
4.1. Near-Infrared Albedo
[7] A NIR albedo map was produced using the I/F valueat l = 1.08 mm, assuming a lambertian surface. All thespectral parameters listed in Table 1 and described in detailhereafter can be compared to the NIR albedo map.
4.2. Mineral Spectral Parameters
[8] Previous studies show that OMEGA is able to detectunambiguously key surface materials in the form of maficiron-bearing silicates, hydrated minerals, ferric oxides, and
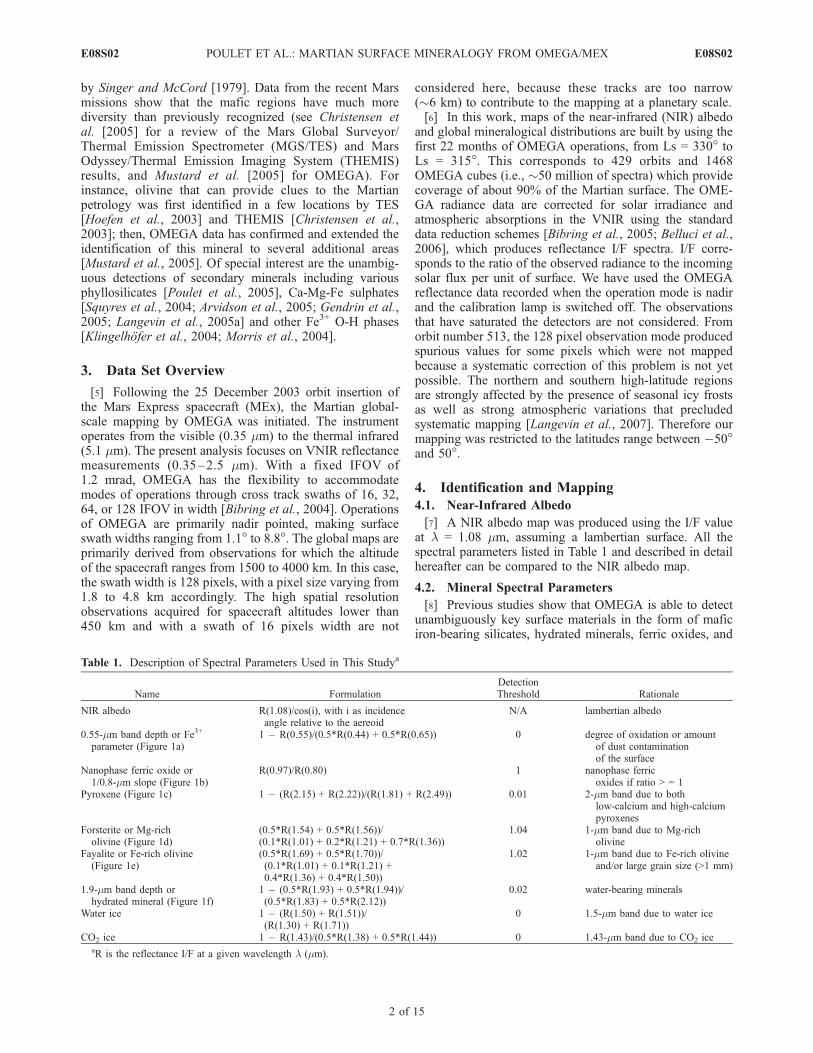
Table 1. Description of Spectral Parameters Used in This Studya
Name FormulationDetectionThreshold Rationale
NIR albedo R(1.08)/cos(i), with i as incidenceangle relative to the aereoid
N/A lambertian albedo
0.55-mm band depth or Fe3+
parameter (Figure 1a)1 � R(0.55)/(0.5*R(0.44) + 0.5*R(0.65)) 0 degree of oxidation or amount
of dust contaminationof the surface
Nanophase ferric oxide or1/0.8-mm slope (Figure 1b)
R(0.97)/R(0.80) 1 nanophase ferricoxides if ratio > = 1
Pyroxene (Figure 1c) 1 � (R(2.15) + R(2.22))/(R(1.81) + R(2.49)) 0.01 2-mm band due to bothlow-calcium and high-calciumpyroxenes
Forsterite or Mg-richolivine (Figure 1d)
(0.5*R(1.54) + 0.5*R(1.56))/(0.1*R(1.01) + 0.2*R(1.21) + 0.7*R(1.36))
1.04 1-mm band due to Mg-richolivine
Fayalite or Fe-rich olivine(Figure 1e)
(0.5*R(1.69) + 0.5*R(1.70))/(0.1*R(1.01) + 0.1*R(1.21) +0.4*R(1.36) + 0.4*R(1.50))
1.02 1-mm band due to Fe-rich olivineand/or large grain size (>1 mm)
1.9-mm band depth orhydrated mineral (Figure 1f)
1 � (0.5*R(1.93) + 0.5*R(1.94))/(0.5*R(1.83) + 0.5*R(2.12))
0.02 water-bearing minerals
Water ice 1 � (R(1.50) + R(1.51))/(R(1.30) + R(1.71))
0 1.5-mm band due to water ice
CO2 ice 1 � R(1.43)/(0.5*R(1.38) + 0.5*R(1.44)) 0 1.43-mm band due to CO2 iceaR is the reflectance I/F at a given wavelength l (mm).
E08S02 POULET ET AL.: MARTIAN SURFACE MINERALOGY FROM OMEGA/MEX
2 of 15
E08S02
ices [Bibring et al., 2005, 2006]. VNIR spectral propertiescan be categorized in terms of a set of spectral parameters.The spectral parameters (also called spectral index orspectral criterion hereafter) considered in this study arelisted in Table 1. They were developed for a few mineralsrepresentative of the Martian mineralogy, and applied toanalyze the I/F atmospheric-corrected spectra. The pyroxeneindex uses the 2-mm band attributed to crystal field tran-sitions in Fe2+ which preferentially occupy the M2 crystal-lographic site [Gaffey et al., 1993]; this spectral index issensitive to both low- to high-calcium species. Two olivineindexes (Mg-rich olivine and Fe-rich olivine) are based onthe strong and broad 1-mm band of olivine mineral due toFe2+ ion in distorted octahedral sites [Gaffey et al., 1993].The 1.9-mm band attributed to overtone of the H-O-Hbending mode and the OH stretching mode was used toidentify water-bearing minerals or hydrated minerals [Gaffeyet al., 1993]. The content of Fe-oxidized phases is measuredthanks to an Fe3+ parameter based on the combination ofspectral features in the visible due to the presence of Fe3+
ions [Morris et al., 1989]. The presence of nanophase ferricoxide is based on the spectral shape of absorptions in the0.8–1-mm wavelength region resulting from the grain sizeeffect [Morris et al., 1989].[9] The data analysis based on spectral parameter has the
advantage of being fast and well adapted for the largeOMEGA data set. However, mineral abundances are notreported here because the strength of each spectral indexdepends on a variety of parameters such as the mineralmixture, the relative concentration, the optical constants andthe grain size distribution of each end-member, the surfacetexture and the atmospheric condition. Mineral deconvolu-tion using complex radiative transfer theory is needed toprovide concentrations [Poulet and Erard, 2004]. Sincesuch a method is very time consuming, it has not yet beenapplied to the entire OMEGA data set. However, limits ofdetection in term of abundance are discussed for the olivineand hydrated minerals (section 4.3.4).[10] Finally, we note that some important minerals such
as feldspar, quartz, amorphous silica, and nonhydrated saltsare not mapped here because they are featureless in theOMEGA wavelength range. VNIR data are actually wellsuited for Fe and hydrated minerals, whereas thermalinfrared (TIR) measurements are well suited for a broadrange of silicate and other minerals that do not showvisible–near infrared absorptions (e.g., feldspar). Bothwavelength regions are differentially affected by texture,coatings, and particle size. For example mineral identifica-tion in the TIR, can be hampered by fine particulatetextures.4.2.1. Ferric Phases[11] Telescopic, orbital, and in situ observations have
revealed the presence of ferric iron absorption features inthe UV/visible that are indicative of oxidized surfacematerials. The strength of the ferric absorption edge at0.53 mm provides a good estimate of the degree of oxidationor amount of dust contamination of the surface [Bell et al.,1993; Morris et al., 2000; Farrand et al., 2006]. Thisabsorption edge is caused by several effects: intense Fe3+
ligand field transitions between 0.4 and 0.6 mm, Fe3+
electronic pair transitions in the 0.5–0.7-mm region and astrong O2� ! Fe3+ charge transfer absorption centered near
0.25–0.35 mm. To study this feature, we use the spectralparameter that is defined by Morris et al. [2000] and calledBD530 in their paper, and addresses the depth of the 0.53-mmabsorption feature. The positions of the BD530 wavelengthshave been slightly adapted to account for the OMEGAspectral resolution (Table 1 and Figure 1a). This Fe3+
parameter can be positive or negative depending on thedeviation from the reference line. As shown by Morris et al.[2000], the values of the Fe3+ spectral parameter increase inthe following order: jarosite (negative values) < maghemite(positive values) < nanophase oxides < hematite.[12] Ferric phases also exhibit a broad NIR absorption
feature between 0.75 and 1.0 mm resulting from electronictransitions and which in some instances are indicative of thedegree of crystallinity and iron content. More specifically,the spectral ratio of the reflectance at wavelengths 0.97 and0.8 mm is a good index of the nature of ferric oxide andprovides a second parameter for ferric phases and called the1/0.8-mm slope (Table 1 and Figure 1b) [Bell et al., 2000].As a test, the 1/0.8-mm slope parameter has been calculatedfor the laboratory samples of hematite particles smaller than10 nm (samples S6FN-type D from Morris et al., 1989])and typical values ranged between 1.0 and 1.05 wereobtained. Values close to or slightly larger than 1 can bethus assigned to the presence of nanophase ferric oxides.Small deviations from linearity and second-order effects canresult in instrumental errors on the order of a few percentwhen comparing reflectance spectra in this wavelengthrange [Belluci et al., 2006]. Given these uncertainties, thevalues larger than unity is considered as a diagnostic of thepresence of so-called nanophase ferric oxide, with size of afew tens of nm or less [Morris et al., 1989, 1993].4.2.2. Pyroxene[13] Mafic minerals play an important role in determining
the history of the Martian geology. The detection of pyrox-ene is made on the basis of the presence of a broad 2-mmabsorption corresponding to a mixture of low-calcium py-roxene (LCP), for which the band is centered at �1.9 mm,and high-calcium pyroxene (HCP), for which the band iscentered at �2.3 mm. The pyroxene spectral parameter isdefined in Table 1, and an example of a typical pyroxene-rich spectrum is illustrated in Figure 1c. To account forinstrumental and atmospheric biases, the detection is con-sidered positive for values of the pyroxene spectral param-eter larger than 1%. Our spectral parameter is not designed todiscriminate between the LCP end-member and HCP end-member. It has been demonstrated that other methods such asthe Modified Gaussian Model (MGM) are very efficient toachieve this goal [Bibring et al., 2005].4.2.3. Olivine[14] Olivine has a broad, complex absorption centered
near 1 mm that varies in width, position, and shape withgrain size and Fo number. For instance, the right wing shiftstoward longer wavelengths as the amount of FeO in theolivine increases. In USGS samples [Clark et al., 1993],the absorption feature extends to �1.55 mm for Fo89 and to�1.8 mm for Fo11. The increase in grain size broadens thebottom of the band and shifts the right wing of the bandtoward longer wavelengths, so that a forsterite olivinespectrum with very large grains (�100 mm) and a fayaliteolivine spectrum with smaller grain have similar spectralfeatures. Nevertheless, we have defined a spectral index for
E08S02 POULET ET AL.: MARTIAN SURFACE MINERALOGY FROM OMEGA/MEX
3 of 15
E08S02
each of the two olivine end-members (forsterite and faya-lite) based on the spectral slope in the 1.0–1.7-mm region.The formulas of these two olivine parameters are given inTable 1 and the spectra representative of these minerals areshown in Figures 1d and 1e. In typical olivine-free Martianspectra, the indexes are less than unity; presence of olivineincreases these indexes above unity. For instance, weobserve values larger than 1.1 for the forsterite and fayaliteparameters in the Nili Fossae region where the identificationof olivine is certain. However, an index slightly higher thanunity can also reflect the presence of crystalline ferricoxides or of pyroxene and/or be due to atmospheric effects.Therefore, in order to remove ‘‘false positive’’, we have set
a threshold for olivine detection to 1.04 for the forsteriteindex, and to 1.02 for fayalite, after proper evaluation basedon careful analysis of OMEGA data set and on spectra ofterrestrial samples. For instance, the forsterite parametercalculated for the spectrum of the terrestrial fine-grained(<45 mm) forsterite (sample LAP050 of the MRO/CRISMlibrary [Bishop et al., 1995]) is equal to 1.15, while the valueof the fayalite parameter of the spectrum of the terrestrialfine-grained (<45 mm) fayalite (sample LAP005 [Bishopet al., 1995]) is 1.70.[15] We excluded spots identified by a forsterite index
larger than 1.04 for which the spectrum exhibits a strongraise between 1.0 and 1.4 mm, combined with a shallow
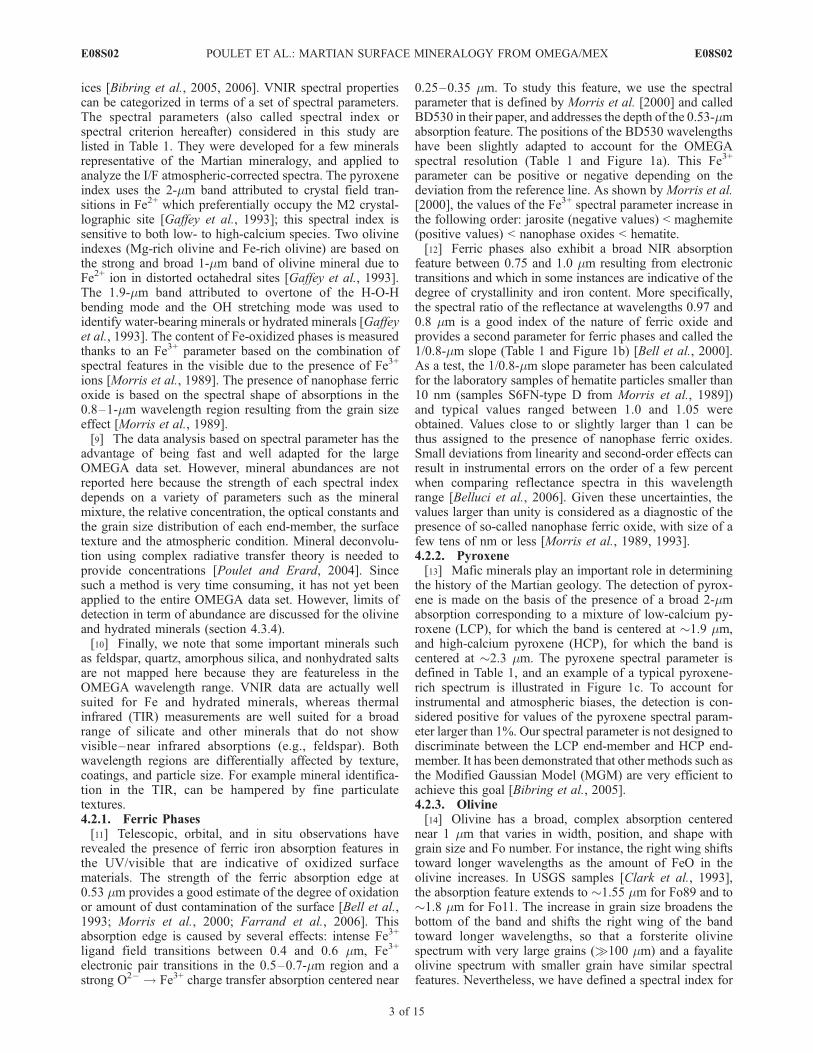
Figure 1. Band positions of spectral parameters listed in Table 1 on OMEGA spectra representative ofthe major spectral types discussed in the paper. (a) Fe3+ parameter over typical spectra of dark (dashedline) and bright regions (solid line), (b) nanophase ferric oxide parameter over typical spectra of dark(dashed line) and bright regions (solid line), (c) pyroxene parameter over a typical spectrum of apyroxene-rich terrain, (d) forsterite parameter over a spectrum of a olivine-rich (likely enriched in Mg)deposit, (e) fayalite parameter over a spectrum of a olivine-rich (likely enriched in Fe) deposit, and(f) 1.9-mm parameter over a spectrum of water-bearing terrains identified by the 1.9-mm band. The verticaldashed bars indicate the wavelengths used for the band centers (labeled by b) and the wavelengths used forthe continuum (labeled by c) used in the calculation of the spectral parameters (Table 1).
E08S02 POULET ET AL.: MARTIAN SURFACE MINERALOGY FROM OMEGA/MEX
4 of 15
E08S02
1.0-mm feature (nanophase ferric oxide index larger than0.94). These spectral properties are typical of poorly crys-talline ferric oxides with grain sizes ranged between severalhundreds of nanometers and several tens of micrometers[Morris et al., 1989]. Such spots are found in a few areasonly: Terra Meridiani, Valles Marineris, and Aram Chaos.[16] Finally, comparison of our technique mapping with
MGM deconvolution results produced over Syrtis Major[Pinet et al., 2006] suggests that for the forsterite index,olivine might be present in association with pyroxene for athreshold as low as 1.025–1.03. Accordingly, as a criticalassessment of sensitivity on the extent of the olivinedistribution map at the global scale, this second thresholdcould be considered as a proxy for marginal.4.2.4. Hydrated Minerals[17] OMEGA detects hydrated minerals by the presence
of an absorption feature resulting from overtones andcombinations of OH and H2O in the 1.9-mm wavelengthregion. This absorption feature is measured at �1.93 mmwith a continuum at 1.83 mm (1.80 mm for the orbit numberlarger than 2100 because of an instrumental problem thataffects the 1.83-mm spectral element) and 2.12 mm, asillustrated in Figure 1f. This absorption feature serves asan indicator of hydrated minerals; it has been used inprevious studies for mapping minerals considered to resultfrom aqueous alteration processes and include phyllosili-cates [Poulet et al., 2005; Loizeau et al., 2007; Mangold etal., 2007] and sulfates [Langevin et al., 2005a]. A thresholdof 0.02 is used in order to be significantly above instru-mental noise and atmospheric artifacts. Some sulfates (kie-serite and romerite), are excluded in this mapping becausethe 1.9-mm hydration band of these minerals is shifted tolonger wavelengths [Gendrin et al., 2005; Cloutis et al.,2006].
4.3. Uncertainties
4.3.1. Uncertainties Due to Ices[18] OMEGA is very sensitive to the presence of ice,
under the form of clouds and frosts [Bibring et al., 2005;Gondet et al., 2006]. Both water ice and carbon dioxide icehave an absorption band centered at �2 mm, which mayaffect the detection of hydrated minerals. In mapping thehydrated minerals, we therefore decided to disregard spectrain which either H2O ice, identified by its 1.5-mm absorptionband, or CO2 ice, identified by its 1.43-mm absorption band[Langevin et al., 2005b; Langevin et al., 2007] are detected.The ice criteria are described in Table 1.[19] Pyroxene and olivine detection mapping can be also
biased by the presence of ices. Therefore we do not plotpixels with H2O ice criterion larger than 0.2, 0, and 0.1when mapping pyroxene, forsterite and fayalite respectively,and with CO2 ice criterion larger than 0 for all three maps.4.3.2. Uncertainties Due to Aerosols[20] To discriminate spectral features related to fine-
grained surface coatings from those originating from theatmospheric dust is a difficult task, because a dusty atmo-sphere may have spectral signatures similar to those of thesurficial dust. The strongest contribution of aerosols in termof spectral signatures and quantitative effects is expected tooccur in the visible wavelength range. Since atmosphericconditions are variable, the values of the spectral parameterswould vary with time if the detection was dominated by
suspended dust. OMEGAwas able to target some geographicregions on Mars several times, at different local times and/orseasons, providing the opportunity to check the temporalvariation of the spectral parameters. As expected, the visibleportion of the electromagnetic spectrum is the most affectedand shows significant absolute variations related to themagnitude of the Fe3+ parameter. However, the relativedifferences of the parameter from one region to anotherone do not change both at the regional and global scales,and the effects of the variable atmospheric conditions arenegligible on the global maps.4.3.3. Uncertainties Due to Fine Grain Coatings[21] Laboratory and field investigations of the spectral
effects of fine surface grain coating have shown that thin(<100 mm) layers can partly or totally mask the underlyingmaterials in both the visible and near-infrared portions at thespectrum [Singer and Roush, 1983; Wells et al., 1984;Fischer and Pieters, 1993; Christensen et al., 1998]. How-ever, this masking effect is known to be less important in theNIR wavelength region than in the visible wavelengthinterval, because of the increasing transparency of thesurface coating at longer wavelengths. Thus the NIR ab-sorption bands of pyroxenes and hydrated minerals can bedetected despite the presence of an optically thick coating.A dust coating over dark substrate results in a negative slopeof the spectrum in the near-infrared because of increasingtransparency of the coating at longer wavelengths, resultingin a greater contribution from the substrate [Singer andRoush, 1983], and/or by a dependence of the phase functionwith wavelength [Johnson and Grundy, 2001]. Since thedark surfaces on Mars likely are basaltic in composition,such observation can be considered as an indirect detectionof a basalt material as discussed in sections 5.4 and 6.3.[22] Finally, previous works using mapping technique
based on spectral parameters [Langevin et al., 2005a; Pouletet al., 2005; Mustard et al., 2005] have shown that most ofthe regions exhibiting spectral signatures of mafic or water-bearing materials are very well correlated to distinct andspecific geological units. This gives us strong confidence inthe technique consisting of mapping the minerals withspectral parameters.4.3.4. Uncertainties Due to Grain Size and Mixture[23] The grain size distribution of a mineral mixture
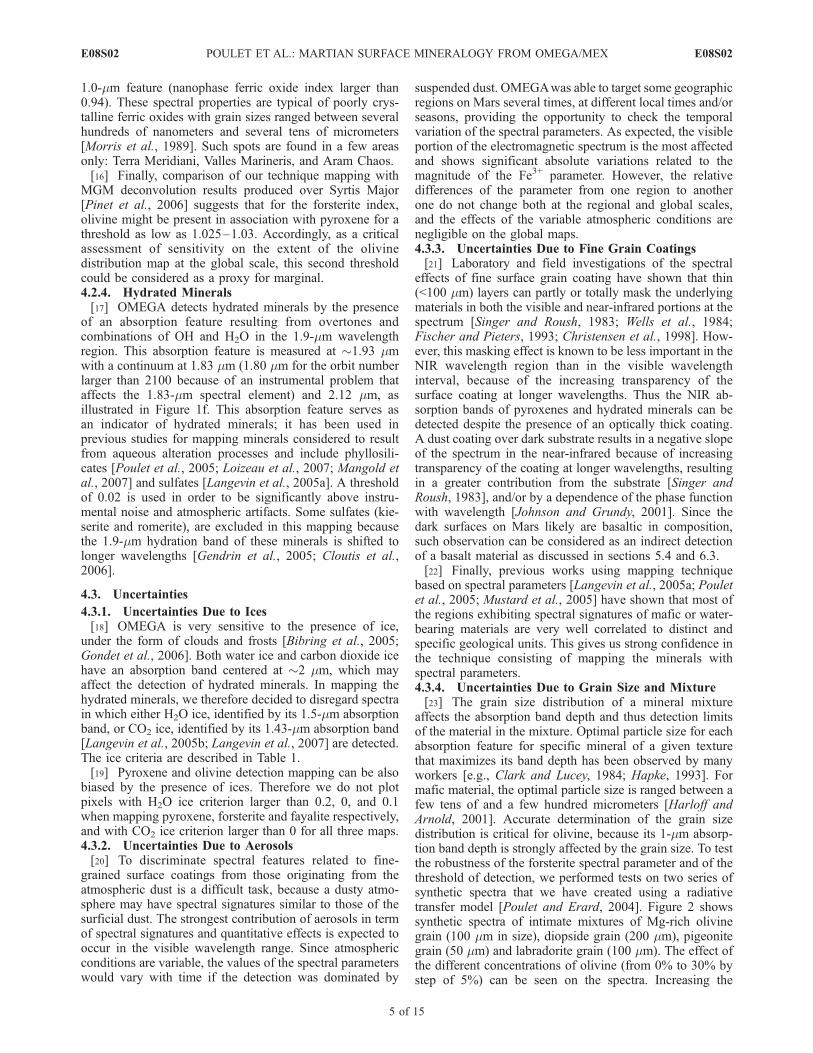
affects the absorption band depth and thus detection limitsof the material in the mixture. Optimal particle size for eachabsorption feature for specific mineral of a given texturethat maximizes its band depth has been observed by manyworkers [e.g., Clark and Lucey, 1984; Hapke, 1993]. Formafic material, the optimal particle size is ranged between afew tens of and a few hundred micrometers [Harloff andArnold, 2001]. Accurate determination of the grain sizedistribution is critical for olivine, because its 1-mm absorp-tion band depth is strongly affected by the grain size. To testthe robustness of the forsterite spectral parameter and of thethreshold of detection, we performed tests on two series ofsynthetic spectra that we have created using a radiativetransfer model [Poulet and Erard, 2004]. Figure 2 showssynthetic spectra of intimate mixtures of Mg-rich olivinegrain (100 mm in size), diopside grain (200 mm), pigeonitegrain (50 mm) and labradorite grain (100 mm). The effect ofthe different concentrations of olivine (from 0% to 30% bystep of 5%) can be seen on the spectra. Increasing the
E08S02 POULET ET AL.: MARTIAN SURFACE MINERALOGY FROM OMEGA/MEX
5 of 15
E08S02
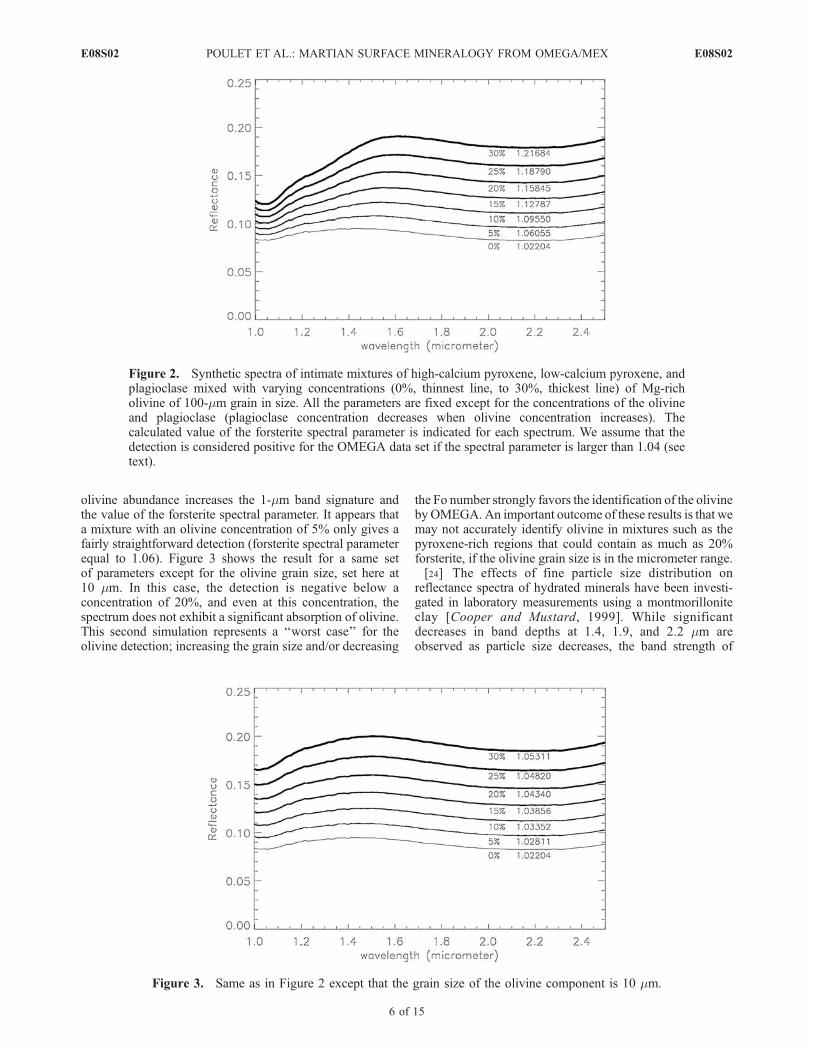
olivine abundance increases the 1-mm band signature andthe value of the forsterite spectral parameter. It appears thata mixture with an olivine concentration of 5% only gives afairly straightforward detection (forsterite spectral parameterequal to 1.06). Figure 3 shows the result for a same setof parameters except for the olivine grain size, set here at10 mm. In this case, the detection is negative below aconcentration of 20%, and even at this concentration, thespectrum does not exhibit a significant absorption of olivine.This second simulation represents a ‘‘worst case’’ for theolivine detection; increasing the grain size and/or decreasing
the Fo number strongly favors the identification of the olivinebyOMEGA. An important outcome of these results is that wemay not accurately identify olivine in mixtures such as thepyroxene-rich regions that could contain as much as 20%forsterite, if the olivine grain size is in the micrometer range.[24] The effects of fine particle size distribution on
reflectance spectra of hydrated minerals have been investi-gated in laboratory measurements using a montmorilloniteclay [Cooper and Mustard, 1999]. While significantdecreases in band depths at 1.4, 1.9, and 2.2 mm areobserved as particle size decreases, the band strength of
Figure 2. Synthetic spectra of intimate mixtures of high-calcium pyroxene, low-calcium pyroxene, andplagioclase mixed with varying concentrations (0%, thinnest line, to 30%, thickest line) of Mg-richolivine of 100-mm grain in size. All the parameters are fixed except for the concentrations of the olivineand plagioclase (plagioclase concentration decreases when olivine concentration increases). Thecalculated value of the forsterite spectral parameter is indicated for each spectrum. We assume that thedetection is considered positive for the OMEGA data set if the spectral parameter is larger than 1.04 (seetext).
Figure 3. Same as in Figure 2 except that the grain size of the olivine component is 10 mm.
E08S02 POULET ET AL.: MARTIAN SURFACE MINERALOGY FROM OMEGA/MEX
6 of 15
E08S02
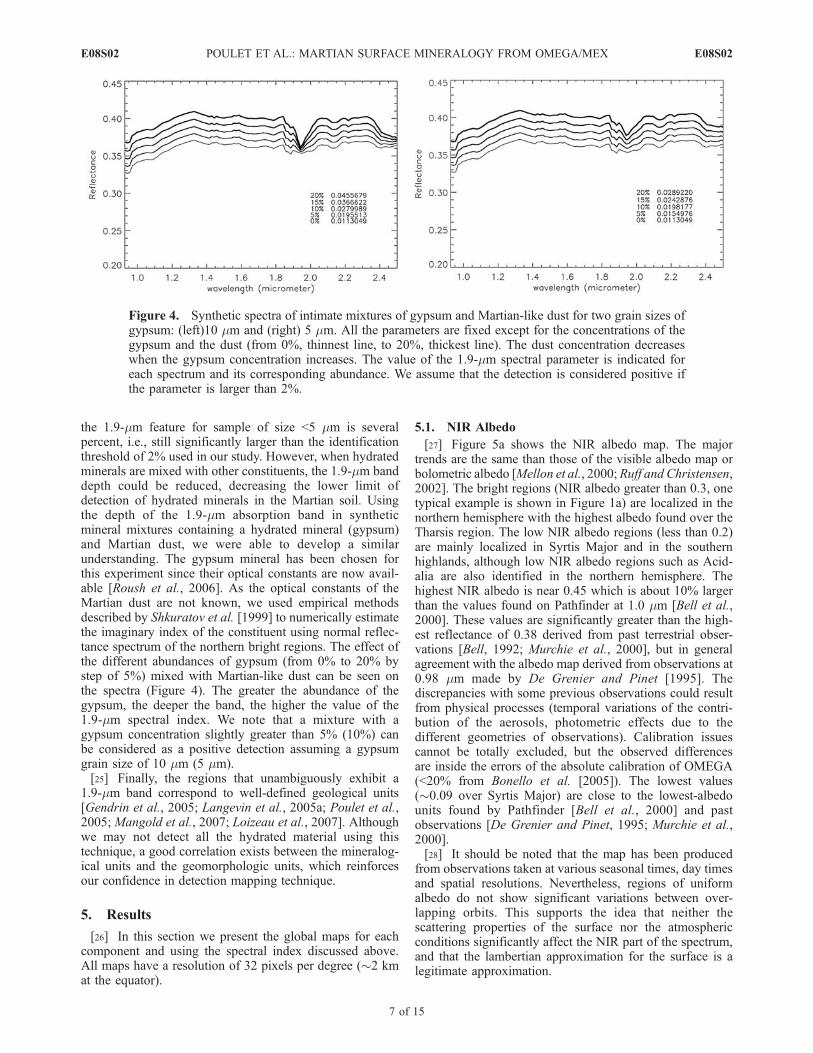
the 1.9-mm feature for sample of size <5 mm is severalpercent, i.e., still significantly larger than the identificationthreshold of 2% used in our study. However, when hydratedminerals are mixed with other constituents, the 1.9-mm banddepth could be reduced, decreasing the lower limit ofdetection of hydrated minerals in the Martian soil. Usingthe depth of the 1.9-mm absorption band in syntheticmineral mixtures containing a hydrated mineral (gypsum)and Martian dust, we were able to develop a similarunderstanding. The gypsum mineral has been chosen forthis experiment since their optical constants are now avail-able [Roush et al., 2006]. As the optical constants of theMartian dust are not known, we used empirical methodsdescribed by Shkuratov et al. [1999] to numerically estimatethe imaginary index of the constituent using normal reflec-tance spectrum of the northern bright regions. The effect ofthe different abundances of gypsum (from 0% to 20% bystep of 5%) mixed with Martian-like dust can be seen onthe spectra (Figure 4). The greater the abundance of thegypsum, the deeper the band, the higher the value of the1.9-mm spectral index. We note that a mixture with agypsum concentration slightly greater than 5% (10%) canbe considered as a positive detection assuming a gypsumgrain size of 10 mm (5 mm).[25] Finally, the regions that unambiguously exhibit a
1.9-mm band correspond to well-defined geological units[Gendrin et al., 2005; Langevin et al., 2005a; Poulet et al.,2005; Mangold et al., 2007; Loizeau et al., 2007]. Althoughwe may not detect all the hydrated material using thistechnique, a good correlation exists between the mineralog-ical units and the geomorphologic units, which reinforcesour confidence in detection mapping technique.
5. Results
[26] In this section we present the global maps for eachcomponent and using the spectral index discussed above.All maps have a resolution of 32 pixels per degree (�2 kmat the equator).
5.1. NIR Albedo
[27] Figure 5a shows the NIR albedo map. The majortrends are the same than those of the visible albedo map orbolometric albedo [Mellon et al., 2000; Ruff and Christensen,2002]. The bright regions (NIR albedo greater than 0.3, onetypical example is shown in Figure 1a) are localized in thenorthern hemisphere with the highest albedo found over theTharsis region. The low NIR albedo regions (less than 0.2)are mainly localized in Syrtis Major and in the southernhighlands, although low NIR albedo regions such as Acid-alia are also identified in the northern hemisphere. Thehighest NIR albedo is near 0.45 which is about 10% largerthan the values found on Pathfinder at 1.0 mm [Bell et al.,2000]. These values are significantly greater than the high-est reflectance of 0.38 derived from past terrestrial obser-vations [Bell, 1992; Murchie et al., 2000], but in generalagreement with the albedo map derived from observations at0.98 mm made by De Grenier and Pinet [1995]. Thediscrepancies with some previous observations could resultfrom physical processes (temporal variations of the contri-bution of the aerosols, photometric effects due to thedifferent geometries of observations). Calibration issuescannot be totally excluded, but the observed differencesare inside the errors of the absolute calibration of OMEGA(<20% from Bonello et al. [2005]). The lowest values(�0.09 over Syrtis Major) are close to the lowest-albedounits found by Pathfinder [Bell et al., 2000] and pastobservations [De Grenier and Pinet, 1995; Murchie et al.,2000].[28] It should be noted that the map has been produced
from observations taken at various seasonal times, day timesand spatial resolutions. Nevertheless, regions of uniformalbedo do not show significant variations between over-lapping orbits. This supports the idea that neither thescattering properties of the surface nor the atmosphericconditions significantly affect the NIR part of the spectrum,and that the lambertian approximation for the surface is alegitimate approximation.
Figure 4. Synthetic spectra of intimate mixtures of gypsum and Martian-like dust for two grain sizes ofgypsum: (left)10 mm and (right) 5 mm. All the parameters are fixed except for the concentrations of thegypsum and the dust (from 0%, thinnest line, to 20%, thickest line). The dust concentration decreaseswhen the gypsum concentration increases. The value of the 1.9-mm spectral parameter is indicated foreach spectrum and its corresponding abundance. We assume that the detection is considered positive ifthe parameter is larger than 2%.
E08S02 POULET ET AL.: MARTIAN SURFACE MINERALOGY FROM OMEGA/MEX
7 of 15
E08S02
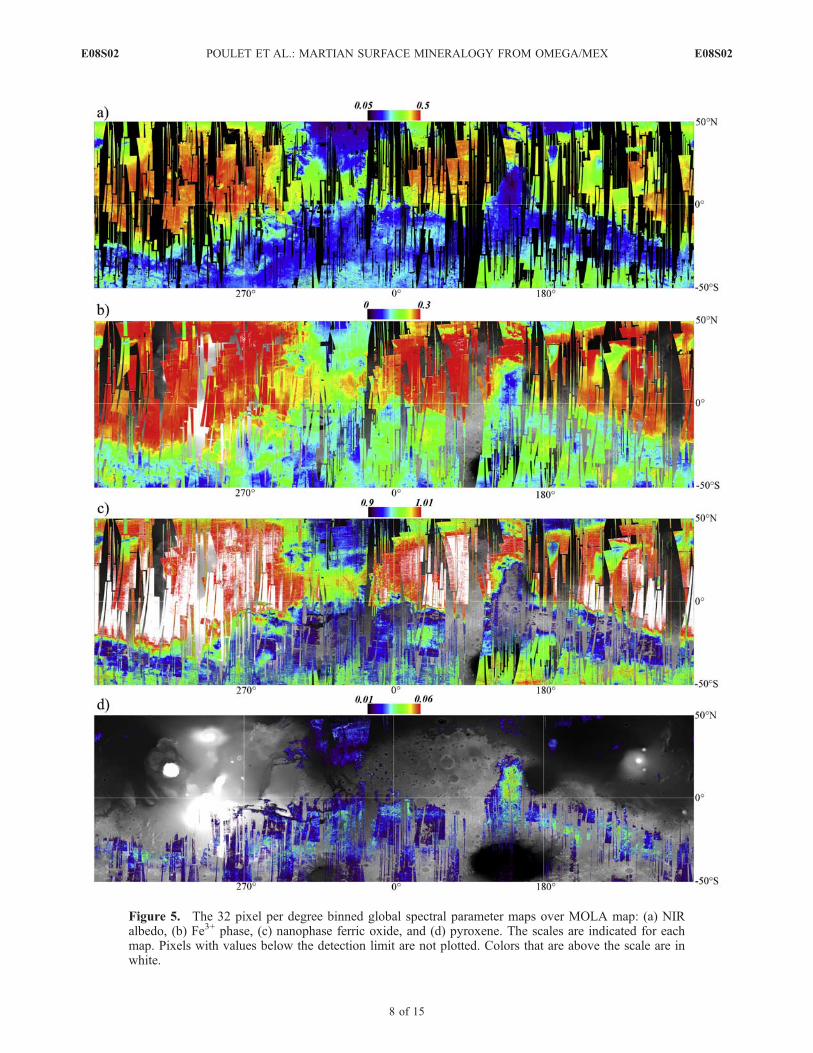
Figure 5. The 32 pixel per degree binned global spectral parameter maps over MOLA map: (a) NIRalbedo, (b) Fe3+ phase, (c) nanophase ferric oxide, and (d) pyroxene. The scales are indicated for eachmap. Pixels with values below the detection limit are not plotted. Colors that are above the scale are inwhite.
E08S02 POULET ET AL.: MARTIAN SURFACE MINERALOGY FROM OMEGA/MEX
8 of 15
E08S02
5.2. Fe3+ Feature
[29] As shown in Figure 5b, values of the Fe3+ spectralparameter are positive for all the OMEGA pixels. Thisimplies the presence of ferric oxide phases everywhere atthe surface, although its abundance varies significantly.These variations reflect the existence of distinct mineralphases, with different composition and origin, in the variousunits. Although atmospheric effects may be present, themap shows a remarkable spatial coupling of the value of theFe3+ spectral index and the NIR albedo. The greatest valuesfound in the bright regions are close to 0.3, which is largerthan the values found for the brightest Pathfinder soils. Onterrestrial analogues, similar large values were derived fornanophase ferric oxide [Morris et al., 2000].
5.3. Nanophase Ferric Oxides
[30] The global map of the nanophase ferric oxides(hereafter abbreviated np-Ox) obtained from the 1/0.8-mmslope parameter mapping is presented in Figure 5c. Thedarkest regions have values of the 1/0.8-mm slope parametersmaller than 0.9 because of strong mafic 1-mm bands andare not plotted on the map. The white regions representvalues greater than 1.01 and their spectra are thus charac-terized by significant red slopes (increasing reflectance withincreasing wavelength) between 0.8 and 1.0 mm. No obvi-ous artifacts due to atmospheric effects are evident. Appar-ent from the map is the spatial coherence of the largestvalues (red and white areas on Figure 5c) with the brightregions in the NIR albedo map (Figure 5a). Consequently,
the values of the Fe3+ and nanophase ferric oxide parame-ters of the bright regions are consistent with previoustelescopic and spacecraft investigations that have impliednp-Ox as the best spectral analogues to these regions in theVNIR wavelength range. Nevertheless, some spectra ofthese regions (Figure 1b) exhibit a very weak 0.9-mm rangeinflection, which could be explained by the presence of aminor amount of poorly crystalline ferric phase.
5.4. Pyroxene
[31] Pyroxenes are identified in equatorial and southernlow-albedo regions with the highest parameter values foundin Syrtis Major (Figure 5d). This map is consistent with theTES global pyroxene map [Bandfield, 2002] and withthe map derived from OMEGA observations analyzed withthe Modified Gaussian Model [Bibring et al., 2006]. Iden-tification of the pyroxene in the low-albedo regions of thenorthern hemisphere is positive while challenging becausethe value of the pyroxene spectral parameter is close to thedetection threshold equal to 0.01. These regions are spec-trally rather unique and are best characterized by a blueslope in the NIR range (decreasing reflectance with increas-ing wavelength) [Mustard et al., 2005, Figure 5]. Theyexhibit a weak 2-mm band but no apparent 1-mm band.
5.5. Olivine
[32] Olivine is mapped according to its two spectralparameters: forsterite and fayalite (Table 1 and Figures 1d,1e, 6, and 7). Thresholds and potential biases are discussed
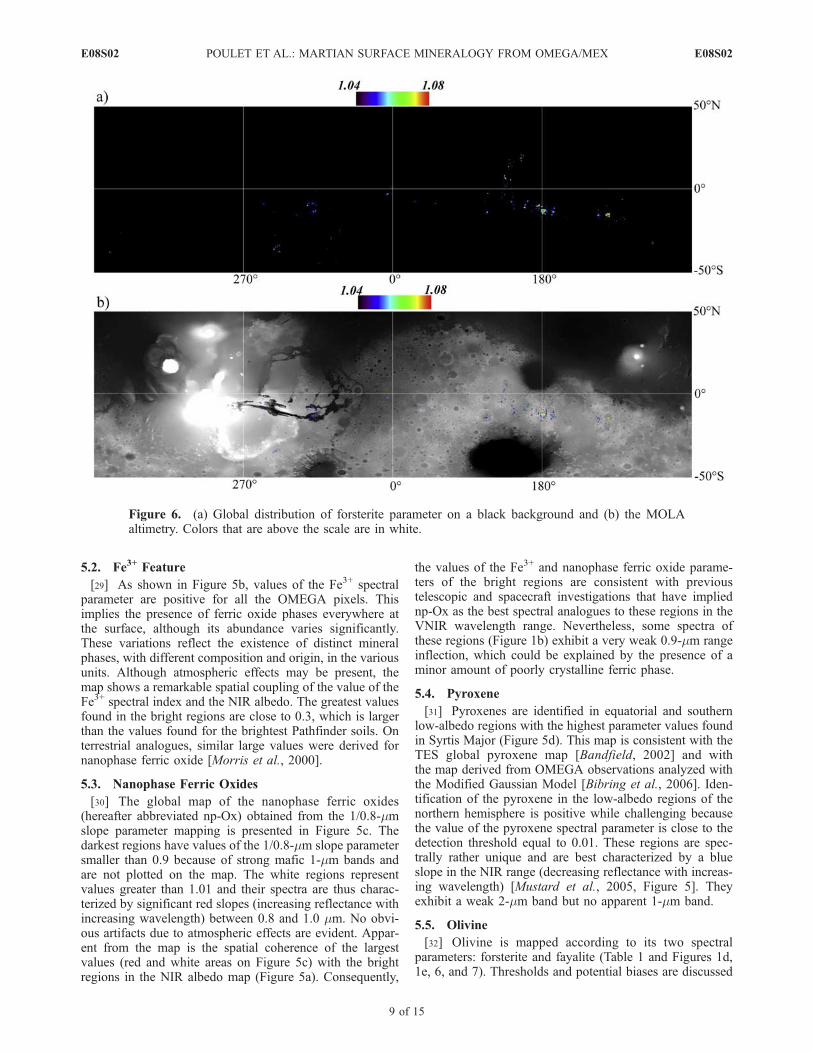
Figure 6. (a) Global distribution of forsterite parameter on a black background and (b) the MOLAaltimetry. Colors that are above the scale are in white.
E08S02 POULET ET AL.: MARTIAN SURFACE MINERALOGY FROM OMEGA/MEX
9 of 15
E08S02
in sections 4.2.3 and 4.3.4. These maps provide the firstglobal olivine distribution map of Mars based on OMEGAobservations.5.5.1. Mg-Rich Olivine[33] All previously identified olivine regions are detected
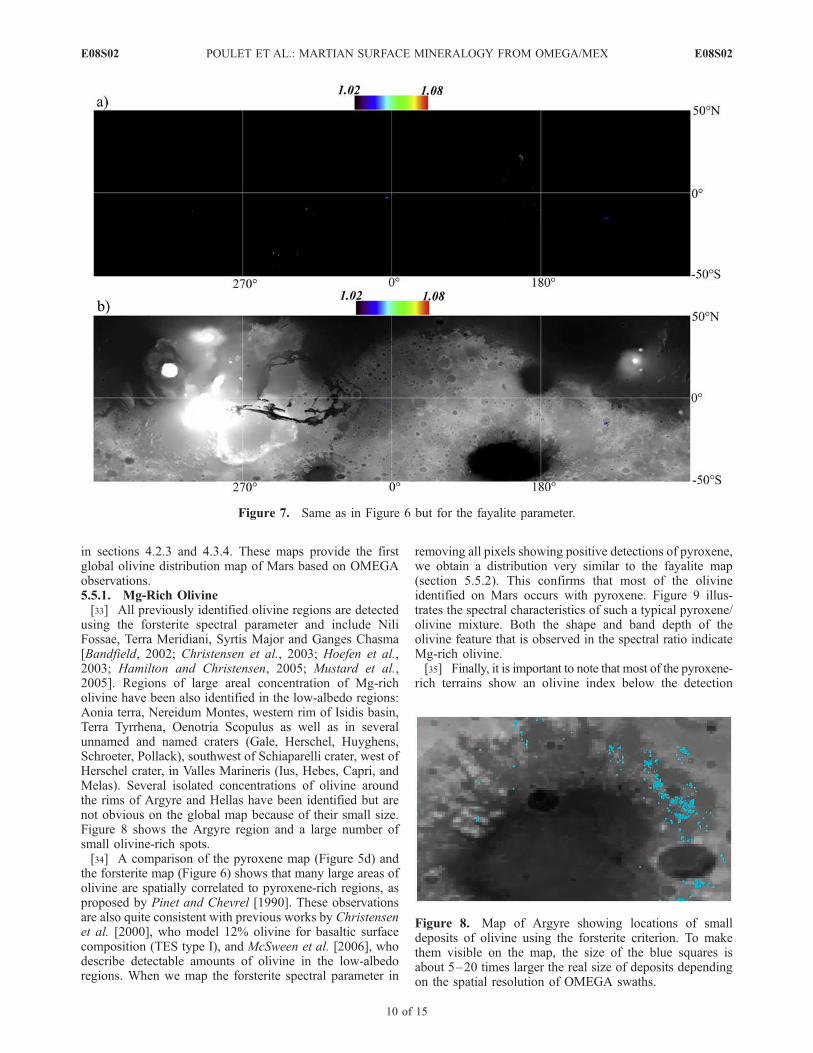
using the forsterite spectral parameter and include NiliFossae, Terra Meridiani, Syrtis Major and Ganges Chasma[Bandfield, 2002; Christensen et al., 2003; Hoefen et al.,2003; Hamilton and Christensen, 2005; Mustard et al.,2005]. Regions of large areal concentration of Mg-richolivine have been also identified in the low-albedo regions:Aonia terra, Nereidum Montes, western rim of Isidis basin,Terra Tyrrhena, Oenotria Scopulus as well as in severalunnamed and named craters (Gale, Herschel, Huyghens,Schroeter, Pollack), southwest of Schiaparelli crater, west ofHerschel crater, in Valles Marineris (Ius, Hebes, Capri, andMelas). Several isolated concentrations of olivine aroundthe rims of Argyre and Hellas have been identified but arenot obvious on the global map because of their small size.Figure 8 shows the Argyre region and a large number ofsmall olivine-rich spots.[34] A comparison of the pyroxene map (Figure 5d) and
the forsterite map (Figure 6) shows that many large areas ofolivine are spatially correlated to pyroxene-rich regions, asproposed by Pinet and Chevrel [1990]. These observationsare also quite consistent with previous works by Christensenet al. [2000], who model 12% olivine for basaltic surfacecomposition (TES type I), and McSween et al. [2006], whodescribe detectable amounts of olivine in the low-albedoregions. When we map the forsterite spectral parameter in
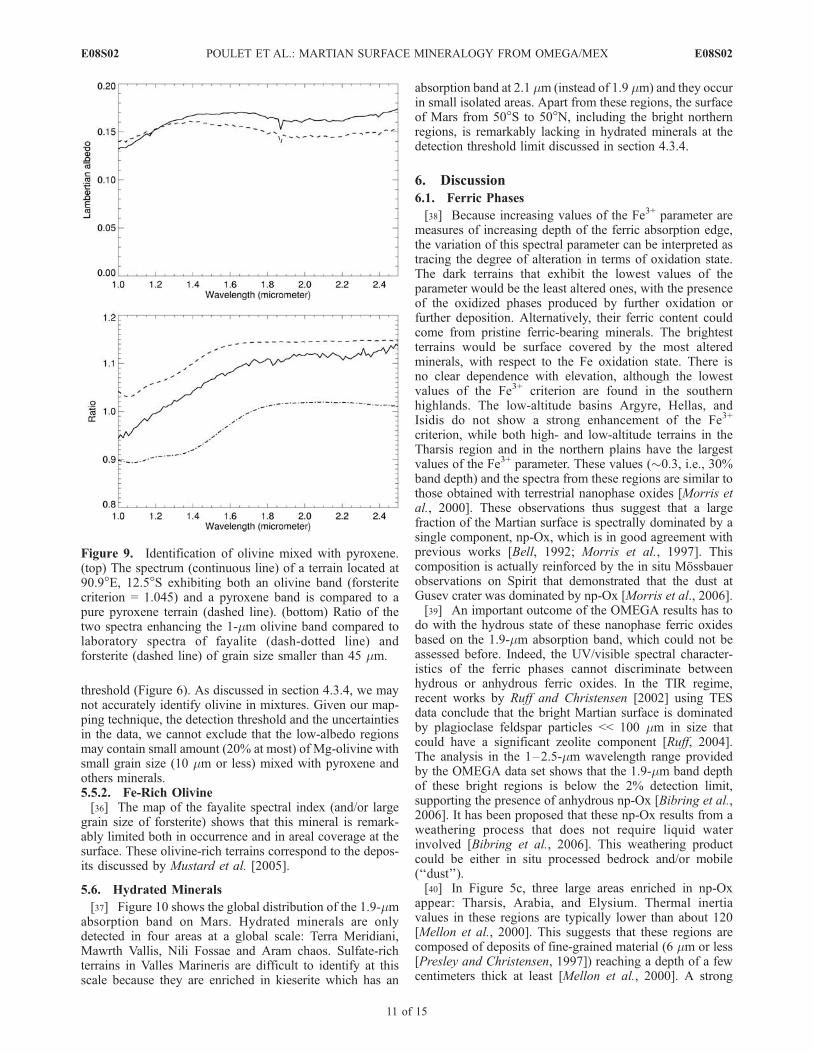
removing all pixels showing positive detections of pyroxene,we obtain a distribution very similar to the fayalite map(section 5.5.2). This confirms that most of the olivineidentified on Mars occurs with pyroxene. Figure 9 illus-trates the spectral characteristics of such a typical pyroxene/olivine mixture. Both the shape and band depth of theolivine feature that is observed in the spectral ratio indicateMg-rich olivine.[35] Finally, it is important to note that most of the pyroxene-
rich terrains show an olivine index below the detection
Figure 7. Same as in Figure 6 but for the fayalite parameter.
Figure 8. Map of Argyre showing locations of smalldeposits of olivine using the forsterite criterion. To makethem visible on the map, the size of the blue squares isabout 5–20 times larger the real size of deposits dependingon the spatial resolution of OMEGA swaths.
E08S02 POULET ET AL.: MARTIAN SURFACE MINERALOGY FROM OMEGA/MEX
10 of 15
E08S02
threshold (Figure 6). As discussed in section 4.3.4, we maynot accurately identify olivine in mixtures. Given our map-ping technique, the detection threshold and the uncertaintiesin the data, we cannot exclude that the low-albedo regionsmay contain small amount (20% at most) of Mg-olivine withsmall grain size (10 mm or less) mixed with pyroxene andothers minerals.5.5.2. Fe-Rich Olivine[36] The map of the fayalite spectral index (and/or large
grain size of forsterite) shows that this mineral is remark-ably limited both in occurrence and in areal coverage at thesurface. These olivine-rich terrains correspond to the depos-its discussed by Mustard et al. [2005].
5.6. Hydrated Minerals
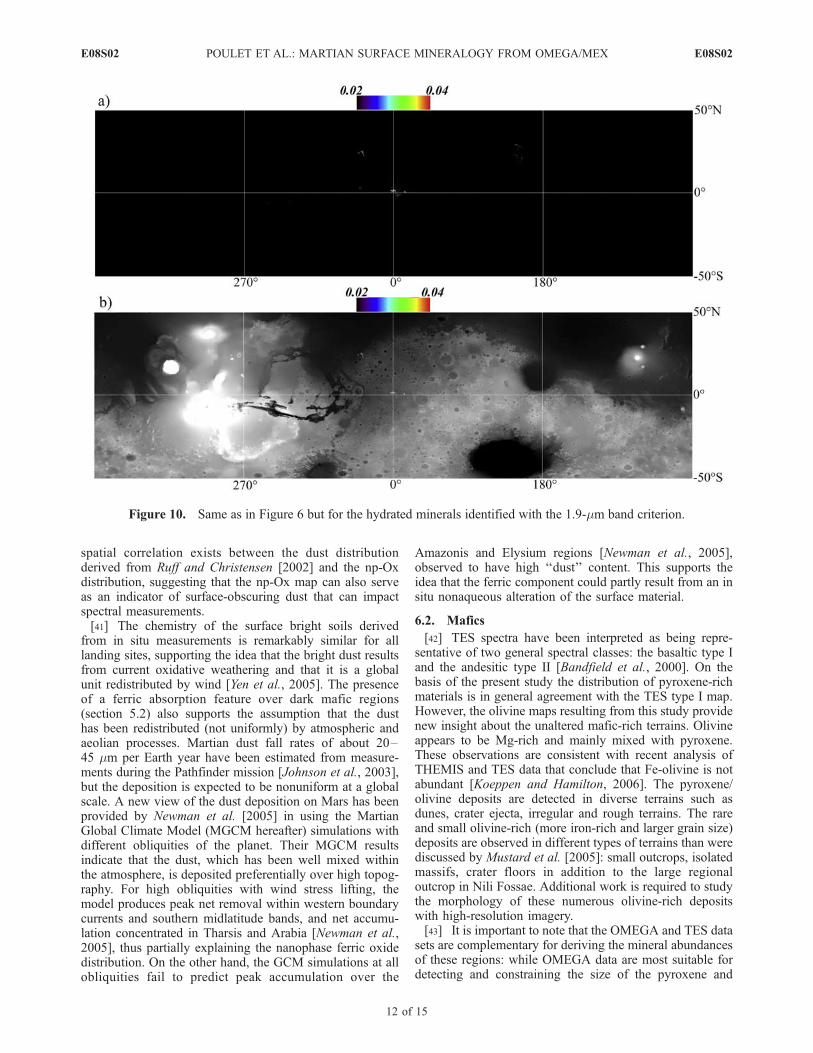
[37] Figure 10 shows the global distribution of the 1.9-mmabsorption band on Mars. Hydrated minerals are onlydetected in four areas at a global scale: Terra Meridiani,Mawrth Vallis, Nili Fossae and Aram chaos. Sulfate-richterrains in Valles Marineris are difficult to identify at thisscale because they are enriched in kieserite which has an
absorption band at 2.1 mm (instead of 1.9 mm) and they occurin small isolated areas. Apart from these regions, the surfaceof Mars from 50�S to 50�N, including the bright northernregions, is remarkably lacking in hydrated minerals at thedetection threshold limit discussed in section 4.3.4.
6. Discussion
6.1. Ferric Phases
[38] Because increasing values of the Fe3+ parameter aremeasures of increasing depth of the ferric absorption edge,the variation of this spectral parameter can be interpreted astracing the degree of alteration in terms of oxidation state.The dark terrains that exhibit the lowest values of theparameter would be the least altered ones, with the presenceof the oxidized phases produced by further oxidation orfurther deposition. Alternatively, their ferric content couldcome from pristine ferric-bearing minerals. The brightestterrains would be surface covered by the most alteredminerals, with respect to the Fe oxidation state. There isno clear dependence with elevation, although the lowestvalues of the Fe3+ criterion are found in the southernhighlands. The low-altitude basins Argyre, Hellas, andIsidis do not show a strong enhancement of the Fe3+
criterion, while both high- and low-altitude terrains in theTharsis region and in the northern plains have the largestvalues of the Fe3+ parameter. These values (�0.3, i.e., 30%band depth) and the spectra from these regions are similar tothose obtained with terrestrial nanophase oxides [Morris etal., 2000]. These observations thus suggest that a largefraction of the Martian surface is spectrally dominated by asingle component, np-Ox, which is in good agreement withprevious works [Bell, 1992; Morris et al., 1997]. Thiscomposition is actually reinforced by the in situ Mossbauerobservations on Spirit that demonstrated that the dust atGusev crater was dominated by np-Ox [Morris et al., 2006].[39] An important outcome of the OMEGA results has to
do with the hydrous state of these nanophase ferric oxidesbased on the 1.9-mm absorption band, which could not beassessed before. Indeed, the UV/visible spectral character-istics of the ferric phases cannot discriminate betweenhydrous or anhydrous ferric oxides. In the TIR regime,recent works by Ruff and Christensen [2002] using TESdata conclude that the bright Martian surface is dominatedby plagioclase feldspar particles << 100 mm in size thatcould have a significant zeolite component [Ruff, 2004].The analysis in the 1–2.5-mm wavelength range providedby the OMEGA data set shows that the 1.9-mm band depthof these bright regions is below the 2% detection limit,supporting the presence of anhydrous np-Ox [Bibring et al.,2006]. It has been proposed that these np-Ox results from aweathering process that does not require liquid waterinvolved [Bibring et al., 2006]. This weathering productcould be either in situ processed bedrock and/or mobile(‘‘dust’’).[40] In Figure 5c, three large areas enriched in np-Ox
appear: Tharsis, Arabia, and Elysium. Thermal inertiavalues in these regions are typically lower than about 120[Mellon et al., 2000]. This suggests that these regions arecomposed of deposits of fine-grained material (6 mm or less[Presley and Christensen, 1997]) reaching a depth of a fewcentimeters thick at least [Mellon et al., 2000]. A strong
Figure 9. Identification of olivine mixed with pyroxene.(top) The spectrum (continuous line) of a terrain located at90.9�E, 12.5�S exhibiting both an olivine band (forsteritecriterion = 1.045) and a pyroxene band is compared to apure pyroxene terrain (dashed line). (bottom) Ratio of thetwo spectra enhancing the 1-mm olivine band compared tolaboratory spectra of fayalite (dash-dotted line) andforsterite (dashed line) of grain size smaller than 45 mm.
E08S02 POULET ET AL.: MARTIAN SURFACE MINERALOGY FROM OMEGA/MEX
11 of 15
E08S02
spatial correlation exists between the dust distributionderived from Ruff and Christensen [2002] and the np-Oxdistribution, suggesting that the np-Ox map can also serveas an indicator of surface-obscuring dust that can impactspectral measurements.[41] The chemistry of the surface bright soils derived
from in situ measurements is remarkably similar for alllanding sites, supporting the idea that the bright dust resultsfrom current oxidative weathering and that it is a globalunit redistributed by wind [Yen et al., 2005]. The presenceof a ferric absorption feature over dark mafic regions(section 5.2) also supports the assumption that the dusthas been redistributed (not uniformly) by atmospheric andaeolian processes. Martian dust fall rates of about 20–45 mm per Earth year have been estimated from measure-ments during the Pathfinder mission [Johnson et al., 2003],but the deposition is expected to be nonuniform at a globalscale. A new view of the dust deposition on Mars has beenprovided by Newman et al. [2005] in using the MartianGlobal Climate Model (MGCM hereafter) simulations withdifferent obliquities of the planet. Their MGCM resultsindicate that the dust, which has been well mixed withinthe atmosphere, is deposited preferentially over high topog-raphy. For high obliquities with wind stress lifting, themodel produces peak net removal within western boundarycurrents and southern midlatitude bands, and net accumu-lation concentrated in Tharsis and Arabia [Newman et al.,2005], thus partially explaining the nanophase ferric oxidedistribution. On the other hand, the GCM simulations at allobliquities fail to predict peak accumulation over the
Amazonis and Elysium regions [Newman et al., 2005],observed to have high ‘‘dust’’ content. This supports theidea that the ferric component could partly result from an insitu nonaqueous alteration of the surface material.
6.2. Mafics
[42] TES spectra have been interpreted as being repre-sentative of two general spectral classes: the basaltic type Iand the andesitic type II [Bandfield et al., 2000]. On thebasis of the present study the distribution of pyroxene-richmaterials is in general agreement with the TES type I map.However, the olivine maps resulting from this study providenew insight about the unaltered mafic-rich terrains. Olivineappears to be Mg-rich and mainly mixed with pyroxene.These observations are consistent with recent analysis ofTHEMIS and TES data that conclude that Fe-olivine is notabundant [Koeppen and Hamilton, 2006]. The pyroxene/olivine deposits are detected in diverse terrains such asdunes, crater ejecta, irregular and rough terrains. The rareand small olivine-rich (more iron-rich and larger grain size)deposits are observed in different types of terrains than werediscussed by Mustard et al. [2005]: small outcrops, isolatedmassifs, crater floors in addition to the large regionaloutcrop in Nili Fossae. Additional work is required to studythe morphology of these numerous olivine-rich depositswith high-resolution imagery.[43] It is important to note that the OMEGA and TES data
sets are complementary for deriving the mineral abundancesof these regions: while OMEGA data are most suitable fordetecting and constraining the size of the pyroxene and
Figure 10. Same as in Figure 6 but for the hydrated minerals identified with the 1.9-mm band criterion.
E08S02 POULET ET AL.: MARTIAN SURFACE MINERALOGY FROM OMEGA/MEX
12 of 15
E08S02
olivine grains, TES provides identification of the feldspaticcomponents. In a more general sense, significant newinsights are likely to be gained by combining data fromthe two wavelength regions, enabling well resolved mineralidentifications and providing estimates of abundances.
6.3. Northern Low-Albedo Regions
[44] Several hypotheses have been presented to explainthe apparent andesitic character of the Acidalia-type spec-trum: weathering of basalt to produce clay minerals [Wyattand McSween, 2002], silica coating basalt [Kraft et al.,2003], water-bearing minerals such as opaline, silica-richallophane like mineraloids, and the most silica-rich zeolites[Michalski et al., 2005], oxidation and recrystallisation of aSNC-type basalt [Minitti et al., 2002], palagonization ofbasalt [Morris et al., 2003], oxidation at high temperature ofa glass-rich basalt flows [Minitti et al., 2005]. Theseproposed mineralogies and implied origins offer broadpossibilities for processes of formation. OMEGA observa-tions show unique spectral attributes: very weak basalticsignature, strong blue slope in the NIR and lack of thehydration band at 1.9 mm. The lack of hydration band helpsdiscriminate between the previously proposed composi-tions. Clays that exhibit significant 1.9-mm feature associ-ated with metal-OH bands in the 2.1–2.5-mm wavelengthregion should be excluded. This is in agreement with arecent reassessment of the TES data [Michalski et al., 2005].Since water processing is required to form silica coatings,silica-coated basalt would be expected to exhibit significantwater molecular bands, as confirmed by USGS laboratoryspectra [Clark et al., 1993]. Therefore silica-coated basaltsas well as water-bearing minerals such as opaline, silica-richallophane like mineraloids, and the most silica-rich zeolitesalso proposed as putative candidates [Michalski et al., 2005]are not consistent with the OMEGA results. The NIR andthermal spectral properties of oxidized, partially crystallineSNC-based basaltic materials measured in the laboratory arein general not consistent with the spectrally blue materialscontained in these dark regions, as has been assessed by alater reanalysis of the spectral properties of oxidized,Martian meteorite-like basalts [Hamilton and Minitti,2003]. Finally, the andesitic composition and the resultinglarge proportion of high-Si obsidian glass necessary toreproduce the TES spectra is also problematic. Althoughsome crystallization conditions that would yield dry, high-SiO2 glass can be conceived, the obsidian that is the resultof volcanic lava coming in contact with water should beidentified by a 1.9-mmwater absorption band in the OMEGAspectra.[45] As mentioned previously, another model to explain
Si-rich minerals could be a palagonization of basalt [Morriset al., 2003] or similarly partial weathering of surface type Irocks [McSween et al., 2003]. Actually, OMEGA spectraand observations of thin coatings of iron oxides on a dark(i.e., basaltic) substrate are spectrally similar [Singer andRoush, 1983]. At shorter wavelengths, the brighter coatingis optically thick keeping albedo high, while at longerwavelength it becomes increasingly transparent so that thebasaltic substrate becomes spectrally dominant. If surfacesof dark material are moderately weathered in the form of athin varnish of ferric oxide-bearing rinds, this would pro-duce this ‘‘blue’’ NIR continuum slope without water band
at 1.9 mm. Another very interesting process that produces ananhydrous, ferric coating over a glass-rich basaltic substrateconsists in an oxidation of a basaltic substrate at hightemperatures (700� and 900�C) in air and CO2 [Minitti etal., 2005]. This process can be also considered as possible.[46] However, an alternative origin can be also proposed.
Occurrences of materials showing the same spectral char-acteristics of type II material have been found in the floor ofsome craters located in the equatorial region. Dark impactglasses have a typical blue slope with no mafic absorptionband [Schultz and Mustard, 2004]. Therefore this darkmaterial could imply the presence of impact melts orglasses. This would support the assumption that depositsof impact melts and glasses produced by major impactssince the late Hesperian could provide an alternative inter-pretation for surface composition type II spectra [Schultzand Mustard, 2004].
6.4. Hydrated Minerals
[47] The water-bearing minerals identified by the 1.9-mmspectral criterion are locally in restricted sites at the surfaceof Mars. The implications of these detections of majorimportance to trace the past environment are still underinvestigation, but the major trends have been stated [Bibringet al., 2006]: a first phyllocian period (formation of phyllo-silicates) indicating an aqueous alteration very early in itshistory, followed by a theeikian phase during which sulfateswere formed in an acidic environment.
7. Conclusion
[48] The global maps summarized in this work confirmthe general trends of the distribution of surface material atMars. The low-albedo regions have a pyroxene-rich com-position; the bright regions are spectrally comparable toanhydrous nanophase ferric oxides. A comparison of theglobal ‘‘dust’’ global distribution with the past and presentdust activities simulated with GCM indicates that large partsof the bright regions (Amazonis and Elysium) should not becovered by such a ferric component. It is therefore proposedthat this ferric material may be not only a large-scale mobilecomponent, but could partly result from in situ alteration.Olivine is identified in large areas associated with low-albedo pyroxene-rich highlands. Values of the olivine spec-tral indexes indicate that olivine is dominantly Mg-rich withgrain size distribution likely less than 100 mm. The detec-tion limit of olivine depends on the grain size. Mg-richolivine as fine grains (10 mm in size typically) could bewidely distributed in the pyroxene-rich terrains at abun-dance <20%, and not detected spectrally. By contrast,deposits containing coarse grain size distribution of forster-ite, and/or more iron-rich forsterite at many grain sizes, canbe detected in localized areas. Our best model to explain theVNIR spectral properties of the northern regions is that thinferric coating or varnish is present on dark basaltic sub-strate. Such a composition could be consistent with TESobservations. Finally, hydrated minerals have been detectedin a variety of spatially restricted and highly specific areas.[49] The next step of our analysis will consist of (1)
retrieving abundances and assessing physical parameterssuch as mean grain size distribution for each mineral,through nonlinear deconvolution [Poulet and Erard, 2004],
E08S02 POULET ET AL.: MARTIAN SURFACE MINERALOGY FROM OMEGA/MEX
13 of 15
E08S02
and (2) initiating a systematic study using OMEGA resultsto complement those of thermal instruments, MGS/TES,and Odyssey/THEMIS, sensitive to non-Fe-bearingminerals such as plagioclase.
[50] Acknowledgments. At the time of this writing (beginning 2007),OMEGA is in excellent health and still targeting the surface of Mars. Itsperformance and longevity are testimony to the efforts of talented anddedicated engineers and scientists who made the ESA/Mars Expressmission and the OMEGA instrument possible. We would also like to thankMichelle Minitti and an anonymous reviewer for thorough and insightfulreviews. This work was partially supported by the CNES.
ReferencesArvidson, R. E., F. Poulet, J.-P. Bibring, M. Wolff, A. Gendrin, R. V. Morris,J. J. Freeman, Y. Langevin, N. Mangold, and G. Bellucci (2005), Spectralreflectance and morphologic correlations in Eastern Terra Meridiani,Mars, Science, 307, 1591–1594, doi:10.1126/science.1109509.
Bandfield, J. L. (2002), Global mineral distributions on Mars, J. Geophys.Res., 107(E6), 5042, doi:10.1029/2001JE001510.
Bandfield, J. L., V. E. Hamilton, and P. R. Christensen (2000), A globalview of Martian surface compositions from MGS-TES, Science, 287,1626–1630.
Bell, J. F., III (1992), Charge-coupled device imaging spectroscopy of Mars2: Results and implications for Martian ferric mineralogy, Icarus, 100,575–597.
Bell, J. F., III, R. V. Morris, and J. B. Adams (1993), Thermally alteredpalagonitic tephra: A spectral and process analog to the soil and dust ofMars, J. Geophys. Res., 98, 3373–3385.
Bell, J. F., III, et al. (2000). Mineralogic and compositional properties ofMartian soil and dust: Results from Mars Pathfinder, J. Geophys. Res.,105, 1721–1756.
Bellucci, G., F. Altieri, J.-P. Bibring, G. Bonello, Y. Langevin, B. Gondet,and F. Poulet (2006), OMEGA/Mars Express: Visual channel perfor-mances and data reduction techniques, Planet. Space Sci., 54, 675–684, doi:10.1016/j.pss.2006.03.006.
Bibring, J.-P., et al. (2004) OMEGA: Observatoire pour le Mineralogie,l’Eau, les Glaces et l’Activite, Eur. Space Agency Spec. Publ., ESA SP1240, 37–49.
Bibring, J.-P., et al. (2005), Mars surface diversity as revealed by theOMEGA/Mars Express observations, Science, 307, 1576 – 1581,doi:10.1126/science.1109509.
Bibring, J.-P., Y. Langevin, J.Mustard, F. Poulet, R. E. Arvidson, A. Gendrin,B. Gondet, N. Mangold, P. Pinet, and F. Forget (2006), Global mineralo-gical and aqueous Mars history derived from OMEGA/Mars Express data,Science, 312, 400–404, doi:10.1126/science.1122659.
Bishop, J. L., C. M. Pieters, R. G. Burns, J. O. Edwards, R. L. Mancinelli,and H. Froeschl (1995), Reflectance spectroscopy of ferric sulfate-bearingmontmorillonites as Mars soil analog materials, Icarus, 117, 101–119.
Bonello, G., J.-P. Bibring, A. Soufflot, Y. Langevin, B. Gondet, M. Berthe,and C. Carabetian (2005), The ground calibration setup of OMEGA andVIRTIS experiments: Description and performances, Planet. Space Sci.,53, 711–728.
Christensen, P. R., et al. (1998), Results from the Mars Global SurveyorThermal Emission Spectrometer investigation, Science, 279, 1692–1698.
Christensen, P. R., J. L. Bandfield, M. D. Smith, V. E. Hamilton, andR. N. Clark (2000), Identification of a basaltic component on theMartian surface from Thermal Emission Spectrometer data, J. Geo-phys. Res., 105, 9609–9621.
Christensen, P. R., et al. (2003), Morphology and composition of the sur-face of Mars: Mars Odyssey THEMIS results, Science, 300, 2056–2061.
Christensen, P. R., et al. (2005), Evidence for igneous diversity and mag-matic evolution on Mars from infrared spectral observations, Nature, 436,504–509.
Clark, R. N., and P. G. Lucey (1984), Spectral properties of ice-particulatemixtures and implications for remote sensing: 1. Intimate mixtures,J. Geophys. Res., 89, 6341–6348.
Clark, R. N., G. A. Swayze, A. J. Gallagher, T. V. V. King, and W. M.Calvin (1993), The Geological U.S. Survey, Digital Spectral Library:Version 1 (0.2 to 3.0mm), U.S. Geol. Surv. Open File Rep., 93–592,1340 pp. (Available at http://speclab.cr.usgs.gov/spectral.lib04/clark1993/spectral_lib.html.)
Cloutis, E. A., et al. (2006), Detection and discrimination of sulfate miner-als using reflectance spectroscopy, Icarus, 184, 121–157.
Cooper, C. D., and J. F. Mustard (1999), Effects of very fine particle size onreflectance spectra of smectite and palagonitic soil, Icarus, 142, 557–570.
De Grenier, M., and P. Pinet (1995), Near opposition Martian limb-darkening: Quantification and implication for visible near infrared bidir-ectional reflectance studies, Icarus, 115, 354–368.
Farrand, W. H., J. F. Bell III, J. R. Johnson, S. W. Squyres, J. Soderblom,and D. W. Ming (2006), Spectral variability among rocks in visible andnear-infrared multispectral Pancam data collected at Gusev crater: Exam-inations using spectral mixture analysis and related techniques, J. Geo-phys. Res., 111, E02S15, doi:10.1029/2005JE002495.
Fischer, E. M., and C. M. Pieters (1993), The continuum slope of Mars:Bidirectional reflectance investigations and applications to OlympusMons, Icarus, 102, 185–202.
Gaffey, S. J., L. A. McFadden, D. Nash, and C. Pieters (1993), Ultraviolet,visible and near-infrared reflectance spectroscopy: Laboratory spectra ofgeologic materials, in Remote Geochemical Analysis: Elemental andMineralogical Composition, edited by C. Pieters and P. A. J. Englert,pp. 43–77, Cambridge Univ. Press, New York.
Gendrin, A., et al. (2005), Sulfates in Martian layered terrains: TheOMEGA/Mars Express view, Science, 307, 1587–1591, doi:10.1126/science.1109509.
Gondet, B., J.-P. Bibring, Y. Langevin, F. Poulet, F. Montmessin, andF. Forget (2006), One Martian year observation of H2O ice clouds byOMEGA/Mars Express, in Second Workshop on Mars Atmosphere Mod-elling and Observations, edited by F. Forget et al., p. 251, Eur. SpaceAgency, Granada, Spain.
Hamilton, V. E., and P. R. Christensen (2005), Evidence for extensive,olivine-rich bedrock on Mars, Geology, 33, 433–436.
Hamilton, V. E., and M. E. Minitti (2003), Are oxidized shergottite-likebasalts an alternative to ‘‘andesite’’ on Mars?, Geophys. Res. Lett.,30(18), 1915, doi:10.1029/2003GL017839.
Hapke, B. (1993), Theory of Reflectance and Emittance Spectroscopy,Cambridge Univ. Press, New York.
Harloff, J., and G. Arnold (2001), Near-infrared reflectance spectroscopy ofbulk analog materials for planetary crust, Planet. Space Sci., 49, 191–211.
Hoefen, T. M., R. N. Clark, J. L. Bandfield, M. D. Smith, J. C. Pearl, andP. R. Christensen (2003), Discovery of olivine in the Nili Fossae regionof Mars, Science, 302, 627–630.
Johnson, J. R., and W. M. Grundy (2001), Visible/near-infrared spectra andtwo layer modeling of palagonite-coated basalts, Geophys. Res. Lett., 28,2101–2104.
Johnson, J. R., W. M. Grundy, and M. T. Lemmon (2003), Dust depositionat the Mars Pathfinder landing site: Observations and modeling of visible/near infrared spectra, Icarus, 163, 330–346.
Klingelhofer, G., et al. (2004), Jarosite and hematite at Meridiani Planumfrom the Mossbauer spectrometer on the Opportunity rover, Science, 306,1740–1745.
Koeppen, W. C., and V. E. Hamilton (2006), The distribution and composi-tion of olivine on Mars, Lunar Planet. Sci. [CD-ROM], XXXVII, Abstract1964.
Kraft, M. D., J. R. Michalski, and T. G. Sharp (2003), Effects of pure silicacoatings on thermal emission spectra of basaltic rocks: Considerations forMartian surface mineralogy, Geophys. Res. Lett., 30(24), 2288,doi:10.1029/2003GL018848.
Langevin, Y., F. Poulet, J.-P. Bibring, and B. Gondet (2005a), Sulfates inthe north polar region of Mars detected by OMEGA/Mars Express,Science, 307, 1584–1586.
Langevin, Y., F. Poulet, J.-P. Bibring, B. Schmitt, S. Doute, and B. Gondet(2005b), Summer evolution of the north polar cap of Mars as observed byOMEGA/Mars Express, Science, 307, 1581–1584.
Langevin, Y., J.-P. Bibring, F. Montmessin, F. Forget, M. Vincendon,S. Doute, F. Poulet, and B. Gondet (2007), Observations of the southseasonal cap of Mars during recession in 2004–2006 by the OMEGAvisible/near-infrared imaging spectrometer on board Mars Express,J. Geophys. Res., doi:10.1029/2006JE002841, in press.
Loizeau, D., et al. (2007), Phyllosilicates in the Mawrth Vallis region ofMars, J. Geophys. Res., doi:10.1029/2006JE002877, in press.
Mangold, N., et al. (2007), Mineralogy of the Nili Fossae region withOMEGA/Mars Express data: 2. Aqueous alteration of the crust, J. Geo-phys. Res., doi:10.1029/2006JE002835, in press.
McSween, H. Y., Jr., T. L. Grove, and M. B. Wyatt (2003), Constraints onthe composition and petrogenesis of the Martian crust, J. Geophys. Res.,108(E12), 5135, doi:10.1029/2003JE002175.
McSween, H. Y., Jr., et al. (2006), Characterization and petrologic inter-pretation of olivine-rich basalts at Gusev Crater, Mars, J. Geophys. Res.,111, E02S10, doi:10.1029/2005JE002477.
Mellon, M. T., B. M. Jakosky, H. H. Kieffer, and P. R. Christensen (2000),High resolution thermal inertia mapping from the Mars Global SurveyorThermal Emission Spectrometer, Icarus, 148, 437–455.
Michalski, J. R., M. D. Kraft, T. G. Sharp, L. B. Williams, and P. R.Christensen (2005), Mineralogical constraints on the high-silica Martiansurface component observed by TES, Icarus, 174, 161–177.
E08S02 POULET ET AL.: MARTIAN SURFACE MINERALOGY FROM OMEGA/MEX
14 of 15
E08S02
Minitti, M. E., J. F. Mustard, and M. J. Rutherford (2002), Effects of glasscontent and oxidation on the spectra of SNC-like basalts: Applications toMars remote sensing, J. Geophys. Res., 107(E5), 5030, doi:10.1029/2001JE001518.
Minitti, M. E., M. D. Lane, and J. L. Bishop (2005), A new hematiteformationon Mars, Meteoritics Planet Sci., 40, 55–69.
Morris, R. V., D. G. Agresti, H. V. Lauer Jr., J. A. Newcomb, T. D. Shelfer,and A. V. Murali (1989), Evidence for pigmentary hematite on Marsbased on optical, magnetic, and Mossbauer studies of superparamagnetic(nanocrystalline) hematite, J. Geophys. Res., 94, 2760–2778.
Morris, R. V., D. C. Golden, J. F. Bell III, H. V. Lauer Jr., and J. B. Adams(1993), Pigmenting agents in Martian soils: Inferences from spectral,Mossbauer, and magnetic properties of nanophase and other iron oxidesin Hawaiian palagonitic soil PN-9, Geochim. Cosmochim. Acta, 57,4597–4609.
Morris, R. V., D. C. Golden, and J. F. Bell III (1997), Low-temperaturereflectivity spectra of red hematite and the color of Mars, J. Geophys.Res., 102, 9125–9134.
Morris, R. V., et al. (2000), Mineralogy, composition, and alteration of MarsPathfinder rocks and soils: Evidence from multispectral, elemental, andmagnetic data on terrestrial analogue, SNC meteorite, and Pathfindersamples, J. Geophys. Res., 105, 1757–1817.
Morris, R. V., T. G. Graff, S. A. Mertzman, M. D. Lane, and P. R.Christensen (2003), Palagonitic (not andesitic) Mars: Evidence from ther-mal emission and VNIR spectra of palagonitic alteration rinds on basalticrock, paper presented at Sixth International Conference on Mars, Lunarand Planet. Inst., Pasadena, Calif.
Morris, R. V., et al. (2004), Moessbauer mineralogy on Mars: First resultsfrom the Spirit landing site in Gusev Crater, Science, 305, 833–836.
Morris, R. V., et al. (2006), Mossbauer mineralogy of rock, soil, and dust atGusev Crater, Mars: Spirit’s journey through weakly altered olivine basalton the plains and pervasively altered basalt in the Columbia Hills,J. Geophys. Res., 111, E02S13, doi:10.1029/2005JE002584.
Murchie, S., L. Kirkland, S. Erard, J. Mustard, and M. Robinson (2000),Near-infrared spectral variations of Martian surface materials from ISMimaging spectrometer data, Icarus, 147, 444–471.
Mustard, J. F., F. Poulet, A. Gendrin, J.-P. Bibring, Y. Langevin, B. Gondet,N. Mangold, G. Bellucci, and F. Altieri (2005), Olivine and pyroxenediversity in the crust of Mars, Science, 307, 1594–1597, doi:10.1126/science.1109509.
Newman, C. E., S. R. Lewis, and P. L. Read (2005), The atmosphericcirculation and dust activity in different orbital epochs on Mars, Icarus,174, 135–160, doi:10.1016/j.icarus.2004.10.023.
Pinet, P., and S. Chevrel (1990), Spectral identification of geological unitson the surface of Mars related to the presence of silicates from earthbasednear-infrared telescopic CCD imaging, J. Geophys. Res., 95, 14,435–14,446.
Pinet, P., et al. (2006) Detection and regional mapping of mafic mineralsacross Syrtis Major from OMEGA/Mars Express observations in thevisible-near infrared domain by means of MGM deconvolution, paperpresented at European Planetary Science Congress 2006, Eur. Planet.Network, Berlin.
Poulet, F., and S. Erard (2004), Nonlinear spectral mixing: Quantitativeanalysis of laboratory mineral mixtures, J. Geophys. Res., 109,E02009, doi:10.1029/2003JE002179.
Poulet, F., J.-P. Bibring, J. F. Mustard, A. Gendrin, N. Mangold, Y. Langevin,R. E. Arvidson, B. Gondet, and C. Gomez (2005), Phyllosilicates on Marsand implications for early Martian climate, Nature, 438, 623–628.
Presley, M. A., and P. R. Christensen (1997), Thermal conductivity mea-surements of particulate materials: 2. Results, J. Geophys. Res., 102,6551–6566.
Roush, T. L., F. Esposito, G. R. Rossman, and L. Colangeli (2006),Gypsum optical constants in the visible and near-infrared: Real andimagined, Lunar Planet. Sci. [CD-ROM], 1188.
Ruff, S. W. (2004), Spectral evidence for zeolite in the dust on Mars,Icarus, 168, 131–143.
Ruff, S. W., and P. R. Christensen (2002), Bright and dark regions on Mars:Particle size and mineralogical characteristics based on Thermal EmissionSpectrometer data, J. Geophys. Res., 107(E12), 5127, doi:10.1029/2001JE001580.
Schultz, P. H., and J. F. Mustard (2004), Impact melts and glasses on Mars,J. Geophys. Res., 109, E01001, doi:10.1029/2002JE002025.
Shkuratov, Y., L. Starukhina, H. Hoffmann, and G. Arnold (1999), A modelof spectral albedo of particulate surfaces: Implications for optical proper-ties of the moon, Icarus, 137, 235–246.
Singer, R. B., and T. B. McCord (1979), Mars: large scale mixing of brightand dark materials and properties of dark material, Proc. Lunar Planet.Sci. Conf., 10, 1128–1130.
Singer, R. B., and T. R. Roush (1983), Spectral reflectance properties ofparticulate weathered coatings on rocks: Laboratory modeling and applic-ability to Mars, Proc. Lunar Planet. Sci. Conf., 14, 708–709.
Squyres, S. W., et al. (2004), The opportunity Rover’s Athena ScienceInvestigation at Meridiani Planum, Mars, Science, 306, 1698–1703,doi:10.1126/science.1106171.
Wells, E. N., J. Veverka, and P. Thomas (1984), Mars: Experimental studyof albedo changes caused by dust fallout, Icarus, 587, 331–338.
Wyatt, M. B., and H. Y. McSween (2002), Spectral evidence for weatheredbasalt as an alternative to andesite in the Martian lowlands of Mars,Nature, 417, 263–266.
Yen, A. S., et al. (2005), An integrated view of the chemistry and miner-alogy of Martian soils, Nature, 436, 49–54, doi:10.1038/nature03637.
�����������������������G. Belluci, Istituto Nazionale Di Astrofiscia dello Spazio Interplanetario,
Rome, I-00133 Italy.J.-P. Bibring, C. Gomez, B. Gondet, Y. Langevin, and F. Poulet, Institut
d’Astrophysique Spatiale, CNRS/Universite Paris-Sud,OrsayCedex, F-91405France. ([email protected])J. Mustard, Geological Sciences, Brown University, Providence, RI
02912, USA.P. Pinet, DTP/UMR5562, CNRS, Toulouse, F-31400 France.
E08S02 POULET ET AL.: MARTIAN SURFACE MINERALOGY FROM OMEGA/MEX
15 of 15
E08S02