marquette law school poll – august 13-16, 2015 … law school poll – august 13-16, 2015 results...
TRANSCRIPT
Marquette Law School Poll – August 13-16, 2015
Results for Registered Voters
(Percentages are rounded to whole numbers for reporting of results. Values ending in .5 here may round up or down if they are slightly above .5 or slightly below. Frequencies have been rounded to whole numbers but percentages are
calculated based on non-integer weighted sample sizes.)
S2. Record Gender: (INTERVIEWER NOTE: DO NOT ASK, JUST
RECORD)
Frequency Percent Valid Percent Cumulative
Percent Valid Male 375 46.8 46.8 46.8
Female 427 53.2 53.2 100.0 Total 802 100.0 100.0
S3a. Do you currently live in Wisconsin?
Frequency Percent Valid Percent Cumulative
Percent Valid Yes 802 100.0 100.0 100.0
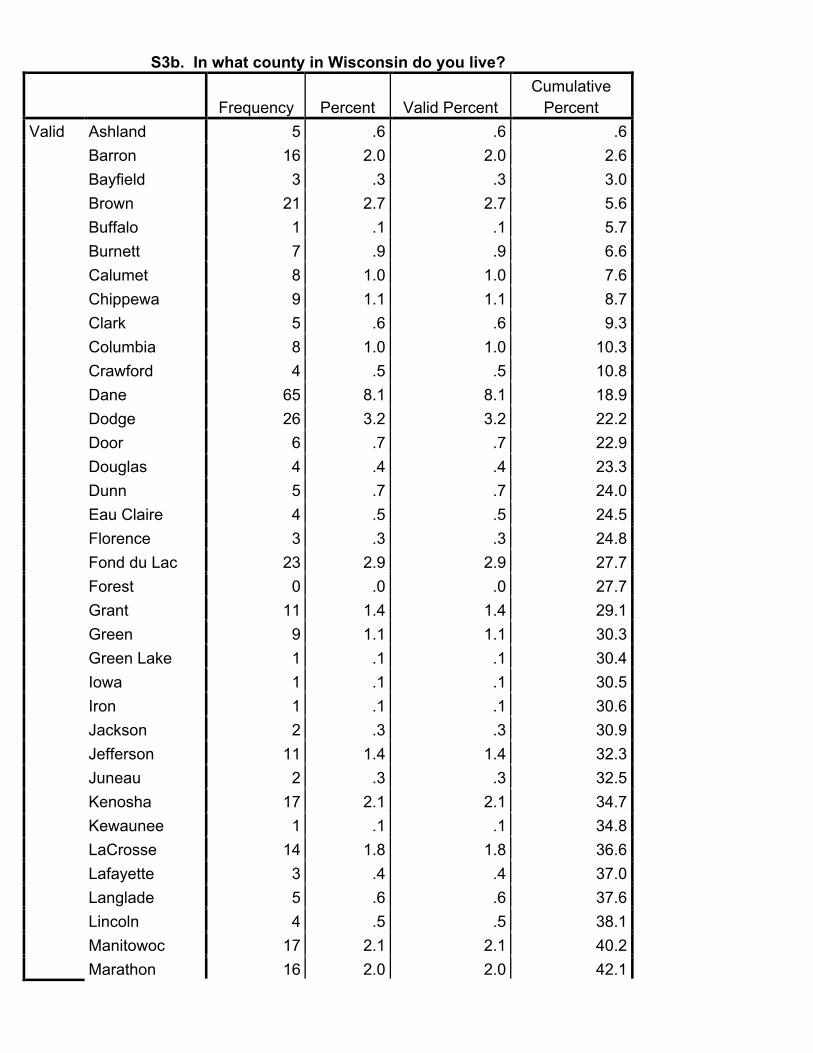
S3b. In what county in Wisconsin do you live?
Frequency Percent Valid Percent Cumulative
Percent Valid Ashland 5 .6 .6 .6
Barron 16 2.0 2.0 2.6 Bayfield 3 .3 .3 3.0 Brown 21 2.7 2.7 5.6 Buffalo 1 .1 .1 5.7 Burnett 7 .9 .9 6.6 Calumet 8 1.0 1.0 7.6 Chippewa 9 1.1 1.1 8.7 Clark 5 .6 .6 9.3 Columbia 8 1.0 1.0 10.3 Crawford 4 .5 .5 10.8 Dane 65 8.1 8.1 18.9 Dodge 26 3.2 3.2 22.2 Door 6 .7 .7 22.9 Douglas 4 .4 .4 23.3 Dunn 5 .7 .7 24.0 Eau Claire 4 .5 .5 24.5 Florence 3 .3 .3 24.8 Fond du Lac 23 2.9 2.9 27.7 Forest 0 .0 .0 27.7 Grant 11 1.4 1.4 29.1 Green 9 1.1 1.1 30.3 Green Lake 1 .1 .1 30.4 Iowa 1 .1 .1 30.5 Iron 1 .1 .1 30.6 Jackson 2 .3 .3 30.9 Jefferson 11 1.4 1.4 32.3 Juneau 2 .3 .3 32.5 Kenosha 17 2.1 2.1 34.7 Kewaunee 1 .1 .1 34.8 LaCrosse 14 1.8 1.8 36.6 Lafayette 3 .4 .4 37.0 Langlade 5 .6 .6 37.6 Lincoln 4 .5 .5 38.1 Manitowoc 17 2.1 2.1 40.2 Marathon 16 2.0 2.0 42.1
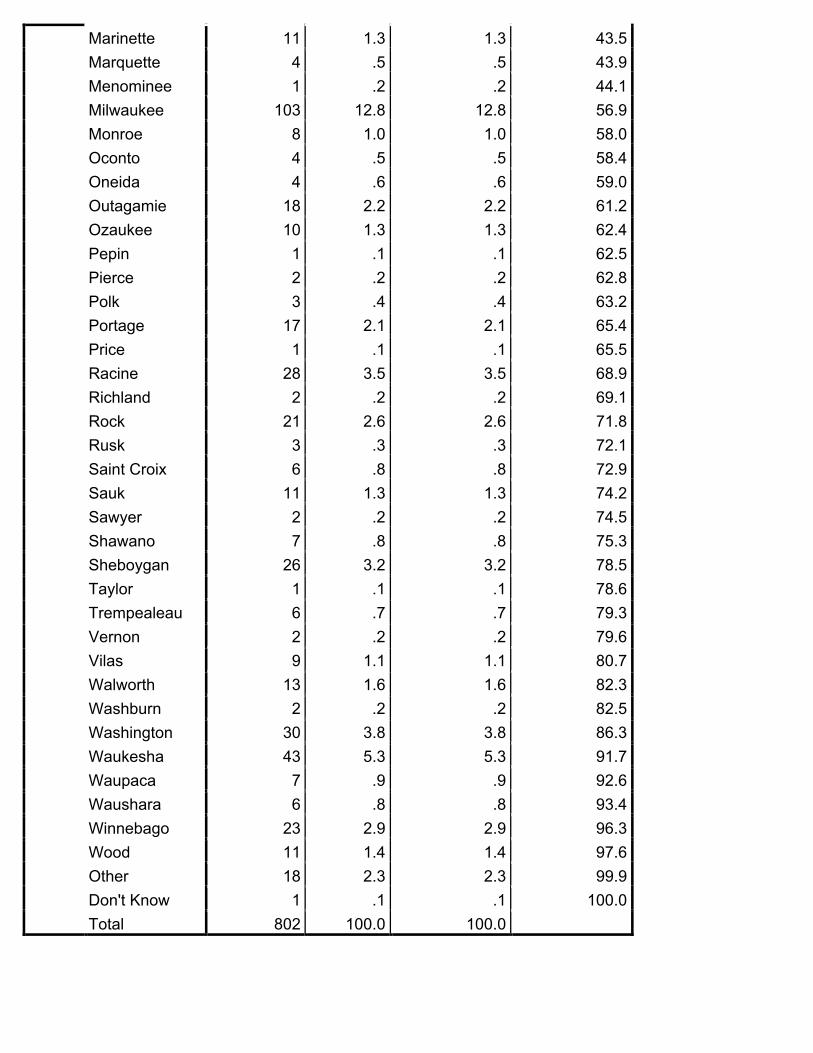
Marinette 11 1.3 1.3 43.5 Marquette 4 .5 .5 43.9 Menominee 1 .2 .2 44.1 Milwaukee 103 12.8 12.8 56.9 Monroe 8 1.0 1.0 58.0 Oconto 4 .5 .5 58.4 Oneida 4 .6 .6 59.0 Outagamie 18 2.2 2.2 61.2 Ozaukee 10 1.3 1.3 62.4 Pepin 1 .1 .1 62.5 Pierce 2 .2 .2 62.8 Polk 3 .4 .4 63.2 Portage 17 2.1 2.1 65.4 Price 1 .1 .1 65.5 Racine 28 3.5 3.5 68.9 Richland 2 .2 .2 69.1 Rock 21 2.6 2.6 71.8 Rusk 3 .3 .3 72.1 Saint Croix 6 .8 .8 72.9 Sauk 11 1.3 1.3 74.2 Sawyer 2 .2 .2 74.5 Shawano 7 .8 .8 75.3 Sheboygan 26 3.2 3.2 78.5 Taylor 1 .1 .1 78.6 Trempealeau 6 .7 .7 79.3 Vernon 2 .2 .2 79.6 Vilas 9 1.1 1.1 80.7 Walworth 13 1.6 1.6 82.3 Washburn 2 .2 .2 82.5 Washington 30 3.8 3.8 86.3 Waukesha 43 5.3 5.3 91.7 Waupaca 7 .9 .9 92.6 Waushara 6 .8 .8 93.4 Winnebago 23 2.9 2.9 96.3 Wood 11 1.4 1.4 97.6 Other 18 2.3 2.3 99.9 Don't Know 1 .1 .1 100.0 Total 802 100.0 100.0
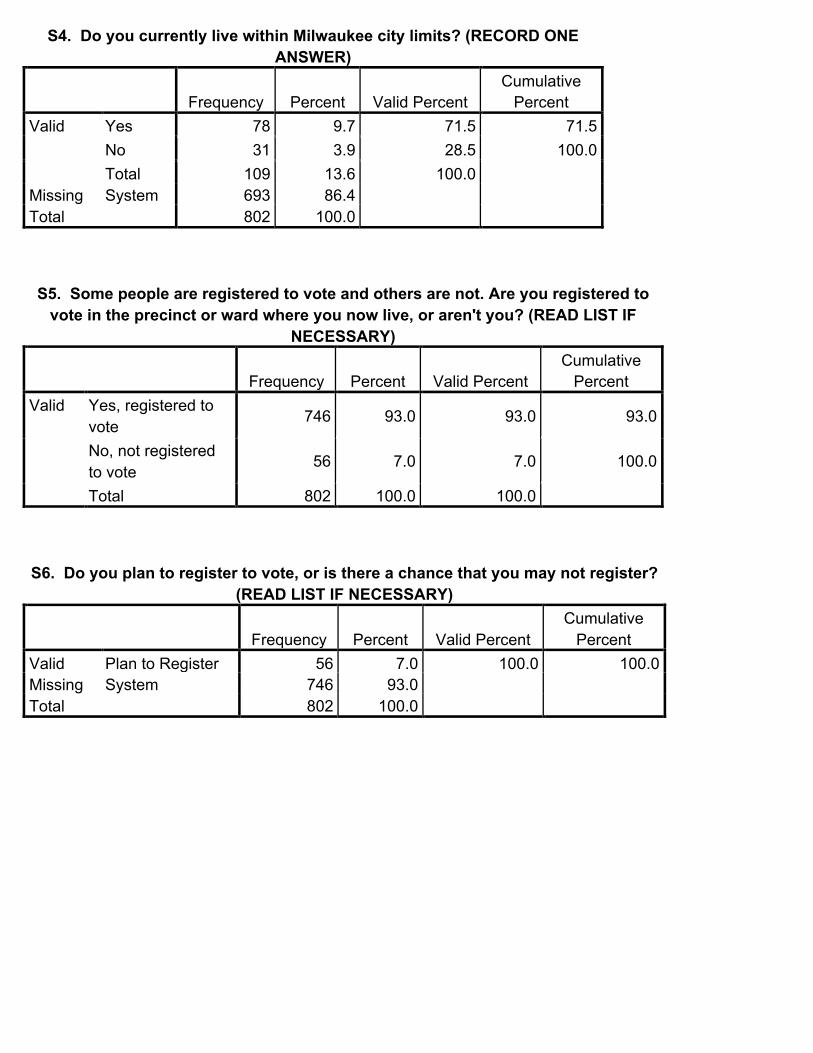
S4. Do you currently live within Milwaukee city limits? (RECORD ONE ANSWER)
Frequency Percent Valid Percent Cumulative
Percent Valid Yes 78 9.7 71.5 71.5
No 31 3.9 28.5 100.0 Total 109 13.6 100.0
Missing System 693 86.4 Total 802 100.0
S5. Some people are registered to vote and others are not. Are you registered to
vote in the precinct or ward where you now live, or aren't you? (READ LIST IF NECESSARY)
Frequency Percent Valid Percent Cumulative
Percent Valid Yes, registered to
vote 746 93.0 93.0 93.0
No, not registered to vote
56 7.0 7.0 100.0
Total 802 100.0 100.0
S6. Do you plan to register to vote, or is there a chance that you may not register?
(READ LIST IF NECESSARY)
Frequency Percent Valid Percent Cumulative
Percent Valid Plan to Register 56 7.0 100.0 100.0 Missing System 746 93.0 Total 802 100.0
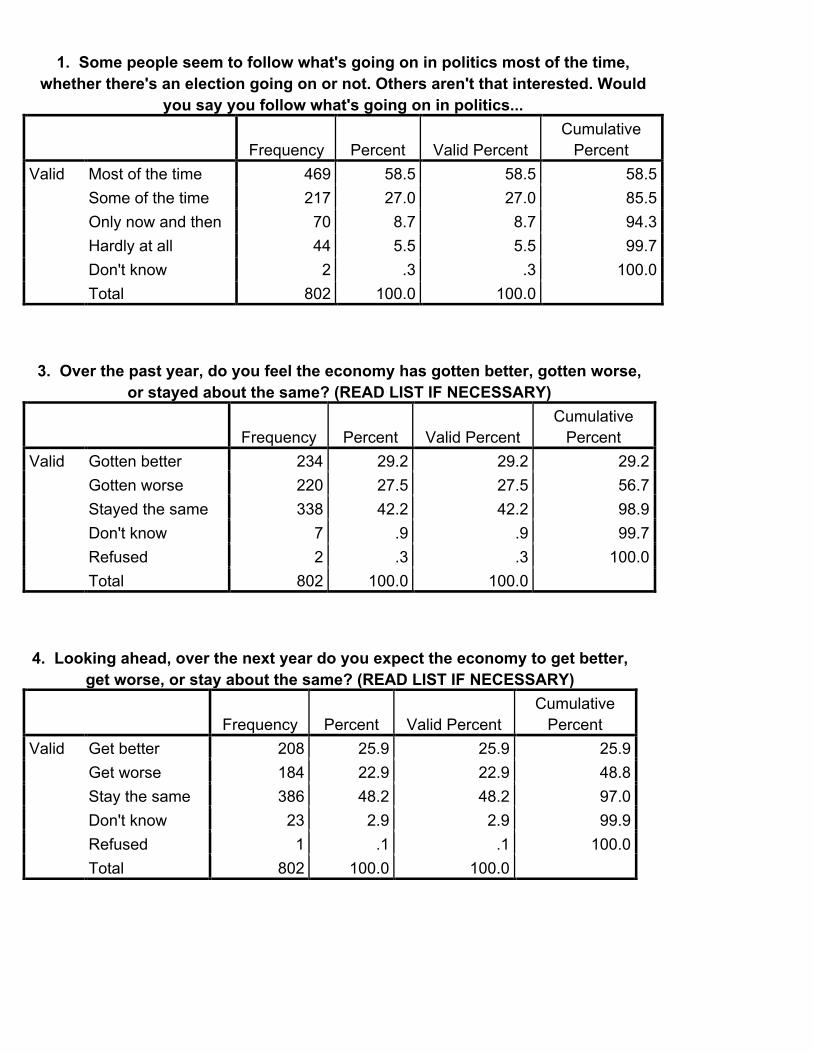
1. Some people seem to follow what's going on in politics most of the time,
whether there's an election going on or not. Others aren't that interested. Would you say you follow what's going on in politics...
Frequency Percent Valid Percent Cumulative
Percent Valid Most of the time 469 58.5 58.5 58.5
Some of the time 217 27.0 27.0 85.5 Only now and then 70 8.7 8.7 94.3 Hardly at all 44 5.5 5.5 99.7 Don't know 2 .3 .3 100.0 Total 802 100.0 100.0
3. Over the past year, do you feel the economy has gotten better, gotten worse,
or stayed about the same? (READ LIST IF NECESSARY)
Frequency Percent Valid Percent Cumulative
Percent Valid Gotten better 234 29.2 29.2 29.2
Gotten worse 220 27.5 27.5 56.7 Stayed the same 338 42.2 42.2 98.9 Don't know 7 .9 .9 99.7 Refused 2 .3 .3 100.0 Total 802 100.0 100.0
4. Looking ahead, over the next year do you expect the economy to get better,
get worse, or stay about the same? (READ LIST IF NECESSARY)
Frequency Percent Valid Percent Cumulative
Percent Valid Get better 208 25.9 25.9 25.9
Get worse 184 22.9 22.9 48.8 Stay the same 386 48.2 48.2 97.0 Don't know 23 2.9 2.9 99.9 Refused 1 .1 .1 100.0 Total 802 100.0 100.0
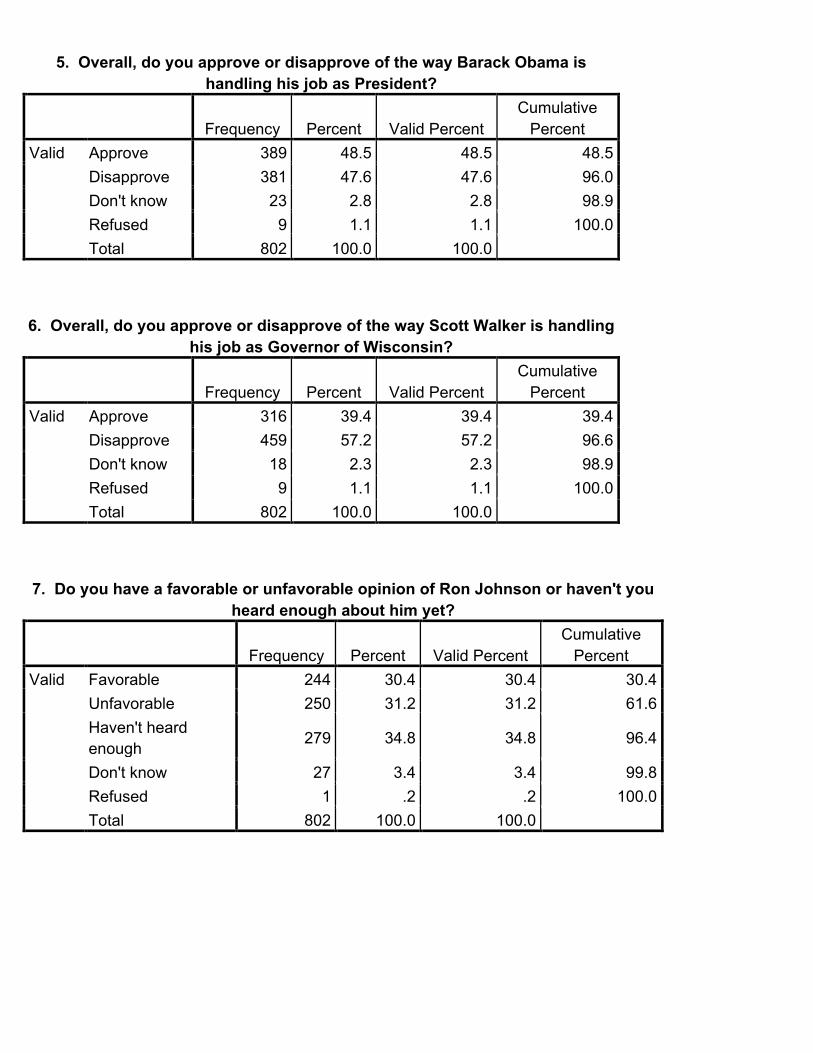
5. Overall, do you approve or disapprove of the way Barack Obama is
handling his job as President?
Frequency Percent Valid Percent Cumulative
Percent Valid Approve 389 48.5 48.5 48.5
Disapprove 381 47.6 47.6 96.0 Don't know 23 2.8 2.8 98.9 Refused 9 1.1 1.1 100.0 Total 802 100.0 100.0
6. Overall, do you approve or disapprove of the way Scott Walker is handling
his job as Governor of Wisconsin?
Frequency Percent Valid Percent Cumulative
Percent Valid Approve 316 39.4 39.4 39.4
Disapprove 459 57.2 57.2 96.6 Don't know 18 2.3 2.3 98.9 Refused 9 1.1 1.1 100.0 Total 802 100.0 100.0
7. Do you have a favorable or unfavorable opinion of Ron Johnson or haven't you
heard enough about him yet?
Frequency Percent Valid Percent Cumulative
Percent Valid Favorable 244 30.4 30.4 30.4
Unfavorable 250 31.2 31.2 61.6 Haven't heard enough 279 34.8 34.8 96.4
Don't know 27 3.4 3.4 99.8 Refused 1 .2 .2 100.0 Total 802 100.0 100.0

8. Do you have a favorable or unfavorable opinion of Tammy Baldwin or haven't
you heard enough about her yet?
Frequency Percent Valid Percent Cumulative
Percent Valid Favorable 286 35.7 35.7 35.7
Unfavorable 324 40.3 40.3 76.0 Haven't heard enough 176 22.0 22.0 98.0
Don't know 16 2.0 2.0 99.9 Refused 0 .1 .1 100.0 Total 802 100.0 100.0
9. Do you have a favorable or unfavorable opinion of Russ Feingold or haven't you
heard enough about him yet?
Frequency Percent Valid Percent Cumulative
Percent Valid Favorable 339 42.2 42.2 42.2
Unfavorable 242 30.2 30.2 72.4 Haven't heard enough 202 25.2 25.2 97.6
Don't know 19 2.3 2.3 99.9 Refused 1 .1 .1 100.0 Total 802 100.0 100.0
10. Do you have a favorable or unfavorable opinion of Pope Francis or haven't you
heard enough about him yet?
Frequency Percent Valid Percent Cumulative
Percent Valid Favorable 409 51.0 51.0 51.0
Unfavorable 99 12.3 12.3 63.3 Haven't heard enough
240 30.0 30.0 93.2
Don't know 44 5.5 5.5 98.8 Refused 10 1.2 1.2 100.0 Total 802 100.0 100.0
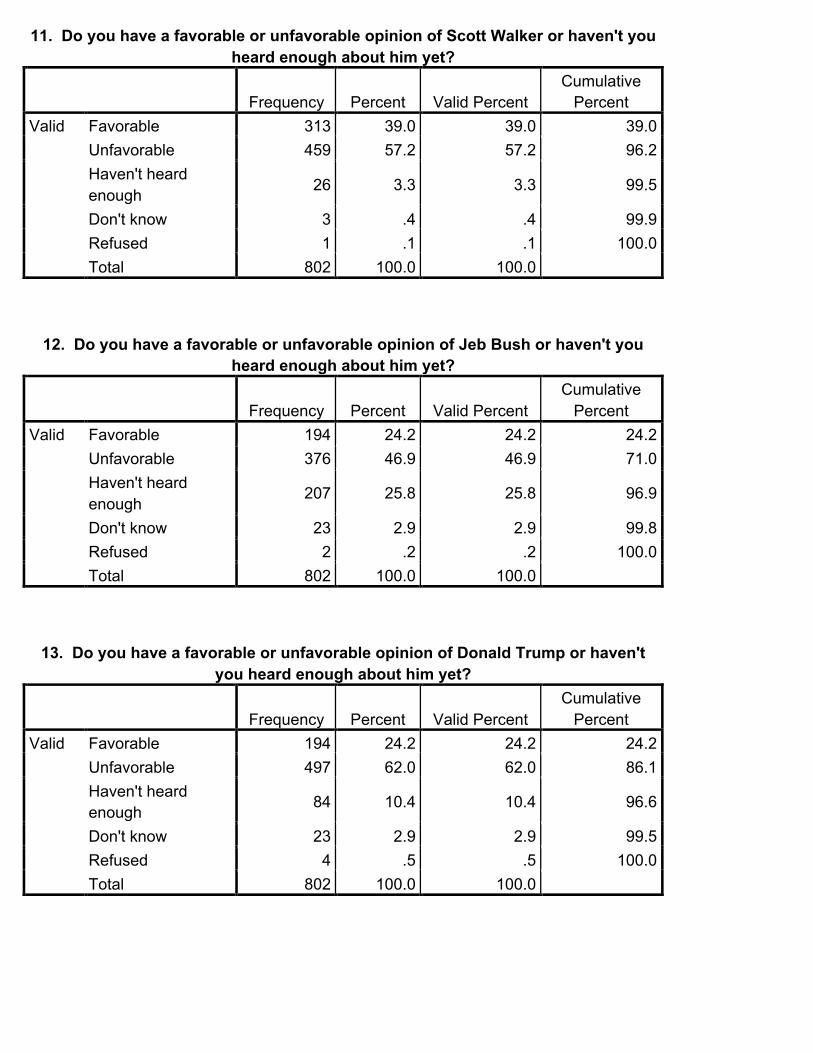
11. Do you have a favorable or unfavorable opinion of Scott Walker or haven't you heard enough about him yet?
Frequency Percent Valid Percent Cumulative
Percent Valid Favorable 313 39.0 39.0 39.0
Unfavorable 459 57.2 57.2 96.2 Haven't heard enough 26 3.3 3.3 99.5
Don't know 3 .4 .4 99.9 Refused 1 .1 .1 100.0 Total 802 100.0 100.0
12. Do you have a favorable or unfavorable opinion of Jeb Bush or haven't you
heard enough about him yet?
Frequency Percent Valid Percent Cumulative
Percent Valid Favorable 194 24.2 24.2 24.2
Unfavorable 376 46.9 46.9 71.0 Haven't heard enough
207 25.8 25.8 96.9
Don't know 23 2.9 2.9 99.8 Refused 2 .2 .2 100.0 Total 802 100.0 100.0
13. Do you have a favorable or unfavorable opinion of Donald Trump or haven't
you heard enough about him yet?
Frequency Percent Valid Percent Cumulative
Percent Valid Favorable 194 24.2 24.2 24.2
Unfavorable 497 62.0 62.0 86.1 Haven't heard enough 84 10.4 10.4 96.6
Don't know 23 2.9 2.9 99.5 Refused 4 .5 .5 100.0 Total 802 100.0 100.0
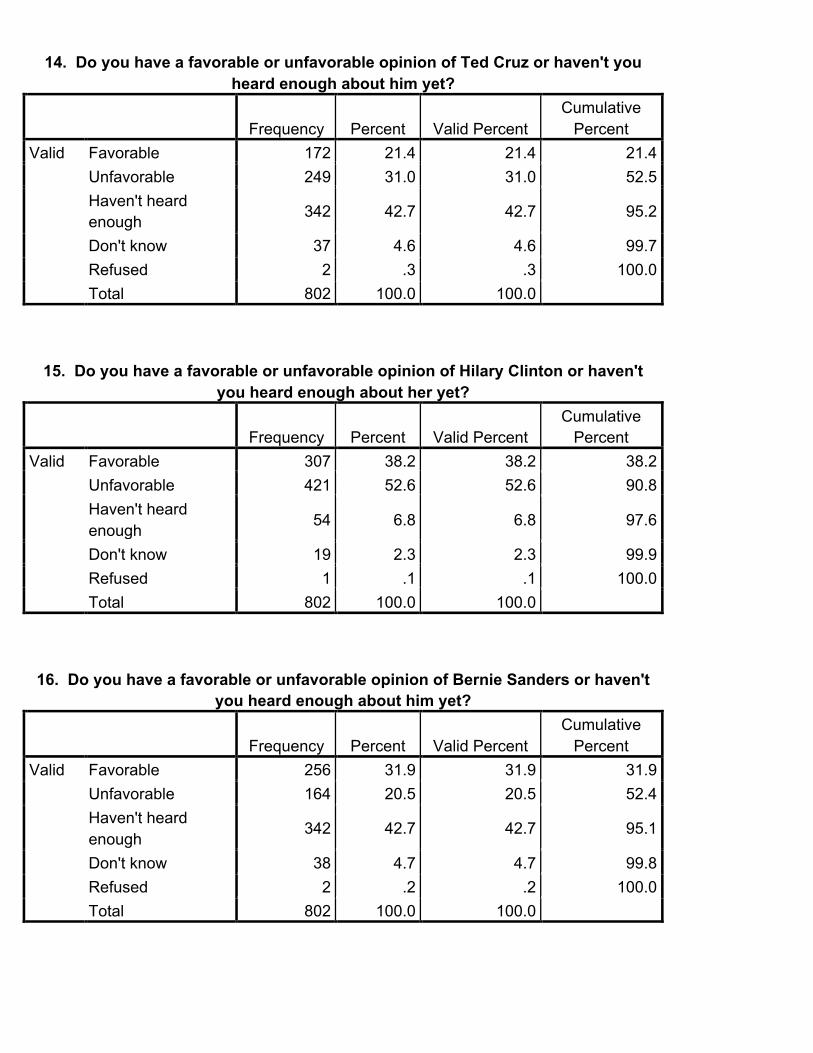
14. Do you have a favorable or unfavorable opinion of Ted Cruz or haven't you
heard enough about him yet?
Frequency Percent Valid Percent Cumulative
Percent Valid Favorable 172 21.4 21.4 21.4
Unfavorable 249 31.0 31.0 52.5 Haven't heard enough 342 42.7 42.7 95.2
Don't know 37 4.6 4.6 99.7 Refused 2 .3 .3 100.0 Total 802 100.0 100.0
15. Do you have a favorable or unfavorable opinion of Hilary Clinton or haven't
you heard enough about her yet?
Frequency Percent Valid Percent Cumulative
Percent Valid Favorable 307 38.2 38.2 38.2
Unfavorable 421 52.6 52.6 90.8 Haven't heard enough 54 6.8 6.8 97.6
Don't know 19 2.3 2.3 99.9 Refused 1 .1 .1 100.0 Total 802 100.0 100.0
16. Do you have a favorable or unfavorable opinion of Bernie Sanders or haven't
you heard enough about him yet?
Frequency Percent Valid Percent Cumulative
Percent Valid Favorable 256 31.9 31.9 31.9
Unfavorable 164 20.5 20.5 52.4 Haven't heard enough
342 42.7 42.7 95.1
Don't know 38 4.7 4.7 99.8 Refused 2 .2 .2 100.0 Total 802 100.0 100.0
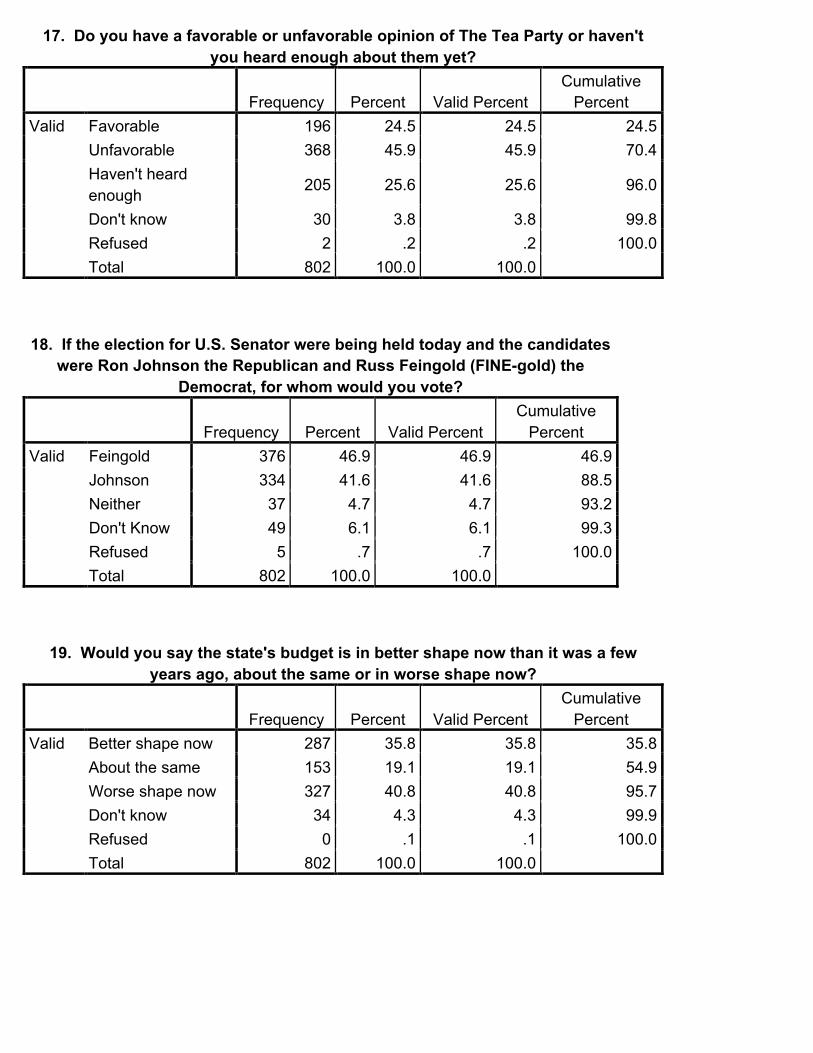
17. Do you have a favorable or unfavorable opinion of The Tea Party or haven't you heard enough about them yet?
Frequency Percent Valid Percent Cumulative
Percent Valid Favorable 196 24.5 24.5 24.5
Unfavorable 368 45.9 45.9 70.4 Haven't heard enough 205 25.6 25.6 96.0
Don't know 30 3.8 3.8 99.8 Refused 2 .2 .2 100.0 Total 802 100.0 100.0
18. If the election for U.S. Senator were being held today and the candidates
were Ron Johnson the Republican and Russ Feingold (FINE-gold) the Democrat, for whom would you vote?
Frequency Percent Valid Percent Cumulative
Percent Valid Feingold 376 46.9 46.9 46.9
Johnson 334 41.6 41.6 88.5 Neither 37 4.7 4.7 93.2 Don't Know 49 6.1 6.1 99.3 Refused 5 .7 .7 100.0 Total 802 100.0 100.0
19. Would you say the state's budget is in better shape now than it was a few
years ago, about the same or in worse shape now?
Frequency Percent Valid Percent Cumulative
Percent Valid Better shape now 287 35.8 35.8 35.8
About the same 153 19.1 19.1 54.9 Worse shape now 327 40.8 40.8 95.7 Don't know 34 4.3 4.3 99.9 Refused 0 .1 .1 100.0 Total 802 100.0 100.0
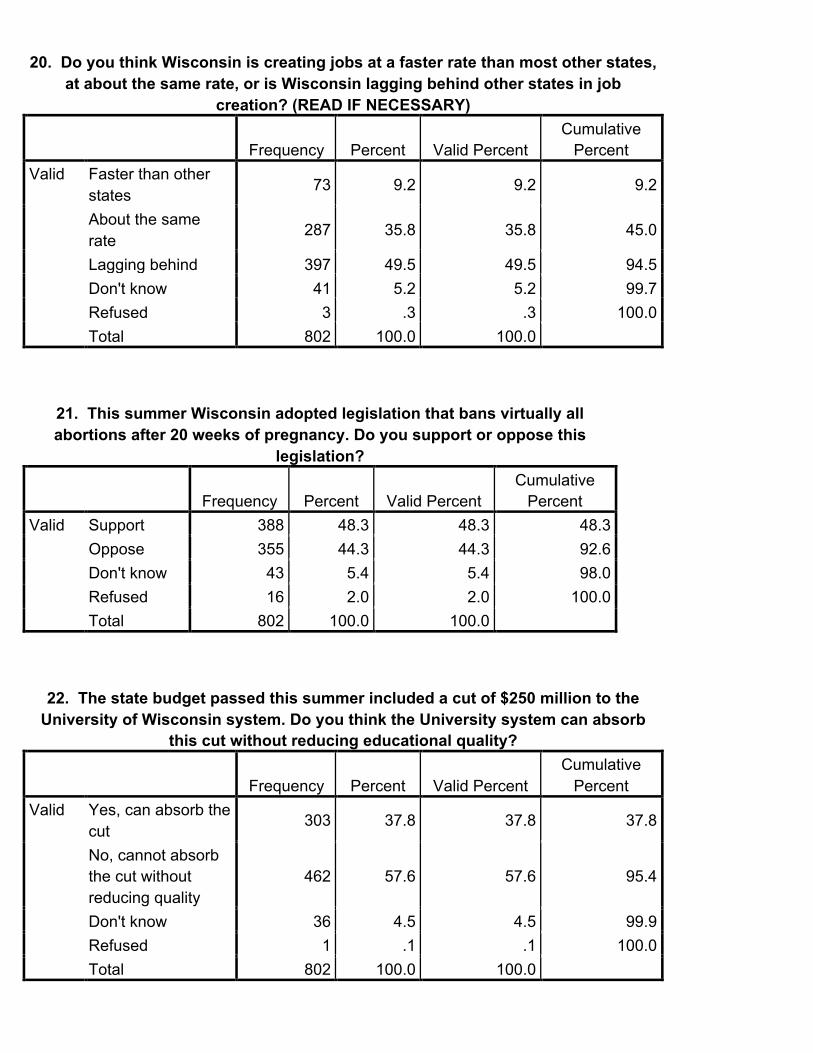
20. Do you think Wisconsin is creating jobs at a faster rate than most other states,
at about the same rate, or is Wisconsin lagging behind other states in job creation? (READ IF NECESSARY)
Frequency Percent Valid Percent Cumulative
Percent Valid Faster than other
states 73 9.2 9.2 9.2
About the same rate
287 35.8 35.8 45.0
Lagging behind 397 49.5 49.5 94.5 Don't know 41 5.2 5.2 99.7 Refused 3 .3 .3 100.0 Total 802 100.0 100.0
21. This summer Wisconsin adopted legislation that bans virtually all abortions after 20 weeks of pregnancy. Do you support or oppose this
legislation?
Frequency Percent Valid Percent Cumulative
Percent Valid Support 388 48.3 48.3 48.3
Oppose 355 44.3 44.3 92.6 Don't know 43 5.4 5.4 98.0 Refused 16 2.0 2.0 100.0 Total 802 100.0 100.0
22. The state budget passed this summer included a cut of $250 million to the
University of Wisconsin system. Do you think the University system can absorb this cut without reducing educational quality?
Frequency Percent Valid Percent Cumulative
Percent Valid Yes, can absorb the
cut 303 37.8 37.8 37.8
No, cannot absorb the cut without reducing quality
462 57.6 57.6 95.4
Don't know 36 4.5 4.5 99.9 Refused 1 .1 .1 100.0 Total 802 100.0 100.0
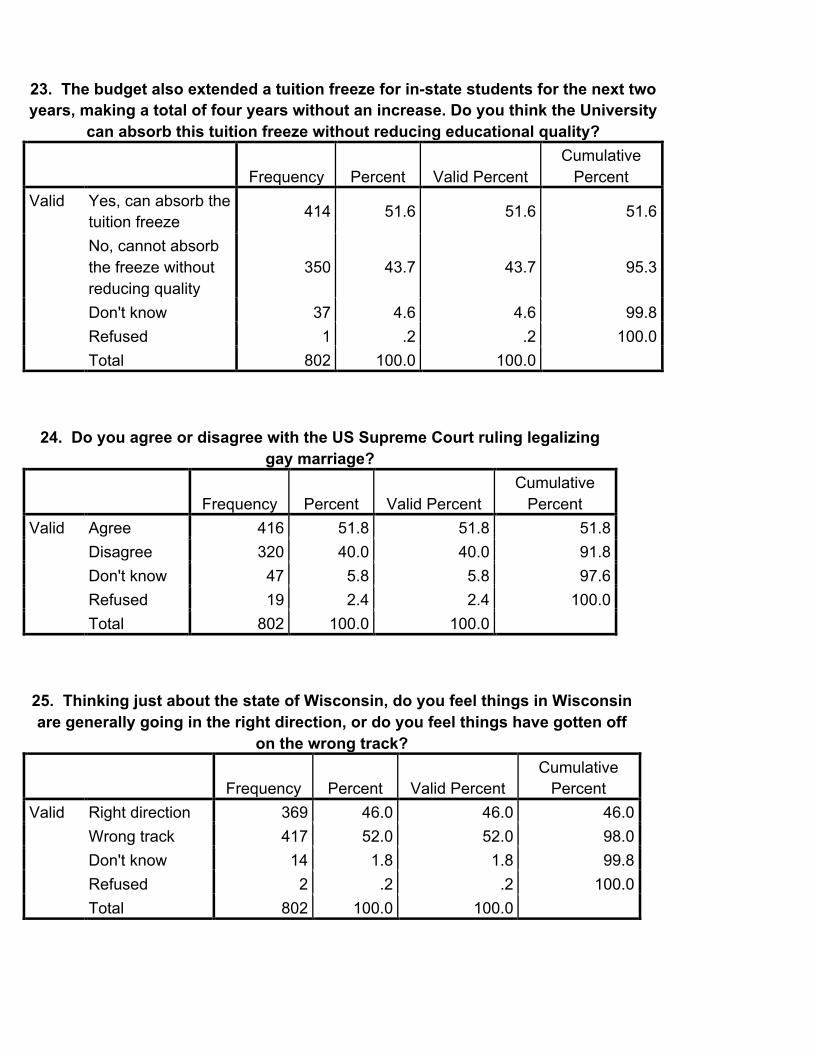
23. The budget also extended a tuition freeze for in-state students for the next two years, making a total of four years without an increase. Do you think the University
can absorb this tuition freeze without reducing educational quality?
Frequency Percent Valid Percent Cumulative
Percent Valid Yes, can absorb the
tuition freeze 414 51.6 51.6 51.6
No, cannot absorb the freeze without reducing quality
350 43.7 43.7 95.3
Don't know 37 4.6 4.6 99.8 Refused 1 .2 .2 100.0 Total 802 100.0 100.0
24. Do you agree or disagree with the US Supreme Court ruling legalizing
gay marriage?
Frequency Percent Valid Percent Cumulative
Percent Valid Agree 416 51.8 51.8 51.8
Disagree 320 40.0 40.0 91.8 Don't know 47 5.8 5.8 97.6 Refused 19 2.4 2.4 100.0 Total 802 100.0 100.0
25. Thinking just about the state of Wisconsin, do you feel things in Wisconsin are generally going in the right direction, or do you feel things have gotten off
on the wrong track?
Frequency Percent Valid Percent Cumulative
Percent Valid Right direction 369 46.0 46.0 46.0
Wrong track 417 52.0 52.0 98.0 Don't know 14 1.8 1.8 99.8 Refused 2 .2 .2 100.0 Total 802 100.0 100.0
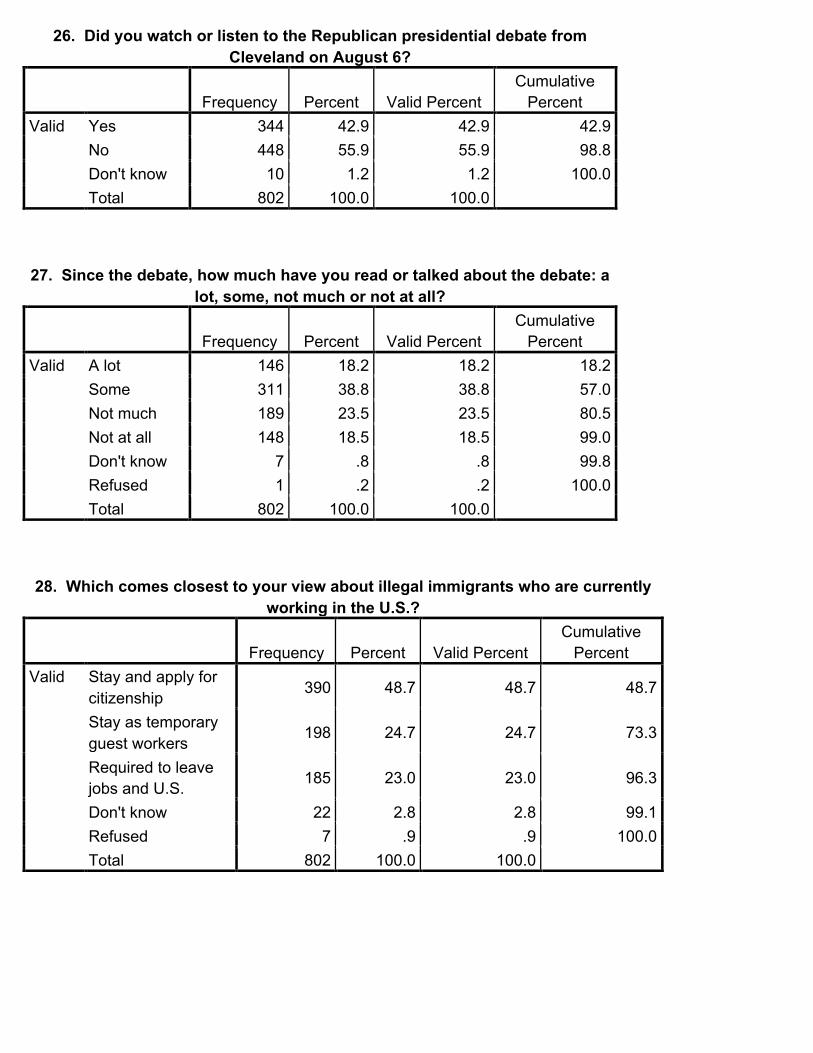
26. Did you watch or listen to the Republican presidential debate from Cleveland on August 6?
Frequency Percent Valid Percent Cumulative
Percent Valid Yes 344 42.9 42.9 42.9
No 448 55.9 55.9 98.8 Don't know 10 1.2 1.2 100.0 Total 802 100.0 100.0
27. Since the debate, how much have you read or talked about the debate: a
lot, some, not much or not at all?
Frequency Percent Valid Percent Cumulative
Percent Valid A lot 146 18.2 18.2 18.2
Some 311 38.8 38.8 57.0 Not much 189 23.5 23.5 80.5 Not at all 148 18.5 18.5 99.0 Don't know 7 .8 .8 99.8 Refused 1 .2 .2 100.0 Total 802 100.0 100.0
28. Which comes closest to your view about illegal immigrants who are currently
working in the U.S.?
Frequency Percent Valid Percent Cumulative
Percent Valid Stay and apply for
citizenship 390 48.7 48.7 48.7
Stay as temporary guest workers
198 24.7 24.7 73.3
Required to leave jobs and U.S. 185 23.0 23.0 96.3
Don't know 22 2.8 2.8 99.1 Refused 7 .9 .9 100.0 Total 802 100.0 100.0
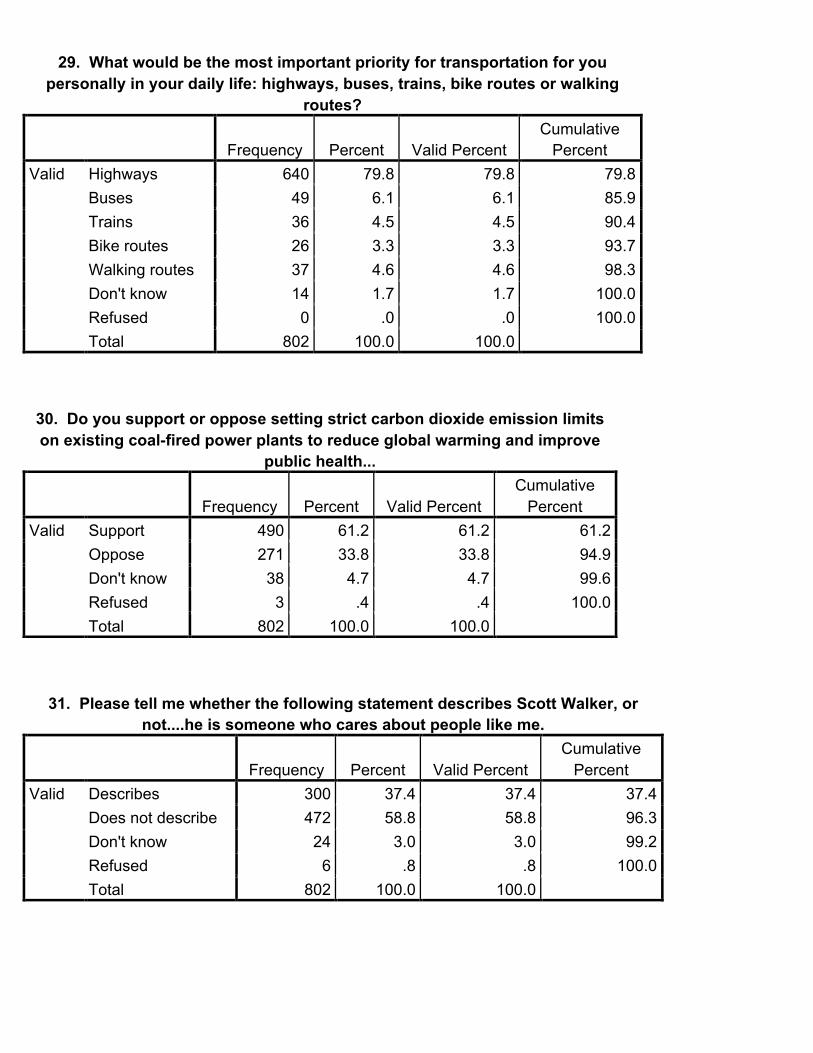
29. What would be the most important priority for transportation for you
personally in your daily life: highways, buses, trains, bike routes or walking routes?
Frequency Percent Valid Percent Cumulative
Percent Valid Highways 640 79.8 79.8 79.8
Buses 49 6.1 6.1 85.9 Trains 36 4.5 4.5 90.4 Bike routes 26 3.3 3.3 93.7 Walking routes 37 4.6 4.6 98.3 Don't know 14 1.7 1.7 100.0 Refused 0 .0 .0 100.0 Total 802 100.0 100.0
30. Do you support or oppose setting strict carbon dioxide emission limits on existing coal-fired power plants to reduce global warming and improve
public health...
Frequency Percent Valid Percent Cumulative
Percent Valid Support 490 61.2 61.2 61.2
Oppose 271 33.8 33.8 94.9 Don't know 38 4.7 4.7 99.6 Refused 3 .4 .4 100.0 Total 802 100.0 100.0
31. Please tell me whether the following statement describes Scott Walker, or
not....he is someone who cares about people like me.
Frequency Percent Valid Percent Cumulative
Percent Valid Describes 300 37.4 37.4 37.4
Does not describe 472 58.8 58.8 96.3 Don't know 24 3.0 3.0 99.2 Refused 6 .8 .8 100.0 Total 802 100.0 100.0
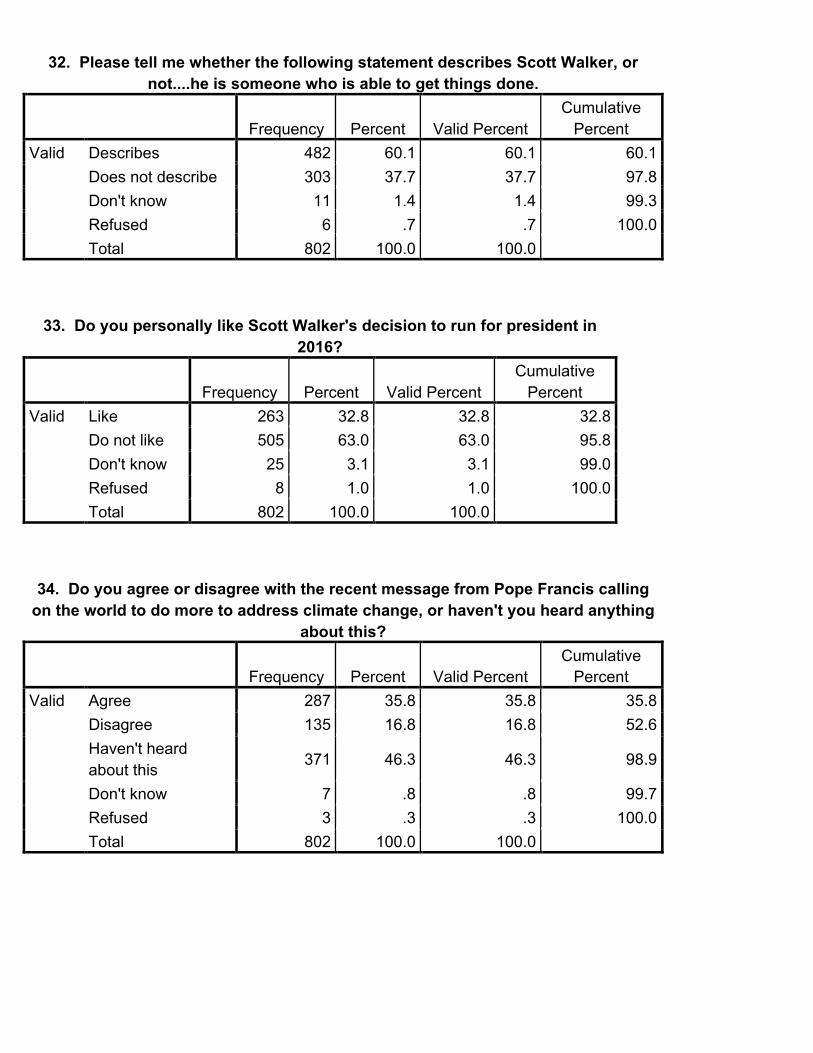
32. Please tell me whether the following statement describes Scott Walker, or
not....he is someone who is able to get things done.
Frequency Percent Valid Percent Cumulative
Percent Valid Describes 482 60.1 60.1 60.1
Does not describe 303 37.7 37.7 97.8 Don't know 11 1.4 1.4 99.3 Refused 6 .7 .7 100.0 Total 802 100.0 100.0
33. Do you personally like Scott Walker's decision to run for president in
2016?
Frequency Percent Valid Percent Cumulative
Percent Valid Like 263 32.8 32.8 32.8
Do not like 505 63.0 63.0 95.8 Don't know 25 3.1 3.1 99.0 Refused 8 1.0 1.0 100.0 Total 802 100.0 100.0
34. Do you agree or disagree with the recent message from Pope Francis calling
on the world to do more to address climate change, or haven't you heard anything about this?
Frequency Percent Valid Percent Cumulative
Percent Valid Agree 287 35.8 35.8 35.8
Disagree 135 16.8 16.8 52.6 Haven't heard about this 371 46.3 46.3 98.9
Don't know 7 .8 .8 99.7 Refused 3 .3 .3 100.0 Total 802 100.0 100.0
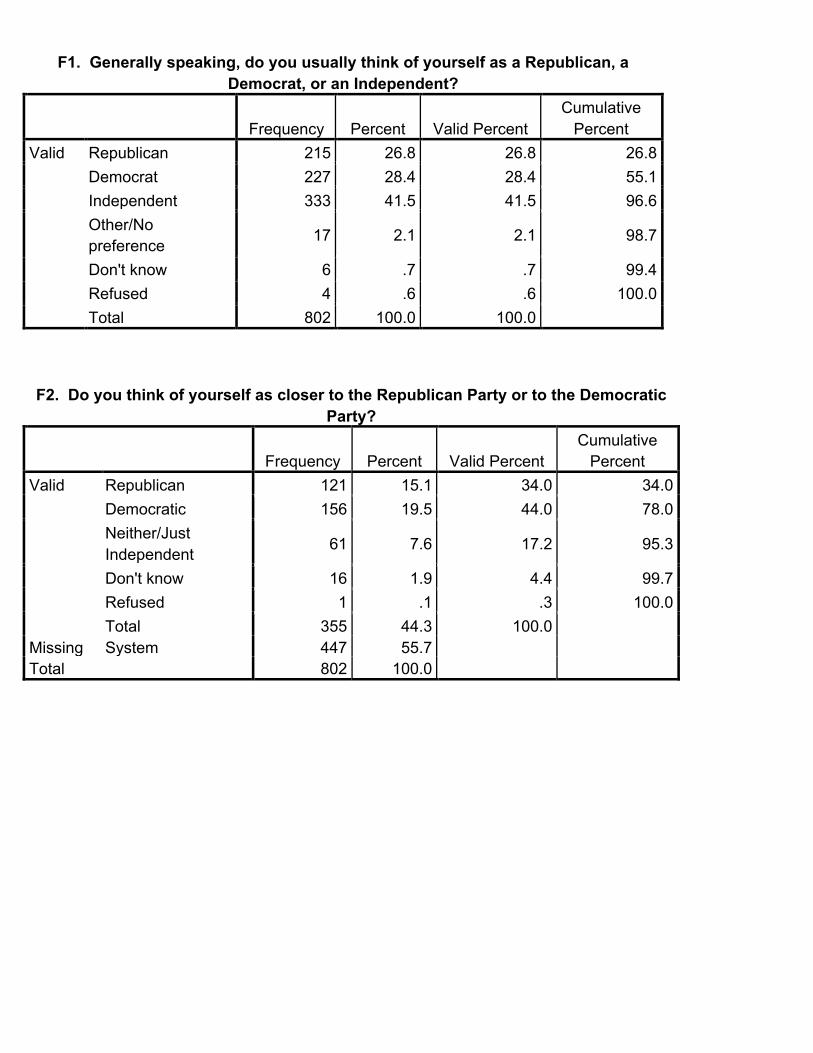
F1. Generally speaking, do you usually think of yourself as a Republican, a
Democrat, or an Independent?
Frequency Percent Valid Percent Cumulative
Percent Valid Republican 215 26.8 26.8 26.8
Democrat 227 28.4 28.4 55.1 Independent 333 41.5 41.5 96.6 Other/No preference 17 2.1 2.1 98.7
Don't know 6 .7 .7 99.4 Refused 4 .6 .6 100.0 Total 802 100.0 100.0
F2. Do you think of yourself as closer to the Republican Party or to the Democratic
Party?
Frequency Percent Valid Percent Cumulative
Percent Valid Republican 121 15.1 34.0 34.0
Democratic 156 19.5 44.0 78.0 Neither/Just Independent 61 7.6 17.2 95.3
Don't know 16 1.9 4.4 99.7 Refused 1 .1 .3 100.0 Total 355 44.3 100.0
Missing System 447 55.7 Total 802 100.0
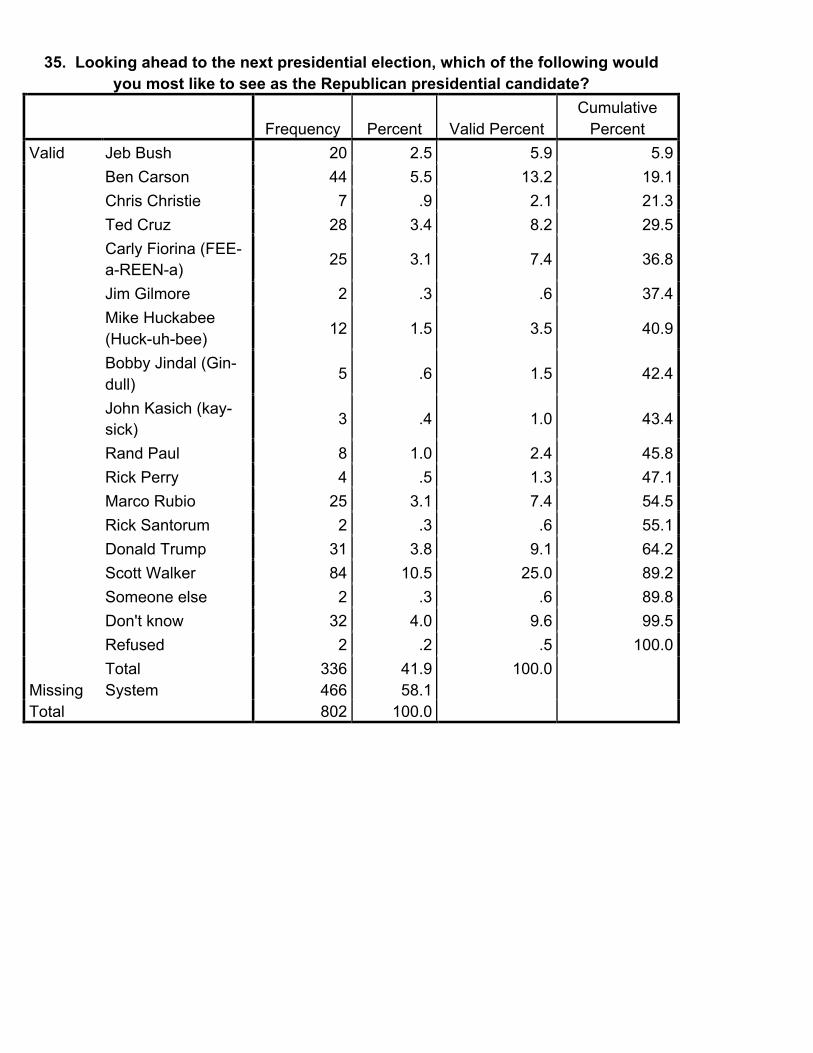
35. Looking ahead to the next presidential election, which of the following would
you most like to see as the Republican presidential candidate?
Frequency Percent Valid Percent Cumulative
Percent Valid Jeb Bush 20 2.5 5.9 5.9
Ben Carson 44 5.5 13.2 19.1 Chris Christie 7 .9 2.1 21.3 Ted Cruz 28 3.4 8.2 29.5 Carly Fiorina (FEE-a-REEN-a) 25 3.1 7.4 36.8
Jim Gilmore 2 .3 .6 37.4 Mike Huckabee (Huck-uh-bee) 12 1.5 3.5 40.9
Bobby Jindal (Gin-dull)
5 .6 1.5 42.4
John Kasich (kay-sick) 3 .4 1.0 43.4
Rand Paul 8 1.0 2.4 45.8 Rick Perry 4 .5 1.3 47.1 Marco Rubio 25 3.1 7.4 54.5 Rick Santorum 2 .3 .6 55.1 Donald Trump 31 3.8 9.1 64.2 Scott Walker 84 10.5 25.0 89.2 Someone else 2 .3 .6 89.8 Don't know 32 4.0 9.6 99.5 Refused 2 .2 .5 100.0 Total 336 41.9 100.0
Missing System 466 58.1 Total 802 100.0
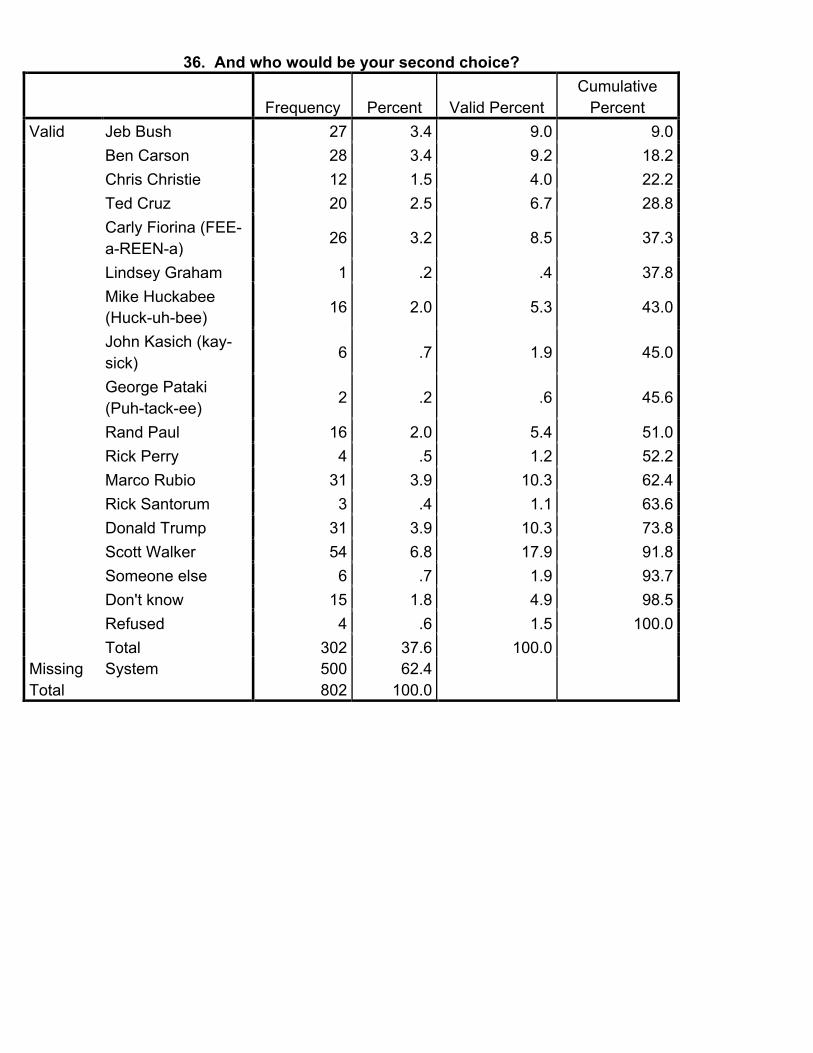
36. And who would be your second choice?
Frequency Percent Valid Percent Cumulative
Percent Valid Jeb Bush 27 3.4 9.0 9.0
Ben Carson 28 3.4 9.2 18.2 Chris Christie 12 1.5 4.0 22.2 Ted Cruz 20 2.5 6.7 28.8 Carly Fiorina (FEE-a-REEN-a)
26 3.2 8.5 37.3
Lindsey Graham 1 .2 .4 37.8 Mike Huckabee (Huck-uh-bee) 16 2.0 5.3 43.0
John Kasich (kay-sick) 6 .7 1.9 45.0
George Pataki (Puh-tack-ee)
2 .2 .6 45.6
Rand Paul 16 2.0 5.4 51.0 Rick Perry 4 .5 1.2 52.2 Marco Rubio 31 3.9 10.3 62.4 Rick Santorum 3 .4 1.1 63.6 Donald Trump 31 3.9 10.3 73.8 Scott Walker 54 6.8 17.9 91.8 Someone else 6 .7 1.9 93.7 Don't know 15 1.8 4.9 98.5 Refused 4 .6 1.5 100.0 Total 302 37.6 100.0
Missing System 500 62.4 Total 802 100.0
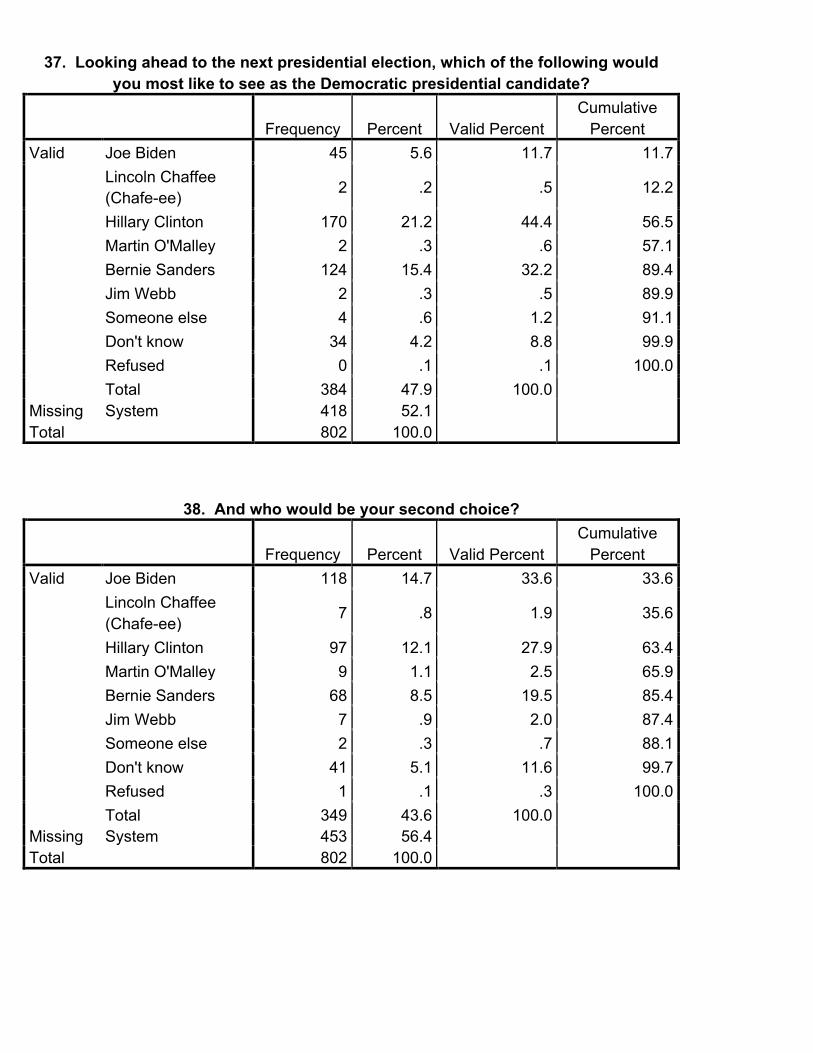
37. Looking ahead to the next presidential election, which of the following would
you most like to see as the Democratic presidential candidate?
Frequency Percent Valid Percent Cumulative
Percent Valid Joe Biden 45 5.6 11.7 11.7
Lincoln Chaffee (Chafe-ee) 2 .2 .5 12.2
Hillary Clinton 170 21.2 44.4 56.5 Martin O'Malley 2 .3 .6 57.1 Bernie Sanders 124 15.4 32.2 89.4 Jim Webb 2 .3 .5 89.9 Someone else 4 .6 1.2 91.1 Don't know 34 4.2 8.8 99.9 Refused 0 .1 .1 100.0 Total 384 47.9 100.0
Missing System 418 52.1 Total 802 100.0
38. And who would be your second choice?
Frequency Percent Valid Percent Cumulative
Percent Valid Joe Biden 118 14.7 33.6 33.6
Lincoln Chaffee (Chafe-ee)
7 .8 1.9 35.6
Hillary Clinton 97 12.1 27.9 63.4 Martin O'Malley 9 1.1 2.5 65.9 Bernie Sanders 68 8.5 19.5 85.4 Jim Webb 7 .9 2.0 87.4 Someone else 2 .3 .7 88.1 Don't know 41 5.1 11.6 99.7 Refused 1 .1 .3 100.0 Total 349 43.6 100.0
Missing System 453 56.4 Total 802 100.0
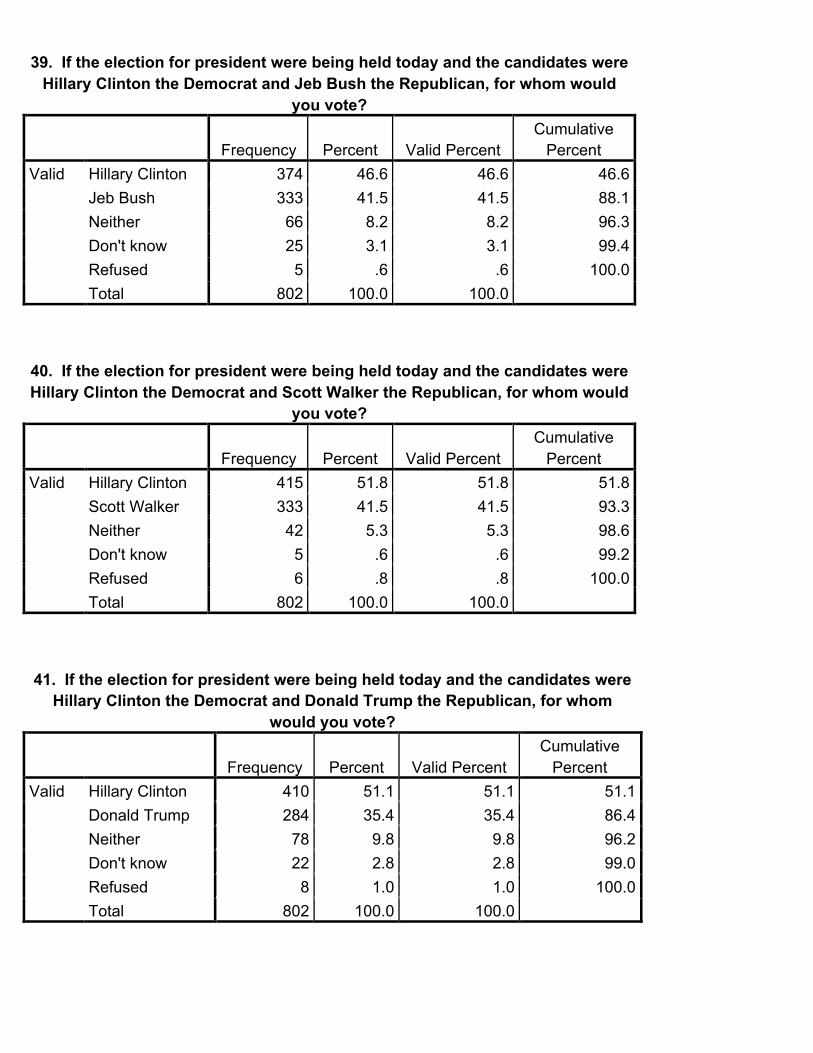
39. If the election for president were being held today and the candidates were
Hillary Clinton the Democrat and Jeb Bush the Republican, for whom would you vote?
Frequency Percent Valid Percent Cumulative
Percent Valid Hillary Clinton 374 46.6 46.6 46.6
Jeb Bush 333 41.5 41.5 88.1 Neither 66 8.2 8.2 96.3 Don't know 25 3.1 3.1 99.4 Refused 5 .6 .6 100.0 Total 802 100.0 100.0
40. If the election for president were being held today and the candidates were Hillary Clinton the Democrat and Scott Walker the Republican, for whom would
you vote?
Frequency Percent Valid Percent Cumulative
Percent Valid Hillary Clinton 415 51.8 51.8 51.8
Scott Walker 333 41.5 41.5 93.3 Neither 42 5.3 5.3 98.6 Don't know 5 .6 .6 99.2 Refused 6 .8 .8 100.0 Total 802 100.0 100.0
41. If the election for president were being held today and the candidates were
Hillary Clinton the Democrat and Donald Trump the Republican, for whom would you vote?
Frequency Percent Valid Percent Cumulative
Percent Valid Hillary Clinton 410 51.1 51.1 51.1
Donald Trump 284 35.4 35.4 86.4 Neither 78 9.8 9.8 96.2 Don't know 22 2.8 2.8 99.0 Refused 8 1.0 1.0 100.0 Total 802 100.0 100.0
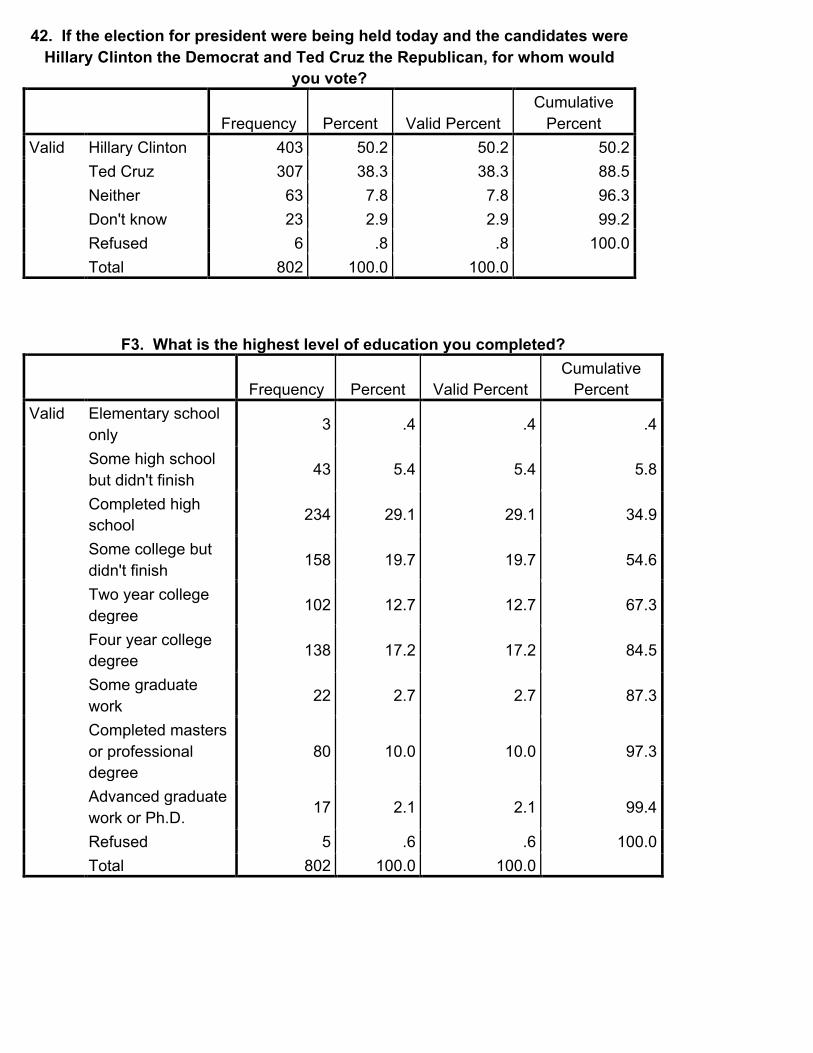
42. If the election for president were being held today and the candidates were Hillary Clinton the Democrat and Ted Cruz the Republican, for whom would
you vote?
Frequency Percent Valid Percent Cumulative
Percent Valid Hillary Clinton 403 50.2 50.2 50.2
Ted Cruz 307 38.3 38.3 88.5 Neither 63 7.8 7.8 96.3 Don't know 23 2.9 2.9 99.2 Refused 6 .8 .8 100.0 Total 802 100.0 100.0
F3. What is the highest level of education you completed?
Frequency Percent Valid Percent Cumulative
Percent Valid Elementary school
only 3 .4 .4 .4
Some high school but didn't finish
43 5.4 5.4 5.8
Completed high school 234 29.1 29.1 34.9
Some college but didn't finish 158 19.7 19.7 54.6
Two year college degree
102 12.7 12.7 67.3
Four year college degree 138 17.2 17.2 84.5
Some graduate work 22 2.7 2.7 87.3
Completed masters or professional degree
80 10.0 10.0 97.3
Advanced graduate work or Ph.D. 17 2.1 2.1 99.4
Refused 5 .6 .6 100.0 Total 802 100.0 100.0
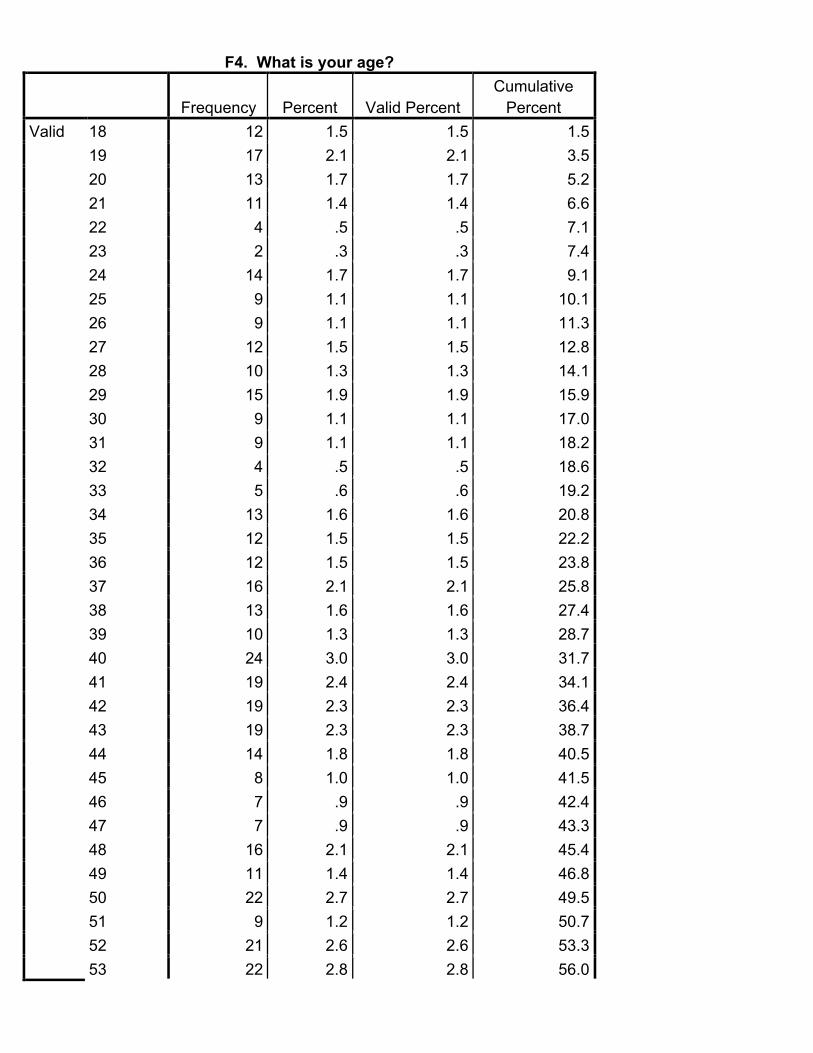
F4. What is your age?
Frequency Percent Valid Percent Cumulative
Percent Valid 18 12 1.5 1.5 1.5
19 17 2.1 2.1 3.5 20 13 1.7 1.7 5.2 21 11 1.4 1.4 6.6 22 4 .5 .5 7.1 23 2 .3 .3 7.4 24 14 1.7 1.7 9.1 25 9 1.1 1.1 10.1 26 9 1.1 1.1 11.3 27 12 1.5 1.5 12.8 28 10 1.3 1.3 14.1 29 15 1.9 1.9 15.9 30 9 1.1 1.1 17.0 31 9 1.1 1.1 18.2 32 4 .5 .5 18.6 33 5 .6 .6 19.2 34 13 1.6 1.6 20.8 35 12 1.5 1.5 22.2 36 12 1.5 1.5 23.8 37 16 2.1 2.1 25.8 38 13 1.6 1.6 27.4 39 10 1.3 1.3 28.7 40 24 3.0 3.0 31.7 41 19 2.4 2.4 34.1 42 19 2.3 2.3 36.4 43 19 2.3 2.3 38.7 44 14 1.8 1.8 40.5 45 8 1.0 1.0 41.5 46 7 .9 .9 42.4 47 7 .9 .9 43.3 48 16 2.1 2.1 45.4 49 11 1.4 1.4 46.8 50 22 2.7 2.7 49.5 51 9 1.2 1.2 50.7 52 21 2.6 2.6 53.3 53 22 2.8 2.8 56.0
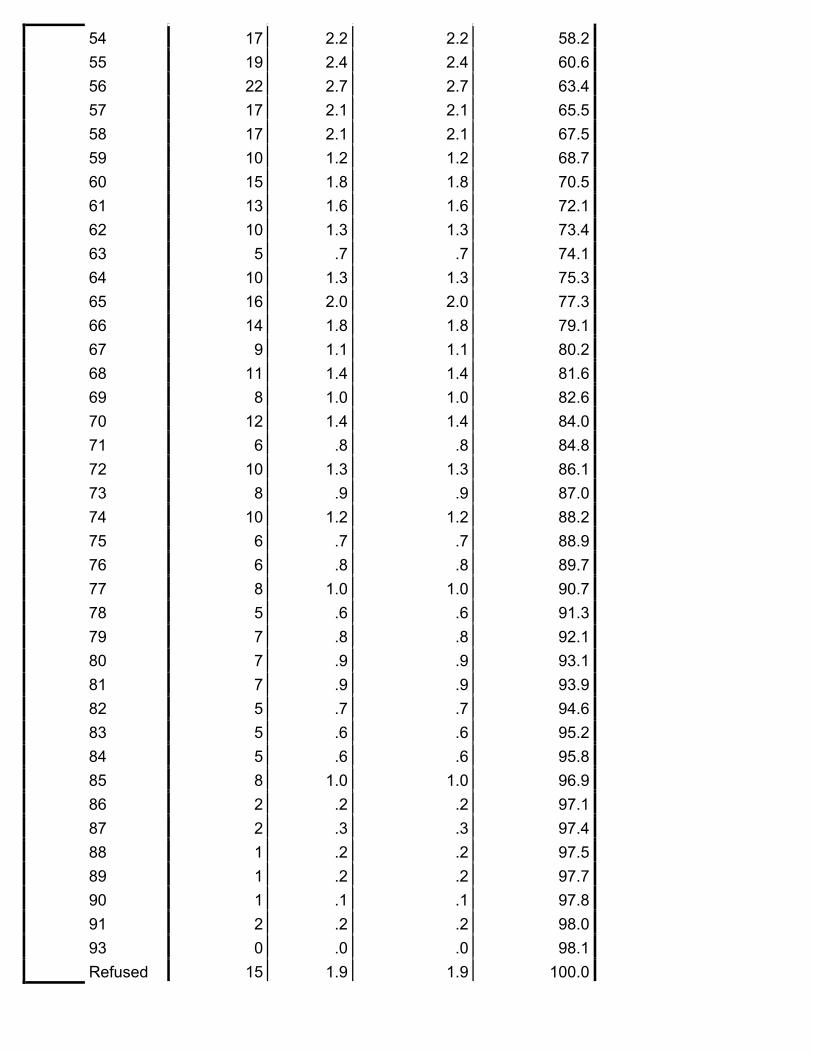
54 17 2.2 2.2 58.2 55 19 2.4 2.4 60.6 56 22 2.7 2.7 63.4 57 17 2.1 2.1 65.5 58 17 2.1 2.1 67.5 59 10 1.2 1.2 68.7 60 15 1.8 1.8 70.5 61 13 1.6 1.6 72.1 62 10 1.3 1.3 73.4 63 5 .7 .7 74.1 64 10 1.3 1.3 75.3 65 16 2.0 2.0 77.3 66 14 1.8 1.8 79.1 67 9 1.1 1.1 80.2 68 11 1.4 1.4 81.6 69 8 1.0 1.0 82.6 70 12 1.4 1.4 84.0 71 6 .8 .8 84.8 72 10 1.3 1.3 86.1 73 8 .9 .9 87.0 74 10 1.2 1.2 88.2 75 6 .7 .7 88.9 76 6 .8 .8 89.7 77 8 1.0 1.0 90.7 78 5 .6 .6 91.3 79 7 .8 .8 92.1 80 7 .9 .9 93.1 81 7 .9 .9 93.9 82 5 .7 .7 94.6 83 5 .6 .6 95.2 84 5 .6 .6 95.8 85 8 1.0 1.0 96.9 86 2 .2 .2 97.1 87 2 .3 .3 97.4 88 1 .2 .2 97.5 89 1 .2 .2 97.7 90 1 .1 .1 97.8 91 2 .2 .2 98.0 93 0 .0 .0 98.1 Refused 15 1.9 1.9 100.0
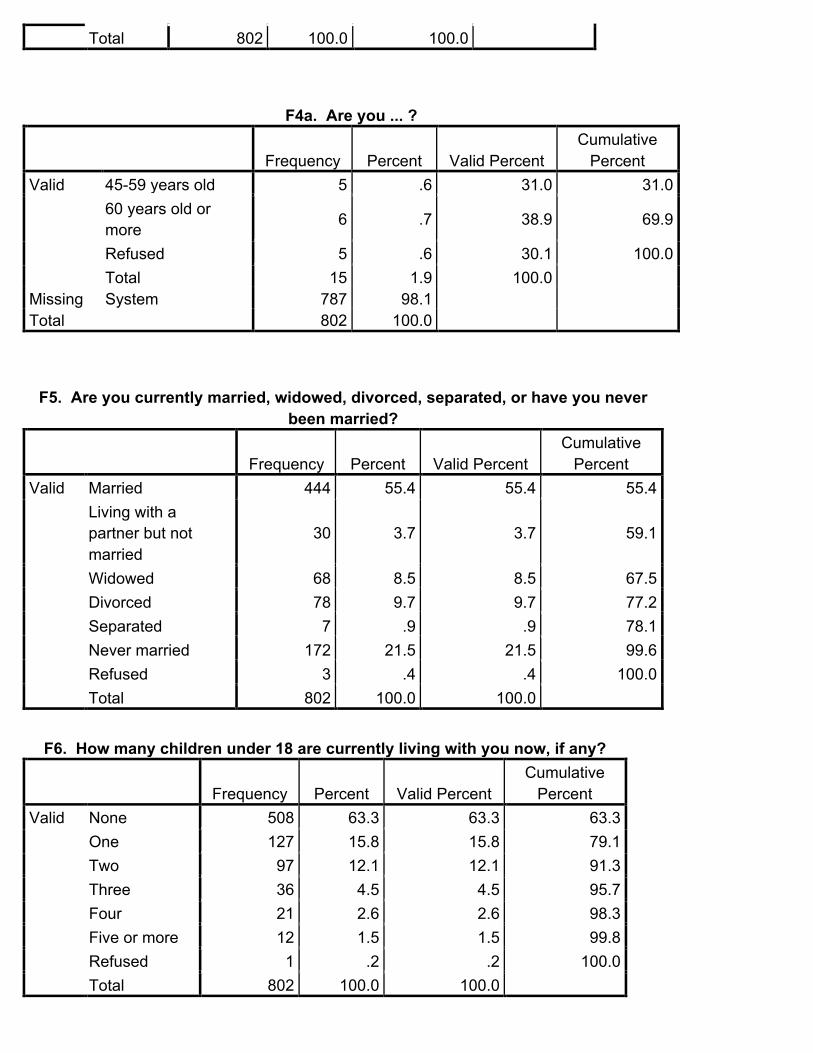
Total 802 100.0 100.0
F4a. Are you ... ?
Frequency Percent Valid Percent Cumulative
Percent Valid 45-59 years old 5 .6 31.0 31.0
60 years old or more 6 .7 38.9 69.9
Refused 5 .6 30.1 100.0 Total 15 1.9 100.0
Missing System 787 98.1 Total 802 100.0
F5. Are you currently married, widowed, divorced, separated, or have you never
been married?
Frequency Percent Valid Percent Cumulative
Percent Valid Married 444 55.4 55.4 55.4
Living with a partner but not married
30 3.7 3.7 59.1
Widowed 68 8.5 8.5 67.5 Divorced 78 9.7 9.7 77.2 Separated 7 .9 .9 78.1 Never married 172 21.5 21.5 99.6 Refused 3 .4 .4 100.0 Total 802 100.0 100.0
F6. How many children under 18 are currently living with you now, if any?
Frequency Percent Valid Percent Cumulative
Percent Valid None 508 63.3 63.3 63.3
One 127 15.8 15.8 79.1 Two 97 12.1 12.1 91.3 Three 36 4.5 4.5 95.7 Four 21 2.6 2.6 98.3 Five or more 12 1.5 1.5 99.8 Refused 1 .2 .2 100.0 Total 802 100.0 100.0
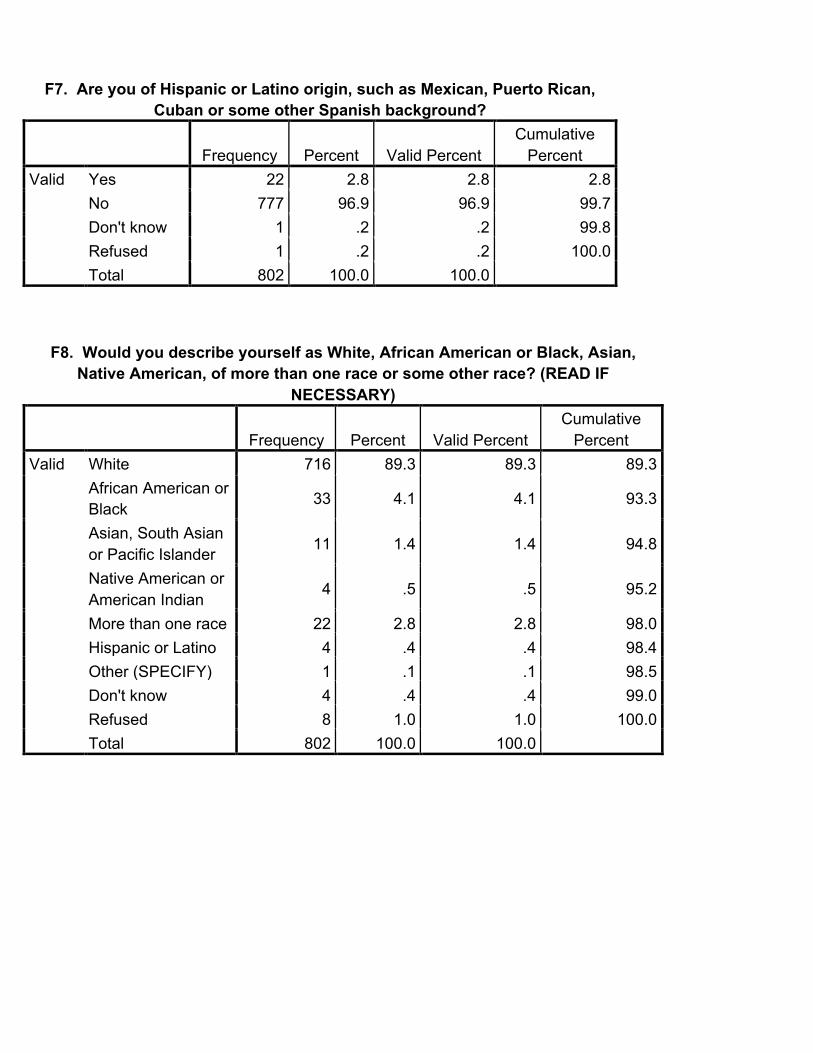
F7. Are you of Hispanic or Latino origin, such as Mexican, Puerto Rican,
Cuban or some other Spanish background?
Frequency Percent Valid Percent Cumulative
Percent Valid Yes 22 2.8 2.8 2.8
No 777 96.9 96.9 99.7 Don't know 1 .2 .2 99.8 Refused 1 .2 .2 100.0 Total 802 100.0 100.0
F8. Would you describe yourself as White, African American or Black, Asian,
Native American, of more than one race or some other race? (READ IF NECESSARY)
Frequency Percent Valid Percent Cumulative
Percent Valid White 716 89.3 89.3 89.3
African American or Black 33 4.1 4.1 93.3
Asian, South Asian or Pacific Islander 11 1.4 1.4 94.8
Native American or American Indian
4 .5 .5 95.2
More than one race 22 2.8 2.8 98.0 Hispanic or Latino 4 .4 .4 98.4 Other (SPECIFY) 1 .1 .1 98.5 Don't know 4 .4 .4 99.0 Refused 8 1.0 1.0 100.0 Total 802 100.0 100.0
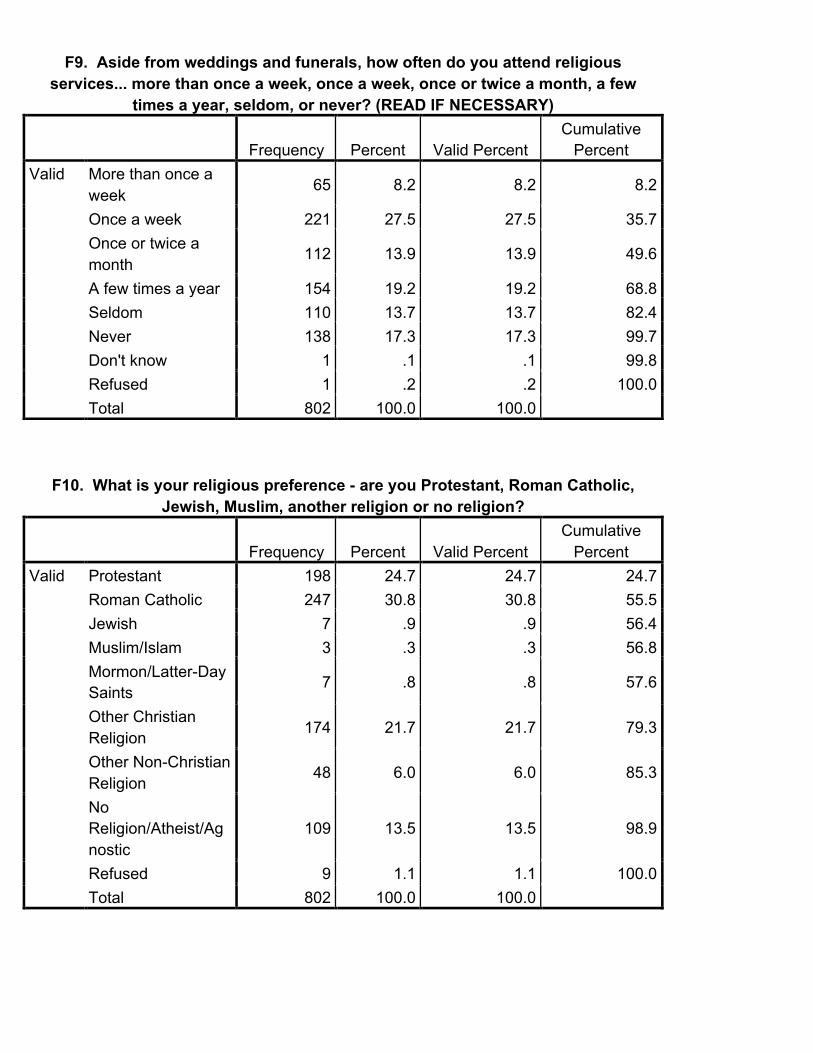
F9. Aside from weddings and funerals, how often do you attend religious
services... more than once a week, once a week, once or twice a month, a few times a year, seldom, or never? (READ IF NECESSARY)
Frequency Percent Valid Percent Cumulative
Percent Valid More than once a
week 65 8.2 8.2 8.2
Once a week 221 27.5 27.5 35.7 Once or twice a month
112 13.9 13.9 49.6
A few times a year 154 19.2 19.2 68.8 Seldom 110 13.7 13.7 82.4 Never 138 17.3 17.3 99.7 Don't know 1 .1 .1 99.8 Refused 1 .2 .2 100.0 Total 802 100.0 100.0
F10. What is your religious preference - are you Protestant, Roman Catholic,
Jewish, Muslim, another religion or no religion?
Frequency Percent Valid Percent Cumulative
Percent Valid Protestant 198 24.7 24.7 24.7
Roman Catholic 247 30.8 30.8 55.5 Jewish 7 .9 .9 56.4 Muslim/Islam 3 .3 .3 56.8 Mormon/Latter-Day Saints 7 .8 .8 57.6
Other Christian Religion 174 21.7 21.7 79.3
Other Non-Christian Religion
48 6.0 6.0 85.3
No Religion/Atheist/Agnostic
109 13.5 13.5 98.9
Refused 9 1.1 1.1 100.0 Total 802 100.0 100.0
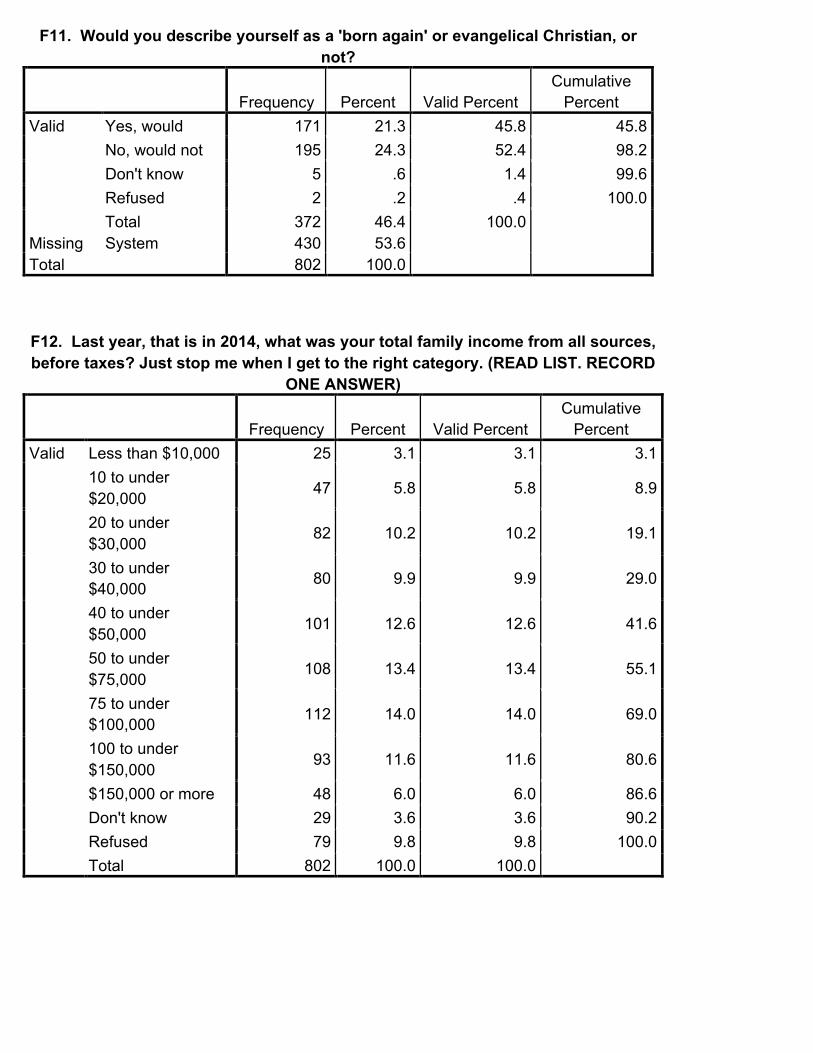
F11. Would you describe yourself as a 'born again' or evangelical Christian, or not?
Frequency Percent Valid Percent Cumulative
Percent Valid Yes, would 171 21.3 45.8 45.8
No, would not 195 24.3 52.4 98.2 Don't know 5 .6 1.4 99.6 Refused 2 .2 .4 100.0 Total 372 46.4 100.0
Missing System 430 53.6 Total 802 100.0
F12. Last year, that is in 2014, what was your total family income from all sources, before taxes? Just stop me when I get to the right category. (READ LIST. RECORD
ONE ANSWER)
Frequency Percent Valid Percent Cumulative
Percent Valid Less than $10,000 25 3.1 3.1 3.1
10 to under $20,000 47 5.8 5.8 8.9
20 to under $30,000
82 10.2 10.2 19.1
30 to under $40,000 80 9.9 9.9 29.0
40 to under $50,000 101 12.6 12.6 41.6
50 to under $75,000
108 13.4 13.4 55.1
75 to under $100,000 112 14.0 14.0 69.0
100 to under $150,000 93 11.6 11.6 80.6
$150,000 or more 48 6.0 6.0 86.6 Don't know 29 3.6 3.6 90.2 Refused 79 9.8 9.8 100.0 Total 802 100.0 100.0
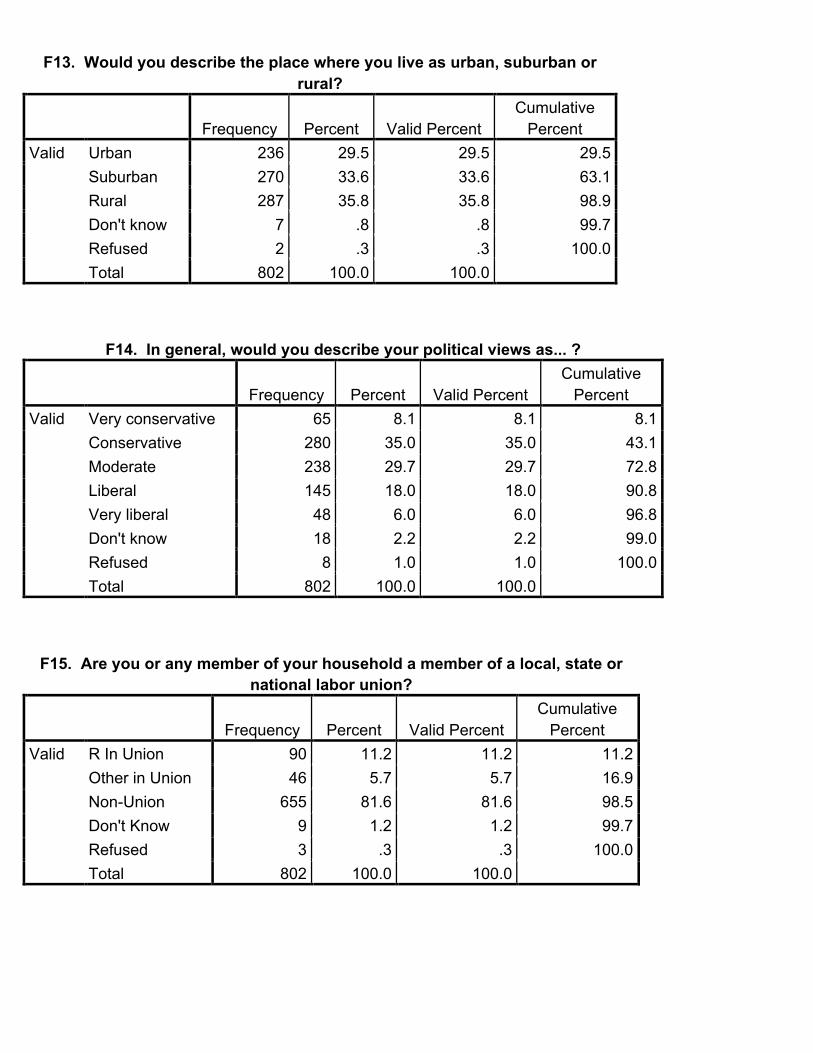
F13. Would you describe the place where you live as urban, suburban or
rural?
Frequency Percent Valid Percent Cumulative
Percent Valid Urban 236 29.5 29.5 29.5
Suburban 270 33.6 33.6 63.1 Rural 287 35.8 35.8 98.9 Don't know 7 .8 .8 99.7 Refused 2 .3 .3 100.0 Total 802 100.0 100.0
F14. In general, would you describe your political views as... ?
Frequency Percent Valid Percent Cumulative
Percent Valid Very conservative 65 8.1 8.1 8.1
Conservative 280 35.0 35.0 43.1 Moderate 238 29.7 29.7 72.8 Liberal 145 18.0 18.0 90.8 Very liberal 48 6.0 6.0 96.8 Don't know 18 2.2 2.2 99.0 Refused 8 1.0 1.0 100.0 Total 802 100.0 100.0
F15. Are you or any member of your household a member of a local, state or
national labor union?
Frequency Percent Valid Percent Cumulative
Percent Valid R In Union 90 11.2 11.2 11.2
Other in Union 46 5.7 5.7 16.9 Non-Union 655 81.6 81.6 98.5 Don't Know 9 1.2 1.2 99.7 Refused 3 .3 .3 100.0 Total 802 100.0 100.0
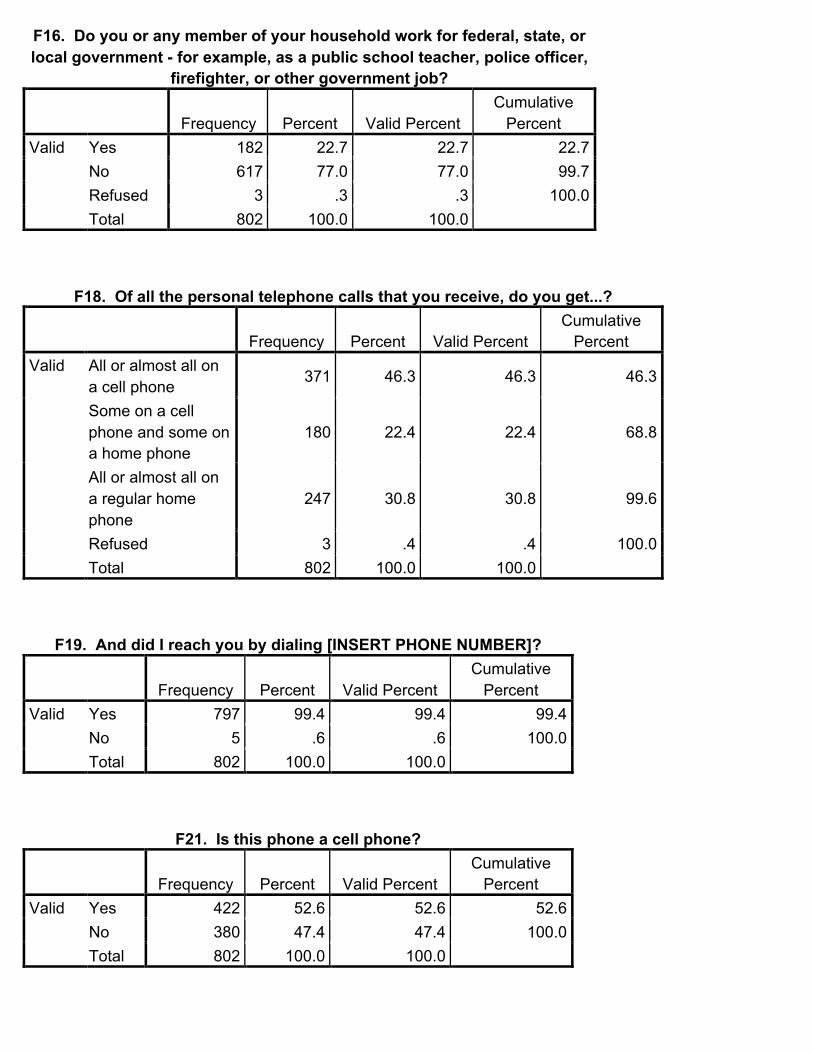
F16. Do you or any member of your household work for federal, state, or local government - for example, as a public school teacher, police officer,
firefighter, or other government job?
Frequency Percent Valid Percent Cumulative
Percent Valid Yes 182 22.7 22.7 22.7
No 617 77.0 77.0 99.7 Refused 3 .3 .3 100.0 Total 802 100.0 100.0
F18. Of all the personal telephone calls that you receive, do you get...?
Frequency Percent Valid Percent Cumulative
Percent Valid All or almost all on
a cell phone 371 46.3 46.3 46.3
Some on a cell phone and some on a home phone
180 22.4 22.4 68.8
All or almost all on a regular home phone
247 30.8 30.8 99.6
Refused 3 .4 .4 100.0 Total 802 100.0 100.0
F19. And did I reach you by dialing [INSERT PHONE NUMBER]?
Frequency Percent Valid Percent Cumulative
Percent Valid Yes 797 99.4 99.4 99.4
No 5 .6 .6 100.0 Total 802 100.0 100.0
F21. Is this phone a cell phone?
Frequency Percent Valid Percent Cumulative
Percent Valid Yes 422 52.6 52.6 52.6
No 380 47.4 47.4 100.0 Total 802 100.0 100.0
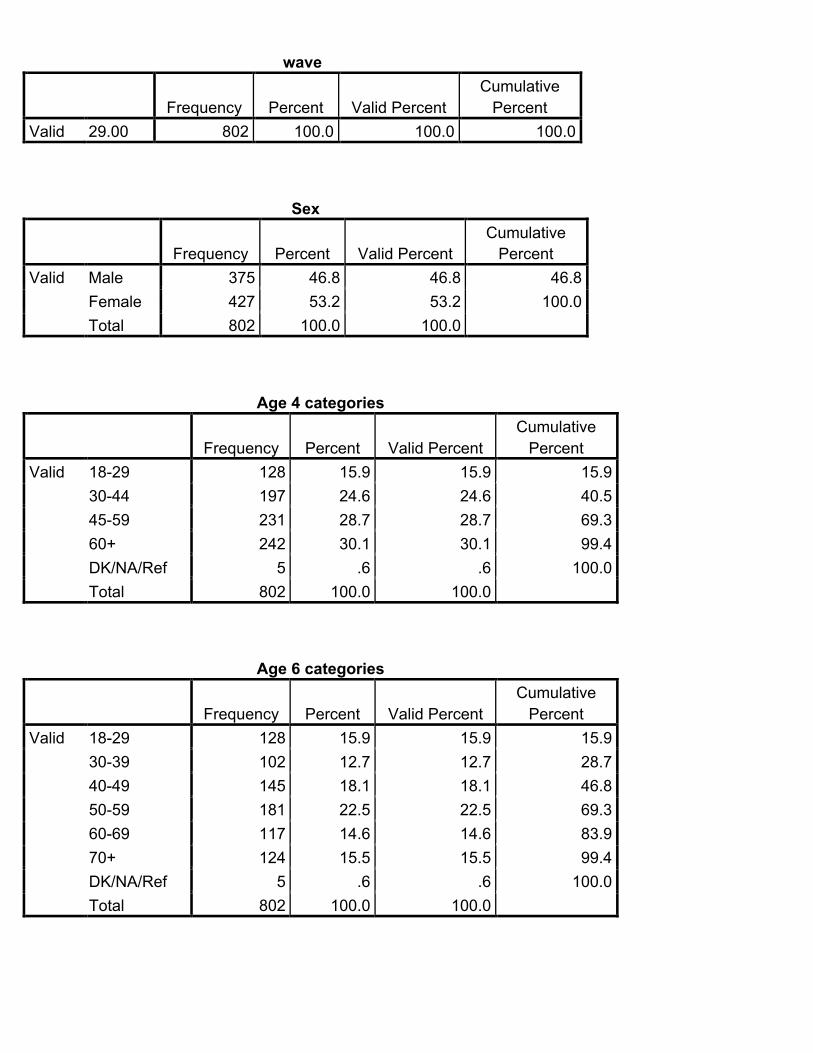
wave
Frequency Percent Valid Percent Cumulative
Percent Valid 29.00 802 100.0 100.0 100.0
Sex
Frequency Percent Valid Percent Cumulative
Percent Valid Male 375 46.8 46.8 46.8
Female 427 53.2 53.2 100.0 Total 802 100.0 100.0
Age 4 categories
Frequency Percent Valid Percent Cumulative
Percent Valid 18-29 128 15.9 15.9 15.9
30-44 197 24.6 24.6 40.5 45-59 231 28.7 28.7 69.3 60+ 242 30.1 30.1 99.4 DK/NA/Ref 5 .6 .6 100.0 Total 802 100.0 100.0
Age 6 categories
Frequency Percent Valid Percent Cumulative
Percent Valid 18-29 128 15.9 15.9 15.9
30-39 102 12.7 12.7 28.7 40-49 145 18.1 18.1 46.8 50-59 181 22.5 22.5 69.3 60-69 117 14.6 14.6 83.9 70+ 124 15.5 15.5 99.4 DK/NA/Ref 5 .6 .6 100.0 Total 802 100.0 100.0
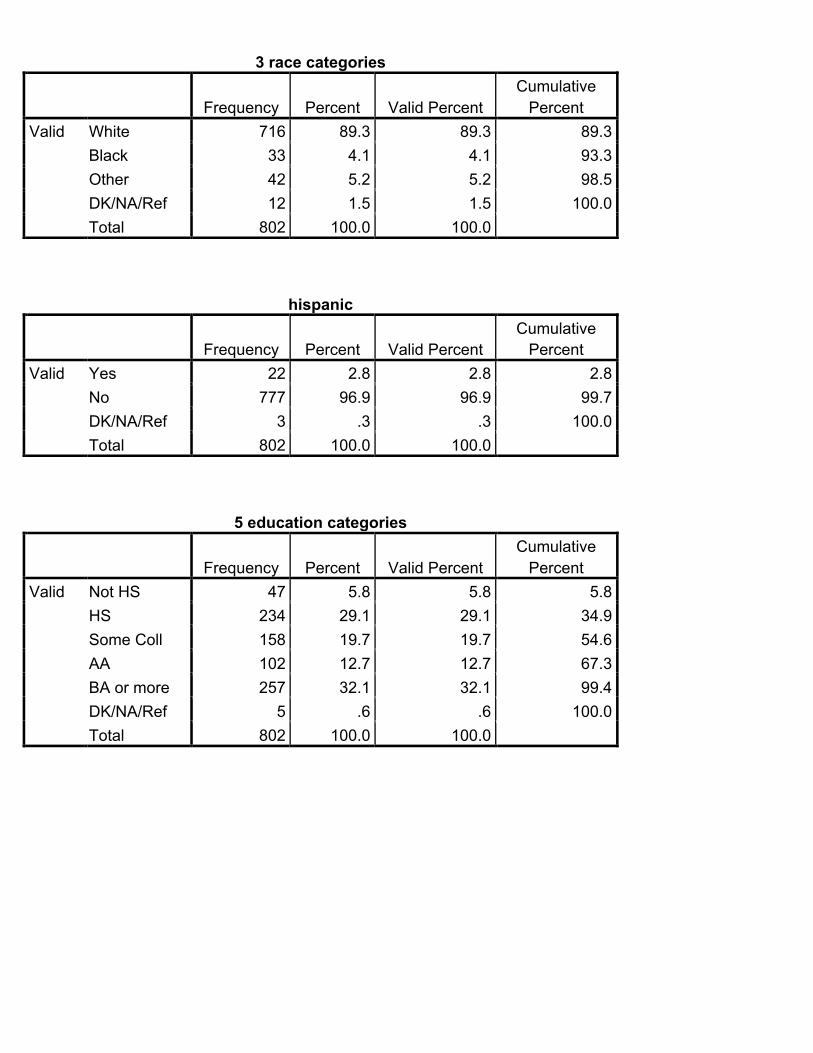
3 race categories
Frequency Percent Valid Percent Cumulative
Percent Valid White 716 89.3 89.3 89.3
Black 33 4.1 4.1 93.3 Other 42 5.2 5.2 98.5 DK/NA/Ref 12 1.5 1.5 100.0 Total 802 100.0 100.0
hispanic
Frequency Percent Valid Percent Cumulative
Percent Valid Yes 22 2.8 2.8 2.8
No 777 96.9 96.9 99.7 DK/NA/Ref 3 .3 .3 100.0 Total 802 100.0 100.0
5 education categories
Frequency Percent Valid Percent Cumulative
Percent Valid Not HS 47 5.8 5.8 5.8
HS 234 29.1 29.1 34.9 Some Coll 158 19.7 19.7 54.6 AA 102 12.7 12.7 67.3 BA or more 257 32.1 32.1 99.4 DK/NA/Ref 5 .6 .6 100.0 Total 802 100.0 100.0
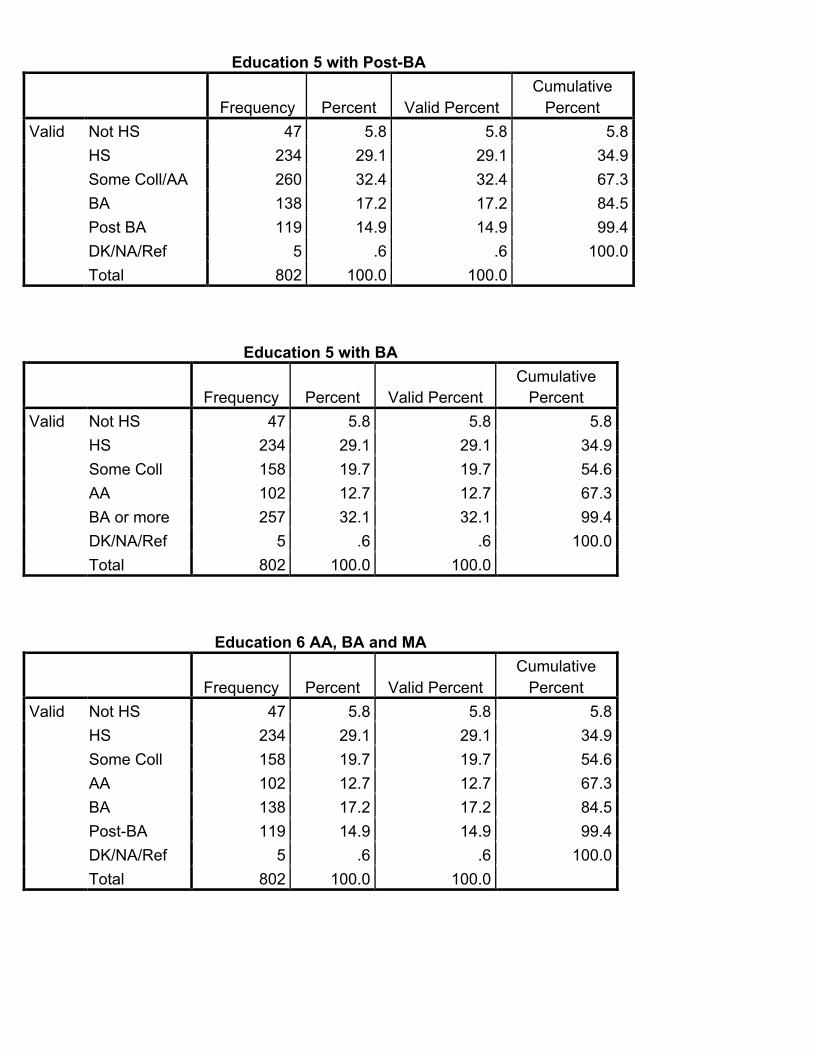
Education 5 with Post-BA
Frequency Percent Valid Percent Cumulative
Percent Valid Not HS 47 5.8 5.8 5.8
HS 234 29.1 29.1 34.9 Some Coll/AA 260 32.4 32.4 67.3 BA 138 17.2 17.2 84.5 Post BA 119 14.9 14.9 99.4 DK/NA/Ref 5 .6 .6 100.0 Total 802 100.0 100.0
Education 5 with BA
Frequency Percent Valid Percent Cumulative
Percent Valid Not HS 47 5.8 5.8 5.8
HS 234 29.1 29.1 34.9 Some Coll 158 19.7 19.7 54.6 AA 102 12.7 12.7 67.3 BA or more 257 32.1 32.1 99.4 DK/NA/Ref 5 .6 .6 100.0 Total 802 100.0 100.0
Education 6 AA, BA and MA
Frequency Percent Valid Percent Cumulative
Percent Valid Not HS 47 5.8 5.8 5.8
HS 234 29.1 29.1 34.9 Some Coll 158 19.7 19.7 54.6 AA 102 12.7 12.7 67.3 BA 138 17.2 17.2 84.5 Post-BA 119 14.9 14.9 99.4 DK/NA/Ref 5 .6 .6 100.0 Total 802 100.0 100.0
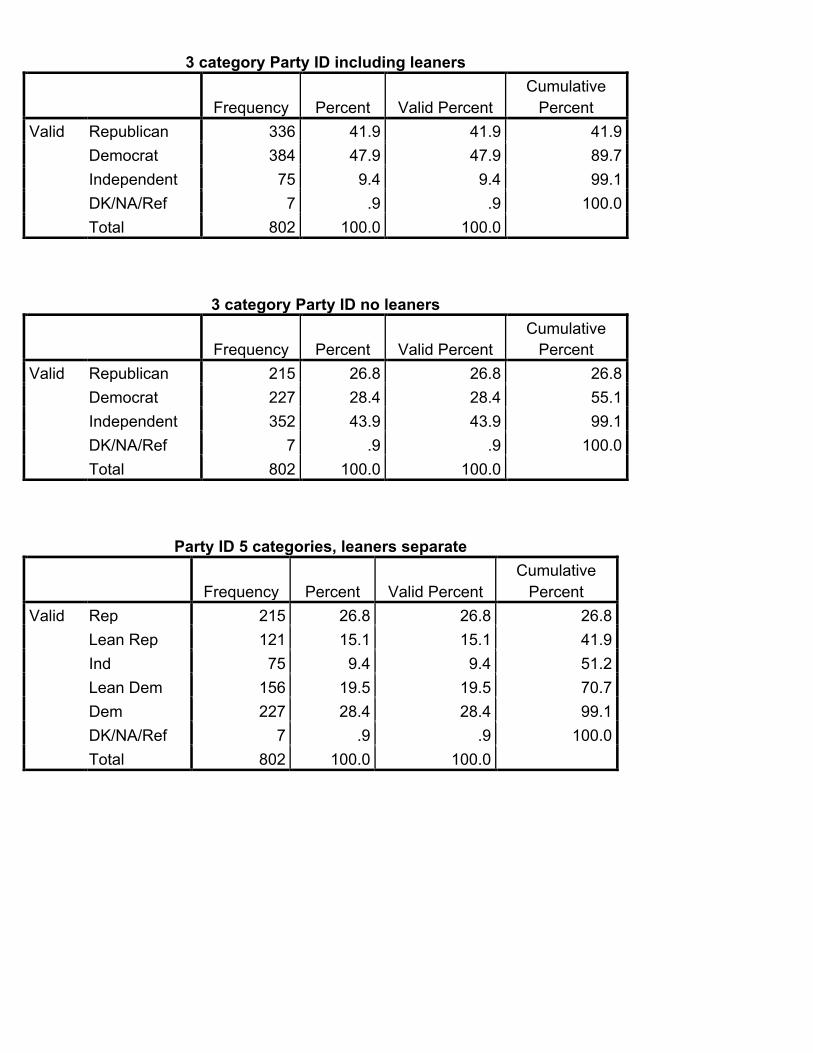
3 category Party ID including leaners
Frequency Percent Valid Percent Cumulative
Percent Valid Republican 336 41.9 41.9 41.9
Democrat 384 47.9 47.9 89.7 Independent 75 9.4 9.4 99.1 DK/NA/Ref 7 .9 .9 100.0 Total 802 100.0 100.0
3 category Party ID no leaners
Frequency Percent Valid Percent Cumulative
Percent Valid Republican 215 26.8 26.8 26.8
Democrat 227 28.4 28.4 55.1 Independent 352 43.9 43.9 99.1 DK/NA/Ref 7 .9 .9 100.0 Total 802 100.0 100.0
Party ID 5 categories, leaners separate
Frequency Percent Valid Percent Cumulative
Percent Valid Rep 215 26.8 26.8 26.8
Lean Rep 121 15.1 15.1 41.9 Ind 75 9.4 9.4 51.2 Lean Dem 156 19.5 19.5 70.7 Dem 227 28.4 28.4 99.1 DK/NA/Ref 7 .9 .9 100.0 Total 802 100.0 100.0
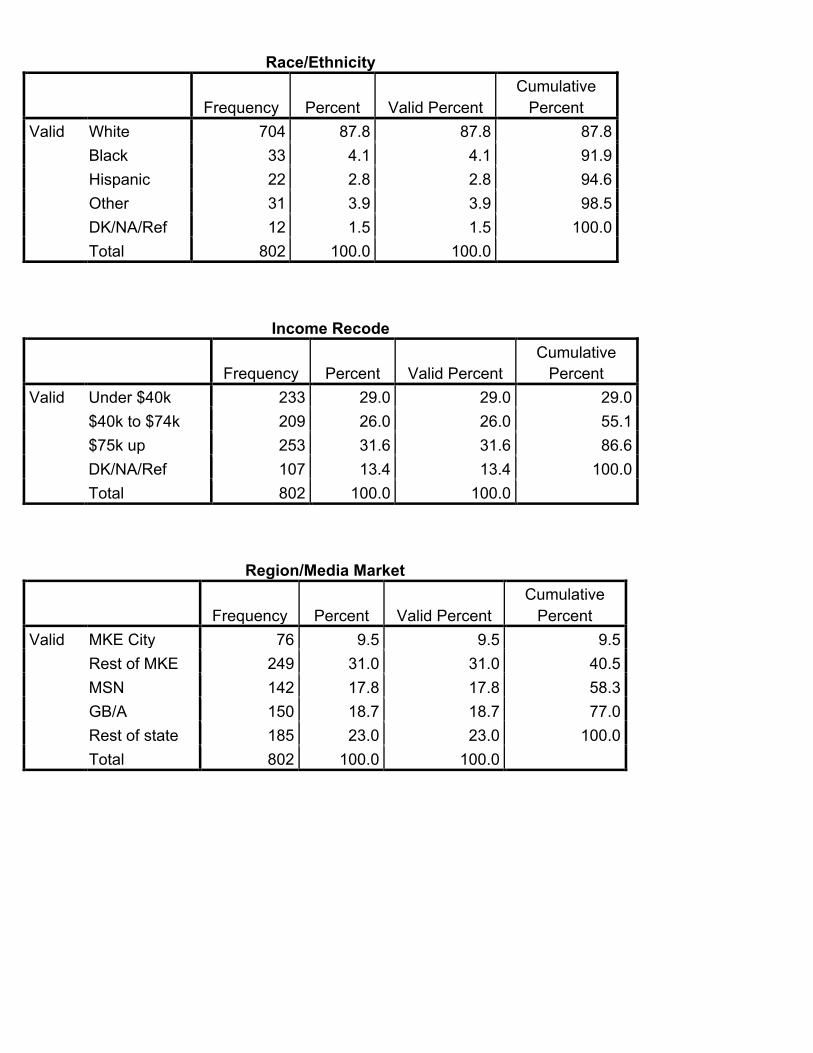
Race/Ethnicity
Frequency Percent Valid Percent Cumulative
Percent Valid White 704 87.8 87.8 87.8
Black 33 4.1 4.1 91.9 Hispanic 22 2.8 2.8 94.6 Other 31 3.9 3.9 98.5 DK/NA/Ref 12 1.5 1.5 100.0 Total 802 100.0 100.0
Income Recode
Frequency Percent Valid Percent Cumulative
Percent Valid Under $40k 233 29.0 29.0 29.0
$40k to $74k 209 26.0 26.0 55.1 $75k up 253 31.6 31.6 86.6 DK/NA/Ref 107 13.4 13.4 100.0 Total 802 100.0 100.0
Region/Media Market
Frequency Percent Valid Percent Cumulative
Percent Valid MKE City 76 9.5 9.5 9.5
Rest of MKE 249 31.0 31.0 40.5 MSN 142 17.8 17.8 58.3 GB/A 150 18.7 18.7 77.0 Rest of state 185 23.0 23.0 100.0 Total 802 100.0 100.0
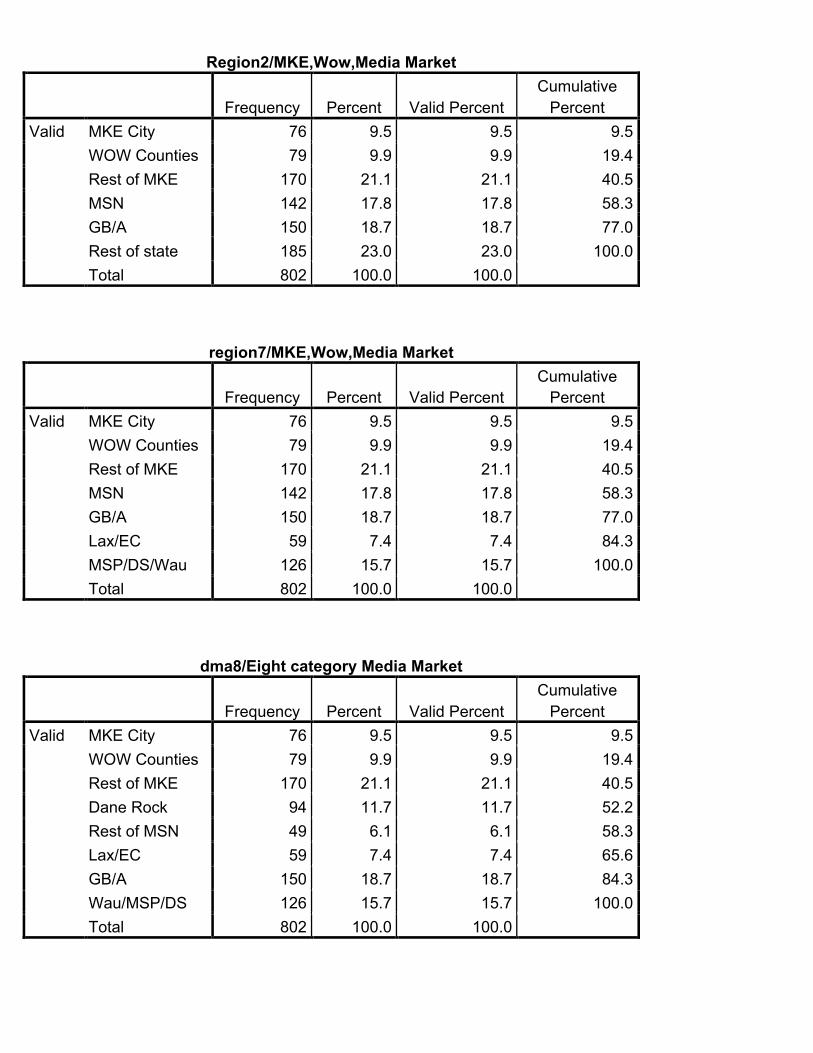
Region2/MKE,Wow,Media Market
Frequency Percent Valid Percent Cumulative
Percent Valid MKE City 76 9.5 9.5 9.5
WOW Counties 79 9.9 9.9 19.4 Rest of MKE 170 21.1 21.1 40.5 MSN 142 17.8 17.8 58.3 GB/A 150 18.7 18.7 77.0 Rest of state 185 23.0 23.0 100.0 Total 802 100.0 100.0
region7/MKE,Wow,Media Market
Frequency Percent Valid Percent Cumulative
Percent Valid MKE City 76 9.5 9.5 9.5
WOW Counties 79 9.9 9.9 19.4 Rest of MKE 170 21.1 21.1 40.5 MSN 142 17.8 17.8 58.3 GB/A 150 18.7 18.7 77.0 Lax/EC 59 7.4 7.4 84.3 MSP/DS/Wau 126 15.7 15.7 100.0 Total 802 100.0 100.0
dma8/Eight category Media Market
Frequency Percent Valid Percent Cumulative
Percent Valid MKE City 76 9.5 9.5 9.5
WOW Counties 79 9.9 9.9 19.4 Rest of MKE 170 21.1 21.1 40.5 Dane Rock 94 11.7 11.7 52.2 Rest of MSN 49 6.1 6.1 58.3 Lax/EC 59 7.4 7.4 65.6 GB/A 150 18.7 18.7 84.3 Wau/MSP/DS 126 15.7 15.7 100.0 Total 802 100.0 100.0
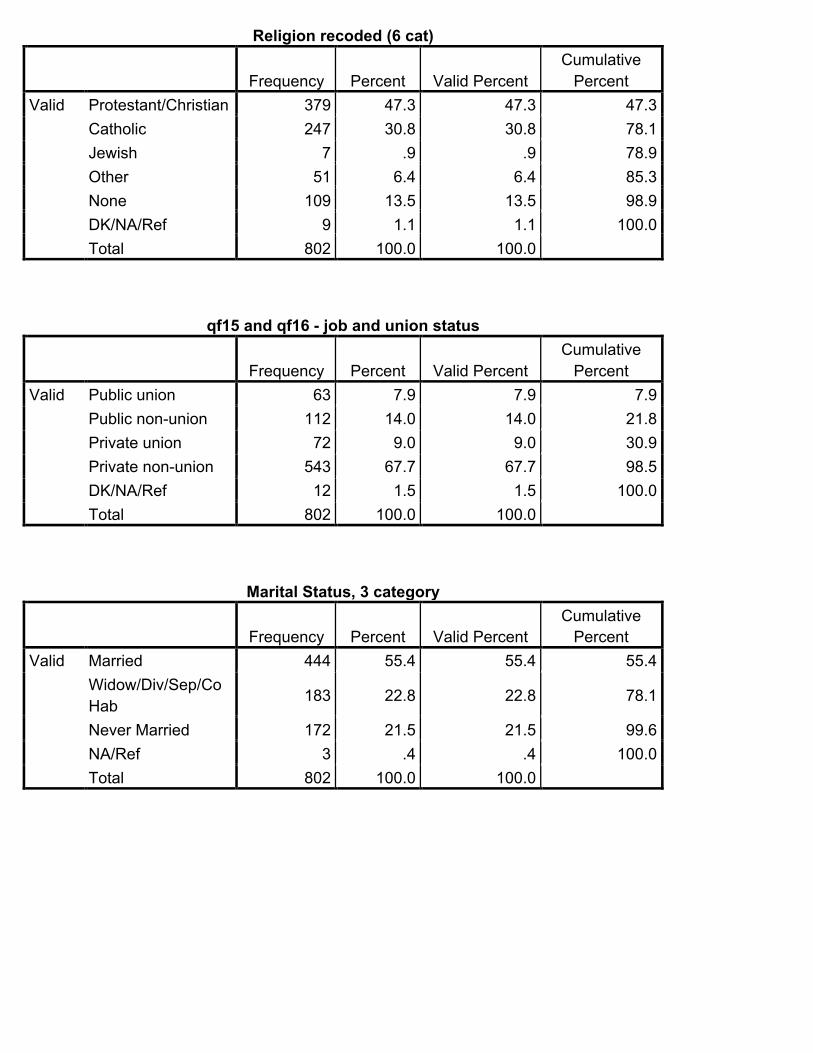
Religion recoded (6 cat)
Frequency Percent Valid Percent Cumulative
Percent Valid Protestant/Christian 379 47.3 47.3 47.3
Catholic 247 30.8 30.8 78.1 Jewish 7 .9 .9 78.9 Other 51 6.4 6.4 85.3 None 109 13.5 13.5 98.9 DK/NA/Ref 9 1.1 1.1 100.0 Total 802 100.0 100.0
qf15 and qf16 - job and union status
Frequency Percent Valid Percent Cumulative
Percent Valid Public union 63 7.9 7.9 7.9
Public non-union 112 14.0 14.0 21.8 Private union 72 9.0 9.0 30.9 Private non-union 543 67.7 67.7 98.5 DK/NA/Ref 12 1.5 1.5 100.0 Total 802 100.0 100.0
Marital Status, 3 category
Frequency Percent Valid Percent Cumulative
Percent Valid Married 444 55.4 55.4 55.4
Widow/Div/Sep/CoHab 183 22.8 22.8 78.1
Never Married 172 21.5 21.5 99.6 NA/Ref 3 .4 .4 100.0 Total 802 100.0 100.0