marketing simulation; examples
TRANSCRIPT
Case Studies A sample of applications of Concentric software
Simulate Your Market
© Concentric, Inc. 2014. All rights reserved.
Concentric Applications All the ways you can use our simulation technology
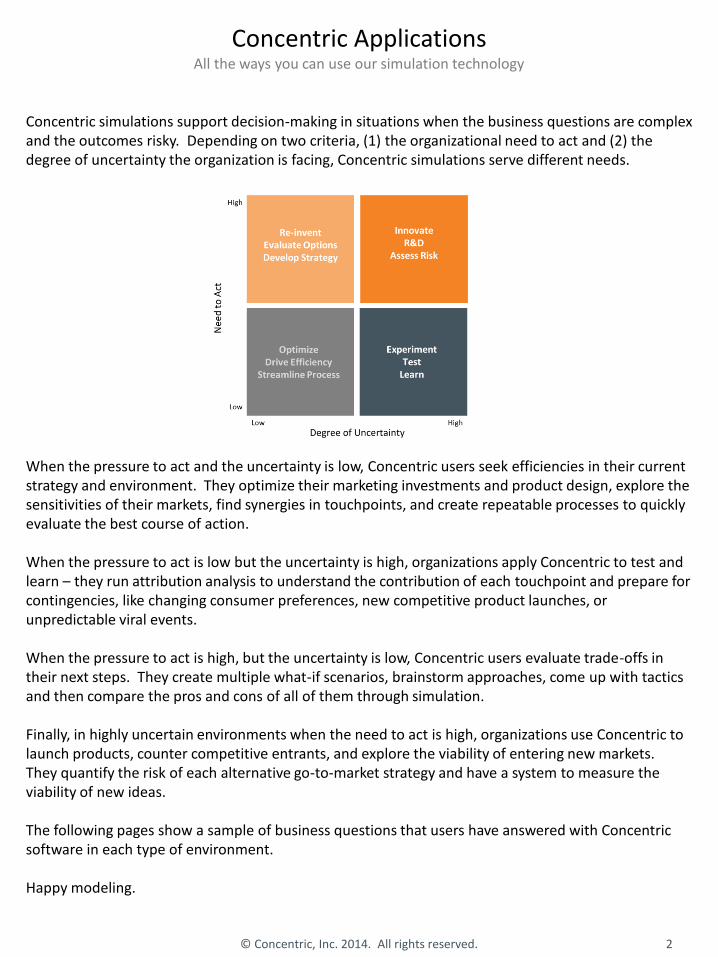
Concentric simulations support decision-making in situations when the business questions are complex and the outcomes risky. Depending on two criteria, (1) the organizational need to act and (2) the degree of uncertainty the organization is facing, Concentric simulations serve different needs. When the pressure to act and the uncertainty is low, Concentric users seek efficiencies in their current strategy and environment. They optimize their marketing investments and product design, explore the sensitivities of their markets, find synergies in touchpoints, and create repeatable processes to quickly evaluate the best course of action. When the pressure to act is low but the uncertainty is high, organizations apply Concentric to test and learn – they run attribution analysis to understand the contribution of each touchpoint and prepare for contingencies, like changing consumer preferences, new competitive product launches, or unpredictable viral events. When the pressure to act is high, but the uncertainty is low, Concentric users evaluate trade-offs in their next steps. They create multiple what-if scenarios, brainstorm approaches, come up with tactics and then compare the pros and cons of all of them through simulation. Finally, in highly uncertain environments when the need to act is high, organizations use Concentric to launch products, counter competitive entrants, and explore the viability of entering new markets. They quantify the risk of each alternative go-to-market strategy and have a system to measure the viability of new ideas. The following pages show a sample of business questions that users have answered with Concentric software in each type of environment. Happy modeling.
© Concentric, Inc. 2014. All rights reserved. 2

Contents A sample of applications
© Concentric, Inc. 2014. All rights reserved. 3
5 Streaming Video What media allocation maximizes subscriptions?
7 Banking What portfolio allocation reaches our targets?
9 Automotive What marketing investment maximizes web traffic?
11 Pre-paid Wireless Which strategy for which region?
13 Coffee Maker Invest in product or in-store marketing?
15 Soup Would promotions increase sales?
17 Telecom How does sentiment move market share?
19 Vitamin Supplement What channels and what timing for a new message?
21 Luxury Perfume What is the impact of earned media?
22 Airline How do we minimize the effect of negative word of mouth?
24 Credit Card What is the trade-off between profit and reputation?
26 Internet TV Network What is the risk of competitive pricing moves?
27 Magazine How do we make our brand more engaging?
29 Pharma Which launch strategy reaches our sales target?
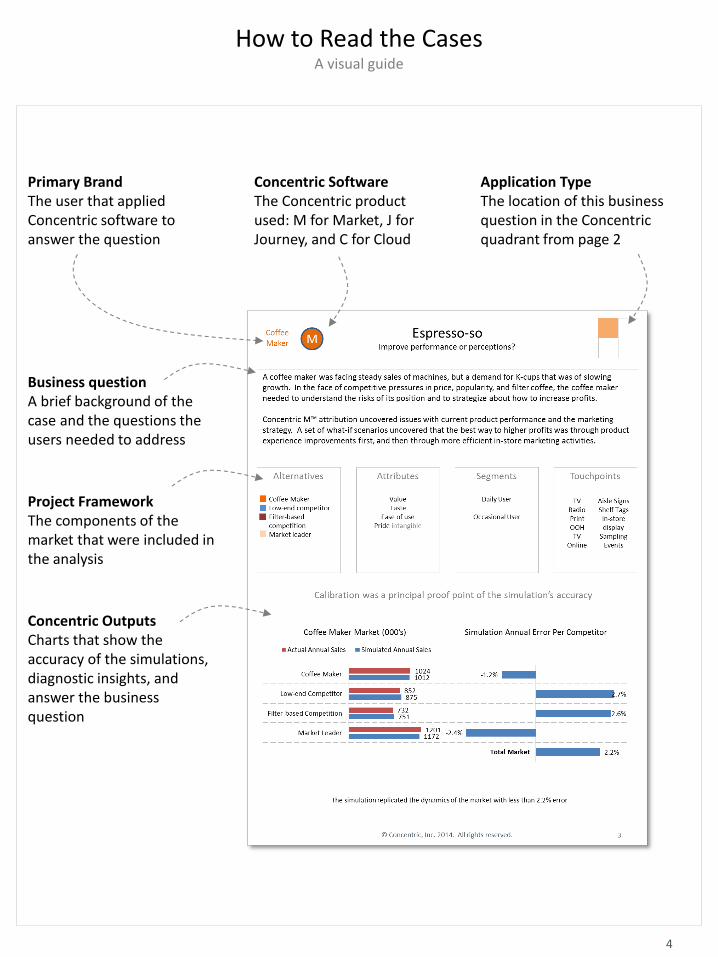
How to Read the Cases A visual guide
Business question A brief background of the case and the questions the users needed to address
Primary Brand The user that applied Concentric software to answer the question
Concentric Software The Concentric product used: M for Market, J for Journey, and C for Cloud
Application Type The location of this business question in the Concentric quadrant from page 2
Project Framework The components of the market that were included in the analysis
Concentric Outputs Charts that show the accuracy of the simulations, diagnostic insights, and answer the business question
4
-
10
20
30
40
50
Sub
scri
ber
ship
(m
illio
ns)
2012 Validation
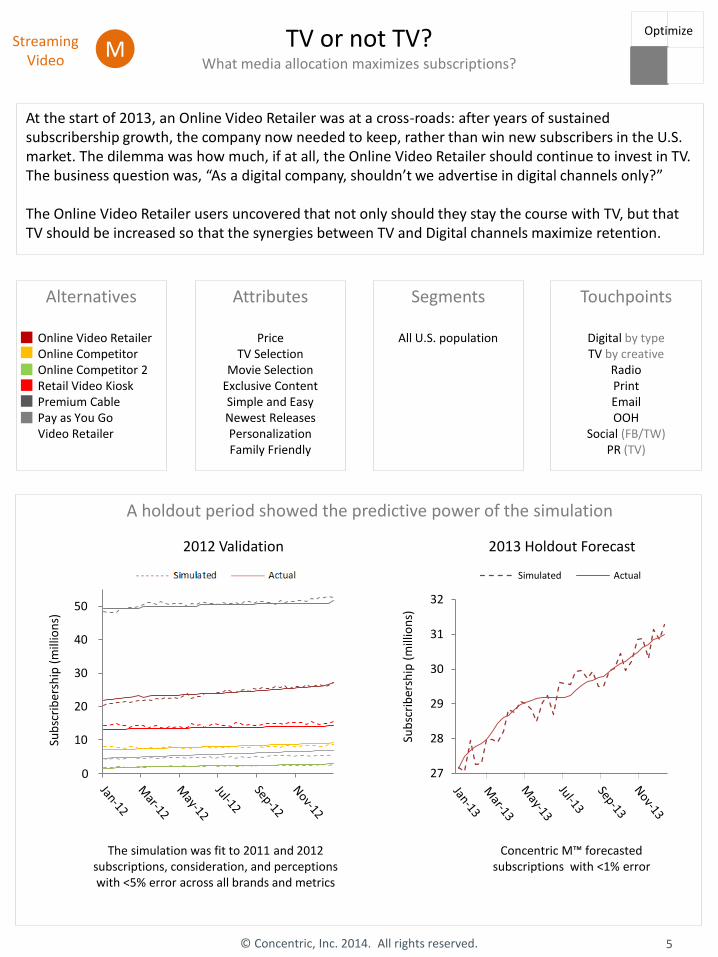
TV or not TV? What media allocation maximizes subscriptions?
At the start of 2013, an Online Video Retailer was at a cross-roads: after years of sustained subscribership growth, the company now needed to keep, rather than win new subscribers in the U.S. market. The dilemma was how much, if at all, the Online Video Retailer should continue to invest in TV. The business question was, “As a digital company, shouldn’t we advertise in digital channels only?” The Online Video Retailer users uncovered that not only should they stay the course with TV, but that TV should be increased so that the synergies between TV and Digital channels maximize retention.
Alternatives
Online Video Retailer Online Competitor Online Competitor 2 Retail Video Kiosk Premium Cable Pay as You Go Video Retailer
Attributes
Price TV Selection
Movie Selection Exclusive Content Simple and Easy Newest Releases Personalization Family Friendly
Segments
All U.S. population
Touchpoints
Digital by type TV by creative
Radio Print Email OOH
Social (FB/TW) PR (TV)
A holdout period showed the predictive power of the simulation
The simulation was fit to 2011 and 2012 subscriptions, consideration, and perceptions with <5% error across all brands and metrics
Concentric M™ forecasted subscriptions with <1% error
27
28
29
30
31
32
Sub
scri
ber
ship
(m
illio
ns)
2013 Holdout Forecast
Simulated Actual
M
5 © Concentric, Inc. 2014. All rights reserved.
Streaming Video
Optimize
0
TV or not TV? What media allocation maximizes subscriptions?
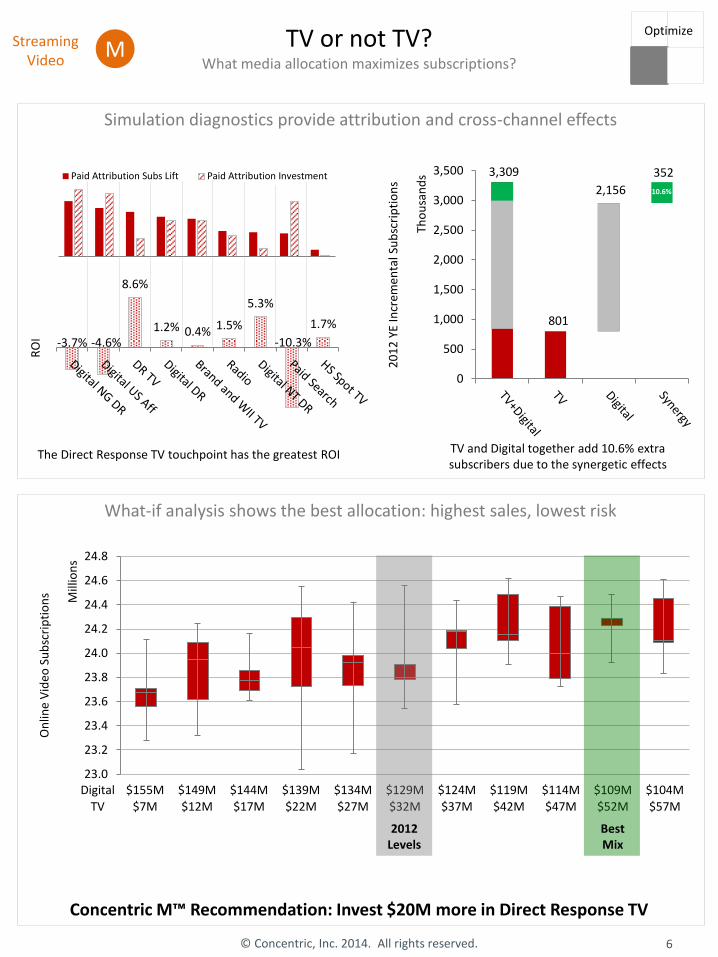
Simulation diagnostics provide attribution and cross-channel effects
What-if analysis shows the best allocation: highest sales, lowest risk
Paid Attribution Subs Lift Paid Attribution Investment
The Direct Response TV touchpoint has the greatest ROI
3,309
801
2,156
352
0
500
1,000
1,500
2,000
2,500
3,000
3,500
20
12
YE
Incr
emen
tal S
ub
scri
pti
on
s
Tho
usa
nd
s
10.6%
TV and Digital together add 10.6% extra subscribers due to the synergetic effects
23.0
23.2
23.4
23.6
23.8
24.0
24.2
24.4
24.6
24.8
On
line
Vid
eo S
ub
scri
pti
on
s Mill
ion
s
Digital $155M $149M $144M $139M $134M $129M $124M $119M $114M $109M $104M
TV $7M $12M $17M $22M $27M $32M $37M $42M $47M $52M $57M
2012 Levels
Best Mix
-3.7% -4.6%
8.6%
1.2% 0.4% 1.5%
5.3%
-10.3%
1.7%
RO
I
Concentric M™ Recommendation: Invest $20M more in Direct Response TV
Streaming Video
M
6 © Concentric, Inc. 2014. All rights reserved.
Optimize
-
20,000
40,000
60,000
80,000
100,000
120,000
Mem
ber
s
Auto - Simulation
Auto - Actual
Two Birds with One Budget What portfolio allocation reaches our targets?
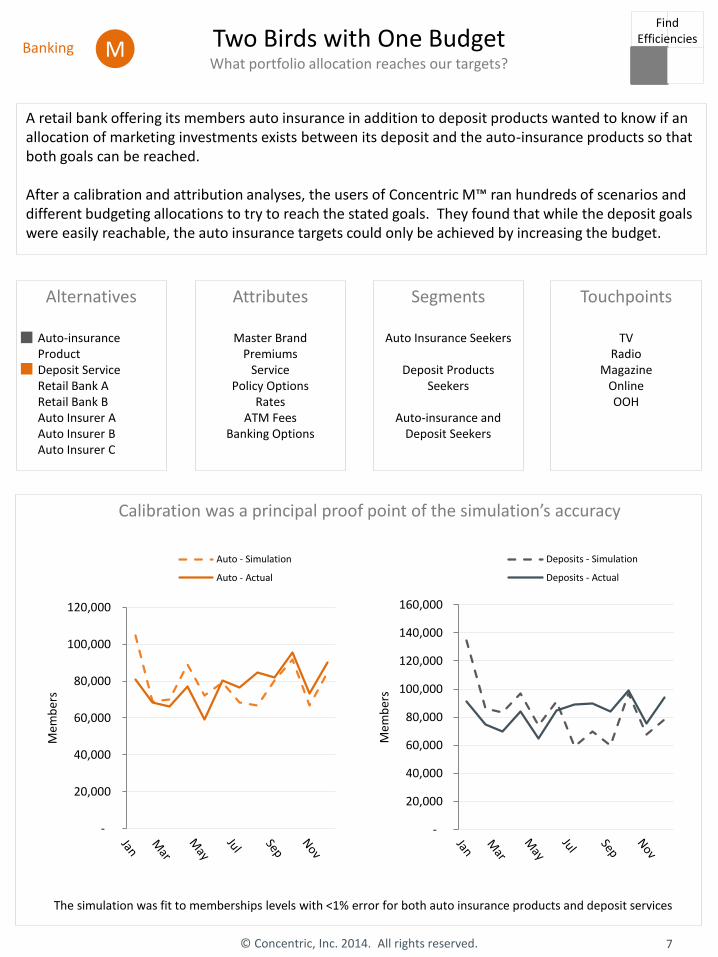
A retail bank offering its members auto insurance in addition to deposit products wanted to know if an allocation of marketing investments exists between its deposit and the auto-insurance products so that both goals can be reached. After a calibration and attribution analyses, the users of Concentric M™ ran hundreds of scenarios and different budgeting allocations to try to reach the stated goals. They found that while the deposit goals were easily reachable, the auto insurance targets could only be achieved by increasing the budget.
Alternatives
Auto-insurance Product Deposit Service Retail Bank A Retail Bank B Auto Insurer A Auto Insurer B Auto Insurer C
Attributes
Master Brand Premiums
Service Policy Options
Rates ATM Fees
Banking Options
Segments
Auto Insurance Seekers
Deposit Products Seekers
Auto-insurance and
Deposit Seekers
Touchpoints
TV Radio
Magazine Online OOH
Calibration was a principal proof point of the simulation’s accuracy
The simulation was fit to memberships levels with <1% error for both auto insurance products and deposit services
Banking M
-
20,000
40,000
60,000
80,000
100,000
120,000
140,000
160,000
Mem
ber
s
Deposits - Simulation
Deposits - Actual
7 © Concentric, Inc. 2014. All rights reserved.
Find Efficiencies
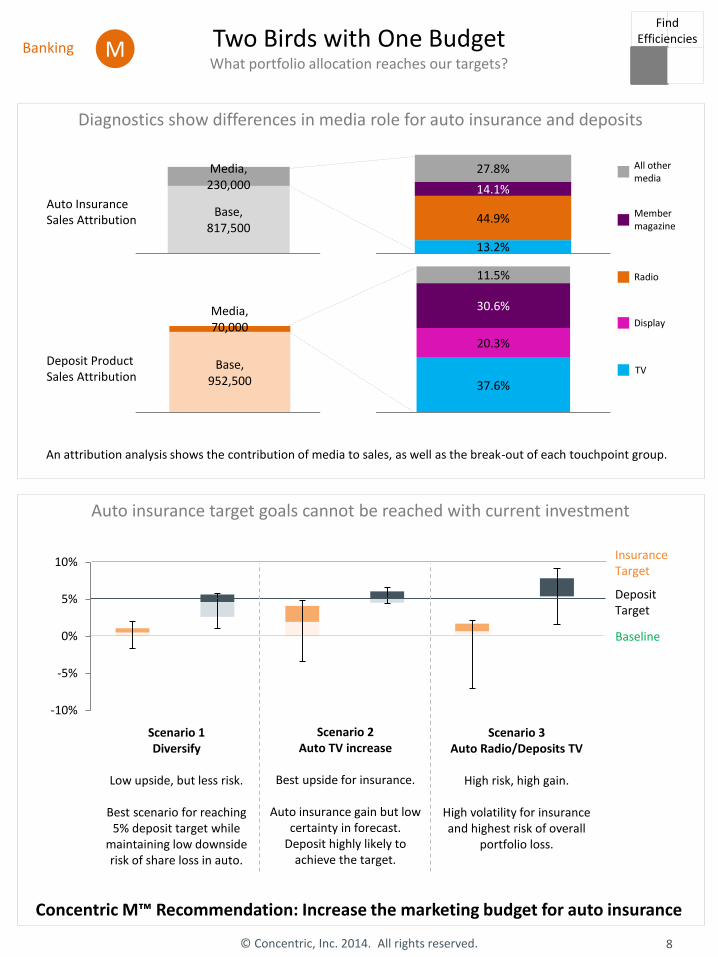
Base, 817,500
Media, 230,000
Base, 952,500
Media, 70,000
Two Birds with One Budget What portfolio allocation reaches our targets?
Diagnostics show differences in media role for auto insurance and deposits
Auto insurance target goals cannot be reached with current investment
M
-10%
-5%
0%
5%
10%
Scenario 1 Diversify
Low upside, but less risk.
Best scenario for reaching
5% deposit target while maintaining low downside risk of share loss in auto.
Scenario 2 Auto TV increase
Best upside for insurance.
Auto insurance gain but low
certainty in forecast. Deposit highly likely to
achieve the target.
Scenario 3 Auto Radio/Deposits TV
High risk, high gain.
High volatility for insurance and highest risk of overall
portfolio loss.
Deposit Target
Insurance Target
Baseline
Concentric M™ Recommendation: Increase the marketing budget for auto insurance
13.2%
44.9%
14.1%
27.8%
An attribution analysis shows the contribution of media to sales, as well as the break-out of each touchpoint group.
37.6%
20.3%
30.6%
11.5%
Auto Insurance Sales Attribution
Deposit Product Sales Attribution
All other media
Member magazine
Radio
Display
TV
8 © Concentric, Inc. 2014. All rights reserved.
Banking
Find Efficiencies
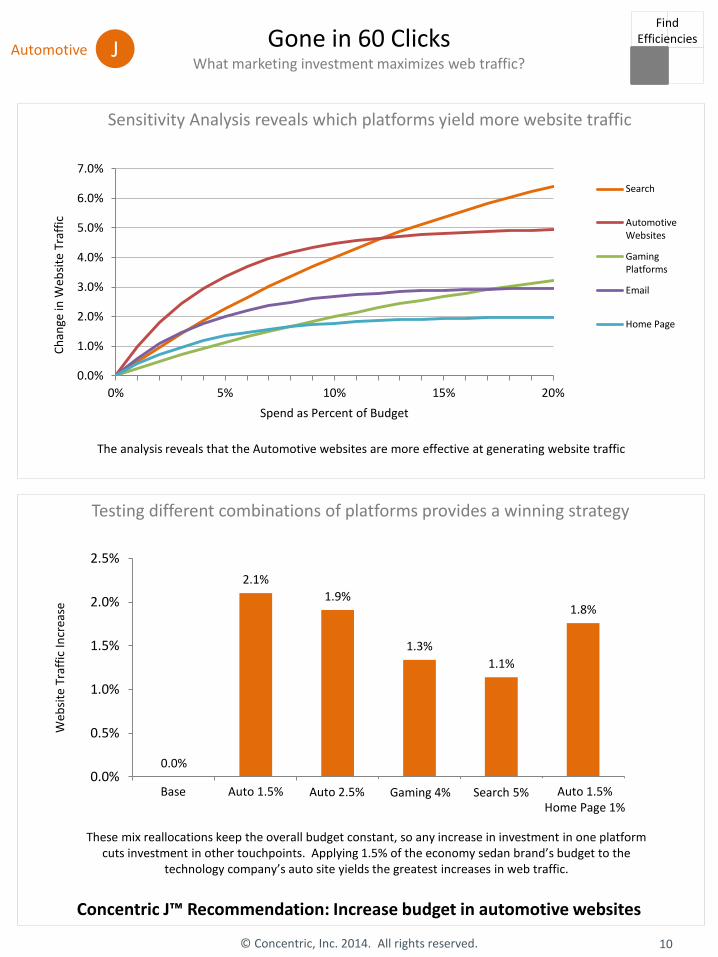
Gone in 60 Clicks What marketing investment maximizes web traffic?
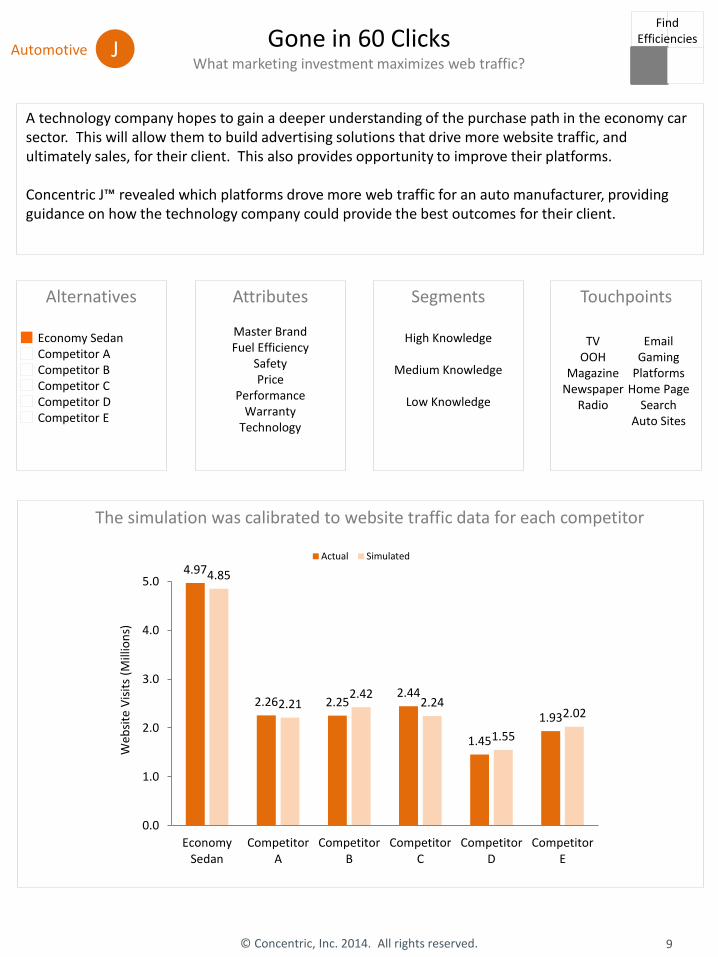
A technology company hopes to gain a deeper understanding of the purchase path in the economy car sector. This will allow them to build advertising solutions that drive more website traffic, and ultimately sales, for their client. This also provides opportunity to improve their platforms. Concentric J™ revealed which platforms drove more web traffic for an auto manufacturer, providing guidance on how the technology company could provide the best outcomes for their client.
Alternatives
Economy Sedan Competitor A Competitor B Competitor C Competitor D Competitor E
Attributes
Master Brand Fuel Efficiency
Safety Price
Performance Warranty
Technology
Segments
High Knowledge
Medium Knowledge
Low Knowledge
Touchpoints
J
TV OOH
Magazine Newspaper
Radio
Email Gaming
Platforms Home Page
Search Auto Sites
The simulation was calibrated to website traffic data for each competitor
4.97
2.26 2.25 2.44
1.45
1.93
4.85
2.21 2.42
2.24
1.55
2.02
0.0
1.0
2.0
3.0
4.0
5.0
EconomySedan
CompetitorA
CompetitorB
CompetitorC
CompetitorD
CompetitorE
Web
site
Vis
its
(Mill
ion
s)
Actual Simulated
9 © Concentric, Inc. 2014. All rights reserved.
Automotive
Find Efficiencies
Gone in 60 Clicks What marketing investment maximizes web traffic?
Testing different combinations of platforms provides a winning strategy
Concentric J™ Recommendation: Increase budget in automotive websites
10 © Concentric, Inc. 2014. All rights reserved.
Automotive J
0.0%
2.1%
1.9%
1.3%
1.1%
1.8%
0.0%
0.5%
1.0%
1.5%
2.0%
2.5%
Base MS Auto 1.5 MS Auto 2.5 MS Windows 4 MS Bing 5 Auto 1.5 +Windows 1
Web
site
Tra
ffic
In
crea
se
Sensitivity Analysis reveals which platforms yield more website traffic
Auto 1.5% Auto 2.5% Search 5% Auto 1.5% Home Page 1%
Base Gaming 4%
These mix reallocations keep the overall budget constant, so any increase in investment in one platform cuts investment in other touchpoints. Applying 1.5% of the economy sedan brand’s budget to the
technology company’s auto site yields the greatest increases in web traffic.
The analysis reveals that the Automotive websites are more effective at generating website traffic
0.0%
1.0%
2.0%
3.0%
4.0%
5.0%
6.0%
7.0%
0% 5% 10% 15% 20%
Ch
ange
in W
ebsi
te T
raff
ic
Spend as Percent of Budget
Search
AutomotiveWebsites
GamingPlatforms
Home Page
Find Efficiencies
165
69
155
71
35
106
194
73
170
78
33
127
Gro
ss A
dd
s (0
00
)
Forecast Data
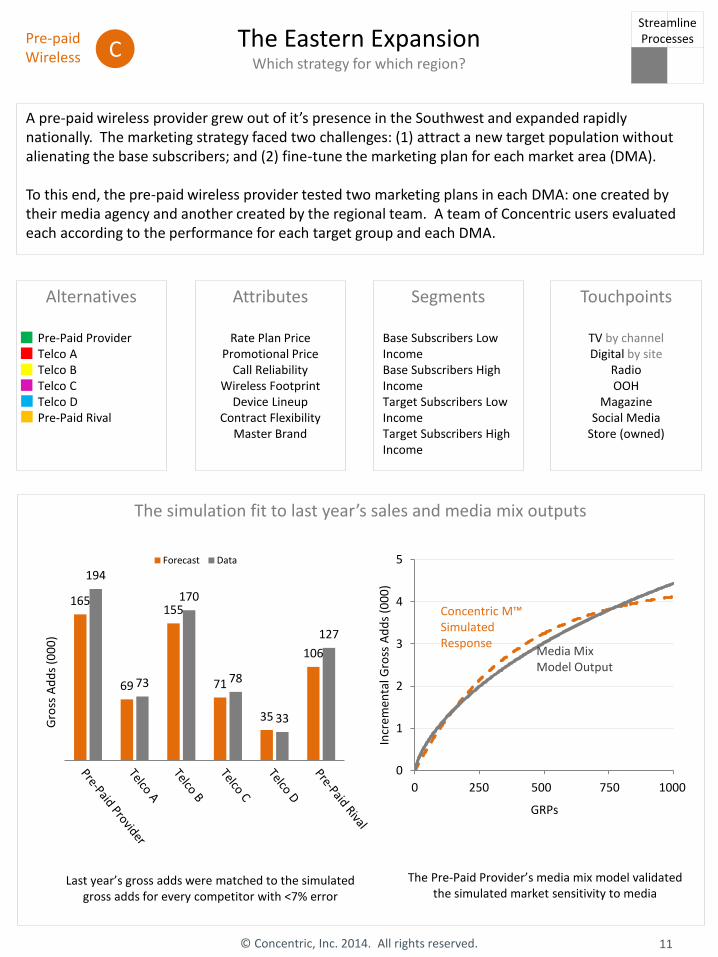
The Eastern Expansion Which strategy for which region?
The simulation fit to last year’s sales and media mix outputs
Last year’s gross adds were matched to the simulated gross adds for every competitor with <7% error
Pre-paid Wireless
A pre-paid wireless provider grew out of it’s presence in the Southwest and expanded rapidly nationally. The marketing strategy faced two challenges: (1) attract a new target population without alienating the base subscribers; and (2) fine-tune the marketing plan for each market area (DMA). To this end, the pre-paid wireless provider tested two marketing plans in each DMA: one created by their media agency and another created by the regional team. A team of Concentric users evaluated each according to the performance for each target group and each DMA.
Alternatives
Pre-Paid Provider Telco A Telco B Telco C Telco D Pre-Paid Rival
Attributes
Rate Plan Price Promotional Price
Call Reliability Wireless Footprint
Device Lineup Contract Flexibility
Master Brand
Segments
Base Subscribers Low Income Base Subscribers High Income Target Subscribers Low Income Target Subscribers High Income
Touchpoints
TV by channel Digital by site
Radio OOH
Magazine Social Media
Store (owned)
C
0
1
2
3
4
5
1 251 501 751 1001
Incr
emen
tal G
ross
Ad
ds
(00
0)
GRPs
Concentric M™ Simulated Response
Media Mix Model Output
The Pre-Paid Provider’s media mix model validated the simulated market sensitivity to media
11 © Concentric, Inc. 2014. All rights reserved.
Streamline Processes
0 250 500 750 1000 GRPs
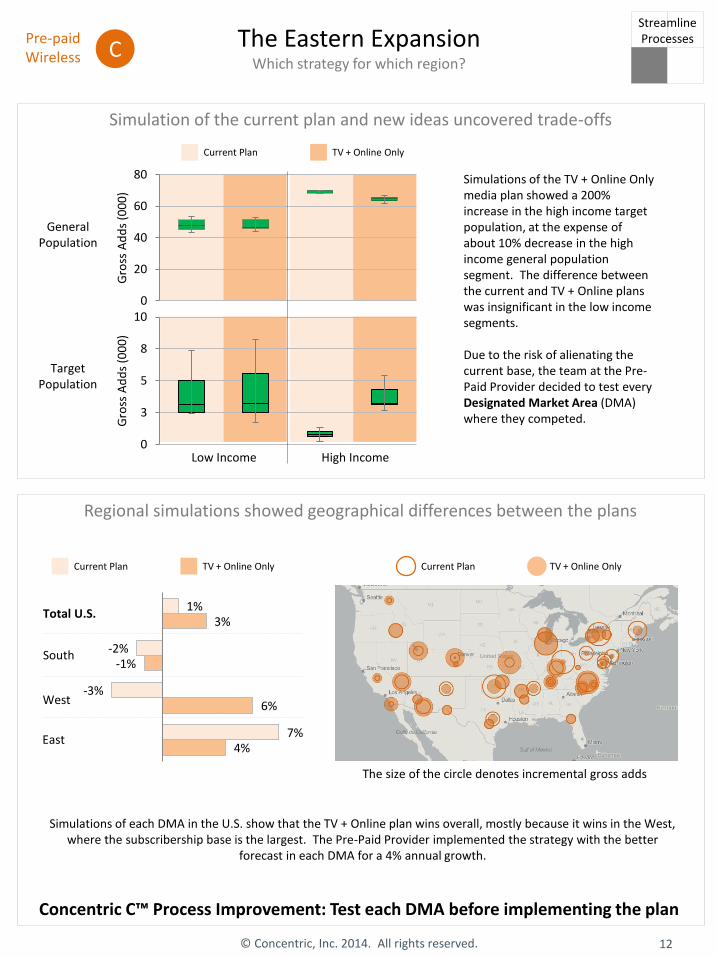
Simulation of the current plan and new ideas uncovered trade-offs
The Eastern Expansion Which strategy for which region?
Regional simulations showed geographical differences between the plans
Concentric C™ Process Improvement: Test each DMA before implementing the plan
Simulations of each DMA in the U.S. show that the TV + Online plan wins overall, mostly because it wins in the West, where the subscribership base is the largest. The Pre-Paid Provider implemented the strategy with the better
forecast in each DMA for a 4% annual growth.
Pre-paid Wireless C
4%
6%
-1%
3%
7%
-3%
-2%
1% Total U.S.
South
West
East
Current Plan TV + Online Only
Low Income 0
3
5
8
10
Gro
ss A
dd
s (0
00
)
0
20
40
60
80
Gro
ss A
dd
s (0
00
)
High Income
General Population
Target Population
Simulations of the TV + Online Only media plan showed a 200% increase in the high income target population, at the expense of about 10% decrease in the high income general population segment. The difference between the current and TV + Online plans was insignificant in the low income segments. Due to the risk of alienating the current base, the team at the Pre-Paid Provider decided to test every Designated Market Area (DMA) where they competed.
The size of the circle denotes incremental gross adds
12 © Concentric, Inc. 2014. All rights reserved.
Streamline Processes
Current Plan TV + Online Only Current Plan TV + Online Only
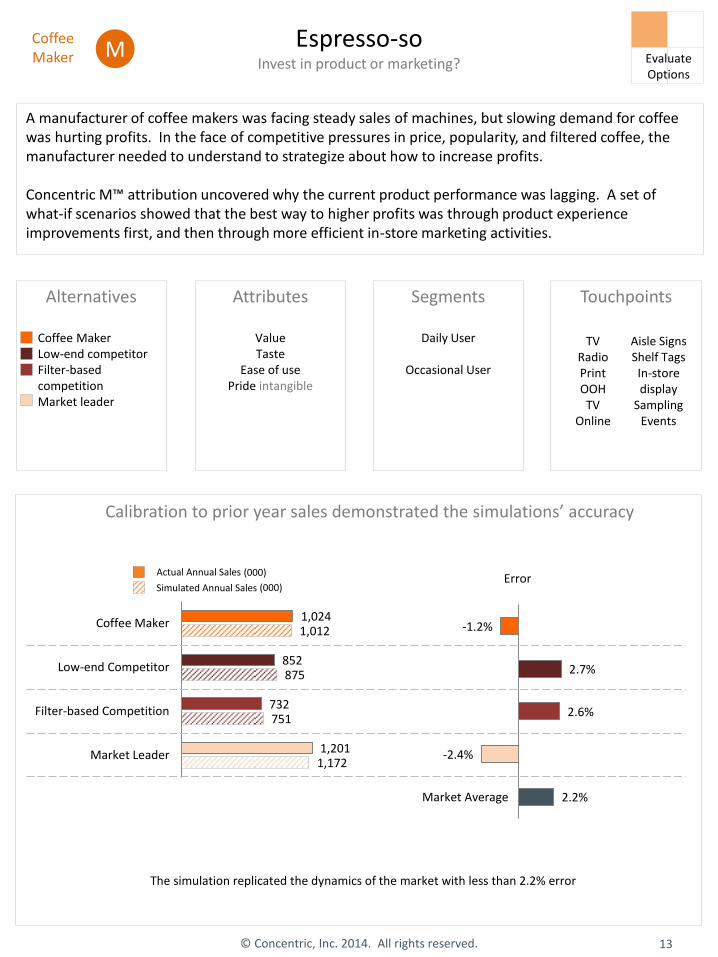
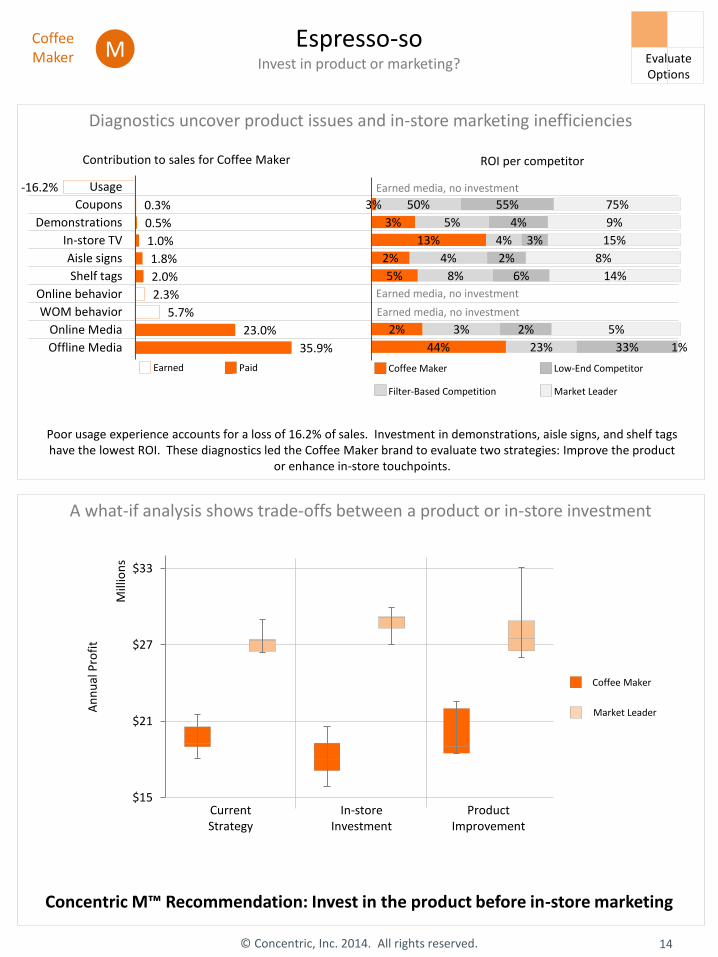
Espresso-so Invest in product or marketing?
A manufacturer of coffee makers was facing steady sales of machines, but slowing demand for coffee was hurting profits. In the face of competitive pressures in price, popularity, and filtered coffee, the manufacturer needed to understand to strategize about how to increase profits. Concentric M™ attribution uncovered why the current product performance was lagging. A set of what-if scenarios showed that the best way to higher profits was through product experience improvements first, and then through more efficient in-store marketing activities.
Alternatives
Coffee Maker Low-end competitor Filter-based competition Market leader
Attributes
Value Taste
Ease of use Pride intangible
Segments
Daily User
Occasional User
Touchpoints
Calibration to prior year sales demonstrated the simulations’ accuracy
The simulation replicated the dynamics of the market with less than 2.2% error
Coffee Maker M
TV Radio Print OOH TV
Online
Aisle Signs Shelf Tags In-store display
Sampling Events
1,172
751
875
1,012
1,201
732
852
1,024
Market Leader
Filter-based Competition
Low-end Competitor
Coffee Maker
Actual Annual Sales
Simulated Annual Sales
2.2%
-2.4%
2.6%
2.7%
-1.2%
Market Average
13 © Concentric, Inc. 2014. All rights reserved.
Evaluate Options
(000) Error
(000)
Espresso-so Invest in product or marketing?
Diagnostics uncover product issues and in-store marketing inefficiencies
A what-if analysis shows trade-offs between a product or in-store investment
Coffee Maker M
Concentric M™ Recommendation: Invest in the product before in-store marketing
35.9%
23.0%
5.7%
2.3%
2.0%
1.8%
1.0%
0.5%
0.3%
-16.2%
Offline Media
Online Media
WOM behavior
Online behavior
Shelf tags
Aisle signs
In-store TV
Demonstrations
Coupons
Usage
Contribution to sales for Coffee Maker
44%
2%
5%
2%
13%
3%
3%
23%
3%
8%
4%
4%
5%
50%
33%
2%
6%
2%
3%
4%
55%
1%
5%
14%
8%
15%
9%
75%
ROI per competitor
Coffee Maker Low-End Competitor
Filter-Based Competition Market Leader
Earned media, no investment
Earned media, no investment
Earned media, no investment
$15
$21
$27
$33
An
nu
al P
rofi
t
Mill
ion
s
Earned Paid
Poor usage experience accounts for a loss of 16.2% of sales. Investment in demonstrations, aisle signs, and shelf tags have the lowest ROI. These diagnostics led the Coffee Maker brand to evaluate two strategies: Improve the product
or enhance in-store touchpoints.
Current Strategy
In-store Investment
Product Improvement
14 © Concentric, Inc. 2014. All rights reserved.
Evaluate Options
Market Leader
Coffee Maker
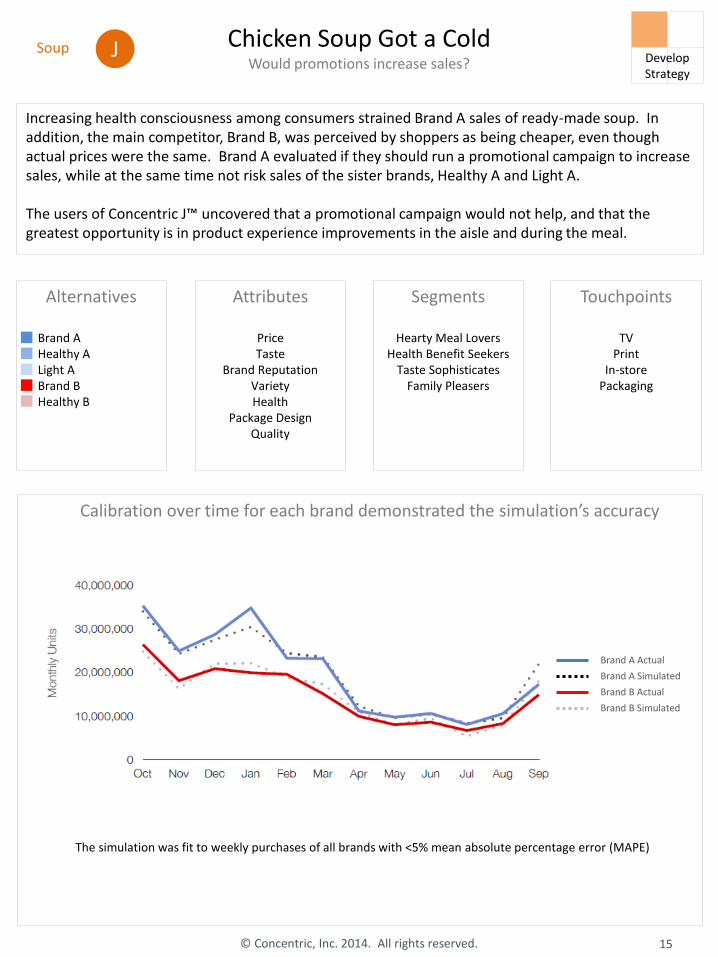
Chicken Soup Got a Cold Would promotions increase sales?
Increasing health consciousness among consumers strained Brand A sales of ready-made soup. In addition, the main competitor, Brand B, was perceived by shoppers as being cheaper, even though actual prices were the same. Brand A evaluated if they should run a promotional campaign to increase sales, while at the same time not risk sales of the sister brands, Healthy A and Light A. The users of Concentric J™ uncovered that a promotional campaign would not help, and that the greatest opportunity is in product experience improvements in the aisle and during the meal.
Alternatives
Brand A Healthy A Light A Brand B Healthy B
Attributes
Price Taste
Brand Reputation Variety Health
Package Design Quality
Segments
Hearty Meal Lovers Health Benefit Seekers
Taste Sophisticates Family Pleasers
Touchpoints
TV Print
In-store Packaging
Calibration over time for each brand demonstrated the simulation’s accuracy
The simulation was fit to weekly purchases of all brands with <5% mean absolute percentage error (MAPE)
Soup
Brand A Actual
Brand A Simulated
Brand B Actual
Brand B Simulated
J
15 © Concentric, Inc. 2014. All rights reserved.
Develop Strategy
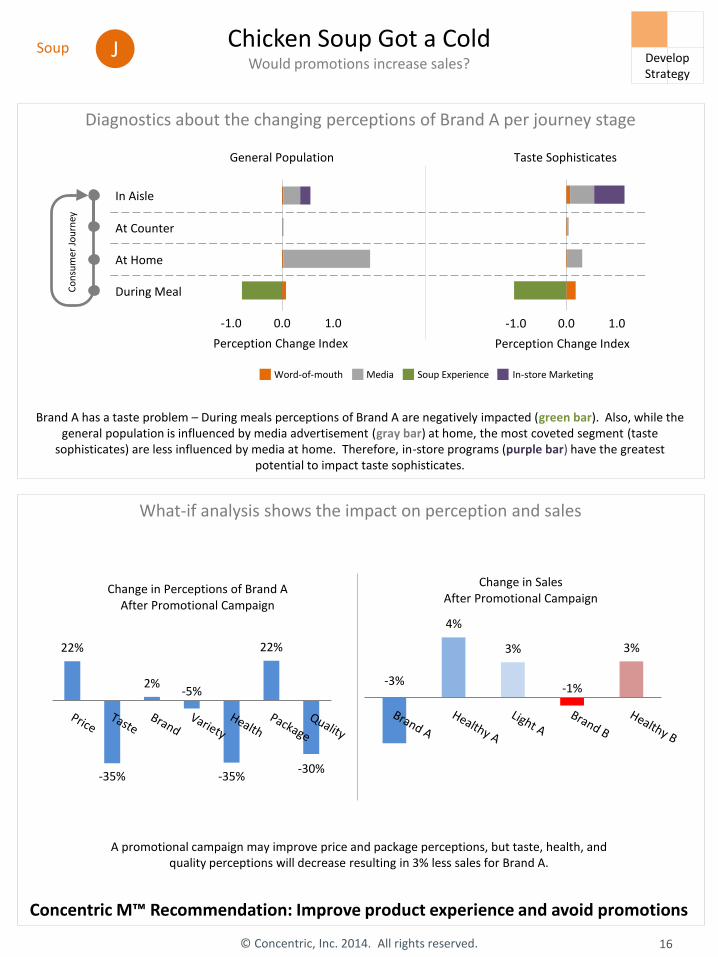
Chicken Soup Got a Cold Would promotions increase sales?
Diagnostics about the changing perceptions of Brand A per journey stage
What-if analysis shows the impact on perception and sales
Brand A has a taste problem – During meals perceptions of Brand A are negatively impacted (green bar). Also, while the general population is influenced by media advertisement (gray bar) at home, the most coveted segment (taste
sophisticates) are less influenced by media at home. Therefore, in-store programs (purple bar) have the greatest potential to impact taste sophisticates.
Concentric M™ Recommendation: Improve product experience and avoid promotions
-2.0 -1.0 0.0 1.0 2.0
Perception Change Index
-2.0 -1.0 0.0 1.0 2.0
Perception Change Index
General Population Taste Sophisticates
In Aisle
At Counter
At Home
During Meal Co
nsu
mer
Jo
urn
ey
Word-of-mouth Media Soup Experience In-store Marketing
22%
-35%
2% -5%
-35%
22%
-30%
Change in Perceptions of Brand A After Promotional Campaign
-3%
4%
3%
-1%
3%
Change in Sales After Promotional Campaign
A promotional campaign may improve price and package perceptions, but taste, health, and quality perceptions will decrease resulting in 3% less sales for Brand A.
Soup J
16 © Concentric, Inc. 2014. All rights reserved.
Develop Strategy
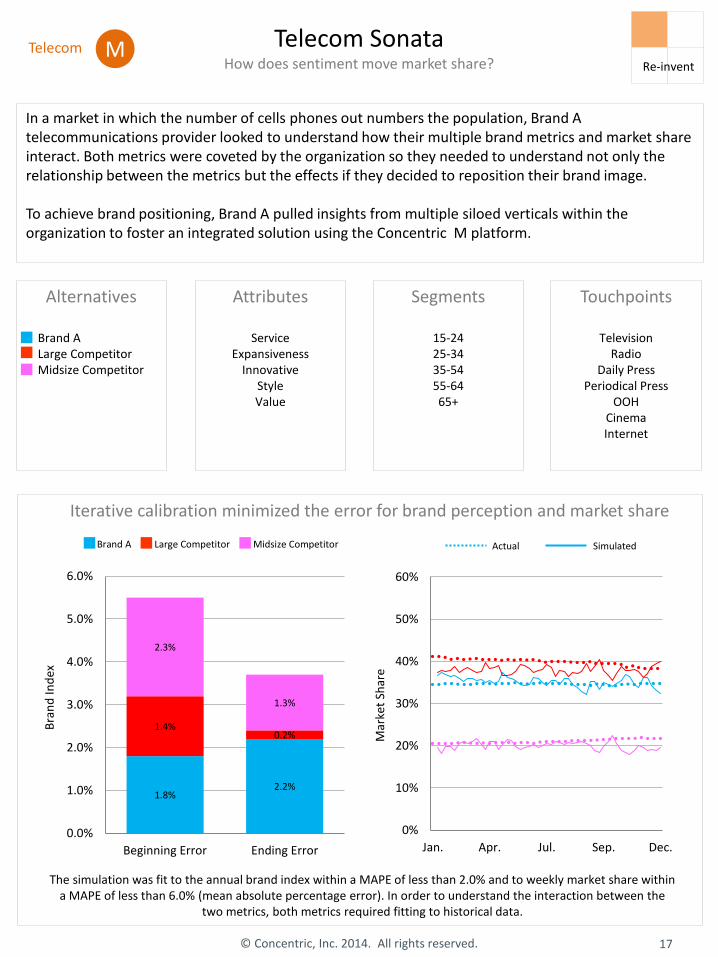
In a market in which the number of cells phones out numbers the population, Brand A telecommunications provider looked to understand how their multiple brand metrics and market share interact. Both metrics were coveted by the organization so they needed to understand not only the relationship between the metrics but the effects if they decided to reposition their brand image. To achieve brand positioning, Brand A pulled insights from multiple siloed verticals within the organization to foster an integrated solution using the Concentric M platform.
Alternatives
Brand A Large Competitor Midsize Competitor
Attributes
Service Expansiveness
Innovative Style Value
Segments
15-24 25-34 35-54 55-64 65+
Touchpoints
Television Radio
Daily Press Periodical Press
OOH Cinema Internet
Iterative calibration minimized the error for brand perception and market share
The simulation was fit to the annual brand index within a MAPE of less than 2.0% and to weekly market share within a MAPE of less than 6.0% (mean absolute percentage error). In order to understand the interaction between the
two metrics, both metrics required fitting to historical data.
17 © Concentric, Inc. 2014. All rights reserved.
Telecom Sonata How does sentiment move market share? Re-invent
Telecom M
0%
10%
20%
30%
40%
50%
60%
Jan. Apr. Jul. Sep. Dec.
Mar
ket
Shar
e
Actual Simulated
1.8% 2.2%
1.4% 0.2%
2.3%
1.3%
0.0%
1.0%
2.0%
3.0%
4.0%
5.0%
6.0%
Beginning Error Ending Error
Bra
nd
Ind
ex
Brand A Large Competitor Midsize Competitor
Different campaigns impact brand equity and market share differently
-1.1%
1.0%
0.6%
-0.5%
-0.8%
Market Share
-0.5%
0.9%
0.6%
-0.7%
-2.5%
Brand Index
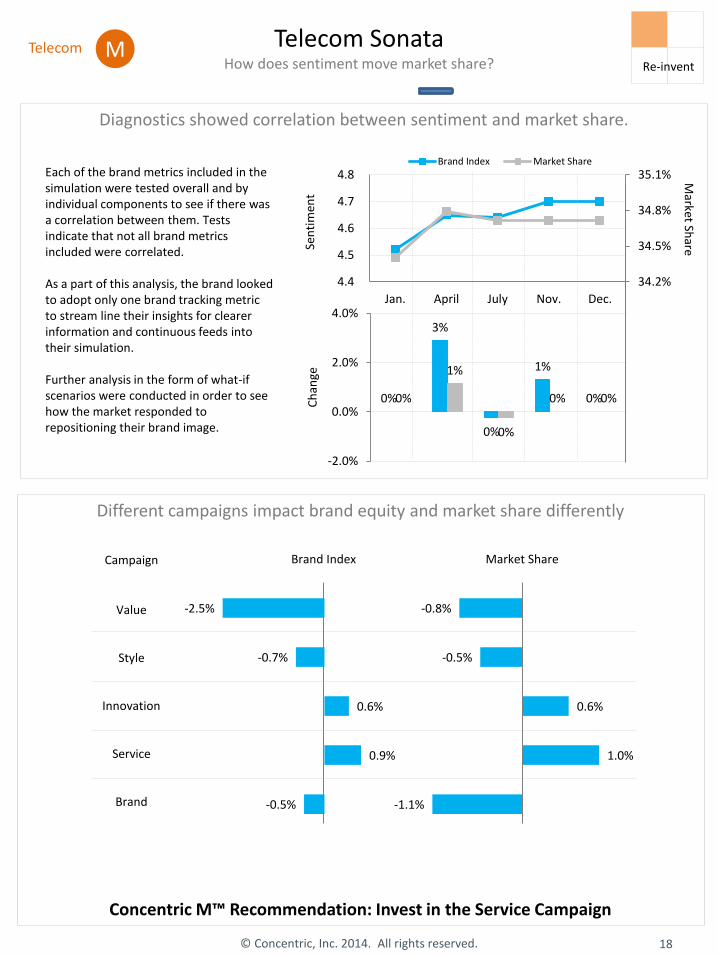
Diagnostics showed correlation between sentiment and market share.
Each of the brand metrics included in the simulation were tested overall and by individual components to see if there was a correlation between them. Tests indicate that not all brand metrics included were correlated. As a part of this analysis, the brand looked to adopt only one brand tracking metric to stream line their insights for clearer information and continuous feeds into their simulation. Further analysis in the form of what-if scenarios were conducted in order to see how the market responded to repositioning their brand image.
Concentric M™ Recommendation: Invest in the Service Campaign
18 © Concentric, Inc. 2014. All rights reserved.
Telecom Sonata How does sentiment move market share? Re-invent
Telecom M
34.2%
34.5%
34.8%
35.1%
4.4
4.5
4.6
4.7
4.8
Jan. April July Nov. Dec.
Brand Index Market Share
0%
3%
0%
1%
0% 0%
1%
0%
0% 0%
-2.0%
0.0%
2.0%
4.0%C
han
ge
Service
Innovation
Style
Value
Brand
Market Sh
are Se
nti
men
t
Campaign
1.5%
-2.4%
-2.5%
0.1%
-0.2%
2.5%
Error
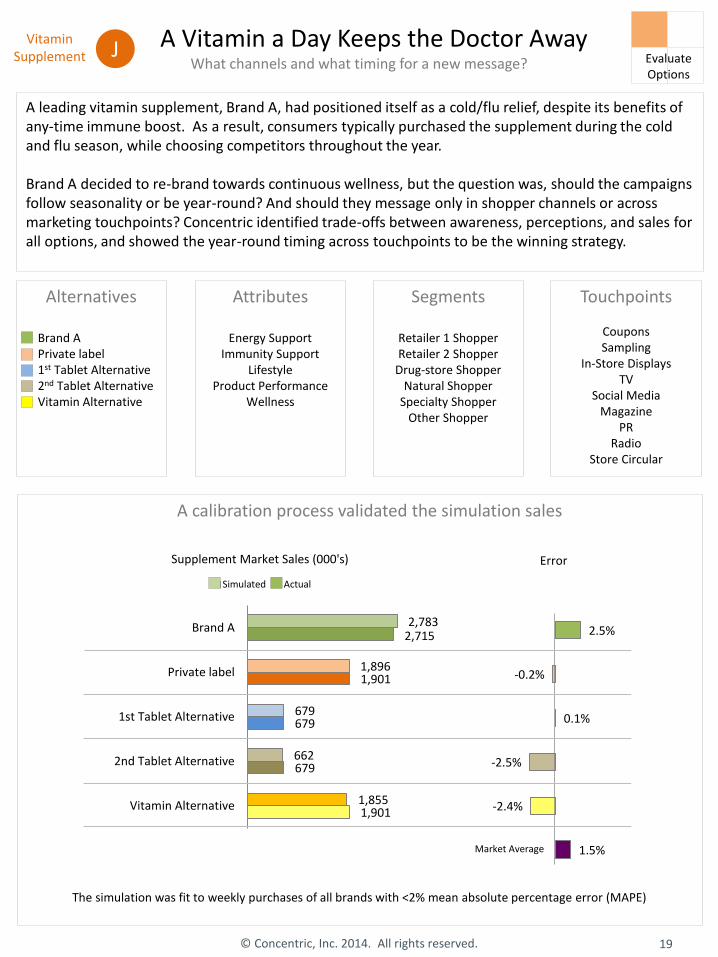
A Vitamin a Day Keeps the Doctor Away What channels and what timing for a new message?
A leading vitamin supplement, Brand A, had positioned itself as a cold/flu relief, despite its benefits of any-time immune boost. As a result, consumers typically purchased the supplement during the cold and flu season, while choosing competitors throughout the year. Brand A decided to re-brand towards continuous wellness, but the question was, should the campaigns follow seasonality or be year-round? And should they message only in shopper channels or across marketing touchpoints? Concentric identified trade-offs between awareness, perceptions, and sales for all options, and showed the year-round timing across touchpoints to be the winning strategy.
Alternatives
Brand A Private label 1st Tablet Alternative 2nd Tablet Alternative Vitamin Alternative
Attributes
Energy Support Immunity Support
Lifestyle Product Performance
Wellness
Segments
Retailer 1 Shopper Retailer 2 Shopper
Drug-store Shopper Natural Shopper
Specialty Shopper Other Shopper
Touchpoints
Coupons Sampling
In-Store Displays TV
Social Media Magazine
PR Radio
Store Circular
© Concentric, Inc. 2014. All rights reserved.
Vitamin Supplement J Evaluate
Options
A calibration process validated the simulation sales
The simulation was fit to weekly purchases of all brands with <2% mean absolute percentage error (MAPE)
1,901
679
679
1,901
2,715
1,855
662
679
1,896
2,783
Vitamin Alternative
2nd Tablet Alternative
1st Tablet Alternative
Private label
Brand A
Supplement Market Sales (000's)
Simulated Actual
Market Average
19
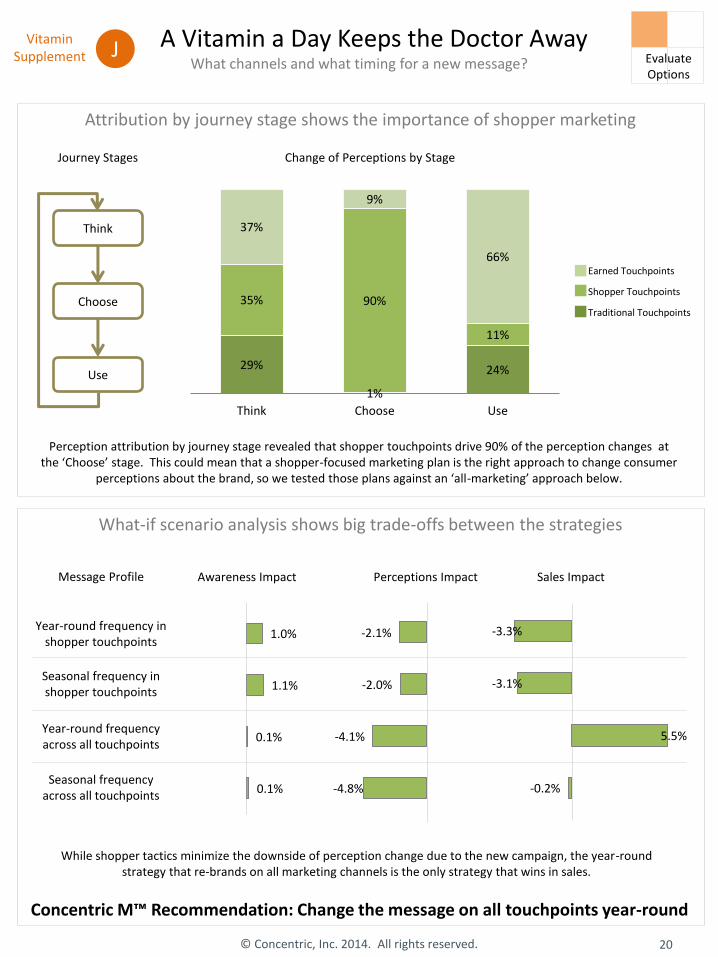
What-if scenario analysis shows big trade-offs between the strategies
Attribution by journey stage shows the importance of shopper marketing
Concentric M™ Recommendation: Change the message on all touchpoints year-round
Perception attribution by journey stage revealed that shopper touchpoints drive 90% of the perception changes at the ‘Choose’ stage. This could mean that a shopper-focused marketing plan is the right approach to change consumer
perceptions about the brand, so we tested those plans against an ‘all-marketing’ approach below.
20 © Concentric, Inc. 2014. All rights reserved.
A Vitamin a Day Keeps the Doctor Away What channels and what timing for a new message?
Vitamin Supplement Evaluate
Options
29%
1%
24%
35% 90%
11%
37%
9%
66%
Think Choose Use
Change of Perceptions by Stage
Earned Touchpoints
Shopper Touchpoints
Traditional Touchpoints
While shopper tactics minimize the downside of perception change due to the new campaign, the year-round strategy that re-brands on all marketing channels is the only strategy that wins in sales.
-0.2%
5.5%
-3.1%
-3.3% Year-round frequency in shopper touchpoints
Sales Impact
0.1%
0.1%
1.1%
1.0%
Awareness Impact
-4.8%
-4.1%
-2.0%
-2.1%
Perceptions Impact
Seasonal frequency in shopper touchpoints
Year-round frequency across all touchpoints
Seasonal frequency across all touchpoints
Message Profile
Journey Stages
Think
Choose
Use
J
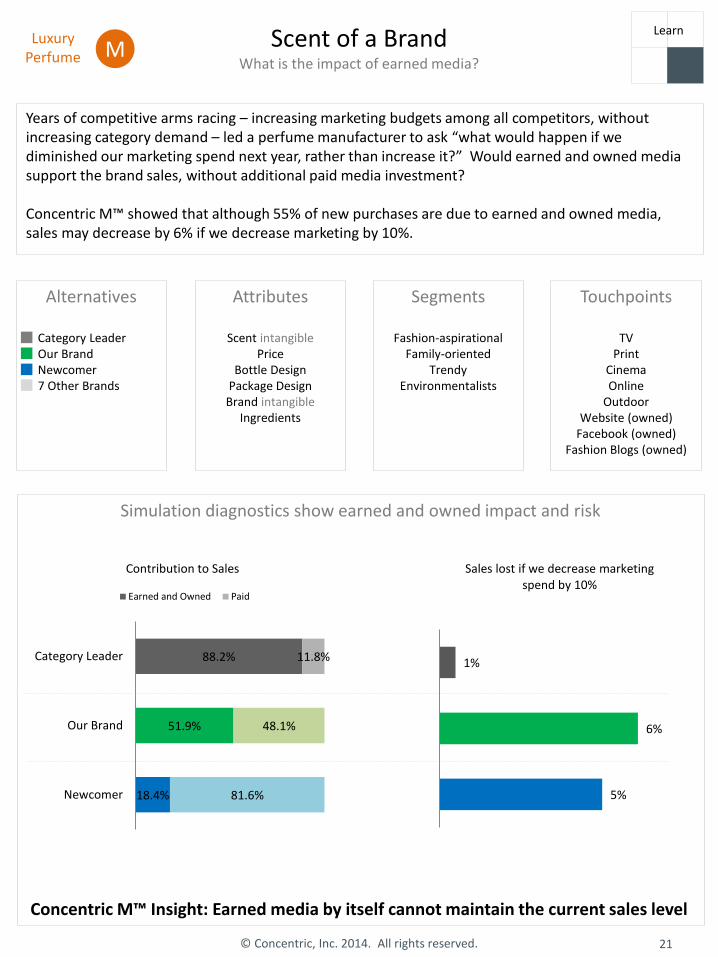
Scent of a Brand What is the impact of earned media?
Simulation diagnostics show earned and owned impact and risk
Concentric M™ Insight: Earned media by itself cannot maintain the current sales level
Luxury Perfume
Years of competitive arms racing – increasing marketing budgets among all competitors, without increasing category demand – led a perfume manufacturer to ask “what would happen if we diminished our marketing spend next year, rather than increase it?” Would earned and owned media support the brand sales, without additional paid media investment? Concentric M™ showed that although 55% of new purchases are due to earned and owned media, sales may decrease by 6% if we decrease marketing by 10%.
Alternatives
Category Leader Our Brand Newcomer 7 Other Brands
Attributes
Scent intangible Price
Bottle Design Package Design
Brand intangible Ingredients
Segments
Fashion-aspirational Family-oriented
Trendy Environmentalists
Touchpoints
TV Print
Cinema Online
Outdoor Website (owned)
Facebook (owned) Fashion Blogs (owned)
18.4%
51.9%
88.2%
81.6%
48.1%
11.8%
Newcomer
Our Brand
Category Leader
Contribution to Sales
Earned and Owned Paid
5%
6%
1%
Sales lost if we decrease marketing spend by 10%
M
21 © Concentric, Inc. 2014. All rights reserved.
Learn
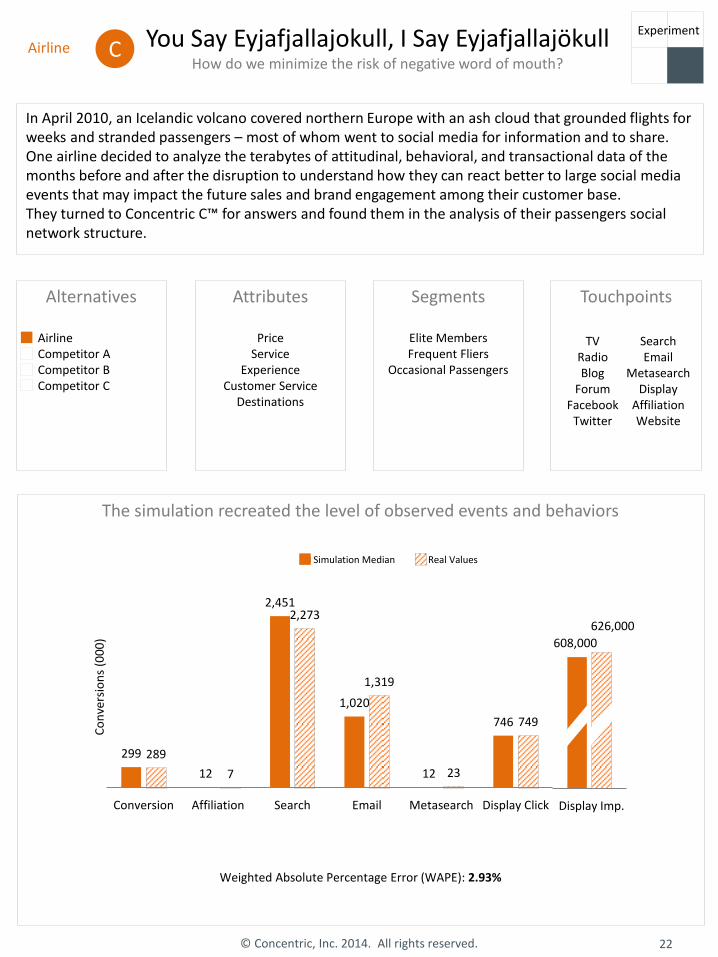
You Say Eyjafjallajokull, I Say Eyjafjallajökull How do we minimize the risk of negative word of mouth?
The simulation recreated the level of observed events and behaviors
Airline
In April 2010, an Icelandic volcano covered northern Europe with an ash cloud that grounded flights for weeks and stranded passengers – most of whom went to social media for information and to share. One airline decided to analyze the terabytes of attitudinal, behavioral, and transactional data of the months before and after the disruption to understand how they can react better to large social media events that may impact the future sales and brand engagement among their customer base. They turned to Concentric C™ for answers and found them in the analysis of their passengers social network structure.
Alternatives
Airline Competitor A Competitor B Competitor C
Attributes
Price Service
Experience Customer Service
Destinations
Segments
Elite Members Frequent Fliers
Occasional Passengers
Touchpoints
C
22 © Concentric, Inc. 2014. All rights reserved.
299
12
2,451
1,020
12
746
289
7
2,273
1,319
23
749
Conversion Affiliation Search Email Metasearch Display Click
Simulation Median Real Values
608,000
626,000
Co
nve
rsio
ns
(00
0)
Display Imp.
Weighted Absolute Percentage Error (WAPE): 2.93%
TV Radio Blog
Forum Facebook
Search Email
Metasearch Display
Affiliation Website
Experiment
You Say Eyjafjallajokull, I Say Eyjafjallajökull How do we minimize the risk of negative word of mouth?
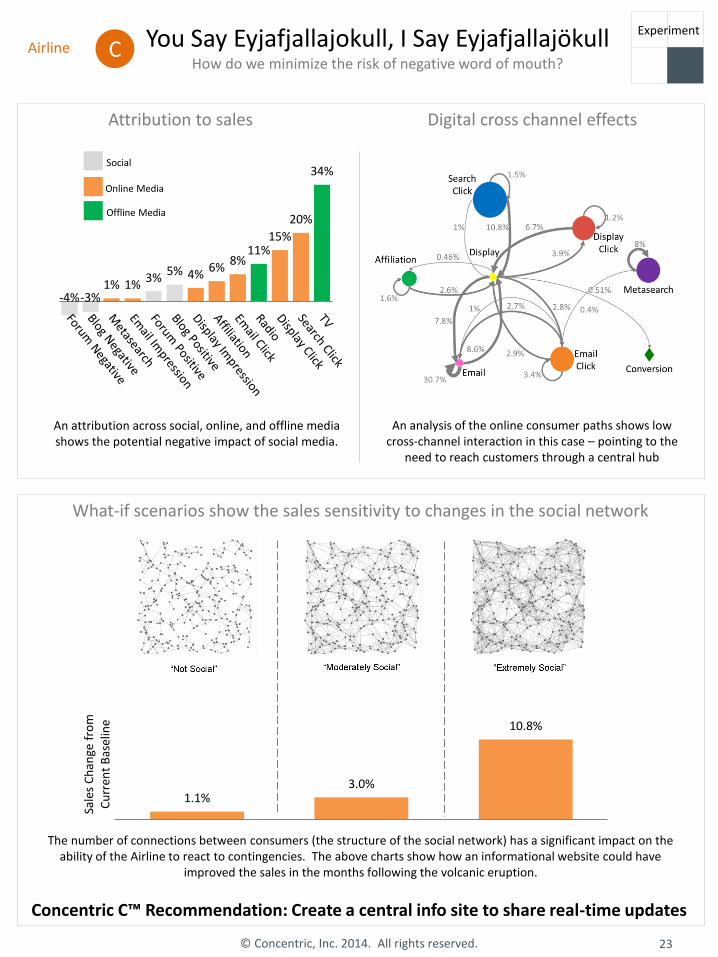
What-if scenarios show the sales sensitivity to changes in the social network
Concentric C™ Recommendation: Create a central info site to share real-time updates
The number of connections between consumers (the structure of the social network) has a significant impact on the ability of the Airline to react to contingencies. The above charts show how an informational website could have
improved the sales in the months following the volcanic eruption.
23 © Concentric, Inc. 2014. All rights reserved.
-4% -3% 1% 1%
3% 5% 4%
6% 8%
11% 15%
20%
34% Social
Online Media
Offline Media
An attribution across social, online, and offline media shows the potential negative impact of social media.
Attribution to sales Digital cross channel effects
An analysis of the online consumer paths shows low cross-channel interaction in this case – pointing to the
need to reach customers through a central hub
1.1% 3.0%
10.8%
Sale
s C
han
ge f
rom
C
urr
ent
Bas
elin
e
Airline C Experiment
-12
13
31 33
11
41
-18
11 5
24
43
6
26
-6 -18
13
3
74
5
-5
31 32 26
7 5
-20
-10
0
10
20
30
40
50
60
70
80
Ind
ex o
f P
erce
pti
on
Ch
ange
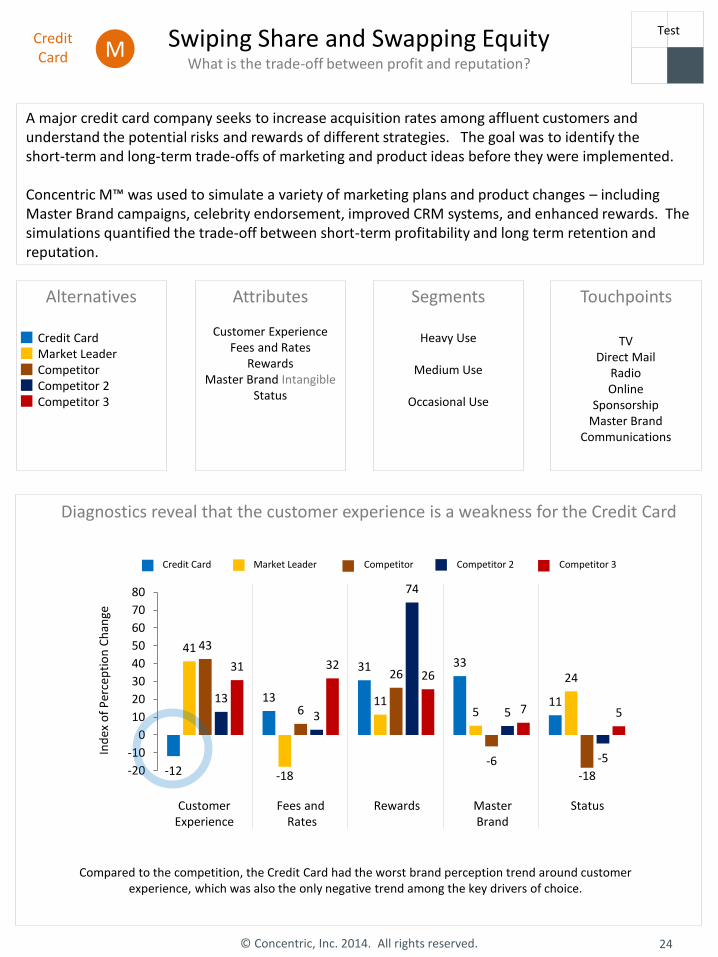
Swiping Share and Swapping Equity What is the trade-off between profit and reputation?
A major credit card company seeks to increase acquisition rates among affluent customers and understand the potential risks and rewards of different strategies. The goal was to identify the short-term and long-term trade-offs of marketing and product ideas before they were implemented. Concentric M™ was used to simulate a variety of marketing plans and product changes – including Master Brand campaigns, celebrity endorsement, improved CRM systems, and enhanced rewards. The simulations quantified the trade-off between short-term profitability and long term retention and reputation.
Alternatives
Credit Card Market Leader Competitor Competitor 2 Competitor 3
Attributes
Customer Experience Fees and Rates
Rewards Master Brand Intangible
Status
Segments
Heavy Use
Medium Use
Occasional Use
Touchpoints
Diagnostics reveal that the customer experience is a weakness for the Credit Card
Credit Card M
TV Direct Mail
Radio Online
Sponsorship Master Brand
Communications
24 © Concentric, Inc. 2014. All rights reserved.
Drive Efficiency
Test
Customer Experience
Fees and Rates
Rewards Master Brand
Status
Competitor 2 Credit Card Market Leader Competitor Competitor 3
Compared to the competition, the Credit Card had the worst brand perception trend around customer experience, which was also the only negative trend among the key drivers of choice.
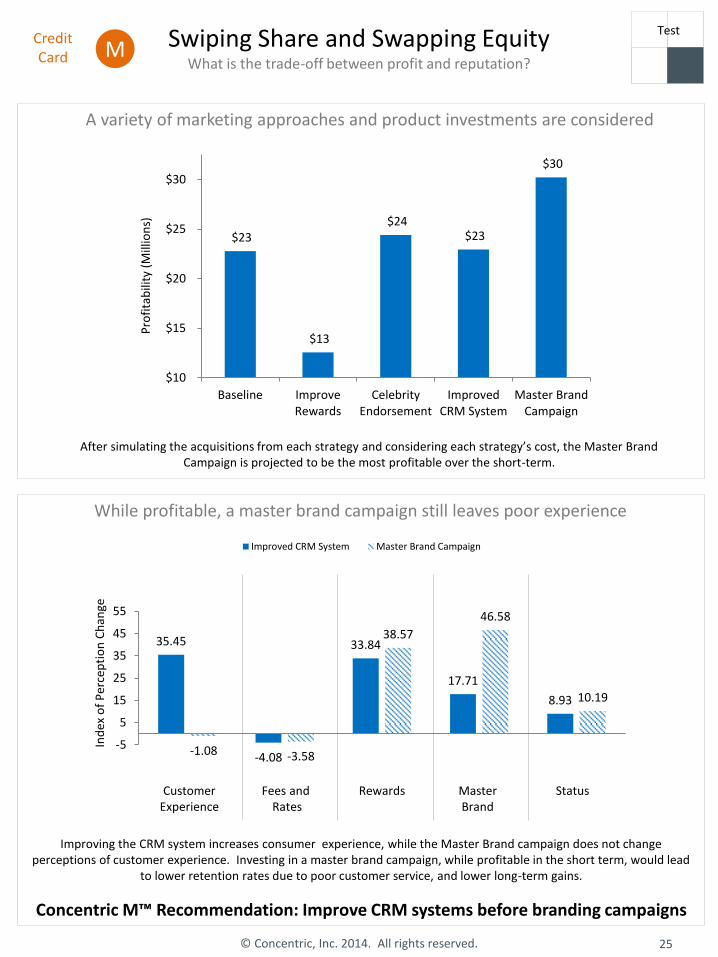
Swiping Share and Swapping Equity What is the trade-off between profit and reputation?
While profitable, a master brand campaign still leaves poor experience
Concentric M™ Recommendation: Improve CRM systems before branding campaigns
25 © Concentric, Inc. 2014. All rights reserved.
Credit Card M
Drive Efficiency
A variety of marketing approaches and product investments are considered
Test
$23
$13
$24 $23
$30
$10
$15
$20
$25
$30
Baseline ImproveRewards
CelebrityEndorsement
ImprovedCRM System
Master BrandCampaign
Pro
fita
bili
ty (
Mill
ion
s)
After simulating the acquisitions from each strategy and considering each strategy’s cost, the Master Brand Campaign is projected to be the most profitable over the short-term.
35.45
-4.08
33.84
17.71
8.93
-1.08 -3.58
38.57
46.58
10.19
-5
5
15
25
35
45
55
Ind
ex o
f P
erce
pti
on
Ch
ange
Improved CRM System Master Brand Campaign
Improving the CRM system increases consumer experience, while the Master Brand campaign does not change perceptions of customer experience. Investing in a master brand campaign, while profitable in the short term, would lead
to lower retention rates due to poor customer service, and lower long-term gains.
Customer Experience
Fees and Rates
Rewards Master Brand
Status
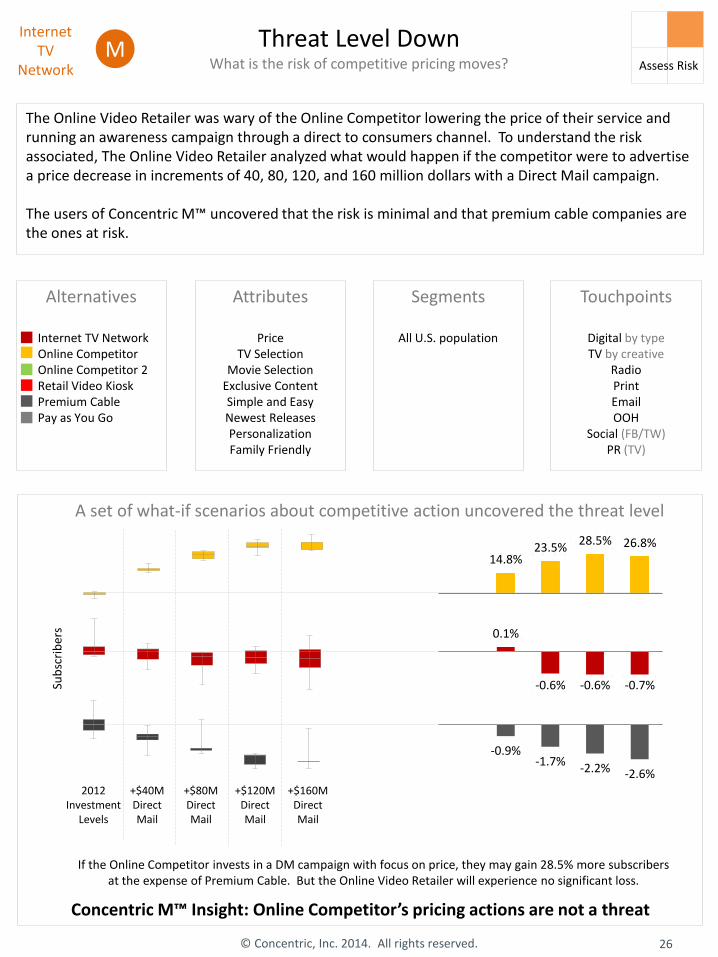
Threat Level Down What is the risk of competitive pricing moves?
The Online Video Retailer was wary of the Online Competitor lowering the price of their service and running an awareness campaign through a direct to consumers channel. To understand the risk associated, The Online Video Retailer analyzed what would happen if the competitor were to advertise a price decrease in increments of 40, 80, 120, and 160 million dollars with a Direct Mail campaign. The users of Concentric M™ uncovered that the risk is minimal and that premium cable companies are the ones at risk.
Alternatives
Internet TV Network Online Competitor Online Competitor 2 Retail Video Kiosk Premium Cable Pay as You Go
Attributes
Price TV Selection
Movie Selection Exclusive Content Simple and Easy Newest Releases Personalization Family Friendly
Segments
All U.S. population
Touchpoints
Digital by type TV by creative
Radio Print Email OOH
Social (FB/TW) PR (TV)
A set of what-if scenarios about competitive action uncovered the threat level
Sub
scri
ber
s 0.1%
-0.6% -0.6% -0.7%
-0.9% -1.7%
-2.2% -2.6%
14.8% 23.5%
28.5% 26.8%
2012 Investment
Levels
Concentric M™ Insight: Online Competitor’s pricing actions are not a threat
+$40M Direct Mail
+$80M Direct Mail
+$120M Direct Mail
+$160M Direct Mail
If the Online Competitor invests in a DM campaign with focus on price, they may gain 28.5% more subscribers at the expense of Premium Cable. But the Online Video Retailer will experience no significant loss.
M
26 © Concentric, Inc. 2014. All rights reserved.
Assess Risk
Internet TV
Network
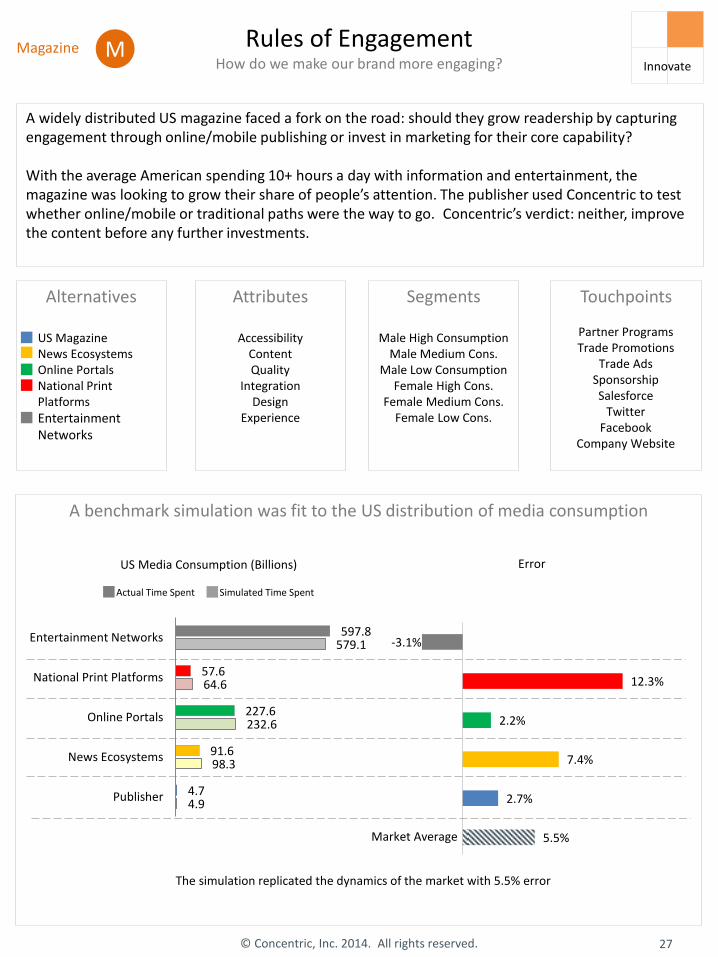
Rules of Engagement How do we make our brand more engaging?
A widely distributed US magazine faced a fork on the road: should they grow readership by capturing engagement through online/mobile publishing or invest in marketing for their core capability? With the average American spending 10+ hours a day with information and entertainment, the magazine was looking to grow their share of people’s attention. The publisher used Concentric to test whether online/mobile or traditional paths were the way to go. Concentric’s verdict: neither, improve the content before any further investments.
Alternatives
US Magazine News Ecosystems Online Portals National Print Platforms
Entertainment Networks
Attributes
Accessibility Content Quality
Integration Design
Experience
Segments
Male High Consumption Male Medium Cons.
Male Low Consumption Female High Cons.
Female Medium Cons. Female Low Cons.
Touchpoints
A benchmark simulation was fit to the US distribution of media consumption
The simulation replicated the dynamics of the market with 5.5% error
Magazine M
Partner Programs Trade Promotions
Trade Ads Sponsorship Salesforce
Twitter Facebook
Company Website
Market Average
27 © Concentric, Inc. 2014. All rights reserved.
Innovate
4.9
98.3
232.6
64.6
579.1
4.7
91.6
227.6
57.6
597.8
Publisher
News Ecosystems
Online Portals
National Print Platforms
Entertainment Networks
US Media Consumption (Billions)
Actual Time Spent Simulated Time Spent
5.5%
2.7%
7.4%
2.2%
12.3%
-3.1%
Error
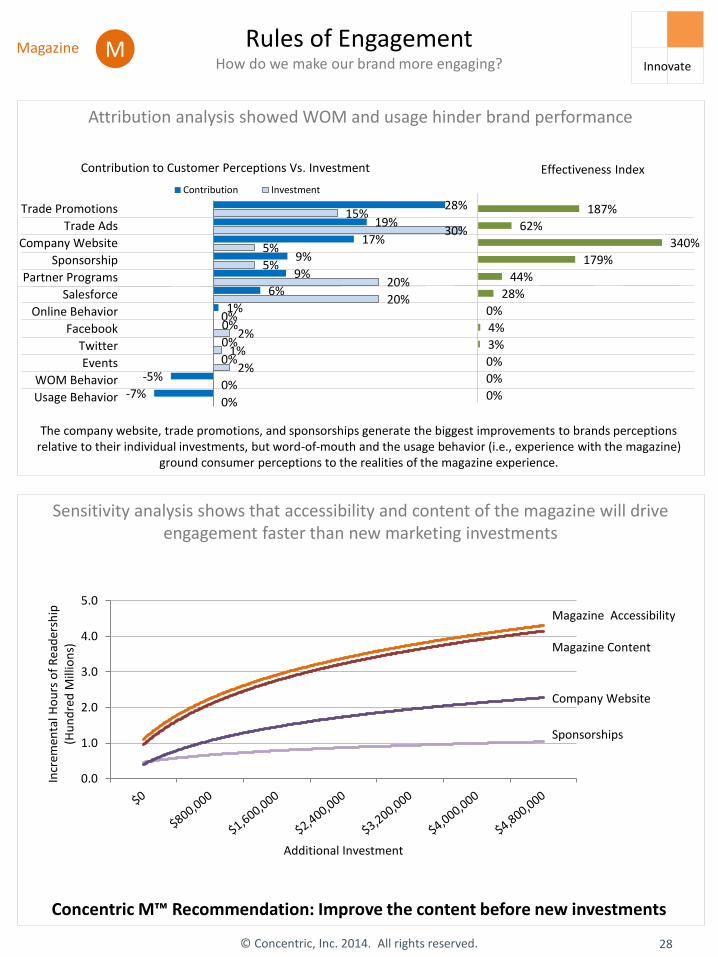
Attribution analysis showed WOM and usage hinder brand performance
0%
0%
2%
1%
2%
0%
20%
20%
5%
5%
30%
15%
-7%
-5%
0%
0%
0%
1%
6%
9%
9%
17%
19%
28%
Usage Behavior
WOM Behavior
Events
Online Behavior
Salesforce
Partner Programs
Sponsorship
Company Website
Trade Ads
Trade Promotions
Contribution to Customer Perceptions Vs. Investment
Contribution Investment
Sensitivity analysis shows that accessibility and content of the magazine will drive engagement faster than new marketing investments
Concentric M™ Recommendation: Improve the content before new investments
The company website, trade promotions, and sponsorships generate the biggest improvements to brands perceptions relative to their individual investments, but word-of-mouth and the usage behavior (i.e., experience with the magazine)
ground consumer perceptions to the realities of the magazine experience.
28 © Concentric, Inc. 2014. All rights reserved.
0.0
1.0
2.0
3.0
4.0
5.0
Incr
emen
tal H
ou
rs o
f R
ead
ersh
ip
(Hu
nd
red
Mill
ion
s)
Additional Investment
Magazine Accessibility
Magazine Content
Company Website
Sponsorships
0%
0%
0%
3%
4%
0%
28%
44%
179%
340%
62%
187%
Effectiveness Index
Rules of Engagement How do we make our brand more engaging?
M Magazine Innovate
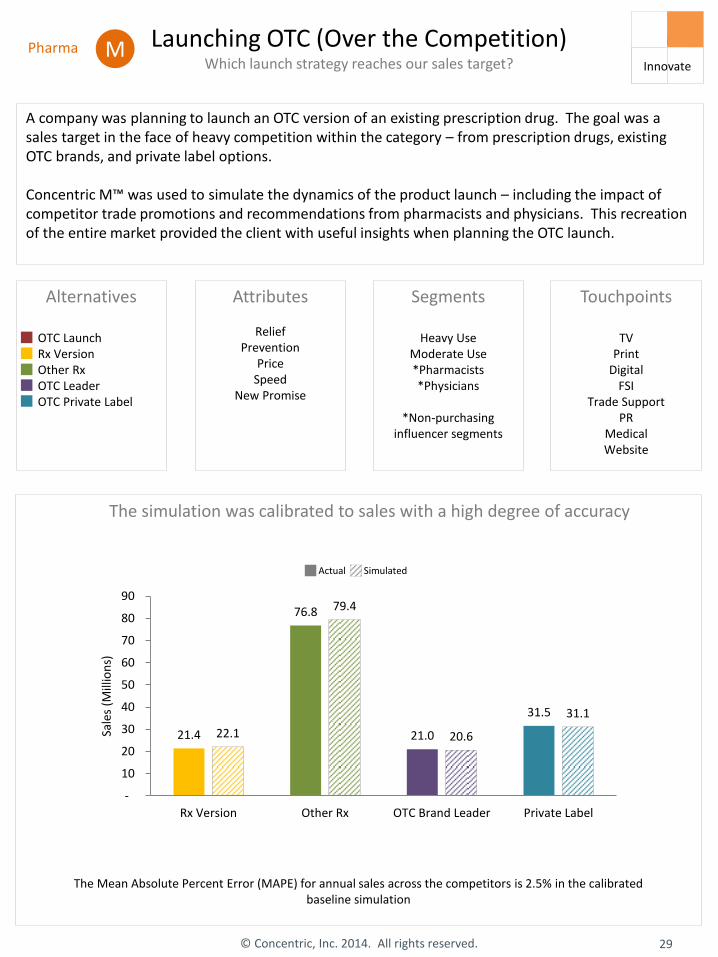
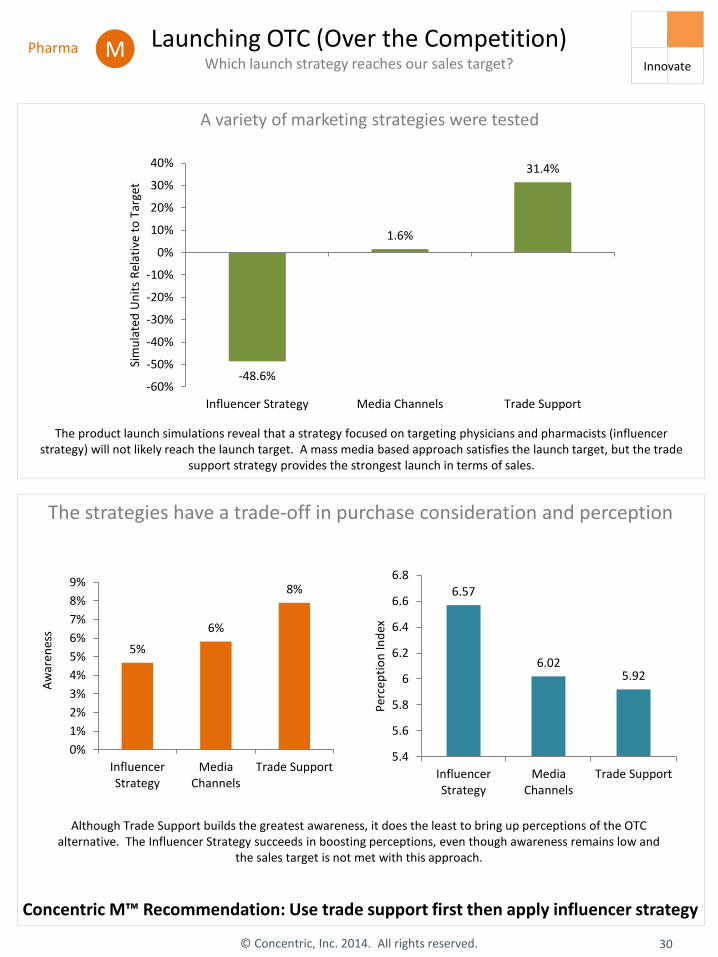
Launching OTC (Over the Competition) Which launch strategy reaches our sales target?
A company was planning to launch an OTC version of an existing prescription drug. The goal was a sales target in the face of heavy competition within the category – from prescription drugs, existing OTC brands, and private label options. Concentric M™ was used to simulate the dynamics of the product launch – including the impact of competitor trade promotions and recommendations from pharmacists and physicians. This recreation of the entire market provided the client with useful insights when planning the OTC launch.
Alternatives
OTC Launch Rx Version Other Rx OTC Leader OTC Private Label
Attributes
Relief Prevention
Price Speed
New Promise
Segments
Heavy Use Moderate Use *Pharmacists *Physicians
*Non-purchasing
influencer segments
Touchpoints
TV Print
Digital FSI
Trade Support PR
Medical Website
The simulation was calibrated to sales with a high degree of accuracy
Pharma M
29 © Concentric, Inc. 2014. All rights reserved.
Drive Efficiency
The Mean Absolute Percent Error (MAPE) for annual sales across the competitors is 2.5% in the calibrated baseline simulation
21.4
76.8
21.0
31.5
22.1
79.4
20.6
31.1
-
10
20
30
40
50
60
70
80
90
Rx Version Other Rx OTC Brand Leader Private Label
Sale
s (M
illio
ns)
Actual Simulated
Innovate
Launching OTC (Over the Competition) Which launch strategy reaches our sales target?
The strategies have a trade-off in purchase consideration and perception
Concentric M™ Recommendation: Use trade support first then apply influencer strategy
30 © Concentric, Inc. 2014. All rights reserved.
Pharma M Drive
Efficiency
A variety of marketing strategies were tested
The product launch simulations reveal that a strategy focused on targeting physicians and pharmacists (influencer strategy) will not likely reach the launch target. A mass media based approach satisfies the launch target, but the trade
support strategy provides the strongest launch in terms of sales.
Although Trade Support builds the greatest awareness, it does the least to bring up perceptions of the OTC alternative. The Influencer Strategy succeeds in boosting perceptions, even though awareness remains low and
the sales target is not met with this approach.
-48.6%
1.6%
31.4%
-60%
-50%
-40%
-30%
-20%
-10%
0%
10%
20%
30%
40%
Influencer Strategy Media Channels Trade Support
Sim
ula
ted
Un
its
Rel
ativ
e to
Tar
get
5%
6%
8%
0%
1%
2%
3%
4%
5%
6%
7%
8%
9%
InfluencerStrategy
MediaChannels
Trade Support
Aw
aren
ess
6.57
6.02 5.92
5.4
5.6
5.8
6
6.2
6.4
6.6
6.8
InfluencerStrategy
MediaChannels
Trade Support
Per
cep
tio
n In
dex
Innovate
© Concentric, Inc. 2014. All rights reserved.
Simulate Your Market
Visit or call any time!
222 3rd Street, Suite 0142
Cambridge, MA 02142 USA
617-674-5678
www.concentricabm.com