market potential, increasing returns, and geographic...
TRANSCRIPT
RESEARCH SEMINAR IN INTERNATIONAL ECONOMICS
School of Public PolicyThe University of Michigan
Ann Arbor, Michigan 48109-1220
Discussion Paper No. 439
Market Potential, Increasing Returns,and Geographic Concentration
(Figures are in separate file.)
Gordon H. HansonUniversity of Michigan and NBER
May, 1999
Recent RSIE Discussion Papers are available on the World Wide Web at:http://www.spp.umich.edu/rsie/workingpapers/wp.html

Market Potential, Increasing Returns, and Geographic Concentration
Gordon H. Hanson
Department of Economics and School of Business AdministrationUniversity of Michigan
and NBER
May 1999
Abstract. In this paper, I examine the spatial correlation of wages, employment, and consumerpurchasing power across U.S. counties to see whether regional product-market linkages contributeto spatial agglomeration. First, I estimate a simple market-potential function, which is a reducedform for several economic geography models. This specification resembles a spatial labordemand function, as it is proximity to consumer markets that determines nominal wages andemployment in a given location. The estimation results indicate how far demand linkages extendacross space and how income shocks in one location affect other locations. Second, I estimatea more elaborate market-potential function derived from the Krugman model of economicgeography. The parameter estimates reflect the importance of scale economies and transportcosts, the stability of spatial agglomeration patterns, and how these features evolve over time.
I thank Steve Bronars, Keith Head, Wolfgang Keller, Gerald Oettinger, Diego Puga, ShinichiSakata, Dan Trefler, David Weinstein, and seminar participants at the CEPR, NBER, theUniversity of Michigan, NYU, Princeton, and the University of Texas for helpful comments andthe National Science Foundation for financial support under grant SBR-9617578. Shu-yi Tsai,Keenan Dworak-Fisher, and Zeeshan Ali provided excellent research assistance.
Most of the United States produces very little, while very little of the United States
produces quite a lot. In 1990, the 2,000 least economically-active U.S. counties, which had an
average employment density of 4.0 workers per square kilometer, accounted for 75.8% of U.S.
land area but only 11.7% of U.S. employment. In contrast, the 100 most economically-active
U.S. counties, with an average employment density of 1,169 workers per square kilometer,
accounted for 41.2% of U.S. employment but only 1.5% of U.S. land area.
In this paper, I examine the spatial distribution of economic activity in the United States
to see what it reveals about the strength of product-market linkages between regions. The starting
point for the exercise is the idea that the level of economic activity in a location is conditioned
by that location's access to markets for its goods. While this view may seem narrow -- it ignores
climate, natural resource supplies, and other factors which surely influence city location -- I
attempt to show that market access provides a useful way to characterize the forces that
contribute to the geographic concentration of economic activity.
There is a large theoretical literature on the spatial organization of the economy.
Krugman (1991) explains city formation through the interaction of transport costs and firm-level
increasing returns to scale, building on earlier work by Henderson (1974), Papageorgiou and
Thisse (1985), and Fujita (1988). 1 In the Krugman model, scale economies and transport costs
create demand linkages between regions that contribute to spatial agglomeration. Cities exist,
in effect, to provide a large local market for firms. This idea is related to Harris' (1954) market-
potential function, which states that the demand for goods produced in a location is the sum of
1 Rivera-Batiz (1988) also develops a model of city formation based on increasing returns. Venables(1996) extends the Krugman model of spatial agglomeration to open economies; Puga (1998) gives ageneralization for this class of models. See Fujita and Thisse (1996) and Ottaviano and Puga (1997) for surveysof the literature.
1
the purchasing power in all other locations, weighted by transport costs. The market-potential
function has been used extensively in urban economics (e.g., Clark et al. 1969, Dicken and Lloyd
1977, Keeble et al. 1982), though usually without reference to formal theory or attempts to see
whether assumed functional forms fit actual data. Recent literature (Krugman 1992; Fujita and
Krugman 1995) reinvigorates the market-potential concept by showing that market-potential
functions can be derived from formal spatial models.
To assess the importance of market access, I examine the spatial correlation of wages,
employment, and consumer purchasing power across U.S. counties from 1970 to 1990. First, I
estimate Harris' market-potential function, which can be seen as a reduced form for a wide class
of economic geography models. The specification resembles a spatial labor demand function, as
it is proximity to markets that determines nominal wages and employment in a given location.
The estimation results indicate how far demand linkages extend across space and how income
shocks in one location affect other locations. Second, I estimate a more elaborate market-
potential function derived from the Krugman (1991) model. The parameter estimates reflect the
importance of scale economies and transport costs, the stability of spatial agglomeration patterns,
and how these features evolve over time. Despite the influence of the Krugman model in
international and urban economics, it has been subjected to little empirical work. This is the first
study, to my knowledge, that applies equilibrium conditions from the model to data. 2
A further contribution of the paper is to add an explicit spatial component to the empirical
2 In related work, Hanson (1997) examines the correlation between wages and proximity to large urbanareas in Mexico, and Davis and Weinstein (1998) find that for Japan regional specialization in production ispositively correlated with regional specialization in absorption, as consistent with Krugman (1980).
2

analysis of agglomeration. 3 Recent literature in this area tends to treat regions as small open
economies, whose trade in goods and factors with surrounding regions is unspecified. Economic
activity in one location is typically correlated with pre-existing conditions in that location,
without reference to conditions at other points in space. I use the market-potential concept as
a basis for identifying spatial interactions between regional economies.
Empirical literature on agglomeration tends to consider motivations for geographic
concentration apart from the regional product-market linkages that are the subject of recent
theory. One possibility is that consumers and firms are drawn to regions that possess exogenous
amenities, such as pleasant weather or natural geography (Rosen 1979, Roback 1982). Roback
(1982), Beeson and Eberts (1989), and Gyourko and Tracy (1991) estimate the economic value
of such amenities in cities. A second possibility is that human capital accumulation by one
individual raises the productivity of her neighbors, making densely concentrated regions attractive
places to work (Lucas 1988, Black and Henderson 1998a). Rauch (1993), Glaeser and Mare
(1994), and Peri (1998) find that wages are higher in cities with higher average education levels.
A third possibility is that localized technological spillovers between firms contribute to the
geographic concentration of industry (Glaeser et al. 1992, Jaffe, Trajtenberg, and Henderson 1993,
Henderson, Kuncoro, and Turner 1995, Ciccone and Hall 1996). 4
To control for how these additional factors contribute to spatial agglomeration, I compare
results using two measures of local wages, which is the dependent variable in most specifications:
3 Other empirical papers on spatial interactions, which use quite different approaches from mine, includeQuah (1996), Eaton and Eckstein (1997), Black and Henderson (1998b), and Dobkins and Ioannides (1998).
4 Related papers include Topel (1986) and Blanchard and Katz (1992) on regional labor markets. See alsoEaton and Dekle (1994) and Justman (1994).
3

average earnings for all workers in a location and the same series adjusted for variation in human
capital and exogenous amenities across locations. As this approach may not control for all
factors behind geographic concentration, I address issues of interpretation in the text.
In the first section of the paper, I describe the data. In the second section, I discuss model
specification and estimation strategy. In the third section, I present estimation results. In the
fourth section, I discuss the results and offer concluding remarks.
I. Empirical Setting
A. Data Sources
I take counties in the continental United States as the geographic unit of analysis. Much
of the empirical literature on regional wages and employment uses data on cities, which selects
information from spikes in the spatial distribution only, or U.S. states, which ignores intra-state
variation in the distribution of production. By using county-level data, I am able to characterize
the spatial distribution of wages and employment in more detail.
The data required are wages, employment, income, and the housing stock. County-level
data on annual labor compensation and annual employment are available from the Regional
Economic Information System, which the U.S. Bureau of Economic Analysis (BEA) compiles
using data from state unemployment-insurance records and other sources. The BEA tabulates
both earnings and employment on a place of work basis. I use earnings and employment data
for wage and salary workers. Data at higher levels of aggregation include the self-employed,
whose earnings are sensitive to local business cycles and industry composition; data for individual
industries are unavailable for many counties due to disclosure restrictions or zero production.
4

I measure income by total personal income, which is total income received by households and
noncorporate businesses. This is the best measure of aggregate consumer purchasing power
available at the county level. I measure the housing stock as total housing units, from the U.S.
Census of Population and Housing. The time period is the three most recent census years, 1970,
1980, and 1990. Table 1 gives summary statistics on the variables.
How I measure wages merits some discussion. I calculate wages in a county as annual
average labor earnings per worker for wage and salary workers. As this measure may be
sensitive to the distribution of human capital and other factors across locations, I construct a
second wage measure by regressing log average earnings for wage and salary workers in a county
on four sets of variables: the shares of the working age population in a county by gender, age,
and educational attainment categories; and indicators of exogenous amenities available in the
county.5 I use the residuals from this regression, which I perform using data from 1980 and
1990, to measure wages adjusted for human capital and exogenous amenities. The specification
of county wages approximates a standard hedonic individual log earnings regression (Rosen
1974), in which one first transforms the variables into means over all workers within each
county.6 By regressing average county wages on average county education, the specification
5 The age categories are ten-year groupings and the educational attainment categories are high schooldropout, high school graduate, some college, and college graduate. These data are from the USA Counties 1996CD ROM, which compiles demographic data on counties from the 1980 and 1990 U.S. Census of Populationand Housing. As similar data have not been compiled for 1970, I have not constructed an adjusted wage seriesfor that year. Following previous literature (Roback 1982, Gyourko and Tracy 1991), the measures ofexogenous amenities I use are heating degree days, cooling degree days, average possible sunshine, averagewind speed, average relative humidity, average precipitation, whether the county borders the sea coast, whetherthe county borders a great lake, and territorial water area in the county. Since few climate measures are readilyavailable at the county level, I use data for the nearest major airport to a county (U.S. Department of Commerce1996).
6 The approximation is not exact, of course, since I use the log of average earnings, rather than the averageof log earnings, as the dependent variable.
5
captures the impact of both individual education and average county education on wages, which
implicitly controls for human capital externalities across workers within a county (Rauch 1993). 7
B. The Spatial Distribution of Employment and Wages
In this section, I present data on wages and employment in U.S. counties. Wages are
average annual earnings per worker, unadjusted for human capital or exogenous amenities; figures
for adjusted wages are similar. Employment is average annual employment per square kilometer.
All variables are expressed relative to weighted averages for the continental United States.
Figure 1 shows the relative employment density of wage and salary workers for U.S.
counties in 1990. Darker colors represent larger numerical values. Blackened counties are spikes
in the spatial distribution, which, unsurprisingly, are in major cities, such as Chicago, New York,
etc. Employment centers are concentrated in and around northeastern and midwestern cities and
virtually absent in the region extending longitudinally from central Texas to eastern California.
Employment densities in the most urbanized counties, which account for 5.4% of all counties,
range from 6 times the U.S. average to 2,237 times the U.S. average. Surrounding major cities
are regions with moderate employment densities, from 1.5 to 6 times the U.S. average. A large
mass of counties have very low employment densities, from 0.02 to 0.6 times the U.S. average.
These counties, which account for 67.3% of all counties, are mostly in farm and mountain states.
That employment density declines as one moves away from large consumption masses is
consistent with the idea that market access influences industry location.
7 Since the spatial extent of human capital externalities may be wider than a single county, I performed asecond set of county wage regressions, in which I included educational attainment at the state level as additionalregressors. Using adjusted wages from these regressions has little effect on the results reported in Tables 2-5.
6

Figure 2 shows the log change in county employment relative to the log change in U.S.
employment for 1970-1990. Since 1970, there has been a sizable shift in employment from the
northeast and midwest to the southeast and west, as discussed in Blanchard and Katz (1992).
Interestingly, employment change in both high and low-growth regions is far from uniform. For
instance, east and south Texas have high relative growth, but west and north Texas show relative
declines, and while most counties in plains states have low relative growth, the Twin Cities
region has high relative growth. As employment relocates to the south and west, it appears to
concentrate in certain pockets, leaving other areas untouched.
Figure 3 shows county average wages relative to U.S. average wages for wage and salary
workers in 1990. Wages are relatively high near areas of densely concentrated economic activity,
such as the Boston-Washington, D.C. corridor and the major cities on the Great Lakes. Forces
other than proximity to large markets also appear to contribute to spatial wage differences.
Wages are relatively high in several relatively unpopulated regions, such as central Nevada,
western Utah, and the Gulf Coast of Louisiana and Texas. Each of these regions specializes in
a single activity -- mining in Utah, tourism (gambling) in Nevada, and petroleum refining along
the Gulf Coast -- that requires an immobile resource. Concentrated pockets of specialized
production suggest that idiosyncratic factors, including climate, natural-resource supplies, and
local regulations, also influence the spatial distribution of wages.
Figure 4 shows the log change in county wages relative to the log change in U.S. wages
between 1970 and 1990. Counties with high relative-wage growth are overwhelmingly
concentrated in the southeast. Most counties in the northern midwest and the northeast, with the
exception of the Atlantic seaboard, have relative-wage declines. Comparing Figures 2 and 4, the
7
geographic expanse of relative-wage growth in the southeast appears to be larger than the
geographic expanse of relative-employment growth in the region, suggesting that employment
growth in high-activity counties puts upward pressure on wages in neighboring counties.
II. Theory
A. The Krugman Model
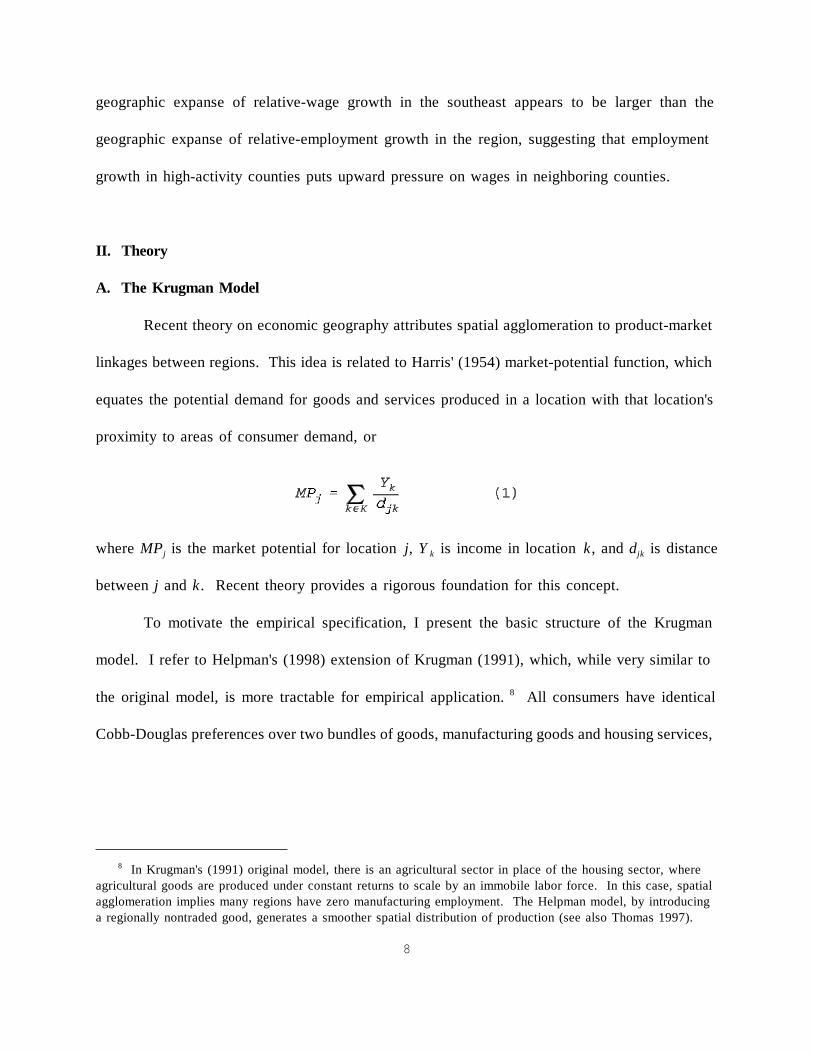
Recent theory on economic geography attributes spatial agglomeration to product-market
linkages between regions. This idea is related to Harris' (1954) market-potential function, which
equates the potential demand for goods and services produced in a location with that location's
proximity to areas of consumer demand, or
where MPj is the market potential for location j, Y k is income in location k, and djk is distance
between j and k. Recent theory provides a rigorous foundation for this concept.
To motivate the empirical specification, I present the basic structure of the Krugman
model. I refer to Helpman's (1998) extension of Krugman (1991), which, while very similar to
the original model, is more tractable for empirical application. 8 All consumers have identical
Cobb-Douglas preferences over two bundles of goods, manufacturing goods and housing services,
8 In Krugman's (1991) original model, there is an agricultural sector in place of the housing sector, whereagricultural goods are produced under constant returns to scale by an immobile labor force. In this case, spatialagglomeration implies many regions have zero manufacturing employment. The Helpman model, by introducinga regionally nontraded good, generates a smoother spatial distribution of production (see also Thomas 1997).
8
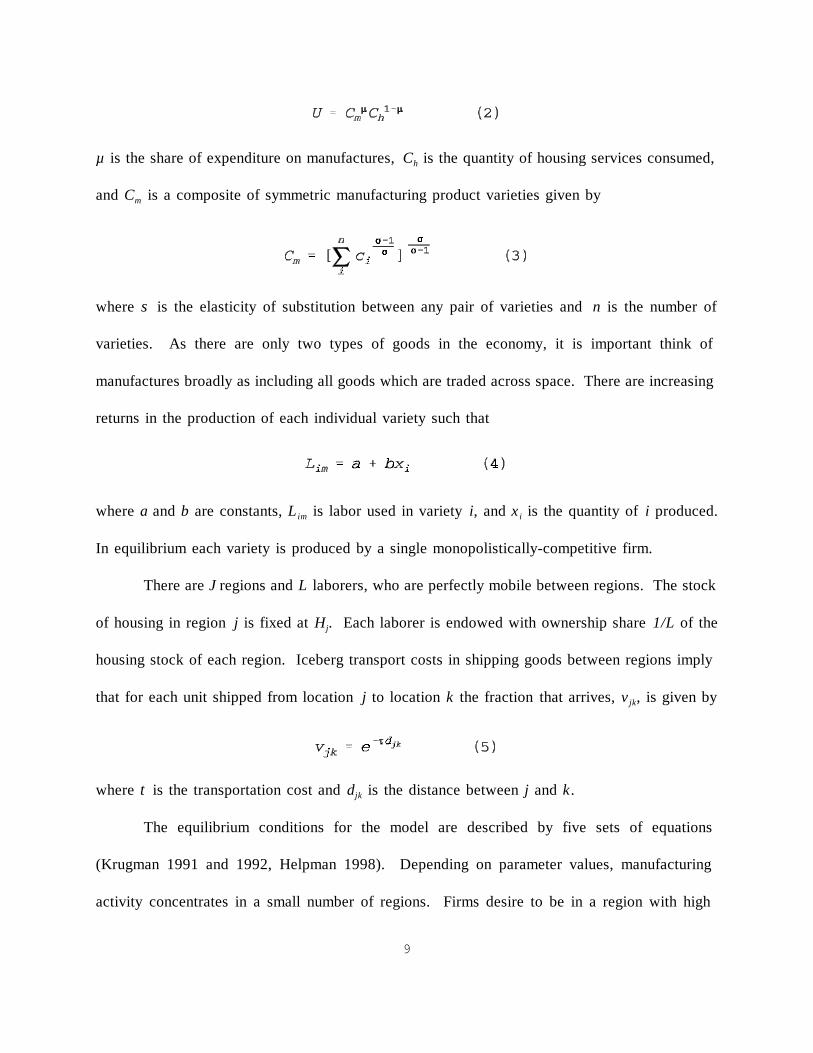
µ is the share of expenditure on manufactures, Ch is the quantity of housing services consumed,
and Cm is a composite of symmetric manufacturing product varieties given by
where σ is the elasticity of substitution between any pair of varieties and n is the number of
varieties. As there are only two types of goods in the economy, it is important think of
manufactures broadly as including all goods which are traded across space. There are increasing
returns in the production of each individual variety such that
where a and b are constants, L im is labor used in variety i, and x i is the quantity of i produced.
In equilibrium each variety is produced by a single monopolistically-competitive firm.
There are J regions and L laborers, who are perfectly mobile between regions. The stock
of housing in region j is fixed at Hj. Each laborer is endowed with ownership share 1/L of the
housing stock of each region. Iceberg transport costs in shipping goods between regions imply
that for each unit shipped from location j to location k the fraction that arrives, v jk, is given by
where τ is the transportation cost and djk is the distance between j and k.
The equilibrium conditions for the model are described by five sets of equations
(Krugman 1991 and 1992, Helpman 1998). Depending on parameter values, manufacturing
activity concentrates in a small number of regions. Firms desire to be in a region with high
9
manufacturing employment, as they can serve a large local market at low transport cost and
without duplicating fixed production costs. The costs for being in a manufacturing center are
higher labor costs, as labor must be compensated for high housing costs associated with local
congestion. The model has multiple equilibria, as which regions contain manufacturing centers
is indeterminant, but how many manufacturing centers exist is in most cases determinant.
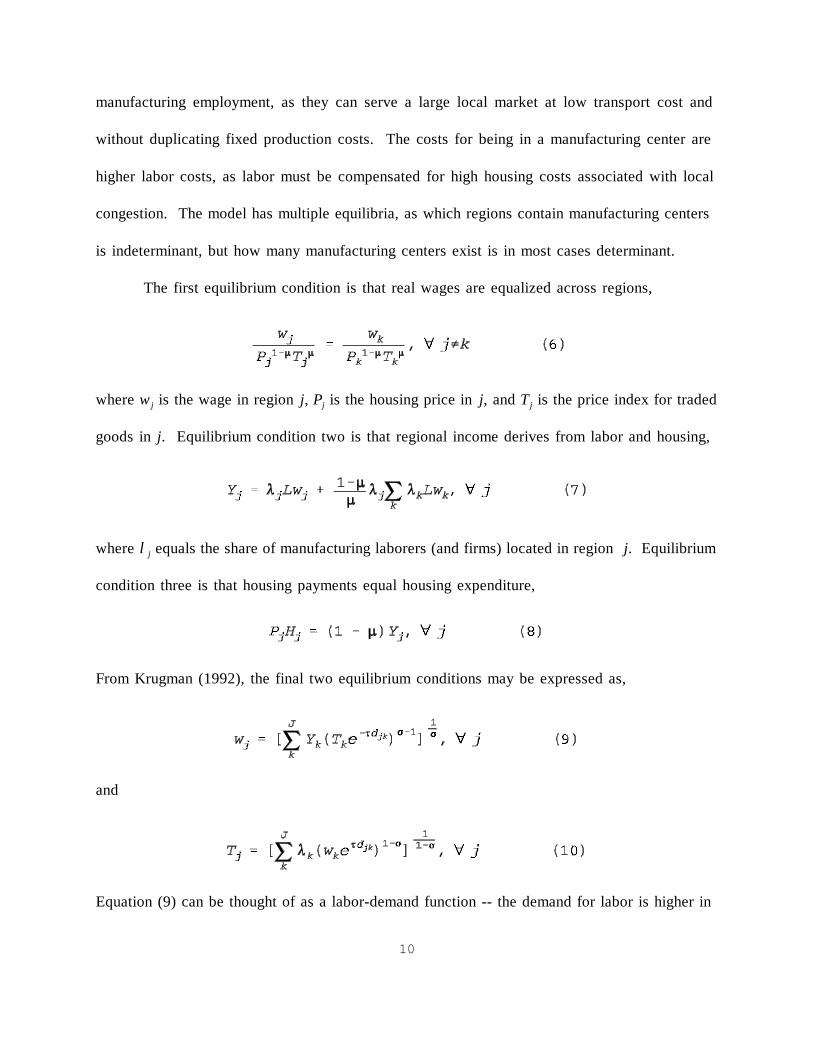
The first equilibrium condition is that real wages are equalized across regions,
where w j is the wage in region j, Pj is the housing price in j, and T j is the price index for traded
goods in j. Equilibrium condition two is that regional income derives from labor and housing,
where λj equals the share of manufacturing laborers (and firms) located in region j. Equilibrium
condition three is that housing payments equal housing expenditure,
From Krugman (1992), the final two equilibrium conditions may be expressed as,
and
Equation (9) can be thought of as a labor-demand function -- the demand for labor is higher in
10
regions that are close to areas with high consumer demand; equation (10) expresses the
equilibrium supply of manufacturing goods -- the price index for these goods is higher in regions
where a larger fraction of the goods must be imported from distant locations. 9 Equations (9) and
(10) are very similar to the market potential function in (1) in that overall economic activity is
higher in regions that are proximate to large market centers.
The Krugman model ignores many features of production and consumption which may
influence the spatial distribution of economic activity. The absence of these features reduces the
realism of the model, but enhances its tractability. My strategy is to examine whether such
simple models are informative about the spatial distribution of economic activity.
B. Model Specification
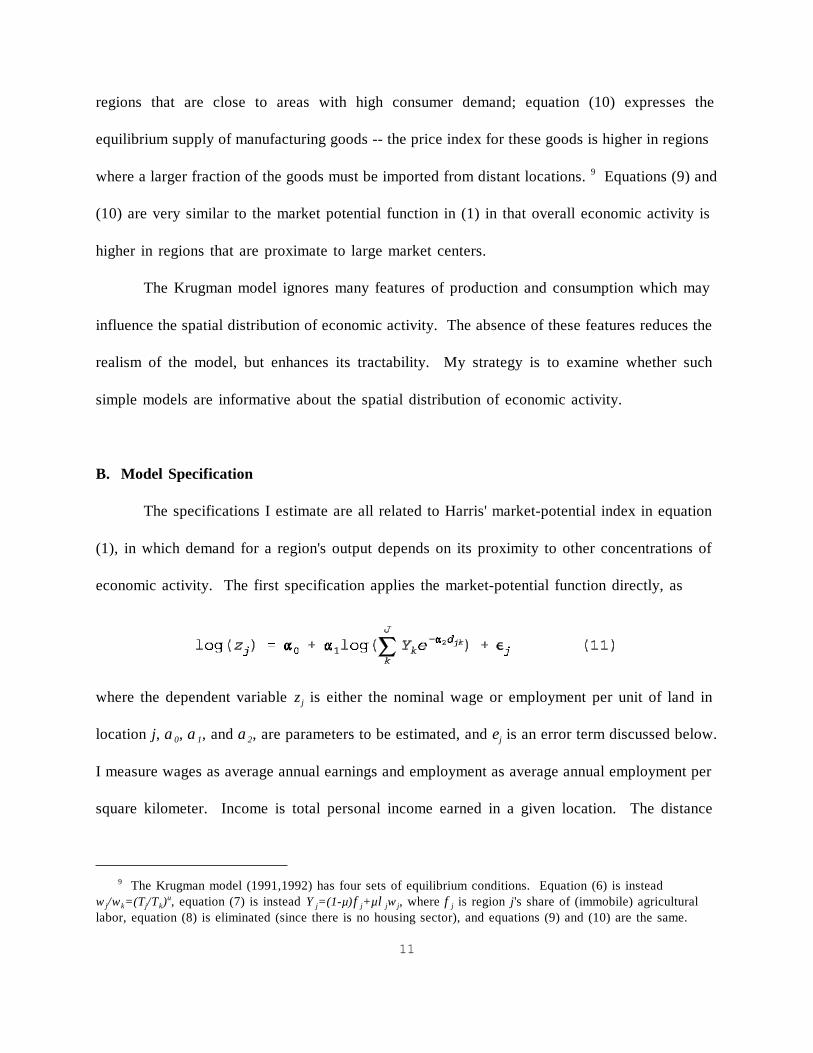
The specifications I estimate are all related to Harris' market-potential index in equation
(1), in which demand for a region's output depends on its proximity to other concentrations of
economic activity. The first specification applies the market-potential function directly, as
where the dependent variable z j is either the nominal wage or employment per unit of land in
location j, α0, α1, and α2, are parameters to be estimated, and εj is an error term discussed below.
I measure wages as average annual earnings and employment as average annual employment per
square kilometer. Income is total personal income earned in a given location. The distance
9 The Krugman model (1991,1992) has four sets of equilibrium conditions. Equation (6) is insteadw j/wk=(Tj/Tk)
u, equation (7) is instead Y j=(1-µ)φj+µλjw j, where φj is region j's share of (immobile) agriculturallabor, equation (8) is eliminated (since there is no housing sector), and equations (9) and (10) are the same.
11
measure is discussed in the next section and in an appendix.
While equation (11) is not derived from an explicit model, its relative simplicity makes
it useful as a starting point for assessing the strength of demand linkages between regions. As
with the gravity equation in international trade (Deardorff 1984), a specification similar to (11)
could be easily derived from a model that has homothetic preferences and regionally specialized
production. One interpretation of (11) is as a local labor demand function in an economy where
labor is perfectly mobile across space. Employment and wages in a location are a function of
the demand for goods produced in that location, where consumer demand is determined by
transport costs and the spatial distribution of income.
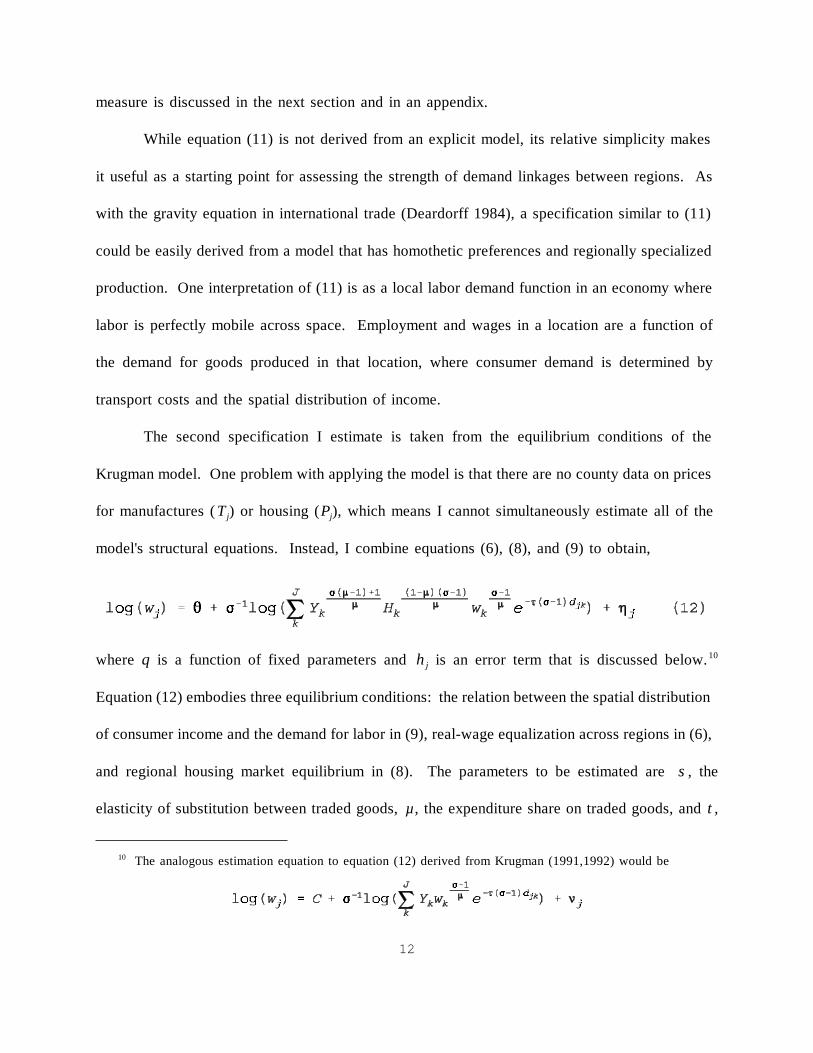
The second specification I estimate is taken from the equilibrium conditions of the
Krugman model. One problem with applying the model is that there are no county data on prices
for manufactures ( T j) or housing (Pj), which means I cannot simultaneously estimate all of the
model's structural equations. Instead, I combine equations (6), (8), and (9) to obtain,
where θ is a function of fixed parameters and ηj is an error term that is discussed below.10
Equation (12) embodies three equilibrium conditions: the relation between the spatial distribution
of consumer income and the demand for labor in (9), real-wage equalization across regions in (6),
and regional housing market equilibrium in (8). The parameters to be estimated are σ, the
elasticity of substitution between traded goods, µ , the expenditure share on traded goods, and τ,
10 The analogous estimation equation to equation (12) derived from Krugman (1991,1992) would be
12
the transportation cost of shipping one unit of a good a unit distance.
Equation (12) shows that nominal wages in one region are increasing in consumer income,
the housing stock, and nominal wages in nearby regions, but decreasing in transport costs to these
regions. The logic behind this result is as follows. For some region j, higher income in nearby
regions raises the demand for goods produced in j (and elsewhere); a larger housing stock in
nearby regions means lower housing prices and higher real incomes in these regions, which also
raises the demand for goods produced in j; and higher wages in nearby regions raise the relative
price of traded goods produced in these regions, which increases their relative demand for traded
goods produced in j. Higher production in j raises local labor demand and, for a fixed housing
stock, local housing prices and wages.
It is useful to summarize the estimation strategy in terms of implicit alternative models.
Step one is to estimate the simple market-potential function in (11). The implicit alternative
model is that spatial wage differences are due to exogenous amenities and human capital
externalities. I check whether the results are affected by replacing average earnings for wage and
salary workers with this same series adjusted for variation in average schooling, climate, natural
geography, and other factors across counties (see notes 5 and 7). If the results are insensitive to
whether adjusted or unadjusted wages are used, then we have evidence that demand linkages
between regions may contribute to spatial agglomeration. Step two is to estimate the market-
potential function based on the Krugman model in (12). The implicit alternative model is the
simple market-potential function in (11). If the Krugman model improves the fit of the
estimation, and if the parameter estimates are consistent with theory, then we have evidence that
regional demand linkages may be based on pecuniary externalities associated with scale
13
economies and transport costs. It is important to note that since the simple market-potential
function is ad hoc, I do not test the Krugman model against an explicit alternative theory. Still,
the results are useful for gauging the strength of demand linkages between regions and assessing
the strength of different factors that contribute to these linkages.
C. Estimation Issues
There are several important estimation issues to be addressed. The first is that forces
additional to those that I examine may also contribute to spatial agglomeration. One possibility
is that unobserved, time-invariant features of counties, such as land and soil quality or pre-
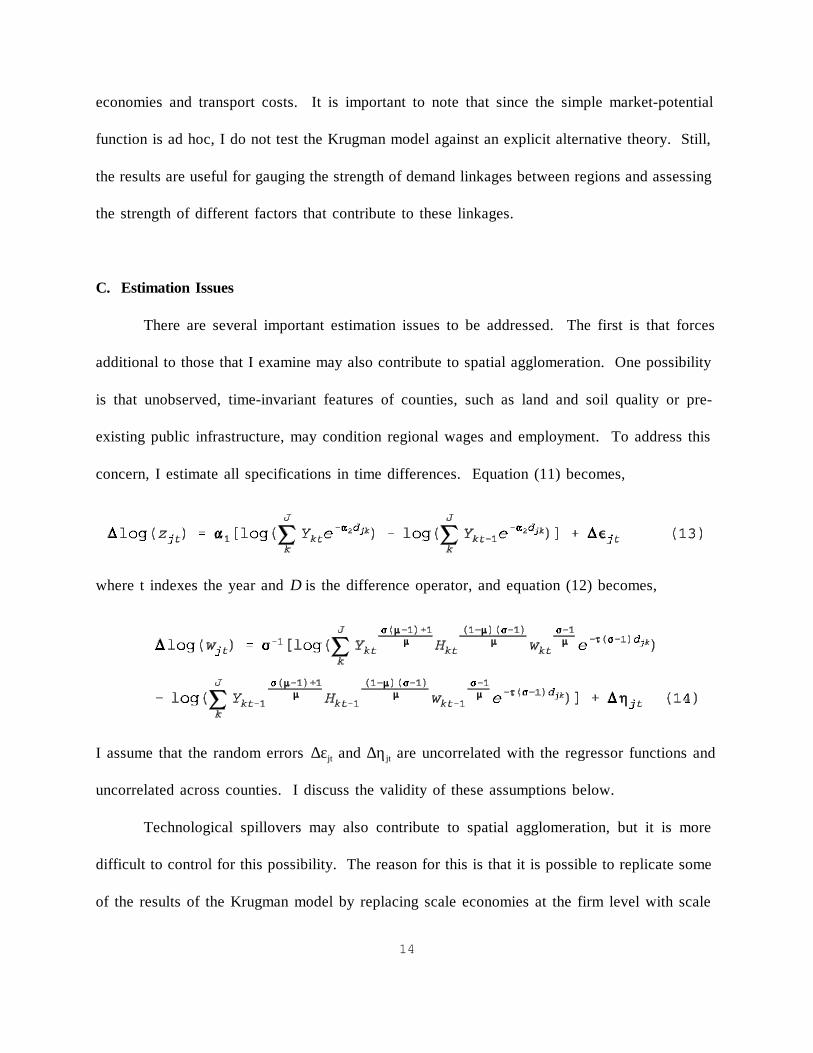
existing public infrastructure, may condition regional wages and employment. To address this
concern, I estimate all specifications in time differences. Equation (11) becomes,
where t indexes the year and ∆ is the difference operator, and equation (12) becomes,
I assume that the random errors ∆εjt and ∆ηjt are uncorrelated with the regressor functions and
uncorrelated across counties. I discuss the validity of these assumptions below.
Technological spillovers may also contribute to spatial agglomeration, but it is more
difficult to control for this possibility. The reason for this is that it is possible to replicate some
of the results of the Krugman model by replacing scale economies at the firm level with scale
14
economies at the industry or region level, as would arise from technological spillovers among
adjacent firms (Helpman 1998). The use of external economies to explain spatial agglomeration
has a long history in urban economics (Fujita and Thisse 1996). One restrictive feature of these
models is that external economies are assumed rather than derived. Part of the appeal of the
Krugman model is that pecuniary externalities arise endogenously from the interaction between
transport costs and firm-level scale economies. While external economies associated with
spillovers between firms could certainly contribute to spatial agglomeration, the absence of
microfoundations for this explanation perhaps makes it less compelling.
The second estimation issue is choosing the geographic unit of analysis. The more
geographically disaggregated are the data, the lower is measurement error and the extent to which
the location-specific error terms in equations (13) and (14) influence the independent variables
in the regressor function. Too much geographic detail, however, creates computational problems.
The summation expressions in (13) and (14) are over all locations and the distance variable, djk,
is defined for each pair of locations. As the number of locations, and hence the number of terms
in the summation expression, grows large, estimation of the model becomes intractable.
The approach I take balances geographic detail with computational costs. For the
dependent variable, I use counties in the continental United States as the unit of analysis.
Specifying the independent variables in the summation terms in (13) and (14) at the county level,
however, would create an expression with over 3,000 terms for each observation and a pair-wise
distance matrix with over 4.7 million distinct elements. I instead aggregate the independent
variables that appear in the summation expressions to the level of U.S. states. In equation (13),
for instance, the summation expressions for each observation contains 49 terms, each consisting
15

of total personal income in a state times the transportation-cost function. To avoid directly
introducing simultaneity into the estimation, I subtract own-county values from the independent
variables for the state that corresponds to the county on which an observation is being taken. In
the next section, I discuss results using alternative aggregation schemes.
The distance variables in the summation expressions are distances from the county on
which an observation is being taken to each state. I construct two measures of distance: direct
distance, which is the shortest arc that connects two locations, and hub-and-spoke distance, which
assumes that goods being transported from county i to state j must pass through a transportation
hub in the home state of county i. An appendix describes these calculations.
The third estimation issue is whether the error terms in equations (13) and (14), which
represent unobserved idiosyncratic shocks to county wage or employment growth, are correlated
with the regressor function. Any such correlation would produce inconsistent coefficient
estimates. Concern about this issue is natural given that the regressor functions include variables
one tends to think of as endogenous, such as income and wages. An obvious solution would be
to use nonlinear-instrumental-variable techniques. It is often difficult to identify valid instruments
and in this case the problem is particularly severe. The multiplicity of equilibria in economic
geography models suggests that any exogenous or pre-determined characteristics of regions may
be poor predictors for where economic activity locates.
My approach is to minimize the potential effects of endogeneity through the choice of
specification. I have already described three elements of this strategy: (i) measuring the
dependent variable at the finest level of geographic detail possible, which minimizes the
economic importance of location-specific shocks and the likelihood that they are correlated with
16
the independent variables, (ii) aggregating the independent variables to the level of U.S. states,
whose economies are less likely to be influenced by shocks to individual counties, and (iii)
subtracting own-county values from the state-level independent variables that enter the regressor
function, which avoids directly introducing simultaneity into the regression.
As an additional check on whether the endogeneity of the independent variables poses a
serious problem, I report estimation results for two samples of U.S. counties: all counties and
counties with less than 0.05% of the U.S. population. Specific shocks to high-population
counties, such as those that compose major cities, may influence economic activity in other
regions, while specific shocks to low-population counties are less likely to do so. If coefficient
estimates are similar for the two samples of counties, then it would appear that the endogeneity
of the independent variables does not have dire consequences for the estimation results.
It is important to recognize that these remedies may not adequately account for the
endogeneity of the regressor function and that there remain concerns about the consistency of the
coefficient estimates. Though the estimating equation for the Krugman model in equation (14)
is derived from explicit equilibrium conditions, one should exercise caution in interpreting the
coefficient estimates as reliable point estimates for the model's structural parameters.
III. Estimation Results
This section shows nonlinear-least-square estimation results for equations (13) and (14).
The sample is 3,075 counties in the continental United States. The dependent variables are, for
equation (13), the log change in employment or wages, and, for equation (14), the log change in
wages only. The independent variables are personal income and direct distance in equation (13),
17
and personal income, the housing stock, wages, and direct distance in equation (14), all measured
at the state level (excluding own-county components). I estimate all specifications in time-
difference form for 1970-1980 and 1980-1990. I also report results using restricted samples of
counties, alternative wage and distance measures, and additional control variables. To evaluate
the fit of the market-potential function versus that of the Krugman model (for specifications using
wages as the dependent variable), I report the value of the Schwarz Criterion, written as ln(L)-
ln(N)k/2 where ln(L) is the log likelihood, k is the number of parameters, and N is the number
of observations (such that the preferred model will have a higher criterion value).
A. The Market-Potential Function
Columns (1) and (2) of Table 2a show coefficient estimates for the market-potential
function in equation (13), using the log change in employment as the dependent variable. The
coefficient α1 is the effect of purchasing power in U.S. states on economic activity in a given
county. Consistent with the market-access hypothesis, the coefficient is positive and very
precisely estimated in both time periods. Higher consumer demand, adjusted for transport costs,
appears to raise the demand for labor in a location. The coefficient, α2, is the effect of distance
from consumer markets on economic activity in given county. Also consistent with the market-
access hypothesis, the coefficient is positive and precisely estimated in all specifications. Greater
distance to consumer markets appears to reduce the demand for labor in a location. Columns (3)
and (4) of Table 2a show coefficient estimates for (13), using the log change in unadjusted wages
as the dependent variable. Similar to the employment results, α1 and α2 are positive and
precisely estimated in both time periods. Overall, the results are consistent with the idea that
18
spatial labor demand is conditioned by access to consumer markets.
The remainder of Table 2 examines the sensitivity of the coefficient estimates to
alternative wage measures and restrictions on the sample of counties. In column (5) of Table 2a,
the dependent variable is wages adjusted for variation in human capital and exogenous amenities
across counties for the period 1980-1990. The coefficient estimates in column (5) are quite
similar to those in column (4), which uses unadjusted wages for the same time period. One
change in the results in that the estimated value of α1 is slightly smaller in column (5), suggesting
that adjusting for human capital and exogenous amenities makes wages less sensitive to variation
in purchasing power in surrounding locations.
In part (b) of Table 2, I check the sensitivity of the results to the presence of high-
population counties in the sample by excluding all counties with greater than 0.05% of the U.S.
population. In either time period, this omits 370 counties, which have 67.7% of the U.S.
population in 1980 and 68.8% of the U.S. population in 1990. Coefficient estimates in Table 2b
are very similar to those in Table 2a, which suggests that the exclusion of high-population
counties, for which it seems most likely that the disturbance term will be correlated with the
regressors, does not influence the results. Unreported results excluding counties with population
shares greater than 0.025% or 0.01% are also very similar to those in Table 2.
The nonlinearity of equation (13) makes the magnitudes of the coefficient estimates
difficult to interpret. In all specifications, α1 and α2 rise in value over time, which suggests that
the effects of both consumer purchasing power in other locations and distance to other locations
have become more important, but the net effect of these changes is unclear. To aid in this
regard, I perform the following experiment: I reduce personal income in Illinois by 10% and
19

then examine the predicted changes in wages across space implied by the coefficient estimates.
Illinois is an appealing case due to its large economic size and central location. 11 Shocks to other
states produce similar results. Given that I explore the direct effects of a shock only, the exercise
is partial equilibrium in nature. While the reduced-form nature of (13) prevents me from
examining feedback effects between wages, employment, and consumer purchasing power, the
exercise is still useful for interpreting the coefficient estimates.
Figure 5 shows the predicted effects of the income shock on the earnings of wage and
salary workers across U.S. counties using coefficient estimates for 1980-1990 (column (4) of
Table 2a) and values of the independent variables for 1990. The effects of the income shock are
largest in central Illinois and fall rapidly as one moves in any direction. Wages in Chicago
(Cook County), at a distance of 74 kilometers from the economic center of Illinois (see
appendix), fall by 3.7%; wages in St. Louis (St. Louis County), at a distance of 345 kilometers,
fall by 1.4%; and wages in Wichita, Kansas (Sedgwick County), at a distance of 885 kilometers,
falls by 0.01%. The income shock in Illinois has zero direct effect on economic activity west
of Iowa, south of Tennessee, or east of Ohio.
It is interesting to compare these results to those for an identical simulation using
estimated coefficient values for 1970-1980 (column (3) of Table 2a). In this case, which is not
shown, wages in Chicago fall by 1.2%, wages in St. Louis fall by 0.8%, and wages in Wichita
fall by 0.07%. In the later time period, the local magnitude of the shock, captured by the effects
in Chicago, is larger but the spatial extent of the shock, captured by the effects in Wichita, is
smaller. Thus, it appears that the strength of local demand linkages is rising over time, but that
11 Since I subtract own-county values from independent variables for the corresponding state, for counties inIllinois the income shock is equivalent to an income shock to all other counties in the state.
20
the spatial extent of these linkages is not. Simulation exercises using estimated coefficients from
the employment regressions (columns (1) and (2) of Table 2a) produce similar results.
Table 3 reports additional checks on the sensitivity of the estimation results. The sample
is all counties in the continental United States; results for low-population counties are very
similar to those shown. In part (a) of Table 3, the regressions include dummy variables for eight
geographic regions, which controls for variation in trend growth rates across regions. Most
coefficient estimates are very similar to those in Table 2. In wage regressions for 1970-1980
coefficient estimates for α2 are lower with region controls than without them. In part (b) of Table
3, I replace direct distance with hub-and-spoke distance (see appendix). Direct distance surely
underestimates the actual distance travelled in transporting goods between locations. Hub-and-
spoke distance, by assuming that all goods must pass through transportation hubs, approximates
actual distance travelled along existing interstate highways and railways. Estimated coefficients
are very similar to those in Table 2.
In unreported results, I perform additional checks on the robustness of the findings. First,
I estimate equation (13) excluding counties in western states, whose large land areas and low
population densities may create differing regional demand linkages. Second, I estimate equation
(13) using a more flexible specification of distance and transport costs. I replace the function
e-αd, which for positive α and d (distance) will be convex for all values of d, with the function
1/[1+(βd)2], which depending on the value of β may have both convex and concave regions in
d. Third, I implement an alternative aggregation scheme for the independent variables that enter
the regressor function. Instead of aggregating the independent variables up to the state level, for
each county I aggregate them across neighboring counties that lie within progressively more
21
distant concentric bands (0-100 km., 100-200 km, 200-300 km., etc.). These concentric-band
aggregates then replace the state aggregates in the regressor function in equations (13). This
approach allows me to calculate a relatively a more accurate distance measure, but may
exacerbate endogeneity problems. All three of these alternative approaches produce results that
are quite similar to those in Tables 2 and 3.
B. The Krugman Model
Table 4 reports estimation results for the Krugman model in equation (14). The dependent
variable is the log change in earnings of wage and salary workers. Columns (1), (2), (4), and (5)
use earnings unadjusted for human capital or exogenous amenities; columns (3) and (6) use
adjusted earnings. Each specification in each time period is estimated on the full sample of
counties and on low-population counties. As coefficient estimates for a given time period are
very similar for either sample of counties and for either earnings measure, I focus on results for
the full sample of counties that use unadjusted earnings as the dependent variable.
The model parameters, σ, the elasticity of substitution, µ, the expenditure share on
manufactured goods, and τ, unit transportation costs, are all positive, as predicted by the theory,
and very precisely estimated. The values of the Schwarz Criterion indicate that the Krugman
model is preferred over the market-potential function for all matched time periods and samples
(e.g., compare column (3) in Table 2 with column (1) in Table 4, etc.). The parameter values
indicate that wages in a location are positively correlated consumer income, the housing stock,
and wages in nearby locations, but negatively correlated with distance to these locations. This
is consistent with the predictions of the Krugman model, as stated in equations (12) and (14).
22
As a further step, it is useful to consider what the parameter estimates imply about preferences
and technology and their influence on spatial agglomeration.
Consistent with theory, estimates of σ are greater than 1. The lower is the value of σ,
the lower in absolute value is the own-price elasticity of demand for any individual good and the
more imperfectly competitive is the market for that good. The results suggest that markets have
become more imperfectly competitive over time. Given profit-maximizing behavior by firms,
σ/(σ-1) equals the ratio of price to marginal cost. The coefficient estimates suggest that between
1980 and 1990 the industry price-cost margin rises from 1.11 to 1.21, with both ratios precisely
estimated. In equilibrium, price equals average cost, in which case a value of σ/(σ-1) that is
greater than one indicates that production is subject to increasing returns to scale.
Also consistent with the theory, the estimates of µ are between 0 and 1. As mentioned
in section II, µ should be interpreted as the expenditure share on all goods traded across space.
With an average expenditure share on housing in the United States of approximately 0.2, the
estimated value for µ of 0.9 may seem high. Note, however, that expenditure on housing services
consists of payments for use of housing structures as well as payments for use of land. Housing
structures are produced using traded intermediate inputs, such as wood, cement, and glass.
Somerville (1996) finds that the share of land costs in the price of new residential housing in
U.S. cities ranges from 0.21 to 0.35. Given these figures, a value of 0.1 for the share of total
expenditure on the land component of housing seems reasonable.
Estimated values for τ suggest, counterintuitively, that transportation costs have risen over
time. Equation (14) indicates that the economic importance of distance depends both on τ and
the magnitude of scale economies, which are captured by σ. That is, the reduced-form coefficient
23
on distance in equation (14) is τ(σ-1). Table 4 also reports estimated values for this parameter.
While estimates of τ(σ-1) also rise in value over time, the proportional increase in the reduced-
form distance coefficient is much less than that for τ alone. I discuss interpretations of rising
distance effects in section IV.
The empirical results also have implications for the stability of the spatial distribution of
economic activity. In the Helpman (1998) version of the Krugman model, if σ(1-µ)<1, then the
higher is τ, the more geographically concentrated will be manufacturing activity. In this case,
scale economies are strong and/or the housing share is low. Scale economies allow firms in
agglomerated regions to adequately compensate workers for high housing costs; a low housing
share means that workers are not adverse to being in a region with high housing prices. These
two forces encourage the spatial agglomeration of economic activity. Alternatively, if σ(1-µ)>1,
then a region's share of manufacturing employment depends only on its share of the housing
stock and is invariant to transport costs.12 In 1980, the value of σ(1-µ) is 0.76, with a standard
error of 0.13, and in 1990 the value is 0.5, with a standard error of 0.08. For the U.S. economy,
it appears that spatial agglomeration is increasing in transport costs. This finding suggests that
spatial agglomeration in the United States is associated with pecuniary externalities created by
transport costs and firm-level scale economies.
To see what the parameter values imply about the nature of demand linkages between
regions, I perform simulation exercises similar to those in the last section. I reduce income in
12 The Krugman (1991) model has a different result. If σ(1-µ)>1, then the range of equilibria depends ontransport costs. At high τ, regions are autarkic and economic activity is evenly distributed across space; at lowτ, their is spatial agglomeration. Alternatively, if σ(1-µ)<1, then there is spatial agglomeration for any value ofτ. Helpman (1998) suggests that his results differ from Krugman's due to the fact that the homogenous productin the Krugman model (agriculture) is freely traded across space while in the Helpman version (housing) it isnot.
24
the state of Illinois by 10% and examine the predicted effects on wages in surrounding counties.
The exercise is again strictly partial equilibrium in nature, as I do not take the indirect effects of
the income shock into account. Without county-level data on housing and goods' prices, I am
unable to perform general-equilibrium simulations.
Figure 6 shows the effects of the income shock in Illinois using coefficient estimates for
1980-1990 (column (2), Table 4) and values for the independent variables from 1990. Wages
in Chicago, at a distance of 74 kilometers from the economic center of Illinois, fall by 0.92%,
wages in St. Louis, at a distance of 345 kilometers, fall by 0.17%, and wages in Wichita, at a
distance of 885 kilometers, are unaffected. It is instructive to compare these results to those for
coefficient estimates from 1970-1980 (column (1), Table 4). In this case (not shown), wages in
Chicago fall by 0.22%, wages in St. Louis fall by 0.15%, and wages in Wichita are unchanged.
Similar to simulations for the simple market-potential function, the impact of the income shock
rises substantially between the two time periods, but in contrast to those results the geographic
scope of the shock is unchanged over time. As in the previous section, demand linkages between
regions appear to be strong and rising over time but limited in spatial extent.
The results in Figures 5 and 6 are qualitatively similar. The coefficient estimates from
the simple market-potential function, however, produce larger changes in regional wages than do
coefficient estimates from the Krugman model. One explanation is that the simple market-
potential function is a reduced form of the Krugman model. The coefficient on income in
equation (13) embodies the direct effect of the variable on wages in a given county plus its
indirect effect through other regional variables. Simulation exercises based on the Krugman
model ignore such indirect effects, since wages and the housing stock are held constant.
25
Table 5 checks the sensitivity of the results to alternative specifications of the model and
alternative measures of distance. In Part (a) of Table 5, I include dummy variables for eight
geographic regions in the estimation. Parameter estimates for µ, σ, τ, and σ/(σ-1) are very
similar to those in Table 4. In Part (b) of Table 5, I replace direct distance with hub-and-spoke
distance. While the results are qualitatively similar to those in Table 4, there are two differences
worthy of note. Estimated values of σ are larger than in Table 4, which produces estimated
ratios of price to marginal cost which are slightly smaller, and estimated values of µ are very
close to one, which may be implausibly large.
Finally, in unreported results I estimate equation (14) using alternative specifications
similar to those for the simple market-potential function described in the previous section.
Excluding counties with high shares of the U.S. population (0.05%, 0.025%, or 0.01%), excluding
counties in western states, or imposing the aggregation scheme based on concentric distance
bands also produce results similar to those in Table 4. 13
IV. Discussion
In this paper, I use data on U.S. counties to estimate nonlinear models of spatial economic
relationships. Recent theoretical work attributes the geographic concentration of economic
activity to product-market linkages between regions that result from scale economies and
transport costs. My findings are broadly consistent with this hypothesis.
13 In unreported results, I estimate the structural parameters of the Krugman model using the formulation inKrugman (1991,1992) (see notes 9 and 10). The estimates (standard errors) are the following: for 1980-1990, σis 8.27 (1.23), µ is 1.15 (0.04), and τ is 3.29 (0.37); and for 1970-1980, σ is 18.25 (3.55), µ is 1.05 (0.04), andτ is 1.62 (0.18). While these results are qualitatively similar to those in Table 4, there is more variation in σand the estimates of µ are inconsistent with the theoretically specified range of 0 to 1.
26
One contribution of the paper is estimation of Harris' (1954) market-potential function.
While Harris' formulation is quite simple, few past applications of the market-potential concept
examine its predictive power using actual data. In a regression context, I find that, analogous
to the gravity model in international trade, the market-potential function is a valuable empirical
tool for describing the spatial covariation of consumer purchasing power, wages, and
employment. The empirical results suggest that demand linkages between regions are strong and
growing over time, but limited in geographic scope.
A second contribution of the paper is estimation of the Krugman (1991) model of
economic geography. The model has been enormously influential in theoretical research, but has
received scant attention in the empirical literature. While there remain concerns about model
identification associated with endogeneity problems, the parameter estimates are consistent with
their theoretically hypothesized values and the Krugman model fits the data better than the simple
market-potential function. The results suggest that there are small but significant economies of
scale and that spatial agglomeration rises with transport costs.
The core result of the paper, that wage growth in a location is positively correlated with
changes in an index of economic activity in surrounding locations, may not seem that surprising.
Other economic models might also predict a similar relationship. What is useful about the results
is that they help identify the nature of the spatial linkages that contribute to geographic
concentration. Previous research on agglomeration often ignores such spatial interactions entirely.
Regions appear to have higher wages if they are near regions with high incomes, which tend to
have high consumer demand; near regions with large housing stocks, which can accommodate
large populations of consumers; or near regions with high labor costs, which presumably produce
27

relatively expensive traded goods. These linkages reflect potential sources of interregional
demand as well as potential sources of competing supply. Regional product-market interactions
thus appear to be central to the process of geographic concentration.
That the Krugman model is consistent with the empirical properties of spatial linkages
does not rule out the possibility that other factors may also contribute to spatial agglomeration.
I show that the estimation results are not greatly affected by introducing controls for human
capital externalities or exogenous amenities. But there are other factors, such as technology
spillovers, for which I do not control. Assessing the relative strength of different factors that
contribute to geographic concentration is an important area for further research.
One puzzling feature of the results is that in all specifications the estimated effects of
distance rise over time. This is unexpected in an economy where communications, airfare, and
freight costs appear to be falling. These changes in relative costs have prompted many observers
to claim that the importance of distance is declining. Cairncross (1997) even predicts that digital
communications will replace the need for face-to-face interaction, rendering cities obsolete. I find
that distance matters for explaining economic interactions between regions. To interpret this
result, it is useful to recall that the Krugman model assumes all traded goods have identical
transport costs, production technology, and preference parameters. During the time period I
examine, 1970-1990, U.S. production shifts from low-transport cost manufactures to high-
transport cost services. Shifts in industry composition may show up in the estimation as a rise
in transport costs. In other words, the transport costs I estimate may be interpreted as average
values, which characterize the overall transport-intensiveness of production in the economy. The
economic importance of distance is clearly another issue worthy of greater attention.
28
Appendix: Distance Calculations
I construct two measures of distance. The first is a measure of direct (geodesic) distance, inwhich I assume that goods are transported along the minimum distance arc that connects twolocations. The second is a measure of hub-and-spoke distance, in which I assume that goods arefirst transported from a county to a transportation hub in the county's home state and then fromthe transportation hub to the final destination.
Direct (Geodesic) Distance: Direct distance is the distance from the geographic center of acounty (the latitude and longitude points for which are taken from the USA Counties 1996 CD-Rom) to the economic center of a state. To calculate the economic center of a state, I take theaverage of the latitude and longitude points for all counties within a state, weighting each countyby its share of state personal income. To calculate direct, or more formally geodesic, distance,I convert the two sets of latitude and longitude points into Cartesian coordinates and thencalculate the minimum-length arc that connects the points, where I impose the assumption thatthe Earth is a perfect sphere with radius equal to the mean of the polar and equatorial radii (thepolar radius is 6,357 kilometers; the equatorial radius is 6,378 kilometers). For distances withinthe continental United States, the measurement error resulting from the perfect-sphere assumptionis very small, generally less than 0.4% of the estimated distance.
Hub-and-Spoke Distance: As an alternative distance measure, I assume that goods must first betransported from a county to a transportation hub in the county's home state and then from thetransportation hub to the economic center of the destination state. This corrects the direct-distance measure for the fact that road or rail distance between locations rarely follows theminimum-distance arc. I use geodesic distance, as described above, to measure distance froma county to a transportation hub and from a transportation hub to the geographic center of a state.I assume that the location of the transportation hub in each state is the economic center of thestate. For most states, the location of the transportation hub corresponds to the location of thestate's largest city. There are three exceptions, California, Pennsylvania, and Texas. To createrealistic transportation hubs for these states, I divide each state roughly in half (California andTexas latitudinally and Pennsylvania longitudinally). The resulting transportation hubs arelocated very near the largest city in the respective region of each state.
29
References
Black, D. and V. Henderson. 1998a. "A Theory of Urban Growth." Journal of Political Economy,forthcoming.
Black, D. and V. Henderson. 1998b. “Urban Evolution in the U.S.A.” Mimeo, Brown University.
Beeson, P. and R. Eberts. 1989. "Identifying Productivity and Amenity Effects in Interurban WageDifferentials." Review of Economics and Statistics 71: 443-452.
Blanchard, O. and L. Katz. 1992. "Regional Evolutions." Brookings Papers on Economic A ctivity 1: 1-75.
Cairncross, F. 1997. The Death of Distance. Boston: Harvard Business School Press.
Ciccone, A. and R. Hall. 1996. "Productivity and the Density of Economic Activity." AmericanEconomic Review 86: 54-70.
Clark, C., F. Wilson, and J. Bradley. 1969. "Industrial Location and Economic Potential in WesternEurope." Regional Studies 3: 197-212.
Davis, D.R. and D.E. Weinstein. 1997. "Economic Geography and Regional Production Structure: AnEmpirical Investigation." NBER Working Paper No. 6093.
Deardorff, A.V. 1984. "Testing Trade Theories." In R. Jones and P. Kennen, eds., Handbook ofInternational Economics. Amsterdam: North-Holland.
Dekle, R. and J. Eaton. 1994. "Agglomeration and the Price of Land: Evidence from the Prefectures."NBER Working Paper No. 4781.
Dicken, P. and P. Lloyd. 1977. Location in Space. New York: Harper and Row.
Dixit, A. and J. Stiglitz. 1977. "Monopolistic Competition and Optimum Product Diversity." AmericanEconomic Review 67: 297-308.
Dobkins, L.H. and Y. Ioannides. 1998. "Spatial Interactions among U.S. Cities." Mimeo, TuftsUniversity.
Eaton, J. and Z. Eckstein. 1997. "Cities and Growth: Theory and Evidence from France and Japan."Regional Science and Urban Economics 27: 443-474.
Fujita, M. 1988. "A Monopolistic Competition Model of Spatial Agglomeration." Regional Science andUrban Economics 18: 87-124.
Fujita, M. and P. Krugman. 1995. "When in the Economy Monocentric? von Thunen and ChamberlainUnified." Regional Science and Urban Economics 25: 505-528.
Fujita, M. and J.F. Thisse. 1996. "Economics of Agglomeration." Journal of the Japanese andInternational Economies 10: 339-378.
30

Glaeser, E.L., H. Kallal, J. Sheinkman, and A. Shleifer. 1992. "Growth in Cities." Journal of PoliticalEconomy 100: 1126-1152.
Glaeser, E.L. and D.C. Mare. 1994. "Cities and Skills." NBER Working Paper No. 4728.
Gyourko, J. and J. Tracy. 1991. "The Structure of Local Public Finance and the Quality of Life."Journal of Political Economy 99: 774-806.
Hanson, G. 1997. "Increasing Returns, Trade, and the Regional Structure of Wages." Economic Journal107: 113-133.
Harris, C.D. 1954. "The Market as a Factor in the Localization of Industry in the United States." A nnalsof the A ssociation of American Geographers 44: 315-348.
Helpman, E. 1998. "The Size of Regions." In D. Pines, E. Sadka, and I. Zilcha, eds., Topics in PublicEconomics. Cambridge: Cambridge University Press, pp. 33-54.
Henderson, J.V. 1974. "The Sizes and Types of Cities." American Economic Review 64: 640-656.
Henderson, J.V., Kuncoro, A., and M. Turner. 1995. "Industrial Development and Cities." Journal ofPolitical Economy 103: 1067-1081.
Jaffe, A., M. Trajtenberg, and R. Henderson. 1993. "Geographic Localization of Knowledge Spilloversas Evidenced by Patent Citations." Quarterly Journal of Economics 108: 577-598.
Justman, M. 1994. "The Effect of Local Demand on Industry Location." Review of Economics andStatistics 76: 742-753.
Keeble, D., P.L. Owens, and C. Thompson. 1982. "Regional Accessibility and Economic Potential inthe European Community." Regional Studies 16: 419-432.
Krugman, P. 1980. "Scale Economies, Product Differentiation, and the Pattern of Trade." AmericanEconomic Review 70: 950-959.
Krugman, P. 1991. "Increasing Returns and Economic Geography." Journal of Political Economy 99:483-499.
Krugman, P. 1992. "A Dynamic Spatial Model." NBER Working Paper No. 4219.
Krugman, P. and A. Venables. 1995. "Globalization and the Inequality of Nations." Quarterly Journalof Economics 110: 857-880.
Lucas, R.E. 1988. "The Mechanics of Economic Development." Journal of Monetary Economics 22: 3-42.
Ottaviano, G.I.P. and D. Puga. 1997. "Agglomeration in a Global Economy: A Survey." Mimeo, LSE.
Papageorgiou, Y.Y. and J.-F. Thisse. 1985. "Agglomeration as Spatial Interdependence between Firmsand Households." Journal of Economic Theory 37: 19-31.
31
Peri, G. 1998. "Human Capital Externalities and U.S. Cities." Mimeo, University of California.
Puga, D. 1998. "The Rise and Fall of Regional Inequalities." European Economic Review, forthcoming.
Quah, D. 1996. "Regional Convergence Clusters across Europe." European Economic Review 40: 951-58.
Rauch, J.E. 1993. "Productivity Gains from Geographic Concentration of Human Capital: Evidencefrom the Cities." Journal of Urban Economics 34: 380-400.
Rivera-Batiz, F.L. 1988. "Increasing Returns, Monopolistic Competition, and Agglomeration Economiesin Consumption and Production." Regional Science and Urban Economics 18: 125-53.
Roback, J. 1982. "Wages, Rents, and the Quality of Life." Journal of Political Economy 90: 1257-1278.
Romer, P. 1987. "Growth Based on Increasing Returns Due to Specialization." Journal of PoliticalEconomy 77: 56-62.
Romer, P. 1990. "Endogenous Technological Change." Journal of Political Economy 98: S71-S102.
Rosen, S. 1974. "Hedonic Prices and Implicit Markets: Product Differentiation in Pure Competition."Journal of Political Economy 82: 34-55.
Rosen, S. 1979. "Wage-Based Indexes of the Urban Quality of Life." In P. Mieszkowski and M.Straszheim. Baltimore: Johns Hopkins University Press.
Somerville, C.T. 1996. "The Contribution of Land and Structure to Builder Profits and House Prices."Journal of Housing Research 7: 127-141.
Topel, R.H. 1986. "Local Labor Markets." Journal of Political Economy 94: S111-S143.
Topel, R.H. 1994. "Regional Labor Markets and the Determinants of Wage Inequality." AmericanEconomic Review 84: 17-22.
Thomas, A. 1997. "Increasing Returns, Congestion Costs and the Geographic Concentration of Firms."Mimeo, International Monetary Fund.
U.S. Department of Commerce. 1996. Statistical A bstract of the United States. Washington, DC:Government Printing Office.
Venables, A.J. 1996. "Equilibrium Locations of Vertically Linked Industries." International EconomicReview 37: 341-360.
32
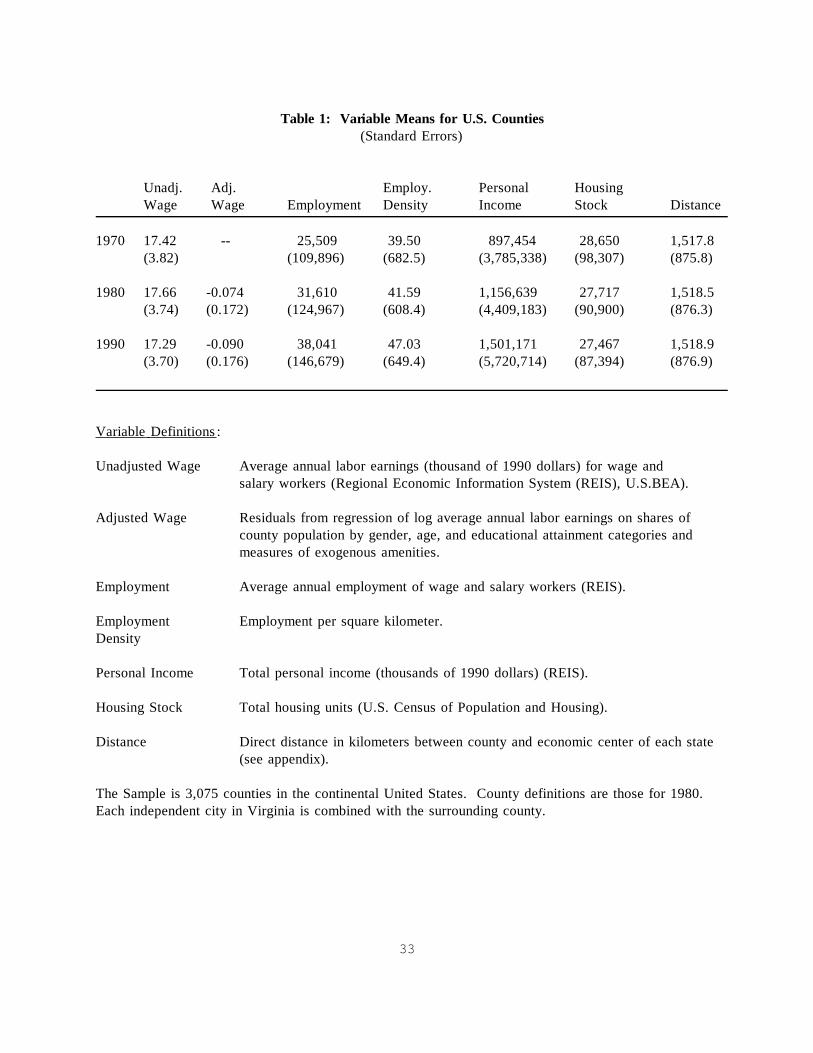
Table 1: Variable Means for U.S. Counties(Standard Errors)
Unadj. Adj. Employ. Personal HousingWage Wage Employment Density Income Stock Distance
1970 17.42 -- 25,509 39.50 897,454 28,650 1,517.8(3.82) (109,896) (682.5) (3,785,338) (98,307) (875.8)
1980 17.66 -0.074 31,610 41.59 1,156,639 27,717 1,518.5(3.74) (0.172) (124,967) (608.4) (4,409,183) (90,900) (876.3)
1990 17.29 -0.090 38,041 47.03 1,501,171 27,467 1,518.9(3.70) (0.176) (146,679) (649.4) (5,720,714) (87,394) (876.9)
Variable Definitions :
Unadjusted Wage Average annual labor earnings (thousand of 1990 dollars) for wage andsalary workers (Regional Economic Information System (REIS), U.S.BEA).
Adjusted Wage Residuals from regression of log average annual labor earnings on shares ofcounty population by gender, age, and educational attainment categories andmeasures of exogenous amenities.
Employment Average annual employment of wage and salary workers (REIS).
Employment Employment per square kilometer.Density
Personal Income Total personal income (thousands of 1990 dollars) (REIS).
Housing Stock Total housing units (U.S. Census of Population and Housing).
Distance Direct distance in kilometers between county and economic center of each state(see appendix).
The Sample is 3,075 counties in the continental United States. County definitions are those for 1980. Each independent city in Virginia is combined with the surrounding county.
33
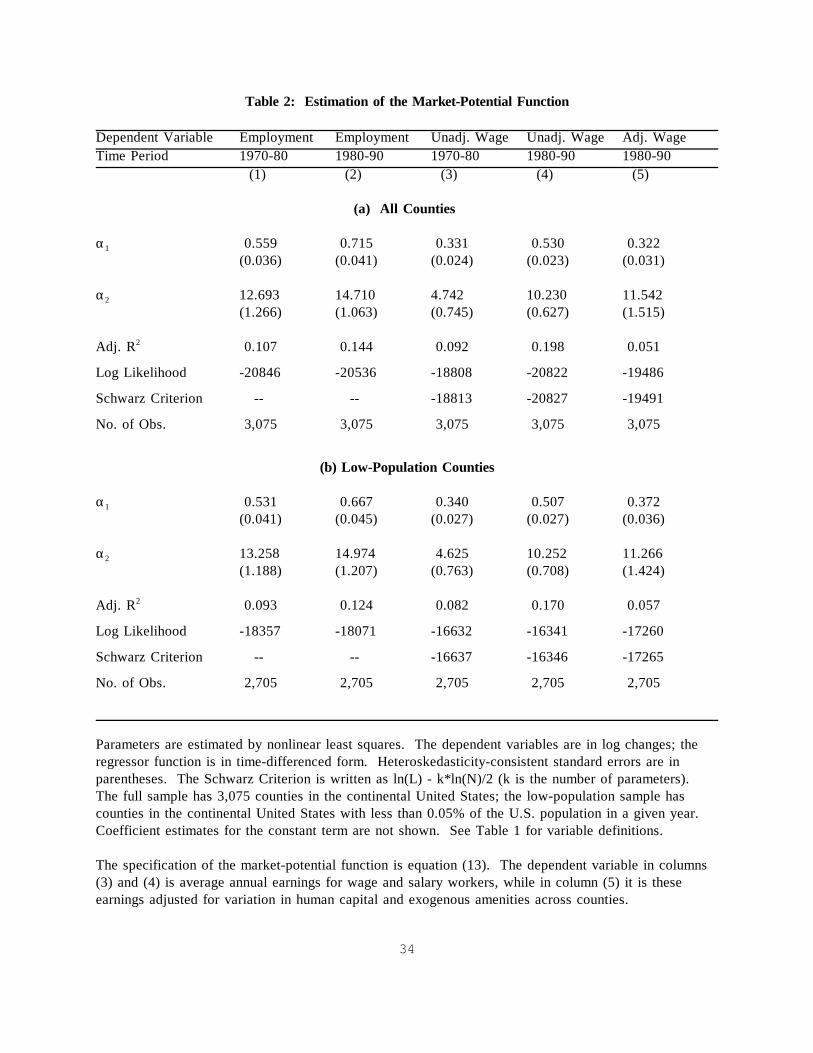
Table 2: Estimation of the Market-Potential Function
Dependent Variable Employment Employment Unadj. Wage Unadj. Wage Adj. WageTime Period 1970-80 1980-90 1970-80 1980-90 1980-90
(1) (2) (3) (4) (5)
(a) All Counties
α1 0.559 0.715 0.331 0.530 0.322(0.036) (0.041) (0.024) (0.023) (0.031)
α2 12.693 14.710 4.742 10.230 11.542(1.266) (1.063) (0.745) (0.627) (1.515)
Adj. R2 0.107 0.144 0.092 0.198 0.051
Log Likelihood -20846 -20536 -18808 -20822 -19486
Schwarz Criterion -- -- -18813 -20827 -19491
No. of Obs. 3,075 3,075 3,075 3,075 3,075
(b) Low-Population Counties
α1 0.531 0.667 0.340 0.507 0.372(0.041) (0.045) (0.027) (0.027) (0.036)
α2 13.258 14.974 4.625 10.252 11.266(1.188) (1.207) (0.763) (0.708) (1.424)
Adj. R2 0.093 0.124 0.082 0.170 0.057
Log Likelihood -18357 -18071 -16632 -16341 -17260
Schwarz Criterion -- -- -16637 -16346 -17265
No. of Obs. 2,705 2,705 2,705 2,705 2,705
Parameters are estimated by nonlinear least squares. The dependent variables are in log changes; theregressor function is in time-differenced form. Heteroskedasticity-consistent standard errors are inparentheses. The Schwarz Criterion is written as ln(L) - k*ln(N)/2 (k is the number of parameters). The full sample has 3,075 counties in the continental United States; the low-population sample hascounties in the continental United States with less than 0.05% of the U.S. population in a given year.Coefficient estimates for the constant term are not shown. See Table 1 for variable definitions.
The specification of the market-potential function is equation (13). The dependent variable in columns(3) and (4) is average annual earnings for wage and salary workers, while in column (5) it is theseearnings adjusted for variation in human capital and exogenous amenities across counties.
34
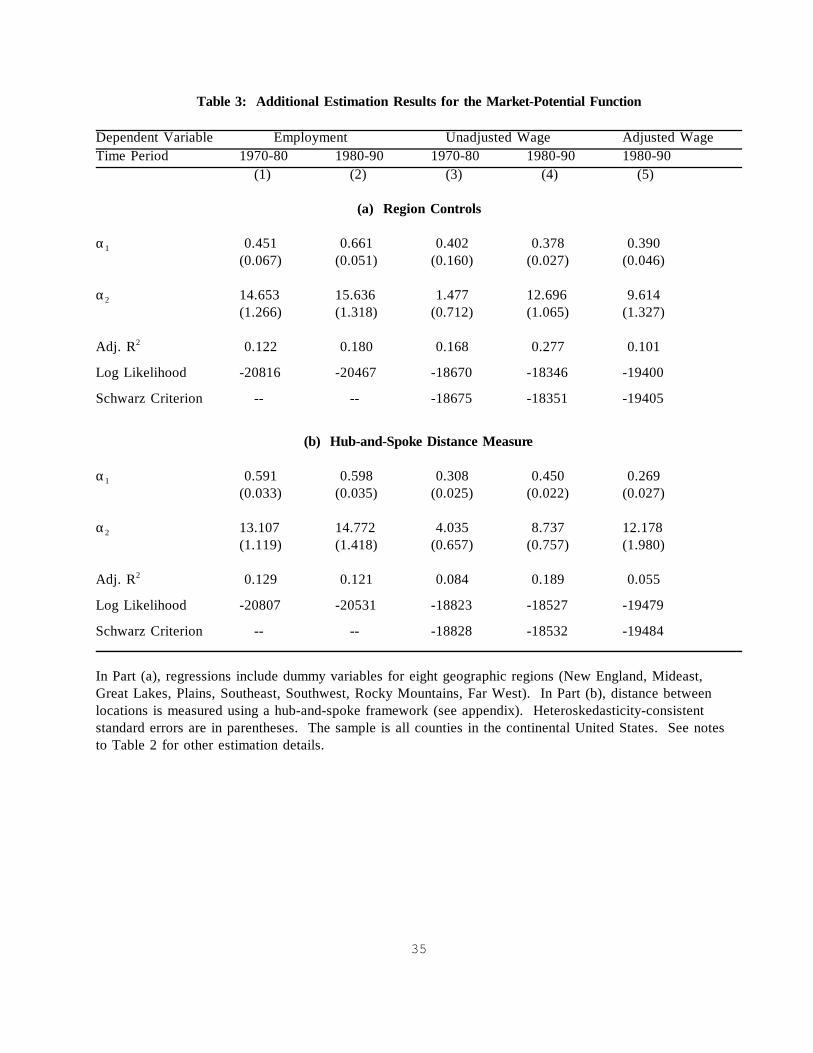
Table 3: Additional Estimation Results for the Market-Potential Function
Dependent Variable Employment Unadjusted Wage Adjusted WageTime Period 1970-80 1980-90 1970-80 1980-90 1980-90
(1) (2) (3) (4) (5)
(a) Region Controls
α1 0.451 0.661 0.402 0.378 0.390 (0.067) (0.051) (0.160) (0.027) (0.046)
α2 14.653 15.636 1.477 12.696 9.614 (1.266) (1.318) (0.712) (1.065) (1.327)
Adj. R2 0.122 0.180 0.168 0.277 0.101
Log Likelihood -20816 -20467 -18670 -18346 -19400
Schwarz Criterion -- -- -18675 -18351 -19405
(b) Hub-and-Spoke Distance Measure
α1 0.591 0.598 0.308 0.450 0.269(0.033) (0.035) (0.025) (0.022) (0.027)
α2 13.107 14.772 4.035 8.737 12.178(1.119) (1.418) (0.657) (0.757) (1.980)
Adj. R2 0.129 0.121 0.084 0.189 0.055
Log Likelihood -20807 -20531 -18823 -18527 -19479
Schwarz Criterion -- -- -18828 -18532 -19484
In Part (a), regressions include dummy variables for eight geographic regions (New England, Mideast,Great Lakes, Plains, Southeast, Southwest, Rocky Mountains, Far West). In Part (b), distance betweenlocations is measured using a hub-and-spoke framework (see appendix). Heteroskedasticity-consistentstandard errors are in parentheses. The sample is all counties in the continental United States. See notesto Table 2 for other estimation details.
35
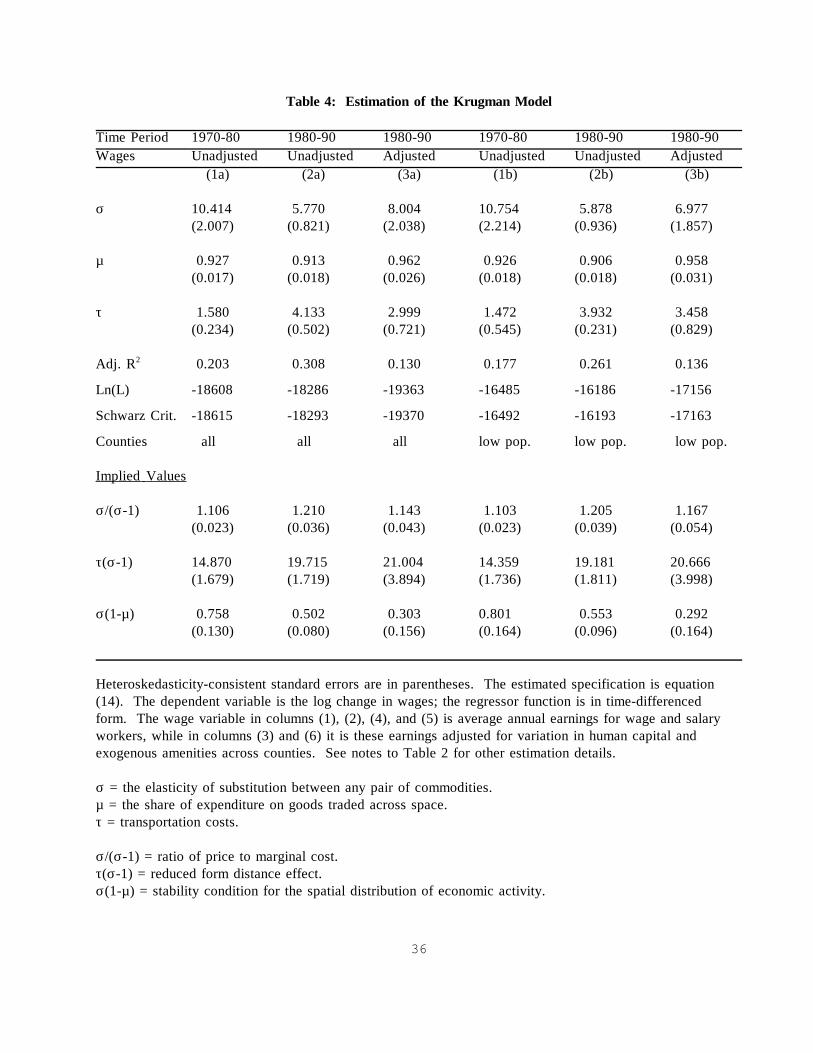
Table 4: Estimation of the Krugman Model
Time Period 1970-80 1980-90 1980-90 1970-80 1980-90 1980-90Wages Unadjusted Unadjusted Adjusted Unadjusted Unadjusted Adjusted
(1a) (2a) (3a) (1b) (2b) (3b)
σ 10.414 5.770 8.004 10.754 5.878 6.977(2.007) (0.821) (2.038) (2.214) (0.936) (1.857)
µ 0.927 0.913 0.962 0.926 0.906 0.958(0.017) (0.018) (0.026) (0.018) (0.018) (0.031)
τ 1.580 4.133 2.999 1.472 3.932 3.458(0.234) (0.502) (0.721) (0.545) (0.231) (0.829)
Adj. R2 0.203 0.308 0.130 0.177 0.261 0.136
Ln(L) -18608 -18286 -19363 -16485 -16186 -17156
Schwarz Crit. -18615 -18293 -19370 -16492 -16193 -17163
Counties all all all low pop. low pop. low pop.
Implied Values
σ/(σ-1) 1.106 1.210 1.143 1.103 1.205 1.167(0.023) (0.036) (0.043) (0.023) (0.039) (0.054)
τ(σ-1) 14.870 19.715 21.004 14.359 19.181 20.666(1.679) (1.719) (3.894) (1.736) (1.811) (3.998)
σ(1-µ) 0.758 0.502 0.303 0.801 0.553 0.292(0.130) (0.080) (0.156) (0.164) (0.096) (0.164)
Heteroskedasticity-consistent standard errors are in parentheses. The estimated specification is equation(14). The dependent variable is the log change in wages; the regressor function is in time-differencedform. The wage variable in columns (1), (2), (4), and (5) is average annual earnings for wage and salaryworkers, while in columns (3) and (6) it is these earnings adjusted for variation in human capital andexogenous amenities across counties. See notes to Table 2 for other estimation details.
σ = the elasticity of substitution between any pair of commodities. µ = the share of expenditure on goods traded across space.τ = transportation costs.
σ/(σ-1) = ratio of price to marginal cost.τ(σ-1) = reduced form distance effect.σ(1-µ) = stability condition for the spatial distribution of economic activity.
36
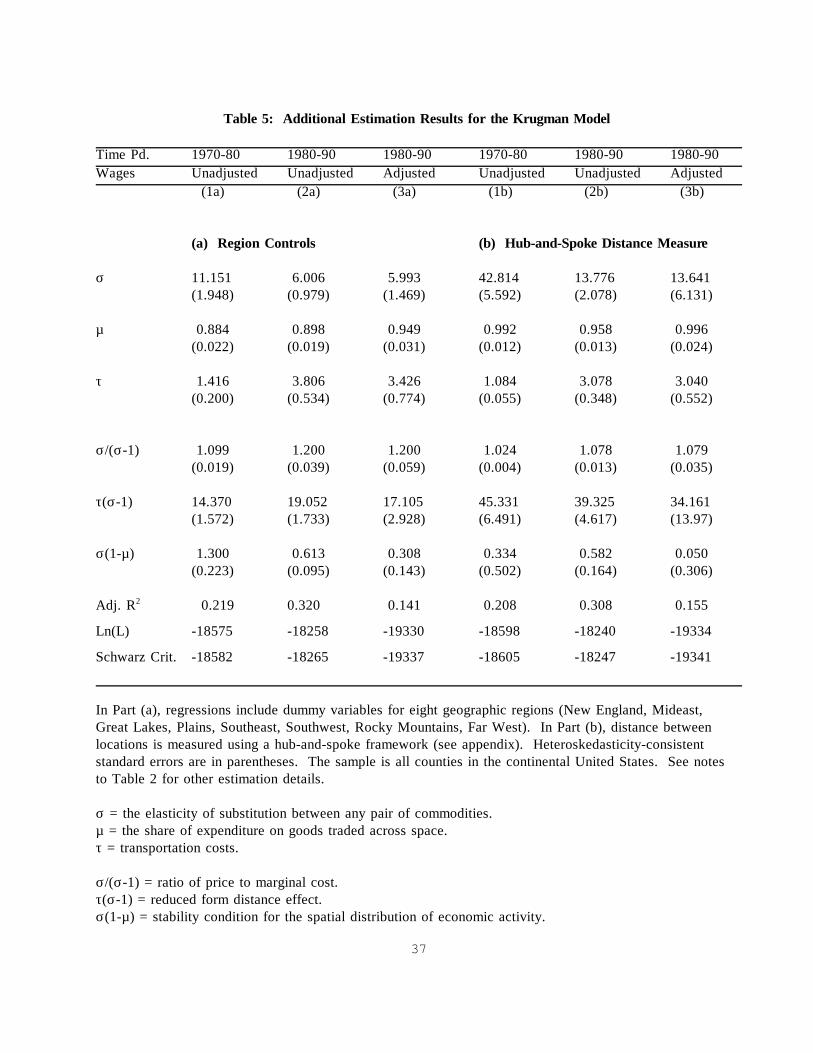
Table 5: Additional Estimation Results for the Krugman Model
Time Pd. 1970-80 1980-90 1980-90 1970-80 1980-90 1980-90Wages Unadjusted Unadjusted Adjusted Unadjusted Unadjusted Adjusted
(1a) (2a) (3a) (1b) (2b) (3b)
(a) Region Controls (b) Hub-and-Spoke Distance Measure
σ 11.151 6.006 5.993 42.814 13.776 13.641(1.948) (0.979) (1.469) (5.592) (2.078) (6.131)
µ 0.884 0.898 0.949 0.992 0.958 0.996(0.022) (0.019) (0.031) (0.012) (0.013) (0.024)
τ 1.416 3.806 3.426 1.084 3.078 3.040(0.200) (0.534) (0.774) (0.055) (0.348) (0.552)
σ/(σ-1) 1.099 1.200 1.200 1.024 1.078 1.079(0.019) (0.039) (0.059) (0.004) (0.013) (0.035)
τ(σ-1) 14.370 19.052 17.105 45.331 39.325 34.161(1.572) (1.733) (2.928) (6.491) (4.617) (13.97)
σ(1-µ) 1.300 0.613 0.308 0.334 0.582 0.050(0.223) (0.095) (0.143) (0.502) (0.164) (0.306)
Adj. R2 0.219 0.320 0.141 0.208 0.308 0.155
Ln(L) -18575 -18258 -19330 -18598 -18240 -19334
Schwarz Crit. -18582 -18265 -19337 -18605 -18247 -19341
In Part (a), regressions include dummy variables for eight geographic regions (New England, Mideast,Great Lakes, Plains, Southeast, Southwest, Rocky Mountains, Far West). In Part (b), distance betweenlocations is measured using a hub-and-spoke framework (see appendix). Heteroskedasticity-consistentstandard errors are in parentheses. The sample is all counties in the continental United States. See notesto Table 2 for other estimation details.
σ = the elasticity of substitution between any pair of commodities. µ = the share of expenditure on goods traded across space.τ = transportation costs.
σ/(σ-1) = ratio of price to marginal cost.τ(σ-1) = reduced form distance effect.σ(1-µ) = stability condition for the spatial distribution of economic activity.
37