market characteristics for technical report · characteristics related to each of these attributes,...
TRANSCRIPT
Technical Report NREL/TP-550-48192 August 2010
Market Characteristics for Efficient Integration of Variable Generation in the Western Interconnection Michael Milligan and Brendan Kirby
National Renewable Energy Laboratory 1617 Cole Boulevard, Golden, Colorado 80401-3393 303-275-3000 • www.nrel.gov
NREL is a national laboratory of the U.S. Department of Energy Office of Energy Efficiency and Renewable Energy Operated by the Alliance for Sustainable Energy, LLC
Contract No. DE-AC36-08-GO28308
Technical Report NREL/TP-550-48192 August 2010
Market Characteristics for Efficient Integration of Variable Generation in the Western Interconnection Michael Milligan and Brendan Kirby
Prepared under Task No. WE10.4231

NOTICE
This report was prepared as an account of work sponsored by an agency of the United States government. Neither the United States government nor any agency thereof, nor any of their employees, makes any warranty, express or implied, or assumes any legal liability or responsibility for the accuracy, completeness, or usefulness of any information, apparatus, product, or process disclosed, or represents that its use would not infringe privately owned rights. Reference herein to any specific commercial product, process, or service by trade name, trademark, manufacturer, or otherwise does not necessarily constitute or imply its endorsement, recommendation, or favoring by the United States government or any agency thereof. The views and opinions of authors expressed herein do not necessarily state or reflect those of the United States government or any agency thereof.
Available electronically at http://www.osti.gov/bridge
Available for a processing fee to U.S. Department of Energy and its contractors, in paper, from:
U.S. Department of Energy Office of Scientific and Technical Information P.O. Box 62 Oak Ridge, TN 37831-0062 phone: 865.576.8401 fax: 865.576.5728 email: mailto:[email protected]
Available for sale to the public, in paper, from: U.S. Department of Commerce National Technical Information Service 5285 Port Royal Road Springfield, VA 22161 phone: 800.553.6847 fax: 703.605.6900 email: [email protected] online ordering: http://www.ntis.gov/ordering.htm
Printed on paper containing at least 50% wastepaper, including 20% postconsumer waste
1
Market Characteristics for Efficient Integration of Variable Generation in the Western Interconnection1
Michael Milligan, National Renewable Energy Laboratory (NREL) Brendan Kirby, NREL consultant
Abstract The Western Electricity Coordinating Council (WECC) convened the Variable Generation Subcommittee (VGS) in 2009. The VGS was commissioned to address all issues related to the predicted increasing penetration of variable generation (wind, solar, and potentially others as discussed below) on reliability, both in the operating and planning time frames. The VGS was split into four Work Groups: Operations, Planning, Markets, and Technology. The Markets Workgroup was tasked with developing a white paper to address the role of electricity markets to help manage variable generation (VG). As part of the white paper effort, prior work from the National Renewable Energy Laboratory (NREL) was used to provide evidence of how markets help with reliable power system operation, both with and without VG. This report, adapted from prior reports and research by the authors and others, was used in the VGS Market White Paper. It is published here as a separate report, free from the space limitations of the VGS White Paper.
Introduction In this report we address the interface between electricity markets and power system operation. Effective power markets are difficult to design. In our view, a simple test of the efficiency and effectiveness of electricity markets is to show that the markets provide the required level of reliability economically. Markets that cannot do this are judged to be inefficient, and should be modified to correct this shortcoming. The overriding purpose of this report is to establish the physical requirements of a power system that can accommodate high levels of VG. We do not discuss whether any particular penetration of VG is appropriate or desirable, but endeavor to establish what is needed to accommodate high levels of VG.2
Markets, or lack of markets, are special cases of institutions. The institutions that are a part of the electricity industry can vary from reliability organizations which set operating rules, to public commissions who establish economic boundaries around other operational and financial issues. In some cases, institutional constraints may present a barrier to efficient VG integration, or more 1 Thanks to WECC’s Variable Generation Subcommittee Marketing Workgroup members for valuable comments. 2 Although we do not precisely define “high levels of VG” in this report, we are broadly referring to moderately challenging to very challenging penetrations; perhaps in the range of 15-35% or more of annual energy requirements.
2
generally, barriers to efficient power system operations. One key constraint in much of the West is the hourly scheduling and dispatch, which constrains most generators’ output levels until the top of the next hour. We discuss this and other issues later in this report. There are many approaches that can increase the interconnection’s ability to efficiently absorb high levels of VG. We do not necessarily favor one approach over another, but large electrical footprints and fast economic dispatch, however implemented, are fundamental to achieving efficient operations with high levels of VG. We also point out that these two properties of power systems also promote more efficient operation without VG; however, higher levels of VG will increase the value of these two characteristics. We also believe that, even though regional transmission organizations (RTOs) and independent system operators (ISOs) in other parts of the country can often integrate VG efficiently, we are not convinced that the RTO or ISO structures per se are required. Instead, we again emphasize that large footprints and fast schedules are key. RTOs and ISOs typically provide both of these, but non-RTOs may be able to achieve much of the benefits. Our key points can be summarized as follows:
• Based on physical requirements to operate the power system with large amounts of VG, we identify potential institutional constraints/solutions that may help inform the Western Electricity Coordinating Council.
• We do NOT intend to prescribe specific mechanisms, but we DO intend to identify the overall characteristics of institutional mechanisms needed to effectively address the physical needs of the power system.
• A simple conceptual test of institutional change is whether it identifies the specific characteristics that are needed to support reliability and that allows full access to the physical capabilities of all responsive resources (generators and responsive loads) that are capable of providing the required response.
• Although there is some evidence that we have collected from RTOs and ISOs, we emphasize that we do not believe that an RTO/ISO structure is needed to obtain a transparent institutional framework (a framework that allows seamless access to physical capabilities needed by the power system).
• Similarly, we cite analyses of balancing area (BA) configurations that help integrate VG. In some cases, these analyses examine the physical consolidation of BAs. We believe that the cited benefits can be obtained by several alternative mechanisms that collectively may be called “virtual BA consolidation.” Such mechanisms may include all or some aspects of dynamic scheduling, intra-BA scheduling at sub-hourly time steps, or other wide-area economic dispatch concepts that do not require actual consolidation of BAs. What matters is the size and dispersion of load, VG, and conventional generation fleet. Bigger is generally easier to balance, but size can be obtained either virtually or physically. For example,
3
consolidation can be physical or virtual. Both full market and historic vertically integrated utility structures can work if they provide full access to all of the responsive resources.
• A significant effort will be required to develop the tools needed to implement sub-hourly dispatch and market protocols; however, these tools will provide a substantial benefit regardless of the ultimate level of VG in the Western Interconnection. These tools will be needed within the BAs, and to achieve maximum benefits, must be coordinated across the interconnection.
• Entities can choose whether, and to what degree, they participate in the wide-area markets and other institutional mechanisms that may be an outgrowth of this analysis. However, we expect that participation will be wide-spread because of the inherent economic and reliability benefits.
• The potential solutions we describe have benefit even in a power system that has no VG. However, these benefits will be greater in systems with VG, and will generally increase with VG penetration.
Definition of VG VG technologies consist of those forms of power generation that depend on a primary energy source that varies over time and cannot be stored. It is important to distinguish between renewable energy sources and VG sources. For example, geothermal and biomass generation use renewable fuels, but because geothermal heat and biofuel can be stored, much in the same way that traditional fuels are stored and used when needed to produce power, they are not VG. VG is typically renewable, but depends on wind, sun, or water energy that cannot be stored (although separate thermal or electric storage technologies can be applied). VG technologies deliver energy on an as-available basis, and increase the level of variability and uncertainly in power system operations. The different VG technologies have different characteristics related to each of these attributes, but the fundamental challenges to power system operation of these technologies are rooted in this variability and uncertainty. Even if these energy delivery profiles could be perfectly predicted in advance, the fundamental variability would still alter at least some aspects of power system operation. The inability to precisely predict the output of VG over various time frames is not unlike what is currently experienced today with load forecasting, but the prediction of VG delivery is currently more difficult per-unit than load prediction. The ability to predict VG output varies among the various technologies, and is expected to mature over time, but, as with load, will never be perfect. Similarly, even if short-term variability were eliminated the power system would have to cope with the increased uncertainty in energy delivery. Both uncertainty and variability increase the power system’s need for reserves. Both uncertainty and variability benefit from aggregation.
4
The fundamental VG technologies that are identified in the NERC−IVGTF Summary Document (NERC, 2009) are:
• Wind energy − wind passing through a rotating turbine and generator is converted to electricity. Presently, wind energy is the fastest-growing VG technology.
• Solar energy − o Photovoltaic (PV) technology converts solar radiation directly to electricity. The
level of power output depends on the properties of the solar cell and the amount of solar radiation at any given time.
o Solar thermal technology consists of a collector system that converts solar energy to heat, and a power block that converts the heat into electricity. Concentrating solar power (CSP) plants collect solar energy with concentrating mirrors or lenses. The thermal storage inherent in the plant can be configured to provide several hours of storage, which may range from 4-6 hours based on current technology.
• Hydrokinetic energy − o Hydroelectric power utilizes energy from water flow of river basins. Hydro power
can consist of a combination of run-of-river, which is VG, and energy delivery that is controllable with the use of storage reservoirs. The latter is not VG, whereas the former is.
o Wave power converts wave energy into electricity. This technology has not matured to the point of commercialization at this time, but may be developed in the future. Specific characteristics of the energy delivery to the power system will likely be different in degree, but not in kind, to the mature VG technologies.
o Tidal generation harnesses the energy that is latent in predictable tidal flows. As such, it is likely that this source of energy contributes variability that can be relatively easily predicted, compared to other VG technologies. This technology is not mature at this time, but there are several demonstration projects operating today.
Relevant Characteristics of VG for System Operators VG itself has four principal characteristics important to power system planning and operations: the generation output is variable because the energy source (wind, solar, or hydro flow) itself is variable, many forms of VG (wind, solar, hydro) has a near-zero marginal cost, wind and some forms of VG are difficult to forecast precisely. In many cases, the resource is locationally constrained, and the best sites are often located far from load centers. Wind and solar are often described as “intermittent,” but since that term implies sudden changes in output and VG output changes vary over a period of hours—longer than the instantaneous outages that affect conventional units—we use the term “variable.” Failure to recognize these characteristics of VG will raise the financial and environmental costs of the nation’s overall electricity usage. It is important to note that the characteristics of VG are not unlike those of load. However, the magnitude of VG’s variability is greater than the variability of typical loads on a per-unit basis, and it is currently somewhat more difficult to forecast VG than load. Similarly, conventional
5
generators can fail at any time and are, consequently, uncertain. The power system maintains reserves specifically to deal with this uncertainty. Hence, the primary differences are more of degree than of kind.3
Physics and economics constrain the dispatchability of VG. The instantaneous maximum VG output is physically limited by the energy currently being supplied by the wind or sun. The zero (or negative) marginal cost of VG energy makes it desirable to use the maximum available even if it is variable and uncertain. It is always possible to reduce the variability and/or uncertainty by controlling the VG output to a level below what the wind or sun is currently supplying. In fact, most modern wind and solar plans have fast and precise control capability, typically exceeding that of most conventional generators. Exercising that control is typically unattractive for economic reasons: renewable VG is typically the lowest marginal cost and least polluting energy source available. Given the high cost of energy fuels today, the primary value of VG is in supplying energy, not capacity and not balancing control, although the different technologies will exhibit different capacity values. VG saves fuel and reduces emissions. It is also a resource with a high capital cost, but very low variable costs (fuel or operating costs). It almost always saves money to reduce production at fuel-consuming power plants instead (given sufficient flexibility in the non-VG generation fleet), and generate as much as possible at VG plants. It also generally makes more sense to reduce generation at hydro plants if they have a reservoir for storing water to take advantage of wind or solar generation. Most reservoir-based hydro systems are energy limited, so saving water with wind or solar now allows the hydro plant to supply more energy later, increasing the capacity value of the hydro system and possibly increasing the value of the hydro energy. Although modern wind turbine technology allows an operator to precisely curtail wind production when necessary, “spilling” free wind and other VG output is only desirable when it is required for reliability reasons, or in the event that wind could supply ancillary services in the future. Similarly, “spilling” solar or hydro energy is generally not desirable. Since much more wind than solar data is available, more analysis has been done on wind generation than solar, and because of the likelihood of significant wind development in the WECC over the next few years, much of the following discussion centers on wind. However, most of these issues apply similarly to solar (especially PV), with some (likely lesser) application to concentrating solar with storage. 3 We note that some non-conforming loads such as arc furnaces impose an extremely large regulation burden on the power system. Arc furnaces repeatedly cycle from zero to full load nearly instantaneously, at hundreds of MW/min ramp rate every hour they operate, whereas VG such as wind move much more slowly and only rarely impose large ramps that are still only tens of MW/min. It is not uncommon for a single arc furnace to be responsible for over half of the regulation burden for its BA (Kirby and Hurst, 2000). Anecdotal evidence from system operators indicates that these large changes in load, which can be up to 300 MW, can be adopted into standard system operations practice with experience. Similarly, there is anecdotal evidence that system operators adapt to wind generation with experience, resulting in more efficient system operation over time.
6
While annual wind and solar energy production can be forecast with reasonable accuracy (greater accuracy than annual hydro production can be forecast), it is more difficult to predict wind generation output a few hours or a few days in advance. Wind generator operators cannot commit to and follow hourly generation schedules with the same precision conventional generation operators can. Wind forecasts are getting better, however, and power system costs can be reduced when power system operators have an advanced wind forecast in the control room. The best wind resources are often located far from load centers and are frequently far from existing transmission lines. New wind plants often need significant transmission expansion before the full amount of new wind generation capacity can be accepted onto the grid and delivered to loads. Where new wind capacity precedes transmission expansion, the incremental wind generation may have to compete for transmission access with other generators and be delivered using non-firm capacity; such generation may often be curtailed due to transmission capacity limitations. A robust transmission system (coupled with sub-hourly scheduling) that allows wind and load variability to be aggregated over large areas further reduces the cost of wind integration. Therefore, wind greatly benefits from a long-term, regional approach to transmission planning. Of course, power system customers benefit from a robust regional transmission network with or without wind.
System Operation with Wind Wind’s characteristics can present challenges to the power system operator. Wind variability in itself is not unique; system operators continuously deal with load variability over all time frames from seconds to seasons. However, because wind is variable, it does add to aggregate variability. While the power system does not need to respond to the variability of each individual wind turbine, it is necessary to meet the North American Electric Reliability Corporation (NERC) reliability standards and balance aggregate load after accounting for wind generation4
4 To meet RPS goals and minimize fuel burn and operating costs, it is usually optimal to use all the VG energy that is available, adjusting the balance of generation to meet the remaining load. This load is often called the “net load” which is the native load plus exports, minus the VG. This net load is what the remainder of the system operates to.
with aggregate generation and responsive load. Adding wind to the generation mix will increase the control actions the conventional generators must take. Fortunately, wind and load variability tend to be uncorrelated, so they do not add linearly, greatly reducing the net flexibility required from the conventional generators. This is based on the principle of statistical independence, described below and confirmed through actual operations. If additional flexibility is not valued by the market or incorporated into system plans, then there may not be sufficient response capability offered, making it more difficult to balance the system. This is a key issue; there may be sufficient flexible generation and responsive load that could respond, but in the absence of a market or other institutional framework, there may be no way to access that flexibility. There
7
may even be scheduling rules that block access to physically available flexible generators or responsive load. Forecast error is not unique to wind either. System operators regularly deal with load forecast uncertainty. A one-degree weather forecast error, for example, can result in a 1000-MW summer peak-load forecast error for the California ISO. As with variability, wind forecast errors add to load forecast errors, increasing the required conventional generator flexibility. Fortunately, as with variability, wind and load forecast errors tend to be uncorrelated, reducing the total required conventional generation flexibility.5
Efficient Integration of VG
Capturing the full environmental and economic benefits of VG requires looking at the power system differently than in the past. The traditional focus on capacity must be supplemented by fully valuing energy. The difference encompasses the planning process and the optimal generation portfolio as well as operational efficiencies. This requires examining total annual fuel requirements and emissions as well as peak generation needs. Accommodating VG involves adjusting the power system structure to accept energy from VG sources when and where it is available. This involves a combination of physical attributes and institutional support and incentives to achieve the desired physical attributes for the non-VG generation characteristics of the power system. Adding VG to an existing power system does not increase the need for installed capacity (which depends on load), but may change the type of capacity required; more flexible generation with the ability to ramp more quickly, achieve lower turn-down rates (in the case of high wind penetration), and cycle more efficiently may eventually replace baseload generation that is not as flexible.6
A common objective for efficient VG integration is to minimize the cost of electricity, given the resource mix, and subject to holding reliability constant (as compared to a no-VG case). There may be trade-offs involved in this complex optimization. For example, the reliability constraint may cause the system operator to occasionally spill VG energy to avoid a reliability problem. Spilling involves an economic cost that generally should be avoided, but reductions in reliability have their own costs that may significantly exceed the cost of spillage. Other objectives include meeting required resource mixes that may be mandated by state or other governments. In the discussion that follows, the goal is to examine how to maximize the energy capture from a fleet of VG resources, given the objective of minimizing the cost of operating a power system that has significant VG penetration. The discussion begins with an examination of physical characteristics that help with efficient integration, and continues into a discussion of the market
5 We discuss this further in a later section of this report. 6 Or if economics justify the retrofitting of inflexible generation with the ability to achieve lower turn-down levels, ramp faster, or cycle more effectively those efforts may be undertaken.
8
and institutional approaches that can help deliver the required physical capability to the power system operator. Recognizing that the goal of WECC is to maintain system reliability, we argue that institutional constraints, such as the lack of large, fast energy markets or intra- and inter-BA sub-hourly scheduling, can impede reliability because access to needed flexible generation and load response is limited. As stated above, much more analysis has been performed on wind generation than solar. We expect that there will be similar impacts from PV, and to a lesser extent CSP, as from wind, although the precise magnitude of impacts on variability and uncertainty will certainly vary somewhat from those of wind. The difference is believed to be more of degree than of kind.
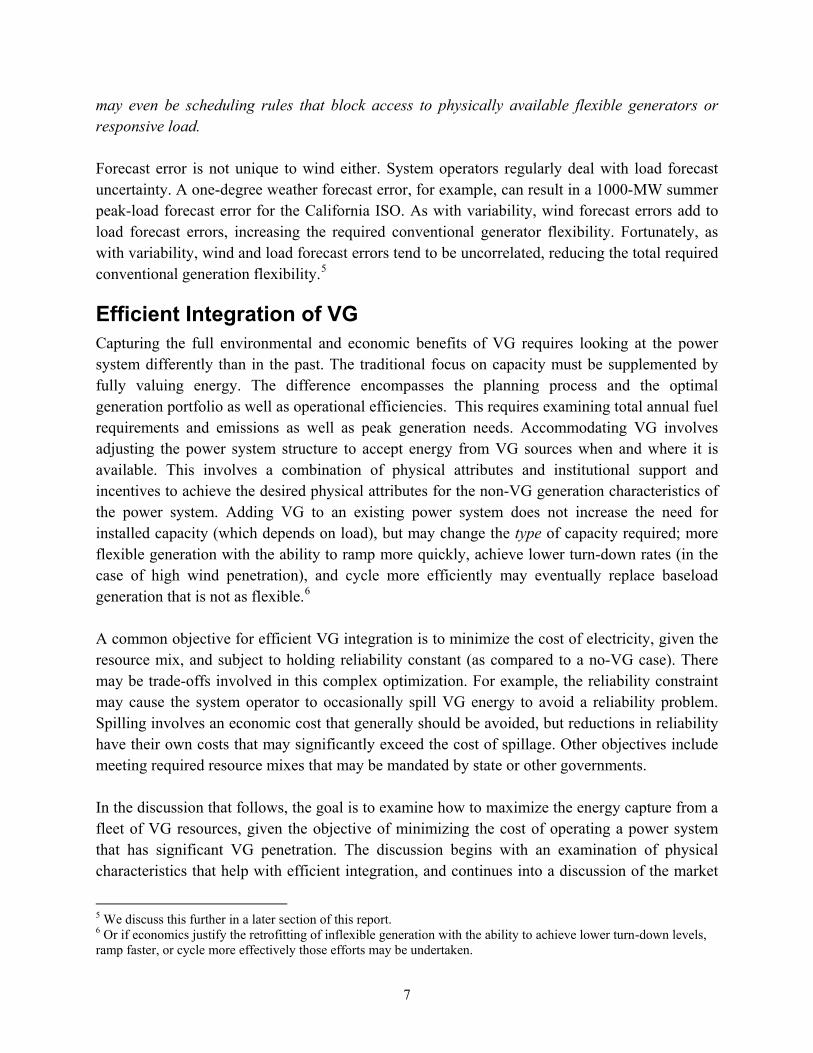
Physical Characteristics of Wind Generation, and Some That Help Efficiently Integrate Wind Energy into the Power System Large, flexible power systems make it easier to economically manage high penetrations of VG. Physical size is important because the correlation between the production levels from multiple wind plants diminishes as those plants are geographically farther apart (Figure 1). A similar characteristic occurs in solar generation, and presumably other forms of VG. In the graph below, correlation between wind farms is lowest (approaches 0) when distances between wind plants are large.
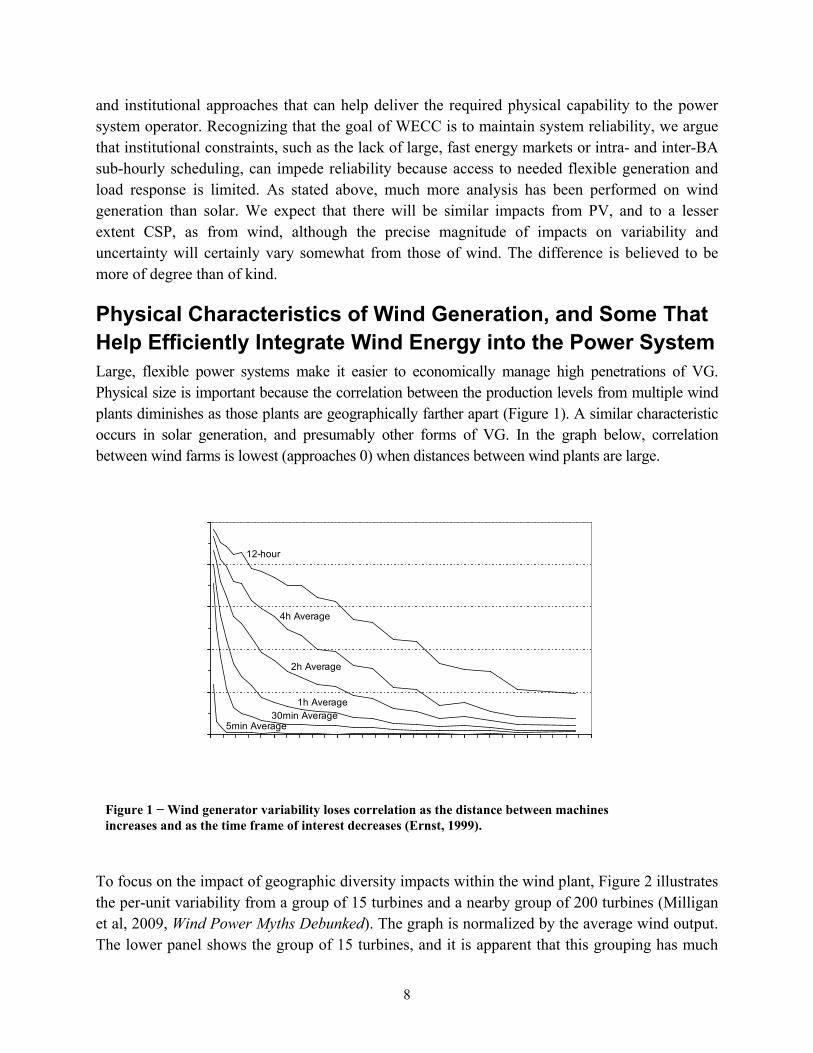
To focus on the impact of geographic diversity impacts within the wind plant, Figure 2 illustrates the per-unit variability from a group of 15 turbines and a nearby group of 200 turbines (Milligan et al, 2009, Wind Power Myths Debunked). The graph is normalized by the average wind output. The lower panel shows the group of 15 turbines, and it is apparent that this grouping has much
Figure 1 − Wind generator variability loses correlation as the distance between machines increases and as the time frame of interest decreases (Ernst, 1999).
4h Average
12-hour
1h Average30min Average
5min Average
2h Average
9
more variability per unit as compared to the upper panel. The coefficient of variation (standard deviation divided by mean) is 0.184 for the small cluster, and 0.126 for the large cluster.
Figure 2 − Geographic smoothing within a wind plant has a considerable smoothing impact using 1-second data for nearly 9 hours.
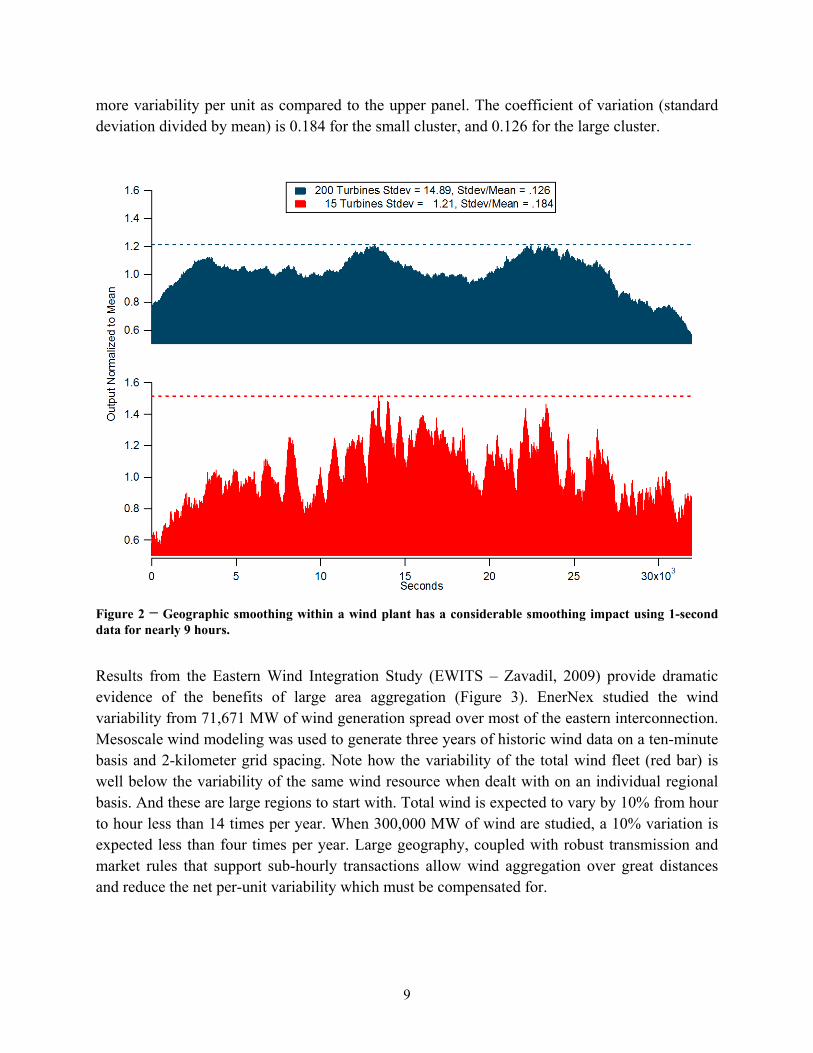
Results from the Eastern Wind Integration Study (EWITS – Zavadil, 2009) provide dramatic evidence of the benefits of large area aggregation (Figure 3). EnerNex studied the wind variability from 71,671 MW of wind generation spread over most of the eastern interconnection. Mesoscale wind modeling was used to generate three years of historic wind data on a ten-minute basis and 2-kilometer grid spacing. Note how the variability of the total wind fleet (red bar) is well below the variability of the same wind resource when dealt with on an individual regional basis. And these are large regions to start with. Total wind is expected to vary by 10% from hour to hour less than 14 times per year. When 300,000 MW of wind are studied, a 10% variation is expected less than four times per year. Large geography, coupled with robust transmission and market rules that support sub-hourly transactions allow wind aggregation over great distances and reduce the net per-unit variability which must be compensated for.
10
Figure 3 − Enernex study performed for the Eastern Wind Integration and Transmission Study (EWITS) shows a dramatic reduction in wind variability when transmission supports aggregation over a large geographic area (Zavadil, 2009).
As with load, larger geographic and electrical size also makes forecasting easier. Table 1 shows that the wind forecasting error is reduced significantly when wind output from all four regions of Germany are compared with wind output from a single region. (Rohrig, 2005) This conclusion is reinforced by Ahlstrom (2008) – when aggregated over a broad geographic region, wind forecast errors can be reduced by as much as 30% to 50%. Thus, power system operators can more accurately predict and plan for changes in wind output when their systems are larger. This is a powerful argument for forecasting VG at the regional level rather than at the VG plant level. Not surprisingly, forecasting accuracy also improves closer to real-time. It is easier to forecast for short periods ahead, compared to longer periods in the future. Markets that operate closer to real-time take advantage of the improved forecasting accuracy by allowing more frequent generator schedule changes. Hour-ahead markets better accommodate wind than day-ahead markets. Sub-hourly markets have the least forecast error. A coordinated series of regularly clearing markets at fast, sub-hourly time frames provides the best ability for conventional generation to adjust to changing wind conditions at least cost.
Hourly Wind Variability By Region Reference Scenario
0
500
1000
1500
2000
2500
3000
3500
4000
4500
-10.0% -7.5% -5.0% -2.5% 0.0% 2.5% 5.0% 7.5% 10.0%
Hourly Production Changes on Nameplate
Hou
rs p
er Y
ear
MAPP
NYISO
ISO-NE
MISO
TOTALPJM
SERC
SPP
TVA

11
The Principle of Statistical Independence Electric power systems are comprised of a very large number of components. A typical utility service territory (or market area) includes many thousands of individual customers. The behavior of these customers exhibits some statistical correlation over some time periods, but has little correlation over other periods. During the morning load pickup, customers are generally increasing their usage of electrical devices, leading to an overall increase in electric demand. However, during very short periods of time, such as seconds to minutes, some loads are increasing at the same time that other loads are decreasing. There is no correlation between these random events; one customer turns on the lights at the same time as another customer turns off the lights. These events, when they occur simultaneously, have no net impact on electrical demand. Wind turbines have a similar statistical property. During the short time periods of seconds or minutes, one wind turbine may be experiencing an increase in wind speed, resulting in more wind power output from the turbine. At the same moment, another wind turbine may experience a decline in wind speed and power output. The random nature of these events can be captured statistically, and are formally described as uncorrelated events. It is important to note that if wind turbine A always runs counter to wind turbine B, then they are perfectly negatively correlated (correlation coefficient is -1). But if sometimes the turbines move together, and other times move in opposite directions, this lack of correlation has important implications for balancing requirements. The principle of statistical independence is the reason why each increase in customer demand (resulting from a switched on light, for example) does not need to be matched by a corresponding increase in generation. Because other customers are switching off their lights at the same time, statistical methods can be used to calculate the amount of generation required to match the aggregate change in load. This principle of statistical independence over short time frames applies to loads, wind turbines, and to load and wind combined. This article illustrates this concept in several different contexts: load, wind, load and wind, and wind forecasts are all subject to the principle of statistical independence.
12
Table 1 − Wind forecasting accuracy improves when larger geographic areas are considered.
NRMSE Forecasting Error %
Germany (all 4 control zones) ~1000 km
1 German Control Zone ~350 km
Day ahead 5.7 6.8 4 hours ahead 3.6 4.7 2 hours ahead 2.6 3.5
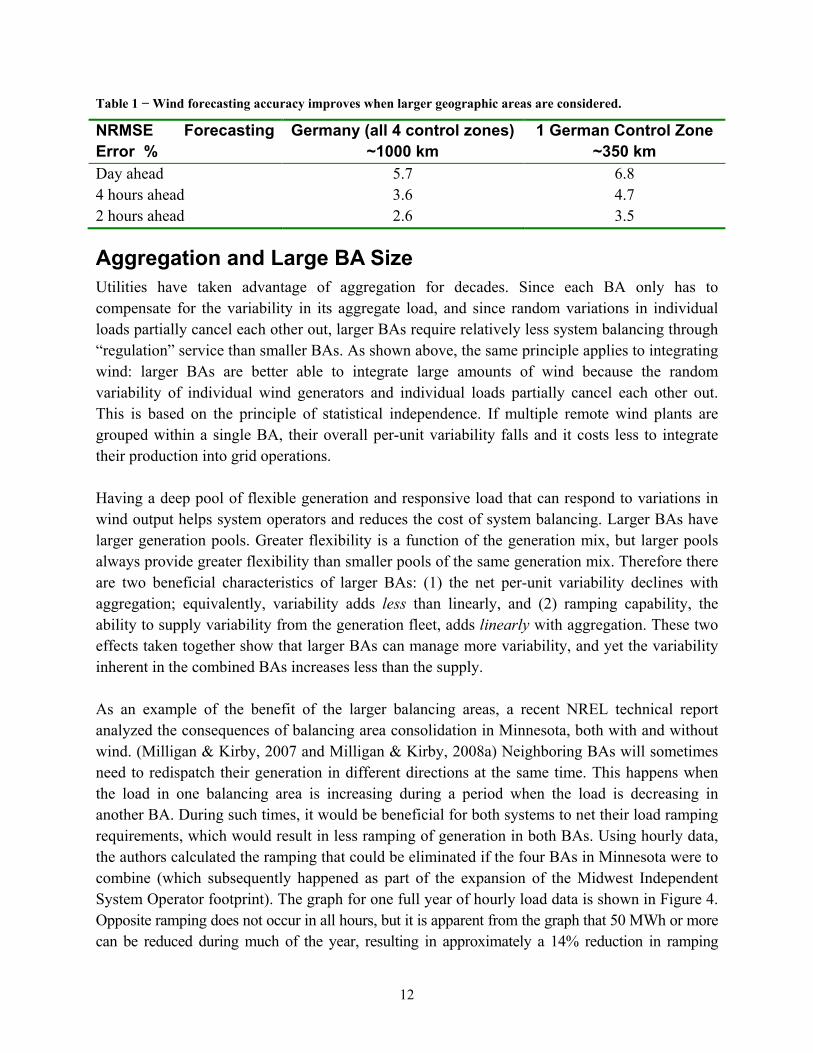
Aggregation and Large BA Size Utilities have taken advantage of aggregation for decades. Since each BA only has to compensate for the variability in its aggregate load, and since random variations in individual loads partially cancel each other out, larger BAs require relatively less system balancing through “regulation” service than smaller BAs. As shown above, the same principle applies to integrating wind: larger BAs are better able to integrate large amounts of wind because the random variability of individual wind generators and individual loads partially cancel each other out. This is based on the principle of statistical independence. If multiple remote wind plants are grouped within a single BA, their overall per-unit variability falls and it costs less to integrate their production into grid operations. Having a deep pool of flexible generation and responsive load that can respond to variations in wind output helps system operators and reduces the cost of system balancing. Larger BAs have larger generation pools. Greater flexibility is a function of the generation mix, but larger pools always provide greater flexibility than smaller pools of the same generation mix. Therefore there are two beneficial characteristics of larger BAs: (1) the net per-unit variability declines with aggregation; equivalently, variability adds less than linearly, and (2) ramping capability, the ability to supply variability from the generation fleet, adds linearly with aggregation. These two effects taken together show that larger BAs can manage more variability, and yet the variability inherent in the combined BAs increases less than the supply. As an example of the benefit of the larger balancing areas, a recent NREL technical report analyzed the consequences of balancing area consolidation in Minnesota, both with and without wind. (Milligan & Kirby, 2007 and Milligan & Kirby, 2008a) Neighboring BAs will sometimes need to redispatch their generation in different directions at the same time. This happens when the load in one balancing area is increasing during a period when the load is decreasing in another BA. During such times, it would be beneficial for both systems to net their load ramping requirements, which would result in less ramping of generation in both BAs. Using hourly data, the authors calculated the ramping that could be eliminated if the four BAs in Minnesota were to combine (which subsequently happened as part of the expansion of the Midwest Independent System Operator footprint). The graph for one full year of hourly load data is shown in Figure 4. Opposite ramping does not occur in all hours, but it is apparent from the graph that 50 MWh or more can be reduced during much of the year, resulting in approximately a 14% reduction in ramping
13
requirements (both up and down) annually when the operations were combined. This reduction in load ramping requirements translates into lower cost of serving loads in all affected BAs. In Figure 4 below, the top graph shows the load ramping movements that canceled out and need not be performed when the four Minnesota BAs were combined. Cancellation happens whenever one BA is ramping up while another is ramping down. Benefits are spread throughout the year, but can be seen to vary from hour to hour. The lower portion of Figure 4 reorganizes the same ramping information into a ramp-duration curve, which shows that, absent BA consolidation, there is as much as 75 MW of costly, unnecessary load-following generation in Minnesota attempting to compensate for the net variability of loads. This graph is based on loads only; there is no wind in the system portrayed by this graph.
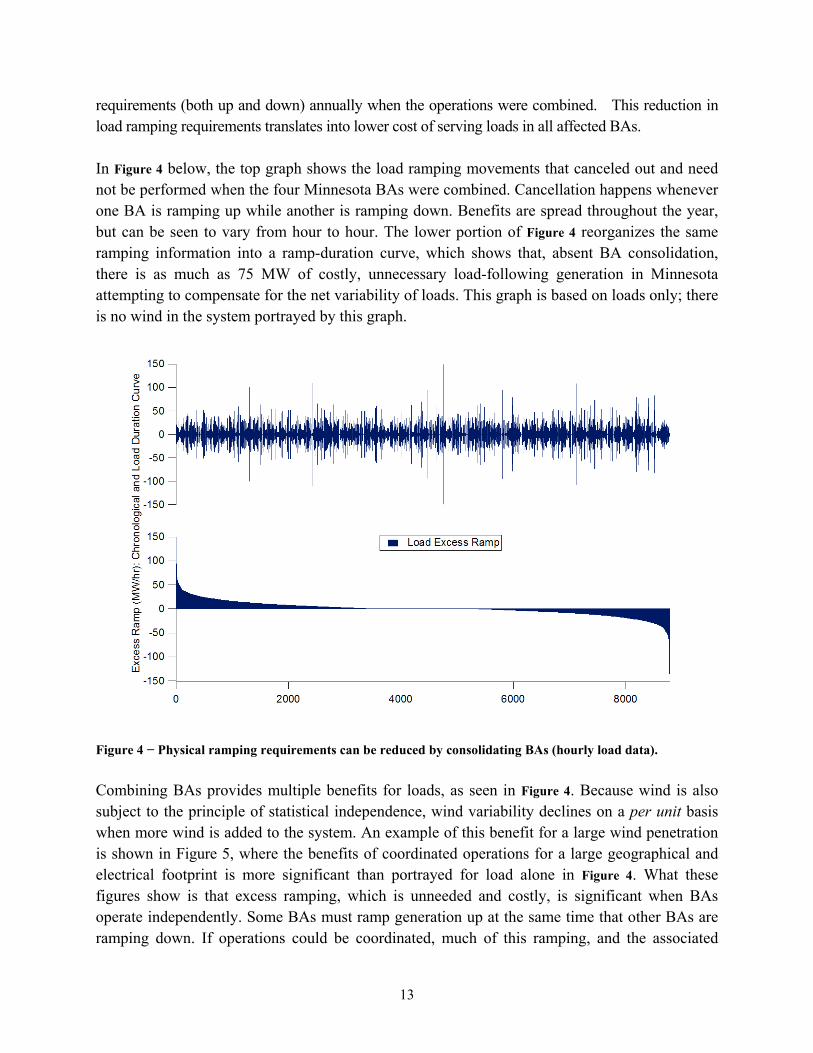
Figure 4 − Physical ramping requirements can be reduced by consolidating BAs (hourly load data). Combining BAs provides multiple benefits for loads, as seen in Figure 4. Because wind is also subject to the principle of statistical independence, wind variability declines on a per unit basis when more wind is added to the system. An example of this benefit for a large wind penetration is shown in Figure 5, where the benefits of coordinated operations for a large geographical and electrical footprint is more significant than portrayed for load alone in Figure 4. What these figures show is that excess ramping, which is unneeded and costly, is significant when BAs operate independently. Some BAs must ramp generation up at the same time that other BAs are ramping down. If operations could be coordinated, much of this ramping, and the associated
14
costs, could be eliminated. The figure shows that, with wind, the maximum unnecessary ramp is approximately 400 MW, and is matched by a -400 MW ramp. This bi-directional ramp requirement could be eliminated if the BAs would coordinate operations. BAs can be consolidated either physically or virtually. Physically combining BAs is straightforward, but may not always be desirable. Two or more BAs can retain their autonomy and still capture much of the aggregation benefit by electronically combining their Area Control Errors (ACE). Each can control to an allocated portion of the combined ACE, assuring that reliability is met at lower cost.i
Sub-hourly scheduling can provide fast access to neighboring markets, allowing trading of opposite ramping requirements.
Figure 5 − Coordinating BAs can reduce ramping requirements for systems that have significant wind and load.
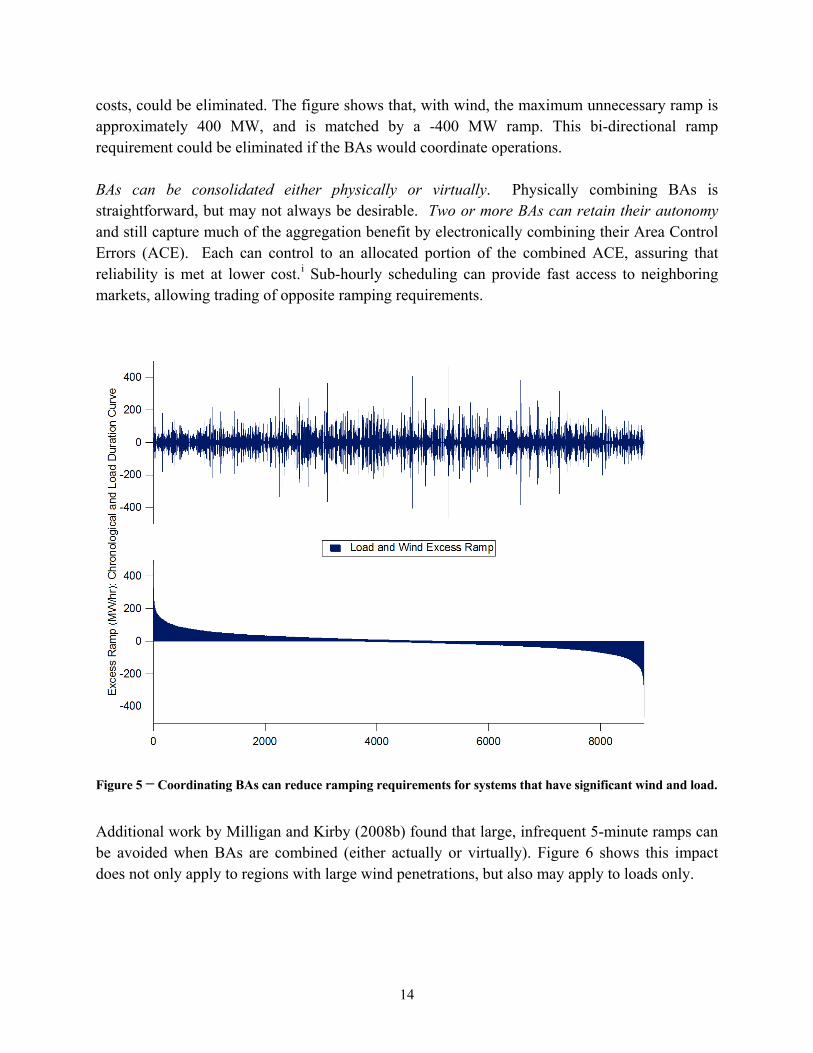
Additional work by Milligan and Kirby (2008b) found that large, infrequent 5-minute ramps can be avoided when BAs are combined (either actually or virtually). Figure 6 shows this impact does not only apply to regions with large wind penetrations, but also may apply to loads only.
15
Figure 6 − Large infrequent ramps can be significantly reduced by combining BAs.
These results are corroborated by the New York State wind integration study which found that combined operation of the eleven zones in the New York State power system reduces hourly load variability by 5% and five-minute load variability by 55%.ii
Figure 4
(GE Energy, 2005). Hourly wind variability is reduced by 33% and five-minute wind variability is reduced by 53% with state-wide operations. Hourly system variability is further reduced by 10% and five-minute system variability is reduced by 15% when wind and load are considered together. Note that while operating large BAs helps reduce the cost of wind integration, it also helps reduce the cost of serving load with or without wind (as pointed out in for the no-wind case). The benefits of large electricity markets apply to systems around the world. In a recent report for the International Energy Agency (Holttinen et al, 2007), the authors conclude “Larger balancing area size and wind aggregation: both load and generation benefit from the statistics of large numbers as they are aggregated over larger geographical areas. Larger balancing areas make wind plant aggregation possible. The forecasting accuracy improves as the geographic scope of the forecast increases; due to the decrease in correlation of wind plant output with distance, the
16
variability of the output decreases as more plants are aggregated. On a shorter time scale, this translates into a reduction in reserve requirements; on a longer time scale, it produces some smoothing effect on the capacity value. Larger balancing areas also give access to more balancing units.” (page 107).
The Value of Energy Markets Markets help economically and reliably integrate wind both in how they treat wind generators and in how they treat conventional generators. Markets that allow variable resources to sell excess energy or purchase shortages at transparent and fair prices accommodate the natural characteristics of wind while reflecting the true real-time cost of maintaining reliability. More generally, generation scheduling rules and the energy market structure itself are the most important factors in tapping the physical flexibility of the conventional generation fleet. Sub-hourly energy markets provide economic signals that make it profitable for conventional generators to respond to fluctuations in load and wind. Scheduling rules that restrict generators to hourly movements artificially hobble the conventional generation fleet, resulting in lost opportunities for those generators and increased costs for all. Markets that encourage conventional generation movement when it helps increase reliability, and do not restrict generators to only changing output at the top of each hour, reduce costs. Markets can provide direct economic incentives for generation flexibility if the current fleet does not have enough. RTOs and ISOs in the United States have fast energy markets, which result in a new economic dispatch every 5 to 15 minutes, depending on the market.7 The fast energy markets (not the RTO or ISO structure, per se) make it possible to hold the regulating units closer to their preferred operating point because they can be brought back to the mid-point of their operating range much faster than if the redispatch did not occur for an hour. Therefore, there is less need for regulation in faster energy markets.8
This results in a significant reduction in costs because regulation is typically the most expensive ancillary service. Thus, when calculating wind integration costs, features that reduce balancing costs will generally lead to lower wind integration costs.
We emphasize that it is not the nature of the ISO/RTO that is critical for this analysis; rather it is the nature of the energy markets operating sub-hourly and the inclusion of all of the generators within the region, along with the large geographic scope and allowing/encouraging demand response. The same basic operating improvements could be achieved by inter-BA coordination,
7 Economic dispatch is the change in the unit’s output in response to changing load or other conditions on the system. Markets are institutions that provide access to faster economic dispatch. An hourly market provides access once an hour, whereas a 5-minute market allows generators to be economically dispatched each 5-minute period, depending on prices and costs. 8 The same result can be achieved through a conventional economic dispatch without the need for a market if all of the generators (and responsive loads) in the region are included.

17
involving fast energy scheduling and transfers between BAs as long as all of the generators can be redispatched every few minutes. Enhancing the flexibility of the conventional generation fleet helps to accommodate wind. This can involve valuing physical flexibility as other generators are built: fast-start generators, lower minimum load capability, low cycling costs, and high ramp rates are all valuable. Valuing this flexibility properly should result in (1) sufficient levels of installed flexible resources, with the ability to provide the desired ramping and minimum generation levels, and (2) the economic incentive to induce the operation of these flexible units when needed. These represent long-run and short-run price signals. We include two analyses; a relatively detailed analysis of the NYISO market, followed by discussion of results from several markets. We then turn to summaries of wind integration experience in Europe.
Load Following As a Byproduct of Fast Energy Markets or the Economic Dispatch Stack When wind is providing energy to its native BA, Milligan and Kirby (2009) have shown that there is no need for additional capacity relative to the no-wind case. It is clear, however, that wind will likely impose additional ramping (dC/dt, the derivative of capacity with respect to time) requirements on the system. Ramping does not require additional capacity; rather, it involves using the existing capacity differently. Before discussing the impact of wind on ramping in more detail, we first examine the relationship between load following and energy markets. Our discussion can easily be applied to vertically integrated utilities that practice economic dispatch, however, for the discussion we focus on the case of an open energy market partly because of the publicly available long price signal data sets from these markets. To sell energy into a market, it is necessary for the generator to be maneuvered to the appropriate level of output. Baseload units are typically not required to maneuver much because they supply energy around the clock at a constant rate. The unit commitment process selects the unit for operation; the unit is started and brought to its rated capacity over a period of hours. The low operating cost of baseload units (below the market clearing price) allows them to participate in energy markets by continuously operating at their full economic output. Intermediate and peaking units operate differently. Their somewhat higher operating cost is not always below the energy market clearing price, so they do not participate in the market unless the clearing price is at or above their cost of generation. These units may not run at night or on weekends when prices are low, for example, but instead operate and sell energy during the day. In order to sell into a given hourly market, the intermediate unit must position itself so that it can sell the prescribed energy for the duration of the market period. In subsequent market periods,

18
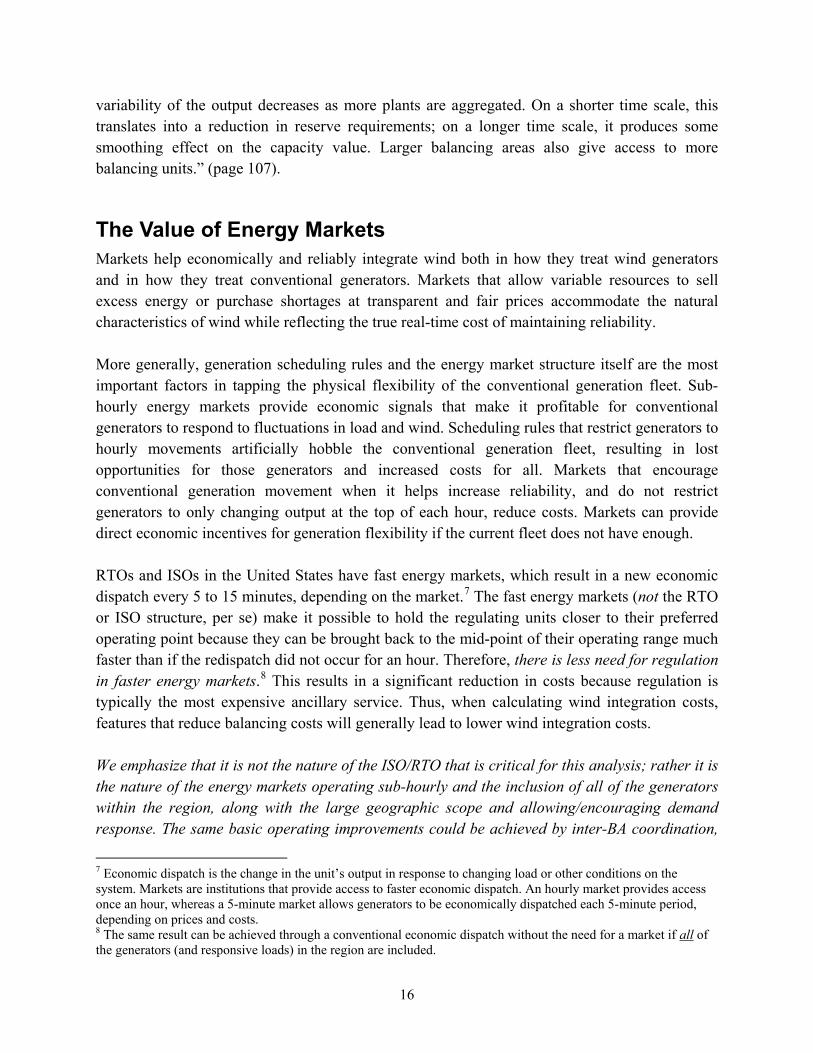
the generator must again move to a new output level if it will sell more or less energy than in the first period, depending on its operating cost and the market clearing price. Failure to respond to market prices seriously hurts an intermediate unit’s ability to make money. The unit incurs a lost opportunity cost if the market price is high and it does not turn on and ramp up to sell. Similarly, the intermediate unit loses money if the market price is below its operating cost and it does not turn off or minimize production. Energy markets are able to obtain a great deal of load following response (a capacity service) from intermediate and peaking generators without explicitly paying for load following capacity. This is very different from regulation where the system operator must purchase a specific regulation ancillary service. Most of the time the intermediate and peaking units can position themselves as needed, and each interconnection has procedures for allowing for the required ramps so that at the top of the hour, units have achieved their desired level of output. However, there are times when the generators can’t move quickly enough, which results in very high energy prices for a short duration of time. This situation can arise if the dispatch stack is not sufficiently deep or if sufficient ramping capability does not exist. Figure 7 shows an example of a baseload unit that is on the margin that is unable to ramp quickly enough between 8:30 AM and 9:00 AM to meet the load, which ramps quickly during this time. Instead, fast maneuverable generation, such as a peaking unit with very high marginal cost, must be dispatched to cover the ramp. Once the baseload unit catches up to the load, the peaking unit is no longer needed. If the energy price is set based on the marginal unit, the energy price will rise from $10.00/MWh at 8:30 AM to $90/MWh from 8:30 AM - 12:30 PM, and then fall back to $10/MWh. In this case, the energy price spikes because the marginal generator is not nimble enough to fully participate in the energy market starting at 9:00 AM.
19
Figure 7 – Load following is a distinct service that is needed if ramping capability impacts the energy market unit selection.
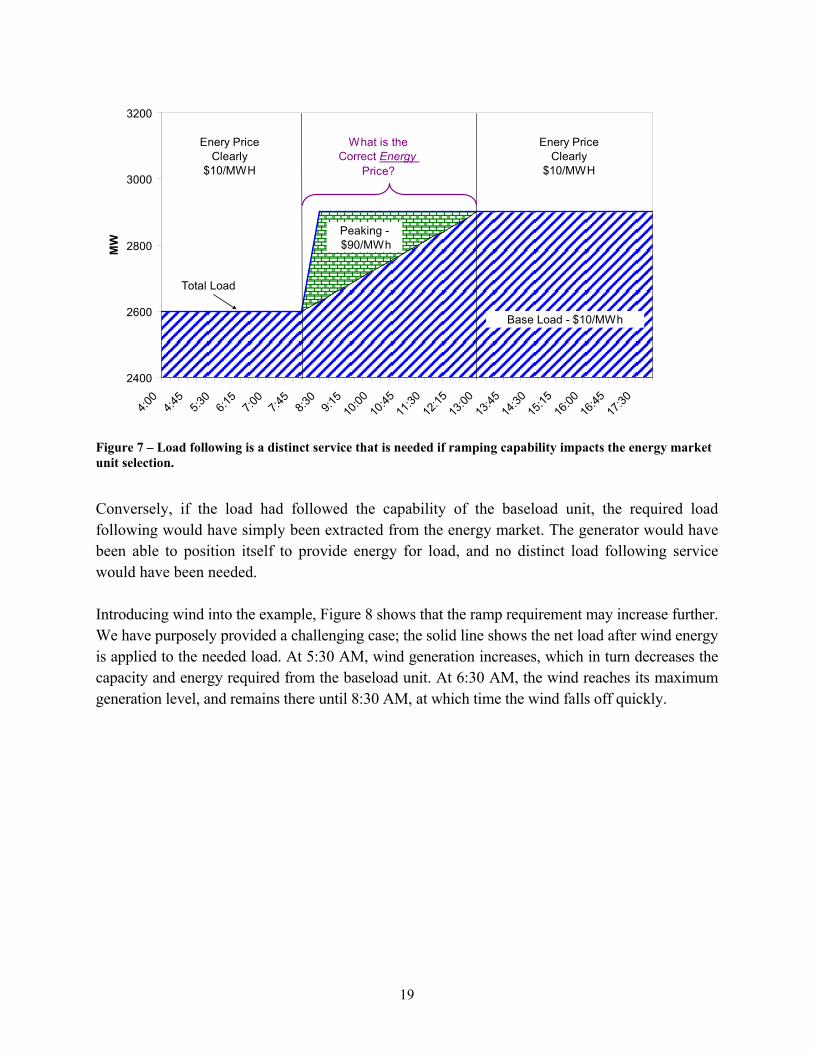
Conversely, if the load had followed the capability of the baseload unit, the required load following would have simply been extracted from the energy market. The generator would have been able to position itself to provide energy for load, and no distinct load following service would have been needed. Introducing wind into the example, Figure 8 shows that the ramp requirement may increase further. We have purposely provided a challenging case; the solid line shows the net load after wind energy is applied to the needed load. At 5:30 AM, wind generation increases, which in turn decreases the capacity and energy required from the baseload unit. At 6:30 AM, the wind reaches its maximum generation level, and remains there until 8:30 AM, at which time the wind falls off quickly.
2400
2600
2800
3000
3200
4:00
4:45
5:30
6:15
7:00
7:45
8:30
9:15
10:00
10:45
11:30
12:15
13:00
13:45
14:30
15:15
16:00
16:45
17:30
MW
Base Load - $10/MWh
Peaking - $90/MWh
Total Load
Enery Price Clearly
$10/MWH
Enery Price Clearly
$10/MWH
What is the Correct Energy
Price?
20
Figure 8 – Wind energy can increase ramping requirements and provides additional energy, but does not require more capacity.
When the wind picks up at 5:30 AM, the baseload generation reduces its output. Although in our example we assume that there is sufficient downward flexibility, this need not be the case. When the wind begins to reduce output at 8:30 AM, the ramp requirement is even steeper than in the no-wind case, which required a peaking unit to pick up the ramp. Clearly, in this example, wind has increased the need for load following and additional peaking capacity (or other fast-ramping unit) is required to maintain system balance. In this example, no additional capacity is needed to maintain system balance. The wind reduces the conventional capacity usage from 5:30 AM - 9:00 AM and imposes an additional downward ramp requirement on the base unit. Wind further exacerbates the ramping shortfall from 8:30 AM - 9:00 AM, but does not require additional capacity to serve the load. Instead, wind imposes a need for more flexible capacity. If that flexibility cannot be provided from the energy market, it must be provided by a load following market or by emergency provisions.
Market Evidence from New York Independent System Operator (NYISO) Data Existing energy markets provide evidence that load following can be provided by energy market movements. Clearly, all hourly markets follow the rise and fall in generation required to match the daily load pattern without resorting to a special load-following charge. Energy prices during the afternoon are simply higher than energy prices in the middle of the night. Data from sub-
2400
2600
2800
3000
3200
4:00
4:45
5:30
6:15
7:00
7:45
8:30
9:15
10:00
10:45
11:30
12:15
13:00
13:45
14:30
15:15
16:00
16:45
17:30
MW
Base Load - $10/MWh
Peaking - $90/MWh
Total Load
Enery Price Clearly
$10/MWH
Enery Price Clearly
$10/MWH
What is the Correct Energy
Price?
Wind Energy
21
hourly energy markets show that faster generator response is also provided from energy markets without resorting to a special load-following charge. An examination of sub-hourly energy markets shows that the energy markets themselves provide an incentive for generators to respond to power system needs for movement, and they do it without incurring costs to customers. ERCOT, PJM, NYISO, ISONE, MISO, and CAISO9
all operate sub-hourly energy markets which are capable of responding to wind and load variability, and forecast error. We examined a year of sub-hourly price data from NYISO.
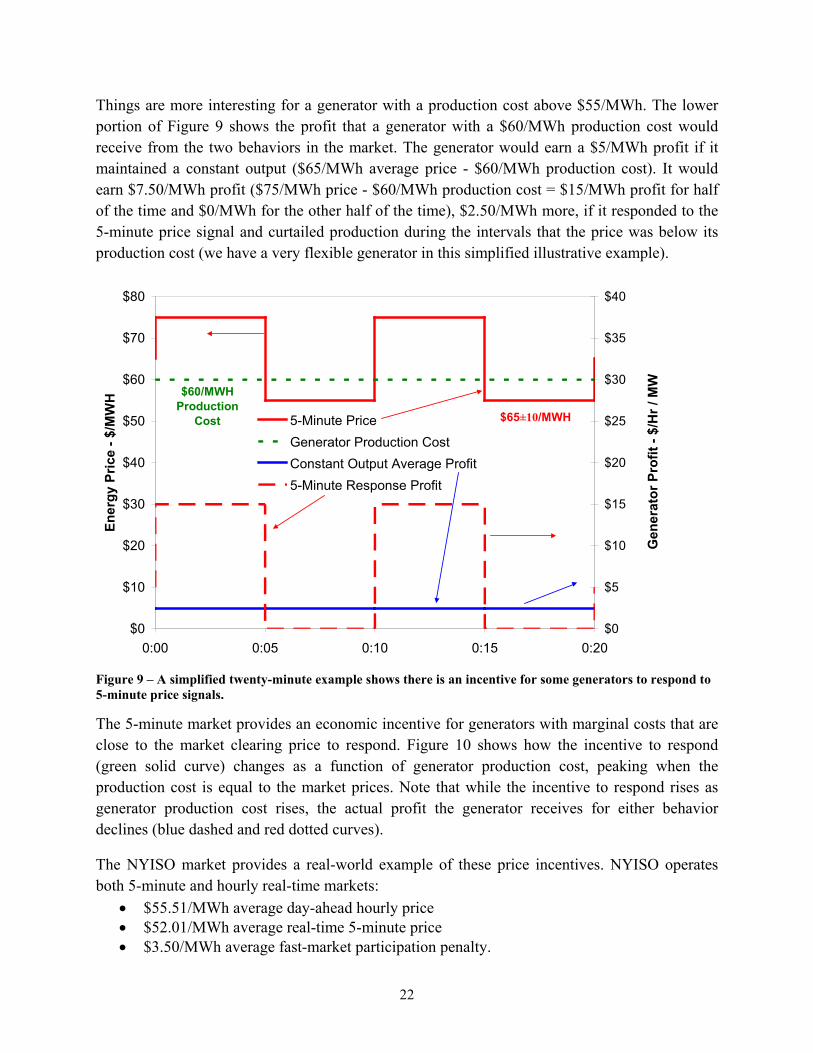
Examination of price data from the NYISO 5-minute real-time market provides insights into how load following can be extracted from sub-hourly energy markets at little or no cost. NYISO 5-minute real-time energy market price-data was examined for all of 2006 to determine if there is a cost associated with obtaining sub-hourly response from generators. Clearly, obtaining minute-to-minute response is costly since regulation is always the most expensive ancillary service, with prices that remain high even at night. Presumably then, 5-minute response would be more expensive than hourly response. NYISO data provides some surprising results. Regulation markets specifically procure maneuvering capacity from generators. When a generator sells a MW of capacity to the regulation market for an hour, the generator gives the system operator the right to move the generator’s real power output anywhere within the sold range in whatever manner the system operator desires. Generators participating in sub-hourly energy markets, on the other hand, do not sell control; they simply respond to energy price signals. Further, prices seldom go to zero or negative. This means that a generator’s response incentive in any given sub-hourly interval depends on the generator’s production cost; some generators will have an incentive to respond, and others will not. Any are free to maintain a constant output and accept the hourly average price if their maneuvering cost is too high. Studying a year of 5-minute price data, we found that the NYISO 5-minute market provides a significant response incentive with the high and low prices for each interval in the hour differing by $17.41/MWh on average. The market is continuously sending the 5-minute market a strong price signal to move up or down. Figure 9 presents a simplified twenty minute example. Market prices are shown in the upper part of the graph. The 5-minute market price varies for every interval between $55/MWh and $75/MWh. Clearly, any generator with a production cost below $55/MWh will provide full output continuously, and will have no incentive to maneuver because it is making a profit during every interval.
9 Electric Reliability Council of Texas (ERCOT), PJM Interconnection (PJM), Independent System Operator of New England (ISONE), Midwest Independent System Operator (MISO), California Independent System Operator (CAISO)
22
Things are more interesting for a generator with a production cost above $55/MWh. The lower portion of Figure 9 shows the profit that a generator with a $60/MWh production cost would receive from the two behaviors in the market. The generator would earn a $5/MWh profit if it maintained a constant output ($65/MWh average price - $60/MWh production cost). It would earn $7.50/MWh profit ($75/MWh price - $60/MWh production cost = $15/MWh profit for half of the time and $0/MWh for the other half of the time), $2.50/MWh more, if it responded to the 5-minute price signal and curtailed production during the intervals that the price was below its production cost (we have a very flexible generator in this simplified illustrative example).
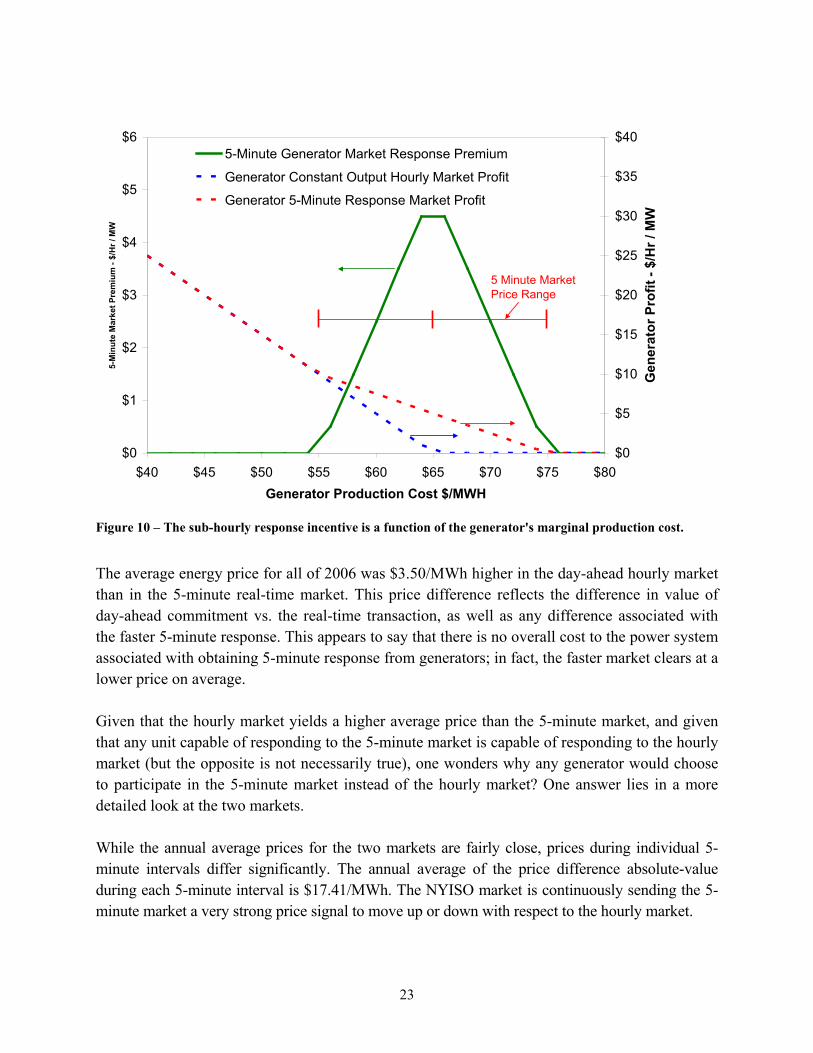
Figure 9 – A simplified twenty-minute example shows there is an incentive for some generators to respond to 5-minute price signals. The 5-minute market provides an economic incentive for generators with marginal costs that are close to the market clearing price to respond. Figure 10 shows how the incentive to respond (green solid curve) changes as a function of generator production cost, peaking when the production cost is equal to the market prices. Note that while the incentive to respond rises as generator production cost rises, the actual profit the generator receives for either behavior declines (blue dashed and red dotted curves).
The NYISO market provides a real-world example of these price incentives. NYISO operates both 5-minute and hourly real-time markets:
• $55.51/MWh average day-ahead hourly price • $52.01/MWh average real-time 5-minute price • $3.50/MWh average fast-market participation penalty.
$0
$10
$20
$30
$40
$50
$60
$70
$80
0:00 0:05 0:10 0:15 0:20
Ener
gy P
rice
- $/M
WH
$0
$5
$10
$15
$20
$25
$30
$35
$40
Gen
erat
or P
rofit
- $/
Hr /
MW
5-Minute PriceGenerator Production CostConstant Output Average Profit5-Minute Response Profit
$65±10/MWH
$60/MWHProduction
Cost
23
Figure 10 – The sub-hourly response incentive is a function of the generator's marginal production cost.
The average energy price for all of 2006 was $3.50/MWh higher in the day-ahead hourly market than in the 5-minute real-time market. This price difference reflects the difference in value of day-ahead commitment vs. the real-time transaction, as well as any difference associated with the faster 5-minute response. This appears to say that there is no overall cost to the power system associated with obtaining 5-minute response from generators; in fact, the faster market clears at a lower price on average. Given that the hourly market yields a higher average price than the 5-minute market, and given that any unit capable of responding to the 5-minute market is capable of responding to the hourly market (but the opposite is not necessarily true), one wonders why any generator would choose to participate in the 5-minute market instead of the hourly market? One answer lies in a more detailed look at the two markets. While the annual average prices for the two markets are fairly close, prices during individual 5-minute intervals differ significantly. The annual average of the price difference absolute-value during each 5-minute interval is $17.41/MWh. The NYISO market is continuously sending the 5-minute market a very strong price signal to move up or down with respect to the hourly market.
$0
$1
$2
$3
$4
$5
$6
$40 $45 $50 $55 $60 $65 $70 $75 $80Generator Production Cost $/MWH
5-M
inut
e M
arke
t Pre
miu
m -
$/H
r / M
W
$0
$5
$10
$15
$20
$25
$30
$35
$40
Gen
erat
or P
rofit
- $/
Hr /
MW
5-Minute Generator Market Response Premium
Generator Constant Output Hourly Market Profit
Generator 5-Minute Response Market Profit
5 Minute MarketPrice Range
24
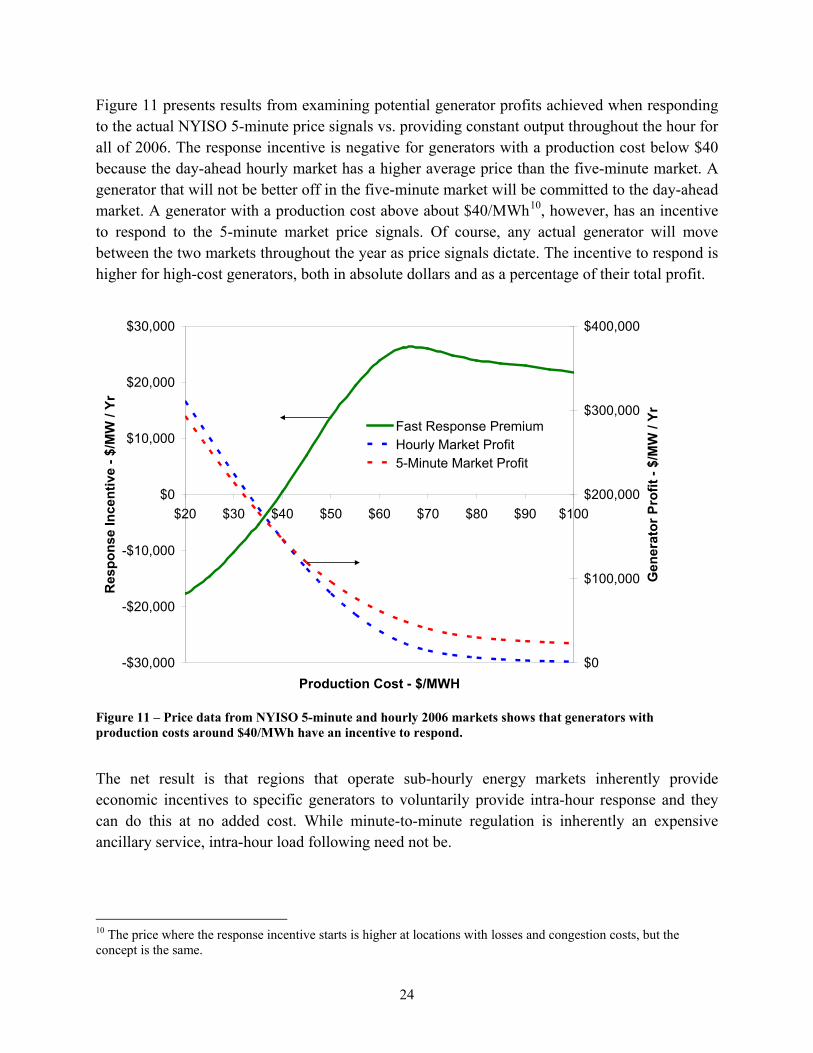
Figure 11 presents results from examining potential generator profits achieved when responding to the actual NYISO 5-minute price signals vs. providing constant output throughout the hour for all of 2006. The response incentive is negative for generators with a production cost below $40 because the day-ahead hourly market has a higher average price than the five-minute market. A generator that will not be better off in the five-minute market will be committed to the day-ahead market. A generator with a production cost above about $40/MWh10
, however, has an incentive to respond to the 5-minute market price signals. Of course, any actual generator will move between the two markets throughout the year as price signals dictate. The incentive to respond is higher for high-cost generators, both in absolute dollars and as a percentage of their total profit.
Figure 11 – Price data from NYISO 5-minute and hourly 2006 markets shows that generators with production costs around $40/MWh have an incentive to respond.
The net result is that regions that operate sub-hourly energy markets inherently provide economic incentives to specific generators to voluntarily provide intra-hour response and they can do this at no added cost. While minute-to-minute regulation is inherently an expensive ancillary service, intra-hour load following need not be.
10 The price where the response incentive starts is higher at locations with losses and congestion costs, but the concept is the same.
-$30,000
-$20,000
-$10,000
$0
$10,000
$20,000
$30,000
$20 $30 $40 $50 $60 $70 $80 $90 $100
Production Cost - $/MWH
Res
pons
e In
cent
ive
- $/M
W /
Yr
$0
$100,000
$200,000
$300,000
$400,000
Gen
erat
or P
rofit
- $/
MW
/ Yr
Fast Response PremiumHourly Market Profit5-Minute Market Profit
25
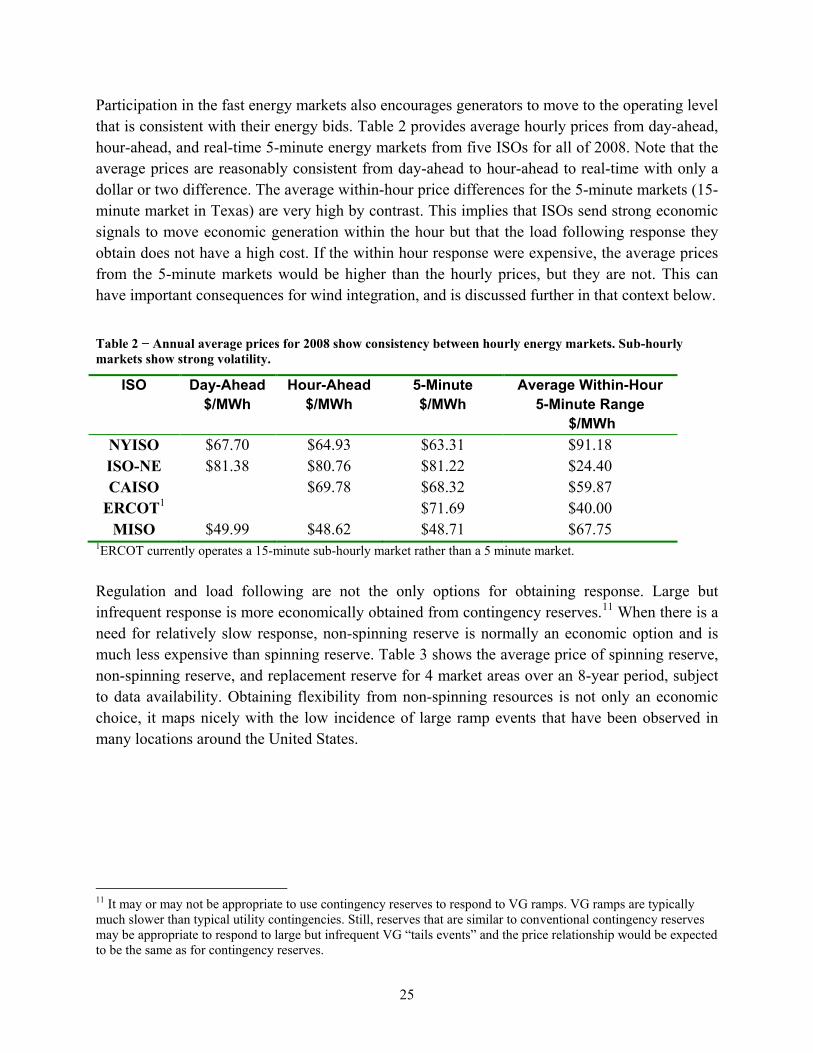
Participation in the fast energy markets also encourages generators to move to the operating level that is consistent with their energy bids. Table 2 provides average hourly prices from day-ahead, hour-ahead, and real-time 5-minute energy markets from five ISOs for all of 2008. Note that the average prices are reasonably consistent from day-ahead to hour-ahead to real-time with only a dollar or two difference. The average within-hour price differences for the 5-minute markets (15-minute market in Texas) are very high by contrast. This implies that ISOs send strong economic signals to move economic generation within the hour but that the load following response they obtain does not have a high cost. If the within hour response were expensive, the average prices from the 5-minute markets would be higher than the hourly prices, but they are not. This can have important consequences for wind integration, and is discussed further in that context below.
Table 2 − Annual average prices for 2008 show consistency between hourly energy markets. Sub-hourly markets show strong volatility.
ISO Day-Ahead $/MWh
Hour-Ahead $/MWh
5-Minute $/MWh
Average Within-Hour 5-Minute Range
$/MWh NYISO $67.70 $64.93 $63.31 $91.18 ISO-NE $81.38 $80.76 $81.22 $24.40 CAISO $69.78 $68.32 $59.87
ERCOT1 $71.69 $40.00 MISO $49.99 $48.62 $48.71 $67.75
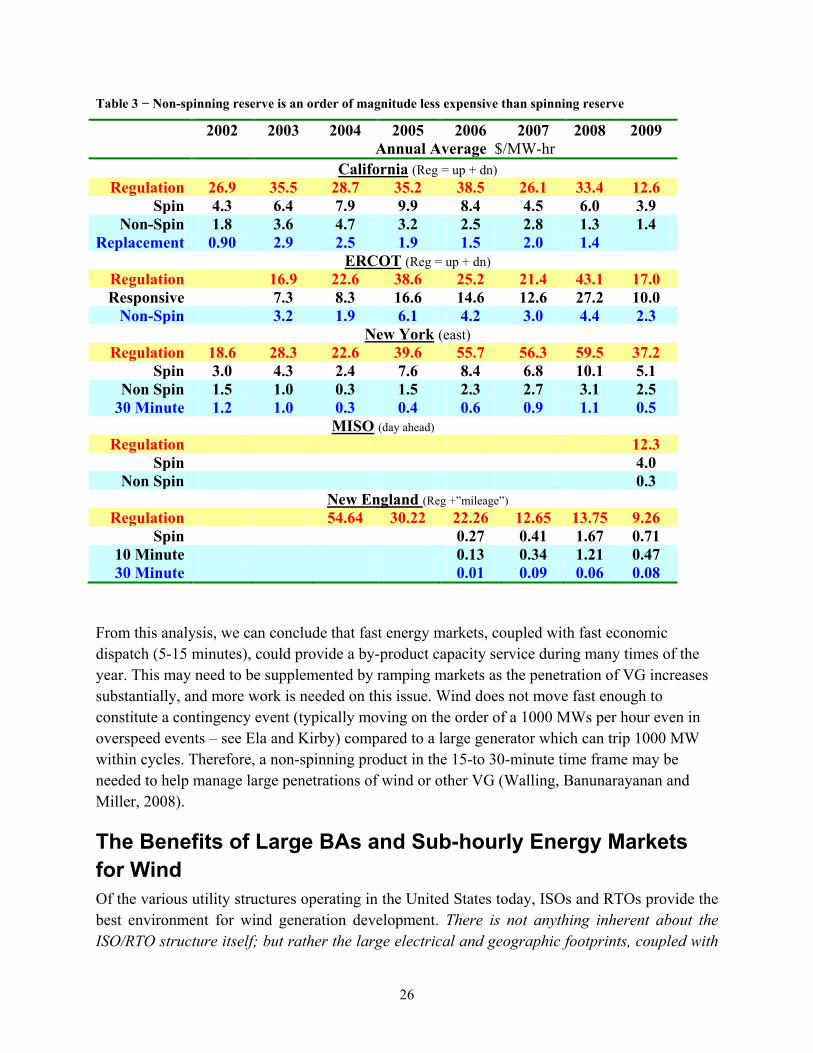
1ERCOT currently operates a 15-minute sub-hourly market rather than a 5 minute market. Regulation and load following are not the only options for obtaining response. Large but infrequent response is more economically obtained from contingency reserves.11
When there is a need for relatively slow response, non-spinning reserve is normally an economic option and is much less expensive than spinning reserve. Table 3 shows the average price of spinning reserve, non-spinning reserve, and replacement reserve for 4 market areas over an 8-year period, subject to data availability. Obtaining flexibility from non-spinning resources is not only an economic choice, it maps nicely with the low incidence of large ramp events that have been observed in many locations around the United States.
11 It may or may not be appropriate to use contingency reserves to respond to VG ramps. VG ramps are typically much slower than typical utility contingencies. Still, reserves that are similar to conventional contingency reserves may be appropriate to respond to large but infrequent VG “tails events” and the price relationship would be expected to be the same as for contingency reserves.
26
Table 3 − Non-spinning reserve is an order of magnitude less expensive than spinning reserve
2002 2003 2004 2005 2006 2007 2008 2009 Annual Average $/MW-hr
California (Reg = up + dn) Regulation 26.9 35.5 28.7 35.2 38.5 26.1 33.4 12.6
Spin 4.3 6.4 7.9 9.9 8.4 4.5 6.0 3.9 Non-Spin 1.8 3.6 4.7 3.2 2.5 2.8 1.3 1.4
Replacement 0.90 2.9 2.5 1.9 1.5 2.0 1.4 ERCOT (Reg = up + dn)
Regulation 16.9 22.6 38.6 25.2 21.4 43.1 17.0 Responsive 7.3 8.3 16.6 14.6 12.6 27.2 10.0
Non-Spin 3.2 1.9 6.1 4.2 3.0 4.4 2.3 New York (east)
Regulation 18.6 28.3 22.6 39.6 55.7 56.3 59.5 37.2 Spin 3.0 4.3 2.4 7.6 8.4 6.8 10.1 5.1
Non Spin 1.5 1.0 0.3 1.5 2.3 2.7 3.1 2.5 30 Minute 1.2 1.0 0.3 0.4 0.6 0.9 1.1 0.5
MISO (day ahead) Regulation 12.3
Spin 4.0 Non Spin 0.3 New England (Reg +”mileage”)
Regulation 54.64 30.22 22.26 12.65 13.75 9.26 Spin 0.27 0.41 1.67 0.71
10 Minute 0.13 0.34 1.21 0.47 30 Minute 0.01 0.09 0.06 0.08
From this analysis, we can conclude that fast energy markets, coupled with fast economic dispatch (5-15 minutes), could provide a by-product capacity service during many times of the year. This may need to be supplemented by ramping markets as the penetration of VG increases substantially, and more work is needed on this issue. Wind does not move fast enough to constitute a contingency event (typically moving on the order of a 1000 MWs per hour even in overspeed events – see Ela and Kirby) compared to a large generator which can trip 1000 MW within cycles. Therefore, a non-spinning product in the 15-to 30-minute time frame may be needed to help manage large penetrations of wind or other VG (Walling, Banunarayanan and Miller, 2008).
The Benefits of Large BAs and Sub-hourly Energy Markets for Wind Of the various utility structures operating in the United States today, ISOs and RTOs provide the best environment for wind generation development. There is not anything inherent about the ISO/RTO structure itself; but rather the large electrical and geographic footprints, coupled with
27
large open markets that provide these benefits for VG integration. The sub-hourly balancing markets can tap the physical maneuvering capabilities of the conventional generators. Balancing payments are typically based upon cost causation rather than on arbitrary penalties.12
www.uwig.org A summary
of utility industry research by the Utility Wind Integration Group (UWIG - ) states that “well-functioning hour-ahead and day-ahead markets provide the best means of addressing the variability in wind plant output.” This assertion is based on evidence from wind integration studies such as GE Energy (2005) for the NYISO. Markets are also cited as helping with wind integration in the International Energy Agency (IEA) report on wind integration on large power systems (Holtinnen, 2007) and by Smith et. al., (2007). The UWIG document also says that, “consolidation of balancing areas or the use of dynamic scheduling can improve system reliability and reduce the cost of integrating additional wind generation into electric system operation.” This is also based on evidence from New York (GE Energy, 2005) and Minnesota (Zavadil, 2006, and Milligan & Kirby, 2007). In this report, we do not specify the time period over which the energy market should run. Markets in the United States have been run at intervals that include 5 minutes, 10 minutes, and hourly. Generally, faster markets reduce the institutional constraints for obtaining flexibility from the physical generation. For example, a 15-minute market performs a new economic dispatch every 15 minutes. Units that participate in this dispatch hold their output flat during the 15-minute period, with the exception of ramps that are required to maneuver into the required position for the next market period. Other units will either hold output constant (because of market bids and generator costs) or will not participate because their cost exceeds the market price. All changes in demand that occur within the market period (15 minutes, in this example) must be met by units on automatic generator control (AGC) that provide regulation. Because the dispatch stack is frozen for the market period, all sub-market-period movements must be met by regulating units. This restricts the available pool of generation that can move within the market period to those operating as regulating units. For the purposes of this discussion, we call this the physically-available but institutionally-constrained generation (PAIC). Should there be excessively large ramps that exceed the capability of the regulating units, no mechanism would exist (without resorting to emergency measures) of tapping the PAIC generators in the economic dispatch stack. Shorter markets require more frequent dispatch. Over 50% of the U.S. electric demand is in regions with 5-minute markets. When ERCOT moves from 15-minute to 5-minute markets, that will increase to almost 60% and when SPP institutes 5-minute markets, two thirds of the country will be operating with 5-minute markets. With this short market period, adjustments to the dispatch stack are made more frequently. Now consider a large load ramp (possibly accentuated by a simultaneous ramp in VG) that lasts for 30 minutes or more. With a 5-minute market, the output of the economic dispatch stack can be changed in 5 minutes, allowing the regulating units 12 See Kirby, Milligan and Wan , 2006

28
to return to their preferred operating points (POPs) after each 5-minute period. However, with a 15-minute market period, the regulating units would have to chase the ramp for 15 minutes before being relieved by units on the dispatch stack. Consequentially, the regulating units must diverge from their POPs much more than before, and the PAIC units are constrained from ramping to help mitigate the ramp for a longer period of time. It is clear from this simple example that longer market periods impose additional institutional constraints, imposing longer time periods during which the economic dispatch stack cannot assist in chasing large ramps. The general principle is therefore that shorter market periods provide better institutional access to flexibility than longer market periods. We note that markets in the United States that began operation with 10- to 15-minute intervals have now moved to 5-minute intervals. As our discussion indicates, the faster market interval is more efficient. A study required by the Minnesota legislature in 2006 to assess the reliability and cost of providing 20%of the state’s electricity from wind provides a good example of how open markets can facilitate wind integration:
“The MISO [Midwest Independent System Operator] energy market also played a large role in reducing wind generation integration costs. Since all generating resources over the market footprint are committed and dispatched in an optimal fashion, the size of the effective system into which the wind generation for the study is integrated grows to almost 1200 individual generating units. The aggregate flexibility of the units on line during any hour is adequate for compensating most of the changes in wind generation.” (See www.puc.state.mn.us/docs/windrpt_vol%201.pdf.) (Zavadil, 2006)
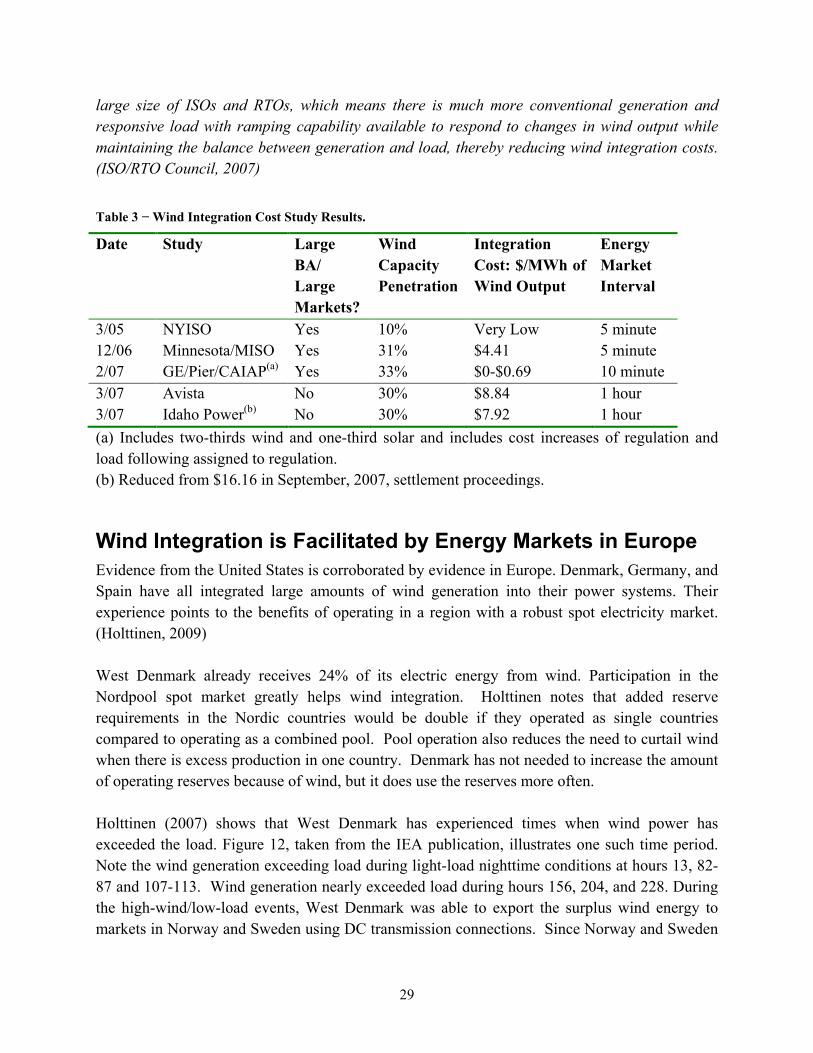
Wind Integration Costs Wind integration studies typically show lower wind integration costs for ISO and RTO markets than for non-ISO/RTO areas. As we pointed out above, it is not the inherent ISO/RTO structure that provides the benefit; rather it is the large, organized energy market that runs at short sub-hourly intervals and over a broad geographic area. These studies quantify the costs of additional reserves, changes in unit commitment and dispatch, gas nominations, etc. Integration costs are separate from energy and emissions benefits. Table 4 shows results from several recent wind integration studies (Smith et. al, 2007, Northwest Wind Integration Action Plan, 2007).iii In general, the studies show lower integration costs in large market areas than in smaller, single-utility service areas. The integration costs for the three studies carried out in large energy markets range from zero to $4.41/MWh of wind, while the integration costs for the two non-market studies range from $8.84 to $16.16/MWh. The primary reason for these results is that the three large BAs operate sub-hourly markets, i.e. they dispatch generation on a five- to fifteen-minute time frame, while the two small BAs require generators to follow hourly schedules and obtain all sub-hourly balancing from regulating units. The second reason for these results is the
29
large size of ISOs and RTOs, which means there is much more conventional generation and responsive load with ramping capability available to respond to changes in wind output while maintaining the balance between generation and load, thereby reducing wind integration costs. (ISO/RTO Council, 2007)
Table 3 − Wind Integration Cost Study Results.
Date Study Large BA/ Large Markets?
Wind Capacity Penetration
Integration Cost: $/MWh of Wind Output
Energy Market Interval
3/05 NYISO Yes 10% Very Low 5 minute 12/06 Minnesota/MISO Yes 31% $4.41 5 minute 2/07 GE/Pier/CAIAP(a) Yes 33% $0-$0.69 10 minute 3/07 Avista No 30% $8.84 1 hour 3/07 Idaho Power(b) No 30% $7.92 1 hour (a) Includes two-thirds wind and one-third solar and includes cost increases of regulation and load following assigned to regulation. (b) Reduced from $16.16 in September, 2007, settlement proceedings.
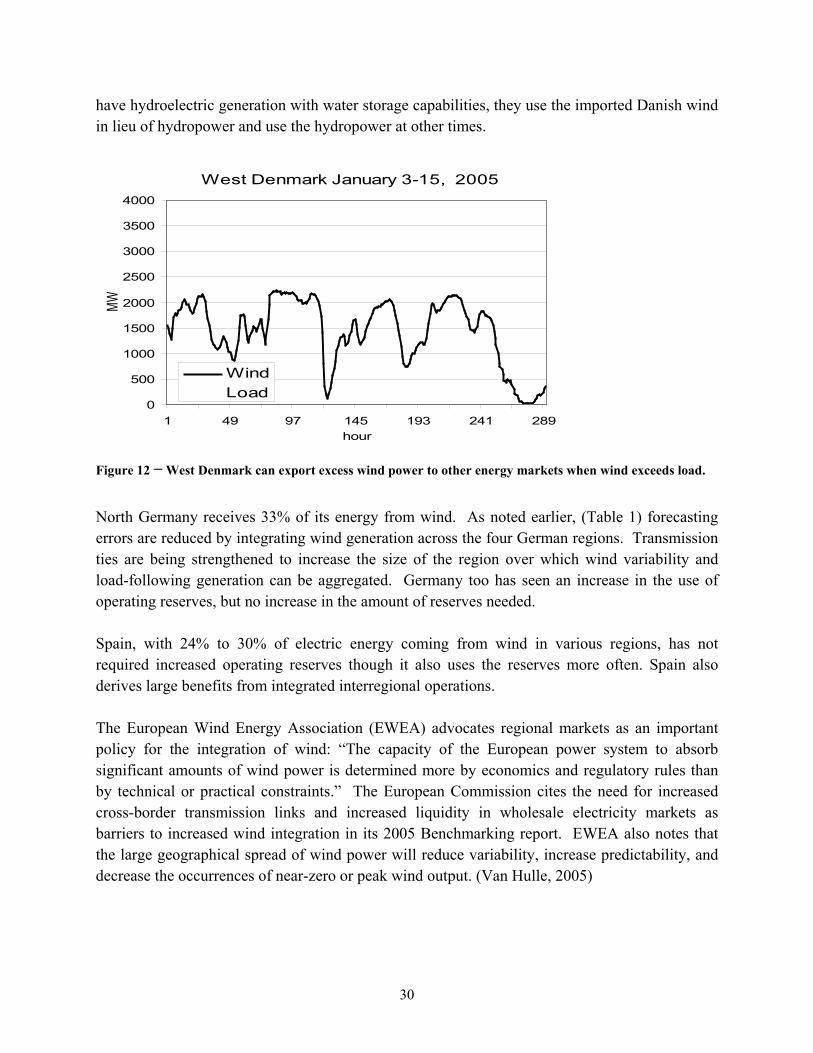
Wind Integration is Facilitated by Energy Markets in Europe Evidence from the United States is corroborated by evidence in Europe. Denmark, Germany, and Spain have all integrated large amounts of wind generation into their power systems. Their experience points to the benefits of operating in a region with a robust spot electricity market. (Holttinen, 2009) West Denmark already receives 24% of its electric energy from wind. Participation in the Nordpool spot market greatly helps wind integration. Holttinen notes that added reserve requirements in the Nordic countries would be double if they operated as single countries compared to operating as a combined pool. Pool operation also reduces the need to curtail wind when there is excess production in one country. Denmark has not needed to increase the amount of operating reserves because of wind, but it does use the reserves more often. Holttinen (2007) shows that West Denmark has experienced times when wind power has exceeded the load. Figure 12, taken from the IEA publication, illustrates one such time period. Note the wind generation exceeding load during light-load nighttime conditions at hours 13, 82-87 and 107-113. Wind generation nearly exceeded load during hours 156, 204, and 228. During the high-wind/low-load events, West Denmark was able to export the surplus wind energy to markets in Norway and Sweden using DC transmission connections. Since Norway and Sweden
30
have hydroelectric generation with water storage capabilities, they use the imported Danish wind in lieu of hydropower and use the hydropower at other times.
Figure 12 − West Denmark can export excess wind power to other energy markets when wind exceeds load.
North Germany receives 33% of its energy from wind. As noted earlier, (Table 1) forecasting errors are reduced by integrating wind generation across the four German regions. Transmission ties are being strengthened to increase the size of the region over which wind variability and load-following generation can be aggregated. Germany too has seen an increase in the use of operating reserves, but no increase in the amount of reserves needed. Spain, with 24% to 30% of electric energy coming from wind in various regions, has not required increased operating reserves though it also uses the reserves more often. Spain also derives large benefits from integrated interregional operations. The European Wind Energy Association (EWEA) advocates regional markets as an important policy for the integration of wind: “The capacity of the European power system to absorb significant amounts of wind power is determined more by economics and regulatory rules than by technical or practical constraints.” The European Commission cites the need for increased cross-border transmission links and increased liquidity in wholesale electricity markets as barriers to increased wind integration in its 2005 Benchmarking report. EWEA also notes that the large geographical spread of wind power will reduce variability, increase predictability, and decrease the occurrences of near-zero or peak wind output. (Van Hulle, 2005)
West Denmark January 3-15, 2005
0
500
1000
1500
2000
2500
3000
3500
4000
1 49 97 145 193 241 289hour
MW
WindLoad

31
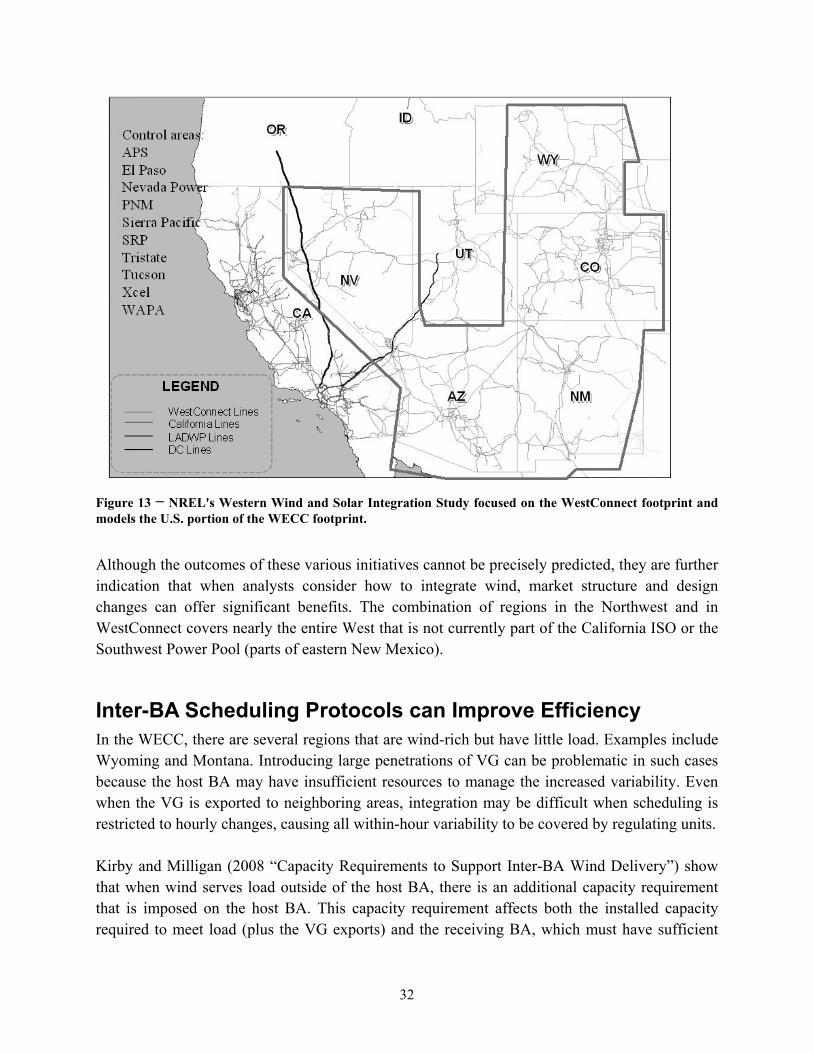
Some Small BAs are Adopting Limited Inter-BA Variability-Sharing In large parts of the western part of the United State, there are many small BAs, and energy markets are not robust and are not run sub-hourly. However, there is significant interest in developing cooperative agreements among BAs that would provide some of the benefits of consolidation. The Northern Tier Transmission Group (NTTG) (www.nttg.biz) developed an area control error/ACE Diversity Interchange (ADI) pilot program that allows for the sharing of regulation across regions. There is significant interest in this project. WestConnect (www.westconnect.com) has joined the NTTG ADI project, and continues to investigate wholesale market enhancements and seams issues in the footprint. NREL has completed a large Western Wind and Solar Integration Study. The focus of the study is the WestConnect footprint, but the entire U.S. portion of WECC was modeled, and high wind and solar penetrations were analyzed. Figure 13 shows the study footprint. Part of the analysis examines the benefit of consolidated BA operations for integrating a high penetration of renewable energy sources. In the Pacific Northwest, the Bonneville Power Administration (BPA) convened stakeholders and utilities to examine how the region could best position itself to integrate up to 6,000 MW of wind that may be developed in the next several years. The result of this effort is the Northwest Wind Integration Action Plan (http://www.nwcouncil.org/energy/Wind/library/2007-1.pdf). Among the items on the agenda for the Northwest Wind Integration Action Plan are “(1) developing more cooperation between regional utilities to spread the variability of wind more broadly; (2) developing markets that will reward entities who choose to market their surplus flexibility.” Other parts of the report indicate a need for “developing more robust markets for control area services that will provide needed electric services for smaller control areas with substantial wind resources” (page 13).
32
Figure 13 − NREL's Western Wind and Solar Integration Study focused on the WestConnect footprint and models the U.S. portion of the WECC footprint.
Although the outcomes of these various initiatives cannot be precisely predicted, they are further indication that when analysts consider how to integrate wind, market structure and design changes can offer significant benefits. The combination of regions in the Northwest and in WestConnect covers nearly the entire West that is not currently part of the California ISO or the Southwest Power Pool (parts of eastern New Mexico).
Inter-BA Scheduling Protocols can Improve Efficiency In the WECC, there are several regions that are wind-rich but have little load. Examples include Wyoming and Montana. Introducing large penetrations of VG can be problematic in such cases because the host BA may have insufficient resources to manage the increased variability. Even when the VG is exported to neighboring areas, integration may be difficult when scheduling is restricted to hourly changes, causing all within-hour variability to be covered by regulating units. Kirby and Milligan (2008 “Capacity Requirements to Support Inter-BA Wind Delivery”) show that when wind serves load outside of the host BA, there is an additional capacity requirement that is imposed on the host BA. This capacity requirement affects both the installed capacity required to meet load (plus the VG exports) and the receiving BA, which must have sufficient
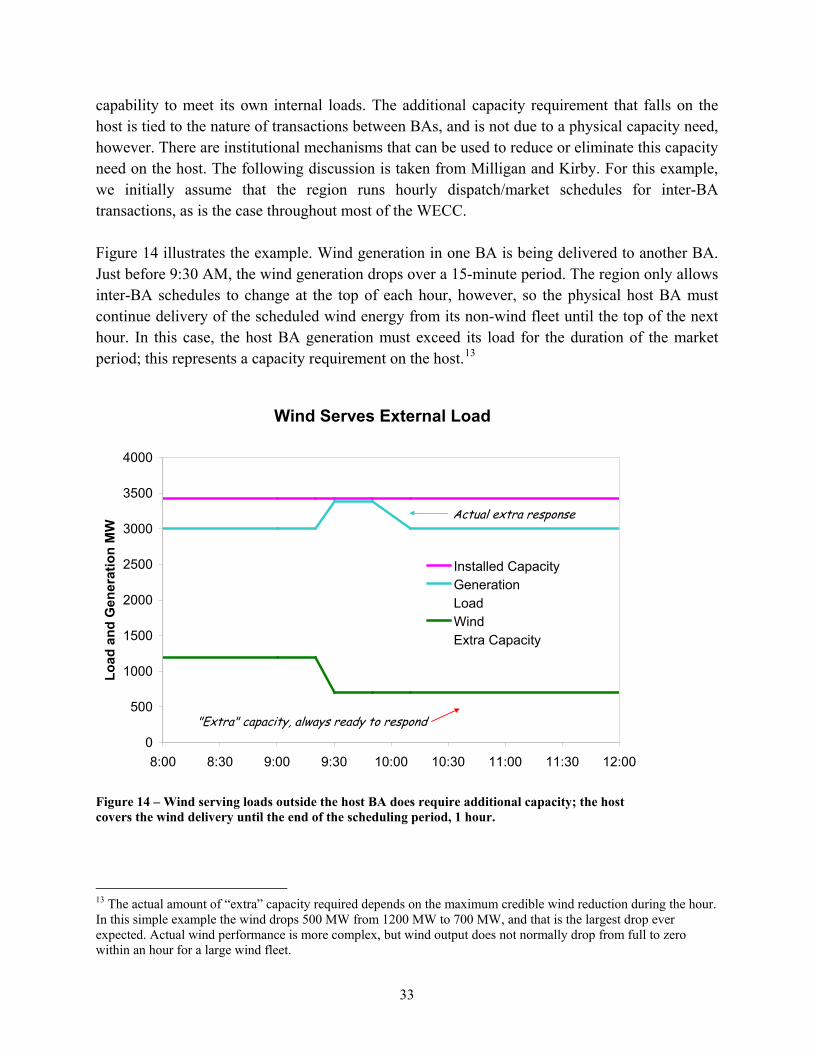
33
capability to meet its own internal loads. The additional capacity requirement that falls on the host is tied to the nature of transactions between BAs, and is not due to a physical capacity need, however. There are institutional mechanisms that can be used to reduce or eliminate this capacity need on the host. The following discussion is taken from Milligan and Kirby. For this example, we initially assume that the region runs hourly dispatch/market schedules for inter-BA transactions, as is the case throughout most of the WECC. Figure 14 illustrates the example. Wind generation in one BA is being delivered to another BA. Just before 9:30 AM, the wind generation drops over a 15-minute period. The region only allows inter-BA schedules to change at the top of each hour, however, so the physical host BA must continue delivery of the scheduled wind energy from its non-wind fleet until the top of the next hour. In this case, the host BA generation must exceed its load for the duration of the market period; this represents a capacity requirement on the host.13
Figure 14 – Wind serving loads outside the host BA does require additional capacity; the host covers the wind delivery until the end of the scheduling period, 1 hour.
13 The actual amount of “extra” capacity required depends on the maximum credible wind reduction during the hour. In this simple example the wind drops 500 MW from 1200 MW to 700 MW, and that is the largest drop ever expected. Actual wind performance is more complex, but wind output does not normally drop from full to zero within an hour for a large wind fleet.
Wind Serves External Load
0
500
1000
1500
2000
2500
3000
3500
4000
8:00 8:30 9:00 9:30 10:00 10:30 11:00 11:30 12:00
Load
and
Gen
erat
ion
MW
Installed CapacityGenerationLoadWindExtra Capacity
"Extra" capacity, always ready to respond
Actual extra response
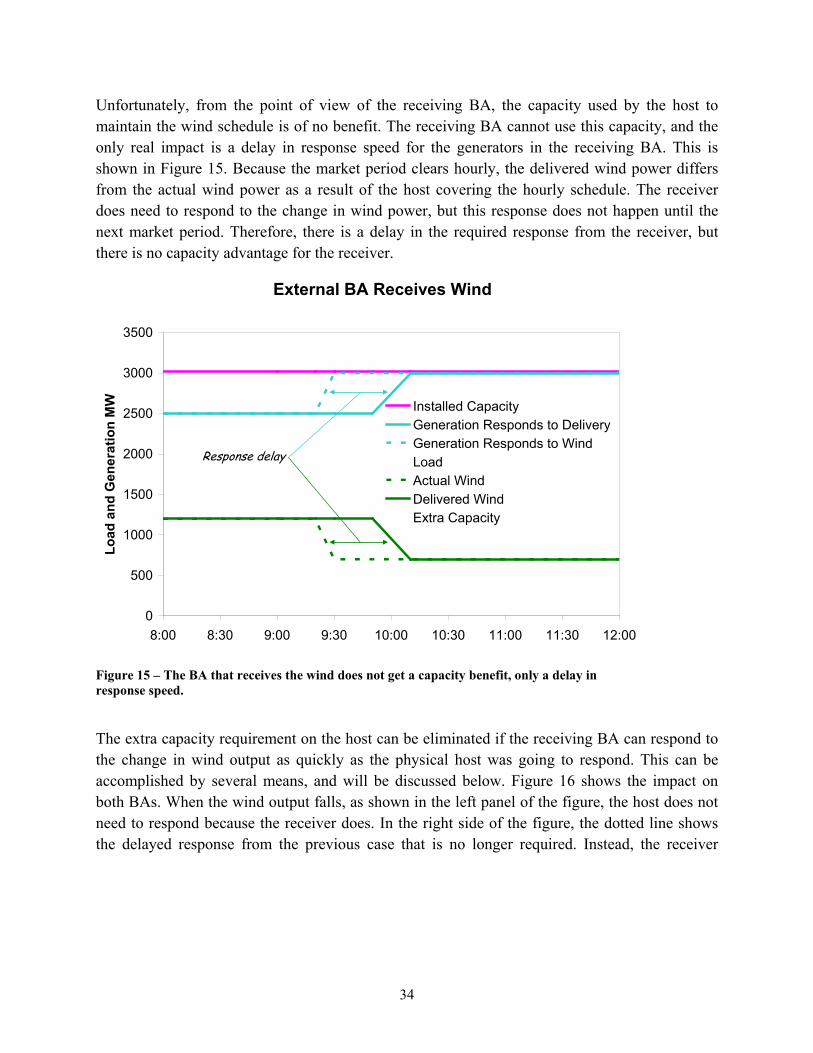
34
Unfortunately, from the point of view of the receiving BA, the capacity used by the host to maintain the wind schedule is of no benefit. The receiving BA cannot use this capacity, and the only real impact is a delay in response speed for the generators in the receiving BA. This is shown in Figure 15. Because the market period clears hourly, the delivered wind power differs from the actual wind power as a result of the host covering the hourly schedule. The receiver does need to respond to the change in wind power, but this response does not happen until the next market period. Therefore, there is a delay in the required response from the receiver, but there is no capacity advantage for the receiver.
Figure 15 – The BA that receives the wind does not get a capacity benefit, only a delay in response speed.
The extra capacity requirement on the host can be eliminated if the receiving BA can respond to the change in wind output as quickly as the physical host was going to respond. This can be accomplished by several means, and will be discussed below. Figure 16 shows the impact on both BAs. When the wind output falls, as shown in the left panel of the figure, the host does not need to respond because the receiver does. In the right side of the figure, the dotted line shows the delayed response from the previous case that is no longer required. Instead, the receiver
External BA Receives Wind
0
500
1000
1500
2000
2500
3000
3500
8:00 8:30 9:00 9:30 10:00 10:30 11:00 11:30 12:00
Load
and
Gen
erat
ion
MW Installed Capacity
Generation Responds to DeliveryGeneration Responds to WindLoadActual WindDelivered WindExtra Capacity
Response delay
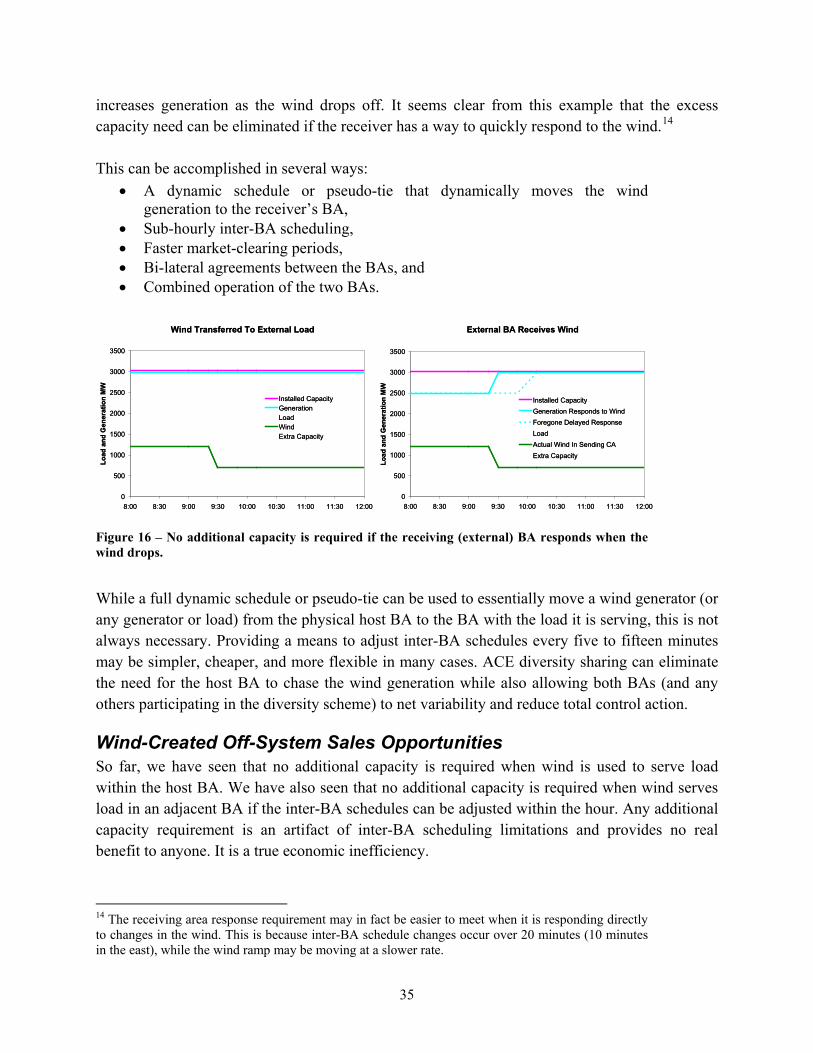
35
increases generation as the wind drops off. It seems clear from this example that the excess capacity need can be eliminated if the receiver has a way to quickly respond to the wind.14
This can be accomplished in several ways: • A dynamic schedule or pseudo-tie that dynamically moves the wind
generation to the receiver’s BA, • Sub-hourly inter-BA scheduling, • Faster market-clearing periods, • Bi-lateral agreements between the BAs, and • Combined operation of the two BAs.
Figure 16 – No additional capacity is required if the receiving (external) BA responds when the wind drops.
While a full dynamic schedule or pseudo-tie can be used to essentially move a wind generator (or any generator or load) from the physical host BA to the BA with the load it is serving, this is not always necessary. Providing a means to adjust inter-BA schedules every five to fifteen minutes may be simpler, cheaper, and more flexible in many cases. ACE diversity sharing can eliminate the need for the host BA to chase the wind generation while also allowing both BAs (and any others participating in the diversity scheme) to net variability and reduce total control action.
Wind-Created Off-System Sales Opportunities So far, we have seen that no additional capacity is required when wind is used to serve load within the host BA. We have also seen that no additional capacity is required when wind serves load in an adjacent BA if the inter-BA schedules can be adjusted within the hour. Any additional capacity requirement is an artifact of inter-BA scheduling limitations and provides no real benefit to anyone. It is a true economic inefficiency.
14 The receiving area response requirement may in fact be easier to meet when it is responding directly to changes in the wind. This is because inter-BA schedule changes occur over 20 minutes (10 minutes in the east), while the wind ramp may be moving at a slower rate.
External BA Receives Wind
0
500
1000
1500
2000
2500
3000
3500
8:00 8:30 9:00 9:30 10:00 10:30 11:00 11:30 12:00
Load
and
Gen
erat
ion
MW
Installed CapacityGeneration Responds to WindForegone Delayed ResponseLoadActual Wind In Sending CAExtra Capacity
Wind Transferred To External Load
0
500
1000
1500
2000
2500
3000
3500
8:00 8:30 9:00 9:30 10:00 10:30 11:00 11:30 12:00
Load
and
Gen
erat
ion
MW
Installed CapacityGenerationLoadWindExtra Capacity
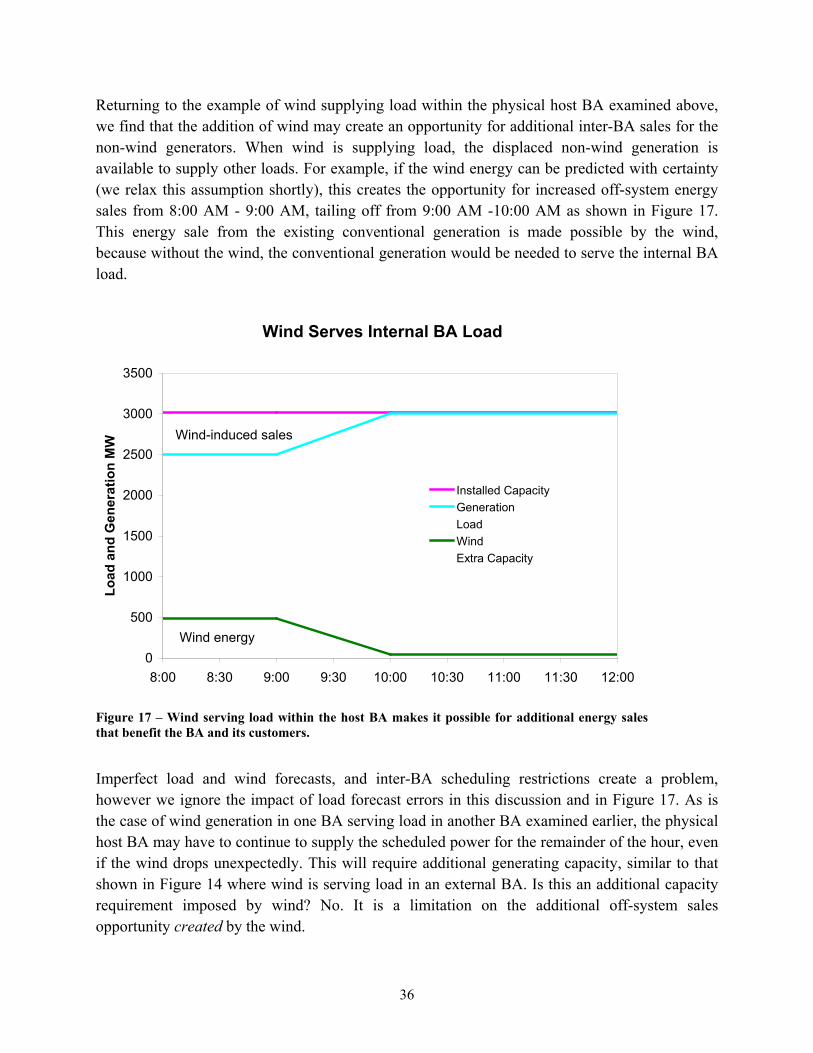
36
Returning to the example of wind supplying load within the physical host BA examined above, we find that the addition of wind may create an opportunity for additional inter-BA sales for the non-wind generators. When wind is supplying load, the displaced non-wind generation is available to supply other loads. For example, if the wind energy can be predicted with certainty (we relax this assumption shortly), this creates the opportunity for increased off-system energy sales from 8:00 AM - 9:00 AM, tailing off from 9:00 AM -10:00 AM as shown in Figure 17. This energy sale from the existing conventional generation is made possible by the wind, because without the wind, the conventional generation would be needed to serve the internal BA load.
Figure 17 – Wind serving load within the host BA makes it possible for additional energy sales that benefit the BA and its customers.
Imperfect load and wind forecasts, and inter-BA scheduling restrictions create a problem, however we ignore the impact of load forecast errors in this discussion and in Figure 17. As is the case of wind generation in one BA serving load in another BA examined earlier, the physical host BA may have to continue to supply the scheduled power for the remainder of the hour, even if the wind drops unexpectedly. This will require additional generating capacity, similar to that shown in Figure 14 where wind is serving load in an external BA. Is this an additional capacity requirement imposed by wind? No. It is a limitation on the additional off-system sales opportunity created by the wind.
Wind Serves Internal BA Load
0
500
1000
1500
2000
2500
3000
3500
8:00 8:30 9:00 9:30 10:00 10:30 11:00 11:30 12:00
Load
and
Gen
erat
ion
MW
Installed CapacityGenerationLoadWindExtra Capacity
Wind-induced sales
Wind energy
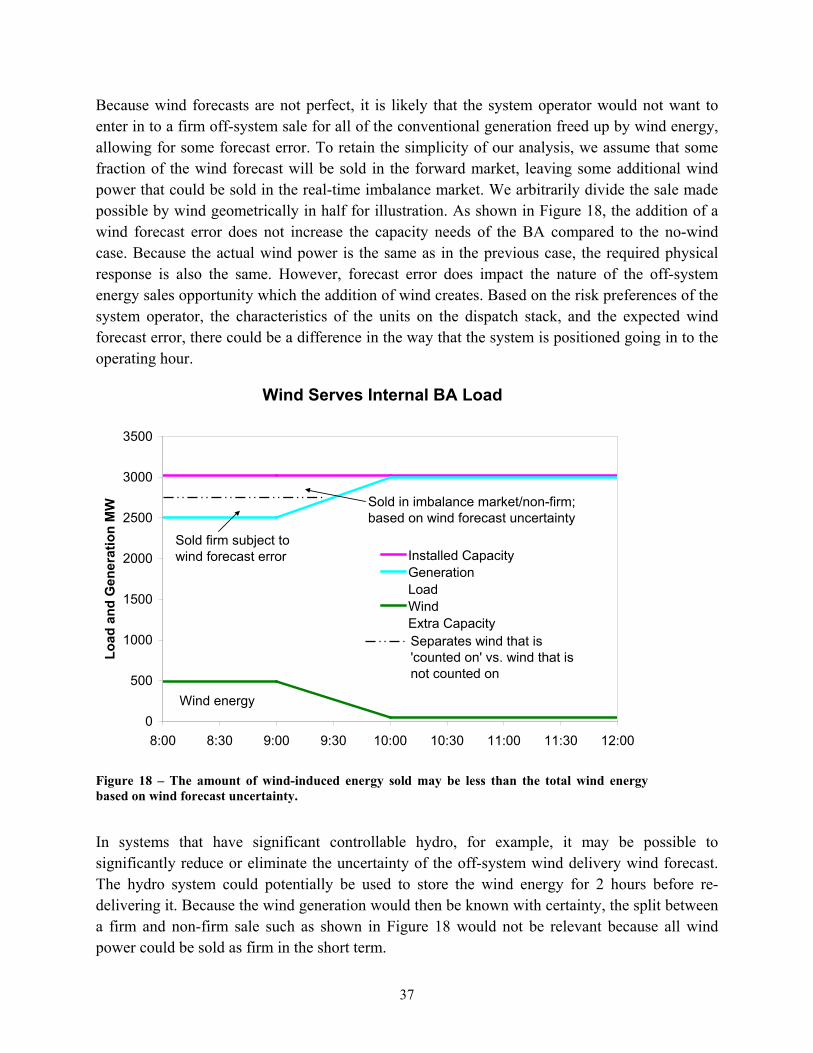
37
Because wind forecasts are not perfect, it is likely that the system operator would not want to enter in to a firm off-system sale for all of the conventional generation freed up by wind energy, allowing for some forecast error. To retain the simplicity of our analysis, we assume that some fraction of the wind forecast will be sold in the forward market, leaving some additional wind power that could be sold in the real-time imbalance market. We arbitrarily divide the sale made possible by wind geometrically in half for illustration. As shown in Figure 18, the addition of a wind forecast error does not increase the capacity needs of the BA compared to the no-wind case. Because the actual wind power is the same as in the previous case, the required physical response is also the same. However, forecast error does impact the nature of the off-system energy sales opportunity which the addition of wind creates. Based on the risk preferences of the system operator, the characteristics of the units on the dispatch stack, and the expected wind forecast error, there could be a difference in the way that the system is positioned going in to the operating hour.
Figure 18 – The amount of wind-induced energy sold may be less than the total wind energy based on wind forecast uncertainty.
In systems that have significant controllable hydro, for example, it may be possible to significantly reduce or eliminate the uncertainty of the off-system wind delivery wind forecast. The hydro system could potentially be used to store the wind energy for 2 hours before re-delivering it. Because the wind generation would then be known with certainty, the split between a firm and non-firm sale such as shown in Figure 18 would not be relevant because all wind power could be sold as firm in the short term.
Wind Serves Internal BA Load
0
500
1000
1500
2000
2500
3000
3500
8:00 8:30 9:00 9:30 10:00 10:30 11:00 11:30 12:00
Load
and
Gen
erat
ion
MW
Installed CapacityGenerationLoadWindExtra Capacity
Sold firm subject to wind forecast error
Wind energy
Sold in imbalance market/non-firm; based on wind forecast uncertainty
Separates wind that is 'counted on' vs. wind that is not counted on
38
Example Using Public Data from Bonneville Power Administration The discussion so far has been primarily conceptual in nature, and has pointed out the impact of hourly schedules on inter-BA wind transfers. We now illustrate the potential impact of late gate closing and faster scheduling intervals on the excess capacity that the host BA must hold, based on the previous analysis (Kirby and Milligan 2009a and 2009b). Bonneville Power Administration (BPA) is a Federal Power Marketing Agency that markets energy from several large hydroelectric dams along the Columbia River, and operates its own BA. BPA has undertaken several analyses of the potential impact of an anticipated large wind build-out within its BA. One of the concerns of BPA is that a large proportion of the wind that is physically and electrically located in its BA is for export to other BAs. In addition, current practice in the Pacific Northwest (and across most of the Western Interconnection) restricts schedule changes to the top of the hour, with an associated ramp period within a 10-minute period either side of the hour for units to move to their scheduled position. As the previous discussion in this paper shows, the capacity requirements for the host BA can be significant under this type of scenario. To illustrate, we provide several simple examples to show how late gate closing and faster scheduling periods can be used to significantly reduce the adverse capacity impact on the host BA when large amounts of wind power are exported outside of the host BA. We obtained data from BPA’s public web site (http://www.transmission.bpa.gov/business/operations/wind/) for 2007. During that period of time, a maximum of 1,176 MW of wind was generated during the year, and the installed capacity increased as new wind was developed in the footprint. BPA provides 5-minute data for both load and wind on this web site. Peak BPA balancing area load was 9,425 MW. We made the simplifying assumption that 80% of the wind in BPA’s footprint is for export, based on conversations with BPA personnel. In keeping with the simple nature of our analysis, we applied wind persistence forecasting in all cases we analyzed. Although better forecasts can be obtained from commercial forecasters, the use of persistence forecasts is straightforward and can be easily replicated in other analyses. Real wind forecasts’ accuracy is also often compared to persistence, allowing the interested reader to extrapolate as desired to other forecasting technologies. Our first example shows the impact of a 2-hour persistence forecasting model (similar to one that was used in BPA’s wind integration rate-development process) and hourly schedules on the BPA system. The results appear in Figure 19. The upper panel shows the capacity requirement in the time domain for the full 8,760 hours of the year. The bottom panel shows the same data, but is organized as a duration curve. Over this year, the maximum capacity requirement imposed on BPA is 451 MW, compared to what a dynamic schedule would achieve. As indicated by the duration graph, there was a sharp fall-off in this maximum capacity requirement, indicating that most other hours experienced a lower capacity impact. The minimum capacity requirement is -
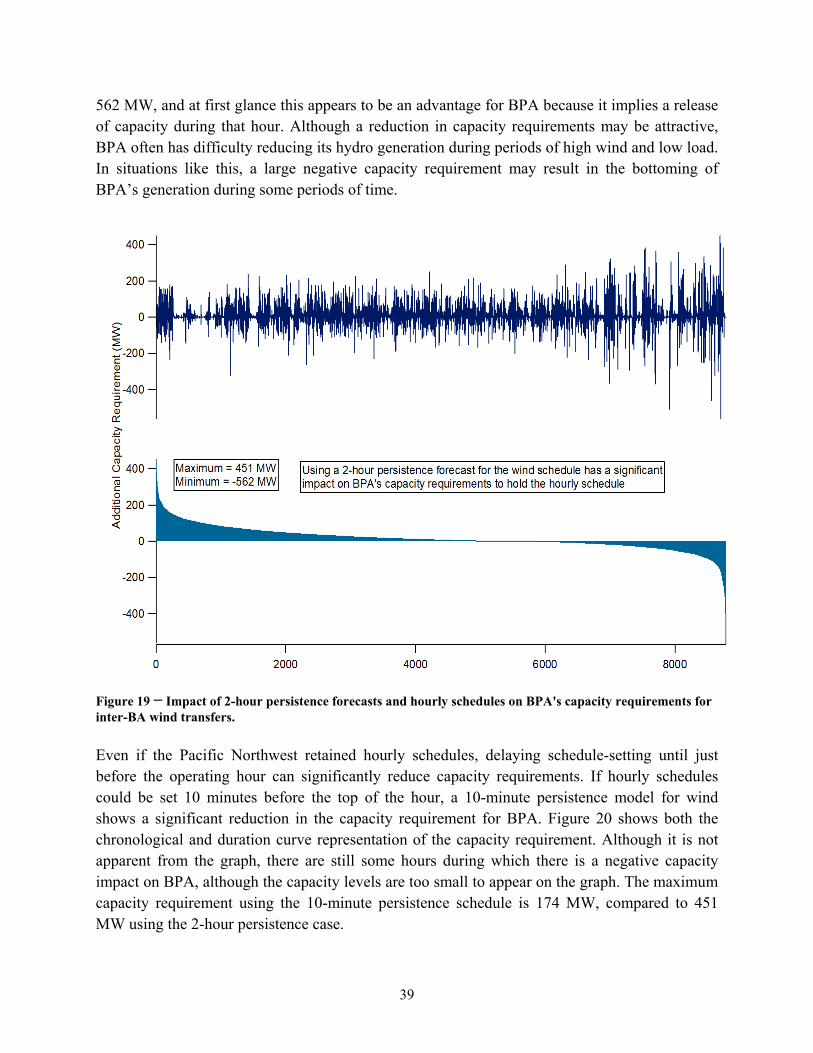
39
562 MW, and at first glance this appears to be an advantage for BPA because it implies a release of capacity during that hour. Although a reduction in capacity requirements may be attractive, BPA often has difficulty reducing its hydro generation during periods of high wind and low load. In situations like this, a large negative capacity requirement may result in the bottoming of BPA’s generation during some periods of time.
Figure 19 − Impact of 2-hour persistence forecasts and hourly schedules on BPA's capacity requirements for inter-BA wind transfers. Even if the Pacific Northwest retained hourly schedules, delaying schedule-setting until just before the operating hour can significantly reduce capacity requirements. If hourly schedules could be set 10 minutes before the top of the hour, a 10-minute persistence model for wind shows a significant reduction in the capacity requirement for BPA. Figure 20 shows both the chronological and duration curve representation of the capacity requirement. Although it is not apparent from the graph, there are still some hours during which there is a negative capacity impact on BPA, although the capacity levels are too small to appear on the graph. The maximum capacity requirement using the 10-minute persistence schedule is 174 MW, compared to 451 MW using the 2-hour persistence case.
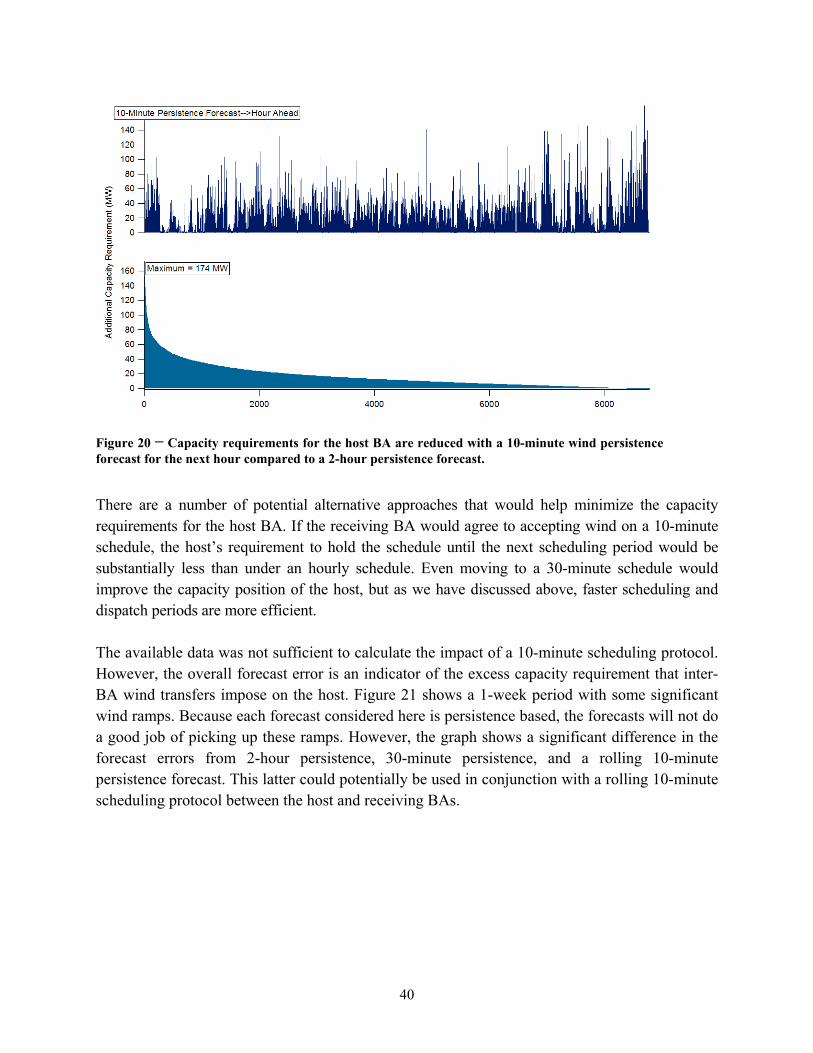
40
Figure 20 − Capacity requirements for the host BA are reduced with a 10-minute wind persistence forecast for the next hour compared to a 2-hour persistence forecast.
There are a number of potential alternative approaches that would help minimize the capacity requirements for the host BA. If the receiving BA would agree to accepting wind on a 10-minute schedule, the host’s requirement to hold the schedule until the next scheduling period would be substantially less than under an hourly schedule. Even moving to a 30-minute schedule would improve the capacity position of the host, but as we have discussed above, faster scheduling and dispatch periods are more efficient. The available data was not sufficient to calculate the impact of a 10-minute scheduling protocol. However, the overall forecast error is an indicator of the excess capacity requirement that inter-BA wind transfers impose on the host. Figure 21 shows a 1-week period with some significant wind ramps. Because each forecast considered here is persistence based, the forecasts will not do a good job of picking up these ramps. However, the graph shows a significant difference in the forecast errors from 2-hour persistence, 30-minute persistence, and a rolling 10-minute persistence forecast. This latter could potentially be used in conjunction with a rolling 10-minute scheduling protocol between the host and receiving BAs.
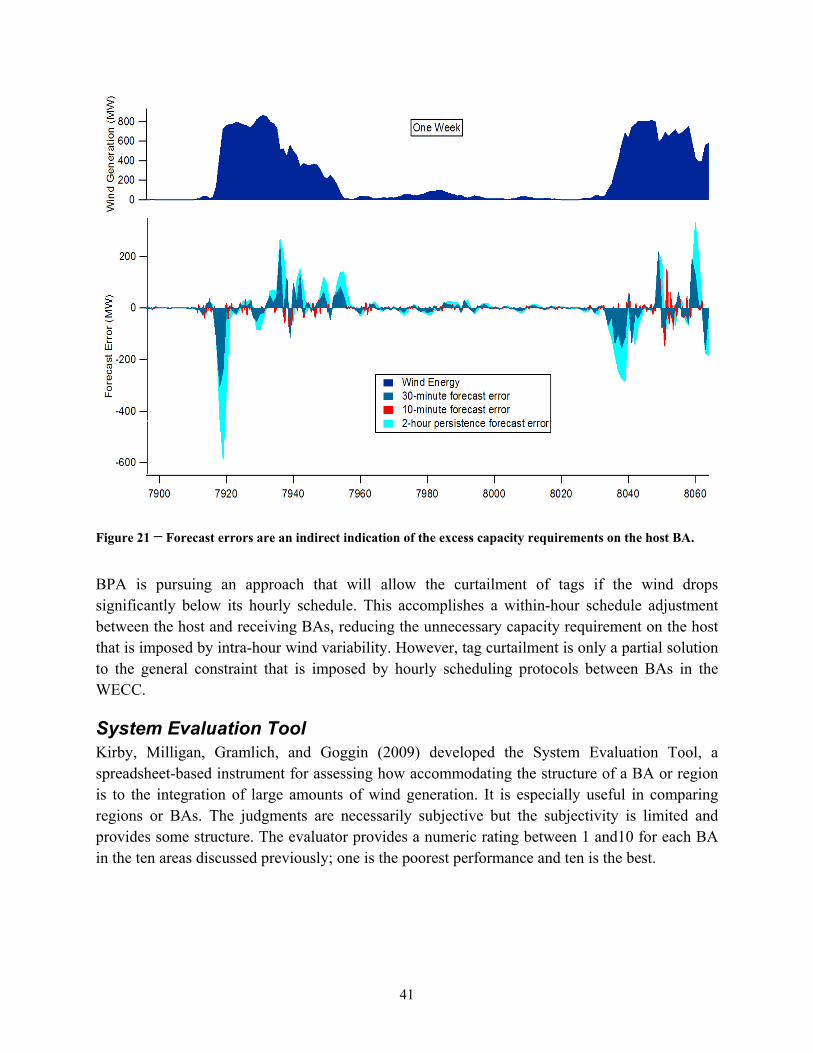
41
Figure 21 − Forecast errors are an indirect indication of the excess capacity requirements on the host BA.
BPA is pursuing an approach that will allow the curtailment of tags if the wind drops significantly below its hourly schedule. This accomplishes a within-hour schedule adjustment between the host and receiving BAs, reducing the unnecessary capacity requirement on the host that is imposed by intra-hour wind variability. However, tag curtailment is only a partial solution to the general constraint that is imposed by hourly scheduling protocols between BAs in the WECC.
System Evaluation Tool Kirby, Milligan, Gramlich, and Goggin (2009) developed the System Evaluation Tool, a spreadsheet-based instrument for assessing how accommodating the structure of a BA or region is to the integration of large amounts of wind generation. It is especially useful in comparing regions or BAs. The judgments are necessarily subjective but the subjectivity is limited and provides some structure. The evaluator provides a numeric rating between 1 and10 for each BA in the ten areas discussed previously; one is the poorest performance and ten is the best.
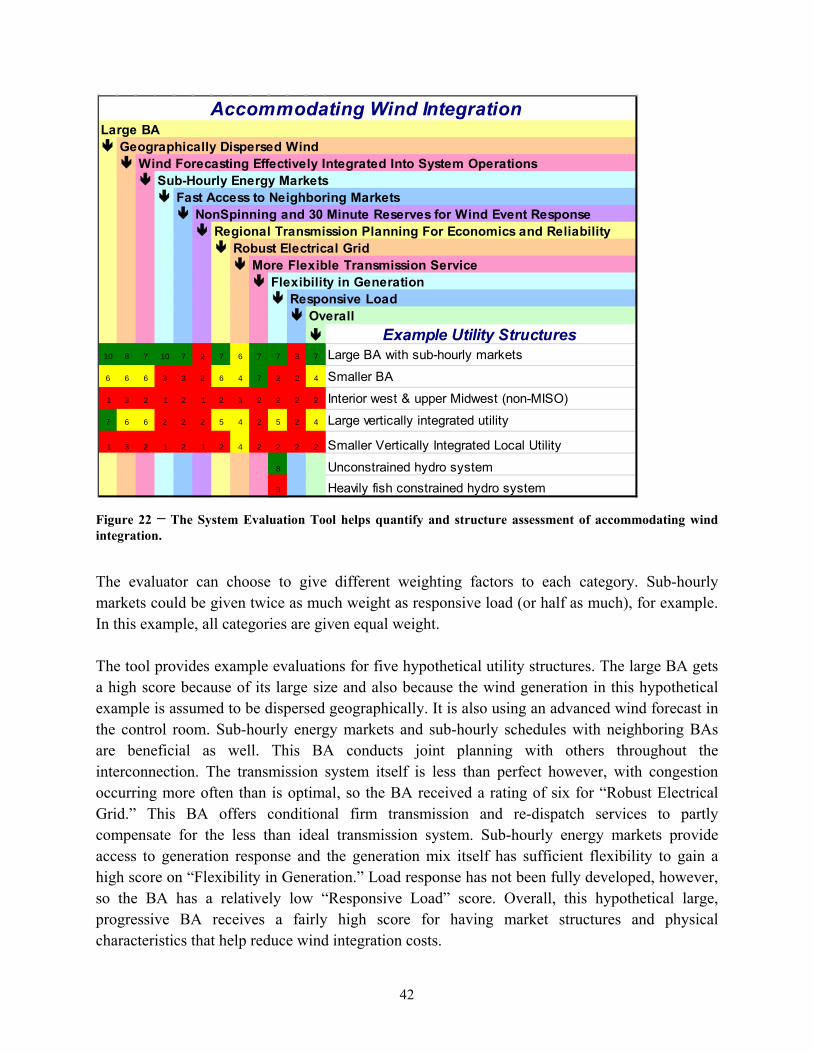
42
Figure 22 − The System Evaluation Tool helps quantify and structure assessment of accommodating wind integration.
The evaluator can choose to give different weighting factors to each category. Sub-hourly markets could be given twice as much weight as responsive load (or half as much), for example. In this example, all categories are given equal weight. The tool provides example evaluations for five hypothetical utility structures. The large BA gets a high score because of its large size and also because the wind generation in this hypothetical example is assumed to be dispersed geographically. It is also using an advanced wind forecast in the control room. Sub-hourly energy markets and sub-hourly schedules with neighboring BAs are beneficial as well. This BA conducts joint planning with others throughout the interconnection. The transmission system itself is less than perfect however, with congestion occurring more often than is optimal, so the BA received a rating of six for “Robust Electrical Grid.” This BA offers conditional firm transmission and re-dispatch services to partly compensate for the less than ideal transmission system. Sub-hourly energy markets provide access to generation response and the generation mix itself has sufficient flexibility to gain a high score on “Flexibility in Generation.” Load response has not been fully developed, however, so the BA has a relatively low “Responsive Load” score. Overall, this hypothetical large, progressive BA receives a fairly high score for having market structures and physical characteristics that help reduce wind integration costs.
Large BA Geographically Dispersed Wind
Wind Forecasting Effectively Integrated Into System Operations Sub-Hourly Energy Markets
Fast Access to Neighboring Markets NonSpinning and 30 Minute Reserves for Wind Event Response
Regional Transmission Planning For Economics and Reliability Robust Electrical Grid
More Flexible Transmission Service Flexibility in Generation
Responsive Load Overall
Example Utility Structures10 8 7 10 7 2 7 6 7 7 3 7 Large BA with sub-hourly markets
6 6 6 3 3 2 6 4 7 2 2 4 Smaller BA
1 3 2 1 2 1 2 3 2 2 2 2 Interior west & upper Midwest (non-MISO)
7 6 6 2 2 2 5 4 2 5 2 4 Large vertically integrated utility
1 3 2 1 2 1 2 4 2 2 2 2 Smaller Vertically Integrated Local Utility
8 Unconstrained hydro system3 Heavily fish constrained hydro system
Accommodating Wind Integration

43
A smaller BA might not receive such a high score. Smaller size, without some mechanism to share diversity with neighbors, results in a lower score. Similarly, if wind generation is concentrated within the BA, the score for wind diversity is reduced. This BA has not developed sub-hourly energy markets and does not engage in sub-hourly schedule adjustments with neighbors, so it receives especially low marks. With less regional focus on transmission planning and greater congestion, this BA receives a lower score though offering conditional firm and re-dispatch gets a high score for transmission flexibility. This BA primarily has large baseload generators with little flexibility and, like most, has yet to fully develop responsive load. Overall, this smaller BA receives a lower score than the large, progressive BA. Small independent BAs would typically receive low scores because they do not have sufficient load diversity or wind diversity to reduce the relative variability. They may not use wind forecasts in the operations center. Typically, they do not operate sub-hourly markets or adjust schedules with neighbors more frequently than each hour. They may not engage in regional transmission planning to alleviate economic as well as reliability concerns and they may not offer effective re-dispatch or conditional firm transmission service. Generation is likely inflexible because of the smaller number of generators, resulting in more difficult minimum load problems. Large, vertically integrated utilities can have an electrically and geographically large footprint, though typically not as large as the largest BAs. Wind may or may not be geographically dispersed; in this example we assume that it is somewhat concentrated. We also assumed that a persistence forecast was available in the control room. With no sub-hourly markets and no sub-hourly coordination with neighbors, the BA receives low marks. Regional transmission planning and transmission adequacy need improvement. Effective re-dispatch and conditional-firm transmission service are not offered. Generation is moderately flexible but load is not. Overall, this large, vertically integrated utility receives marks that are similar to those given to the hypothetical smaller ISO. Lastly, the figure compares an unconstrained hydro system with a constrained hydro system in the generation flexibility category. Some hydro generation can be very flexible with fast ramping capability, rapid cycling, and excellent control. An unconstrained hydro system would receive high marks for flexibility and its ability to accommodate load and wind variability. Biological constraints can remove much of that flexibility, however. Still, constrained hydro systems should be carefully examined to determine how their flexibility can best be used to maximize their profit and to help integrate wind. Wind’s fuel saving capability should be able to maximize the capacity value of a hydro system by saving water. These examples are all hypothetical. The value of the tool is that it supports the evaluation of individual BAs, as well as comparing the relative capabilities of several BAs. A regulator could
44
use the tool as part of a process designed to identify needed improvements in market structures and reliability rules, as well as in transmission and generation facilities.
Summary We have shown that the key facilitators of efficient integration of VG consist of:
• Fast energy markets, operating at 5- to 15-minute intervals − faster markets are more efficient.
• Large BAs, which can be achieved either by actual consolidation or by inter-BA protocols and common market platforms, retaining the individual autonomy of existing BAs.
• Per-unit variability of wind plant output declines with larger geographic spread. Similar mechanisms will also affect other VG sources such as PV, although they are less well-understood because of data limitations.
• Larger geographic footprints benefit from aggregation of load and VG. In addition, the ramping capability of generation adds linearly, whereas the ramping need of large areas increases less than linearly.
• Markets that operate or close near real-time can use the latest, more accurate forecasts of VG output, resulting in more efficient operation of the remaining generation fleet and reduced costs.
• In many cases, ramping capability may be costlessly extracted from fast energy markets as a by-product.
• Forecasts for VG output tend to be more accurate closer to real-time, and errors are smaller per-unit over large geographic areas.
• Load and wind tend to be uncorrelated over small time periods. The Principle of Statistical Independence applies to load and wind, and is thought to also apply to other forms of VG.
• There are multiple approaches that can achieve more efficient operation, and they do not require RTO or ISO organizations.
• Inter-BA scheduling protocols that operate on hourly time steps are inefficient, particularly when wind is delivered between BAs.
• There are several developments in the WECC that are moving towards larger effective BAs, and although these efforts do not appear to encompass physical BA consolidation, they appear to have some of the key elements that can improve efficiency under some type of virtual consolidation or actual coordination
The evidence cited herein is based on electricity markets in the United States and Europe, and is quite robust.
45
References Ahlstrom, M, 2008, Short-term Forecasting: Integration of Forecast Data into Utility Operations Planning Tools, presented at the Utility Wind Integration Group/National Renewable Energy Laboratory Wind Forecasting Applications to Utility Planning and Operations, St. Paul, MN. Feb 21-22. CAISO 2007, Integration of Renewables, http://www.caiso.com/1ca5/1ca5a7a026270.pdf, November. ERCOT, 2006, Analysis of Transmission Alternatives for Competitive Renewable Energy Zones in Texas, www.ercot.com/news/presentations/2006/ATTCH_A_CREZ_Analysis_Report.pdf GE Energy, 2005, The Effects of Integrating Wind Power on Transmission System Planning, Reliability, and Operations: Report on Phase 2, http://www.windaction.org/documents/157, prepared for The New York State Energy Research and Development Authority. Gramlich, R. and Goggin, M. 2008, The Ability of Current U.S. Electric Industry Structure and Transmission Rules to Accommodate High Wind Energy Penetration, www.nrel.gov/wind/systemsintegration/pdfs/2009/milligan_electric_structure_impact.pdf, 7th Holttinen H., et al 2009, Design and Operation of Power Systems with Large Amounts of Wind Power: Final Report, http://www.vtt.fi/inf/pdf/tiedotteet/2009/T2493.pdf. VTT Research Notes 2493, IEA Wind. International Workshop on Large Scale Integration of Wind Power and on Transmission Networks for Offshore Wind Farms. ISO/RTO Council, 2007, Increasing Renewable Resources: How ISOs and RTOs are Helping Meet This Public Policy Objective, www.nrel.gov/wind/systemsintegration/news/2007/563.html, ISO/RTO Council, October 16. Kirby, B. and E. Hirst, 2000, Customer-Specific Metrics for the Regulation and Load-Following Ancillary services, ORNL/CON-474, Oak Ridge National Laboratory, January Kirby, B. and M. Milligan, 2009a, Capacity Requirements to Support Inter-Balancing Area Wind Delivery, WindPower 2009, Chicago Il. Kirby, B. and M. Milligan, 2009b, Capacity Requirements to Support Inter-Balancing Area Wind Delivery, www.nrel.gov/wind/systemsintegration/pdfs/2009/milligan_capacity_requirements.pdf

46
B. Kirby, M. Milligan, E. Wan, 2006, Cost-Causation-Based Tariffs for Wind Ancillary Service Impacts, American Wind Energy Association, WindPower 2006, June Kirby, B., M. Milligan, R. Gramlich, and M. Goggin 2009, The Impact of Electric Industry Structure on High Wind Penetration Potential, WindPower 2009, Chicago, Il. Milligan, M. and B. Kirby 2007, The Impact of Balancing Areas Size, Obligation Sharing, and Ramping Capability on Wind Integration, WindPower 2007, www.nrel.gov/wind/systemsintegration/publications.html. Milligan, M. and B. Kirby, 2008a, The Impact of Balancing Area Size and Ramping Requirements on Wind Integration, Wind Engineering, Vol 32, No. 4, p 399-414 Milligan and Kirby, 2008b An Analysis of Sub-Hourly Ramping Impacts of Wind Energy and BA Size, http://www.nrel.gov/docs/fy08osti/43434.pdf Milligan, M., et al, November/December 2009, Wind Myths Debunked, http://www.poweracrosstexas.org/node/115, IEEE Power and EnergyMagazine. Milligan, M. and B. Kirby, 2009, Capacity Requirements to Support Inter-Balancing Area Wind Delivery, www.nrel.gov/wind/systemsintegration/pdfs/2009/milligan_capacity_requirements.pdf presented at WindPower 2009, Chicago, Il. NERC 2009, Accommodating High Levels of Variable Generation, http://www.aeso.ca/downloads/IVGTF_Report_041609(1).pdf, April Rohrig, K. (ed.), 2005, Entwicklung eines Rechenmodells zur Windleistungsprognose für das Gebiet des deutschen Verbundnetzes. Abschlussbericht Forschungsvorhaben Nr. 0329915A, gefördert durch Bundesministeriums für Umwelt, Naturschutz und Reaktorsicherheit (BMU). Kassel, Germany. Spees, K. and Lave, L., 2007, Do RTOs Promote Renewables? A Study of State-Level Data over Time, Carnegie Mellon Electricity Industry Center Working Paper CEIC-07-14, December 3. U.S. Department of Energy, 2002, National Transmission Grid Study, http://www.docstoc.com/docs/939328/National-Transmission-Grid-Study, May. Van Hulle, F., 2005, Large Scale Integration of Wind Energy in the European Power Supply: Analysis, Issues and Recommendations, European Wind Energy Association, www.ewea.org, December.

47
Walling, R., V. Banunarayanan and N. Miller, 2008, Analysis of Wind Generation Impact on ERCOT Ancillary Services Requirements, ERCOT, http://www.uwig.org/AttchA-ERCOT_A-S_Study_Exec_Sum.pdf, March Zavadil, R. et. al., 2006, Final Report - 2006 Minnesota Wind Integration Study Volume I, www.uwig.org/opimpactsdocs.html, The Minnesota Public Utilities Commission, November. Zavadil, R. 2009, Eastern Interconnection Wind Integration & Transmission Study, TRC Meeting #3, Peabody Little Rock Hotel, Little Rock, Arkansas, February 11-12. i There are several ways to allocate the combined ACE among the participating balancing areas but in all cases the required control actions are smaller than if the ACE signals were not combined. ii Hourly load variability shows the smallest reduction in variability (5%) when state-wide operations are compared with zonal operations because loads are highly correlated on an hourly basis. Most loads increase in the morning and decrease in the evening. State wide wind does not show that same similar pattern. iii The quoted integration costs are actually the operating cost impacts. Some studies quantify additional wind related costs.
F1147-E(10/2008)
REPORT DOCUMENTATION PAGE Form Approved OMB No. 0704-0188
The public reporting burden for this collection of information is estimated to average 1 hour per response, including the time for reviewing instructions, searching existing data sources, gathering and maintaining the data needed, and completing and reviewing the collection of information. Send comments regarding this burden estimate or any other aspect of this collection of information, including suggestions for reducing the burden, to Department of Defense, Executive Services and Communications Directorate (0704-0188). Respondents should be aware that notwithstanding any other provision of law, no person shall be subject to any penalty for failing to comply with a collection of information if it does not display a currently valid OMB control number. PLEASE DO NOT RETURN YOUR FORM TO THE ABOVE ORGANIZATION. 1. REPORT DATE (DD-MM-YYYY)
August 2010 2. REPORT TYPE
Technical Report 3. DATES COVERED (From - To)
4. TITLE AND SUBTITLE
Market Characteristics for Efficient Integration of Variable Generation in the Western Interconnection
5a. CONTRACT NUMBER DE-AC36-08-GO28308
5b. GRANT NUMBER
5c. PROGRAM ELEMENT NUMBER
6. AUTHOR(S) M. Milligan and B. Kirby
5d. PROJECT NUMBER NREL/TP-550-48192
5e. TASK NUMBER WE10.4231
5f. WORK UNIT NUMBER
7. PERFORMING ORGANIZATION NAME(S) AND ADDRESS(ES) National Renewable Energy Laboratory 1617 Cole Blvd. Golden, CO 80401-3393
8. PERFORMING ORGANIZATION REPORT NUMBER NREL/TP-550-48192
9. SPONSORING/MONITORING AGENCY NAME(S) AND ADDRESS(ES)
10. SPONSOR/MONITOR'S ACRONYM(S) NREL
11. SPONSORING/MONITORING AGENCY REPORT NUMBER
12. DISTRIBUTION AVAILABILITY STATEMENT National Technical Information Service U.S. Department of Commerce 5285 Port Royal Road Springfield, VA 22161
13. SUPPLEMENTARY NOTES
14. ABSTRACT (Maximum 200 Words) The overriding purpose of this report is to establish the physical requirements of a power system that can accommodate high levels of variable generation.
15. SUBJECT TERMS Wind; variable generation; WECC; Western Interconnection; grid integration; markets.
16. SECURITY CLASSIFICATION OF: 17. LIMITATION OF ABSTRACT
UL
18. NUMBER OF PAGES
19a. NAME OF RESPONSIBLE PERSON a. REPORT
Unclassified b. ABSTRACT Unclassified
c. THIS PAGE Unclassified 19b. TELEPHONE NUMBER (Include area code)
Standard Form 298 (Rev. 8/98) Prescribed by ANSI Std. Z39.18