march 17, 2016 meeting minutes - university of idaho€¦ · · 2016-04-22march 17, 2016 meeting...
TRANSCRIPT
March 17, 2016 Meeting Minutes
Moscow UI Facilities Services Center, Jack’s Creek Meeting Room - 1:00 PM
Attendance
X UI: Elmer Johnson, Water Systems Manager
X WSU: Greg Streva, Water Distribution Manager, Facilities Ops.
X UI: Eugene Gussenhoven Utilities and Engineering Director
X WSU: Steve Potratz, Plant Engineer – Facilities Operations
X Moscow: Tyler Palmer Deputy Director Operations
X Pullman: Mark Workman City Supervisor
X Moscow: Walter Steed, City Council Member
X
Pullman: Kevin Gardes (Vice-Chair), Director of Public Works
X Moscow: Les MacDonald, Director of Public Works
Pullman: Fritz Hughes City Council Member
Latah County: Paul Kimmell (Chair), County Representative
Whitman County: Mark Storey, Director of Public Works
X Latah County: Tom Lamar, County Commissioner
Whitman County: Art Swannack, County Commissioner
Visitors and Others
Ben Floyd, Anchor QEA; David Rice, Anchor QEA (via WebEx); Jeff Hansen, HDR (via WebEx); Jay Decker, HDR (via WebEx); Steve Robischon, PBAC
Call to Order
• Kevin Gardes called the meeting to order at 1:05 PM, and the WebEx attendees were introduced by Floyd.
1) Approval of the February 18, 2016 Meeting Minutes
• February draft minutes were approved by consensus.
2) Public Comment for Items not on Agenda – None 3) Unfinished Business –
• Consideration of project proposals presented in February MacDonald summarized results of a special meeting held March 3 to consider projects proposed at the February 18 regular PBAC meeting.
Palouse Basin Aquifer Committee March 17, 2016 Meeting Minutes
• Consideration of project proposals presented in February (continued)
(continued) He reported the group recommends the Bush geologic map update project be approved, and the WSU/UI aquifer dynamics simulation project not be pursued at this time. Motions were passed to approve the Bush project, and (with Streva dissenting) disapproving the simulation project. A separate motion was passed approving the purchase (not to exceed $15K) of a professional grade GPS unit for use in the Bush project.
• IWRB/PBAC Contract Robischon read an email from Paul Kimmell reporting the contract has been executed. In order to comply with the contract terms, PBAC was required to purchase general liability insurance (cost $664), which will be expensed from the funds provided by the Idaho Water Resource Board (IWRB).
• Water Supply Alternatives – Ben Floyd walked the group through a discussion outline of activities to be completed by the group. He and Rice presented a summary of the work done to create future demand projections, and illustrated and explained the columns in the supply actions spreadsheet. At that point the group broke into 2 working groups (with an additional offline group of Anchor/HDR consultants), each tasked with developing a preliminary set of 3 or 4 alternatives (combinations of supply actions capable of meeting projected 2065 demand). The working groups then reported their results to the larger group. Floyd will aggregate the results and recirculate them to the group in advance of an April 5 conference call which will review the selected alternatives and address decision criteria to be included in follow-on analyses.
4) Other Reports and Announcements –
• MacDonald reported the drill rig for Moscow Well 10 should be on site before the end of the month.
5) Next Meeting –
• The next regular meeting is scheduled for April 21, 2016 in Pullman, starting at 2:00 PM.
6) Adjournment
• The meeting adjourned at 4:05 PM.
Preliminary draft minutes submitted for PBAC review and approved at the April 21, 2016 PBAC meeting. Steve Robischon, PBAC Executive Manager
1
Palouse Basin Aquifer Committee
Palouse Groundwater Basin Water Supply Alternatives Project
Discussion Outline (Final)
March 2016
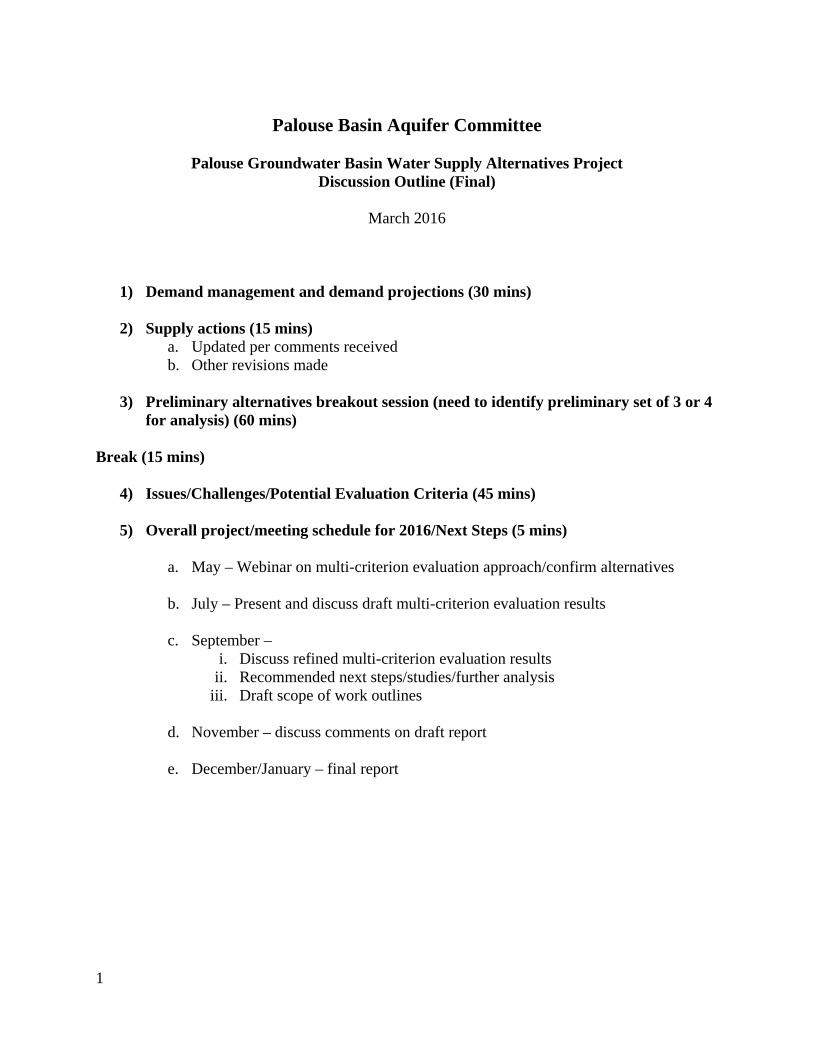
1) Demand management and demand projections (30 mins)
2) Supply actions (15 mins) a. Updated per comments received b. Other revisions made
3) Preliminary alternatives breakout session (need to identify preliminary set of 3 or 4
for analysis) (60 mins)
Break (15 mins)
4) Issues/Challenges/Potential Evaluation Criteria (45 mins)
5) Overall project/meeting schedule for 2016/Next Steps (5 mins)
a. May – Webinar on multi-criterion evaluation approach/confirm alternatives
b. July – Present and discuss draft multi-criterion evaluation results
c. September – i. Discuss refined multi-criterion evaluation results
ii. Recommended next steps/studies/further analysis iii. Draft scope of work outlines
d. November – discuss comments on draft report
e. December/January – final report
2
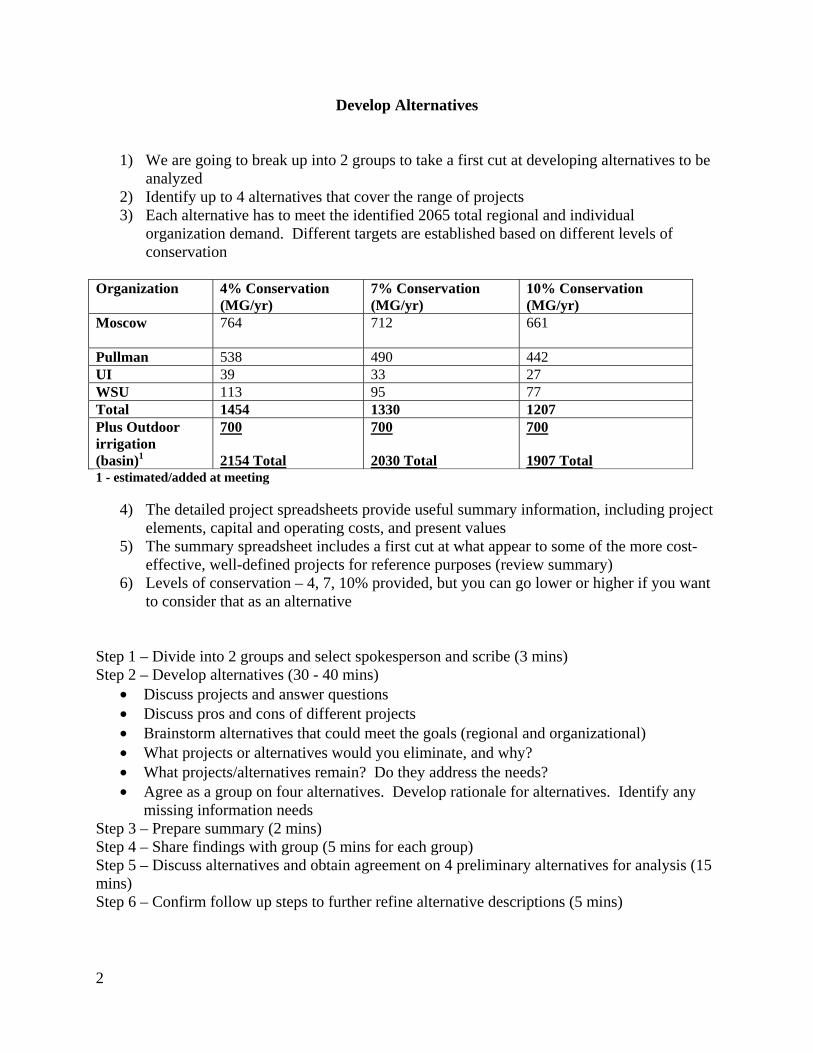
Develop Alternatives
1) We are going to break up into 2 groups to take a first cut at developing alternatives to be
analyzed 2) Identify up to 4 alternatives that cover the range of projects 3) Each alternative has to meet the identified 2065 total regional and individual
organization demand. Different targets are established based on different levels of conservation
Organization 4% Conservation (MG/yr)
7% Conservation (MG/yr)
10% Conservation (MG/yr)
Moscow 764 712 661
Pullman 538 490 442 UI 39 33 27 WSU 113 95 77 Total 1454 1330 1207 Plus Outdoor irrigation (basin)1
700 2154 Total
700 2030 Total
700 1907 Total
1 - estimated/added at meeting
4) The detailed project spreadsheets provide useful summary information, including project elements, capital and operating costs, and present values
5) The summary spreadsheet includes a first cut at what appear to some of the more cost-effective, well-defined projects for reference purposes (review summary)
6) Levels of conservation – 4, 7, 10% provided, but you can go lower or higher if you want to consider that as an alternative
Step 1 – Divide into 2 groups and select spokesperson and scribe (3 mins) Step 2 – Develop alternatives (30 - 40 mins)
• Discuss projects and answer questions • Discuss pros and cons of different projects • Brainstorm alternatives that could meet the goals (regional and organizational) • What projects or alternatives would you eliminate, and why? • What projects/alternatives remain? Do they address the needs? • Agree as a group on four alternatives. Develop rationale for alternatives. Identify any
missing information needs Step 3 – Prepare summary (2 mins) Step 4 – Share findings with group (5 mins for each group) Step 5 – Discuss alternatives and obtain agreement on 4 preliminary alternatives for analysis (15 mins) Step 6 – Confirm follow up steps to further refine alternative descriptions (5 mins)
3
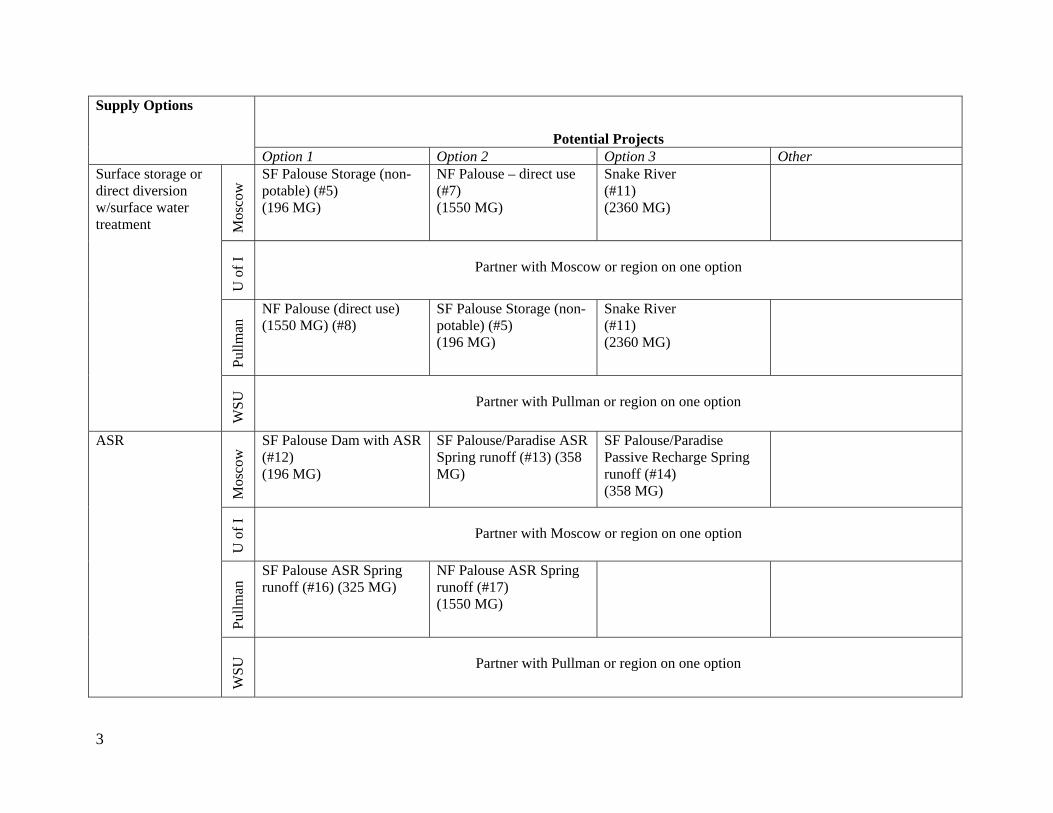
Supply Options
Potential Projects Option 1 Option 2 Option 3 Other
Surface storage or direct diversion w/surface water treatment
Mos
cow
SF Palouse Storage (non-potable) (#5) (196 MG)
NF Palouse – direct use (#7) (1550 MG)
Snake River (#11) (2360 MG)
U o
f I
Partner with Moscow or region on one option
Pullm
an NF Palouse (direct use)
(1550 MG) (#8) SF Palouse Storage (non-potable) (#5) (196 MG)
Snake River (#11) (2360 MG)
WSU
Partner with Pullman or region on one option
ASR
Mos
cow
SF Palouse Dam with ASR (#12) (196 MG)
SF Palouse/Paradise ASR Spring runoff (#13) (358 MG)
SF Palouse/Paradise Passive Recharge Spring runoff (#14) (358 MG)
U o
f I
Partner with Moscow or region on one option
Pullm
an SF Palouse ASR Spring
runoff (#16) (325 MG) NF Palouse ASR Spring runoff (#17) (1550 MG)
WSU
Partner with Pullman or region on one option
4
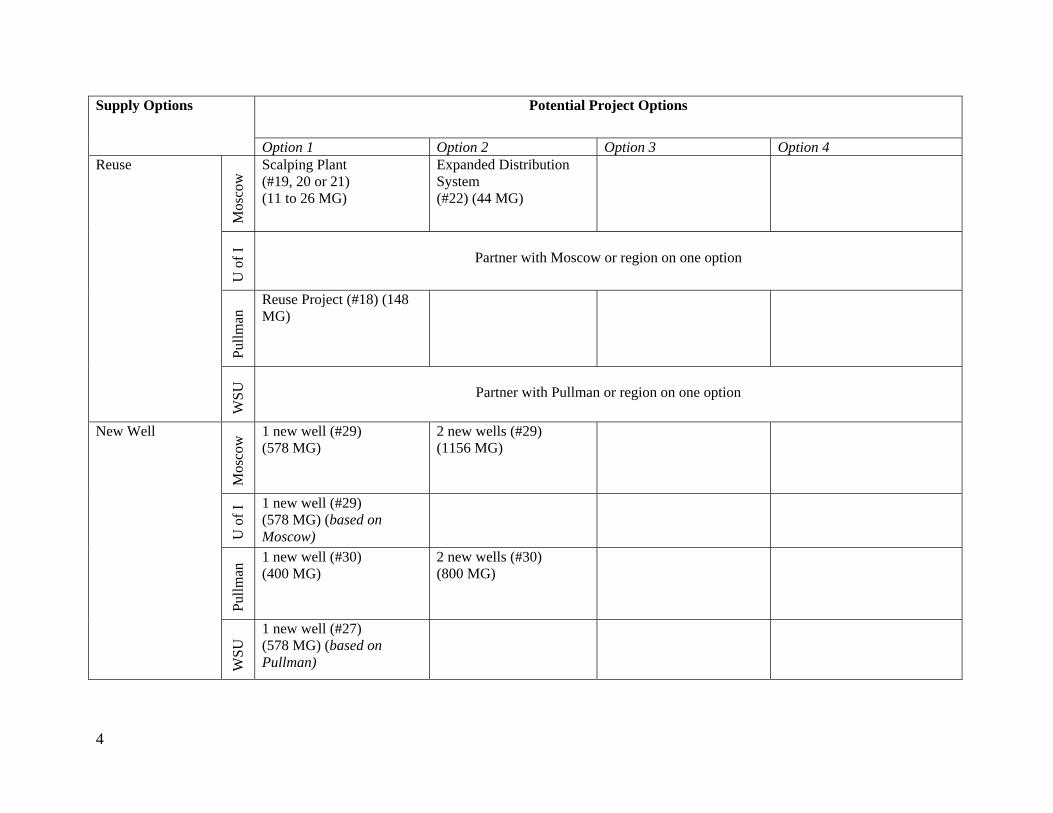
Supply Options Potential Project Options
Option 1 Option 2 Option 3 Option 4 Reuse
Mos
cow
Scalping Plant (#19, 20 or 21) (11 to 26 MG)
Expanded Distribution System (#22) (44 MG)
U o
f I
Partner with Moscow or region on one option Pu
llman
Reuse Project (#18) (148 MG)
WSU
Partner with Pullman or region on one option
New Well
Mos
cow
1 new well (#29) (578 MG)
2 new wells (#29) (1156 MG)
U o
f I 1 new well (#29)
(578 MG) (based on Moscow)
Pullm
an 1 new well (#30)
(400 MG) 2 new wells (#30) (800 MG)
WSU
1 new well (#27) (578 MG) (based on Pullman)
Water Supply Alternatives, Demands, and Conservation
Presented by Anchor QEA/HDR Team Presented to the Palouse Basin Aquifer Committee (PBAC)
PBAC Meeting – March 17, 2013Presented by Anchor QEA and HDR Inc. 1
March 17, 2016
Demand Management andTopic #1
Demand Management and Demand Projectionsj
PBAC Meeting – March 17, 2013Presented by Anchor QEA and HDR Inc. 2
Demands and Demand Management Goals
• Evaluated Historic Pumping• Evaluated Demand Projectionsj
– Without Additional Conservation– With Additional Conservation (Current Goals)– With 4% Savings by 2065– With 7% Savings by 2065
With 10% Savings by 2065– With 10% Savings by 2065
• Evaluated Per Capita Water Use• Evaluated Per Capita Winter (Indoor) Use• Evaluated Per Capita Winter (Indoor) Use
PBAC Meeting – March 17, 2013Presented by Anchor QEA and HDR Inc. 3
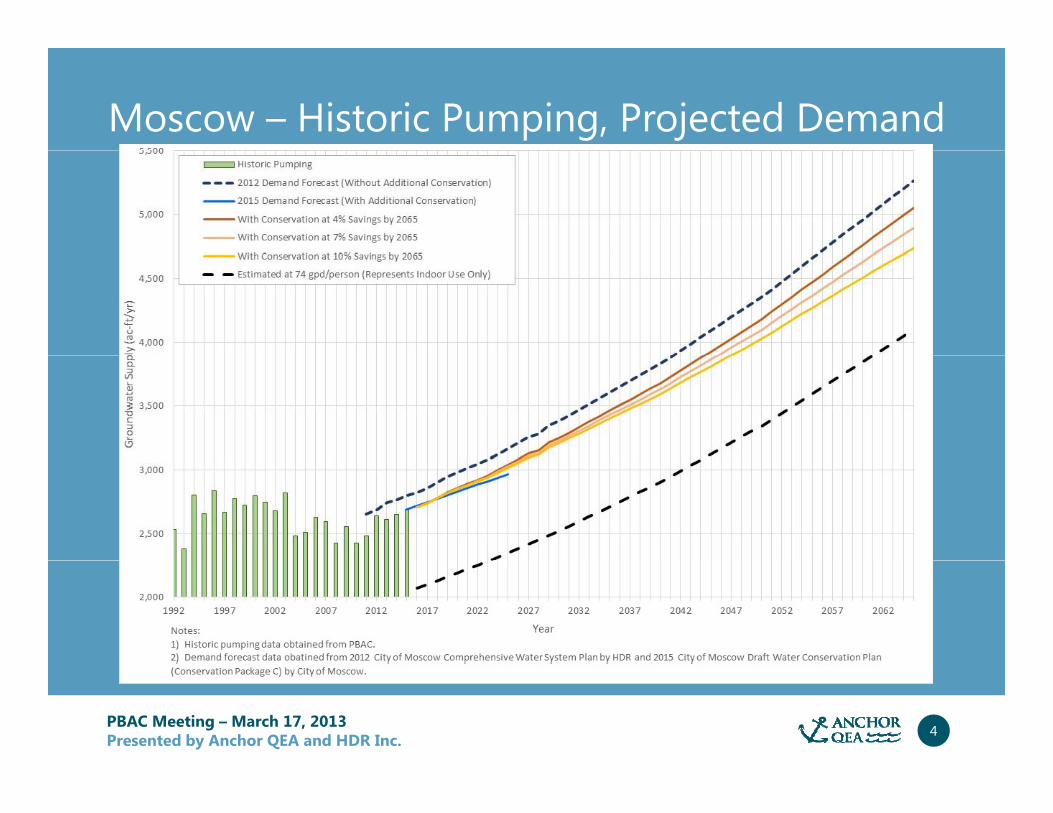
Moscow – Historic Pumping, Projected Demand
PBAC Meeting – March 17, 2013Presented by Anchor QEA and HDR Inc. 4
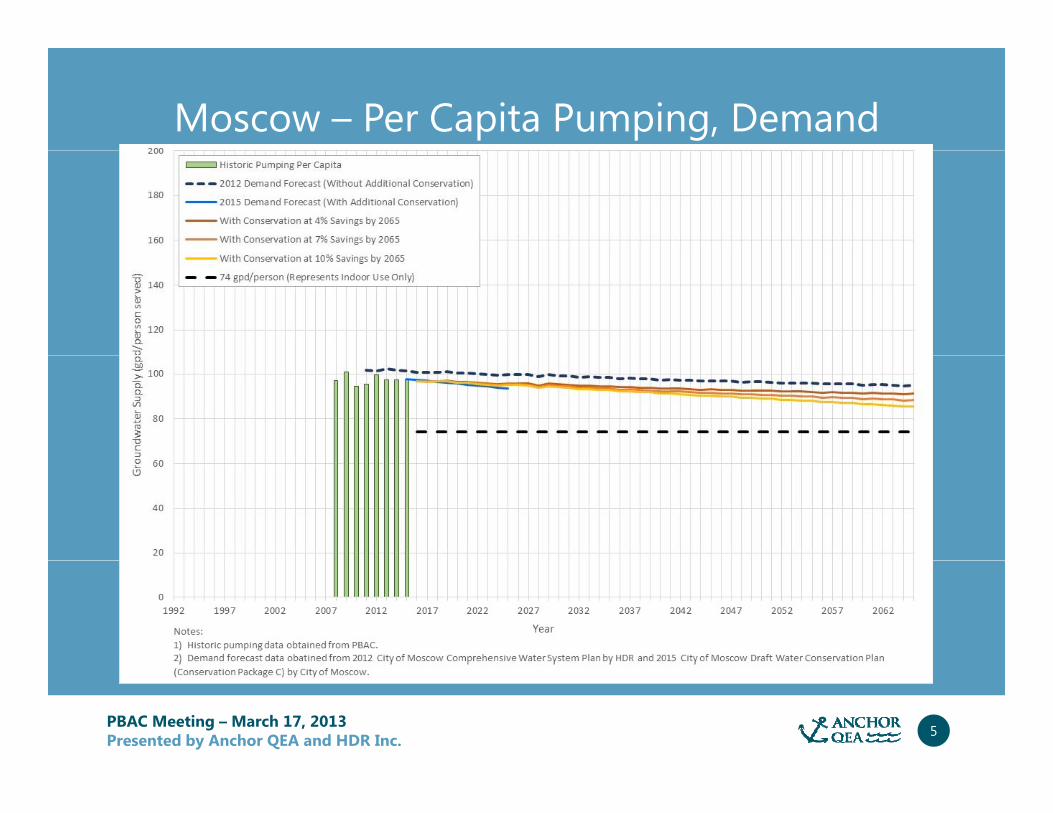
Moscow – Per Capita Pumping, Demand
PBAC Meeting – March 17, 2013Presented by Anchor QEA and HDR Inc. 5
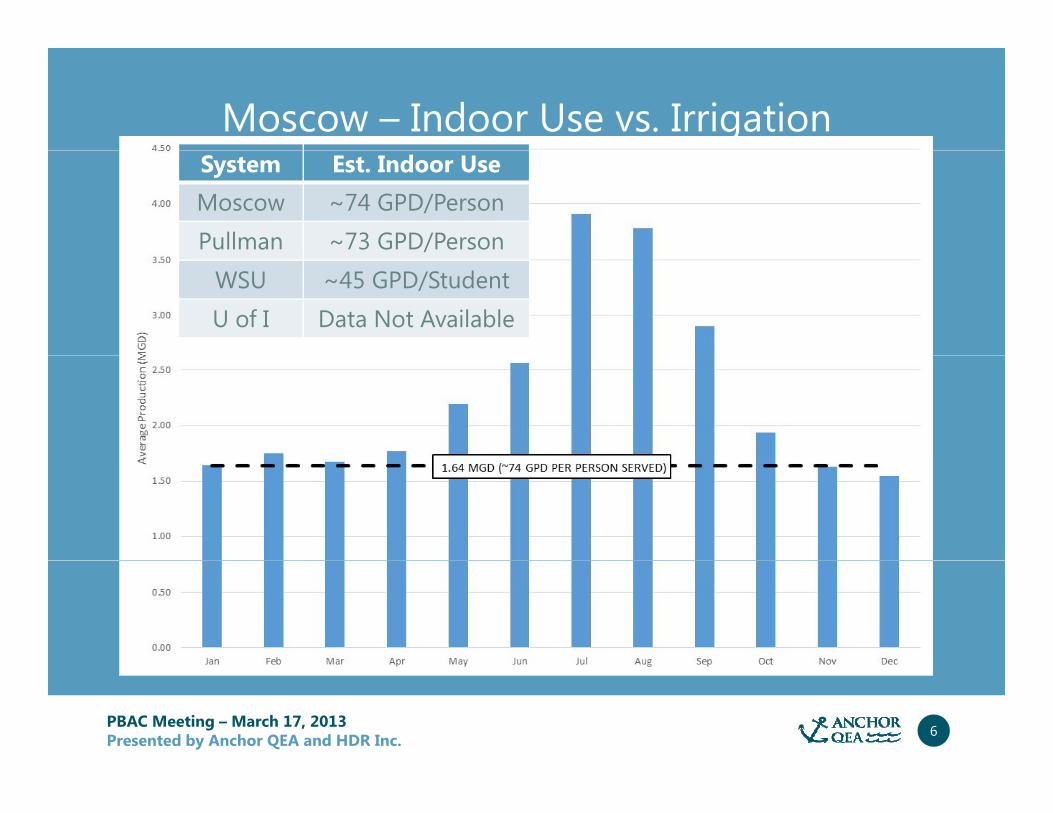
Moscow – Indoor Use vs. IrrigationSystem Est. Indoor UseMoscow ~74 GPD/PersonPullman ~73 GPD/Person
WSU ~45 GPD/StudentU of I Data Not Available
PBAC Meeting – March 17, 2013Presented by Anchor QEA and HDR Inc. 6
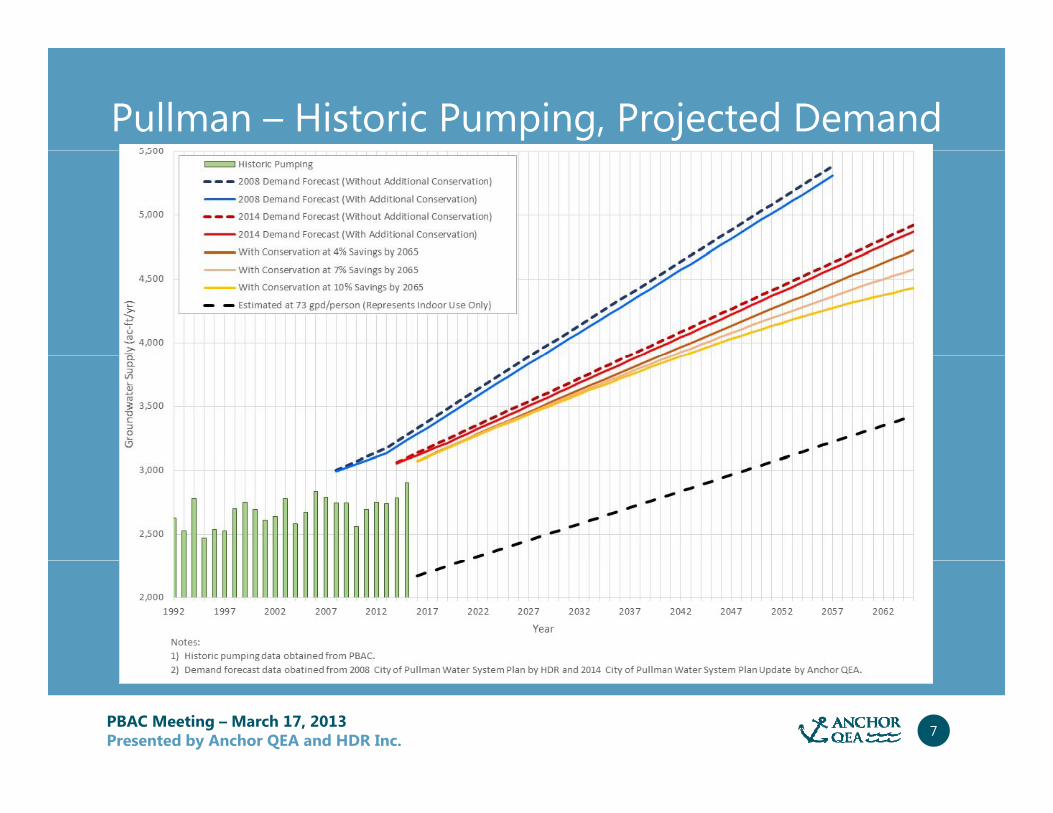
Pullman – Historic Pumping, Projected Demand
PBAC Meeting – March 17, 2013Presented by Anchor QEA and HDR Inc. 7
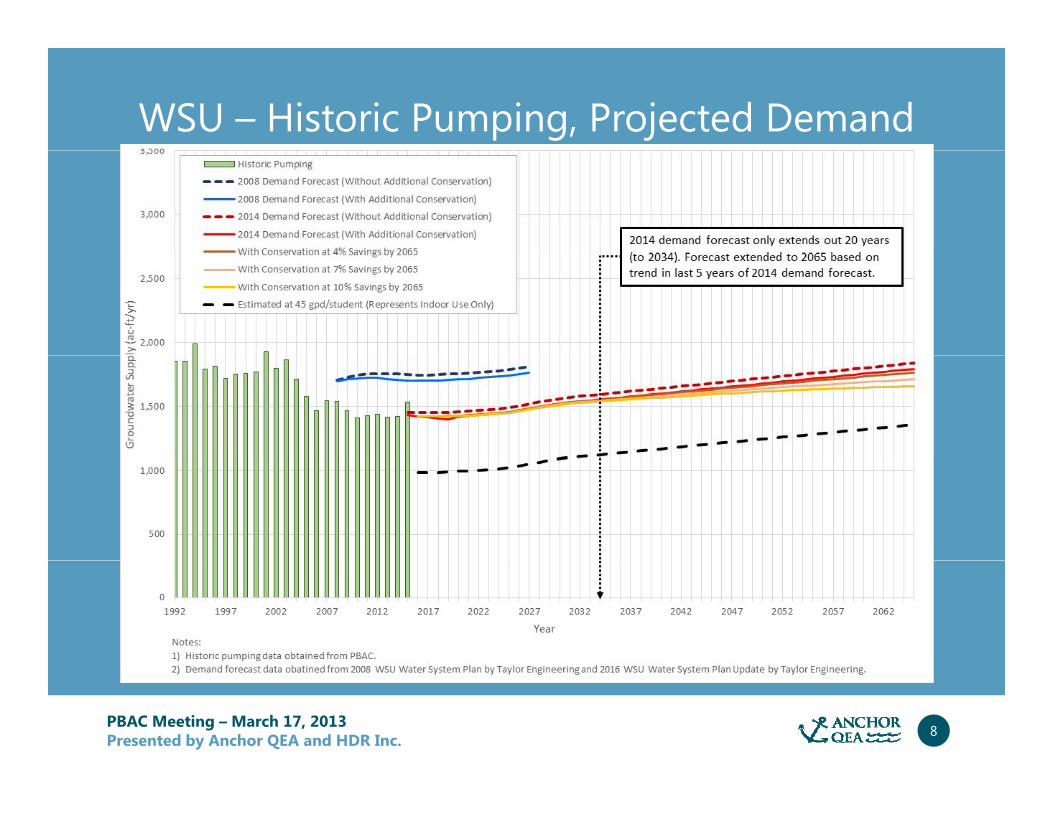
WSU – Historic Pumping, Projected Demand
PBAC Meeting – March 17, 2013Presented by Anchor QEA and HDR Inc. 8
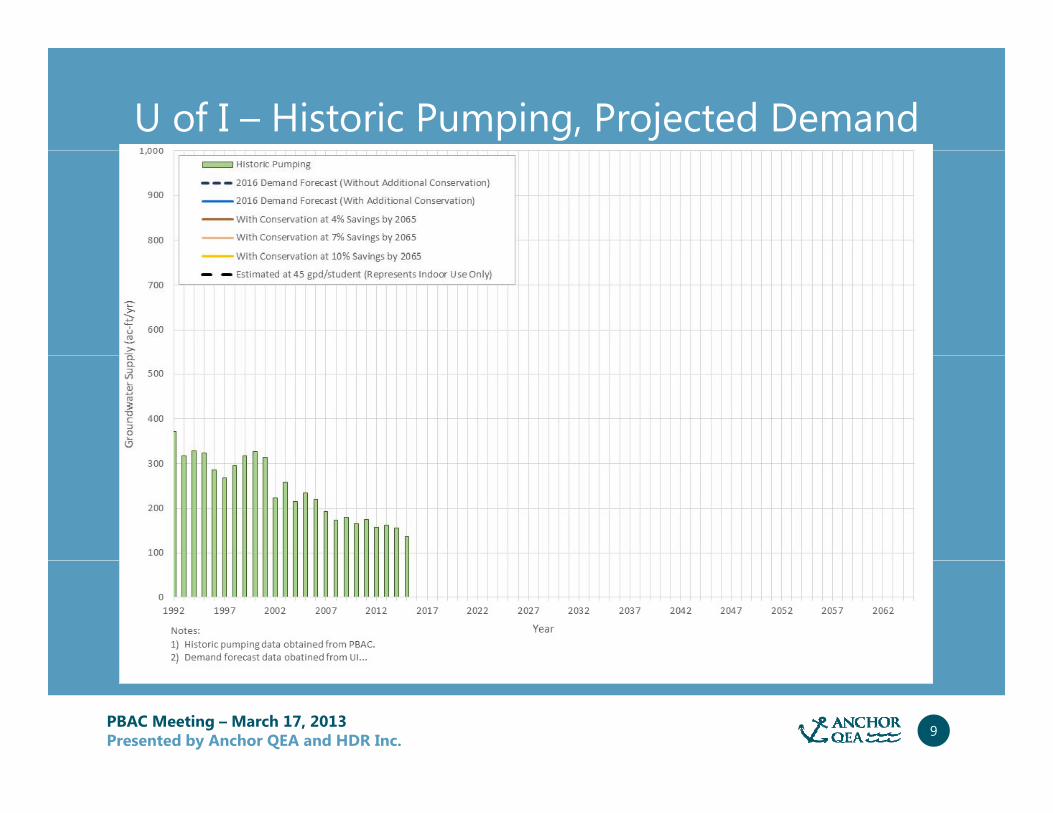
U of I – Historic Pumping, Projected Demand
PBAC Meeting – March 17, 2013Presented by Anchor QEA and HDR Inc. 9
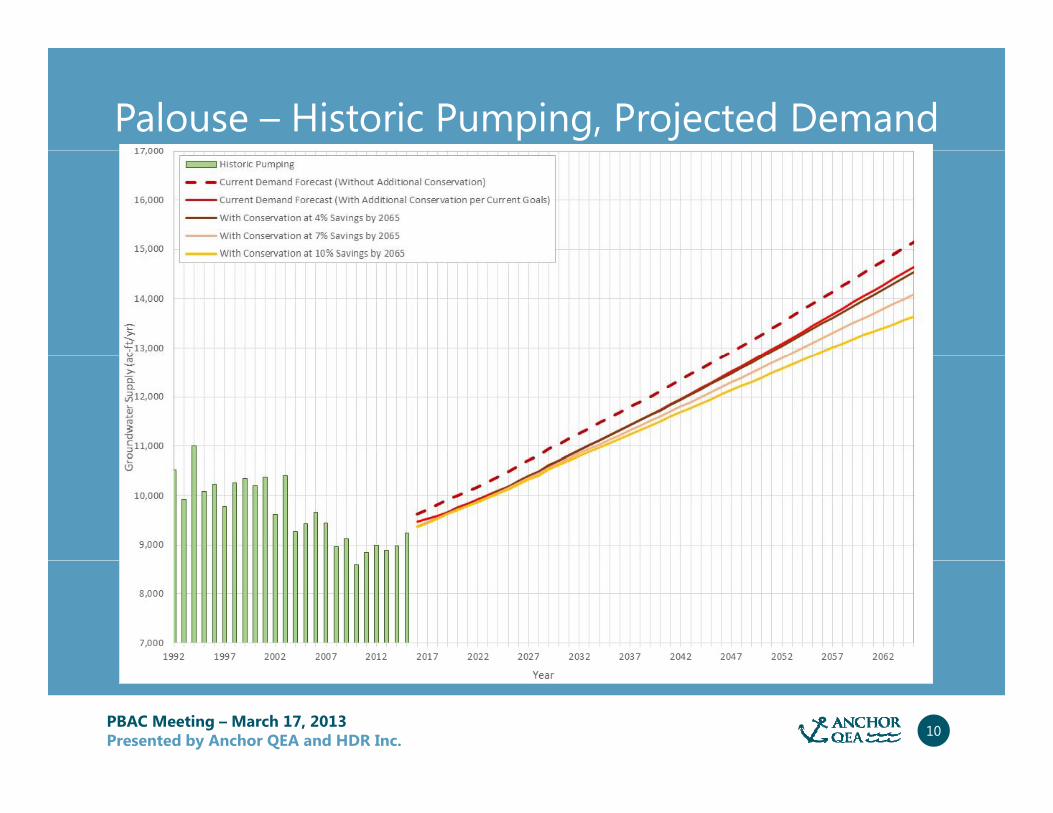
Palouse – Historic Pumping, Projected Demand
PBAC Meeting – March 17, 2013Presented by Anchor QEA and HDR Inc. 10
Water Supply ActionsTopic #2
Water Supply Actions
PBAC Meeting – March 17, 2013Presented by Anchor QEA and HDR Inc. 11
Water Supply AlternativesTopic #3
Water Supply Alternatives
PBAC Meeting – March 17, 2013Presented by Anchor QEA and HDR Inc. 12
Risks and UncertaintiesTopic #4
Risks and Uncertainties
PBAC Meeting – March 17, 2013Presented by Anchor QEA and HDR Inc. 13
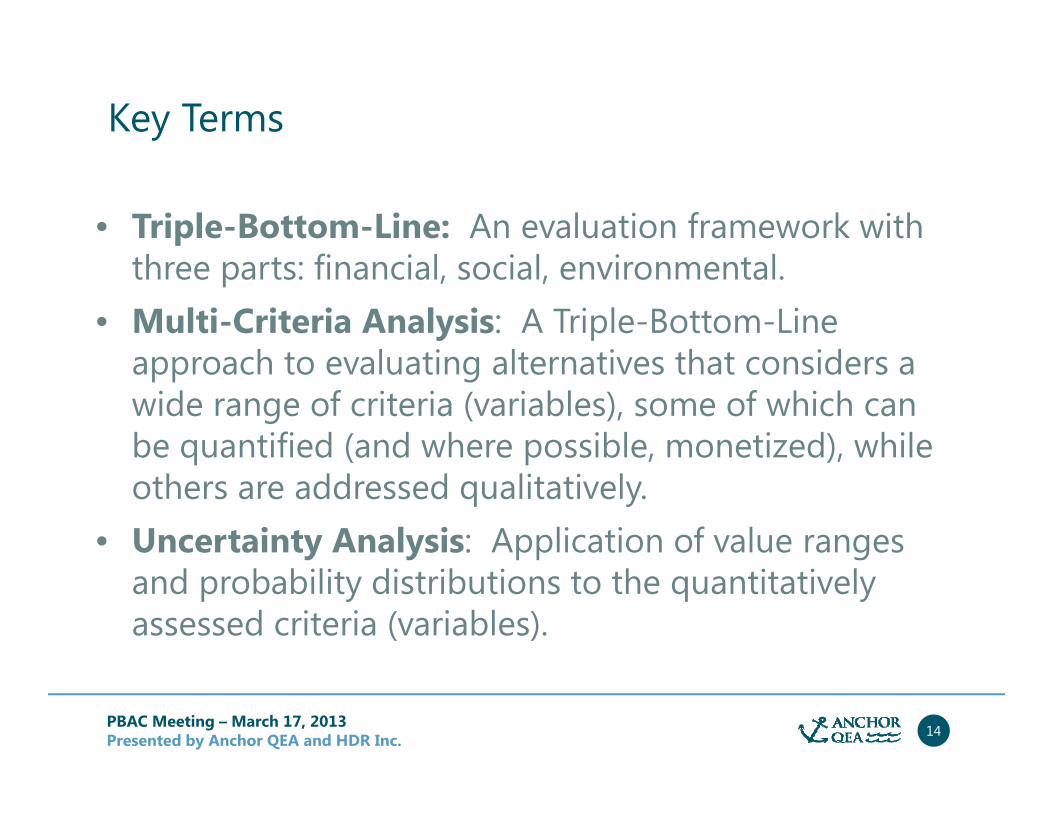
Key Terms
• Triple-Bottom-Line: An evaluation framework with three parts: financial, social, environmental.
• Multi-Criteria Analysis: A Triple-Bottom-Line h t l ti lt ti th t idapproach to evaluating alternatives that considers a
wide range of criteria (variables), some of which can be quantified (and where possible, monetized), while q ( p , ),others are addressed qualitatively.
• Uncertainty Analysis: Application of value ranges and probability distributions to the quantitatively assessed criteria (variables).
PBAC Meeting – March 17, 2013Presented by Anchor QEA and HDR Inc. 14
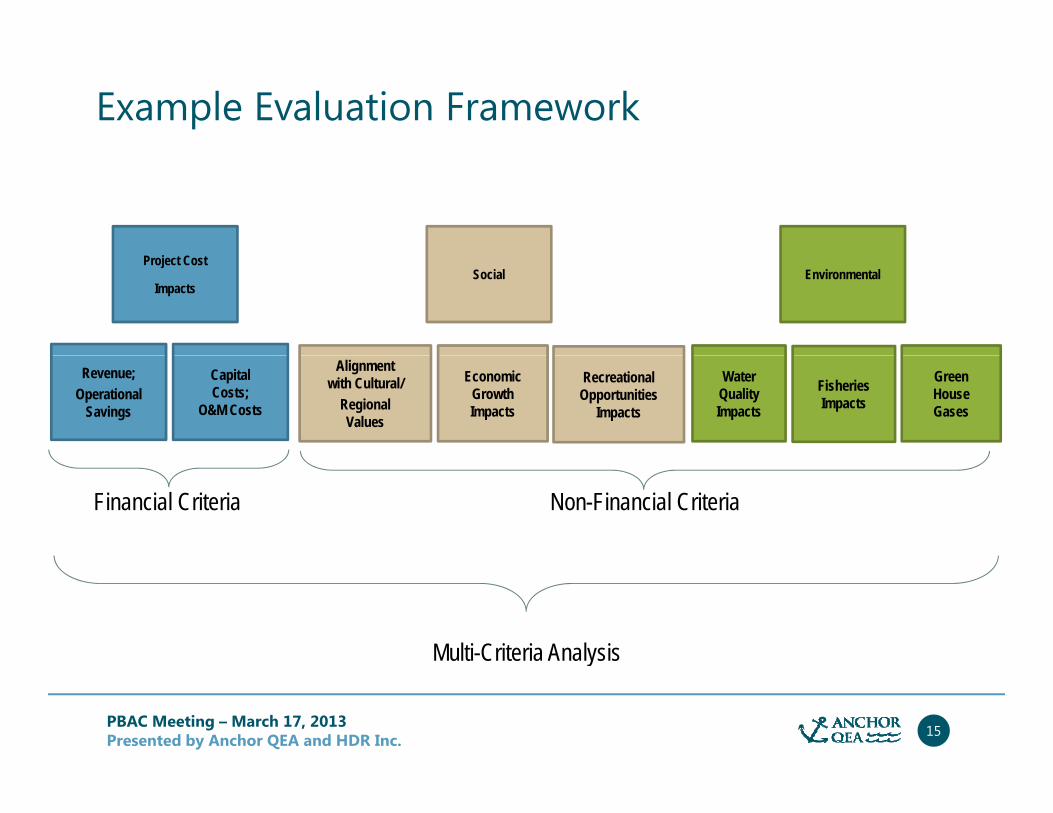
Example Evaluation Framework
Project Cost
ImpactsSocial Environmental
Revenue;Operational
Savings
Capital Costs;
O&M Costs
Alignment with Cultural/
Regional Values
Economic Growth Impacts
Water Quality Impacts
Green House Gases
Fisheries Impacts
Recreational Opportunities
Impacts
Financial Criteria Non-Financial Criteria
Multi-Criteria Analysis
PBAC Meeting – March 17, 2013Presented by Anchor QEA and HDR Inc. 15
y
• See table with criteriaSee table with criteria
PBAC Meeting – March 17, 2013Presented by Anchor QEA and HDR Inc. 16
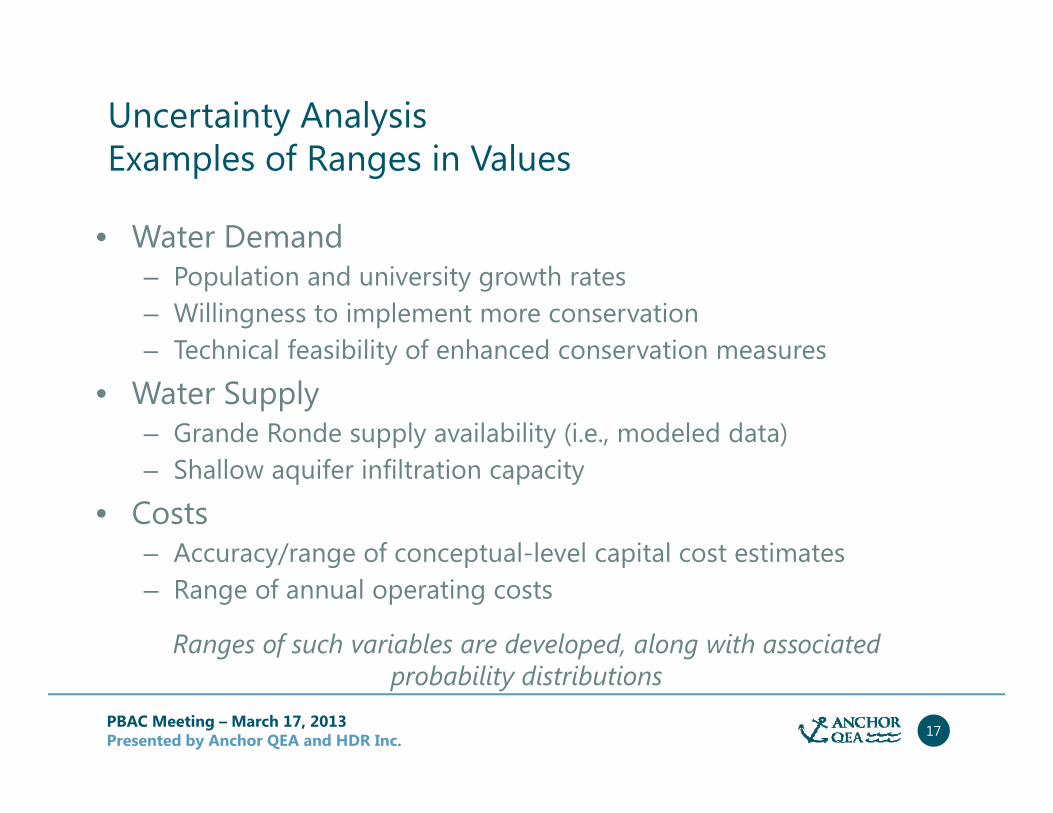
Uncertainty Analysis E l f R i V l
• Water Demand
Examples of Ranges in Values
– Population and university growth rates– Willingness to implement more conservation– Technical feasibility of enhanced conservation measuresTechnical feasibility of enhanced conservation measures
• Water Supply– Grande Ronde supply availability (i.e., modeled data)– Shallow aquifer infiltration capacity
• Costs– Accuracy/range of conceptual-level capital cost estimatesAccuracy/range of conceptual level capital cost estimates– Range of annual operating costs
Ranges of such variables are developed, along with associated
PBAC Meeting – March 17, 2013Presented by Anchor QEA and HDR Inc. 17
probability distributions
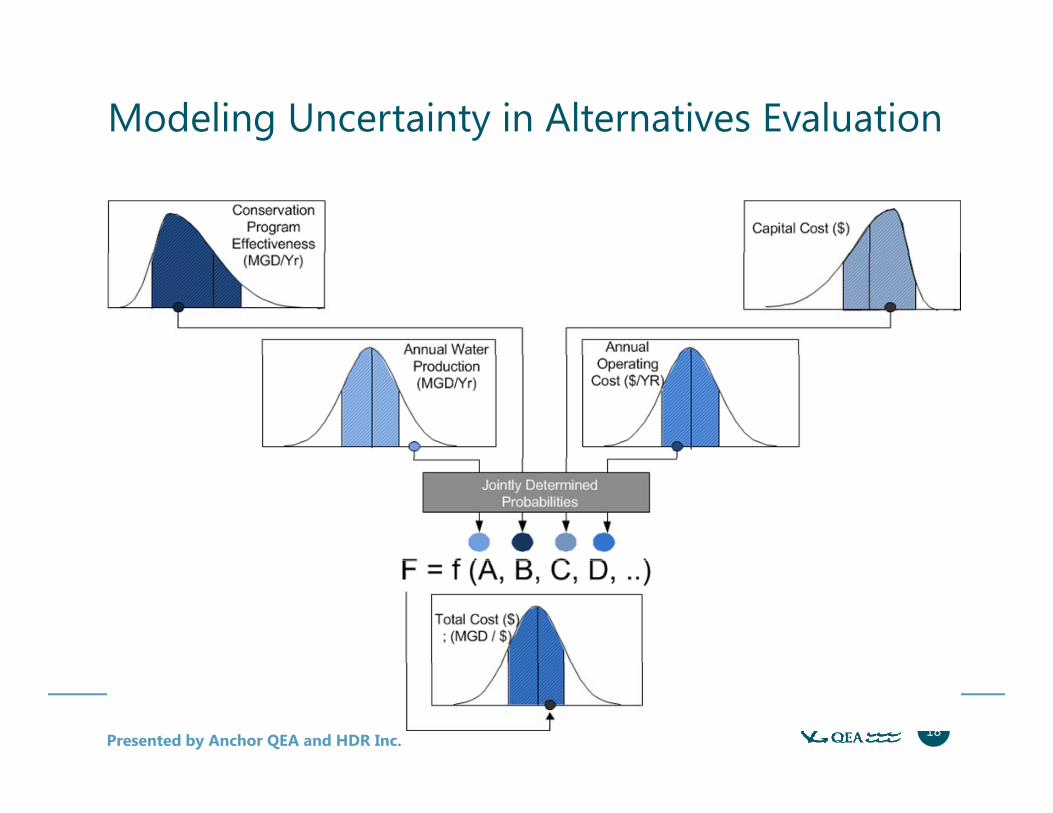
Modeling Uncertainty in Alternatives Evaluation
PBAC Meeting – March 17, 2013Presented by Anchor QEA and HDR Inc. 18
Questions/Discussion
PBAC Meeting – March 17, 2013Presented by Anchor QEA and HDR Inc. 19
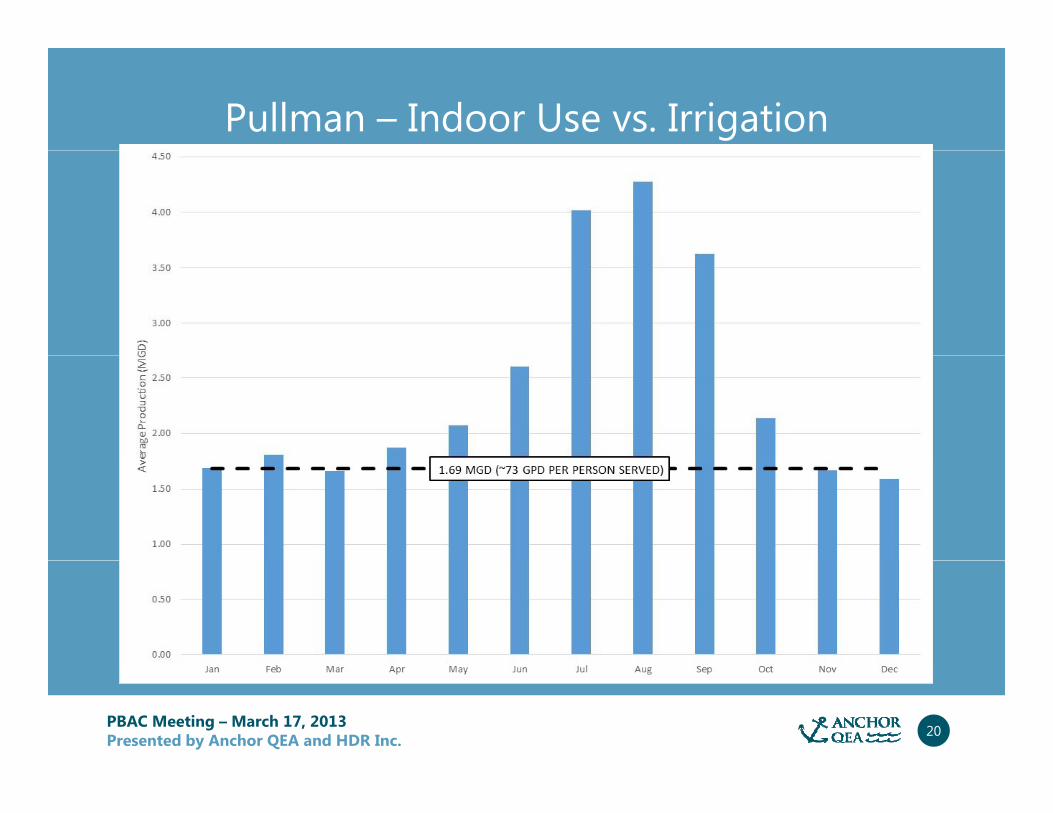
Pullman – Indoor Use vs. Irrigation
PBAC Meeting – March 17, 2013Presented by Anchor QEA and HDR Inc. 20
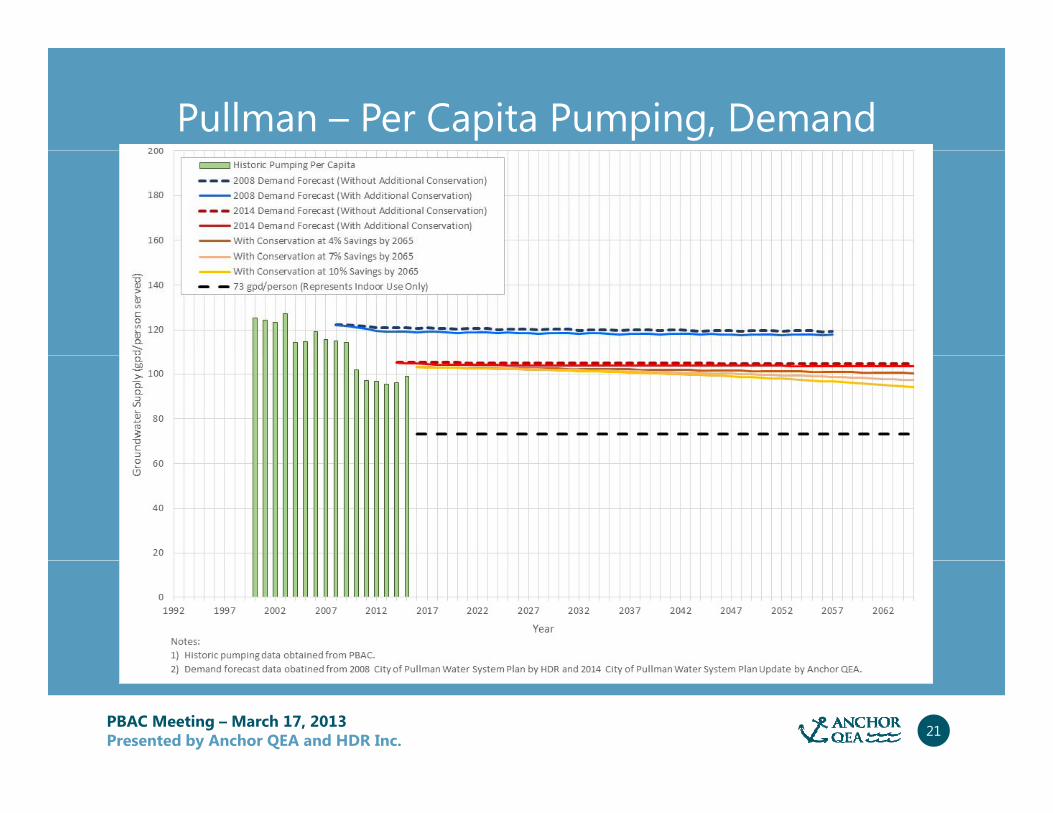
Pullman – Per Capita Pumping, Demand
PBAC Meeting – March 17, 2013Presented by Anchor QEA and HDR Inc. 21
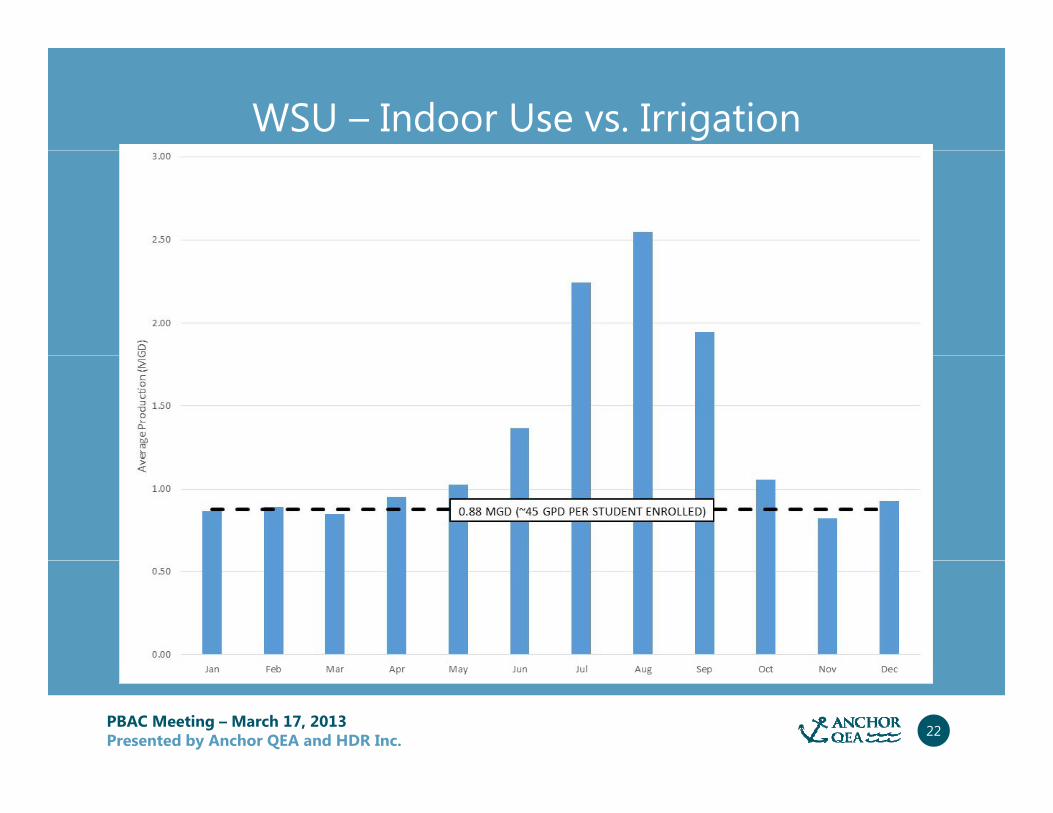
WSU – Indoor Use vs. Irrigation
PBAC Meeting – March 17, 2013Presented by Anchor QEA and HDR Inc. 22
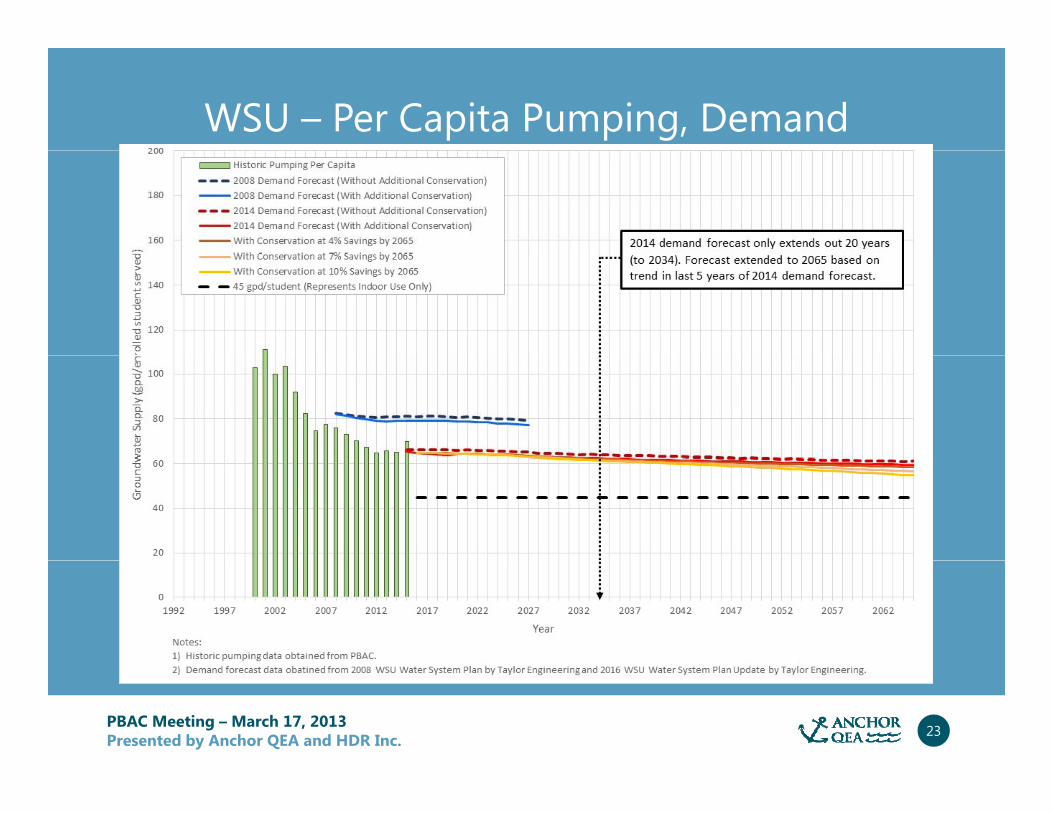
WSU – Per Capita Pumping, Demand
PBAC Meeting – March 17, 2013Presented by Anchor QEA and HDR Inc. 23
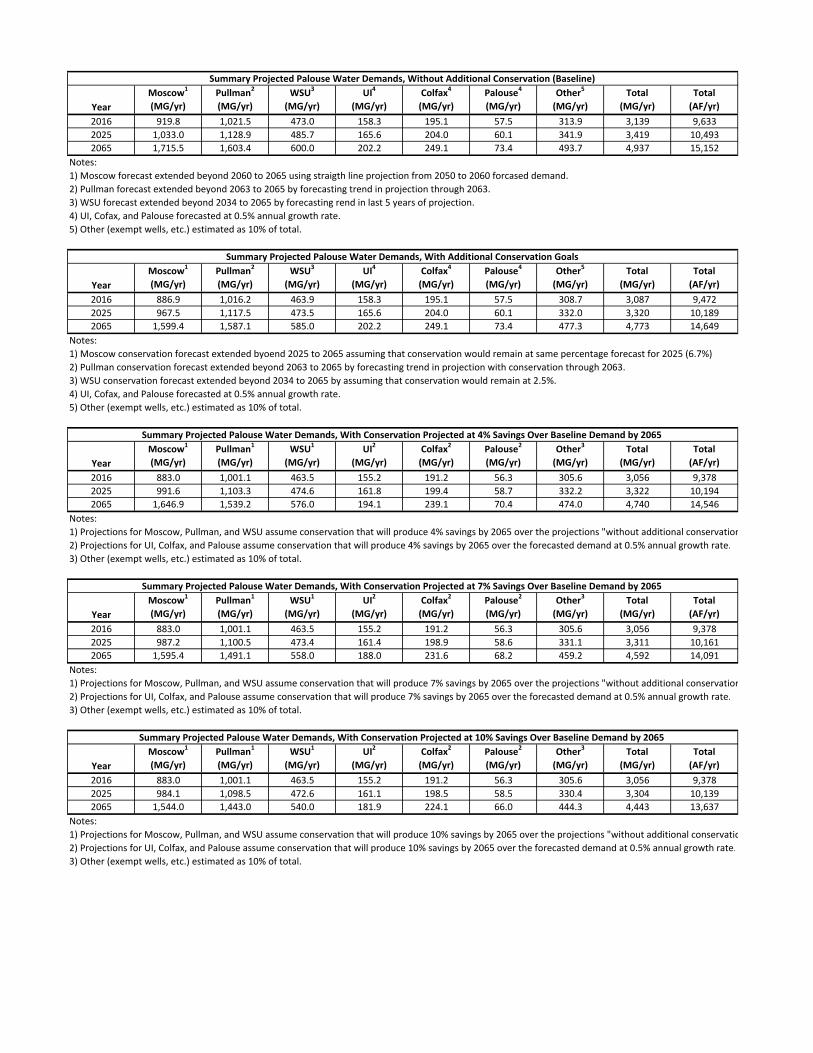
Summary Projected Palouse Water Demands, Without Additional Conservation (Baseline)
YearMoscow1
(MG/yr)Pullman2
(MG/yr)WSU3
(MG/yr)UI4
(MG/yr)Colfax4
(MG/yr)Palouse4
(MG/yr)Other5
(MG/yr)Total
(MG/yr)Total
(AF/yr)2016 919.8 1,021.5 473.0 158.3 195.1 57.5 313.9 3,139 9,6332025 1,033.0 1,128.9 485.7 165.6 204.0 60.1 341.9 3,419 10,4932065 1,715.5 1,603.4 600.0 202.2 249.1 73.4 493.7 4,937 15,152
Notes:1) Moscow forecast extended beyond 2060 to 2065 using straigth line projection from 2050 to 2060 forcased demand.2) Pullman forecast extended beyond 2063 to 2065 by forecasting trend in projection through 2063.3) WSU forecast extended beyond 2034 to 2065 by forecasting rend in last 5 years of projection.4) UI, Cofax, and Palouse forecasted at 0.5% annual growth rate.5) Other (exempt wells, etc.) estimated as 10% of total.
Summary Projected Palouse Water Demands, With Additional Conservation Goals
YearMoscow1
(MG/yr)Pullman2
(MG/yr)WSU3
(MG/yr)UI4
(MG/yr)Colfax4
(MG/yr)Palouse4
(MG/yr)Other5
(MG/yr)Total
(MG/yr)Total
(AF/yr)2016 886.9 1,016.2 463.9 158.3 195.1 57.5 308.7 3,087 9,4722025 967.5 1,117.5 473.5 165.6 204.0 60.1 332.0 3,320 10,1892065 1,599.4 1,587.1 585.0 202.2 249.1 73.4 477.3 4,773 14,649
Notes:1) Moscow conservation forecast extended byoend 2025 to 2065 assuming that conservation would remain at same percentage forecast for 2025 (6.7%).2) Pullman conservation forecast extended beyond 2063 to 2065 by forecasting trend in projection with conservation through 2063.3) WSU conservation forecast extended beyond 2034 to 2065 by assuming that conservation would remain at 2.5%.4) UI, Cofax, and Palouse forecasted at 0.5% annual growth rate.5) Other (exempt wells, etc.) estimated as 10% of total.
Summary Projected Palouse Water Demands, With Conservation Projected at 4% Savings Over Baseline Demand by 2065
YearMoscow1
(MG/yr)Pullman1
(MG/yr)WSU1
(MG/yr)UI2
(MG/yr)Colfax2
(MG/yr)Palouse2
(MG/yr)Other3
(MG/yr)Total
(MG/yr)Total
(AF/yr)2016 883.0 1,001.1 463.5 155.2 191.2 56.3 305.6 3,056 9,3782025 991.6 1,103.3 474.6 161.8 199.4 58.7 332.2 3,322 10,1942065 1,646.9 1,539.2 576.0 194.1 239.1 70.4 474.0 4,740 14,546
Notes:1) Projections for Moscow, Pullman, and WSU assume conservation that will produce 4% savings by 2065 over the projections "without additional conservation2) Projections for UI, Colfax, and Palouse assume conservation that will produce 4% savings by 2065 over the forecasted demand at 0.5% annual growth rate.3) Other (exempt wells, etc.) estimated as 10% of total.
Summary Projected Palouse Water Demands, With Conservation Projected at 7% Savings Over Baseline Demand by 2065
YearMoscow1
(MG/yr)Pullman1
(MG/yr)WSU1
(MG/yr)UI2
(MG/yr)Colfax2
(MG/yr)Palouse2
(MG/yr)Other3
(MG/yr)Total
(MG/yr)Total
(AF/yr)2016 883.0 1,001.1 463.5 155.2 191.2 56.3 305.6 3,056 9,3782025 987.2 1,100.5 473.4 161.4 198.9 58.6 331.1 3,311 10,1612065 1,595.4 1,491.1 558.0 188.0 231.6 68.2 459.2 4,592 14,091
Notes:1) Projections for Moscow, Pullman, and WSU assume conservation that will produce 7% savings by 2065 over the projections "without additional conservation2) Projections for UI, Colfax, and Palouse assume conservation that will produce 7% savings by 2065 over the forecasted demand at 0.5% annual growth rate.3) Other (exempt wells, etc.) estimated as 10% of total.
Summary Projected Palouse Water Demands, With Conservation Projected at 10% Savings Over Baseline Demand by 2065
YearMoscow1
(MG/yr)Pullman1
(MG/yr)WSU1
(MG/yr)UI2
(MG/yr)Colfax2
(MG/yr)Palouse2
(MG/yr)Other3
(MG/yr)Total
(MG/yr)Total
(AF/yr)2016 883.0 1,001.1 463.5 155.2 191.2 56.3 305.6 3,056 9,3782025 984.1 1,098.5 472.6 161.1 198.5 58.5 330.4 3,304 10,1392065 1,544.0 1,443.0 540.0 181.9 224.1 66.0 444.3 4,443 13,637
Notes:1) Projections for Moscow, Pullman, and WSU assume conservation that will produce 10% savings by 2065 over the projections "without additional conservatio2) Projections for UI, Colfax, and Palouse assume conservation that will produce 10% savings by 2065 over the forecasted demand at 0.5% annual growth rate.3) Other (exempt wells, etc.) estimated as 10% of total.
3/18/2016
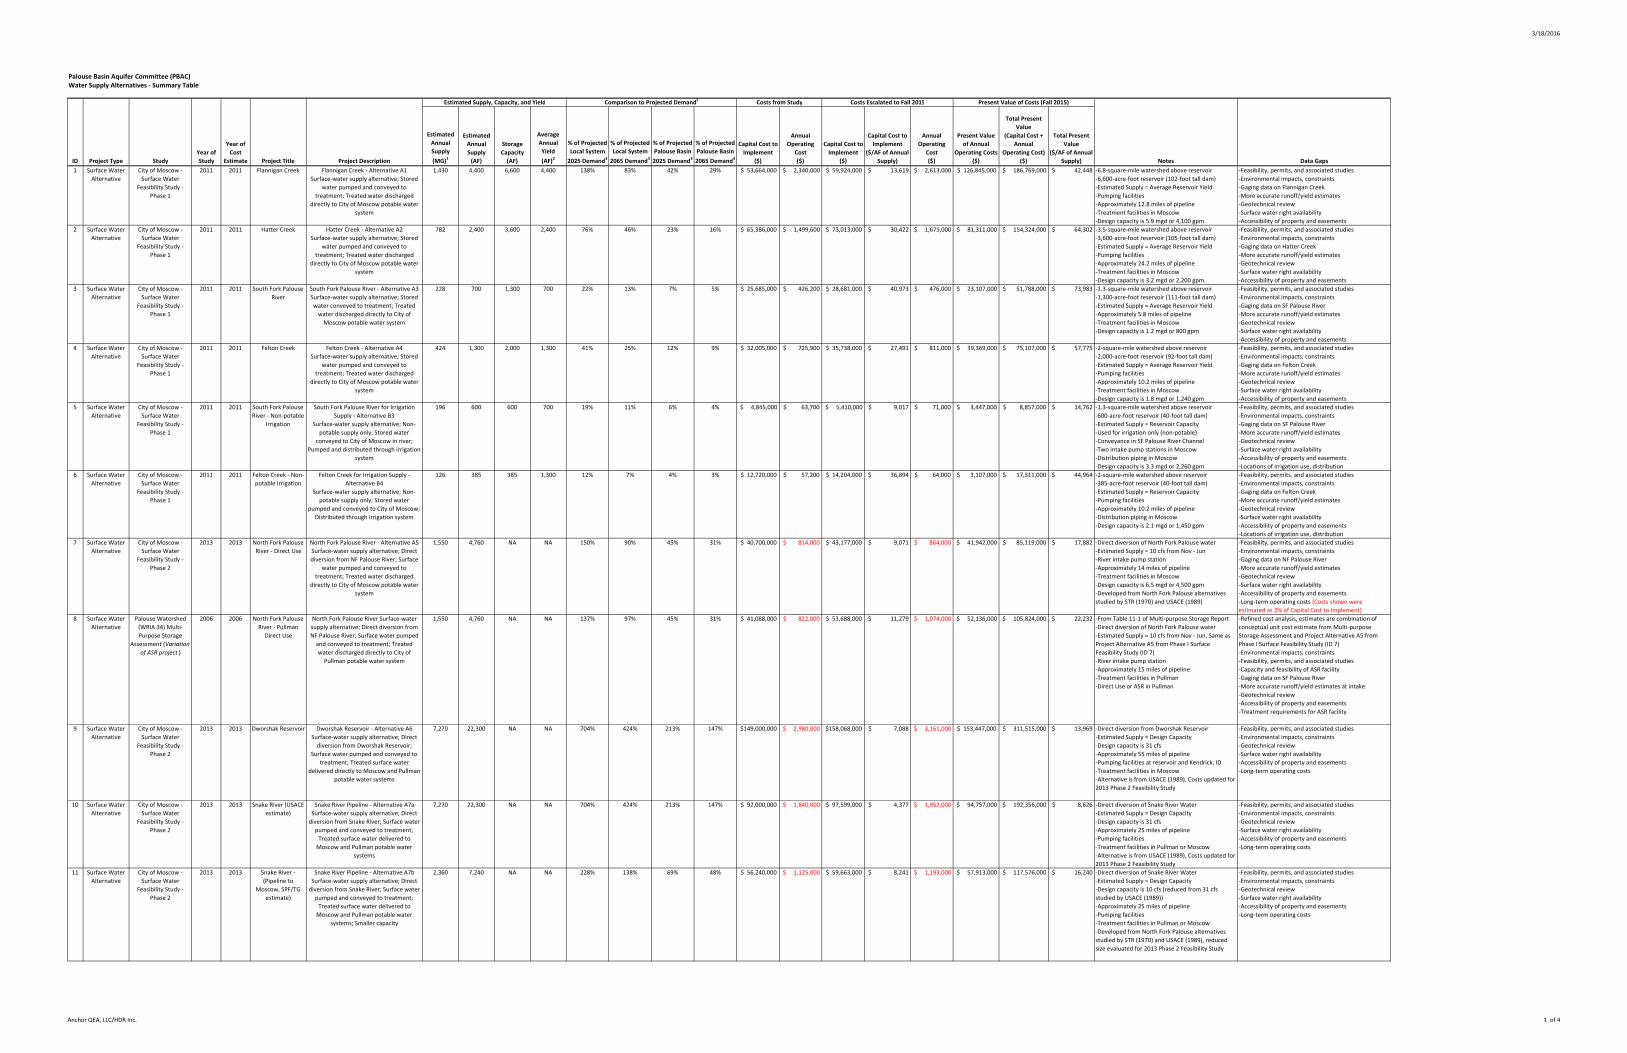
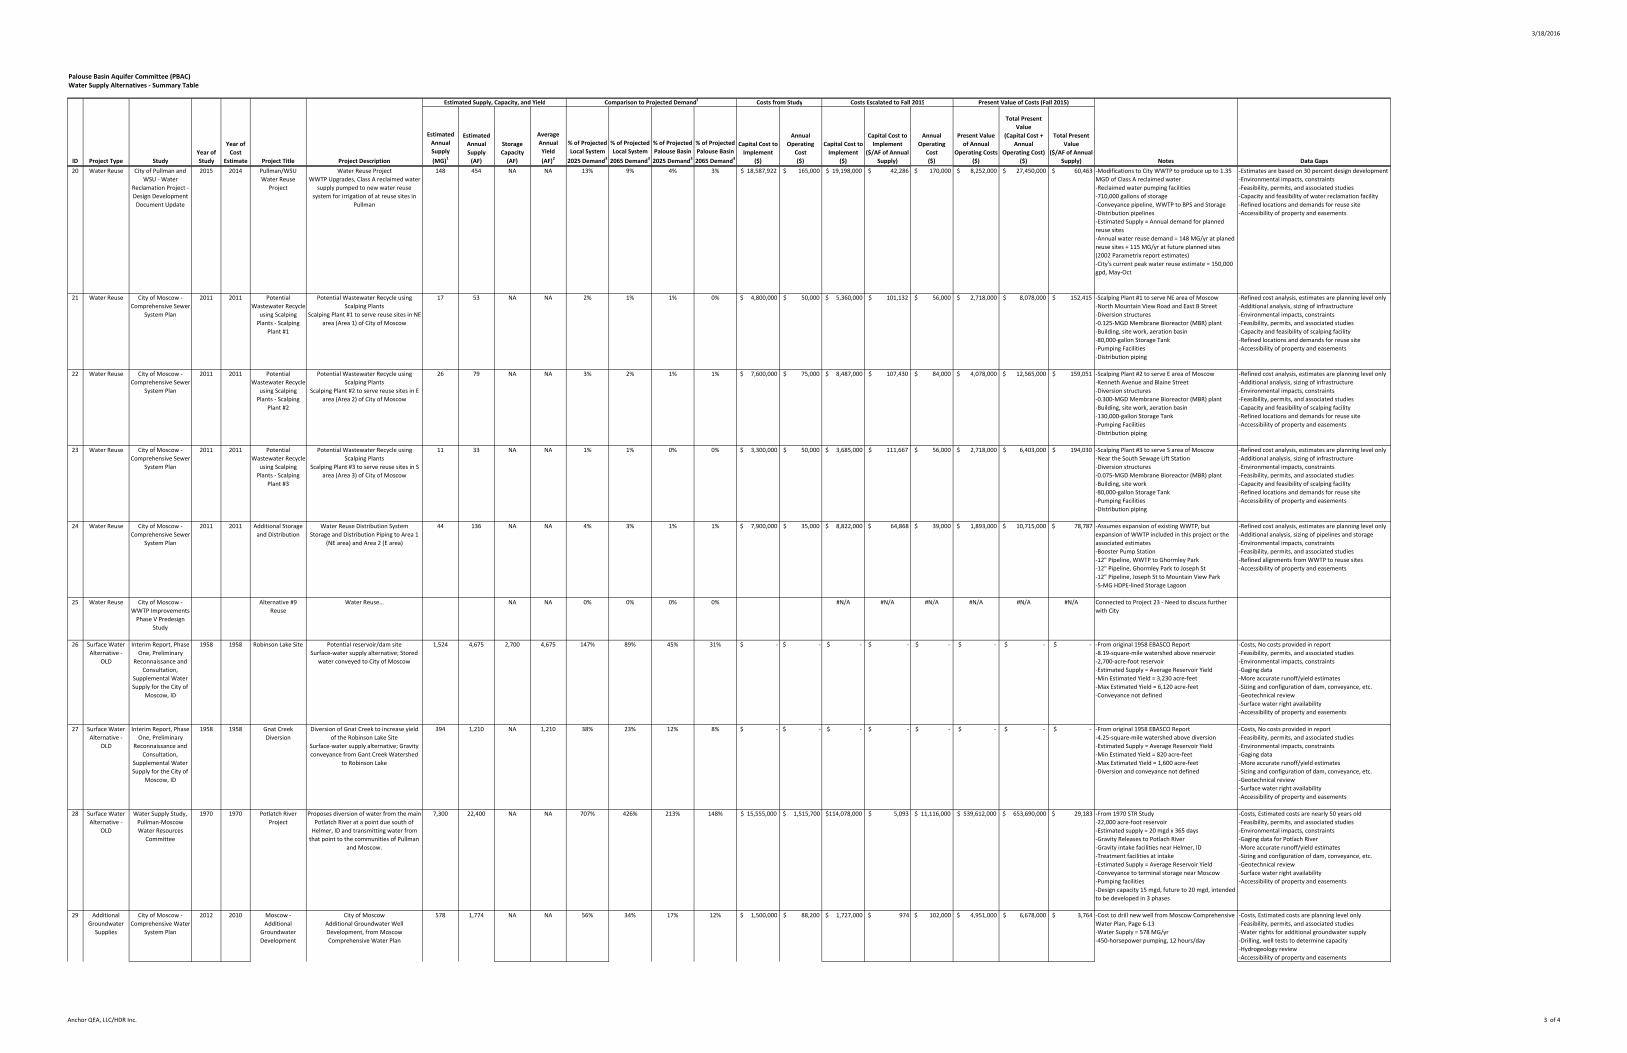
Palouse Basin Aquifer Committee (PBAC)Water Supply Alternatives - Summary Table
Estimated Supply, Capacity, and Yield Comparison to Projected Demand3 Costs from Study Costs Escalated to Fall 2015
ID Project Type StudyYear of Study
Year of Cost
Estimate Project Title Project Description
Estimated Annual Supply (MG)1
Estimated Annual Supply
(AF)
Storage Capacity
(AF)
Average Annual Yield(AF)2
% of Projected Local System
2025 Demand3
% of Projected Local System
2065 Demand3
% of Projected Palouse Basin 2025 Demand3
% of Projected Palouse Basin 2065 Demand3
Capital Cost to Implement
($)
Annual Operating
Cost($)
Capital Cost to Implement
($)
Capital Cost to Implement
($/AF of Annual Supply)
Annual Operating
Cost($)
Present Valueof Annual
Operating Costs($)
Total Present Value
(Capital Cost + Annual
Operating Cost)($)
Total Present Value
($/AF of Annual Supply) Notes Data Gaps
1 Surface Water Alternative
City of Moscow - Surface Water
Feasibility Study - Phase 1
2011 2011 Flannigan Creek Flannigan Creek - Alternative A1 Surface-water supply alternative; Stored
water pumped and conveyed to treatment; Treated water discharged
directly to City of Moscow potable water system
1,430 4,400 6,600 4,400 138% 83% 42% 29% $ 53,664,000 $ 2,340,000 $ 59,924,000 $ 13,619 $ 2,613,000 $ 126,845,000 $ 186,769,000 $ 42,448 -6.8-square-mile watershed above reservoir-6,600-acre-foot reservoir (102-foot tall dam)-Estimated Supply = Average Reservoir Yield-Pumping facilities-Approximately 12.8 miles of pipeline-Treatment facilities in Moscow-Design capacity is 5.9 mgd or 4,100 gpm.
-Feasibility, permits, and associated studies-Environmental impacts, constraints-Gaging data on Flannigan Creek-More accurate runoff/yield estimates-Geotechnical review-Surface water right availability-Accessibility of property and easements
2 Surface Water Alternative
City of Moscow - Surface Water
Feasibility Study - Phase 1
2011 2011 Hatter Creek Hatter Creek - Alternative A2Surface-water supply alternative; Stored
water pumped and conveyed to treatment; Treated water discharged
directly to City of Moscow potable water system
782 2,400 3,600 2,400 76% 46% 23% 16% $ 65,386,000 $ 1,499,600 $ 73,013,000 $ 30,422 $ 1,675,000 $ 81,311,000 $ 154,324,000 $ 64,302 -3.5-square-mile watershed above reservoir-3,600-acre-foot reservoir (105-foot tall dam)-Estimated Supply = Average Reservoir Yield-Pumping facilities-Approximately 24.2 miles of pipeline-Treatment facilities in Moscow-Design capacity is 3.2 mgd or 2,200 gpm.
-Feasibility, permits, and associated studies-Environmental impacts, constraints-Gaging data on Hatter Creek-More accurate runoff/yield estimates-Geotechnical review-Surface water right availability-Accessibility of property and easements
3 Surface Water Alternative
City of Moscow - Surface Water
Feasibility Study - Phase 1
2011 2011 South Fork Palouse River
South Fork Palouse River - Alternative A3Surface-water supply alternative; Stored water conveyed to treatment; Treated
water discharged directly to City of Moscow potable water system
228 700 1,300 700 22% 13% 7% 5% $ 25,685,000 $ 426,200 $ 28,681,000 $ 40,973 $ 476,000 $ 23,107,000 $ 51,788,000 $ 73,983 -1.3-square-mile watershed above reservoir-1,300-acre-foot reservoir (111-foot tall dam)-Estimated Supply = Average Reservoir Yield-Approximately 5.8 miles of pipeline-Treatment facilities in Moscow-Design capacity is 1.2 mgd or 800 gpm
-Feasibility, permits, and associated studies-Environmental impacts, constraints-Gaging data on SF Palouse River-More accurate runoff/yield estimates-Geotechnical review-Surface water right availability-Accessibility of property and easements
4 Surface Water Alternative
City of Moscow - Surface Water
Feasibility Study - Phase 1
2011 2011 Felton Creek Felton Creek - Alternative A4Surface-water supply alternative; Stored
water pumped and conveyed to treatment; Treated water discharged
directly to City of Moscow potable water system
424 1,300 2,000 1,300 41% 25% 12% 9% $ 32,005,000 $ 725,900 $ 35,738,000 $ 27,491 $ 811,000 $ 39,369,000 $ 75,107,000 $ 57,775 -2-square-mile watershed above reservoir-2,000-acre-foot reservoir (92-foot tall dam)-Estimated Supply = Average Reservoir Yield-Pumping facilities-Approximately 10.2 miles of pipeline-Treatment facilities in Moscow-Design capacity is 1.8 mgd or 1,240 gpm
-Feasibility, permits, and associated studies-Environmental impacts, constraints-Gaging data on Felton Creek-More accurate runoff/yield estimates-Geotechnical review-Surface water right availability-Accessibility of property and easements
5 Surface Water Alternative
City of Moscow - Surface Water
Feasibility Study - Phase 1
2011 2011 South Fork Palouse River - Non-potable
Irrigation
South Fork Palouse River for Irrigation Supply - Alternative B3
Surface-water supply alternative; Non-potable supply only; Stored water
conveyed to City of Moscow in river; Pumped and distributed through irrigation
system
196 600 600 700 19% 11% 6% 4% $ 4,845,000 $ 63,700 $ 5,410,000 $ 9,017 $ 71,000 $ 3,447,000 $ 8,857,000 $ 14,762 -1.3-square-mile watershed above reservoir-600-acre-foot reservoir (40-foot tall dam)-Estimated Supply = Reservoir Capacity-Used for irrigation only (non-potable)-Conveyance in SF Palouse River Channel-Two intake pump stations in Moscow-Distribution piping in Moscow-Design capacity is 3.3 mgd or 2,260 gpm
-Feasibility, permits, and associated studies-Environmental impacts, constraints-Gaging data on SF Palouse River-More accurate runoff/yield estimates-Geotechnical review-Surface water right availability-Accessibility of property and easements-Locations of irrigation use, distribution
6 Surface Water Alternative
City of Moscow - Surface Water
Feasibility Study - Phase 1
2011 2011 Felton Creek - Non-potable Irrigation
Felton Creek for Irrigation Supply - Alternative B4
Surface-water supply alternative; Non-potable supply only; Stored water
pumped and conveyed to City of Moscow; Distributed through irrigation system
126 385 385 1,300 12% 7% 4% 3% $ 12,720,000 $ 57,200 $ 14,204,000 $ 36,894 $ 64,000 $ 3,107,000 $ 17,311,000 $ 44,964 -2-square-mile watershed above reservoir-385-acre-foot reservoir (40-foot tall dam)-Estimated Supply = Reservoir Capacity-Pumping facilities-Approximately 10.2 miles of pipeline-Distribution piping in Moscow-Design capacity is 2.1 mgd or 1,450 gpm
-Feasibility, permits, and associated studies-Environmental impacts, constraints-Gaging data on Felton Creek-More accurate runoff/yield estimates-Geotechnical review-Surface water right availability-Accessibility of property and easements-Locations of irrigation use, distribution
7 Surface Water Alternative
City of Moscow - Surface Water
Feasibility Study - Phase 2
2013 2013 North Fork Palouse River - Direct Use
North Fork Palouse River - Alternative A5Surface-water supply alternative; Direct diversion from NF Palouse River; Surface
water pumped and conveyed to treatment; Treated water discharged
directly to City of Moscow potable water system
1,550 4,760 NA NA 150% 90% 45% 31% $ 40,700,000 $ 814,000 $ 43,177,000 $ 9,071 $ 864,000 $ 41,942,000 $ 85,119,000 $ 17,882 -Direct diversion of North Fork Palouse water-Estimated Supply = 10 cfs from Nov - Jun-River intake pump station-Approximately 14 miles of pipeline-Treatment facilities in Moscow-Design capacity is 6.5 mgd or 4,500 gpm-Developed from North Fork Palouse alternatives studied by STR (1970) and USACE (1989)
-Feasibility, permits, and associated studies-Environmental impacts, constraints-Gaging data on NF Palouse River-More accurate runoff/yield estimates-Geotechnical review-Surface water right availability-Accessibility of property and easements-Long-term operating costs (Costs shown were estimated as 2% of Capital Cost to Implement)
8 Surface Water Alternative
Palouse Watershed (WRIA 34) Multi-Purpose Storage
Assessment (Variation of ASR project )
2006 2006 North Fork Palouse River - Pullman
Direct Use
North Fork Palouse River Surface-water supply alternative; Direct diversion from NF Palouse River; Surface water pumped
and conveyed to treatment; Treated water discharged directly to City of
Pullman potable water system
1,550 4,760 NA NA 137% 97% 45% 31% $ 41,088,000 $ 822,000 $ 53,688,000 $ 11,279 $ 1,074,000 $ 52,136,000 $ 105,824,000 $ 22,232 -From Table 11-1 of Multi-purpose Storage Report-Direct diversion of North Fork Palouse water-Estimated Supply = 10 cfs from Nov - Jun, Same as Project Alternative A5 from Phase I Surface Feasibility Study (ID 7)-River intake pump station-Approximately 15 miles of pipeline-Treatment facilities in Pullman-Direct Use or ASR in Pullman
-Refined cost analysis, estimates are combination of conceptual unit cost estimate from Multi-purpose Storage Assessment and Project Alternative A5 from Phase I Surface Feasibility Study (ID 7)-Environmental impacts, constraints-Feasibility, permits, and associated studies-Capacity and feasibility of ASR facility-Gaging data on SF Palouse River-More accurate runoff/yield estimates at intake-Geotechnical review-Accessibility of property and easements-Treatment requirements for ASR facility
9 Surface Water Alternative
City of Moscow - Surface Water
Feasibility Study - Phase 2
2013 2013 Dworshak Reservoir Dworshak Reservoir - Alternative A6Surface-water supply alternative; Direct
diversion from Dworshak Reservoir; Surface water pumped and conveyed to
treatment; Treated surface water delivered directly to Moscow and Pullman
potable water systems
7,270 22,300 NA NA 704% 424% 213% 147% $149,000,000 $ 2,980,000 $158,068,000 $ 7,088 $ 3,161,000 $ 153,447,000 $ 311,515,000 $ 13,969 -Direct diversion from Dworshak Reservoir-Estimated Supply = Design Capacity-Design capacity is 31 cfs-Approximately 55 miles of pipeline-Pumping facilities at reservoir and Kendrick, ID-Treatment facilities in Moscow-Alternative is from USACE (1989), Costs updated for 2013 Phase 2 Feasibility Study
-Feasibility, permits, and associated studies-Environmental impacts, constraints-Geotechnical review-Surface water right availability-Accessibility of property and easements-Long-term operating costs
10 Surface Water Alternative
City of Moscow - Surface Water
Feasibility Study - Phase 2
2013 2013 Snake River (USACE estimate)
Snake River Pipeline - Alternative A7aSurface-water supply alternative; Direct
diversion from Snake River; Surface water pumped and conveyed to treatment;
Treated surface water delivered to Moscow and Pullman potable water
systems
7,270 22,300 NA NA 704% 424% 213% 147% $ 92,000,000 $ 1,840,000 $ 97,599,000 $ 4,377 $ 1,952,000 $ 94,757,000 $ 192,356,000 $ 8,626 -Direct diversion of Snake River Water-Estimated Supply = Design Capacity-Design capacity is 31 cfs-Approximately 25 miles of pipeline-Pumping facilities-Treatment facilities in Pullman or Moscow-Alternative is from USACE (1989), Costs updated for 2013 Phase 2 Feasibility Study
-Feasibility, permits, and associated studies-Environmental impacts, constraints-Geotechnical review-Surface water right availability-Accessibility of property and easements-Long-term operating costs
11 Surface Water Alternative
City of Moscow - Surface Water
Feasibility Study - Phase 2
2013 2013 Snake River -(Pipeline to
Moscow, SPF/TG estimate)
Snake River Pipeline - Alternative A7bSurface-water supply alternative; Direct
diversion from Snake River; Surface water pumped and conveyed to treatment;
Treated surface water delivered to Moscow and Pullman potable water
systems; Smaller capacity
2,360 7,240 NA NA 228% 138% 69% 48% $ 56,240,000 $ 1,125,000 $ 59,663,000 $ 8,241 $ 1,193,000 $ 57,913,000 $ 117,576,000 $ 16,240 -Direct diversion of Snake River Water-Estimated Supply = Design Capacity-Design capacity is 10 cfs (reduced from 31 cfs studied by USACE (1989))-Approximately 25 miles of pipeline-Pumping facilities-Treatment facilities in Pullman or Moscow-Developed from North Fork Palouse alternatives studied by STR (1970) and USACE (1989), reduced size evaluated for 2013 Phase 2 Feasibility Study
-Feasibility, permits, and associated studies-Environmental impacts, constraints-Geotechnical review-Surface water right availability-Accessibility of property and easements-Long-term operating costs
Present Value of Costs (Fall 2015)
Anchor QEA, LLC/HDR Inc. 1 of 4
3/18/2016
Palouse Basin Aquifer Committee (PBAC)Water Supply Alternatives - Summary Table
Estimated Supply, Capacity, and Yield Comparison to Projected Demand3 Costs from Study Costs Escalated to Fall 2015
ID Project Type StudyYear of Study
Year of Cost
Estimate Project Title Project Description
Estimated Annual Supply (MG)1
Estimated Annual Supply
(AF)
Storage Capacity
(AF)
Average Annual Yield(AF)2
% of Projected Local System
2025 Demand3
% of Projected Local System
2065 Demand3
% of Projected Palouse Basin 2025 Demand3
% of Projected Palouse Basin 2065 Demand3
Capital Cost to Implement
($)
Annual Operating
Cost($)
Capital Cost to Implement
($)
Capital Cost to Implement
($/AF of Annual Supply)
Annual Operating
Cost($)
Present Valueof Annual
Operating Costs($)
Total Present Value
(Capital Cost + Annual
Operating Cost)($)
Total Present Value
($/AF of Annual Supply) Notes Data Gaps
Present Value of Costs (Fall 2015)
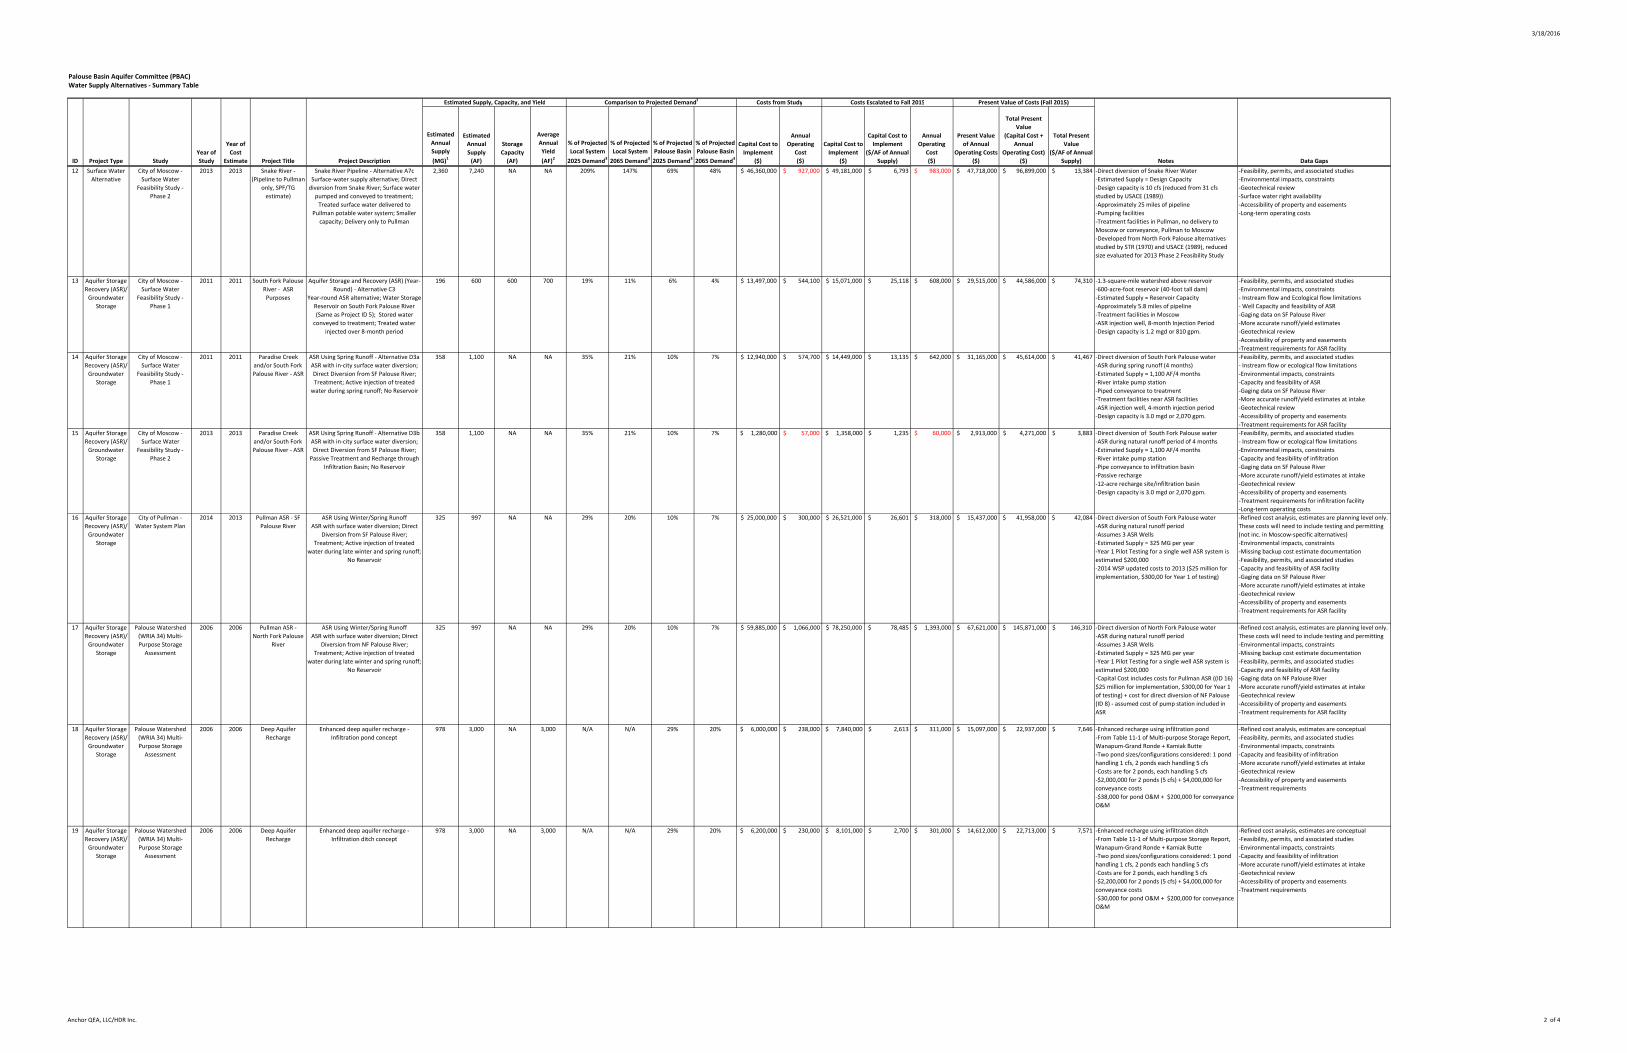
12 Surface Water Alternative
City of Moscow - Surface Water
Feasibility Study - Phase 2
2013 2013 Snake River - (Pipeline to Pullman
only, SPF/TG estimate)
Snake River Pipeline - Alternative A7c Surface-water supply alternative; Direct
diversion from Snake River; Surface water pumped and conveyed to treatment;
Treated surface water delivered to Pullman potable water system; Smaller
capacity; Delivery only to Pullman
2,360 7,240 NA NA 209% 147% 69% 48% $ 46,360,000 $ 927,000 $ 49,181,000 $ 6,793 $ 983,000 $ 47,718,000 $ 96,899,000 $ 13,384 -Direct diversion of Snake River Water-Estimated Supply = Design Capacity-Design capacity is 10 cfs (reduced from 31 cfs studied by USACE (1989))-Approximately 25 miles of pipeline-Pumping facilities-Treatment facilities in Pullman, no delivery to Moscow or conveyance, Pullman to Moscow-Developed from North Fork Palouse alternatives studied by STR (1970) and USACE (1989), reduced size evaluated for 2013 Phase 2 Feasibility Study
-Feasibility, permits, and associated studies-Environmental impacts, constraints-Geotechnical review-Surface water right availability-Accessibility of property and easements-Long-term operating costs
13 Aquifer Storage Recovery (ASR)/
Groundwater Storage
City of Moscow - Surface Water
Feasibility Study - Phase 1
2011 2011 South Fork Palouse River - ASR Purposes
Aquifer Storage and Recovery (ASR) (Year-Round) - Alternative C3
Year-round ASR alternative; Water Storage Reservoir on South Fork Palouse River (Same as Project ID 5); Stored water
conveyed to treatment; Treated water injected over 8-month period
196 600 600 700 19% 11% 6% 4% $ 13,497,000 $ 544,100 $ 15,071,000 $ 25,118 $ 608,000 $ 29,515,000 $ 44,586,000 $ 74,310 -1.3-square-mile watershed above reservoir-600-acre-foot reservoir (40-foot tall dam)-Estimated Supply = Reservoir Capacity-Approximately 5.8 miles of pipeline-Treatment facilities in Moscow-ASR injection well, 8-month Injection Period-Design capacity is 1.2 mgd or 810 gpm.
-Feasibility, permits, and associated studies-Environmental impacts, constraints- Instream flow and Ecological flow limitations- Well Capacity and feasibility of ASR-Gaging data on SF Palouse River-More accurate runoff/yield estimates-Geotechnical review-Accessibility of property and easements-Treatment requirements for ASR facility
14 Aquifer Storage Recovery (ASR)/
Groundwater Storage
City of Moscow - Surface Water
Feasibility Study - Phase 1
2011 2011 Paradise Creek and/or South Fork Palouse River - ASR
ASR Using Spring Runoff - Alternative D3aASR with in-city surface water diversion; Direct Diversion from SF Palouse River; Treatment; Active injection of treated
water during spring runoff; No Reservoir
358 1,100 NA NA 35% 21% 10% 7% $ 12,940,000 $ 574,700 $ 14,449,000 $ 13,135 $ 642,000 $ 31,165,000 $ 45,614,000 $ 41,467 -Direct diversion of South Fork Palouse water-ASR during spring runoff (4 months)-Estimated Supply = 1,100 AF/4 months-River intake pump station-Piped conveyance to treatment-Treatment facilities near ASR facilities-ASR injection well, 4-month injection period-Design capacity is 3.0 mgd or 2,070 gpm.
-Feasibility, permits, and associated studies- Instream flow or ecological flow limitations-Environmental impacts, constraints-Capacity and feasibility of ASR-Gaging data on SF Palouse River-More accurate runoff/yield estimates at intake-Geotechnical review-Accessibility of property and easements-Treatment requirements for ASR facility
15 Aquifer Storage Recovery (ASR)/
Groundwater Storage
City of Moscow - Surface Water
Feasibility Study - Phase 2
2013 2013 Paradise Creek and/or South Fork Palouse River - ASR
ASR Using Spring Runoff - Alternative D3bASR with in-city surface water diversion; Direct Diversion from SF Palouse River;
Passive Treatment and Recharge through Infiltration Basin; No Reservoir
358 1,100 NA NA 35% 21% 10% 7% $ 1,280,000 $ 57,000 $ 1,358,000 $ 1,235 $ 60,000 $ 2,913,000 $ 4,271,000 $ 3,883 -Direct diversion of South Fork Palouse water-ASR during natural runoff period of 4 months-Estimated Supply = 1,100 AF/4 months-River intake pump station-Pipe conveyance to infiltration basin-Passive recharge-12-acre recharge site/infiltration basin-Design capacity is 3.0 mgd or 2,070 gpm.
-Feasibility, permits, and associated studies- Instream flow or ecological flow limitations-Environmental impacts, constraints-Capacity and feasibility of infiltration-Gaging data on SF Palouse River-More accurate runoff/yield estimates at intake-Geotechnical review-Accessibility of property and easements-Treatment requirements for infiltration facility-Long-term operating costs
16 Aquifer Storage Recovery (ASR)/
Groundwater Storage
City of Pullman - Water System Plan
2014 2013 Pullman ASR - SF Palouse River
ASR Using Winter/Spring RunoffASR with surface water diversion; Direct
Diversion from SF Palouse River; Treatment; Active injection of treated
water during late winter and spring runoff; No Reservoir
325 997 NA NA 29% 20% 10% 7% $ 25,000,000 $ 300,000 $ 26,521,000 $ 26,601 $ 318,000 $ 15,437,000 $ 41,958,000 $ 42,084 -Direct diversion of South Fork Palouse water-ASR during natural runoff period-Assumes 3 ASR Wells-Estimated Supply = 325 MG per year-Year 1 Pilot Testing for a single well ASR system is estimated $200,000 -2014 WSP updated costs to 2013 ($25 million for implementation, $300,00 for Year 1 of testing)
-Refined cost analysis, estimates are planning level only. These costs will need to include testing and permitting (not inc. in Moscow-specific alternatives)-Environmental impacts, constraints-Missing backup cost estimate documentation-Feasibility, permits, and associated studies-Capacity and feasibility of ASR facility-Gaging data on SF Palouse River-More accurate runoff/yield estimates at intake-Geotechnical review-Accessibility of property and easements-Treatment requirements for ASR facility
17 Aquifer Storage Recovery (ASR)/
Groundwater Storage
Palouse Watershed (WRIA 34) Multi-Purpose Storage
Assessment
2006 2006 Pullman ASR - North Fork Palouse
River
ASR Using Winter/Spring RunoffASR with surface water diversion; Direct
Diversion from NF Palouse River; Treatment; Active injection of treated
water during late winter and spring runoff; No Reservoir
325 997 NA NA 29% 20% 10% 7% $ 59,885,000 $ 1,066,000 $ 78,250,000 $ 78,485 $ 1,393,000 $ 67,621,000 $ 145,871,000 $ 146,310 -Direct diversion of North Fork Palouse water-ASR during natural runoff period-Assumes 3 ASR Wells-Estimated Supply = 325 MG per year-Year 1 Pilot Testing for a single well ASR system is estimated $200,000 -Capital Cost includes costs for Pullman ASR ((ID 16) $25 million for implementation, $300,00 for Year 1 of testing) + cost for direct diversion of NF Palouse (ID 8) - assumed cost of pump station included in ASR
-Refined cost analysis, estimates are planning level only. These costs will need to include testing and permitting-Environmental impacts, constraints-Missing backup cost estimate documentation-Feasibility, permits, and associated studies-Capacity and feasibility of ASR facility-Gaging data on NF Palouse River-More accurate runoff/yield estimates at intake-Geotechnical review-Accessibility of property and easements-Treatment requirements for ASR facility
18 Aquifer Storage Recovery (ASR)/
Groundwater Storage
Palouse Watershed (WRIA 34) Multi-Purpose Storage
Assessment
2006 2006 Deep Aquifer Recharge
Enhanced deep aquifer recharge - Infiltration pond concept
978 3,000 NA 3,000 N/A N/A 29% 20% $ 6,000,000 $ 238,000 $ 7,840,000 $ 2,613 $ 311,000 $ 15,097,000 $ 22,937,000 $ 7,646 -Enhanced recharge using infiltration pond-From Table 11-1 of Multi-purpose Storage Report, Wanapum-Grand Ronde + Kamiak Butte-Two pond sizes/configurations considered: 1 pond handling 1 cfs, 2 ponds each handling 5 cfs-Costs are for 2 ponds, each handling 5 cfs-$2,000,000 for 2 ponds (5 cfs) + $4,000,000 for conveyance costs-$38,000 for pond O&M + $200,000 for conveyance O&M
-Refined cost analysis, estimates are conceptual-Feasibility, permits, and associated studies-Environmental impacts, constraints-Capacity and feasibility of infiltration-More accurate runoff/yield estimates at intake-Geotechnical review-Accessibility of property and easements-Treatment requirements
19 Aquifer Storage Recovery (ASR)/
Groundwater Storage
Palouse Watershed (WRIA 34) Multi-Purpose Storage
Assessment
2006 2006 Deep Aquifer Recharge
Enhanced deep aquifer recharge - Infiltration ditch concept
978 3,000 NA 3,000 N/A N/A 29% 20% $ 6,200,000 $ 230,000 $ 8,101,000 $ 2,700 $ 301,000 $ 14,612,000 $ 22,713,000 $ 7,571 -Enhanced recharge using infiltration ditch-From Table 11-1 of Multi-purpose Storage Report, Wanapum-Grand Ronde + Kamiak Butte-Two pond sizes/configurations considered: 1 pond handling 1 cfs, 2 ponds each handling 5 cfs-Costs are for 2 ponds, each handling 5 cfs-$2,200,000 for 2 ponds (5 cfs) + $4,000,000 for conveyance costs-$30,000 for pond O&M + $200,000 for conveyance O&M
-Refined cost analysis, estimates are conceptual-Feasibility, permits, and associated studies-Environmental impacts, constraints-Capacity and feasibility of infiltration-More accurate runoff/yield estimates at intake-Geotechnical review-Accessibility of property and easements-Treatment requirements
Anchor QEA, LLC/HDR Inc. 2 of 4
3/18/2016
Palouse Basin Aquifer Committee (PBAC)Water Supply Alternatives - Summary Table
Estimated Supply, Capacity, and Yield Comparison to Projected Demand3 Costs from Study Costs Escalated to Fall 2015
ID Project Type StudyYear of Study
Year of Cost
Estimate Project Title Project Description
Estimated Annual Supply (MG)1
Estimated Annual Supply
(AF)
Storage Capacity
(AF)
Average Annual Yield(AF)2
% of Projected Local System
2025 Demand3
% of Projected Local System
2065 Demand3
% of Projected Palouse Basin 2025 Demand3
% of Projected Palouse Basin 2065 Demand3
Capital Cost to Implement
($)
Annual Operating
Cost($)
Capital Cost to Implement
($)
Capital Cost to Implement
($/AF of Annual Supply)
Annual Operating
Cost($)
Present Valueof Annual
Operating Costs($)
Total Present Value
(Capital Cost + Annual
Operating Cost)($)
Total Present Value
($/AF of Annual Supply) Notes Data Gaps
Present Value of Costs (Fall 2015)
20 Water Reuse City of Pullman and WSU - Water
Reclamation Project - Design Development
Document Update
2015 2014 Pullman/WSU Water Reuse
Project
Water Reuse ProjectWWTP Upgrades, Class A reclaimed water
supply pumped to new water reuse system for irrigation of at reuse sites in
Pullman
148 454 NA NA 13% 9% 4% 3% $ 18,587,922 $ 165,000 $ 19,198,000 $ 42,286 $ 170,000 $ 8,252,000 $ 27,450,000 $ 60,463 -Modifications to City WWTP to produce up to 1.35 MGD of Class A reclaimed water-Reclaimed water pumping facilities-710,000 gallons of storage-Conveyance pipeline, WWTP to BPS and Storage-Distribution pipelines-Estimated Supply = Annual demand for planned reuse sites-Annual water reuse demand = 148 MG/yr at planed reuse sites + 115 MG/yr at future planned sites (2002 Parametrix report estimates)-City's current peak water reuse estimate = 150,000 gpd, May-Oct
-Estimates are based on 30 percent design development-Environmental impacts, constraints-Feasibility, permits, and associated studies-Capacity and feasibility of water reclamation facility-Refined locations and demands for reuse site-Accessibility of property and easements
21 Water Reuse City of Moscow - Comprehensive Sewer
System Plan
2011 2011 Potential Wastewater Recycle
using Scalping Plants - Scalping
Plant #1
Potential Wastewater Recycle using Scalping Plants
Scalping Plant #1 to serve reuse sites in NE area (Area 1) of City of Moscow
17 53 NA NA 2% 1% 1% 0% $ 4,800,000 $ 50,000 $ 5,360,000 $ 101,132 $ 56,000 $ 2,718,000 $ 8,078,000 $ 152,415 -Scalping Plant #1 to serve NE area of Moscow -North Mountain View Road and East B Street-Diversion structures-0.125-MGD Membrane Bioreactor (MBR) plant-Building, site work, aeration basin-80,000-gallon Storage Tank-Pumping Facilities-Distribution piping
-Refined cost analysis, estimates are planning level only-Additional analysis, sizing of infrastructure-Environmental impacts, constraints-Feasibility, permits, and associated studies-Capacity and feasibility of scalping facility-Refined locations and demands for reuse site-Accessibility of property and easements
22 Water Reuse City of Moscow - Comprehensive Sewer
System Plan
2011 2011 Potential Wastewater Recycle
using Scalping Plants - Scalping
Plant #2
Potential Wastewater Recycle using Scalping Plants
Scalping Plant #2 to serve reuse sites in E area (Area 2) of City of Moscow
26 79 NA NA 3% 2% 1% 1% $ 7,600,000 $ 75,000 $ 8,487,000 $ 107,430 $ 84,000 $ 4,078,000 $ 12,565,000 $ 159,051 -Scalping Plant #2 to serve E area of Moscow-Kenneth Avenue and Blaine Street-Diversion structures-0.300-MGD Membrane Bioreactor (MBR) plant-Building, site work, aeration basin-130,000-gallon Storage Tank-Pumping Facilities-Distribution piping
-Refined cost analysis, estimates are planning level only-Additional analysis, sizing of infrastructure-Environmental impacts, constraints-Feasibility, permits, and associated studies-Capacity and feasibility of scalping facility-Refined locations and demands for reuse site-Accessibility of property and easements
23 Water Reuse City of Moscow - Comprehensive Sewer
System Plan
2011 2011 Potential Wastewater Recycle
using Scalping Plants - Scalping
Plant #3
Potential Wastewater Recycle using Scalping Plants
Scalping Plant #3 to serve reuse sites in S area (Area 3) of City of Moscow
11 33 NA NA 1% 1% 0% 0% $ 3,300,000 $ 50,000 $ 3,685,000 $ 111,667 $ 56,000 $ 2,718,000 $ 6,403,000 $ 194,030 -Scalping Plant #3 to serve S area of Moscow-Near the South Sewage Lift Station-Diversion structures-0.075-MGD Membrane Bioreactor (MBR) plant-Building, site work-80,000-gallon Storage Tank-Pumping Facilities-Distribution piping
-Refined cost analysis, estimates are planning level only-Additional analysis, sizing of infrastructure-Environmental impacts, constraints-Feasibility, permits, and associated studies-Capacity and feasibility of scalping facility-Refined locations and demands for reuse site-Accessibility of property and easements
24 Water Reuse City of Moscow - Comprehensive Sewer
System Plan
2011 2011 Additional Storage and Distribution
Water Reuse Distribution SystemStorage and Distribution Piping to Area 1
(NE area) and Area 2 (E area)
44 136 NA NA 4% 3% 1% 1% $ 7,900,000 $ 35,000 $ 8,822,000 $ 64,868 $ 39,000 $ 1,893,000 $ 10,715,000 $ 78,787 -Assumes expansion of existing WWTP, but expansion of WWTP included in this project or the associated estimates-Booster Pump Station-12" Pipeline, WWTP to Ghormley Park-12" Pipeline, Ghormley Park to Joseph St-12" Pipeline, Joseph St to Mountain View Park-5-MG HDPE-lined Storage Lagoon
-Refined cost analysis, estimates are planning level only-Additional analysis, sizing of pipelines and storage-Environmental impacts, constraints-Feasibility, permits, and associated studies-Refined alignments from WWTP to reuse sites-Accessibility of property and easements
25 Water Reuse City of Moscow - WWTP Improvements
Phase V Predesign Study
Alternative #9 Reuse
Water Reuse… NA NA 0% 0% 0% 0% #N/A #N/A #N/A #N/A #N/A #N/A Connected to Project 23 - Need to discuss further with City
26 Surface Water Alternative -
OLD
Interim Report, Phase One, Preliminary
Reconnaissance and Consultation,
Supplemental Water Supply for the City of
Moscow, ID
1958 1958 Robinson Lake Site Potential reservoir/dam siteSurface-water supply alternative; Stored
water conveyed to City of Moscow
1,524 4,675 2,700 4,675 147% 89% 45% 31% $ - $ - $ - $ - $ - $ - $ - $ - -From original 1958 EBASCO Report-8.19-square-mile watershed above reservoir-2,700-acre-foot reservoir-Estimated Supply = Average Reservoir Yield-Min Estimated Yield = 3,230 acre-feet-Max Estimated Yield = 6,120 acre-feet-Conveyance not defined
-Costs, No costs provided in report-Feasibility, permits, and associated studies-Environmental impacts, constraints-Gaging data-More accurate runoff/yield estimates-Sizing and configuration of dam, conveyance, etc.-Geotechnical review-Surface water right availability-Accessibility of property and easements
27 Surface Water Alternative -
OLD
Interim Report, Phase One, Preliminary
Reconnaissance and Consultation,
Supplemental Water Supply for the City of
Moscow, ID
1958 1958 Gnat Creek Diversion
Diversion of Gnat Creek to increase yield of the Robinson Lake Site
Surface-water supply alternative; Gravity conveyance from Gant Creek Watershed
to Robinson Lake
394 1,210 NA 1,210 38% 23% 12% 8% $ - $ - $ - $ - $ - $ - $ - $ - -From original 1958 EBASCO Report-4.25-square-mile watershed above diversion-Estimated Supply = Average Reservoir Yield-Min Estimated Yield = 820 acre-feet-Max Estimated Yield = 1,600 acre-feet-Diversion and conveyance not defined
-Costs, No costs provided in report-Feasibility, permits, and associated studies-Environmental impacts, constraints-Gaging data-More accurate runoff/yield estimates-Sizing and configuration of dam, conveyance, etc.-Geotechnical review-Surface water right availability-Accessibility of property and easements
28 Surface Water Alternative -
OLD
Water Supply Study, Pullman-Moscow Water Resources
Committee
1970 1970 Potlatch River Project
Proposes diversion of water from the main Potlatch River at a point due south of
Helmer, ID and transmitting water from that point to the communities of Pullman
and Moscow.
7,300 22,400 NA NA 707% 426% 213% 148% $ 15,555,000 $ 1,515,700 $114,078,000 $ 5,093 $ 11,116,000 $ 539,612,000 $ 653,690,000 $ 29,183 -From 1970 STR Study-22,000 acre-foot reservoir-Estimated supply = 20 mgd x 365 days-Gravity Releases to Potlach River-Gravity intake facilities near Helmer, ID-Treatment facilities at intake-Estimated Supply = Average Reservoir Yield-Conveyance to terminal storage near Moscow-Pumping facilities-Design capacity 15 mgd, future to 20 mgd, intended to be developed in 3 phases
-Costs, Estimated costs are nearly 50 years old-Feasibility, permits, and associated studies-Environmental impacts, constraints-Gaging data for Potlach River-More accurate runoff/yield estimates-Sizing and configuration of dam, conveyance, etc.-Geotechnical review-Surface water right availability-Accessibility of property and easements
29 Additional Groundwater
Supplies
City of Moscow - Comprehensive Water
System Plan
2012 2010 Moscow - Additional
Groundwater Development
City of MoscowAdditional Groundwater Well Development, from Moscow Comprehensive Water Plan
578 1,774 NA NA 56% 34% 17% 12% $ 1,500,000 $ 88,200 $ 1,727,000 $ 974 $ 102,000 $ 4,951,000 $ 6,678,000 $ 3,764 -Cost to drill new well from Moscow Comprehensive Water Plan, Page 6-13-Water Supply = 578 MG/yr-450-horsepower pumping, 12 hours/day
-Costs, Estimated costs are planning level only-Feasibility, permits, and associated studies-Water rights for additional groundwater supply-Drilling, well tests to determine capacity-Hydrogeology review-Accessibility of property and easements
Anchor QEA, LLC/HDR Inc. 3 of 4
3/18/2016
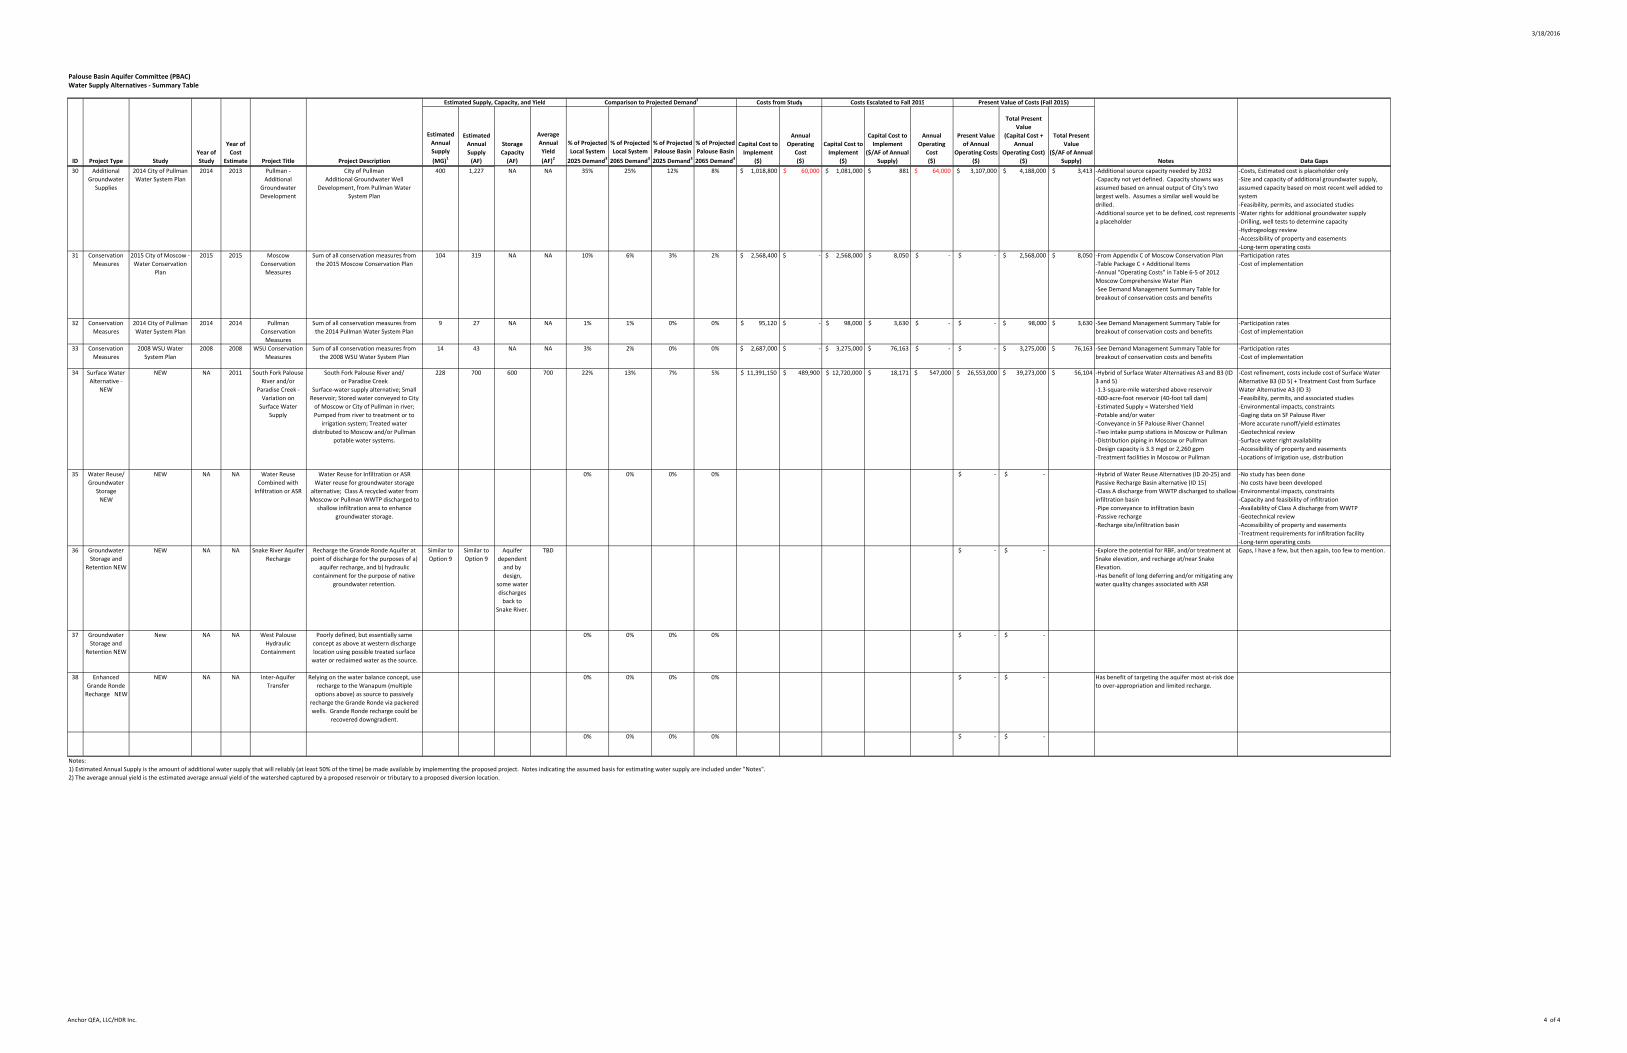
Palouse Basin Aquifer Committee (PBAC)Water Supply Alternatives - Summary Table
Estimated Supply, Capacity, and Yield Comparison to Projected Demand3 Costs from Study Costs Escalated to Fall 2015
ID Project Type StudyYear of Study
Year of Cost
Estimate Project Title Project Description
Estimated Annual Supply (MG)1
Estimated Annual Supply
(AF)
Storage Capacity
(AF)
Average Annual Yield(AF)2
% of Projected Local System
2025 Demand3
% of Projected Local System
2065 Demand3
% of Projected Palouse Basin 2025 Demand3
% of Projected Palouse Basin 2065 Demand3
Capital Cost to Implement
($)
Annual Operating
Cost($)
Capital Cost to Implement
($)
Capital Cost to Implement
($/AF of Annual Supply)
Annual Operating
Cost($)
Present Valueof Annual
Operating Costs($)
Total Present Value
(Capital Cost + Annual
Operating Cost)($)
Total Present Value
($/AF of Annual Supply) Notes Data Gaps
Present Value of Costs (Fall 2015)
30 Additional Groundwater
Supplies
2014 City of Pullman Water System Plan
2014 2013 Pullman - Additional
Groundwater Development
City of PullmanAdditional Groundwater Well
Development, from Pullman Water System Plan
400 1,227 NA NA 35% 25% 12% 8% $ 1,018,800 $ 60,000 $ 1,081,000 $ 881 $ 64,000 $ 3,107,000 $ 4,188,000 $ 3,413 -Additional source capacity needed by 2032-Capacity not yet defined. Capacity showns was assumed based on annual output of City's two largest wells. Assumes a similar well would be drilled.-Additional source yet to be defined, cost represents a placeholder
-Costs, Estimated cost is placeholder only-Size and capacity of additional groundwater supply, assumed capacity based on most recent well added to system-Feasibility, permits, and associated studies-Water rights for additional groundwater supply-Drilling, well tests to determine capacity-Hydrogeology review-Accessibility of property and easements-Long-term operating costs
31 Conservation Measures
2015 City of Moscow - Water Conservation
Plan
2015 2015 Moscow Conservation
Measures
Sum of all conservation measures from the 2015 Moscow Conservation Plan
104 319 NA NA 10% 6% 3% 2% $ 2,568,400 $ - $ 2,568,000 $ 8,050 $ - $ - $ 2,568,000 $ 8,050 -From Appendix C of Moscow Conservation Plan-Table Package C + Additional Items-Annual "Operating Costs" in Table 6-5 of 2012 Moscow Comprehensive Water Plan-See Demand Management Summary Table for breakout of conservation costs and benefits
-Participation rates-Cost of implementation
32 Conservation Measures
2014 City of Pullman Water System Plan
2014 2014 Pullman Conservation
Measures
Sum of all conservation measures from the 2014 Pullman Water System Plan
9 27 NA NA 1% 1% 0% 0% $ 95,120 $ - $ 98,000 $ 3,630 $ - $ - $ 98,000 $ 3,630 -See Demand Management Summary Table for breakout of conservation costs and benefits
-Participation rates-Cost of implementation
33 Conservation Measures
2008 WSU Water System Plan
2008 2008 WSU Conservation Measures
Sum of all conservation measures from the 2008 WSU Water System Plan
14 43 NA NA 3% 2% 0% 0% $ 2,687,000 $ - $ 3,275,000 $ 76,163 $ - $ - $ 3,275,000 $ 76,163 -See Demand Management Summary Table for breakout of conservation costs and benefits
-Participation rates-Cost of implementation
34 Surface Water Alternative -
NEW
NEW NA 2011 South Fork Palouse River and/or
Paradise Creek - Variation on
Surface Water Supply
South Fork Palouse River and/or Paradise Creek
Surface-water supply alternative; Small Reservoir; Stored water conveyed to City
of Moscow or City of Pullman in river; Pumped from river to treatment or to
irrigation system; Treated water distributed to Moscow and/or Pullman
potable water systems.
228 700 600 700 22% 13% 7% 5% $ 11,391,150 $ 489,900 $ 12,720,000 $ 18,171 $ 547,000 $ 26,553,000 $ 39,273,000 $ 56,104 -Hybrid of Surface Water Alternatives A3 and B3 (ID 3 and 5)-1.3-square-mile watershed above reservoir-600-acre-foot reservoir (40-foot tall dam)-Estimated Supply = Watershed Yield-Potable and/or water-Conveyance in SF Palouse River Channel-Two intake pump stations in Moscow or Pullman-Distribution piping in Moscow or Pullman-Design capacity is 3.3 mgd or 2,260 gpm -Treatment facilities in Moscow or Pullman
-Cost refinement, costs include cost of Surface Water Alternative B3 (ID 5) + Treatment Cost from Surface Water Alternative A3 (ID 3)-Feasibility, permits, and associated studies-Environmental impacts, constraints-Gaging data on SF Palouse River-More accurate runoff/yield estimates-Geotechnical review-Surface water right availability-Accessibility of property and easements-Locations of irrigation use, distribution
35 Water Reuse/ Groundwater
StorageNEW
NEW NA NA Water Reuse Combined with
Infiltration or ASR
Water Reuse for Infiltration or ASRWater reuse for groundwater storage
alternative; Class A recycled water from Moscow or Pullman WWTP discharged to
shallow infiltration area to enhance groundwater storage.
0% 0% 0% 0% $ - $ - -Hybrid of Water Reuse Alternatives (ID 20-25) and Passive Recharge Basin alternative (ID 15)-Class A discharge from WWTP discharged to shallow infiltration basin-Pipe conveyance to infiltration basin-Passive recharge-Recharge site/infiltration basin
-No study has been done-No costs have been developed-Environmental impacts, constraints-Capacity and feasibility of infiltration-Availability of Class A discharge from WWTP-Geotechnical review-Accessibility of property and easements-Treatment requirements for infiltration facility-Long-term operating costs
36 Groundwater Storage and
Retention NEW
NEW NA NA Snake River Aquifer Recharge
Recharge the Grande Ronde Aquifer at point of discharge for the purposes of a)
aquifer recharge, and b) hydraulic containment for the purpose of native
groundwater retention.
Similar to Option 9
Similar to Option 9
Aquifer dependent
and by design,
some water discharges
back to Snake River.
TBD $ - $ - -Explore the potential for RBF, and/or treatment at Snake elevation, and recharge at/near Snake Elevation. -Has benefit of long deferring and/or mitigating any water quality changes associated with ASR
Gaps, I have a few, but then again, too few to mention.
37 Groundwater Storage and
Retention NEW
New NA NA West Palouse Hydraulic
Containment
Poorly defined, but essentially same concept as above at western discharge location using possible treated surface
water or reclaimed water as the source.
0% 0% 0% 0% $ - $ -
38 Enhanced Grande Ronde
Recharge NEW
NEW NA NA Inter-Aquifer Transfer
Relying on the water balance concept, use recharge to the Wanapum (multiple
options above) as source to passively recharge the Grande Ronde via packered wells. Grande Ronde recharge could be
recovered downgradient.
0% 0% 0% 0% $ - $ - Has benefit of targeting the aquifer most at-risk doe to over-appropriation and limited recharge.
0% 0% 0% 0% $ - $ -
Notes:1) Estimated Annual Supply is the amount of additional water supply that will reliably (at least 50% of the time) be made available by implementing the proposed project. Notes indicating the assumed basis for estimating water supply are included under "Notes".2) The average annual yield is the estimated average annual yield of the watershed captured by a proposed reservoir or tributary to a proposed diversion location.
Anchor QEA, LLC/HDR Inc. 4 of 4
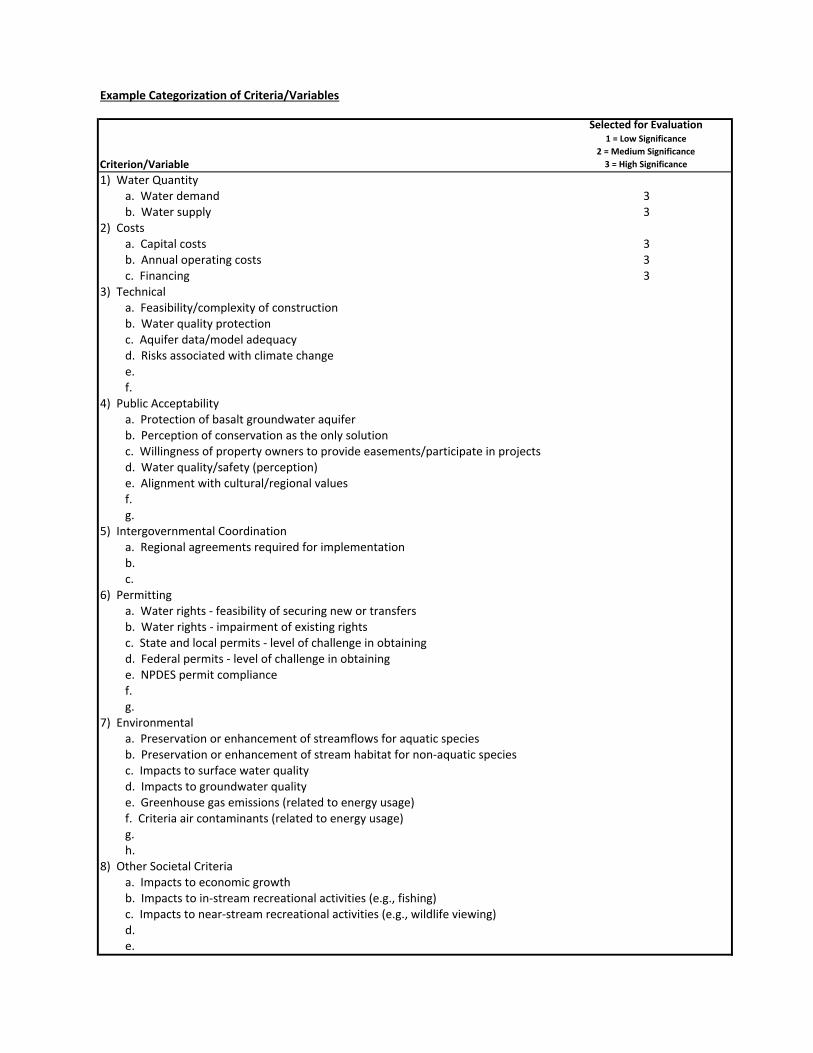
Example Categorization of Criteria/Variables
Criterion/Variable
Selected for Evaluation1 = Low Significance
2 = Medium Significance3 = High Significance
1) Water Quantitya. Water demand 3b. Water supply 3
2) Costsa. Capital costs 3b. Annual operating costs 3c. Financing 3
3) Technicala. Feasibility/complexity of constructionb. Water quality protectionc. Aquifer data/model adequacyd. Risks associated with climate changee.f.
4) Public Acceptabilitya. Protection of basalt groundwater aquiferb. Perception of conservation as the only solutionc. Willingness of property owners to provide easements/participate in projectsd. Water quality/safety (perception)e. Alignment with cultural/regional valuesf.g.
5) Intergovernmental Coordinationa. Regional agreements required for implementationb.c.
6) Permittinga. Water rights - feasibility of securing new or transfersb. Water rights - impairment of existing rightsc. State and local permits - level of challenge in obtainingd. Federal permits - level of challenge in obtaininge. NPDES permit compliancef.g.
7) Environmentala. Preservation or enhancement of streamflows for aquatic speciesb. Preservation or enhancement of stream habitat for non-aquatic speciesc. Impacts to surface water qualityd. Impacts to groundwater qualitye. Greenhouse gas emissions (related to energy usage)f. Criteria air contaminants (related to energy usage)g.h.
8) Other Societal Criteriaa. Impacts to economic growthb. Impacts to in-stream recreational activities (e.g., fishing)c. Impacts to near-stream recreational activities (e.g., wildlife viewing)d.e.