maqam music an automatic pitch analysis method for turkish · representations of pitch scales (i.e....
TRANSCRIPT
Full Terms & Conditions of access and use can be found athttp://www.tandfonline.com/action/journalInformation?journalCode=nnmr20
Download by: [Izmir Yuksek Teknologi Enstitusu] Date: 10 November 2016, At: 04:06
Journal of New Music Research
ISSN: 0929-8215 (Print) 1744-5027 (Online) Journal homepage: http://www.tandfonline.com/loi/nnmr20
An Automatic Pitch Analysis Method for TurkishMaqam Music
Barış Bozkurt
To cite this article: Barış Bozkurt (2008) An Automatic Pitch Analysis Method for TurkishMaqam Music, Journal of New Music Research, 37:1, 1-13
To link to this article: http://dx.doi.org/10.1080/09298210802259520
Published online: 20 Aug 2008.
Submit your article to this journal
Article views: 211
View related articles
Citing articles: 16 View citing articles
An Automatic Pitch Analysis Method for Turkish Maqam Music
Barıs Bozkurt
Izmir Institute of Technology, Turkey
Abstract
Automatic pitch analysis of large audio databases isessential for studies on music information retrieval anddeveloping a pitch scale theory for Turkish maqammusic. However no such study is available. In this article,we first determine the main obstacle as the alignment offrequency analysis results from multiple files. We thenpropose a new method to automatically detect the tonicof a recording, align the data, and estimate overallfrequency histograms from large databases. We showthat such histograms can be successfully used for pitchscale (tuning) studies on the recordings of Tanburi CemilBey, an undisputed master of the genre.
1. Introduction
Although the ‘‘maqam world’’ corresponds to aregionally very large multicultural area (Touma, 1971;Powers, 1988; Zannos, 1990), computational methodsaiming to process maqammusic is very limited in number.This study targets development of fully automaticmethods for frequency analysis of large audio databasesof maqam music. In this study, for practical reasons, thediscussions and data are limited to Turkish maqammusic. However the basic methods presented are poten-tially applicable to other maqam music traditions.
Development of computerized music analysis methodsnecessitates use of music theory. Similarly, music theoryresearch can also profit highly from use of computer-based analysis especially for traditional music (Tzanetakiset al., 2007). Today, for Turkish maqam music studies, itappears that computerized analysis can be a veryimportant tool for progress in music theory research.
A maqam generally implies a set of rules forcomposition and improvisation. These rules are defined
in various dimensions: the pitch scale, melodic progres-sion defining overall ascending–descending characteris-tics, temporary tonics, possible modulations to othermaqams, etc. For an in-depth analysis of maqam music,computerized methods are needed that can provide alarge set of data for each of these dimensions. This studyaims at providing automatic analysis tools only for thepitch scale dimension of the problem.
It is well known that developing the pitch scale theoryfor Turkish maqam music is still an open issue. Manystudies mention that there exist mismatches between theintervals measured on recordings from master musiciansand those specified in the Arel–Ezgi–Uzdilek (AEU)theory (Arel, 1930) although this theory is widelyaccepted and taught.1 New studies continue to emergewhich compare old scales with actual intervals beingplayed and propose new formulations for more efficientrepresentations of pitch scales (i.e. maqam music notescalled ‘‘perde’’s) (Karaosmano�glu & Akkoc, 2003;Tulgan, 2007; Yarman, 2008).
It is clear that collecting large audio databases andanalysing them in a systematic way is very crucial forsuch studies. However the common approach used inmost of the studies is to analyse a very limited number ofexamples from well-known musicians and draw generalconclusions from these limited data. This choice inmethodology stems from some difficulties related tothe nature of maqam music: it is well knownin maqam music theory that notes do not correspondto standardized single fixed frequencies. In addition tothe fact that there are 12 possible diapasons called
Correspondence: Barıs Bozkurt, Izmir Institute of Technology, Electrical and Electronics Engineering Dept. Gulbahce, Urla, _Izmir/Turkey. E-mail: [email protected]
1A recent congress was completely dedicated to this topic:‘‘Theory-application mismatch for Turkish Music: Problems
and Solutions’’, organized by Istanbul Technical University,State Conservatory for Turkish Music, 3–6 March 2008,_Istanbul.
Journal of New Music Research2008, Vol. 37, No. 1, pp. 1–13
DOI: 10.1080/09298210802259520 � 2008 Taylor & Francis
‘‘ahenk’’s2 and dozens of maqams employing a largevariety of intervals, musicians may differently interpretcertain degrees of some scales.3 Therefore, it is not at alltrivial to develop computerized methods that can performautomatic analysis and gather results from large data-bases. The lack of such methods continues to hamperresearch into the actual tuning of Turkish maqam musicand the development of a theory conforming to practice.
Furthermore, a literature study of maqam musicshows that music information retrieval (MIR) techniquesdeveloped for maqam music is very much limited innumber. The problems mentioned above stays at theheart of many issues in MIR studies.
This study proposes a novel method for aligning pitchfrequencies computed on various recordings in order tofacilitate automatic analysis of large databases. Thealignment is performed via matching the tonics of eachrecording. To achieve this, a new tonic detectionalgorithm for maqam music is presented.
It should be noted that for direct alignment with tonicas reference, the recordings should be from the same classof maqams that have the same note as tonic. In terms oftheir tonics, maqams can be classified into several broadclasses, those with the tonic note being: rast, dugah,segah, ırak, yegah, acem asiran, huseyni asiran, gevest,buselik, cargah4 (Karadeniz, 1965). The largest set is thatof maqams with dugah as tonic, followed by rast andsegah. From tables provided in Ceviko�glu (2007), thepercentage of songs in the repertory of TRT (TurkishRadio Television Broadcasting) can roughly (by comput-ing percentage on the list provided for 72% of the wholerepertory) be calculated as: 44.7% for maqams withdugah tonic, 39.2% for maqams with rast tonic and11.8% for maqams with segah tonic. This means that, ifrecordings from these three classes (maqams with tonicas dugah, rast or segah) can be aligned and processedtogether, one could cover more than 90% of recordings.To avoid confusion and save space, we have chosenrecordings only from maqams with dugah tonic as test
data in the application part of this study. But the systemcan be successfully applied to other classes in astraightforward way.
To demonstrate the effectiveness of the method, wepresent an application of the methods to recordings ofTanburi Cemil Bey (1871–1916). There are variousreasons for this choice. Firstly, Tanburi Cemil Bey isthe most commonly referred musician for the correctnessand precision of his pitch intervals. Many talentedmusicians claim that his recordings are the most valuablesource of information for maqam music (Tanrıkorur,2004). He has mastered many instruments includingtanbur, kemence, lute, tar, cello, violin, kanun, clarinet,zurna and ba�glama. He is known as the creator of thebowed tanbur (yaylı tanbur) and was an indisputablevirtuoso of kemence and tanbur. Although he wasmainly known as a performer he was an importantcomposer too. His compositions are still being played notonly in Turkey but also in Iran, Iraq, Syria, Lebanon,Egypt, Tunisia, Greece and the Balkans. For furtherinformation the reader is referred to Cemil (1947).
In addition, the author thinks that Tanburi CemilBey’s recordings, being among the rather old recordingsof maqam music, represent the traditional pitch frequen-cies taught through oral education without muchinfluence from the official Arel–Ezgi–Uzdilek (AEU)theory (Arel, 1930). It can be easily seen in recentinstrumental methods that tables on fretting reflect morethe dictates of the AEU tuning than the demands ofactual practice. A similar predicament is also true forformal education; the conservatories teach the AEUsystem. However, mismatches between theory and actualpractice are also acknowledged. Through the testsperformed on Tanburi Cemil Bey’s recordings for ourproposed methods, we show that ‘‘theory–practice’’mismatches can be directly observed and scrutinized onthe average histograms automatically obtained.
Throughout the study, the YIN algorithm (deCheveigne & Kawahara, 2002) is used for fundamentalfrequency (f0) estimation together with some post-filtersdesigned specially for Turkish maqam music. These post-filters are explained in Section 2. All recordings used aremonophonic to avoid the complex multi-pitch estimationproblem since it is not the main issue in our study. InSection 3, we discuss f0 histogram computation. It iscommon practice to use Holdrian comma (Hc) as thesmallest intervallic unit in Turkish maqam music theory.To facilitate comparisons with other studies, we also usethe Holdrian comma unit in most of our figures andtables. Section 4 is dedicated to the presentation of ourproposed method for combining histograms of multiplerecordings and our tonic detection algorithm. Section 5includes the discussions and conclusions. In addition, theAEU system which is also explained in Yarman (2007) tobe equivalent to the Yekta-24 system in terms of intervalsused is very briefly explained in Appendix A. The audio
2Ahenk is synonymous with key transposition or diapason. Due
to the fact that maqam music notes (‘‘perde’’s) are named byreference to their relative positions, the same perde correspondsto different pitches on different sizes of instruments. The readeris referred to Erguner (2007) and Appendix B of Yarman (2008)
for detailed reviews on ahenks, ney fingerings, location of holeson neys with various lengths and the corresponding pitchfrequencies produced.3For example for fretted instruments there is a lack of standardsand defining appropriate fret locations is an open topic ofresearch. It is observed that the number of frets and their
locations vary regionally or due to personal choice.4It should be noted that some names are used both for makamsand notes(‘‘perde’’s), like: Hicaz, Buselik, Kurdi, Segah, Mahur,etc. For discriminating the two, maqam names are written with
the first letter being capital.
2 Barıs Bozkurt
material used is referred to at various steps in plots anddiscussions. We preferred to present the brief descriptionof the recording database used in Appendix B so as notto interrupt the natural flow of the text.
2. F0 post-filtering for Turkish maqam musicrecordings
Fundamental frequency estimation methods are not freeof errors. Depending on the acoustic characteristics,various methods have various error rates. It is commonpractice to design post-filtering methods to correct someof these errors. For some special cases as ours, post-filters may be designed considering the melodic char-acteristics of a particular type of music. For Turkishmaqam music we have verified that the post-filters belowcan be effectively used.
Filters which impose continuity with the assumptionthat the following are not likely in Turkish maqam music:
(1) low signal energy and short duration pitch chunkswith boundary intervals larger than a perfect fifth;
(2) relatively short duration chunk at an integer multi-ple octave higher or lower in pitch compared to along duration previous or post chunk;
(3) melodic dynamic range being larger than fouroctaves.
The first two properties are implemented via conditionalcode lines. The last one is realized as a filter by:computing the mean of frequencies measured for arecording, defining maximum and minimum possiblefrequencies as two octaves higher and lower than themean for that specific recording and filtering out the
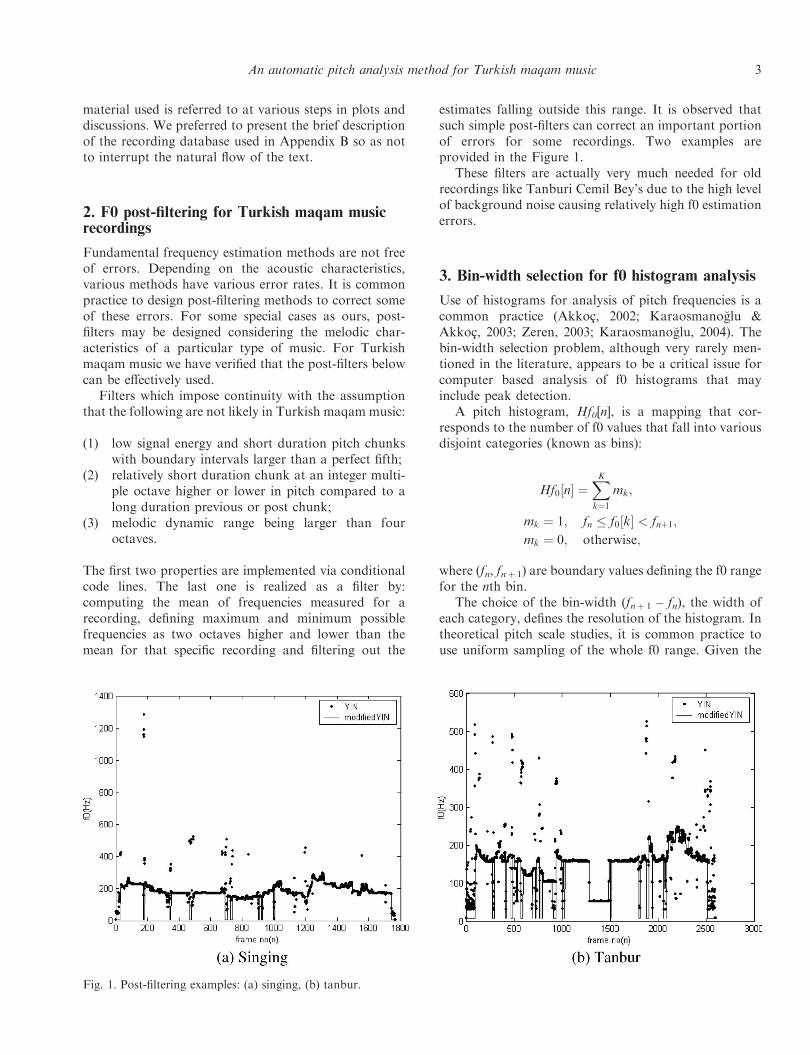
estimates falling outside this range. It is observed thatsuch simple post-filters can correct an important portionof errors for some recordings. Two examples areprovided in the Figure 1.
These filters are actually very much needed for oldrecordings like Tanburi Cemil Bey’s due to the high levelof background noise causing relatively high f0 estimationerrors.
3. Bin-width selection for f0 histogram analysis
Use of histograms for analysis of pitch frequencies is acommon practice (Akkoc, 2002; Karaosmano�glu &Akkoc, 2003; Zeren, 2003; Karaosmano�glu, 2004). Thebin-width selection problem, although very rarely men-tioned in the literature, appears to be a critical issue forcomputer based analysis of f0 histograms that mayinclude peak detection.
A pitch histogram, Hf0[n], is a mapping that cor-responds to the number of f0 values that fall into variousdisjoint categories (known as bins):
Hf0½n� ¼XKk¼1
mk;
mk ¼ 1; fn � f0 k½ � < fnþ1;
mk ¼ 0; otherwise;
where (fn, fnþ 1) are boundary values defining the f0 rangefor the nth bin.
The choice of the bin-width (fnþ 1 – fn), the width ofeach category, defines the resolution of the histogram. Intheoretical pitch scale studies, it is common practice touse uniform sampling of the whole f0 range. Given the
Fig. 1. Post-filtering examples: (a) singing, (b) tanbur.
An automatic pitch analysis method for Turkish maqam music 3
number of bins, N, and f0 range (f0max and f0min) bin-width, Wb, is obtained simply by the following:
Wb ¼f0max � f0min
N;
fn ¼ f0min þ n� 1ð ÞWb:
One of the critical choices made in histogram computa-tion is the decision of bin-width when automatic methodsare concerned. In automatic processing of histograms,peak detection is one of the basic operations; therefore ourchoice targets facilitation of the detection of note peaks.
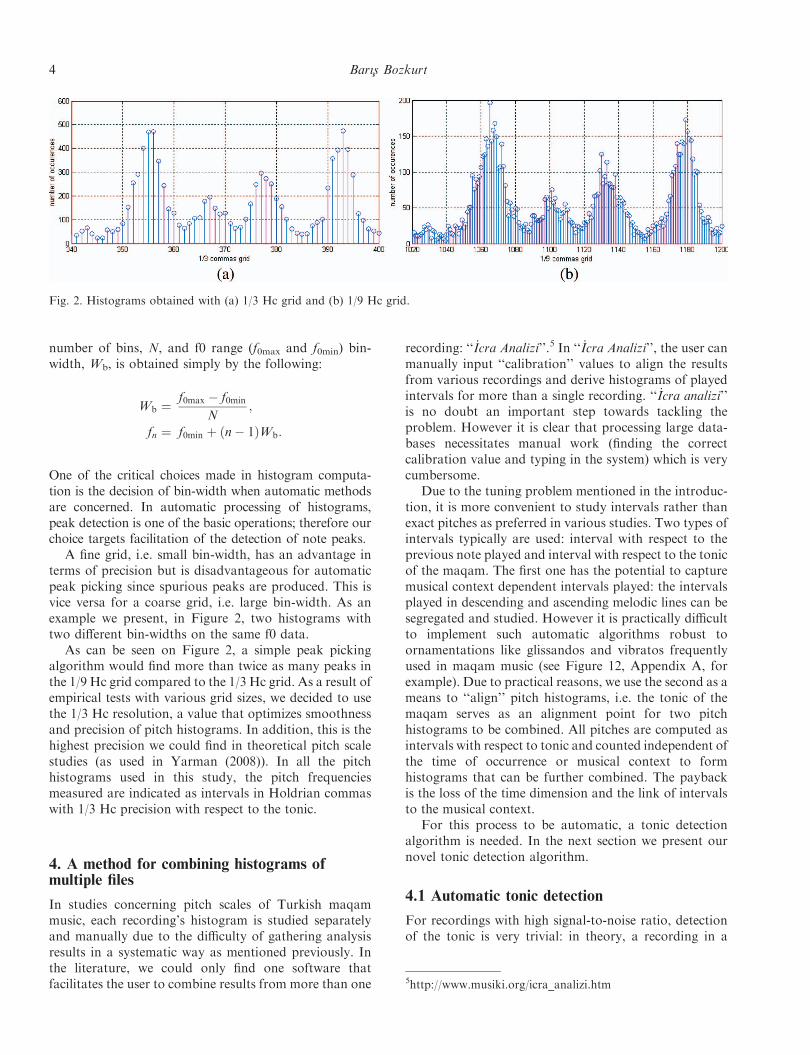
A fine grid, i.e. small bin-width, has an advantage interms of precision but is disadvantageous for automaticpeak picking since spurious peaks are produced. This isvice versa for a coarse grid, i.e. large bin-width. As anexample we present, in Figure 2, two histograms withtwo different bin-widths on the same f0 data.
As can be seen on Figure 2, a simple peak pickingalgorithm would find more than twice as many peaks inthe 1/9 Hc grid compared to the 1/3 Hc grid. As a result ofempirical tests with various grid sizes, we decided to usethe 1/3 Hc resolution, a value that optimizes smoothnessand precision of pitch histograms. In addition, this is thehighest precision we could find in theoretical pitch scalestudies (as used in Yarman (2008)). In all the pitchhistograms used in this study, the pitch frequenciesmeasured are indicated as intervals in Holdrian commaswith 1/3 Hc precision with respect to the tonic.
4. A method for combining histograms ofmultiple files
In studies concerning pitch scales of Turkish maqammusic, each recording’s histogram is studied separatelyand manually due to the difficulty of gathering analysisresults in a systematic way as mentioned previously. Inthe literature, we could only find one software thatfacilitates the user to combine results from more than one
recording: ‘‘ _Icra Analizi’’.5 In ‘‘ _Icra Analizi’’, the user canmanually input ‘‘calibration’’ values to align the resultsfrom various recordings and derive histograms of playedintervals for more than a single recording. ‘‘ _Icra analizi’’is no doubt an important step towards tackling theproblem. However it is clear that processing large data-bases necessitates manual work (finding the correctcalibration value and typing in the system) which is verycumbersome.
Due to the tuning problem mentioned in the introduc-tion, it is more convenient to study intervals rather thanexact pitches as preferred in various studies. Two types ofintervals typically are used: interval with respect to theprevious note played and interval with respect to the tonicof the maqam. The first one has the potential to capturemusical context dependent intervals played: the intervalsplayed in descending and ascending melodic lines can besegregated and studied. However it is practically difficultto implement such automatic algorithms robust toornamentations like glissandos and vibratos frequentlyused in maqam music (see Figure 12, Appendix A, forexample). Due to practical reasons, we use the second as ameans to ‘‘align’’ pitch histograms, i.e. the tonic of themaqam serves as an alignment point for two pitchhistograms to be combined. All pitches are computed asintervals with respect to tonic and counted independent ofthe time of occurrence or musical context to formhistograms that can be further combined. The paybackis the loss of the time dimension and the link of intervalsto the musical context.
For this process to be automatic, a tonic detectionalgorithm is needed. In the next section we present ournovel tonic detection algorithm.
4.1 Automatic tonic detection
For recordings with high signal-to-noise ratio, detectionof the tonic is very trivial: in theory, a recording in a
Fig. 2. Histograms obtained with (a) 1/3 Hc grid and (b) 1/9 Hc grid.
5http://www.musiki.org/icra_analizi.htm
4 Barıs Bozkurt
specific maqam always ends at the tonic as the last note(Akdo�gu, 1989). We have implemented a simple algo-rithm to capture the last note and tested on variousrecordings. This approach works quite well when thebackground noise is rather low.
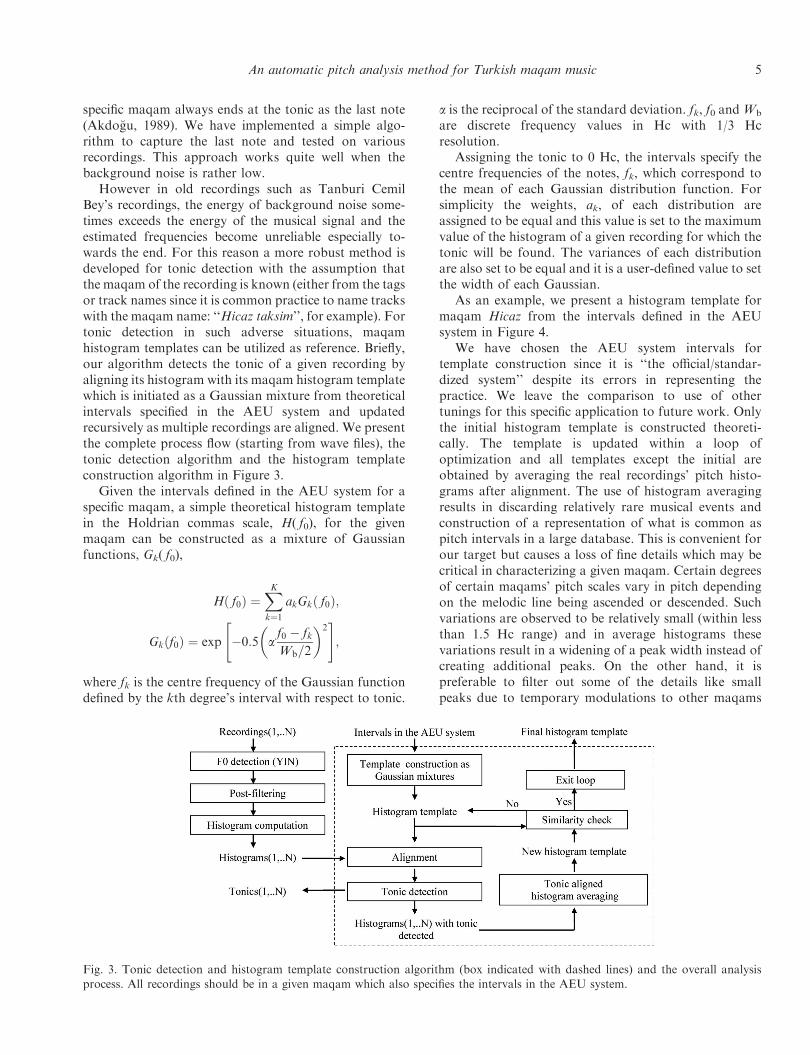
However in old recordings such as Tanburi CemilBey’s recordings, the energy of background noise some-times exceeds the energy of the musical signal and theestimated frequencies become unreliable especially to-wards the end. For this reason a more robust method isdeveloped for tonic detection with the assumption thatthe maqam of the recording is known (either from the tagsor track names since it is common practice to name trackswith the maqam name: ‘‘Hicaz taksim’’, for example). Fortonic detection in such adverse situations, maqamhistogram templates can be utilized as reference. Briefly,our algorithm detects the tonic of a given recording byaligning its histogram with its maqam histogram templatewhich is initiated as a Gaussian mixture from theoreticalintervals specified in the AEU system and updatedrecursively as multiple recordings are aligned. We presentthe complete process flow (starting from wave files), thetonic detection algorithm and the histogram templateconstruction algorithm in Figure 3.
Given the intervals defined in the AEU system for aspecific maqam, a simple theoretical histogram templatein the Holdrian commas scale, H( f0), for the givenmaqam can be constructed as a mixture of Gaussianfunctions, Gk( f0),
Hð f0Þ ¼XKk¼1
akGkð f0Þ;
Gkðf0Þ ¼ exp �0:5 af0 � fkWb=2
� �2" #
;
where fk is the centre frequency of the Gaussian functiondefined by the kth degree’s interval with respect to tonic.
a is the reciprocal of the standard deviation. fk, f0 andWb
are discrete frequency values in Hc with 1/3 Hcresolution.
Assigning the tonic to 0 Hc, the intervals specify thecentre frequencies of the notes, fk, which correspond tothe mean of each Gaussian distribution function. Forsimplicity the weights, ak, of each distribution areassigned to be equal and this value is set to the maximumvalue of the histogram of a given recording for which thetonic will be found. The variances of each distributionare also set to be equal and it is a user-defined value to setthe width of each Gaussian.
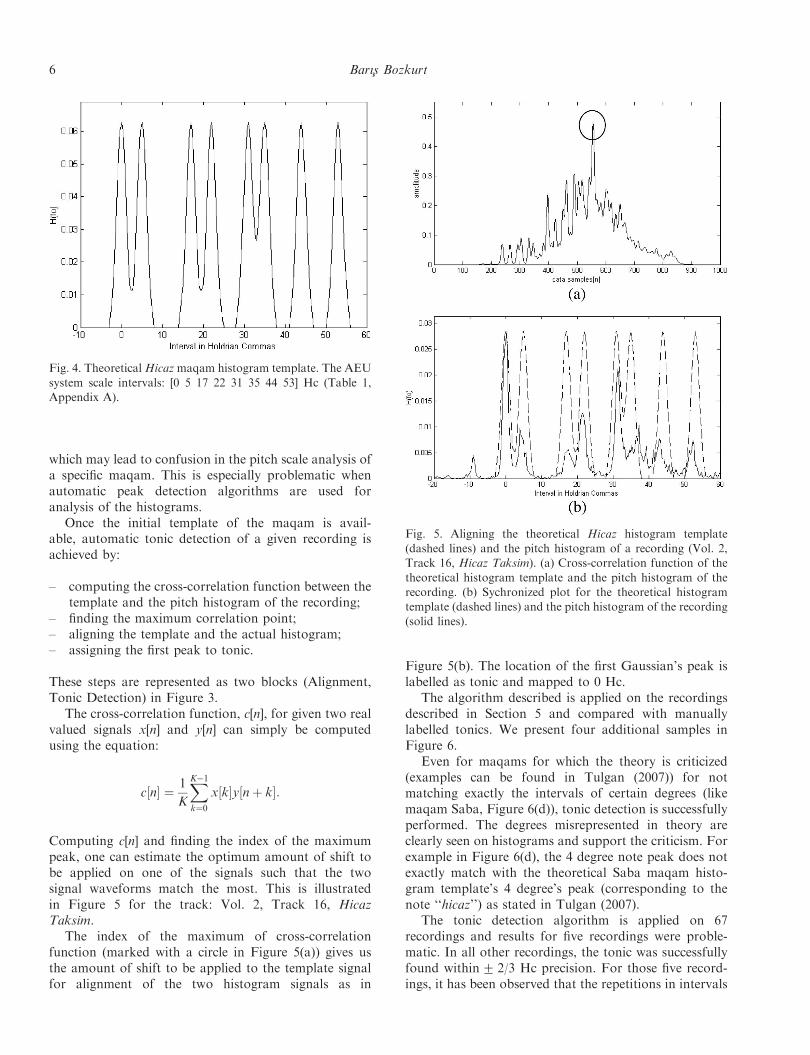
As an example, we present a histogram template formaqam Hicaz from the intervals defined in the AEUsystem in Figure 4.
We have chosen the AEU system intervals fortemplate construction since it is ‘‘the official/standar-dized system’’ despite its errors in representing thepractice. We leave the comparison to use of othertunings for this specific application to future work. Onlythe initial histogram template is constructed theoreti-cally. The template is updated within a loop ofoptimization and all templates except the initial areobtained by averaging the real recordings’ pitch histo-grams after alignment. The use of histogram averagingresults in discarding relatively rare musical events andconstruction of a representation of what is common aspitch intervals in a large database. This is convenient forour target but causes a loss of fine details which may becritical in characterizing a given maqam. Certain degreesof certain maqams’ pitch scales vary in pitch dependingon the melodic line being ascended or descended. Suchvariations are observed to be relatively small (within lessthan 1.5 Hc range) and in average histograms thesevariations result in a widening of a peak width instead ofcreating additional peaks. On the other hand, it ispreferable to filter out some of the details like smallpeaks due to temporary modulations to other maqams
Fig. 3. Tonic detection and histogram template construction algorithm (box indicated with dashed lines) and the overall analysisprocess. All recordings should be in a given maqam which also specifies the intervals in the AEU system.
An automatic pitch analysis method for Turkish maqam music 5
which may lead to confusion in the pitch scale analysis ofa specific maqam. This is especially problematic whenautomatic peak detection algorithms are used foranalysis of the histograms.
Once the initial template of the maqam is avail-able, automatic tonic detection of a given recording isachieved by:
– computing the cross-correlation function between thetemplate and the pitch histogram of the recording;
– finding the maximum correlation point;– aligning the template and the actual histogram;– assigning the first peak to tonic.
These steps are represented as two blocks (Alignment,Tonic Detection) in Figure 3.
The cross-correlation function, c[n], for given two realvalued signals x[n] and y[n] can simply be computedusing the equation:
c½n� ¼ 1
K
XK�1k¼0
x½k�y½nþ k�:
Computing c[n] and finding the index of the maximumpeak, one can estimate the optimum amount of shift tobe applied on one of the signals such that the twosignal waveforms match the most. This is illustratedin Figure 5 for the track: Vol. 2, Track 16, HicazTaksim.
The index of the maximum of cross-correlationfunction (marked with a circle in Figure 5(a)) gives usthe amount of shift to be applied to the template signalfor alignment of the two histogram signals as in
Figure 5(b). The location of the first Gaussian’s peak islabelled as tonic and mapped to 0 Hc.
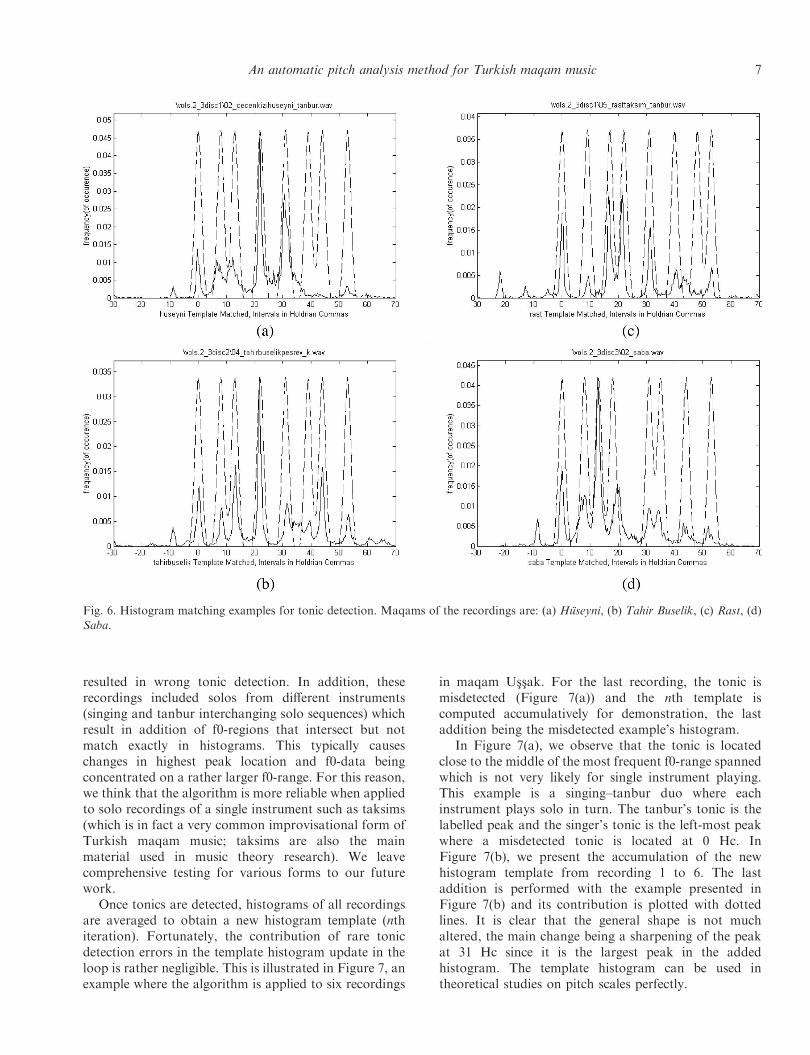
The algorithm described is applied on the recordingsdescribed in Section 5 and compared with manuallylabelled tonics. We present four additional samples inFigure 6.
Even for maqams for which the theory is criticized(examples can be found in Tulgan (2007)) for notmatching exactly the intervals of certain degrees (likemaqam Saba, Figure 6(d)), tonic detection is successfullyperformed. The degrees misrepresented in theory areclearly seen on histograms and support the criticism. Forexample in Figure 6(d), the 4 degree note peak does notexactly match with the theoretical Saba maqam histo-gram template’s 4 degree’s peak (corresponding to thenote ‘‘hicaz’’) as stated in Tulgan (2007).
The tonic detection algorithm is applied on 67recordings and results for five recordings were proble-matic. In all other recordings, the tonic was successfullyfound within+ 2/3 Hc precision. For those five record-ings, it has been observed that the repetitions in intervals
Fig. 4. TheoreticalHicazmaqam histogram template. The AEU
system scale intervals: [0 5 17 22 31 35 44 53] Hc (Table 1,Appendix A).
Fig. 5. Aligning the theoretical Hicaz histogram template(dashed lines) and the pitch histogram of a recording (Vol. 2,Track 16, Hicaz Taksim). (a) Cross-correlation function of the
theoretical histogram template and the pitch histogram of therecording. (b) Sychronized plot for the theoretical histogramtemplate (dashed lines) and the pitch histogram of the recording
(solid lines).
6 Barıs Bozkurt
resulted in wrong tonic detection. In addition, theserecordings included solos from different instruments(singing and tanbur interchanging solo sequences) whichresult in addition of f0-regions that intersect but notmatch exactly in histograms. This typically causeschanges in highest peak location and f0-data beingconcentrated on a rather larger f0-range. For this reason,we think that the algorithm is more reliable when appliedto solo recordings of a single instrument such as taksims(which is in fact a very common improvisational form ofTurkish maqam music; taksims are also the mainmaterial used in music theory research). We leavecomprehensive testing for various forms to our futurework.
Once tonics are detected, histograms of all recordingsare averaged to obtain a new histogram template (nthiteration). Fortunately, the contribution of rare tonicdetection errors in the template histogram update in theloop is rather negligible. This is illustrated in Figure 7, anexample where the algorithm is applied to six recordings
in maqam Ussak. For the last recording, the tonic ismisdetected (Figure 7(a)) and the nth template iscomputed accumulatively for demonstration, the lastaddition being the misdetected example’s histogram.
In Figure 7(a), we observe that the tonic is locatedclose to the middle of the most frequent f0-range spannedwhich is not very likely for single instrument playing.This example is a singing–tanbur duo where eachinstrument plays solo in turn. The tanbur’s tonic is thelabelled peak and the singer’s tonic is the left-most peakwhere a misdetected tonic is located at 0 Hc. InFigure 7(b), we present the accumulation of the newhistogram template from recording 1 to 6. The lastaddition is performed with the example presented inFigure 7(b) and its contribution is plotted with dottedlines. It is clear that the general shape is not muchaltered, the main change being a sharpening of the peakat 31 Hc since it is the largest peak in the addedhistogram. The template histogram can be used intheoretical studies on pitch scales perfectly.
Fig. 6. Histogram matching examples for tonic detection. Maqams of the recordings are: (a) Huseyni, (b) Tahir Buselik, (c) Rast, (d)
Saba.
An automatic pitch analysis method for Turkish maqam music 7
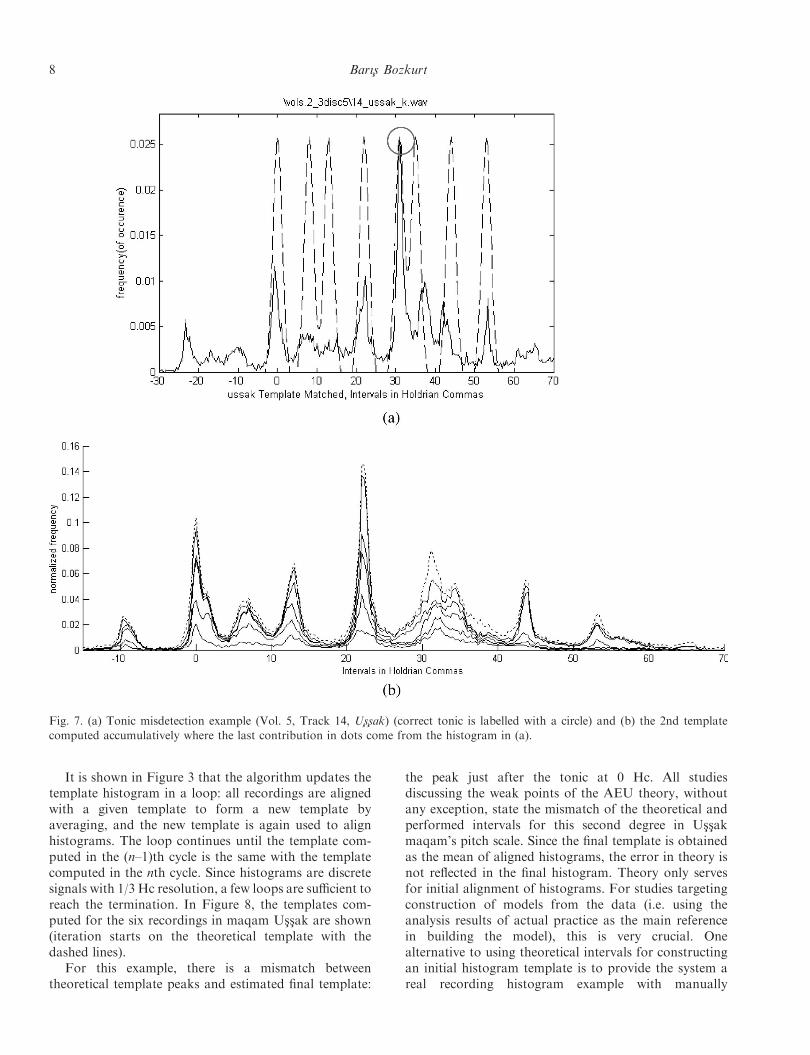
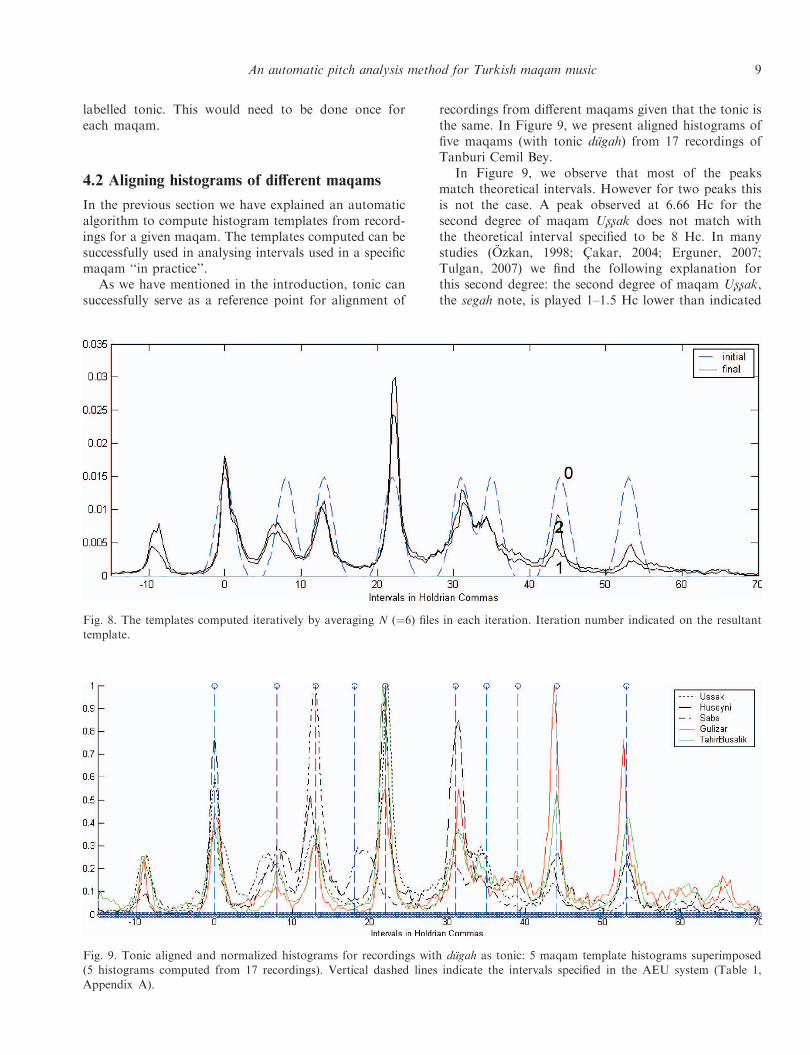
It is shown in Figure 3 that the algorithm updates thetemplate histogram in a loop: all recordings are alignedwith a given template to form a new template byaveraging, and the new template is again used to alignhistograms. The loop continues until the template com-puted in the (n–1)th cycle is the same with the templatecomputed in the nth cycle. Since histograms are discretesignals with 1/3 Hc resolution, a few loops are sufficient toreach the termination. In Figure 8, the templates com-puted for the six recordings in maqam Ussak are shown(iteration starts on the theoretical template with thedashed lines).
For this example, there is a mismatch betweentheoretical template peaks and estimated final template:
the peak just after the tonic at 0 Hc. All studiesdiscussing the weak points of the AEU theory, withoutany exception, state the mismatch of the theoretical andperformed intervals for this second degree in Ussakmaqam’s pitch scale. Since the final template is obtainedas the mean of aligned histograms, the error in theory isnot reflected in the final histogram. Theory only servesfor initial alignment of histograms. For studies targetingconstruction of models from the data (i.e. using theanalysis results of actual practice as the main referencein building the model), this is very crucial. Onealternative to using theoretical intervals for constructingan initial histogram template is to provide the system areal recording histogram example with manually
Fig. 7. (a) Tonic misdetection example (Vol. 5, Track 14, Ussak) (correct tonic is labelled with a circle) and (b) the 2nd templatecomputed accumulatively where the last contribution in dots come from the histogram in (a).
8 Barıs Bozkurt
labelled tonic. This would need to be done once foreach maqam.
4.2 Aligning histograms of different maqams
In the previous section we have explained an automaticalgorithm to compute histogram templates from record-ings for a given maqam. The templates computed can besuccessfully used in analysing intervals used in a specificmaqam ‘‘in practice’’.
As we have mentioned in the introduction, tonic cansuccessfully serve as a reference point for alignment of
recordings from different maqams given that the tonic isthe same. In Figure 9, we present aligned histograms offive maqams (with tonic dugah) from 17 recordings ofTanburi Cemil Bey.
In Figure 9, we observe that most of the peaksmatch theoretical intervals. However for two peaks thisis not the case. A peak observed at 6.66 Hc for thesecond degree of maqam Ussak does not match withthe theoretical interval specified to be 8 Hc. In manystudies (Ozkan, 1998; Cakar, 2004; Erguner, 2007;Tulgan, 2007) we find the following explanation forthis second degree: the second degree of maqam Ussak,the segah note, is played 1–1.5 Hc lower than indicated
Fig. 8. The templates computed iteratively by averaging N (¼6) files in each iteration. Iteration number indicated on the resultanttemplate.
Fig. 9. Tonic aligned and normalized histograms for recordings with dugah as tonic: 5 maqam template histograms superimposed(5 histograms computed from 17 recordings). Vertical dashed lines indicate the intervals specified in the AEU system (Table 1,
Appendix A).
An automatic pitch analysis method for Turkish maqam music 9
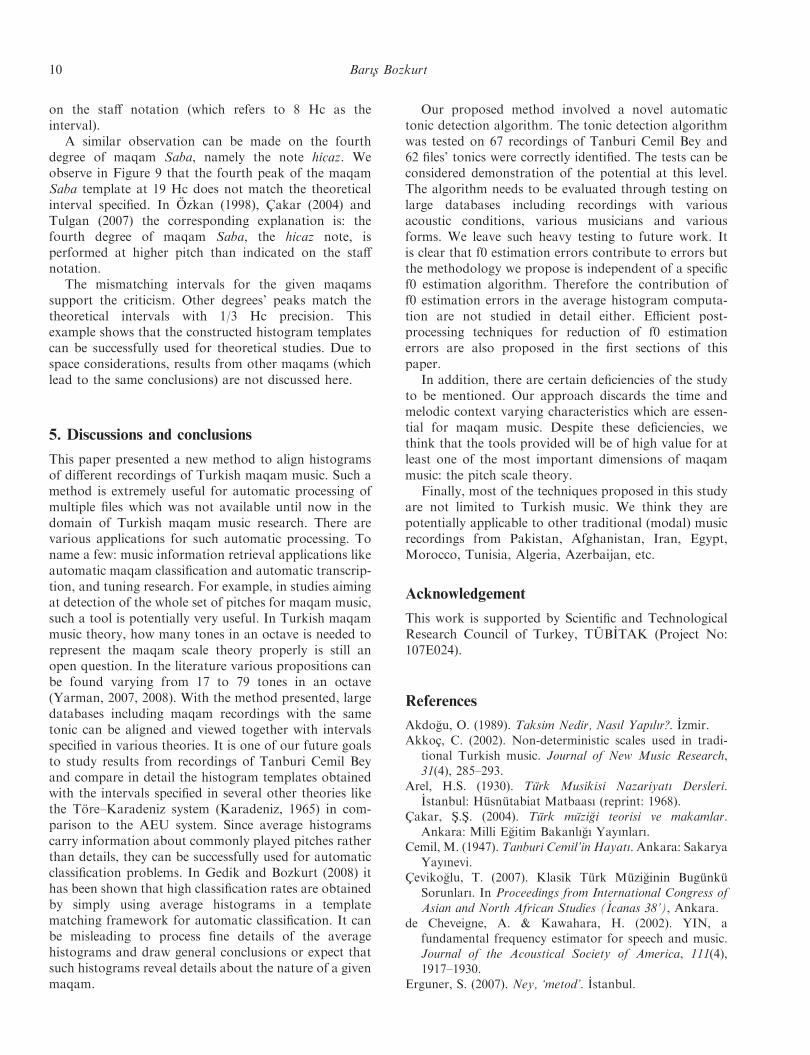
on the staff notation (which refers to 8 Hc as theinterval).
A similar observation can be made on the fourthdegree of maqam Saba, namely the note hicaz. Weobserve in Figure 9 that the fourth peak of the maqamSaba template at 19 Hc does not match the theoreticalinterval specified. In Ozkan (1998), Cakar (2004) andTulgan (2007) the corresponding explanation is: thefourth degree of maqam Saba, the hicaz note, isperformed at higher pitch than indicated on the staffnotation.
The mismatching intervals for the given maqamssupport the criticism. Other degrees’ peaks match thetheoretical intervals with 1/3 Hc precision. Thisexample shows that the constructed histogram templatescan be successfully used for theoretical studies. Due tospace considerations, results from other maqams (whichlead to the same conclusions) are not discussed here.
5. Discussions and conclusions
This paper presented a new method to align histogramsof different recordings of Turkish maqam music. Such amethod is extremely useful for automatic processing ofmultiple files which was not available until now in thedomain of Turkish maqam music research. There arevarious applications for such automatic processing. Toname a few: music information retrieval applications likeautomatic maqam classification and automatic transcrip-tion, and tuning research. For example, in studies aimingat detection of the whole set of pitches for maqam music,such a tool is potentially very useful. In Turkish maqammusic theory, how many tones in an octave is needed torepresent the maqam scale theory properly is still anopen question. In the literature various propositions canbe found varying from 17 to 79 tones in an octave(Yarman, 2007, 2008). With the method presented, largedatabases including maqam recordings with the sametonic can be aligned and viewed together with intervalsspecified in various theories. It is one of our future goalsto study results from recordings of Tanburi Cemil Beyand compare in detail the histogram templates obtainedwith the intervals specified in several other theories likethe Tore–Karadeniz system (Karadeniz, 1965) in com-parison to the AEU system. Since average histogramscarry information about commonly played pitches ratherthan details, they can be successfully used for automaticclassification problems. In Gedik and Bozkurt (2008) ithas been shown that high classification rates are obtainedby simply using average histograms in a templatematching framework for automatic classification. It canbe misleading to process fine details of the averagehistograms and draw general conclusions or expect thatsuch histograms reveal details about the nature of a givenmaqam.
Our proposed method involved a novel automatictonic detection algorithm. The tonic detection algorithmwas tested on 67 recordings of Tanburi Cemil Bey and62 files’ tonics were correctly identified. The tests can beconsidered demonstration of the potential at this level.The algorithm needs to be evaluated through testing onlarge databases including recordings with variousacoustic conditions, various musicians and variousforms. We leave such heavy testing to future work. Itis clear that f0 estimation errors contribute to errors butthe methodology we propose is independent of a specificf0 estimation algorithm. Therefore the contribution off0 estimation errors in the average histogram computa-tion are not studied in detail either. Efficient post-processing techniques for reduction of f0 estimationerrors are also proposed in the first sections of thispaper.
In addition, there are certain deficiencies of the studyto be mentioned. Our approach discards the time andmelodic context varying characteristics which are essen-tial for maqam music. Despite these deficiencies, wethink that the tools provided will be of high value for atleast one of the most important dimensions of maqammusic: the pitch scale theory.
Finally, most of the techniques proposed in this studyare not limited to Turkish music. We think they arepotentially applicable to other traditional (modal) musicrecordings from Pakistan, Afghanistan, Iran, Egypt,Morocco, Tunisia, Algeria, Azerbaijan, etc.
Acknowledgement
This work is supported by Scientific and TechnologicalResearch Council of Turkey, TUB_ITAK (Project No:107E024).
References
Akdo�gu, O. (1989). Taksim Nedir, Nasıl Yapılır?. _Izmir.Akkoc, C. (2002). Non-deterministic scales used in tradi-
tional Turkish music. Journal of New Music Research,31(4), 285–293.
Arel, H.S. (1930). Turk Musikisi Nazariyatı Dersleri._Istanbul: Husnutabiat Matbaası (reprint: 1968).
Cakar, S.S. (2004). Turk muzi�gi teorisi ve makamlar.Ankara: Milli E�gitim Bakanlı�gı Yayınları.
Cemil, M. (1947). Tanburi Cemil’in Hayatı.Ankara: SakaryaYayınevi.
Ceviko�glu, T. (2007). Klasik Turk Muzi�ginin BugunkuSorunları. In Proceedings from International Congress ofAsian and North African Studies ( _Icanas 38’), Ankara.
de Cheveigne, A. & Kawahara, H. (2002). YIN, afundamental frequency estimator for speech and music.Journal of the Acoustical Society of America, 111(4),1917–1930.
Erguner, S. (2007). Ney, ‘metod’. _Istanbul.
10 Barıs Bozkurt
Ezgi, S.Z. (1933). Nazarı ve Amelı Turk Musıkısi. Vol. I. (pp.8–29). _Istanbul: Milli Mecmua Matbaası.
Gedik, A.C. & Bozkurt, B. (2008). Automatic classificationof taksim recordings in Turkish makam music. InConference on Interdisciplinary Musicology, 2–6 July,Thessaloniki, Greece.
Karadeniz, M.E. (1965). Turk Musıkisinin Nazariye veEsasları. _Istanbul: _Is Bankası Yayınları.
Karaosmano�glu, M.K. (2004). Turk musikisi perdeleriniolcum, analiz ve test teknikleri. In Proceedings fromYıldız Teknik Universitesi Muzik Konferansı, _Istanbul,Turkey.
Karaosmano�glu, M.K. & Akkoc, C. (2003). Turk musıki-sinde icra – teori birli�gini sa�glama yolunda bir girisim. InProceedings from 10th Muzdak Symposium, _Istanbul,Turkey.
Ozkan, _I.H. (1998). Turk Musikisi Kuramsalı ve Usulleri –Kudum Velveleleri. _Istanbul: Otuken Nesriyat.
Oztuna, Y. (2006). Turk Musikisi: Akademik Klasik TurkSan’at Musikisi’nin Ansiklopedik Sozlu�gu, Vol. 2._Istanbul: Orient Press.
Powers, H. (1988). First meeting of the ICTM Study Groupon maqam. Yearbook for Traditional Music, 20, 199–218.
Tanrıkorur, C. (2004). Turk Muzi�gi Kimli�gi. _Istanbul:Dergah Yayınları.
Touma, H.H. (1971). The maqam phenomenon: an im-provisation technique in the music of the Middle East.Ethnomusicology, 15(1), 38–48.
Tulgan, O. (2007). Makam musiki perdelerinin sırrı,deduktif bir deneme. Muzik ve Bilim, 7, http://www.musikbilim.com/7m_2007/tulgan_o.html
Tzanetakis, G., Kapur, A., Schloss, W.A. & Wright, M.(2007). Computational ethnomusicology. Journal ofInterdisciplinary Music Studies, 1(2), 1–24.
Yarman, O. (2007). A comparative evaluation of pitchnotations in Turkish makam music. Journal of Inter-disciplinary Music Studies, 1(2), 43–61.
Yarman, O. (2008). 79-tone tuning & theory for Turkishmaqam music. PhD thesis, _Istanbul Technical University,Social Sciences Institute, _Istanbul.
Yekta, R. (1922). Turk Musikisi. Transl. O. Nasuhio�glu.(pp. 6–16). _Istanbul: Pan Yayıncılık (reprinted: 1986).
Zannos, I. (1990). Intonation in theory and practice ofGreek and Turkish music. Yearbook for TraditionalMusic, 22, 42–59.
Zeren, A. (2003). Muzik sorunlarımız uzerine arastırmalar._Istanbul: Pan Yayıncılık.
Appendix A: Pitch scale intervals in theArel–Ezgi–Uzdilek (AEU)
The most commonly referred system for Turkish maqammusic is the Arel–Ezgi–Uzdilek (AEU) system (Arel,1930; Ezgi, 1933) which is considered as the ‘‘officialtheory’’. Most of the available theory and instrumentmethod books use AEU as the basic system. It is shown
in Yarman (2007) that the AEU system is also equivalentto Yekta’s (1922) system in terms of the intervals used. Inthe AEU system, the following basic intervals (in termsof Holdrian commas (Hc)) are used:
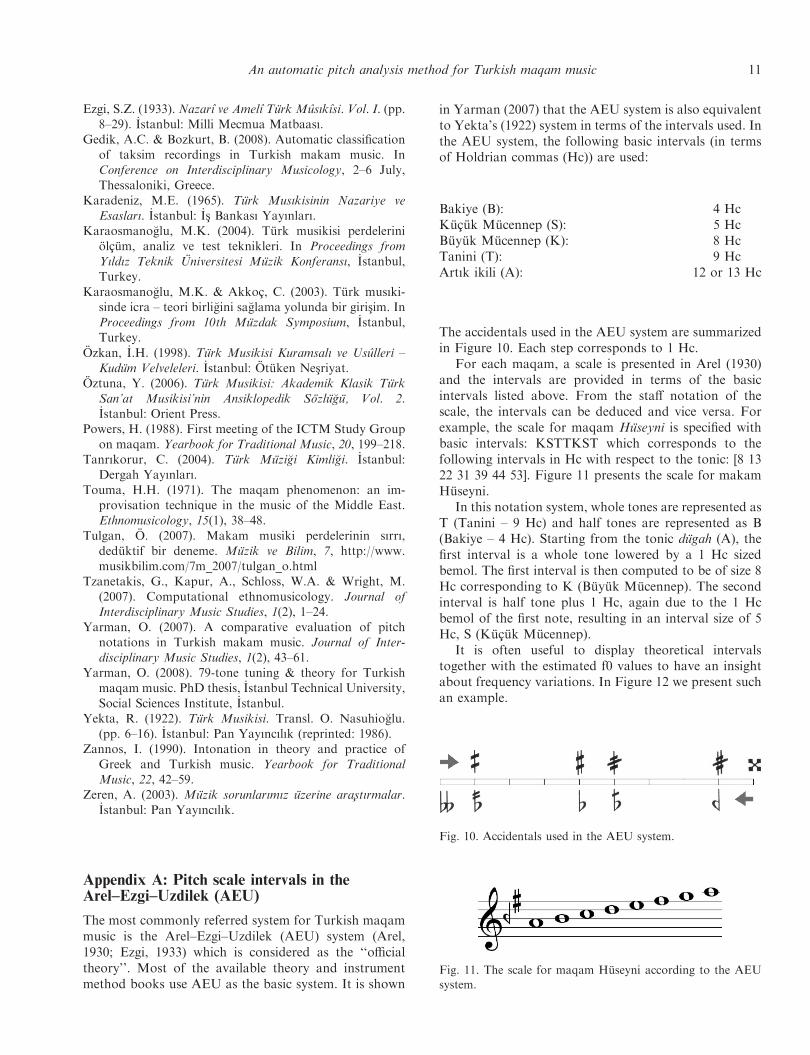
The accidentals used in the AEU system are summarizedin Figure 10. Each step corresponds to 1 Hc.
For each maqam, a scale is presented in Arel (1930)and the intervals are provided in terms of the basicintervals listed above. From the staff notation of thescale, the intervals can be deduced and vice versa. Forexample, the scale for maqam Huseyni is specified withbasic intervals: KSTTKST which corresponds to thefollowing intervals in Hc with respect to the tonic: [8 1322 31 39 44 53]. Figure 11 presents the scale for makamHuseyni.
In this notation system, whole tones are represented asT (Tanini – 9 Hc) and half tones are represented as B(Bakiye – 4 Hc). Starting from the tonic dugah (A), thefirst interval is a whole tone lowered by a 1 Hc sizedbemol. The first interval is then computed to be of size 8Hc corresponding to K (Buyuk Mucennep). The secondinterval is half tone plus 1 Hc, again due to the 1 Hcbemol of the first note, resulting in an interval size of 5Hc, S (Kucuk Mucennep).
It is often useful to display theoretical intervalstogether with the estimated f0 values to have an insightabout frequency variations. In Figure 12 we present suchan example.
Bakiye (B): 4 HcKucuk Mucennep (S): 5 HcBuyuk Mucennep (K): 8 HcTanini (T): 9 HcArtık ikili (A): 12 or 13 Hc
Fig. 10. Accidentals used in the AEU system.
Fig. 11. The scale for maqam Huseyni according to the AEU
system.
An automatic pitch analysis method for Turkish maqam music 11
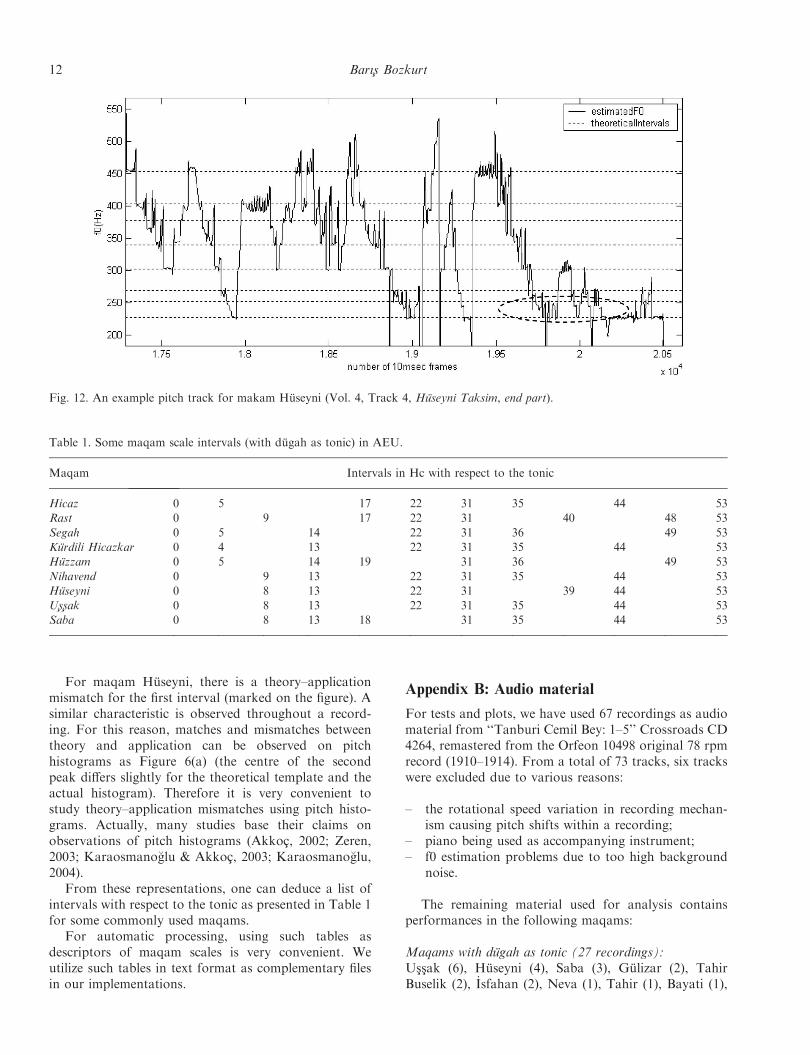
For maqam Huseyni, there is a theory–applicationmismatch for the first interval (marked on the figure). Asimilar characteristic is observed throughout a record-ing. For this reason, matches and mismatches betweentheory and application can be observed on pitchhistograms as Figure 6(a) (the centre of the secondpeak differs slightly for the theoretical template and theactual histogram). Therefore it is very convenient tostudy theory–application mismatches using pitch histo-grams. Actually, many studies base their claims onobservations of pitch histograms (Akkoc, 2002; Zeren,2003; Karaosmano�glu & Akkoc, 2003; Karaosmano�glu,2004).
From these representations, one can deduce a list ofintervals with respect to the tonic as presented in Table 1for some commonly used maqams.
For automatic processing, using such tables asdescriptors of maqam scales is very convenient. Weutilize such tables in text format as complementary filesin our implementations.
Appendix B: Audio material
For tests and plots, we have used 67 recordings as audiomaterial from ‘‘Tanburi Cemil Bey: 1–5’’ Crossroads CD4264, remastered from the Orfeon 10498 original 78 rpmrecord (1910–1914). From a total of 73 tracks, six trackswere excluded due to various reasons:
– the rotational speed variation in recording mechan-ism causing pitch shifts within a recording;
– piano being used as accompanying instrument;– f0 estimation problems due to too high background
noise.
The remaining material used for analysis containsperformances in the following maqams:
Maqams with dugah as tonic (27 recordings):Ussak (6), Huseyni (4), Saba (3), Gulizar (2), TahirBuselik (2), _Isfahan (2), Neva (1), Tahir (1), Bayati (1),
Fig. 12. An example pitch track for makam Huseyni (Vol. 4, Track 4, Huseyni Taksim, end part).
Table 1. Some maqam scale intervals (with dugah as tonic) in AEU.
Maqam Intervals in Hc with respect to the tonic
Hicaz 0 5 17 22 31 35 44 53Rast 0 9 17 22 31 40 48 53
Segah 0 5 14 22 31 36 49 53Kurdili Hicazkar 0 4 13 22 31 35 44 53Huzzam 0 5 14 19 31 36 49 53
Nihavend 0 9 13 22 31 35 44 53Huseyni 0 8 13 22 31 39 44 53Ussak 0 8 13 22 31 35 44 53Saba 0 8 13 18 31 35 44 53
12 Barıs Bozkurt
Kurdi (1), Sehnaz (1), Hicaz (1), Nisaburek (1),Muhayyer (1).
Maqams with rast as tonic (16 recordings):Rast (2), Pesendide (1), Neveser (1), Nihavend (2), Mahur(3), Kurdili Hicazkar (2), Hicazkar (3), Suzinak (2).
Maqams with segah as tonic (5 recordings):Segah (3), Mustear (1), Huzzam (1).
Maqams with ırak as tonic (8 recordings):Irak (1), Bestenigar (3), Evic (2), Ferahnak (2).
Maqams with yegah as tonic (8 recordings):Yegah (3), Ferahfeza (3), Sedaraban (2).
Maqams with huseyni asiran as tonic (2 recordings):Nuhuft (1), Suzidil (1).
Maqams with acem asiran as tonic (1 recording):Sevkefza (1).
On these recordings Tanburi Cemil Bey playskemence (an unfretted instrument), tanbur (movablefretted instrument), yaylı tanbur (tanbur played with abow), lute and violin. It is acknowledged in varioustexts that Tanburi Cemil Bey used fewer number offrets (43 for two octave range whereas today’stanburs have more than 50 frets) and adjusted fretlocations time to time before starting a taksim on aspecific makam.
A few pre-processing operations were performed onrecordings. Most of the recordings contain speech at thebeginning as announcement of the content of recording.These portions of the recordings are silenced out. Whennecessary and possible, periodic noise is suppressed viafrequency selective filters.
An automatic pitch analysis method for Turkish maqam music 13