manzanita elementary school school accountability report...
TRANSCRIPT
2015-16 School Accountability Report Card for Manzanita Elementary School Page 1 of 12
Manzanita Elementary School
School Accountability Report Card
Reported Using Data from the 2015-16 School Year
Published During 2016-17
By February 1 of each year, every school in California is required by state law to publish a School Accountability Report Card (SARC). The SARC contains information about the condition and performance of each California public school. Under the Local Control Funding Formula (LCFF) all local educational agencies (LEAs) are required to prepare a Local Control and Accountability Plan (LCAP), which describes how they intend to meet annual school-specific goals for all pupils, with specific activities to address state and local priorities. Additionally, data reported in an LCAP is to be consistent with data reported in the SARC. • For more information about SARC requirements, see the California Department of Education (CDE) SARC Web page at
http://www.cde.ca.gov/ta/ac/sa/. • For more information about the LCFF or LCAP, see the CDE LCFF Web page at http://www.cde.ca.gov/fg/aa/lc/. • For additional information about the school, parents/guardians and community members should contact the school principal or
the district office. DataQuest DataQuest is an online data tool located on the CDE DataQuest Web page at http://dq.cde.ca.gov/dataquest/ that contains additional information about this school and comparisons of the school to the district and the county. Specifically, DataQuest is a dynamic system that provides reports for accountability (e.g., test data, enrollment, high school graduates, dropouts, course enrollments, staffing, and data regarding English learners). Internet Access Internet access is available at public libraries and other locations that are publicly accessible (e.g., the California State Library). Access to the Internet at libraries and public locations is generally provided on a first-come, first-served basis. Other use restrictions may include the hours of operation, the length of time that a workstation may be used (depending on availability), the types of software programs available on a workstation, and the ability to print documents.
About This School Contact Information (School Year 2016-17)
School Contact Information
School Name------- Manzanita Elementary School
Street------- 38620 33rd Street East
City, State, Zip------- Palmdale, CA 93550-4232
Phone Number------- (661) 947-3128
Principal------- Roberto Lopez
E-mail Address------- [email protected]
Web Site------- www.palmdalesd.org
CDS Code 19-64857-6021158
2015-16 School Accountability Report Card for Manzanita Elementary School Page 2 of 12
District Contact Information
District Name------- Palmdale Elementary School District
Phone Number------- (661) 947-7191
Superintendent-------
Raul Maldonado
E-mail Address------- [email protected]
Web Site------- www.palmdalesd.org
School Description and Mission Statement (School Year 2016-17)
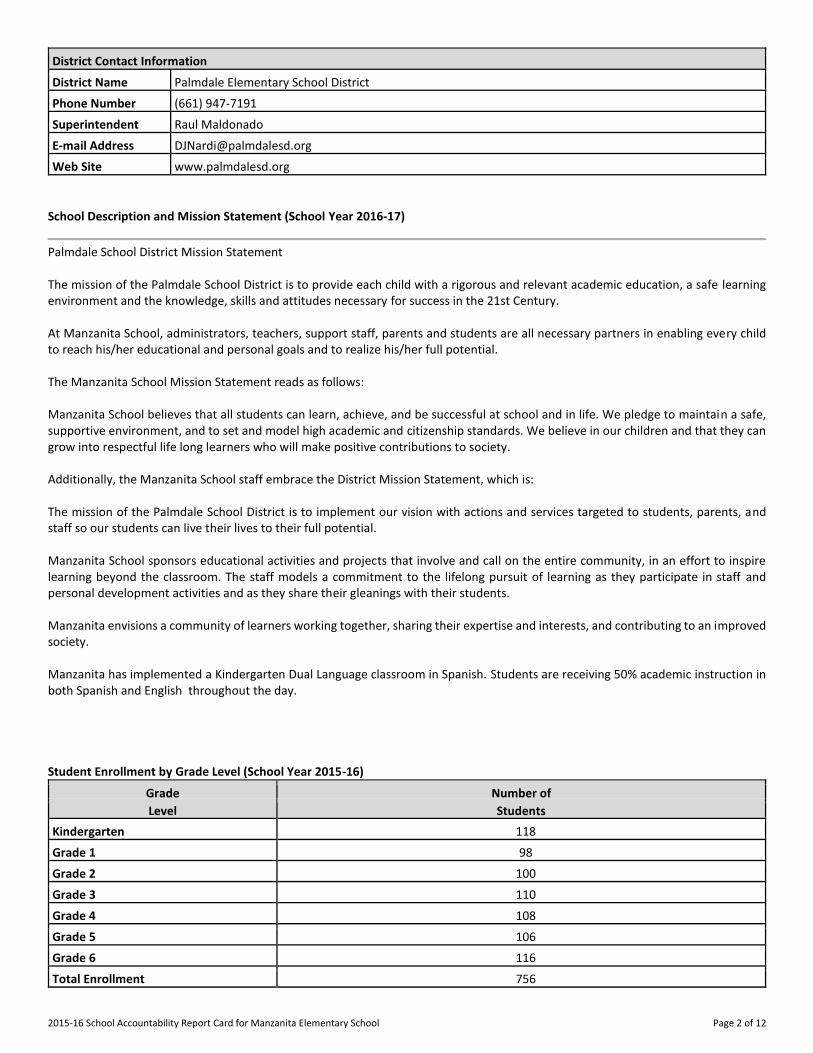
Palmdale School District Mission Statement The mission of the Palmdale School District is to provide each child with a rigorous and relevant academic education, a safe learning environment and the knowledge, skills and attitudes necessary for success in the 21st Century. At Manzanita School, administrators, teachers, support staff, parents and students are all necessary partners in enabling every child to reach his/her educational and personal goals and to realize his/her full potential. The Manzanita School Mission Statement reads as follows: Manzanita School believes that all students can learn, achieve, and be successful at school and in life. We pledge to maintain a safe, supportive environment, and to set and model high academic and citizenship standards. We believe in our children and that they can grow into respectful life long learners who will make positive contributions to society. Additionally, the Manzanita School staff embrace the District Mission Statement, which is: The mission of the Palmdale School District is to implement our vision with actions and services targeted to students, parents, and staff so our students can live their lives to their full potential. Manzanita School sponsors educational activities and projects that involve and call on the entire community, in an effort to inspire learning beyond the classroom. The staff models a commitment to the lifelong pursuit of learning as they participate in staff and personal development activities and as they share their gleanings with their students. Manzanita envisions a community of learners working together, sharing their expertise and interests, and contributing to an improved society. Manzanita has implemented a Kindergarten Dual Language classroom in Spanish. Students are receiving 50% academic instruction in both Spanish and English throughout the day. Student Enrollment by Grade Level (School Year 2015-16)
Grade Number of
Level Students
Kindergarten 118
Grade 1 98
Grade 2 100
Grade 3 110
Grade 4 108
Grade 5 106
Grade 6 116
Total Enrollment 756

2015-16 School Accountability Report Card for Manzanita Elementary School Page 3 of 12
Student Enrollment by Group (School Year 2015-16)
Student Percent of
Group Total Enrollment
Black or African American 13.8
American Indian or Alaska Native 1.2
Asian 0.3
Filipino 0.7
Hispanic or Latino 78
Native Hawaiian or Pacific Islander 0.1
White 4.4
Two or More Races 1.5
Socioeconomically Disadvantaged 95.1
English Learners 40.9
Students with Disabilities 11.1
Foster Youth 3
A. Conditions of Learning
State Priority: Basic The SARC provides the following information relevant to the Basic State Priority (Priority 1): • Degree to which teachers are appropriately assigned and fully credentialed in the subject area and for the pupils they are
teaching; • Pupils have access to standards-aligned instructional materials; and • School facilities are maintained in good repair. Teacher Credentials
Teachers School District
2014-15 2015-16 2016-17 2016-17
With Full Credential 30 25 29 810
Without Full Credential 0 0 2 31
Teaching Outside Subject Area of Competence (with full credential) 0 0 0 0
Teacher Misassignments and Vacant Teacher Positions
Indicator 2014-15 2015-16 2016-17
Misassignments of Teachers of English Learners 0 0 0
Total Teacher Misassignments * 0 0 0
Vacant Teacher Positions 0 0 0 Note: “Misassignments” refers to the number of positions filled by teachers who lack legal authorization to teach that grade level, subject area, student group, etc. * Total Teacher Misassignments includes the number of Misassignments of Teachers of English Learners.

2015-16 School Accountability Report Card for Manzanita Elementary School Page 4 of 12
Core Academic Classes Taught by Highly Qualified Teachers (School Year 2015-16)
Location of Classes Percent of Classes In Core Academic Subjects
Taught by Highly Qualified Teachers Not Taught by Highly Qualified Teachers
This School 96.4 3.6
All Schools in District 88.8 11.2
High-Poverty Schools in District 89.0 11.0
Low-Poverty Schools in District 61.9 38.1 Note: High-poverty schools are defined as those schools with student eligibility of approximately 40 percent or more in the free and reduced price meals program. Low-poverty schools are those with student eligibility of approximately 39 percent or less in the free and reduced price meals program. Quality, Currency, Availability of Textbooks and Instructional Materials (School Year 2016-17) Year and month in which data were collected: September 2015 All students are provided with appropriate textbooks in each curriculum area.
Subject Textbooks and Instructional Materials/
Year of Adoption
From Most Recent
Adoption?
Percent of Students Lacking Own
Assigned Copy
Reading/Language Arts K-6 ELA/ELD: Houghton Mifflin Medallions 2010
7-8 ELA: Pearson Literature California 2010
7-8 ELD: Pearson Language Central 2010
Yes 0
Mathematics Math K-5: Eureka/Engage New York Math 2015
Math 6 – 8: Houghton Mifflin Math Big Ideas 2015
Yes 0
Science K-6: Harcourt California Edition Science 2007
7-8: Holt, Rinehart, & Winston 2007
Yes 0
History-Social Science K-6: Macmillan McGraw Hill 2007
7-8: McDougal Littell 2006
Yes 0
Foreign Language 7-8: Pearson Learning 2011 Yes 0
School Facility Conditions and Planned Improvements (Most Recent Year)
Manzanita School was established in 1957 and underwent a modernization project which was completed in 1998. In addition to the original school facility, Manzanita has 15 portable classrooms. The school facilities include a student computer lab, library, cafeteria/auditorium, and media center. Manzanita takes pride in keeping its school grounds and buildings groomed and clean. It is Manzanita's policy to maintain its classrooms and restrooms on a daily basis. Our staff monitors the hallways and restrooms on a regular basis. Additional cleaning and maintenance is performed as required. In August, our playground was resurfaced and in November, new playground equipment was installed.

2015-16 School Accountability Report Card for Manzanita Elementary School Page 5 of 12
School Facility Good Repair Status (Most Recent Year)
School Facility Good Repair Status (Most Recent Year) Year and month of the most recent FIT report: July 2016
System Inspected Repair Status Repair Needed and
Action Taken or Planned Good Fair Poor
Systems: Gas Leaks, Mechanical/HVAC, Sewer
X
Interior: Interior Surfaces X
Cleanliness: Overall Cleanliness, Pest/ Vermin Infestation
X
Electrical: Electrical X
Restrooms/Fountains: Restrooms, Sinks/ Fountains
X
Safety: Fire Safety, Hazardous Materials X
Structural: Structural Damage, Roofs X
External: Playground/School Grounds, Windows/ Doors/Gates/Fences
X
Overall Facility Rating (Most Recent Year)
Year and month of the most recent FIT report: July 2016
Overall Rating Exemplary Good Fair Poor
X
B. Pupil Outcomes
State Priority: Pupil Achievement The SARC provides the following information relevant to the State priority: Pupil Achievement (Priority 4): • Statewide assessments (i.e., California Assessment of Student Performance and Progress [CAASPP] System, which includes the
Smarter Balanced Summative Assessments for students in the general education population and the California Alternate Assessments [CAAs] for English language arts/literacy [ELA] and mathematics given in grades three through eight and grade eleven. The CAAs have replaced the California Alternate Performance Assessment [CAPA] for ELA and mathematics, which were eliminated in 2015. Only eligible students may participate in the administration of the CAAs. CAA items are aligned with alternate achievement standards, which are linked with the Common Core State Standards [CCSS] for students with significant cognitive disabilities); and
• The percentage of students who have successfully completed courses that satisfy the requirements for entrance to the University of California and the California State University, or career technical education sequences or programs of study
CAASPP Test Results in English Language Arts/Literacy (ELA) and Mathematics for All Students
Subject
Percent of Students Meeting or Exceeding the State Standards (grades 3-8 and 11)
School District State
2014-15 2015-16 2014-15 2015-16 2014-15 2015-16
English Language Arts/Literacy 17 19 29 31 44 48
Mathematics 8 9 19 19 34 36 Note: Percentages are not calculated when the number of students tested is ten or less, either because the number of students in this category is too small for statistical accuracy or to protect student privacy.

2015-16 School Accountability Report Card for Manzanita Elementary School Page 6 of 12
CAASPP Test Results in ELA by Student Group Grades Three through Eight and Grade Eleven (School Year 2015-16)
Student Group Grade
Number of Students Percent of Students
Enrolled Tested Tested Standard Met or
Exceeded
All Students 3 111 109 98.2 16.5
4 111 110 99.1 14.6
5 109 108 99.1 24.1
6 128 126 98.4 20.6
Male 3 54 52 96.3 13.5
4 61 61 100.0 11.5
5 53 53 100.0 13.2
6 73 71 97.3 21.1
Female 3 57 57 100.0 19.3
4 50 49 98.0 18.4
5 56 55 98.2 34.5
6 55 55 100.0 20.0
Black or African American 3 13 13 100.0
4 14 13 92.9 7.7
5 13 12 92.3 41.7
6 18 18 100.0 5.6
Hispanic or Latino 3 89 87 97.8 19.5
4 85 85 100.0 17.6
5 88 88 100.0 22.7
6 97 96 99.0 24.0
Socioeconomically Disadvantaged 3 102 100 98.0 16.0
4 110 109 99.1 14.7
5 104 103 99.0 23.3
6 117 116 99.2 19.0
English Learners 3 37 35 94.6
4 29 29 100.0
5 24 24 100.0
6 30 29 96.7
Students with Disabilities 4 25 25 100.0
5 23 23 100.0
6 28 28 100.0 7.1
Note: ELA test results include the Smarter Balanced Summative Assessment and the CAA. The “Percent Met or Exceeded” is calculated by taking the total number of students who met or exceeded the standard on the Smarter Balanced Summative Assessment plus the total number of students who met the standard on the CAAs divided by the total number of students who participated in both assessments. Double dashes (--) appear in the table when the number of students is ten or less, either because the number of students in this category is too small for statistical accuracy or to protect student privacy. Note: The number of students tested includes all students who participated in the test whether they received a score or not; however, the number of students tested is not the number that was used to calculate the achievement level percentages. The achievement level percentages are calculated using only students who received scores.

2015-16 School Accountability Report Card for Manzanita Elementary School Page 7 of 12
CAASPP Test Results in Mathematics by Student Group Grades Three through Eight and Grade Eleven (School Year 2015-16)
Student Group Grade
Number of Students Percent of Students
Enrolled Tested Tested Standard Met or
Exceeded
All Students 3 111 110 99.1 12.7
4 113 111 98.2 7.2
5 110 108 98.2 8.3
6 128 127 99.2 9.4
Male 3 54 53 98.2 11.3
4 62 62 100.0 6.5
5 53 53 100.0 5.7
6 73 72 98.6 13.9
Female 3 57 57 100.0 14.0
4 51 49 96.1 8.2
5 57 55 96.5 10.9
6 55 55 100.0 3.6
Black or African American 3 13 13 100.0
4 16 14 87.5 7.1
5 14 12 85.7 8.3
6 18 18 100.0
Hispanic or Latino 3 89 88 98.9 14.8
4 85 85 100.0 8.2
5 88 88 100.0 9.1
6 97 97 100.0 11.3
Socioeconomically Disadvantaged 3 102 101 99.0 11.9
4 111 110 99.1 7.3
5 104 103 99.0 8.7
6 117 117 100.0 9.4
English Learners 3 37 36 97.3 2.8
4 29 29 100.0
5 24 24 100.0
6 30 30 100.0
Students with Disabilities 4 25 25 100.0
5 23 23 100.0
6 28 28 100.0 3.6
Note: Mathematics test results include the Smarter Balanced Summative Assessment and the CAA. The “Percent Met or Exceeded” is calculated by taking the total number of students who met or exceeded the standard on the Smarter Balanced Summative Assessment plus the total number of students who met the standard on the CAAs divided by the total number of students who participated in both assessments. Double dashes (--) appear in the table when the number of students is ten or less, either because the number of students in this category is too small for statistical accuracy or to protect student privacy.

2015-16 School Accountability Report Card for Manzanita Elementary School Page 8 of 12
Note: The number of students tested includes all students who participated in the test whether they received a score or not; however, the number of students tested is not the number that was used to calculate the achievement level percentages. The achievement level percentages are calculated using only students who received scores.
CAASPP Test Results in Science for All Students
Subject
Percent of Students Scoring at Proficient or Advanced (meeting or exceeding the state standards)
School District State
2013-14 2014-15 2015-16 2013-14 2014-15 2015-16 2013-14 2014-15 2015-16
Science (grades 5, 8, and 10) 27 23 22 48 49 40 60 56 54 Note: Science test results include California Standards Tests (CSTs), California Modified Assessment (CMA), and California Alternate Performance Assessment (CAPA) in grades five, eight, and ten. Note: Scores are not shown when the number of students tested is ten or less, either because the number of students in this category is too small for statistical accuracy or to protect student privacy.
CAASPP Test Results in Science by Student Group Grades Five, Eight, and Ten (School Year 2015-16)
Student Group
Total Enrollment
# of Students with Valid Scores
% of Students with Valid Scores
% of Students Proficient or
Advanced
All Students 108 107 99.1 22.4
Male 53 53 100.0 18.9
Female 55 54 98.2 25.9
Black or African American 13 12 92.3 33.3
Hispanic or Latino 88 88 100.0 22.7
Socioeconomically Disadvantaged 103 102 99.0 21.6
English Learners 24 24 100.0
Students with Disabilities 23 23 100.0 Note: Science test results include CSTs, CMA, and CAPA in grades five, eight, and ten. The “Proficient or Advanced” is calculated by taking the total number of students who scored at Proficient or Advanced on the science assessment divided by the total number of students with valid scores. Note: Scores are not shown when the number of students tested is ten or less, either because the number of students in this category is too small for statistical accuracy or to protect student privacy.
State Priority: Other Pupil Outcomes The SARC provides the following information relevant to the Other Pupil Outcomes State Priority (Priority 8): • Pupil outcomes in the subject areas of physical education. California Physical Fitness Test Results (School Year 2015-16)
Grade Level
Percent of Students Meeting Fitness Standards
Four of Six Standards Five of Six Standards Six of Six Standards
---5--- 23.8 26.7 13.3 Note: Percentages are not calculated when the number of students tested is ten or less, either because the number of students in this category is too small for statistical accuracy or to protect student privacy.
2015-16 School Accountability Report Card for Manzanita Elementary School Page 9 of 12
C. Engagement
State Priority: Parental Involvement The SARC provides the following information relevant to the Parental Involvement State Priority (Priority 3): • Efforts the school district makes to seek parent input in making decisions for the school district and each schoolsite. Opportunities for Parental Involvement (School Year 2016-17)
Manzanita School strives to provide a welcoming environment which encourages community and parental involvement in its many and varied programs and services. Parents are encouraged to volunteer in Manzanita classrooms and to provide assistance and additional monitoring on field trips. Parents are also encouraged to participate in family nights, student performances, parent meetings, and parent-teacher conferences. At Manzanita School, translators are provided on site for parents who are not native English-speakers. Manzanita School has established an English Language Advisory Committee (ELAC), African American Parent Advisory Council (AAPAC) and School Site Council (SSC) that work to provide added support and suggestion to the Manzanita School students, parents, and staff. The School Site Council (SSC) is actively involved in the decision making processes that affect the daily lives of all Manzanita School community members. Manzanita has also established a Parent Teacher Organization (PTO) to help encourage more parent participation and support activities for students. Manzanita also creates opportunities for Gifted and Talented Education (GATE) parents to meet and discuss matters pertinent to their children's specific needs. Manzanita parents and guardians have the opportunity to attend Coffee with the Principal, Parent Partners program and technology software information parent meetings. ( Imagine Learning and Footsteps to Brilliance Program )
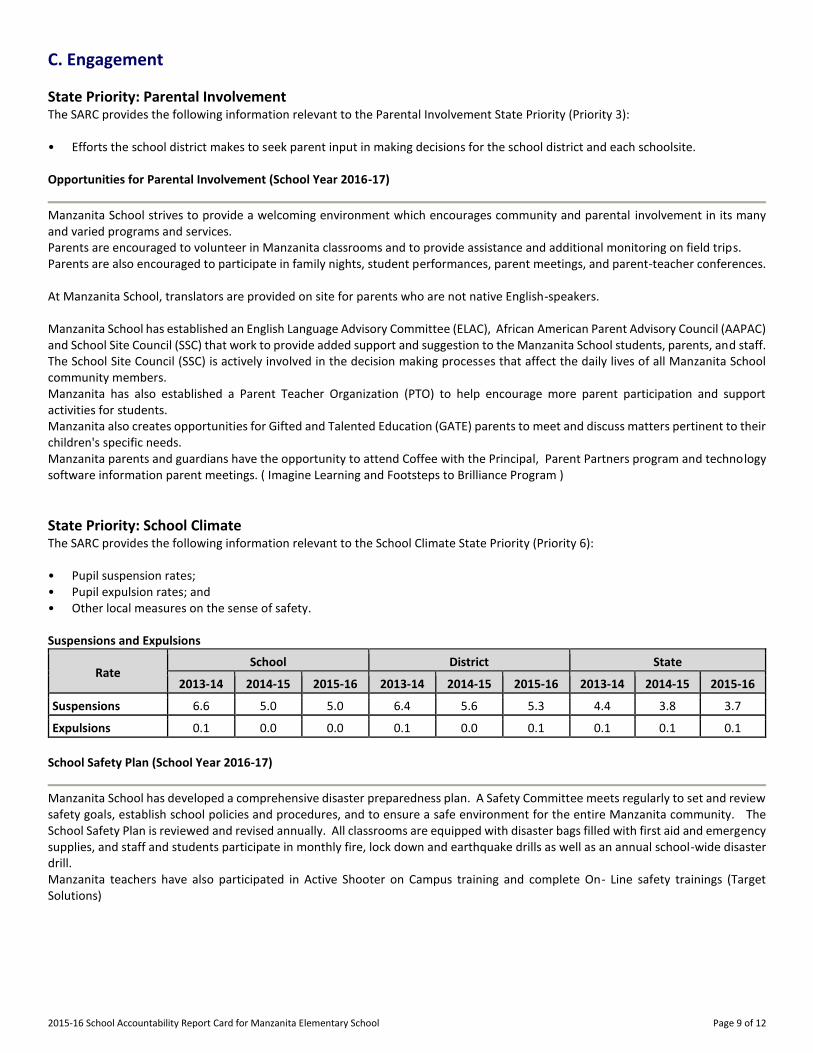
State Priority: School Climate The SARC provides the following information relevant to the School Climate State Priority (Priority 6): • Pupil suspension rates; • Pupil expulsion rates; and • Other local measures on the sense of safety. Suspensions and Expulsions
Rate School District State
2013-14 2014-15 2015-16 2013-14 2014-15 2015-16 2013-14 2014-15 2015-16
Suspensions------- 6.6 5.0 5.0 6.4 5.6 5.3 4.4 3.8 3.7
Expulsions------- 0.1 0.0 0.0 0.1 0.0 0.1 0.1 0.1 0.1
School Safety Plan (School Year 2016-17)
Manzanita School has developed a comprehensive disaster preparedness plan. A Safety Committee meets regularly to set and review safety goals, establish school policies and procedures, and to ensure a safe environment for the entire Manzanita community. The School Safety Plan is reviewed and revised annually. All classrooms are equipped with disaster bags filled with first aid and emergency supplies, and staff and students participate in monthly fire, lock down and earthquake drills as well as an annual school-wide disaster drill. Manzanita teachers have also participated in Active Shooter on Campus training and complete On- Line safety trainings (Target Solutions)
2015-16 School Accountability Report Card for Manzanita Elementary School Page 10 of 12
D. Other SARC Information
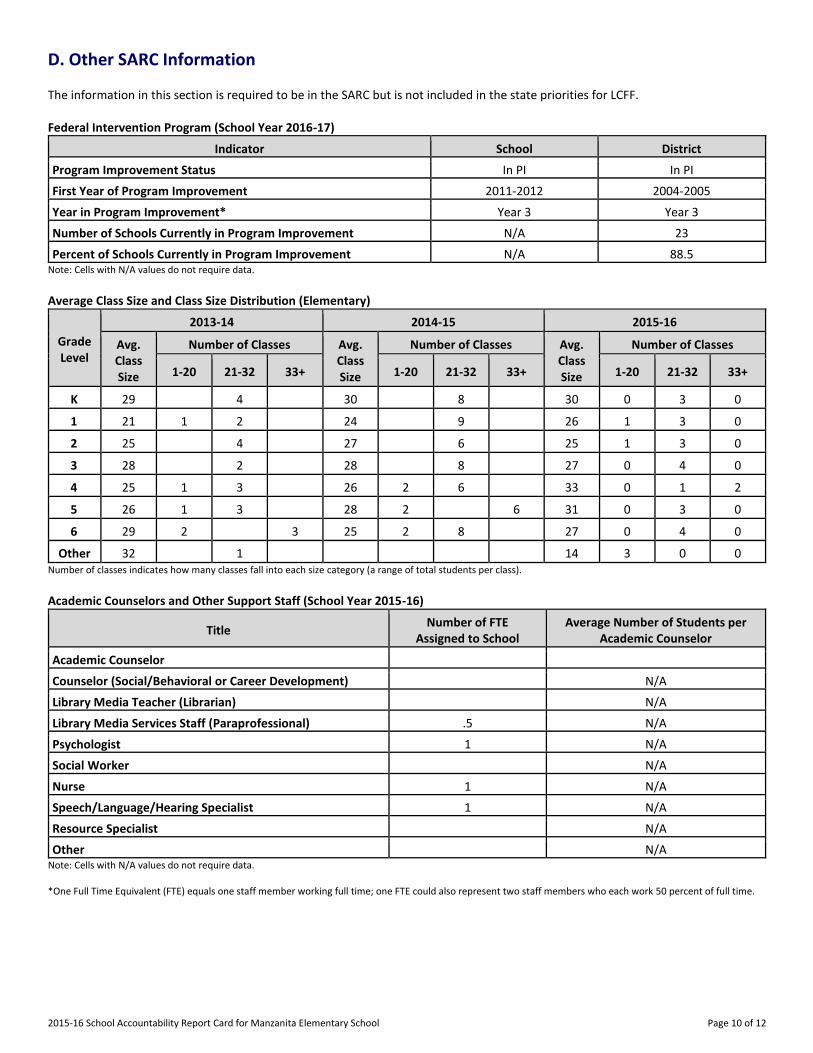
The information in this section is required to be in the SARC but is not included in the state priorities for LCFF. Federal Intervention Program (School Year 2016-17)
Indicator School District
Program Improvement Status In PI In PI
First Year of Program Improvement 2011-2012 2004-2005
Year in Program Improvement* Year 3 Year 3
Number of Schools Currently in Program Improvement N/A 23
Percent of Schools Currently in Program Improvement N/A 88.5 Note: Cells with N/A values do not require data.
Average Class Size and Class Size Distribution (Elementary)
Grade Level
2013-14 2014-15 2015-16
Avg. Class Size
Number of Classes Avg. Class Size
Number of Classes Avg. Class Size
Number of Classes
1-20 21-32 33+ 1-20 21-32 33+ 1-20 21-32 33+
K
29 4 30 8 30 0 3 0
1
21 1 2 24 9 26 1 3 0
2
25 4 27 6 25 1 3 0
3
28 2 28 8 27 0 4 0
4
25 1 3 26 2 6 33 0 1 2
5
26 1 3 28 2 6 31 0 3 0
6
29 2 3 25 2 8 27 0 4 0
Other
32 1 14 3 0 0 Number of classes indicates how many classes fall into each size category (a range of total students per class).
Academic Counselors and Other Support Staff (School Year 2015-16)
Title Number of FTE
Assigned to School Average Number of Students per
Academic Counselor
Academic Counselor-------
Counselor (Social/Behavioral or Career Development) N/A
Library Media Teacher (Librarian) N/A
Library Media Services Staff (Paraprofessional) .5 N/A
Psychologist------- 1 N/A
Social Worker------- N/A
Nurse------- 1 N/A
Speech/Language/Hearing Specialist 1 N/A
Resource Specialist------- N/A
Other------- N/A Note: Cells with N/A values do not require data. *One Full Time Equivalent (FTE) equals one staff member working full time; one FTE could also represent two staff members who each work 50 percent of full time.

2015-16 School Accountability Report Card for Manzanita Elementary School Page 11 of 12
Expenditures per Pupil and School Site Teacher Salaries (Fiscal Year 2014-15)
Level
Expenditures Per Pupil Average Teacher Salary Total
Supplemental/ Restricted
Basic/ Unrestricted
School Site------- $331.32 $235.19 $96.13 $60,320.27
District------- N/A N/A $85.08 $71,737
Percent Difference: School Site and District N/A N/A 13.0 -10.5
State------- N/A N/A $5,677 $75,137
Percent Difference: School Site and State N/A N/A -98.2 -17.4 Note: Cells with N/A values do not require data.
Types of Services Funded (Fiscal Year 2015-16)
A wide variety of student services are funded at Manzanita. Funded student services include the following: Title I: A school-wide program to improve student achievement in reading and math. GATE: Gifted and Talented Education for students identified as gifted. ELD: English Language Development for students identified as English Language Learners. Resource: Instructional program for students who have been identified as learning disabled. Adaptive PE: Modified Physical Education Program based on the individual physical needs of qualifying students. Speech: Instructional program for speech and language development based on the individual needs of qualifying students. SDC: Special Day Class. Special Education Services are delivered in a self-contained classroom for the majority of the school day. Individual students are mainstreamed to regular education programs as appropriate and specified in an Individual Education Plan (IEP) Intervention and Enrichment: Manzanita offers Extended Learning Opportunities (ELO) to all students who are at risk of not meeting District standards for promotion to a next grade level. These opportunities are offered after school on Monday, Tuesdays, Thursdays and Fridays. Opportunities to extend the curriculum are provided for students not at risk (at risk students may also participate in addition to participating in the aforementioned programs). Technology - Hardware ( student iPads, laptop computers, laptop carts and supplies) Software ( Imagine Learning, Footsteps to Brilliance and Big Brainz) Teacher and Administrative Salaries (Fiscal Year 2014-15)
Category District Amount State Average for Districts In Same Category
Beginning Teacher Salary $37,935 $44,573
Mid-Range Teacher Salary $69,045 $72,868
Highest Teacher Salary $82,275 $92,972
Average Principal Salary (Elementary) $110,473 $116,229
Average Principal Salary (Middle) $108,565 $119,596
Average Principal Salary (High) $121,883
Superintendent Salary $200,850 $201,784
Percent of Budget for Teacher Salaries 34% 39%
Percent of Budget for Administrative Salaries 5% 5% For detailed information on salaries, see the CDE Certificated Salaries & Benefits Web page at http://www.cde.ca.gov/ds/fd/cs/.

2015-16 School Accountability Report Card for Manzanita Elementary School Page 12 of 12
Professional Development (Most Recent Three Years)
Teachers meet in their grade level PLC (Professional Learning Community) , Leadership Team and RTI ( Response to Intervention) teams . Teachers meet frequently within and across grade levels in lesson studies, on and off site professional development opportunities and grade specific institutes to plan and discuss what they are doing and how to coordinate instruction. A teacher survey is taken at the end of the school year that guides site professional development and in-service selection decisions. Student data is also used to determine professional development offerings. Sites design specific professional development based on academic content standards, the California Standards for the Teaching Profession, and research-based practices. Educational Services, Special Education, English Learners, Student Assessment and Accountability, and Teacher Support departments participate in the planning and implementation of District staff development activities. Courses are offered throughout the year on week nights and Saturdays. Training is also offered during the summer months on content specific and professional areas such as the implementation of Common Core State Standards, Teacher Leaders, English Language Arts, mathematics workshops, unpacking standards, effective teaching strategies, and intervention programs. Administration training focuses on the development of professional learning communities (PLCs) Conference and convention attendance( AVID,CABE and ATDLE etc), in-service meetings and staff collaboration offers additional opportunities for professional growth. Teachers observe other professionals, engage in peer coaching and work with mentors and grade level or departmental colleagues