manuscript submitted to plant physiology (research … · abstract: in leaves, the transpirational...
TRANSCRIPT

1
Manuscript submitted to Plant Physiology (Research Article)
Running Head: Liquid and vapor transport in transpiring leaves
Corresponding author:
Fulton E. Rockwell
Cornell University
School of Chem. and Biomol. Eng.
120 Olin Hall, Ithaca, NY 14853-5201.
Phone: 914 456 1917
Email: [email protected]
Research Area: Ecophysiology and Sustainability
Plant Physiology Preview. Published on February 26, 2014, as DOI:10.1104/pp.114.236323
Copyright 2014 by the American Society of Plant Biologists
www.plantphysiol.orgon August 25, 2018 - Published by Downloaded from Copyright © 2014 American Society of Plant Biologists. All rights reserved.

2
Title: The competition between liquid and vapor transport in transpiring leaves1
Authors:
Fulton Ewing Rockwell*, N. Michele Holbrook, Abraham Duncan Stroock.
Addresses:
School of Chemical and Biomolecular Engineering, Cornell University, Ithaca, NY
14853, USA (F.E.R., A.D.S.); Department of Organismic and Evolutionary Biology,
Harvard University, Cambridge, MA 02138, USA (N.M.H.).
Summary (300 char):
The competition between internal liquid and vapor transport in transpiring leaves is
sensitive to environmental forcings, such that the sites of evaporation in leaves vary with
both leaf structure and external conditions.
www.plantphysiol.orgon August 25, 2018 - Published by Downloaded from Copyright © 2014 American Society of Plant Biologists. All rights reserved.

3
1 This work was supported by the National Science Foundation (award no. DBI
1103664)(F.E.R.), and the Air Force Office of Sponsored Research (award no. FA9550-
09-1-0188) (A.D.S. and N.M.H.).
* Corresponding author; email [email protected].
www.plantphysiol.orgon August 25, 2018 - Published by Downloaded from Copyright © 2014 American Society of Plant Biologists. All rights reserved.

4
Abstract:
In leaves, the transpirational flux of water exits the veins as liquid, and travels toward the
stomata in both the vapor and liquid phases before exiting the leaf as vapor. Yet whether
most of the evaporation occurs from the vascular bundles (‘perivascular’), from the
photosynthetic mesophyll cells, or within the vicinity of the stomatal pore
(‘peristomatal’), remains in dispute. Here a 1D model of the competition between liquid
and vapor transport is developed from the perspective of non-isothermal coupled heat and
water molecule transport in a composite media of airspace and cells. An analytical
solution to the model is found in terms of the energy and transpirational fluxes from the
leaf surfaces and the absorbed solar energy load, leading to mathematical expressions for
the proportions of evaporation accounted for by the vascular, mesophyll, and epidermal
regions. The distribution of evaporation in a given leaf is predicted to be variable,
changing with the local environment, and to range from dominantly perivascular to
dominantly peristomatal depending on internal leaf architecture, with mesophyll
evaporation a subordinate component. Using mature Quercus rubra L. (red oak) trees, we
show that the model can be solved for a specific instance of a transpiring leaf by
combining gas exchange data, anatomical measurements, and hydraulic experiments. We
also investigate the effect of radiation load on the control of transpiration, the potential
for condensation on the inside of an epidermis, and the impact of vapor transport on the
hydraulic efficiency of leaf tissue outside the xylem.
www.plantphysiol.orgon August 25, 2018 - Published by Downloaded from Copyright © 2014 American Society of Plant Biologists. All rights reserved.

5
INTRODUCTION
During steady state transpiration, the evaporative flux from the cell surfaces lining a
leaf’s intercellular airspaces balances the flux of water vapor exiting the stomatal pores.
The question of how the phase change from liquid to vapor is distributed within a leaf
pertains to many aspects of leaf function, including isotopic enrichment of leaf water
(Farquhar et al., 1993; Gillon and Yakir, 2000; Cernusak amd Kahmen, 2013), the
hydromechanics of stomatal control (Buckley, 2005; Franks and Farquhar, 2007; Peak
and Mott, 2011), and hydraulic constraints on maximum transpiration rates (Brodribb et
al. 2007; Boyce et al., 2009; Sack et al., 2010). Experimental work with apoplastic tracers
(Tanton and Crowdy, 1972; Byott and Sherriff, 1976), physical analogues (Meidner,
1976), and mathematical modeling (Tyree and Yianoulis, 1980; Yianoulis and Tyree,
1984) has challenged the idea that evaporation occurred more or less uniformly from the
mesophyll, converging on the view that evaporation will be heavily skewed toward the
internal wetted surfaces closest to the stomata (hereafter, ‘peristomatal evaporation,’
(Buckley and Mott, 2013)). However, interpretation of tracer accumulation as indicative
of a local evaporative flux has been questioned (Yianoulis and Tyree, 1984), and
calculation of the expected pressure drop for flow across the bundle sheath cells alone
suggests a short liquid flow path, with evaporation from the vascular bundle directly to
the air space (hereafter, ‘perivascular evaporation,’ (Boyer 1985).
At the same time, a variety of experimental approaches for characterizing the
hydraulic efficiency with which leaves replace the water lost to transpiration have been
developed, of which evaporative flux measurements (EFM) of transpiring leaves are
considered to be the most naturalistic (Sack et al., 2004). The location and water potential
of the sites of evaporation in a leaf are unknown in EFM. Instead, a whole leaf hydraulic
conductance (Kleaf) is defined as the transpirational flux divided by the difference
between the water potential of a source at the petiole (e.g., the main stem, or a reservoir
in the lab) and leaf water potential, as typically estimated from a pressure chamber
measurement (xylem sap osmolality is assumed to be negligible) (Sack et al, 2004). As a
result, Kleaf is not physically well-defined, and bears an ambiguous relationship to the real
hydraulic properties of leaf xylem and tissues (Rockwell 2014b). Hydraulic studies that
have sought to correlate Kleaf with internal leaf structure have further assumed
www.plantphysiol.orgon August 25, 2018 - Published by Downloaded from Copyright © 2014 American Society of Plant Biologists. All rights reserved.

6
peristomatal evaporation, and neglected the possibility that the phase change for some
portion of the flux occurs deeper inside the leaf (Brodribb et al., 2007; Sack et al., 2010;
Buckley et al., 2011).
Recently however, the possibility that internal vapor transport dominates liquid
phase transport from the vascular bundles to a transpiring epidermis has received
renewed attention, particularly in relation to stomatal behavior (Peak and Mott, 2011;
Pieruschka et al., 2010). As saturated vapor pressure has a strong temperature
dependence, modeling internal vapor transport requires an accounting of internal energy
fluxes. In energy terms, the competition between liquid and vapor transport within a leaf
can be viewed as a competition between thermal conduction and latent heat transport, as
for peristomatal evaporation to occur both liquid water and thermal energy must be
conducted to the transpiring epidermis. Taking a modified leaf energy balance approach,
Pieruschka et al. (2010) interpreted observed stomatal opening in response to increased
radiation load as evidence that latent heat transport serves as the dominant mode of
energy transport from the mesophyll to the epidermis. In this model, internal vapor
transport typically exceeds transpiration, with water condensing on the epidermis
(peristomatal condensation) and flowing back toward the sites of short wave energy
absorption and evaporation in the mesophyll. Increasing the energy load is thought to
increase condensation on the epidermis, allowing stomata to open hydropassively.
Here we provide a model of the competition between internal liquid and vapor
transport that treats the leaf mesophyll as a homogenous composite effective media of air
and cells (Rockwell et al. 2013a), and the epidermis (including stomata) as a boundary
characterized by a temperature, water potential, and conductance to water vapor (Figure
1). As in Pieruschka et al. (2010), we do not attempt to model stomatal mechanics,
though we will assume at some points in the analysis of steady-state transpiration a
phenomenological linkage between epidermal water potential and stomatal conductance.
The most important difference between our approach and prior work is that our model
allows the competition between the vapor and liquid phase transport of water, and the
associated competition between latent and sensible transport of heat energy, to emerge
from general conservation laws and the constraint of local thermal and chemical
equilibrium between phases in mesophyll air spaces. By contrast, Pieruschka et al. (2011)
www.plantphysiol.orgon August 25, 2018 - Published by Downloaded from Copyright © 2014 American Society of Plant Biologists. All rights reserved.

7
fix the balance of internal heat transport between latent transfer and heat conduction in air
based on a result for steady evaporation into saturated air (‘equilibrium evaporation’).
This result says that the proportion of an absorbed solar short wave energy load
dissipated as latent heat transport assumes a characteristic value that depends only on the
temperature sensitivity of saturated vapor pressure, the latent heat of vaporization, and
the heat capacity of air (Raupach, 2001). Another way of expressing this result is to say
that, in the absence of lateral convection (i.e., wind), the Bowen ratio (sensible heat flux/
latent heat flux) for an evaporating surface assumes a value that depends only on the
physical properties of water and air, and not on the properties of the evaporating body
itself (Bowen, 1926; Raupach, 2001; Lambers et al., 1998). It is important to note that
this ‘equilibrium evaporation’ result applies to a 1D system of transport from water to air
in series, rather than in parallel as in the cells and airspaces of leaf mesophyll tissue.
As noted by Pieruschka et al. (2010), assuming the ‘equilibrium evaporation’
result to describe energy fluxes inside a leaf affords an enormous simplification of the
physical detail that must be represented in their model, yet it comes at the cost of
neglecting the possibility of heat conduction in the liquid phase. As liquid phase thermal
conductivity may be expected to be an order of magnitude larger than that of the gas
phase (Tyree & Yianoulis 1980), and as there exists continuous cell-to-cell contact
through the leaf thickness in parallel with the intercellular airspaces, the actual balance of
latent and sensible heat within a leaf may be quite different from the ‘equilibrium
evaporation’ case. Our goal then is to understand how the balance of vapor and liquid
transport, as well as latent and sensible heat transport, depends on leaf and physical
properties after relaxing the assumption that the liquid and vapor phases are arrayed in
series. To do so, we account for liquid phase thermal conduction in the context of the
simplest possible transport model that remains consistent with the principles of non-
isothermal transport phenomena (Bird et al. 1960, Deen 1998).
In a general way, our approach has been anticipated by effective media
formulations of liquid and vapor transport in unsaturated soils, most clearly in terms of
the assumption of local equilibrium between wet surfaces and the vapor in the gas-filled
pores, as well as the decomposition of the mole fraction gradients driving vapor transport
into gradients in temperature and water status (Philip & De Vries 1957, De Vries 1987,
www.plantphysiol.orgon August 25, 2018 - Published by Downloaded from Copyright © 2014 American Society of Plant Biologists. All rights reserved.

8
Whitaker 1977). Our own analysis adds elements important for leaves: a volumetric
energy ‘source’ representing short wave solar energy absorbed in the cells, liquid (cell)
and air fractions continuously connected through the leaf thickness, a source of water at
the vascular plane (Rockwell et al., 2014a,b), and bounding epidermal surfaces either
with stomata or without. With this approach, the combination of local equilibrium
between phases and energy and mass conservation for a composite media leads to a
linkage between water potential and temperature gradients. This linkage allows us to
separate the coupled equations describing heat and molecular fluxes and find analytic
solutions for the temperature and water potential fields inside a leaf. We then analyze
these solutions to describe the effects of leaf structural properties and surface fluxes on
the distribution of evaporation between perivascular, peristomatal, and mesophyll
compartments. However, the lack of a general model for the dependence of stomatal
aperture on the local temperature and water potential (as well as chemical signaling)
prevents us from arriving at a completely general model with which to study
environmental effects. Instead we are restricted to exploring a few cases where the
stomatal conductance realized for a particular set of environmental conditions is known.
In the course of these analyses, we re-analyze the control of transpiration by radiation
(Pieruschka et al., 2010). In exploring environmentally driven shifts in the distribution of
evaporation within a particular leaf, we also clarify the relationship between Kleaf and the
actual hydraulic conductivity of leaf tissue, and show that this relationship is sensitive to
the energy regime experienced by a leaf. Finally, we consider the possible functional
significance of the distribution of evaporation in a leaf in terms of its impact on hydraulic
efficiency, the response of transpiration to environmental forcings, stomatal control, and
minimum leaf water potentials.
RESULTS
I. Analytical results
We start by providing an overview of some of the important physical ideas in our model:
local thermal and chemical equilibrium in leaf air spaces, water vapor mole fraction as a
function of both water potential and temperature, and the decomposition of the vapor
mole fraction gradient driving diffusion of vapor into its corresponding water potential
and temperature gradients. The derivation of the model follows in Supplemental Text S1,
www.plantphysiol.orgon August 25, 2018 - Published by Downloaded from Copyright © 2014 American Society of Plant Biologists. All rights reserved.

9
with additional detail given in Supplemental Text S2. We then analyze the model results
for the distribution of evaporation between perivascular, peristomatal, and mesophyll
fractions in a general way, before turning to solutions for the internal transport behavior
of particular transpiring leaves for which the environmental conditions and stomatal
conductances could be adequately constrained.
Local equilibrium in an unsaturated porous composite of cells and air
We consider a representative volume of leaf tissue through the thickness composed of
two domains, one upper (adaxial, or ‘ad’) and one lower (abaxial, or ‘ab’), each
extending from the plane of the vasculature to an epidermis (Figure 1), and characterized
by separate area fractions for the gas phase (‘vapor fraction’) and cells (‘liquid
fraction’). Within this volume of leaf tissue, we adopt the standard boundary condition of
thermal and chemical equilibrium between liquid and vapor at an interface, i.e., where the
cell walls contact the intercellular air space (Deen 1998). In the palisade mesophyll, the
expectation that air space diameters are small relative to the leaf thickness motivates the
approximation that lateral gradients are negligible, limiting the analysis to the z
dimension. In the spongy mesophyll, air spaces can be considerably larger, yet as long as
local evaporation within the spongy mesophyll is small relative to total flux in the leaf,
the extra ‘resistance’ associated with lateral gradients will again be negligible. With the
above conditions we extend the interfacial boundary condition (i.e., local equilibrium
between phases) across all x,y planes, such that the temperature T and chemical potential
of water μ describe the state of both phases and are functions of z only through the entire
leaf thickness. Thus our composite media is composed of cells and air space in parallel,
in local equilibrium at each point through the thickness (Figure 1).
To complete the 1D model, we treat the vascular plane as a uniform (continuous,
homogenous) source of water (Boyer, 1969), and the epidermal surfaces as either
impermeable, or characterized by a uniform stomatal conductance. Finally, we follow the
convention in plant water relations and divide liquid phase chemical potential by the
molar volume of liquid water v to define water potential, .
The dependence of water vapor mole fraction on temperature and water potential
The depression of saturated water vapor pressure above a salt solution or a curved
meniscus are familiar phenomena in plant physiology. From a thermodynamic
www.plantphysiol.orgon August 25, 2018 - Published by Downloaded from Copyright © 2014 American Society of Plant Biologists. All rights reserved.

10
perspective, salts reduce the chemical potential of the liquid phase by lowering the
activity of the water, while a curved meniscus acts on the pressure term of the chemical
potential. A general expression that integrates all such effects can be written in terms of
chemical potential, or more conveniently, water potential, as
(1)
where is the vapor pressure, pv
(T ) is the vapor pressure above pure water at
atmospheric pressure with a flat interface, v is the molar volume of water, R is the ideal
gas constant and T is the temperature (kelvin) (Pickard, 1981; Nobel, 2005). For gas
exchange measurements, the difference between pv
(T , Patm
) and is typically
trivial relative to the difference in vapor pressure between the leaf and the unsaturated
surrounding air. For studying vapor transport inside the leaf, we will see that we must
maintain the distinction.
Vapor pressure as a function of kelvin temperature T can be represented by the
Clausius-Clapeyron equation (Kittel and Kroemer, 1980; Whitaker 1977),
(2)
where is the latent heat of vaporization evaluated at the reference temperature To
, and
pv ,o(To ) is the reference vapor pressure when the liquid phase is at atmospheric pressure
(e.g., as tabulated in Nobel, 2005). Combining (1) and (2) yields an expression for vapor
presure as a function of temperature and water potential. As the appropriate driving force
for non-isothermal vapor diffusion is the mole fraction of water vapor, (Bird
et al., 1960), we divide by atmospheric pressure Patm
to arrive at an expression for the
mole fraction of water vapor in local equilibrium with a liquid phase at temperature T
and water potential ,
(3)
Description of the fluxes of heat and molecules
www.plantphysiol.orgon August 25, 2018 - Published by Downloaded from Copyright © 2014 American Society of Plant Biologists. All rights reserved.
11
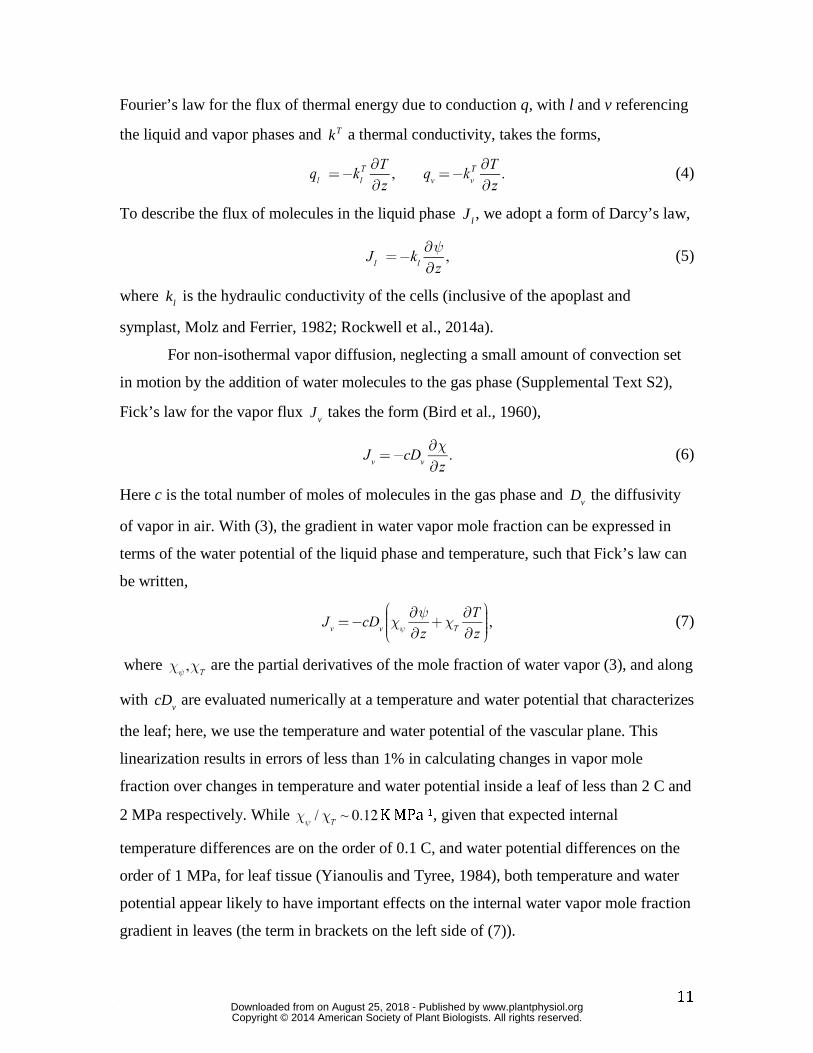
Fourier’s law for the flux of thermal energy due to conduction q, with l and v referencing
the liquid and vapor phases and a thermal conductivity, takes the forms,
(4)
To describe the flux of molecules in the liquid phase Jl
, we adopt a form of Darcy’s law,
(5)
where is the hydraulic conductivity of the cells (inclusive of the apoplast and
symplast, Molz and Ferrier, 1982; Rockwell et al., 2014a).
For non-isothermal vapor diffusion, neglecting a small amount of convection set
in motion by the addition of water molecules to the gas phase (Supplemental Text S2),
Fick’s law for the vapor flux Jv
takes the form (Bird et al., 1960),
(6)
Here c is the total number of moles of molecules in the gas phase and Dv
the diffusivity
of vapor in air. With (3), the gradient in water vapor mole fraction can be expressed in
terms of the water potential of the liquid phase and temperature, such that Fick’s law can
be written,
(7)
where are the partial derivatives of the mole fraction of water vapor (3), and along
with cD
v are evaluated numerically at a temperature and water potential that characterizes
the leaf; here, we use the temperature and water potential of the vascular plane. This
linearization results in errors of less than 1% in calculating changes in vapor mole
fraction over changes in temperature and water potential inside a leaf of less than 2 C and
2 MPa respectively. While K MPa-1, given that expected internal
temperature differences are on the order of 0.1 C, and water potential differences on the
order of 1 MPa, for leaf tissue (Yianoulis and Tyree, 1984), both temperature and water
potential appear likely to have important effects on the internal water vapor mole fraction
gradient in leaves (the term in brackets on the left side of (7)).
kT
kl
www.plantphysiol.orgon August 25, 2018 - Published by Downloaded from Copyright © 2014 American Society of Plant Biologists. All rights reserved.

12
Analysis of the competition of heat conduction and latent transport in leaf tissue
Combining conservation of thermal energy and water molecules in two phases (gas and
liquid) for leaf tissue subject to a volumetric load of absorbed solar short wave radiation
, the description of the fluxes (4), (5), (7), and local equilibrium between the liquid and
gas phases (3), leads directly to governing equations for the water potential and
temperature profiles (S1.5, S1.7). The water potential profile is governed by a steady
diffusion equation with a source (Crank, 1957),
(8)
where is a dimensionless parameter we call the Thermal Dissipation Modulus
(TDM). In words, (8) says:
(9)
The TDM describes the tendency of internal leaf tissue toward dissipating a thermal load
by internal latent heat transport (dominant when is close to one), versus internal
heat conduction (dominant when is large). In its definition, the TDM integrates all of
the effects of the thermal, hydraulic, and diffusive properties of the tissue on the local
evaporative process into a single parameter,
(10)
The two ratios that appear in describe total thermal conductivity over particular
components of latent heat transport, and the TDM is thus analogous to the Bowen ratio.
The first ratio,
(11)
compares thermal conductivity to latent heat transport due to temperature-dependent
gradients in vapor mole fraction. The second ratio in ,
(12)
www.plantphysiol.orgon August 25, 2018 - Published by Downloaded from Copyright © 2014 American Society of Plant Biologists. All rights reserved.

13
compares the relative magnitudes of the heat moved by conduction versus the
evaporation of a liquid flux, as driven by the temperature and water potential differences
that result in equal changes in vapor mole fraction, .
As the temperature and water potential profiles are linked by both the process of
evaporation and their effects on vapor mole fraction gradients in (7), the governing
equation for temperature follows the same form as for water potential (8),
(13)
where again the behavior depends on a second dimensionless parameter . This
equation says that a local energy load will be dissipated by thermal conduction when
approaches one: however, there is no new information in this parameter as it can be
shown , and we restrict our analysis here to .
The composition of the TDM (10) as two independent ratios, each
representing a competition between thermal conduction and an aspect of latent transport,
is such that that thermal conduction need only ‘win’ one to serve as the dominant sink for
absorbed radiation. Physically, this structure arises from the fact that within a
representative volume being loaded with energy, thermal conduction and latent transport
are parallel processes, but local evaporation depends on properties of the liquid phase
(cell fraction, hydraulic conductivity) and vapor phase (air fraction, diffusivity) that, with
respect to a change of phase from liquid to vapor, are arrayed in series. Thus, the
transport properties of either phase can independently create a bottle neck reducing the
competitiveness of local vapor production (and so latent heat transport) as a sink for the
absorbed energy load.
With respect to the value of the TDM expected for leaves, if the thermal
conductivity of the cells is assumed to be in general close to that of water (Tyree and
Yianoulis, 1980) with low variability between plants, then this first ratio (11) will vary
between the palisade and spongy tissues, as well as between leaves, mostly as a function
of the liquid and air fractions , as the other parameters are all material properties.
On the other hand, the ratio in (12) is only weakly affected by area fractions, with the
hydraulic conductivity of the cells kl
likely the most important source of variation
www.plantphysiol.orgon August 25, 2018 - Published by Downloaded from Copyright © 2014 American Society of Plant Biologists. All rights reserved.

14
between (and possibly within) leaves. Given that pressure probe data suggests leaf cell
membrane permeability spans two orders of magnitude, the potential exists for this term
to range from near zero to more than 10 (Kramer and Boyer, 1995; Rockwell et al.,
2014a). Thus, a domain of leaf tissue might have very large air fractions, favoring latent
heat transport in the first ratio, but, if the hydraulic conductivity of the cells is at the low-
end of expected values it could limit vapor production to the extent that heat conduction
emerges as the dominant local mode for the dissipation of absorbed radiation.
Analytical results for the distribution of evaporation
Evaluating the TDM provides important information regarding the characteristic behavior
of a representative volume of mesophyll, yet it cannot tell us the overall distribution of
evaporation within a whole leaf: the environmental conditions and fluxes at the leaf
surfaces are also important. Solving the govering equations (8) and (13) with the
appropriate transpiring or non-transpiring boundary conditions at the epidermal surfaces
(S1.15, S1.16, S1.21, S1.22), leads to general solutions for (S1.17, S1.18,
S1.23, S1.24). These solutions can then be anayzed to find expressions for the proportion
of transpiration that originates in a mesophyll, perivascular, or peristomatal region, as
functions of the tissue properties and surface fluxes. We define peristomatal evaporation
as the liquid flux ( , a positive quantity) arriving at a transpiring epidermis
(z=L), where it consumes energy to change phase and contribute to the transpirational
flux E. As a proportion of transpiration from an epidermal surface, the peristomatal
fraction is found by evaluating, with parameter values specific to the particular domain,
Peristomatal fraction: (14)
Here qc
is heat conduction to the surrounding air, and qr
is net long wave radiation to the
environment. Peristomatal evaporation has two contributions, again both analogous to
Bowen ratios. The first contribution relates to the external environment,
(15)
and represents the Bowen ratio of the surface fluxes, scaled by the TDM in the
denominator, such that when internal thermal conduction is dominant, the effects of
www.plantphysiol.orgon August 25, 2018 - Published by Downloaded from Copyright © 2014 American Society of Plant Biologists. All rights reserved.

15
energy exchange with the environment are muted. The second contribution to the
peristomatal fraction (in brackets) is composed of two ratios involving material
properties. The inverse of the first ratio was discussed above in (11), describing the
competition between temperature driven latent heat transport and thermal conduction.
The second ratio,
(16)
describes the isothermal competition between liquid and vapor. Thus, the bracketed
‘material property ratios’ capture the fact that for peristomatal evaporation to occur, both
thermal energy and water must flow to a transpiring surface. Notably, both ratios are
sensitive to the amount of air space, making the air fraction a critical parameter for the
peristomatal fraction.
It will be noted that for leaves much warmer than the surroundings, and/or when
transpiration is suppressed by high humidity or stomatal closure, the entire peristomatal
fraction (14) can evaluate as negative. Physically this describes condensation on the inner
epidermal surface, and flow back toward evaporating sites in the mesophyll (i.e., the
internal vapor flux exceeds transpiration). A test for the existence of such a condensing
flux can then be derived from (14) as,
(17)
This emphasizes that condensation occurs whenever the sensible heat transport is more
important externally than internally, as this requires that some of the internally
transported latent heat become available by condensation to balance the external sensible
flux.
It will also be noted that the peristomatal fraction can evaluate to more than one.
For transpiring leaves cooler than the surrounding air (as may occur in the shade, or
subcanopy), the sensible heat flux is negative (i.e., to the leaf) and (15) adds to the
peristomatal fraction. A fraction greater than one corresponds physically to an
evaporative flux from the inner face of the epidermis to the mesophyll. Within the
mesophyll, evaporation is energy limited, and evaporation is favored near the surfaces
where sensible heat from the surrounding air is warming the leaf.
www.plantphysiol.orgon August 25, 2018 - Published by Downloaded from Copyright © 2014 American Society of Plant Biologists. All rights reserved.
16
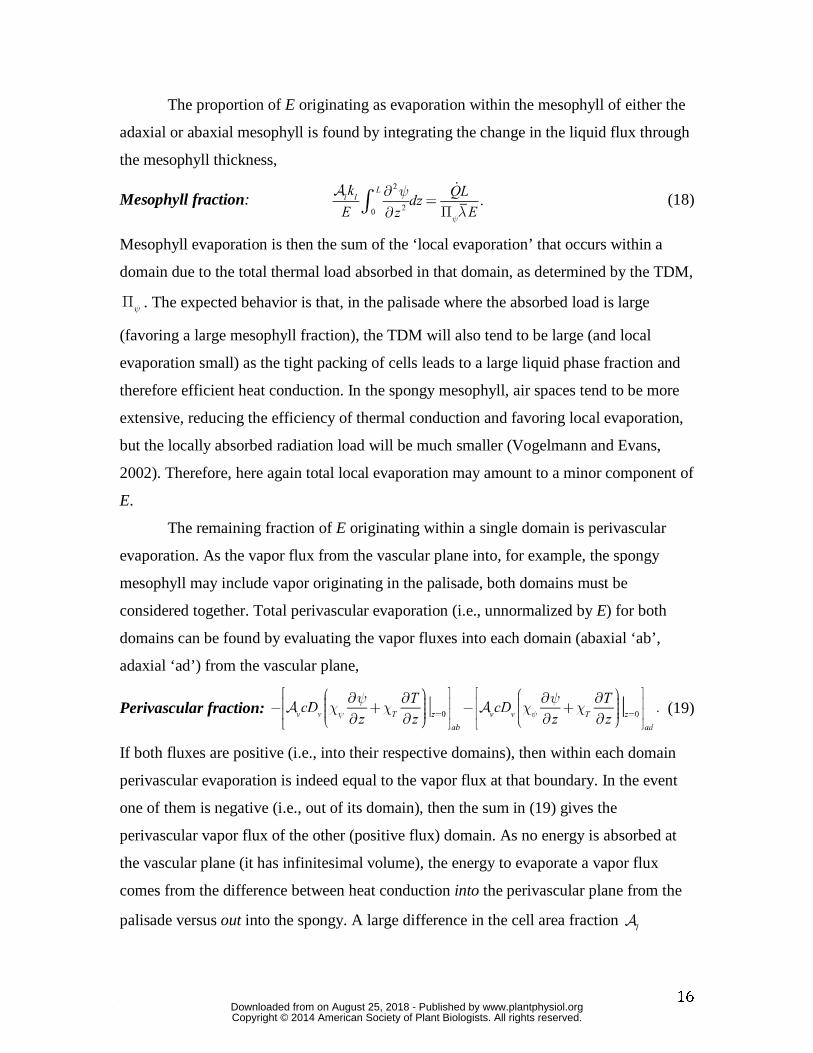
The proportion of E originating as evaporation within the mesophyll of either the
adaxial or abaxial mesophyll is found by integrating the change in the liquid flux through
the mesophyll thickness,
Mesophyll fraction: (18)
Mesophyll evaporation is then the sum of the ‘local evaporation’ that occurs within a
domain due to the total thermal load absorbed in that domain, as determined by the TDM,
. The expected behavior is that, in the palisade where the absorbed load is large
(favoring a large mesophyll fraction), the TDM will also tend to be large (and local
evaporation small) as the tight packing of cells leads to a large liquid phase fraction and
therefore efficient heat conduction. In the spongy mesophyll, air spaces tend to be more
extensive, reducing the efficiency of thermal conduction and favoring local evaporation,
but the locally absorbed radiation load will be much smaller (Vogelmann and Evans,
2002). Therefore, here again total local evaporation may amount to a minor component of
E.
The remaining fraction of E originating within a single domain is perivascular
evaporation. As the vapor flux from the vascular plane into, for example, the spongy
mesophyll may include vapor originating in the palisade, both domains must be
considered together. Total perivascular evaporation (i.e., unnormalized by E) for both
domains can be found by evaluating the vapor fluxes into each domain (abaxial ‘ab’,
adaxial ‘ad’) from the vascular plane,
Perivascular fraction: (19)
If both fluxes are positive (i.e., into their respective domains), then within each domain
perivascular evaporation is indeed equal to the vapor flux at that boundary. In the event
one of them is negative (i.e., out of its domain), then the sum in (19) gives the
perivascular vapor flux of the other (positive flux) domain. As no energy is absorbed at
the vascular plane (it has infinitesimal volume), the energy to evaporate a vapor flux
comes from the difference between heat conduction into the perivascular plane from the
palisade versus out into the spongy. A large difference in the cell area fraction
www.plantphysiol.orgon August 25, 2018 - Published by Downloaded from Copyright © 2014 American Society of Plant Biologists. All rights reserved.

17
between palisade and spongy creates a drop in total thermal conductivity across the
perivascular plane, which then helps push energy from conduction into perivascular
evaporation at the palisade-spongy boundary.
II. Numerical results
The above analysis has examined the factors influencing the distribution of evaporation
in leaves in a general way. In the following, we next consider specific instances – red
oak, sunflower – based on experimental data, as well as additional model simulations to
explore particular phenomena.
Distribution of evaporation in a transpiring red oak leaf
Solution for a “within-cuvette” energy balance
We first consider transpiring red oak leaves, for which all the surface fluxes as
well as stomatal conductance are known. Using gas exchange measurements (LI-6400,
LICOR) of five upper canopy transpiring oak leaves under sunny summer conditions
(Table 3), with additional hydraulic and anatomical measurements on adjacent leaves, we
solved the temperature and water potential profiles through the leaf thickness, both for
surface energy balances within the gas-exchange cuvette, as well as for surface energy
balances for epidermal surfaces exposed to the environment. The latter solutions for the
internal and external fluxes of heat and water are in Figure 2 : as we considered the
‘exposed leaf’ closer to the state of an oak leaf in nature, we chose to present those data
in the figure, rather than the within-cuvette results. After measurement of gas exchange,
the five leaves were then collected to determine the average water potential of each leaf
imposed by transpiration, (e.g., ‘transpiring potential’). This water potential provided
an independent check for the ‘within-cuvette’ solution, as well as a required constraint for
the ‘exposed leaf’ solution, made necessary as leaf absorptance and environmental
reflectance were not measured directly.
The ‘within-cuvette’ distribution of evaporation yielded a dominant peristomatal
fraction (74.5%), with most of the balance perivascular (21.3%), with only minor
contributions from evaporation in the mesophyll tissues (1.5% and 2.7%). The water
potential drop from the branch (-1.29 MPa, as measured by covered leaves) to the
vascular plane (-1.69) was estimated at 0.4 MPa, with the upper domain sitting close to
vascular plane water potential. A steep drop to the transpiring surface ( at -2.51 MPa), put
www.plantphysiol.orgon August 25, 2018 - Published by Downloaded from Copyright © 2014 American Society of Plant Biologists. All rights reserved.

18
the lower epidermis close to the whole-leaf turgor loss point, as estimated from pressure
volume curves measured previously for these trees (Rockwell et al. 2011).
Based on a simple 1D volume weighted average water potential (22), the
predicted average water potential for these leaves was -1.81 MPa, while the value
predicted by an equation accounting for the effect of the 3D geometry of the vein-tissue
interface on water potential gradients (23) was -1.72 MPa. This latter value was within
measurement error (+/- 0.034 MPa, Rockwell (2010)) of the actual average water
potential measured with the pressure chamber of -1.73 MPa (n=5, +/- 0.14 sd); we
regard this agreement as partial validation of the model. As a point of reference, the
apparent ‘Kleaf’, or transpiration divided by the difference between covered ( ) and
transpiring leaf water potentials ( , was 13.3 mmol m-2 MPa-1 s-1,
within the range of values reported by Sack (2002).
Solution for an “exposed leaf” energy balance
The solution of the model for an exposed leaf (i.e., with an environmental rather
than ‘within cuvette’ energy balance) yielded nearly identical results for the distribution
of evaporation (Figure 2). With the average leaf water potential as a constraint, the
solution implies values of absorptance and reflectance r=0.15, at the low end of
the expected range (Nobel 2005), but reasonable considering leaf angles were assumed to
be ideal.
With no vapor flux leaving the upper epidermis, we find that the palisade remains
close to the water potential of the transpiration stream where it exits the veins, whereas
there is large water potential drop from the vascular plane to the stomata in the lower
epidermis (Figure 2A). The spongy mesophyll therefore represents the dominant
hydraulic resistance to the transpirational flux. As the palisade has a larger volume and is
denser in cells than the spongy mesophyll, we further found that the average water
potential of the whole leaf remains close to the water potential at the vascular plane, -1.68
MPa. As a result, Kleaf reports the effective vascular conductance from the petiole to the
vascular plane, , rather than the extra-vascular tissue hydraulic resistance dominant in
transpiration. This scaling of Kleaf with vascular, rather than mesophyll, hydraulic
conductance is likely to be the general case for hypostomatous leaves.
www.plantphysiol.orgon August 25, 2018 - Published by Downloaded from Copyright © 2014 American Society of Plant Biologists. All rights reserved.

19
Leaf temperature peaked in the palisade (Figure 2B), with a small drop toward the
upper non-transpiring epidermis. In accordance with this temperature drop toward the
upper surface, the model predicts a small flux of vapor that condenses at the non-
transpiring epidermal surface (Figure 2C, D), and flows back toward the palisade as
liquid (Figure 2A, D). This circular flow above the temperature peak is interesting as it
acts as heat pump (Chen et al., 2013), moving energy absorbed in the palisade to the
upper (adaxial) epidermis, though here the effect is small; a molecular flux less than 1%
of transpiration carrying less than 1% of the energy load in the upper domain. With larger
air fractions in the palisade this effect will become more important.
In both domains we found a strong tendency toward heat conduction over local
evaporation and latent transport, as indicated by values of much larger than one (8.9
and 55.2 in the lower and upper domains respectively). The larger value of in the
palisade is driven by the lower air fraction (0.05) versus the spongy domain (0.3), and is
why only 1.5% of the transpirational flux originates in the palisade, where 80% of the
energy load is absorbed. Rather, thermal conduction to the upper epidermis accounted for
about a third of the short wave load absorbed in the palisade (36%), with the largest
fraction being conducted to the vascular plane (62%). At the vascular plane, a large
fraction (17%) of the load absorbed in the upper domain drives evaporation (21% of E),
yet almost half (45%) of the upper domain load is ultimately conducted to the lower
epidermis, where it contributes to a dominant peristomatal fraction of evaporation (74%
of E, Figure 2D).
Thus, in this system, evaporation occurs in the first region in which the
transpiration stream encounters a vapor phase (perivascular), and from the wet surfaces
proximal to the stomata and the undersaturated external air (peristomatal). Two factors
appear to be important for perivascular evaporation. First, as the air fraction is larger in
the spongy than the palisade mesophyll, thermal conduction away from the vascular
plane is less efficient than to it (Figure 2D), and the larger spongy air fraction also makes
latent transport in the vapor phase more competitive. Second, the direction of the water
potential gradient (Figure 2A) promotes vapor diffusion below the vascular plane by (7),
but impedes it above. As these two factors are quite general for hypostomatous leaves,
www.plantphysiol.orgon August 25, 2018 - Published by Downloaded from Copyright © 2014 American Society of Plant Biologists. All rights reserved.

20
perivascular evaporation may be a widespread phenomenon, and the contribution to E of
evaporation from the walls of photosynthetic mesophyll cells a minor component.
The above distribution of evaporation within red oak, though varying to a small
extent with transpiration and the energy fluxes, is expected to be resilient, based on both
perturbations to the full model (Figure S1), and analysis of equation (14) for the
peristomatal fraction. The ‘leaf-structural’ component of the peristomatal fraction (14)
dominates the ‘environmentally sensitive’ term (15), 0.753 versus -0.014; the small value
of the latter term reflects the fact that the latent flux is much greater than the sum of the
conductive and long wave fluxes from the lower epidermis (Figure 2D). We expect that
for similar mesic hypostomatous leaves the pattern of dominant peristomatal evaporation,
with most of the balance perivascular, should be robust over a wide range of conditions.
The control of transpiration by radiation as modeled for a sunflower leaf
We next sought to investigate the control of transpiration by radiation, and model internal
transport in an amphistomatous leaf (both domains transpiring) based on experimental
data for a sunflower leaf in Pieruschka et al. (2010), and sunflower leaf structure
(Dengler 1980). In the cited sunflower leaf experiment, the NIR load on the leaf was
manipulated by use of a cold mirror, such that absorbed short wave radiation could be
increased from 160 W/m-2 to 200 W/m-2 with no change in PPFD (Pieruschka et al. 2010,
their figure 1). Following the increase in NIR, stomatal conductance and transpiration
were both observed to increase by ~10%, a phenomenon described by those authors as
control of transpiration by radiation, and we were interested to see whether our mixed
transport model could reproduce a similar result. As we could not constrain all the model
variables with the available data, some parameters had to be assumed; leaf thicknesses,
tissue thermal and hydraulic conductivities, area fractions, the distribution of absorbed
energy between the two domains, and leaf vascular conductance were chosen within a
plausible range that reproduced the transpiration rate, stomatal conductance, and the leaf-
to-air mole fraction gradient reported by Pieruschka et al. (2010).
We first assumed a simple linear relation between steady-state stomatal
conductance and epidermal water potential for small perturbations around an observed
value (‘hydraulic model’), based on the form of turgor and aperture curves in Franks &
Farquhar (1997); this step was taken to relax the assumption in the model of Pieruschka
www.plantphysiol.orgon August 25, 2018 - Published by Downloaded from Copyright © 2014 American Society of Plant Biologists. All rights reserved.
21
et al (2010) that stomata adjust to conserve a fixed target water potential. With the
parameters in Table 3, the amphistomatal model for the initial state of SR=160 W m-2
predicts a slight dominance of internal vapor transport (56% of total E) over total
peristomatal evaporation (44%), with the dominant fraction (42%) occurring as
perivascular evaporation and diffusion toward the lower epidermis (Figure 3D). As for
oak, we find evaporation in either mesophyll contributes only in a minor way to the
evolution of the transpirational vapor flux (14% in aggregate). Interestingly, the
evaporative flux in the palisade is almost equally split in its contributions to E from the
lower and upper surfaces (4 and 6% of total E respectively), as the water potential
gradient toward the upper epidermis is not strong enough to drive vapor across the
temperature maximum (Figure 3D).
Following an increase in NIR such that SR=200 W m-2 and an adjustment to air
temperature to hold the lower epidermis at near constant temperature (Pieruschka et al.
2010), the hydraulic model (i.e., including a hydraulic stomatal response) predicted about
half the observed response in total stomatal conductance (6% versus approximately 10%),
with all of the increase occurring for the lower epidermis (Figure 3E). This increase in
stomatal conductance was driven by an increase in lower epidermal water potential (from
-0.9 to -0.82 MPa), which in turn occurred due to a decrease in the liquid flux (and the
proportion of peristomatal evaporation) even as transpiration increased (by 4.4%). Liquid
transport decreased in absolute terms because the increase in the internal temperature
gradients that accompanied the higher energy load drove an increase in vapor transport
sufficient to displace part of the initial liquid flux; in terms of the percentage of E, total
peristomatal evaporation decreased (44 to 38% of E), while internal vapor transport
increased (56 to 62% of E).
We did, however, find that with a hydraulic feedback model for stomatal aperture,
the positive effect of the higher energy load on stomatal aperture was dependent on the
0.4 C reduction in air temperature required to conserve lower epidermal temperature,
which otherwise saw a small increase in lower stomatal conductance gs offset by a
decrease in upper gs. However, Pieruschka et al. (2010) state that the observed response
was not entirely dependent on such temperature adjustment. A second series of analyses
of the cold mirror experiment, following Pieruschka et al (2010) in assuming that stomata
www.plantphysiol.orgon August 25, 2018 - Published by Downloaded from Copyright © 2014 American Society of Plant Biologists. All rights reserved.

22
adjust to conserve a fixed target epidermal water potential, confirmed this was possible in
our model as well (Figure S2 A,B).
To understand what influences the magnitude of the stomatal response in a
conserved epidermal water potential model we start with the proposition that an increase
in transpiration can occur in one of two ways: an increase in gs, or an increase in
epidermal temperature and so the leaf-to-air vapor mole fraction difference, . At the
same time, dissipating an increased energy load requires an increase in the internal
temperature gradient from the sites of short wave absorption to the leaf surface, such that
both the flux of internal vapor and thermal conduction increase. To have an increase in
internal vapor transport that is ‘passed through’ to E via an increase in gs therefore
requires that the extra energy conducted to the epidermis be transmitted to the
environment as efficiently as possible, minimizing the increase in surface temperature
and that would compete with gs to explain an observed increase in E.
Formally, considering a single domain subject to a radiative load SR, holding the
epidermal water potential and therefore the liquid flux constant leads to an expression for
the change in total conductance δgT (inclusive of stomatal and boundary layer effects)
that results from an additional radiative load δSR (Supplemental Text S2, Appendix C),
as
(20)
The ratio of the increase in thermal load to the initial latent flux sets the
maximum positive response. The second ratio ranges from one to a plausible limit of 1/3
as internal latent transport due to thermal gradients becomes important relative to internal
thermal conduction; the third and final ratio describes the sensitivity of latent transport
from the leaf to temperature, , relative to sensible conductivity ks
T (inclusive of net
long wave radiation and conduction). This last ratio says that stomatal opening in
response to increased energy load is aided by low initial stomatal conductance values,
and confirms the importance of efficient conductive and radiative energy transfer to the
environment that minimize increases in leaf surface temperatures.
www.plantphysiol.orgon August 25, 2018 - Published by Downloaded from Copyright © 2014 American Society of Plant Biologists. All rights reserved.

23
Interestingly, while both condensation (17) and a positive stomatal response (20)
are favored by a dominance of latent transport due to thermal gradients over conduction
inside the leaf, and a dominance of sensible heat over latent heat at the surface, the
expressions are not identical. Leaves that achieve a condensing state on the inner face of
a transpiring epidermis are likely also to be in a regime where stomatal aperture increases
for a higher short wave load, but the converse is not true. The more restrictive condition
for condensation requires that the sensible flux from the surface be at least more than half
as large as the latent flux, given that, even for the extreme case of a 90% air fraction in
the lower domain and a thermal conductivity for the cells a third that of water, the ratio of
thermally induced latent to sensible internal heat transport in (17) is less than 2.
A final result of the model containing a hydraulic feedback on stomatal aperture
underscores the point that average leaf water potentials (as measured by a pressure
chamber or psychrometer) cannot be expected to follow a simple relationship with the
water potential of a transpiring epidermis. For example, in the hydraulic feedback
analyses (Figure 3), lower epidermal water potential increased by 0.08 MPa with the
increase in energy load, even as the average water potential of the leaf increased by only
0.015 MPa. In addition, these problems extend to measures of hydraulic transport
efficiency that depend on average leaf water potential, such as Kleaf, which increased in
the hydraulic feedback model by 12.5% (8.2 to 9.2 mmol m-2 MPa-1 s-1) between the cold
and full mirror treatments, despite constant parameter values for the hydraulic
conductivity of the xylem or cells.
Condensation and energy overload in an oak-like leaf
We next sought to understand the implications for transport efficiency and stomatal
control of a hypostomatous leaf pushed by increasing energy loading into a condensing
state at its transpiring epidermis. We started with a leaf characterized by parameter values
for red oak, and increased the air fraction to 85% in the spongy and 20% in the palisade
(43.4% over all) to produce a leaf with in the palisade of 12.6 and 3.5 in the spongy
(Table 3). For this leaf, internal vapor transport accounted for 103.8% of E (condensing
flux = 3.8% of E) under conditions of 85% RH and 1700 μmol m-2 s-1 PPFD (SR=394.9
W m-2). The high relative humidity was necessary to suppress λE and so increase the
magnitude of the first term in the peristomatal equation (14) over the second (-0.236
www.plantphysiol.orgon August 25, 2018 - Published by Downloaded from Copyright © 2014 American Society of Plant Biologists. All rights reserved.

24
versus 0.198); as a result, even for a large spongy air fraction, reaching a condensing state
at the lower epidermis required a leaf surface temperature more than 2 C above ambient.
We then compared the effects on internal transport of dropping or increasing the energy
load by 100 W m-2 : the high and low load final states are shown in Figure 4 (initial state
not shown).
Dropping the energy load by 100 W m-2 pushed the leaf out of the condensing
regime, with peristomatal evaporation at 2% (Figure 4D); the leaf-to-air temperature
difference fell to 1.5 C, but the change in epidermal water potential (+ 0.03 MPa) resulted
in no material change in stomatal conductance (Figure 4D). Nor did the opposite
perturbation, adding 100 W m-2, result in a increase in gs as hypothesized by Pieruschka
et al. (2010), despite the existence of a condensing flux equivalent to 8% of E (Figure
4E). The smaller total vascular to epidermal water potential difference in the lower
domain was offset by the increased drop through the leaf vasculature and stem
accompanying the increased flux. The difference from the sunflower simulations is not
only the lack of compensatory changes in air temperature, but that here we account for
hydraulic feedbacks due to larger water potential drops through the root and stem arising
from higher fluxes at the whole plant level as well.
Considered from the perspective of stomatal protection of either the leaf tissue or
xylem from excessively low water potentials, the model results suggest that condensing
steady-states may be maladaptive to the extent stomata are influenced by epidermal water
status. While the water potential at the transpiring surface dropped by 0.06 MPa between
the low and high energy loads in Figure 4, the water potential at the vascular plane fell
0.24 MPa, and the average water potential of the mesophyll by 0.21 MPa. This sort of
uncoupling, increasing with higher energy loads and E, indicate that condensing states,
though apparently hydraulically efficient in the sense that Kleaf increased from 14.2 to
17.1 mmol m-2 MPa-1 s-1 between SR = 295 and 495, could lead to the loss of tight
stomatal control of xylem tensions.
Modeling evaporative flux experiments on detached leaves
In the condensing leaf simulation (Figure 4), the increase in apparent Kleaf found
for a 200 W m-2 increase in energy load, equivalent to about an 800 μmol m-2 s-1 increase
in PPFD, amounted to a 20% increase over the initial value, with only a 1.5 C degree
www.plantphysiol.orgon August 25, 2018 - Published by Downloaded from Copyright © 2014 American Society of Plant Biologists. All rights reserved.

25
change in epidermal temperature that from the perspective of viscosity corrections might
be considered non-significant. As an experimental result, this might easily be mistaken as
evidence of an increase in the permeability of the cells. We therefore sought to
understand to what extent evaporative flux measures of whole leaf hydraulic conductance
(Kleaf) are sensitive not to just leaf temperature, but also the balance of sensible and latent
fluxes from the surface, which can change the length of the flow path by changing the
peristomatal fraction, as in (17).
At any particular epidermal surface temperature, average leaf water potential is
sensitive to a shift in the balance of internal liquid versus vapor transport, such that leaves
with more internal vapor transport have a higher apparent Kleaf. The problem for
experiments on detached leaves is exacerbated by the fact that stomata may be difficult to
open under conditions of high water potential due to the mechanical advantage of the
epidermis (Franks & Farquhar 1997, Brodribb & Holbrook 2006). To make the point
concrete, we modeled a detached leaf with the hydraulic and thermal properties of oak
leaves, and a volumetric air fraction of 34% more representative of leaves broadly (Byott
1976), in ‘shade’ and ‘full sun’ (50 and 2000 μmol m-2 s-1 PPFD), with gs constrained to
50 and 100 mmol m-2 s-1 respectively (Figure 5). Kleaf increased 55% between the two
radiation levels, even when air temperature was adjusted to conserve epidermal
temperature. We therefore caution that the apparent Kleaf can change depending on the
details of the energy regime, despite negligible changes in surface temperatures, even as
the hydraulic conductivity of the cells remains unchanged. This effect is expected to be
particularly pronounced when a leaf shifts from a ‘cool leaf’ (energy loading dominated
by conduction to the epidermal surfaces, favoring peristomatal evaporation) to a ‘warm
leaf’ regime (energy loading dominated by short wave absorption in the mesophyll), as
shown here (Figure 5 D, E).
DISCUSSION
Our analysis of evaporation in leaf tissue found that a single non-dimensional parameter
group, the TDM , describes the competition of sensible and latent heat transport.
This parameter group depends not only on the physical properties of air and water, as in
the ‘equilibrium evaporation’ case (Raupach, 2001), but also the sensitivity of vapor
pressure to liquid phase water potential within the mesophyll, and the hydraulic and
www.plantphysiol.orgon August 25, 2018 - Published by Downloaded from Copyright © 2014 American Society of Plant Biologists. All rights reserved.

26
thermal conductivities of leaf tissue as well. Unless the chemical potential of the vapor
and liquid phases of water in mesophyll air-spaces and cells are far out of local
equilibrium, as for example due to an extensive internal cuticle in the mesophyll, our
analysis should provide a reasonable guide to thinking about the coupling of heat and
molecular transport in leaves. And, for any case, our analysis demonstrates the
importance of accounting for liquid phase thermal conduction.
Indeed, liquid phase thermal conduction appears to be not only important but
inevitable. Under local equilibrium, both vapor and liquid tend to move ‘down’ gradients
in water potential; however, the vapor flux has an additional tendency to move ‘down’
temperature gradients, as can be seen in (7). For water to evaporate ‘locally,’ the water
potential gradient ‘out’ of the local volume must be less steep than the gradient ‘in,’ such
that more liquid water moves ‘in’ than ‘out.’ But this also means that the component of
the vapor flux due to water potential is greater ‘in’ than ‘out,’ the opposite of what is
required to have a net increase in vapor out of the local volume. Molecular conservation
then requires that the component of vapor diffusion due to the temperature gradient be
greater ‘out’ than ‘in,’ such that the resulting vapor mole fraction gradient is greater ‘out’
than ‘in.’ This constraint of molecular conservation on the temperature gradient means
that thermal conduction will also be greater ‘out’ than ‘in,’ such that the absorbed energy
load can never be dissipated soley by latent transport – some energy will also flow ‘out’
by thermal conduction.
Our subsequent analyses of particular cases are not intended as definitive
descriptions of the distribution of evaporation in transpiring leaves; rather, they are put
forward as a ‘first order’ framework for organizing thinking about both the competition
between liquid and vapor transport, and the competition between latent heat and thermal
conduction. For example, the 1D model structure is clearly violated by the discrete
placement of veins and stomata in leaves. While the issues of vein-spacing can be
addressed by way of a correction factor, based on simulation of the full 3D geometry of
an areole (Rockwell et al. 2014b), as done here for oak, understanding the effects of
discrete stomatal spacing and the geometry of substomatal cavities (Pickard 1982), as
well as internal cuticle (Pesacreta 1999) on the water potential and temperature of the
‘peristomatal region’ requires further work. Finer scale physical detail, such as volume
www.plantphysiol.orgon August 25, 2018 - Published by Downloaded from Copyright © 2014 American Society of Plant Biologists. All rights reserved.
27
fractions for specific tissues, rather than averaged over whole domains, as well as
independent estimates of a tortuosity for the vapor path, could further fine-tune these
analyses. More detailed short wave absorption functions could also be incorporated, yet
given the apparent strength of thermal conduction in leaf tissue the exact pattern of
absorption within a domain seems unlikely to have a strong effect on the results. The
assertion of a well-defined steady state for transpiring leaves might also be questioned.
Philip (1966) estimated, based on the characteristic times for the propagation of water
potential changes in plant tissue versus the typical period of environmental variation, that
as long as stomatal conductance is stable leaves attain physically well-defined steady
states, although a transient analysis may be necessary to understand behavior at the
wilting point. Here, if we accept the apparent stability of gas exchange measurements,
Philip’s argument supports steady water potential and temperature profiles through the
leaf tissue as well.
With all of the above caveats, a number of general points pertaining to leaf
structure and function emerge from our analysis. The distribution of evaporation found
here for oak provides a general model for hypostomatous leaves with smaller air spaces
in the palisade than spongy mesophyll: due to the high thermal conductivity of leaf tissue
and small air spaces, heat conduction is more efficient than latent heat transport for
dissipating the large absorbed radiation load in the palisade. At the transition to the
spongy mesophyll (i.e., the perivascular plane) the increase in air fraction increases the
competitiveness of vapor transport, and so some of the conducted heat flux switches to
latent transport, creating perivascular evaporation. Local evaporation in the spongy
mesophyll is low as the local radiation load is small. The remainder of the heat
conduction flux that originated in the palisade (and not consumed by perivascular
evaporation) ultimately arrives at the lower epidermis, where it provides the energy for
peristomatal evaporation, and for the surface sensible fluxes. For such leaves, mesophyll
evaporation will be a subordinate component, with the dominance of either perivascular
or peristomatal evaporation strongly influenced by the amount of air space in the spongy
mesophyll.
More broadly, given that the hydraulic conductivity of the cells may span an
order of magnitude larger and smaller than found here for oak (Kramer and Boyer, 1995),
kl
www.plantphysiol.orgon August 25, 2018 - Published by Downloaded from Copyright © 2014 American Society of Plant Biologists. All rights reserved.

28
that volumetric air fractions span 2 to 55% of total leaf volume, and may reach 70% in
the spongy mesophyll of some leaves (Pieruschka et al., 2010), and that the thermal
conductivity of the cells is not likely to be much less than that of water (Tyree and
Yianoulis, 1980), we should expect that leaves span nearly the full range of peristomatal
fractions. The crucial role of the extent of spongy mesophyll airspace in shifting
evaporation between peristomatal and perivascular regions may then reconcile evidence
for a dominant role of vapor transport in plants that have extensive airspaces (Boyer,
1985; Mott, 2007), versus evidence for the dominance of peristomatal evaporation in
plants with denser spongy mesophyll (Byott and Sheriff, 1976). Indeed, given the
importance we find for heat conduction in the liquid phase, most of the variation in the
distribution of evaporation between leaves may occur as differences in perivascular
(evaporation into the first available air spaces) versus peristomatal evaporation
(evaporation from the wetted surfaces closest to the unsaturated external air).
Nevertheless, mesophyll evaporation will be somewhat higher in leaves with a lower
peristomatal fraction, as low values of favor both local evaporation and vapor
transport from the vascular plane.
The distribution of evaporation within a given leaf is not however static. As the
tendency toward vapor transport increases ( approaches 1, and the bracketed term in
the peristomatal equation (14) goes to zero), the internal distribution of evaporation
becomes more sensitive to the surface fluxes and environmental conditions. An increase
in transpiration due to a decrease in ambient mole fraction pulls the distribution of
evaporation toward the stomata. On the other hand, an increase in transpiration due to an
increase in the energy load absorbed in the mesophyll reduces the peristomatal fraction,
as the resulting increase in the temperature gradient shifts the balance of molecular
transport toward the vapor phase. As the latter effect is more likely to be important in
driving E on diurnal time scales, the resulting shifts in evaporation sites may help explain
the inverse relationship in oxygen isotope studies of leaf water between transpiration and
the ‘effective pathlength’ from the veins to the sites of evaporation (Song et al. 2013).
Another important point that emerges from the analysis is that experiments to
characterize hydraulic transport properties of transpiring leaves need to account for the
energy loading regime, and not simply leaf surface temperatures. Even for the transpiring
www.plantphysiol.orgon August 25, 2018 - Published by Downloaded from Copyright © 2014 American Society of Plant Biologists. All rights reserved.
29
oak leaves modeled here, with a strong dominance of the liquid path at 74% peristomatal
evaporation, temperature induced vapor movement explained 11% of the internal flux,
such that accurate characterization of leaf-averaged hydraulic parameters based on
transpiration (non-isothermal) experiments requires accounting for internal temperature
gradients. Comparisons of Kleaf
between heavily shaded leaves, below ambient air
temperature when the external latent heat flux exceeds the solar short wave load, and an
identical illuminated leaf for which the opposite is true, may be expected to be
problematic. This will be especially true for leaves with large air fractions, as these can
shift from a dominantly peristomatal to a dominantly perivascular evaporative regime
between ‘cool’ and ‘warm’ states.
A final point, pertaining to stomatal behavior, is that our model concurs with the
core hypothesis of Pieruschka et al. (2010) that under some circumstances increases in
short wave radiative loading that drive a larger internal vapor flux could lead to increased
stomatal apertures. However, we find that it is not necessary for the internal surface of
the leaf to be in a condensing state for this effect to occur. To the extent stomatal
regulation emphasizes water over energy balance, such condensing states may indeed be
pathological.
The specific cases examined here are just the first steps in elucidating the adaptive
significance of internal vapor versus liquid transport. While the theoretical analyses
presented here provide a broad outline, reconstructing the distribution of evaporation
(i.e., as done here for red oak) for a variety of leaves with varying internal architectures,
characteristic environments, and growth habits will be required to fill in the picture. With
respect to water use efficiency (WUE), there would not appear to be any obvious first
order effects of internal vapor versus liquid transport. The most important factor for
transport influences on WUE are leaf-to-air temperature differences – a cooler leaf will
be more water use efficient – and these do not seem particularly sensitive to which mode
of internal transport is dominant.
In contrast, the hydraulic efficiency of the leaf, defined as E divided by the
vascular-to-epidermal water potential drop, will be very sensitive to the amount of vapor
phase transport. The more the internal transpirational flux is driven by temperature-
induced gradients in mole fraction, the shallower the water potential gradient from veins
www.plantphysiol.orgon August 25, 2018 - Published by Downloaded from Copyright © 2014 American Society of Plant Biologists. All rights reserved.

30
to transpiring epidermis will be. As seen in the sunflower simulations, such temperature
effects mean that increases in energy loading are accompanied by increases in hydraulic
efficiency, such that the water potential gradient may change little as E fluctuates with a
varying solar load (i.e., isohydric behavior at the diurnal time scale). A large perivascular
fraction of E could then save the construction costs associated with building stiff tissues
capable of maintaining volume homeostasis over large swings in water potential.
What then might be the risks of, or constraints on, using temperature-induced
vapor transport to move water to the stomata? The temperature sensitivity of vapor phase
transport helps may help mitigate solar load driven ‘demand shocks’, but will not help
with ‘supply shocks’ due to soil drying. Where leaves must function over a wide-range of
soil water potentials during their lifetime, it may be more advantageous to invest in stiff
epidermal tissues capable of sustaining the water potentials necessary to extract water
from drying soils (i.e., anisohydric). In addition, the ‘condensing leaf’ simulation (Figure
5) points to a possible constraint in that if a leaf with a high perivascular fraction is
pushed into a state where condensation occurs at the transpiring epidermis, protection of
the vasculature from excessive tensions could be compromised.
A final hypothesis suggested by the energy component of this analysis relates to
the functional significance of bundle sheath extensions. A role for these structures in
providing a low resistance path for flow to a transpiring epidermis has long been
suggested (Wylie, 1952). The fact that they have been found to be more prevalent in
upper canopy (high energy), rather than sub-canopy (low energy) strata (Kenzo et al.,
2007), suggests a role in aiding thermal conduction of energy absorbed in the upper
epidermis and palisade to what we find to be the dominant sites of evaporation, the
perivascular and peristomatal regions.
The theoretical and experimental analyses presented here demonstrate that
consideration of the competition between liquid and vapor, as well as thermal conduction
and latent heat, provides an essential perspective for understanding leaf structure and
function. The descriptions of leaf structure that enter into the 1D analysis are still very
rudimentary however. Fortunately, the modeling approach taken here is sufficiently
general that more detailed descriptions of leaf architecture (e.g., the location of internal
cuticles, veins, stomata) can be realized in future by relaxing local equilibrium and
www.plantphysiol.orgon August 25, 2018 - Published by Downloaded from Copyright © 2014 American Society of Plant Biologists. All rights reserved.

31
implementing the model in a numerical simulation package. Even so, the analytical
results presented here for the distribution of evaporation, and the parameter , will
likely retain their value for developing an intuitive understanding of where the
transpiration stream changes phase inside leaves.
MATERIALS AND METHODS
Parameterization and solution of the transpiring oak leaf model
Solution for a section of leaf enclosed in a cuvette
For leaves of Quercus rubra L. (Northern red oak), we estimated based on
hydraulic and anatomical experiments. To estimate the liquid phase hydraulic
conductivity for red oak, we used data from rehydration experiments conducted on
bagged leaves initially attached to a tree on the campus of Harvard University (Rockwell
et al. 2011). The results of these rehydration experiments, conducted on bagged leaves
initially attached to the tree, were reported in terms of the ratio of final to initial water
potential and the hydration time t. From these data, estimates of the total
hydraulic conductivity of leaf tissue were calculated according to,
(21)
where is the volumetric hydraulic capacity of the leaf, L is the half thickness (i.e., the
average length of the upper and lower domains), hA is the hydraulic conductance of the
vascular network normalized to the leaf area, and ξ and η are scaling factors that map the
1D solution form to a numerical solution of the transient hydration in a 3D domain that
respects the discrete placement of the vasculature (Rockwell et al. 2014b)
Flux measurements of transpiring leaves with a Li-6400 (Li-cor Biosciences Inc.,)
provided the estimates of E, TLb, Tair, δ. We then found the sensible heat flux qcb from
(S1.28). In addition, taking the Li-6400 output ‘TBlk’ as Tsur with aIR=0.95 allowed
estimation of the radiative flux qrb from (S1.25). The thermal conductivity of the liquid
phase was estimated from a lateral thermal conductivity of oak leaves of 0.25 J m-2 s-1 K-1
as reported by (Vogel 1983), yielding 0.286 J m-2 s-1 K-1 after accounting for the air
fraction. Volumetric air fraction was estimated from the weight gain observed for leaves
www.plantphysiol.orgon August 25, 2018 - Published by Downloaded from Copyright © 2014 American Society of Plant Biologists. All rights reserved.

32
submerged water in a column subject to alternating cycles of pressurization at 0.1 MPa
and vaccum, until no further weight gain occurred (Byott 1976). For comparison to the
measured value , the average water potential of the cells of a leaf (negligible density
in the airspace), once at internal equilibrium, is given by,
(22)
An estimate that takes into account the effects of vein spacing on water potential
gradients is given by,
(23)
where and can be predicted based on a leaf’s internal geometry, and is ratio of
the vascular and tissue path conductances (Rockwell et al. 2014b).
In the initial iteration of the model (Supplemental Text S3), qrd and qcd were
estimated assuming TLd=TLb, with the total absorbed short wave load SR then given by
(S1.35). The initial estimate of followed from (S1.33). The physical properties
were then calculated at . To find for a hypostomatous leaf for
which the vascular geometry is known, global molecular conservation (S1.36) can be
written in the form,
(24)
where is a correction factor that maps a 1D solution with a continuous vascular plane
approximation to the numerical simulation of the full 3D problem with discrete vein
placement, based on an analysis of the isothermal (linear) flow problem (Rockwell et al.
2013). Essentially, accounts for the resistance to the lateral (x,y) movement of water
molecules in the vicinity of the vascular bundles, a resistance neglected in making a
continuous vascular plane approximation that spreads vascular conductance smoothly
over the whole vascular plane. For a hypostomatous leaf, the factor can be predicted
from the vascular and tissue geometry that determines ζ,η as well as the Biot number ,
the ratio of hydraulic conductance to the total conductance of the tissue between a
vascular plane and the transpiring surface;
www.plantphysiol.orgon August 25, 2018 - Published by Downloaded from Copyright © 2014 American Society of Plant Biologists. All rights reserved.

33
(25)
For the first iteration, to find an appropriate value of we used the total effective
hydraulic conductance of the tissue (the composite of air and cells) from the isothermal
problem.
(26)
With this, the solution for the lower water potential field (S1.23) was complete.
Evaluating the solution for the lower temperature field (S1.24) at z=L with TLb given by
the temperature measured by the Li-6400 leaf thermocouple (‘Tleaf’), provided an
equation for To. Everything was then known.
For the second iteration, physical properties were recalculated at the first
solution's values of The upper surface heat fluxes qrd, qcd were re-calculated for
TLd, and the estimate of SR adjusted. In addition, the value of was updated from the first
iteration of the solution by adjusting the effective hydraulic conductance of the tissue to
account for the portion of the flux driven by temperature gradients;
(27)
This process may be repeated for a third iteration to verify the stability of the solution,
but this was not necessary for the red oak leaves studied here. Final parameter values are
given in Table 3.
Solution for an exposed leaf
We took gs as given (as measured in the cuvette), with gbl estimated from (S.31) and
(S1.29) with taken as 10 cm and The mole fraction of the external air
was calculated from the air temperature and humidity of the reference stream (bypass
fully open) reported by the Li-6400. The transpiration rate was not imposed, but
depended on as given (S1.30). The total solar load SR was estimated from the
energy per mol of incident PAR, for the solar spectrum , based on the
observation that PAR contains about half the energy in the solar spectrum, and that about
half of incident solar short wave radiation (PAR and NIR) is absorbed by leaves
www.plantphysiol.orgon August 25, 2018 - Published by Downloaded from Copyright © 2014 American Society of Plant Biologists. All rights reserved.

34
(Campbell & Norman 1998). The source terms were then set by assuming a
distribution of the solar load between spongy and palisade tissues, as in (S1.32, S1.33).
To calculate the net long-wave radiative fluxes on the upper and lower leaf surfaces, we
let on the upper epidermis, and on the lower. With this, the solutions
(S1.17) and (S1.18) for the upper non-transpiring domain could be evaluated at Ld, and
the solutions (S1.23) and (S1.24) for the transpiring domain at Lb, to find four equations
with six unknowns: . With Ed=0 for no transpiration from the upper
surface and the source water potential given, was found from global molecular
conservation (S1.36), and global energy conservation (S1.35) provided the required
constraints on that closed the system of equations for the five remaining
unknowns. We then solved the system using the FindRoot command of Mathematica 8
(Wolfram Research Inc., Champaign, IL USA). As before, for the first iteration of the
solution the physical properties were evaluated at Tair, and the vascular
scaling factor was defined by (25), and leaf hydraulic conductivity by (26). For the
second iteration, these properties were recalculated at and re-estimated using
the effective non-isothermal from (27). Finally, a check of the neglected enthalpy
transport terms (due to molecular fluxes through a temperature field) described in
Supplemental Text S1 verified they were indeed negligible relative to the retained latent
and conductive fluxes (Supplemental Text S4).
Sunflower cold-mirror experiment model
As not all model inputs were available from the data in Pieruschka et al. (2010), some
parameters had to be estimated on previous reports or assumed (Table 3). Specifically,
the original data contained no information on hydraulic parameters or variables, so values
had to be assumed, and thus the absolute water potentials reported are arbitrary values; a
constant water potential of -0.2 MPa was assumed to exist at the petiole/stem junction. As
sunflower is amphistomatous, the solution was sought for two transpiring domains, with
total gs partitioned arbitrarily but in a manner consistent with a larger flux from the
abaxial side (Foster 1986). Radiative boundary conditions were set for a lab with all
surfaces at Tair , the partitioning of SR between the upper and lower domain was set at
www.plantphysiol.orgon August 25, 2018 - Published by Downloaded from Copyright © 2014 American Society of Plant Biologists. All rights reserved.

35
90% and 10% respectively, and the thermal conductivity of the cells assumed to be 0.2 W
mol-1 K-1.
After solution of the model for the ‘cold mirror’ initial state, SR = 160, we then
constructed equations to describe the linear response of stomatal conductance to small
perturbations in water potential (Supplemental Text S5) when at approximately 80% of
maximum aperture, based on the shape of responses in Franks and Farquhar (1997). We
then changed SR to its full mirror value of 200, and re-solved the model based on
environmental inputs with both stomatal conductances and surface temperatures as
variables. To capture the effect of the temperature compensation in Pieruschka et al.
(2010), ambient air temperature in the model was adjusted iteratively to bring lower
epidermal temperature to within 0.01 degree of its initial at SR = 160.
The explore the effect of air fraction and upper and lower domain symmetry on
the magnitude of stomatal opening at the higher radiation level, we modeled the cold
mirror experiment for three different total air fractions (0.3, 0.5, 0.7), employing the
assumption of Pieruschka et al. (2010) that stomata change aperture to hold epidermal
water potential constant (Supplemental Text S6).
Condensing leaf and evaporative flux meter models
To construct a condensing leaf model (Supplemental Text S7), we started with the
exposed leaf solution for an oak leaf, and then varied the air fraction in each domain and
external humidity as guided by (17) to bring the lower epidermis into a condensing state,
with final values of 0.75 in the spongy and 0.2 in the palisade domains, and RH=85%.
Other leaf parameters were left unchanged. As we were not concerned with the absolute
values of the water potentials, and because the temperature gradients are non-linear in the
condensing limit, we neglected the vascular scaling factor. In addition, to capture the
effect of a whole plant canopy responding to environmental forcing, we allowed the stem
water potential to vary by assuming a soil water reservoir potential and per leaf whole
plant conductance, such that,
(28)
where is the standing gravitational potential, and Krs is the effective conductance of
the root and stem to the modeled leaf. To allow stomatal conductance to respond in a
www.plantphysiol.orgon August 25, 2018 - Published by Downloaded from Copyright © 2014 American Society of Plant Biologists. All rights reserved.

36
manner consistent with steady state hydraulic feedbacks, an arbitrary model based on the
form of aperture and turgor relations in Franks & Farquhar (1997) was adopted,
(29)
where gmax was estimated as 0.36 mol m-2 s-1 based on data from oak trees at Harvard
Forest (Williams 1996). For the evaporative flux meter model, we set to a small but
non-zero value to avoid division by zero errors, with an air fraction of 0.3, and adopted
radiative boundary conditions suitable for a lab of Tsur =Tair (Supplemental Text S8).
SUPPLEMENTAL MATERIALS Supplemental Text S1. Model description and overview of derivation.
Supplemental Text S2. Detailed model derivation and appendices.
Supplemental Text S3. Oak model code.
Supplemental Text S4. Evaluation of enthalpy convection terms code.
Supplemental Text S5. Sunflower model code.
Supplemental Text S6. Sunflower epidermal potential set-point model code.
Supplemental Text S7. Condensing oak-like leaf model code.
Supplemental Text S8. Evaporative flux meter model code.
Supplemental Figure S1. Oak leaf humidity and energy perturbations.
Supplemental Figure S2. Sunflower air fraction and stomatal symmetry variations.
www.plantphysiol.orgon August 25, 2018 - Published by Downloaded from Copyright © 2014 American Society of Plant Biologists. All rights reserved.

37
LITERATURE CITED
Bird RB, Stewart WE, Lightfoot EN (1960) Transport Phenomena. John Wiley & Sons, New York, NY, USA
Bowen IS (1926) The ratio of heat losses by conduction and by evaporation from any wet surface. Physical Review 27: 779-787
Boyer JS (1969) Free energy transport in plants. Science 163: 1219-1220 Boyer JS (1985) Water transport. Ann Rev Plant Physiol 36: 473-516 Brodribb TJ, Holbrook NM (2006) Declining hydraulic efficiency as transpiring leaves
dessicate: two types of responses. Plant Cell Environ 29: 2205-2215 Buckley TN (2005) The control of stomata by water balance. New Phytol 168: 275-292 Buckley TN, Mott KA (2013) Modeling stomatal conductance in response to
environmental factors. Plant Cell Environ. doi: 10.1111/pce.12140 Byott GS (1976) Leaf air space systems in C3 and C4 species. New Phytol 76: 295-299 Byott GS, Sheriff DW (1976) Water movement into and through Tradescantia
virginiana (L.) leaves. II. Liquid flow pathways and evaporating sites. J Exp Bot 27: 634-639
Campbell GS, Norman JM (1998) An Introduction to Environmental Biophysics. Springer-Verlag, New York, NY, USA
Cernusak LA, Kahmen A (2013) The multifaceted relationship between leaf water 18O enrichment and transpiration rate. Plant Cell Environ 36: 1239-1241
Chen IT, Pharkya A, Stroock, AD (2013). Analysis of superheated loop heat pipes exploiting nanoporous wick membranes. AIChE J. DOI: 10.1002/aic.14303
Crank J (1957) The Mathematics of Diffusion. Oxford University Press, New York, NY, USA
Deen WM (1998) Analysis of Transport Phenomena. Oxford University Press, New York, NY, USA
Dengler NG (1980) Comparative histological basis of sun and shade leaf dimorphism in Helianthus annuus. Can J Bot 58: 717-730
DeVries DA (1958) The simultaneous transfer of heat and moisture in porous media. Trans Am Geophys Union 39: 909-916
Farquhar GD, Lloyd J, Taylor JA, Flanagan LB, Syvertsen JP, Hubick KT, Wong SC, Ehleringer JR (1993) Vegetation effects on the isotope composition of oxygen in atmospheric CO2. Nature 363: 439-443
Franks PJ, Farquhar GD (2007) The mechanical diversity of stomata and its significance in gas-exchange control. Plant Physiol 143: 78-87
Gillon JS, Yakir D (2000) Naturally low carbonic anhydrase activity in C4 and C3 plants limits discrimination against C18OO during photosynthesis. Plant Cell Environ 23: 903-915
Kenzo T, Ichie T, Watanbe Y, Hiromi T (2007) Ecological distribution of homobaric and heterobaric leaves in tree species of Malaysian lowland tropical forest. Am J Bot 94: 764-755
Kittel C, Kroemer H (1990) Thermal Physics. Freeman, New York, NY, USA Knipling EB (1970) Physical and physiological basis for the reflectance of visible and
near-infrared radiation from vegetation. Remote Sensing of Environ 1: 155-159 Kramer PJ, Boyer JS (1995) Water Relations of Plants and Soils. Academic Press, San
Diego, CA, USA
www.plantphysiol.orgon August 25, 2018 - Published by Downloaded from Copyright © 2014 American Society of Plant Biologists. All rights reserved.

38
Lambers H, Chapins FS, Pons TL (1998) Plant Physiological Ecology. Springer, New York, NY, USA
Meidner H (1976) Water vapour loss from a physical model of a substomatal cavity. J Exp Bot 27: 691-694
Molz FJ, Ferrier JM (1982) Mathematical treatment of water movement in plant cells and tissues: a review. Plant Cell Environ 5: 191-206
Mott KA (2007) Leaf hydraulic conductivity and stomatal responses to humidity in amphistomatous leaves. Plant Cell Environ 30: 1444-1449
Nobel PS (2005) Physicochemical and Environmental Plant Physiology. Elsevier Academic Press, Burlington, MA, USA
Peak D, Mott KA (2011) A new, vapour-phase mechanism for stomatal responses to humidity and temperature. Plant Cell Environ 34: 162-178
Pesacreta TC, Hasenstein KH (1999) The internal cuticle of Circium horridulum (Asteraceae) leaves. Am J Bot 86: 923-928
Philip JR (1966) Plant water relations: some physical aspects. Ann Rev Plant Physiol 17: 245-268
Philip JR, DeVries DA (1957) Moisture movement in porous materials under temperature gradients. Trans Am Geophys Union 38: 222-232
Pickard WF (1981) The ascent of sap in plants. Prog Biophys molec biol 37: 181-229 Pickard WF (1982) Why is the substomatal cavity as large as it is? Plant Physiol 69:
971-974 Pieruschka R, Huber G, Berry JA (2010) Control of transpiration by radiation. Proc
Natl Acad Sci USA 107: 13372–13377 Raupach MR (2001) Combination theory and equilibrium evaporation. Q J R Meteorol
Soc 127: 1149-1181 Rockwell FE (2010) Leaf water transport. Harvard University, Cambridge, MA, USA Rockwell FE, Holbrook NM, Zwieniecki MA (2011) Hydraulic conductivity of red oak
(Quercus rubra L.) leaf tissue does not respond to light. Plant Cell Environ 34: 565-579
Rockwell FE, Holbrook NM, Stroock AD (2014a) Leaf hydraulics I: scaling transport properties from single cells to tissues. J Theor Bio 340: 251-266
Rockwell FE, Holbrook NM, Stroock AD (2014b) Leaf hydraulics II: vascularized tissues. J Theor Bio 340: 267-284
Sack L, Melcher PJ, Zwieniecki MA, Holbrook NM (2002) The hydraulic conductance of the angiosperm leaf lamina: a comparison of three measurement methods. J Exp Bot 53: 2177-2184
Tanton TW, Crowdy SH (1972) Water pathways in higher plants. III. The transpiration stream within leaves. J Exp Bot 23: 619-625
Tyree MT, Yianoulis P (1980) The site of water evaporation from sub-stomatal cavities, liquid path resistances, and hydroactive stomatal closure. Ann Bot 46: 175-193
Vogel S (1983) The lateral thermal conductivity of leaves. Can J Bot 62: 741-744 Vogelmann TC, Evans JR (2002) Profiles of light absorption and chlorophyll within
spinach leaves from chlorophyll flourescence. Plant Cell Environ 25: 1313-1323 Williams M, Rastetter EB, Fernandes DN, Goulden ML, Wofsy SC, Shaver GR,
Melillo JM, Munger JW, Fan SM, Nadelhoffer KJ (1996) Modeling the soil-plant-atmosphere continuum in a Quercus-Acer stand at Harvard Forest: the
www.plantphysiol.orgon August 25, 2018 - Published by Downloaded from Copyright © 2014 American Society of Plant Biologists. All rights reserved.

39
regulation of stomatal conductance by light, nitrogen and soil/plant hydraulic properties. Plant Cell Environ 19: 911-927
Whitaker S (1977) Simultaneous heat, mass, and momentum transfer in porous media: A theory of drying. In JP Hartnett and TF Irvine, eds, Advances in Heat Transfer vol. 13, Academic Press, New York NY, 119-203
Yianoulis P, Tyree MT (1984) A model to investigate the effect of evaporative cooling on the pattern of evaporation in sub-stomatal cavities. Ann Bot 53: 189-206
www.plantphysiol.orgon August 25, 2018 - Published by Downloaded from Copyright © 2014 American Society of Plant Biologists. All rights reserved.

40
FIGURE LEGENDS Figure 1. Model overview: conservation of heat and molecules at transpiring and non-
transpiring surfaces, and in a representative volume element of mesophyll (air and cells).
In steady-state, global molecular conservation requires that the number of molecules
entering in the liquid phase Jx equals the number leaving in the gas phase Eb, such that
the difference in the enthalpies of the two phase leads to the net consumption of energy as
latent heat equivalent to λEb. Thermal energy conservation requires that the total
absorbed short wave radiation load SR balances the total net surface latent and sensible
(long wave radiative and conductive) fluxes.
Figure 2. Solution of the model for an oak leaf with gas exchange, hydraulic and
anatomical data. A Water potential profile with the vascular plane at z = 0, horizontal line
is the potential drop between the stem and vascular plane; B temperature profile; C mole
fraction profile; D Fluxes of energy (red, W m−2) and molecules (dark blue liquid, light
blue vapor, mmol m−2 s−1), and the percentage of the total transpirational phase-change
occurring in different regions of a leaf. Conduction (qc, total of both phases) is the
dominant mode of absorbed energy dissipation internally within both domains. In the
upper domain a small flux of vapor to the upper epidermis condenses and flows back into
the palisade to re-evaporate, with a net flux of latent heat to the upper surface.
Figure 3. Model results for a sunflower leaf illuminated by a cold mirror (SR = 160 W
m−2, solid lines), and full mirror (SR = 200 W m−2, dashed lines), as in the experiments
of Pieruschka et al. (2010). A Water potential profile through the leaf thickness (upper =
adaxial, lower = abaxial) with the vascular plane at z = 0, horizontal line is the potential
drop between the stem and vascular plane; B temperature profile; C mole fraction profile;
D, E Fluxes of energy (red, W m−2) and molecules (dark blue liquid, light blue vapor,
mmol m−2 s−1), and the percentage of the total transpirational phase change occurring in
different regions of a leaf, under illumination by a cold mirror (SR = 160, D), or full
mirror (SR = 200, E). Under the higher thermal load, an increase in internal temperature
gradients shifts more of the water flux from liquid to vapor.
www.plantphysiol.orgon August 25, 2018 - Published by Downloaded from Copyright © 2014 American Society of Plant Biologists. All rights reserved.

41
Figure 4. The shift at higher short wave radiation loads to a condensing state at the lower
epidermis in an oak-like leaf with an air fraction of 0.434; for plots A, B, C solid lines are
for the low load SR=295 W m−2, dotted lines the high load SR=495 (scale on the upper x
axes in B, C); A Water potential profile through the leaf thickness (upper = adaxial,
lower = abaxial) with the vascular plane at z = 0, horizontal line is the potential drop
between the stem and vascular plane; B temperature profile; C mole fraction profile; D, E
Fluxes of energy (red, W m−2) and molecules (dark blue liquid, light blue vapor, mmol
m−2 s−1), and the percentage of the total transpirational phase change occurring in
different regions of a leaf under a low short wave load (SR= 295, D), and a high load
(SR=495, E). The high load pushes the internal face of the lower epidermis into a
condensing state (the internal evaporative flux exceeds transpiration), such that there is a
small liquid flux back into the spongy mesophyll where it re-evaporates.
Figure 5 Distribution of evaporation for a simulated low light (PPFD= 50 μmol m−2 s−1)
evaporative flux experiment on an oak-like leaf but with an air fraction of 0.34; for plots
A, B, C solid lines are for the low load SR=295 W m−2, dotted lines the high load
SR=495 (scale on the upper x axes in B,C); A Water potential profile through the leaf
thickness (upper = adaxial, lower = abaxial) with the vascular plane at z = 0, horizontal
line is the potential drop between the stem and vascular plane; B temperature profile; C
mole fraction profile; D, E Fluxes of energy (red, W m−2) and molecules (dark blue
liquid, light blue vapor, mmol m−2 s−1), and the percentage of the total transpirational
phase change occurring in different regions of a leaf under two different energy regimes,
driven by low (D) and high (E) light levels (PPFD, μmol m−2 s−1). The transition from a
dominant surface load of sensible heat at low light to a dominant short wave load at high
light results in a large change in apparent leaf conductance, Kleaf (mmol m−2 MPa−1 s−1).
www.plantphysiol.orgon August 25, 2018 - Published by Downloaded from Copyright © 2014 American Society of Plant Biologists. All rights reserved.

Table I Mathematical symbols.
Quantity Symbol Units
Kelvin temperature T K
Temperature, dimensionless -
Water potential Pa
Water potential, dimensionless -
Water vapor mole fraction -
K-1
Pa-1
Conductive heat flux qc J m-2 s-1
Radiative heat flux qr J m-2 s-1
Absorbed SW rad. per vol. J m-3 s-1
Transpiration E mol m-2 s-1
Internal vapor flux Jv mol m-2 s-1
Internal liquid flux Jl mol m-2 s-1
Hydraulic conductivity, leaf kℓ
mol m-1 Pa-1 s-1
Stomatal conductance gs
mol m-2 s-1
Boundary layer conductance gbl
mol m-2 s-1
Boundary layer thickness m
Emissivity, long-wave -
Absorptance, long-wave aIR
-
Absorptance, short-wave asw
-
www.plantphysiol.orgon August 25, 2018 - Published by Downloaded from Copyright © 2014 American Society of Plant Biologists. All rights reserved.

Table II Physical quantities and constants used in the analyses.
Quantity Symbol Value (25 oC) Units
Latent heat, molar 44 x 103 J mol-1
Molar enthalpy of water, liq. Hl
1.88 x 10³ J mol-1
Molar enthalpy of water, vap. Hv
45.88 x 10³ J mol-1
Thermal conductivity air kv
T 0.026 J m-1 K-1 s-1
Molar volume of water, liq. v 1.807 x 10⁻⁵ m3 mol-1
Diffusivity, water in air Dv 2.5 x 10⁻⁵ m2 s-1
Molar concentration of air c 40.86 mol m-3
Gas constant R 8.3145 J mol-1 K-1
Stefan-Boltzmann constant 5.67 x 10⁻⁸ J m-2 s-1 K-4
Atmospheric pressure patm 101.3 x 10³ Pa
Reference temperature To 298.15 K
Reference vapor mole fraction 0.0313 -
Reference vapor pressure po
3.173 x 10³ Pa
www.plantphysiol.orgon August 25, 2018 - Published by Downloaded from Copyright © 2014 American Society of Plant Biologists. All rights reserved.

Table III Leaf and environmental parameter values used in the various solutions reported in the figures.
Red Oak Sunflower Condensing leaf EFM leaf
Quantity Symbol Figure 3 Figure 4 Figure 5 Figure 6 Units
Leaf thickness, adaxial Ld
167.7 x 10⁻⁶ 200 x 10-6 167.7 x 10⁻⁶ 167.7 x 10⁻⁶ m
Leaf thickness, abaxial Lb
94.3 x 10⁻⁶ 200 x 10-6 94.3 x 10⁻⁶ 94.3 x 10⁻⁶ m
Liquid area fraction, adaxial 0.95 0.8 0.8 0.8 -
Liquid area fraction, abaxial 0.7 0.2 0.15 0.4 -
Vapor area fraction, adaxial
0.05 0.2 0.2 0.2 -
Vapor area fraction, abaxial
0.3 0.8 0.85 0.6 -
Palisade absorbed radiation 0.8 SR 0.9 SR 0.8 SR 0.8 SR J m-2 s-1
Spongy absorbed radiation 0.2 SR 0.1 SR 0.2 SR 0.2 SR J m-2 s-1
Leaf hydraulic capacity cℓ
9.3 x 10⁻⁴ - - - mol m-3 Pa-1
Vascular conductance hA
2.1 x 10⁻⁸ 1 x 10⁻⁷ 2.1 x 10⁻⁸ 2.1 x 10⁻⁸ mol m-2 Pa-1 s-1
Vasc. Cond. scaling factor 0.67 - - 0.6 - 0.8 -
Root and stem conductance Krs - - 6 x 10⁻⁹ - mol m-2 Pa-1 s-1
Hydraulic conductivity cells kl
6.97 x 10⁻¹³ 1 x 10-12 6.97 x 10⁻¹³ 6.97 x 10⁻¹³ mol m-1 Pa-1 s-1
Thermal conductivity cells kl
T 0.286 0.2 0.286 0.286 J m-1 K-1 s-1
Stomatal conductance, total gs
0.3 0.71 0.34 0.3 mol m-2 s-1
Characteristic leaf length ℓ c
0.1 - 0.1 0.1 m
Emissivity, long-wave, leaf 0.96 0.96 0.96 0.96 -
Bound. layer cond. (1 side, cuv.) gbl 1.42 1.42 - - mol m-2 s-1
Wind speed uw 3.86 - 3.86 3.86 m s-1
Relative humidity RH 44% 84% 85% 44% -
Temperature, air (base) Tair 301.5 298.15 301.5 301.5 K
Photosyn. photon flux density PPFD 1700 - 1700 50 - 2000 μmol m-2 s-1
w
ww
.plantphysiol.orgon A
ugust 25, 2018 - Published by
Dow
nloaded from
Copyright ©
2014 Am
erican Society of P
lant Biologists. A
ll rights reserved.

Tair, χair
Adaxialdomain
Abaxialdomain
\\δ
Transpiring surface (peristomatal)
\\
Tair, χair
δEb
HlAl Jl HvAvJv Al Jl AvJv Avqv Alql
qcbHv Ebqrb
ψo, Τo
z =Lb
z =Ld
z =0
Non-transpiring surface
Vascular plane (perivascular)
HlAl Jl HvAvJv Al Jl AvJv Avqv Alql
qcd qrd HlAl Jl HvAvJv
Al Jl AvJv Avqv Alql
z
z + Δz
Q
HvAvJv Al Jl
AvJv Avqv Alql
HlAl Jl
HlJxJx
Jx = Eb
SR = QdLd + QbLb
SR = qcb + qcd + qrb + qrd + λEb
λ = Hv − Hl
Global conservation for heat and molecules
Figure 1 Model overview: conservation of heat and molecules at transpiring and non-transpiring surfaces, and in a representative volume element of a composite of air and cells.In steady-state, global molecular conservation requires that the number of molecules enteringin the liquid phase J
x
equals the number leaving in the gas phase Eb
, such that the di↵er-ence in the enthalpies of the two phase leads to the net consumption of energy as latent heatequivalent to �̄E
b
. Thermal energy conservation requires that the total absorbed short waveradiation load SR balances the total net surface latent and sensible (long wave radiative andconductive) fluxes.
1 www.plantphysiol.orgon August 25, 2018 - Published by Downloaded from
Copyright © 2014 American Society of Plant Biologists. All rights reserved.
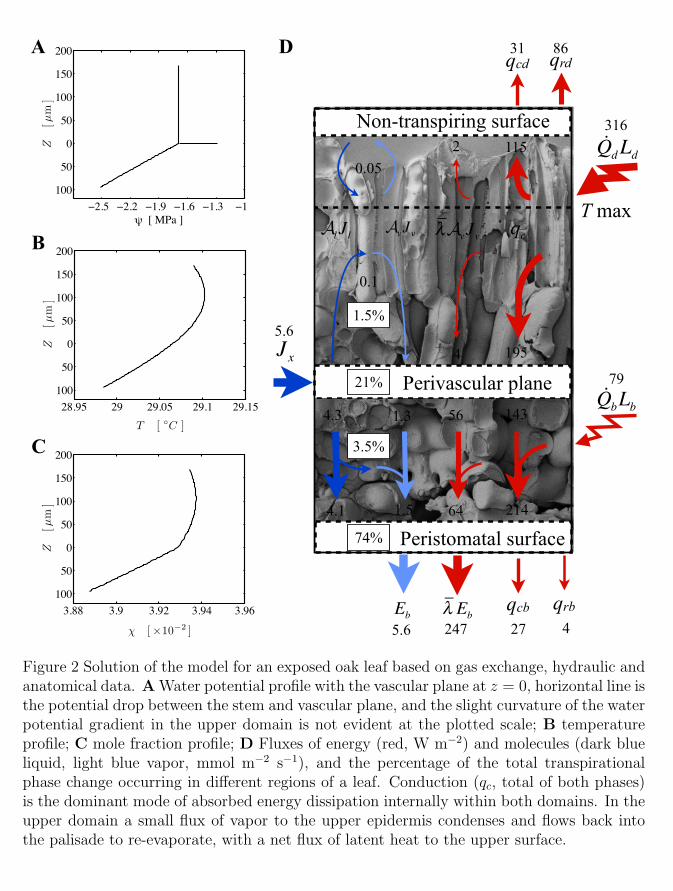
ï2.5 ï2.2 ï1.9 ï1.6 ï1.3 ï1
200
150
100
50
0
50
100
Z[µ
m]
s [ MPa ]
28.95 29 29.05 29.1 29.15
200
150
100
50
0
50
100
Z[µ
m]
T [ �C ]
3.88 3.9 3.92 3.94 3.96
200
150
100
50
0
50
100
Z[µ
m]
� [⇥10�2 ]
A
B
C
D
Peristomatal surface
λ Eb
Non-transpiring surface
Perivascular plane
λAvJv Al Jl
1.5%
21%
3.5%
74%
247
T max
QbLb79
QdLd316
qc
qcb qrb27 4
qcd qrd31 86
AvJv
Eb5.6
Jx5.6
4.3
4.1 1.5
1.3
0.1
0.05
56 143
64 214
2 115
4 195
Figure 2 Solution of the model for an exposed oak leaf based on gas exchange, hydraulic andanatomical data. A Water potential profile with the vascular plane at z = 0, horizontal line isthe potential drop between the stem and vascular plane, and the slight curvature of the waterpotential gradient in the upper domain is not evident at the plotted scale; B temperatureprofile; C mole fraction profile; D Fluxes of energy (red, W m�2) and molecules (dark blueliquid, light blue vapor, mmol m�2 s�1), and the percentage of the total transpirationalphase change occurring in di↵erent regions of a leaf. Conduction (q
c
, total of both phases)is the dominant mode of absorbed energy dissipation internally within both domains. In theupper domain a small flux of vapor to the upper epidermis condenses and flows back intothe palisade to re-evaporate, with a net flux of latent heat to the upper surface.
2 www.plantphysiol.orgon August 25, 2018 - Published by Downloaded from
Copyright © 2014 American Society of Plant Biologists. All rights reserved.

ï1 ï0.8 ï0.6 ï0.4 ï0.2
200150100500
50100150200
Z[µ
m]
s [ MPa ]
A
25.25 25.3 25.35 25.4 25.45
20015010050050100150200
Z[µ
m]
T [ �C ]
3.16 3.17 3.18 3.19 3.2
20015010050050100150200
Z[µ
m]
� [⇥10�2 ]
SR=160SR=200
B
C
Peristomatal
E
6%
16%
λ Eb99
Eb
2.3qrbqcb
24 4
qrd5
582 gsb
T max
QbLb20
QdLd180
SR = 200
Peristomatal22%
Perivascular45%
Jx3.2
6%
0.9Ed172
gsd
5%
Peristomatal
D
4%
4%
20%
λ Eb
λAvJv
94Eb
2.1
qc
qrbqcb9 2
qrd2
536 gsb
T max
QbLb16
QdLd144
SR = 160
Peristomatal24%
Perivascular42%
Jx3
6%
390.9λ EdEd172
gsd
1.80.5
AvJv Al Jl
1.60.7
1.1 0.2
0.2
qcd2939
λ Ed
λAvJv qc
8 65
8 99
70 37
77 50
AvJv Al Jl
1.0 0.1 6 83
7
qcd14
480.16
1.50.6
1.40.7 62 27
67 38
Figure 3 Model results for a sunflower leaf illuminated by a cold mirror (SR = 160 W m�2,solid lines), and full mirror (SR = 200 W m�2, dashed lines), as in the experiments ofPieruschka et al. (2010). A Water potential profile through the leaf thickness (upper =adaxial, lower = abaxial) with the vascular plane at z = 0, horizontal line is the potentialdrop between the stem and vascular plane; B temperature profile; C mole fraction profile;D, E Fluxes of energy (red, W m�2) and molecules (dark blue liquid, light blue vapor,mmol m�2 s�1), and the percentage of the total transpirational phase change occurring indi↵erent regions of a leaf, under illumination by a cold mirror (SR = 160, D), or full mirror(SR = 200, E). Under the higher thermal load, an increase in internal temperature gradientsshifts more of the water flux from liquid to vapor.
3 www.plantphysiol.orgon August 25, 2018 - Published by Downloaded from
Copyright © 2014 American Society of Plant Biologists. All rights reserved.

ï1.2 ï1.1 ï1 ï0.9 ï0.8
200
150
100
50
0
50
100
Z[µ
m]
s [ MPa ]
29.80 29.87 29.93 30.00
200
150
100
50
0
50
100
Z[µ
m]
T [ �C ]
31.40 31.47 31.53 31.60200
150
100
50
0
50
100
4.12 4.14 4.16 4.18
200
150
100
50
0
50
100
Z[µ
m]
� [⇥10�2 ]
4.51 4.53 4.55 4.57200
150
100
50
0
50
100
A
B
C
D
λ Eb108
Eb
2.47
QbLb59
QdLd236
Jx
qrbqcb61 9
qcd qrd64 54
337 gsb
Non-transpiring surface
Perivascular
Al Jl
E
79%
Peristomatal-8%
λ Eb
λAvJv
156
AvJv
Eb
3.6
qc
11%
qrbqcb125 19
qcd qrd131 64
336 gsb
Jx3.6
T max
QbLb99
QdLd396
SR = 295 SR = 495 SR=295
SR=495
Non-transpiring surface
Perivascular
Al Jl
74%
Peristomatal2%
λAvJv AvJv qc
8%
T max
16% 18%0.4
168 132
139 62
3.90.3
3.2
0.38
16 185
17916
0.36
106 72
89 30
2.420.05
2.03
0.21
9 110
1089
0.21
2.47
0.44
Figure 4 The shift at higher short wave radiation loads to a condensing state at the lowerepidermis in an oak-like leaf with an air fraction of 0.434; for plots A,B,C solid lines arefor the low load SR=295 W m�2, dotted lines the high load SR=495 (scale on the upper xaxes in B,C); A Water potential profile through the leaf thickness (upper = adaxial, lower= abaxial) with the vascular plane at z = 0, horizontal line is the potential drop betweenthe stem and vascular plane; B temperature profile; C mole fraction profile; D,E Fluxes ofenergy (red, W m�2) and molecules (dark blue liquid, light blue vapor, mmol m�2 s�1), andthe percentage of the total transpirational phase change occurring in di↵erent regions of aleaf under a low short wave load (SR= 295, D), and a high load (SR=495, E). The highload pushes the internal face of the lower epidermis into a condensing state (the internalevaporative flux exceeds transpiration), such that there is a small liquid flux back into thespongy mesophyll where it re-evaporates.
4 www.plantphysiol.orgon August 25, 2018 - Published by Downloaded from
Copyright © 2014 American Society of Plant Biologists. All rights reserved.

ï0.3 ï0.2 ï0.1 0
200
150
100
50
0
50
100
Z[µ
m]
s [ MPa ]
27.81 27.87 27.94 28.00
200
150
100
50
0
50
100
Z[µ
m]
T [ �C ]
28.03 28.09 28.16 28.22200
150
100
50
0
50
100
3.69 3.71 3.72 3.74
200
150
100
50
0
50
100
Z[µ
m]
� [⇥10�2 ]
3.74 3.76 3.77 3.79200
150
100
50
0
50
100
A
B
C
Peristomatal
Non-transpiring surface
Perivascular
D
3%
36%
60%
λ Eb43
Eb
1
T max
QbLb2
QdLd9
Jx1
Al Jl λAvJv AvJv qc
qrbqcb-20 -3
qcd qrd-19 10
50 gsb
Peristomatal
Non-transpiring surface
Perivascular
Al Jl
E
13%
56%
11%
λ Eb
λAvJv
101
AvJv
Eb
2.3
qc
qrbqcb151 22
qcd qrd156 36
100 gsb
Jx2.3
T max
QbLb93
QdLd373
20%
Kleaf = 11
SR = 12
Kleaf = 16.8
SR = 466
1%
SR=12
SR=466
PPFD = 2000 PPFD = 50
2.00.3 90 184
0.3
13 168
1.60.7 69 112
13 179
0.40.6 17 3
1 17
0.390.61 16.5 1.5
0.3
0.03
Figure 5 Distribution of evaporation for a simulated low light (PPFD= 50 µmol m�2 s�1)evaporative flux experiment on an oak-like leaf but with an air fraction of 0.34; for plotsA,B,C solid lines are for the low load SR=295 W m�2, dotted lines the high load SR=495(scale on the upper x axes in B,C); A Water potential profile through the leaf thickness(upper = adaxial, lower = abaxial) with the vascular plane at z = 0, horizontal line isthe potential drop between the stem and vascular plane; B temperature profile; C molefraction profile; D, E Fluxes of energy (red, W m�2) and molecules (dark blue liquid, lightblue vapor, mmol m�2 s�1), and the percentage of the total transpirational phase changeoccurring in di↵erent regions of a leaf under two di↵erent energy regimes, driven by low (D)and high (E) light levels (PPFD, µmol m�2 s�1). The transition from a dominant surfaceload of sensible heat at low light to a dominant short wave load at high light results in alarge change in apparent leaf conductance, K
leaf
(mmol m�2 MPa�1 s�1).
5 www.plantphysiol.orgon August 25, 2018 - Published by Downloaded from
Copyright © 2014 American Society of Plant Biologists. All rights reserved.