manufacturing industry: financial, 2014 · statistics south africa i manufacturing industry:...
TRANSCRIPT
Manufacturing industry: Financial, 2014
Embargoed until: 26 September 2016
11:30
Statistics South Africa
PJ Lehohla
Statistician-General Report No. 30-02-03 (2014)
Statistics South Africa i
Manufacturing industry: Financial, Report No. 30-02-03 (2014)
Manufacturing industry: Financial, 2014/ Statistics South Africa
Published by Statistics South Africa, Private Bag X44, Pretoria 0001
© Statistics South Africa, 2016 Users may apply or process this data, provided Statistics South Africa (Stats SA) is acknowledged as the original source of the data; that it is specified that the application and/or analysis is the result of the user's independent processing of the data; and that neither the basic data nor any reprocessed version or application thereof may be sold or offered for sale in any form whatsoever without prior permission from Stats SA. Stats SA Library Cataloguing-in-Publication (CIP) Data Manufacturing industry: Financial, 2014 / Statistics South Africa, Pretoria: Statistics South Africa, 2016
[Report No. 30-02-03 (2014)] 79pp
ISBN: 978-0-621-44936-5
A complete set of Stats SA publications is available at Stats SA Library and the following libraries:
National Library of South Africa, Pretoria Division National Library of South Africa, Cape Town Division Library of Parliament, Cape Town Bloemfontein Public Library Natal Society Library, Pietermaritzburg Johannesburg Public Library Eastern Cape Library Services, King William’s Town Central Regional Library, Polokwane Central Reference Library, Mbombela Central Reference Collection, Kimberley Central Reference Library, Mmabatho
This report is available on the Stats SA website: www.statssa.gov.za Copies are obtainable from: Printing and Distribution, Statistics South Africa Tel: (012) 310 8093 (012) 310 8044 Email: [email protected] [email protected]
Technical enquiries: Stanley Mashego: (012) 337 6252 ([email protected]) Mosa Tshekedi: (012) 310 4777 ([email protected])
Statistics South Africa ii
Manufacturing industry: Financial, Report No. 30-02-03 (2014)
Table of contents
1. Introduction ........................................................................................................................................................................................................................................................................... 1
1.1 Scope and coverage ............................................................................................................................................................................................................................................................. 1
1.2 Data items ............................................................................................................................................................................................................................................................................. 1
1.3 Reference period................................................................................................................................................................................................................................................................... 2
1.4 Current prices ....................................................................................................................................................................................................................................................................... 2
1.5 Reliability of data ................................................................................................................................................................................................................................................................... 2
1.6 Confidentiality ....................................................................................................................................................................................................................................................................... 2
2. Summary of findings for the year 2014 .................................................................................................................................................................................................................................. 3
2.1. Income ................................................................................................................................................................................................................................................................................... 3
Table A – Income in the manufacturing industry, 2001 – 2014 ......................................................................................................................................................................................................... 3
Table B – Concentration ratios for total income in the manufacturing industry, 2005 – 2014 ........................................................................................................................................................... 4
Table C – Profit margin in the manufacturing industry, 2005 – 2014 ................................................................................................................................................................................................ 5
2.2. Employment ........................................................................................................................................................................................................................................................................... 6
Table D – Employment as at the end of June in the manufacturing industry, 2005 – 2014 .............................................................................................................................................................. 6
Figure 1 – Income and employment by division (% contribution) in the manufacturing industry, 2014 ............................................................................................................................................. 7
Figure 2 – Income and employment by enterprise size (% contribution) in the manufacturing industry, 2014 .................................................................................................................................. 8
Table E – Average salaries and wages in the manufacturing industry, 2005 – 2014 ....................................................................................................................................................................... 9
2.3. Manufacturing industry value added .................................................................................................................................................................................................................................... 10
Figure 3 – Manufacturing value added, annual percentage change (constant 2010 prices), 2005 – 2014 .................................................................................................................................... 10
Figure 4 – Percentage contribution of manufacturing to total value added (current prices), 2005 – 2014 ..................................................................................................................................... 10
2.4. Capital expenditure on new assets ...................................................................................................................................................................................................................................... 11
Table F – Capital expenditure on new assets in the manufacturing industry, 2005 – 2014 ........................................................................................................................................................... 11
2.5. Selected provincial statistics ................................................................................................................................................................................................................................................ 12
Table G – Key statistics by province in the manufacturing industry, 2014 ..................................................................................................................................................................................... 12
Table H – Key statistics by district/metro in the manufacturing industry, 2014 .............................................................................................................................................................................. 13
3. Tables .................................................................................................................................................................................................................................................................................. 14
Table 1 − Principal statistics in the manufacturing industry, 2011 and 2014 ................................................................................................................................................................................... 14
Table 2 – Principal statistics by division in the manufacturing industry, 2011 and 2014 ................................................................................................................................................................. 15
Table 3 – Principal statistics in the manufacturing industry, 2014 ................................................................................................................................................................................................... 17
Table 4 – Profit margin in the manufacturing industry, 2011 and 2014 ........................................................................................................................................................................................... 22
Statistics South Africa iii
Manufacturing industry: Financial, Report No. 30-02-03 (2014)
Table 5 – Profit margin in the manufacturing industry, 2014 ........................................................................................................................................................................................................... 23
Table 6 – Income in the manufacturing industry, 2011 and 2014 ................................................................................................................................................................................................... 27
Table 7 – Income in the manufacturing industry, 2014 ................................................................................................................................................................................................................... 28
Table 8 − Income by enterprise size in the manufacturing industry, 2014 ...................................................................................................................................................................................... 32
Table 9 – Concentration ratios for total income in the manufacturing industry, 2014 ...................................................................................................................................................................... 33
Table 10 – Expenditure in the manufacturing industry, 2011 and 2014 .......................................................................................................................................................................................... 38
Table 11 – Expenditure in the manufacturing industry, 2014 .......................................................................................................................................................................................................... 39
Table 12 – Purchases in the manufacturing industry, 2011 and 2014 ............................................................................................................................................................................................ 42
Table 13 – Purchases in the manufacturing industry, 2014 ............................................................................................................................................................................................................ 43
Table 14 – Details of capital expenditure on new assets in the manufacturing industry, 2011 and 2014 ....................................................................................................................................... 47
Table 15 – Details of capital expenditure on new assets in the manufacturing industry, 2014 ....................................................................................................................................................... 48
Table 16 – Employment in the manufacturing industry as at the end of June, 2011 and 2014 ....................................................................................................................................................... 52
Table 17 – Employment in the manufacturing industry as at the end of June 2014 ........................................................................................................................................................................ 53
Table 18 − Employment by enterprise size in the manufacturing industry as at the end of June 2014 ........................................................................................................................................... 58
Table 19 – Imports and exports in the manufacturing industry, 2011 and 2014.............................................................................................................................................................................. 59
Table 20 – Key statistics by province in the manufacturing industry, 2014 ..................................................................................................................................................................................... 60
Table 21 – Sales of goods and services by province and major economic activity in the manufacturing industry, 2014 ................................................................................................................ 61
Table 22 – Salaries and wages by province and major economic activity in the manufacturing industry, 2014.............................................................................................................................. 62
Table 23 – Employment by province and major economic activity in the manufacturing industry, 2014 ......................................................................................................................................... 63
Table 24 – Key statistics by district in the manufacturing industry, 2014 ........................................................................................................................................................................................ 64
Table 25 – Information and communication technology usage in the manufacturing industry, 2014 .............................................................................................................................................. 66
Table 26 – Information and communication technology usage by enterprise size in the manufacturing industry, 2014 ................................................................................................................. 66
Explanatory notes .......................................................................................................................................................................................................................................................................... 67
Table 27 – Size groups for the manufacturing industry, 2014 ......................................................................................................................................................................................................... 67
Table 28 – Confidence intervals (95%) for income in the manufacturing industry, 2014 ................................................................................................................................................................ 68
Glossary......................................................................................................................................................................................................................................................................................... 73
Statistics South Africa 1
Manufacturing industry: Financial, Report No. 30-02-03 (2014)
1. Introduction
This publication updates Statistical release P3002, Manufacturing industry, 2014, and provides details at the 4-digit SIC (Standard Industrial Classification of all Economic Activities (SIC), Fifth edition, Report No, 09-09-02). Details of the values and quantities of manufactured products sold and further details of purchases are published separately in Manufacturing industry: Production, 2014, Report No, 30-02-04. The estimates presented here are derived from the results of the 2014 manufacturing large sample survey (LSS).
The previous manufacturing LSS was conducted in 2011 (Statistical release P3002 Manufacturing industry, 2011 and Reports No. 30-02-03 (2011) and 30-02-04 (2011)). 1.1 Scope and coverage
This survey covers enterprises registered for value-added tax (VAT) in the taxation system that are engaged mainly in manufacturing. It includes the following divisions within its scope:
(i) Manufacture of food products and beverages (SIC 30). (ii) Manufacture of textiles, clothing, leather and footwear (SIC 31). (iii) Manufacture of wood and wood products, paper, publishing and printing (SIC 32). (iv) Manufacture of coke, petroleum, chemical products, rubber and plastic (SIC 33). (v) Manufacture of glass and other non-metallic mineral products (SIC 34). (vi) Manufacture of basic metals, metal products, machinery and equipment (SIC 35). (vii) Manufacture of electrical machinery and equipment (SIC 36). (viii) Manufacture of telecommunication and professional equipment (SIC 37). (ix) Manufacture of transport equipment (SIC 38). (x) Manufacture of furniture and other manufacturing (including tobacco and recycling) (SIC 39).
Including
The South Africa-based activities of enterprises which operate in multiple countries. Excluding
Activities of South Africa-based companies in other countries. 1.2 Data items
The following categories of data items were collected: industrial classification, imports and exports, details of employment, income, expenditure, profit or loss, inventories, carrying value of assets.
Statistics South Africa 2
Manufacturing industry: Financial, Report No. 30-02-03 (2014)
1.3 Reference period
The questionnaires were completed for the financial year of the enterprise which ends on any date between 1 July 2013 and 30 June 2014, according to the usual reporting schedule of the enterprise. Example
1 October 2012 – 30 September 2013
1 January 2013 – 31 December 2013
1 February 2013 – 31 January 2014
1 March 2013 – 28 February 2014
1 April 2013 – 31 March 2014 1.4 Current prices
The rand values are at current prices. 1.5 Reliability of data
All estimates compiled for this industry are subject to both sampling and non-sampling errors. The estimates are subject to sampling variability since they are based on information obtained from a sample. They may therefore differ from the figures that would have been produced if the data had been obtained from all enterprises in the manufacturing industry in South Africa. The standard error (SE) indicates the extent to which an estimate might have varied by chance, because only a sample of enterprises was used. The relative standard error (RSE) (the standard error expressed as a percentage of the estimate) provides an indication of the percentage error likely to have occurred due to sampling, and thus avoids the need to refer to the size of the estimate. The larger the RSE, the less reliable the estimate is.
The following are some of the likely sources of non-sampling errors: sampling frame not up to date, wrong definitions and classification, phrasing of questions, non-response, processing and estimation. Every effort is made to minimise non-sampling errors by careful design of questionnaires, testing them with a sample of respondents, editing reported data and implementing efficient operating procedures. Non-sampling errors occur in both sample surveys and censuses. 1.6 Confidentiality
According to Section 17 of the Statistics Act, 1999 (Act No, 6 of 1999), completed questionnaires remain confidential to Statistics South Africa (Stats SA). Individual business information is never disclosed. Results are presented in aggregated form only.
Statistics South Africa 3
Manufacturing industry: Financial, Report No. 30-02-03 (2014)
2. Summary of findings for the year 2014
2.1. Income
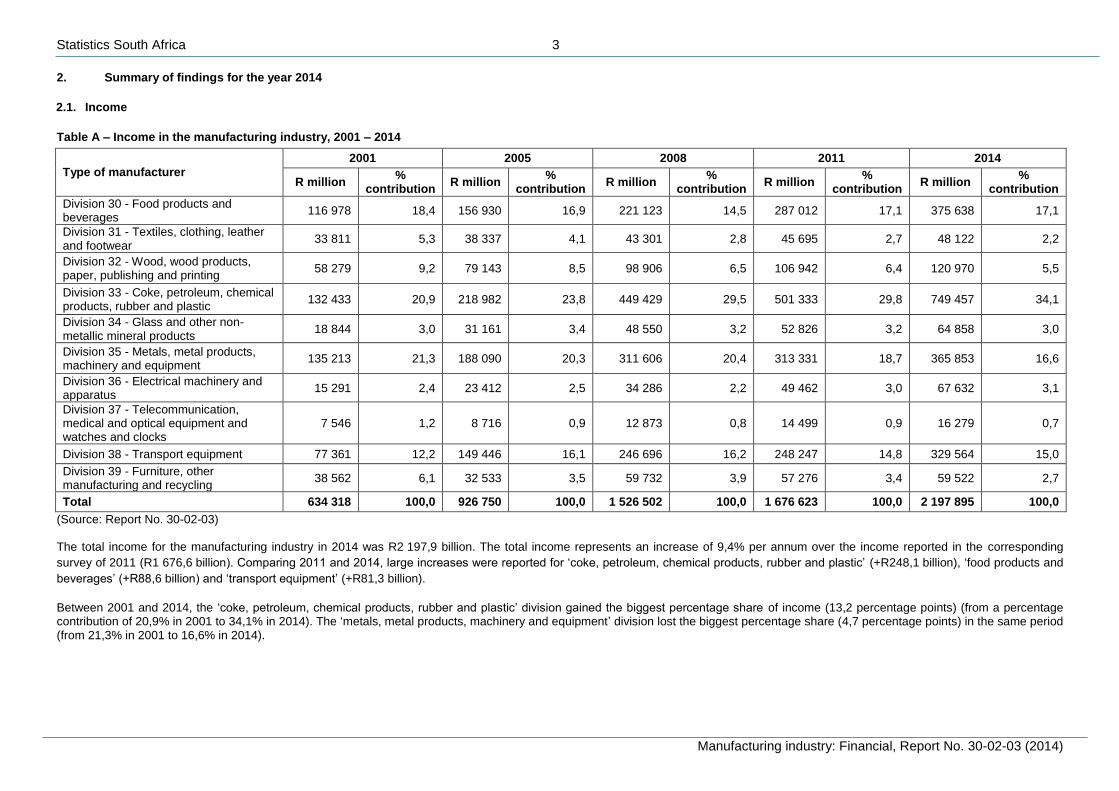
Table A – Income in the manufacturing industry, 2001 – 2014
Type of manufacturer
2001 2005 2008 2011 2014
R million %
contribution R million
% contribution
R million %
contribution R million
% contribution
R million %
contribution
Division 30 - Food products and beverages
116 978 18,4 156 930 16,9 221 123 14,5 287 012 17,1 375 638 17,1
Division 31 - Textiles, clothing, leather and footwear
33 811 5,3 38 337 4,1 43 301 2,8 45 695 2,7 48 122 2,2
Division 32 - Wood, wood products, paper, publishing and printing
58 279 9,2 79 143 8,5 98 906 6,5 106 942 6,4 120 970 5,5
Division 33 - Coke, petroleum, chemical products, rubber and plastic
132 433 20,9 218 982 23,8 449 429 29,5 501 333 29,8 749 457 34,1
Division 34 - Glass and other non-metallic mineral products
18 844 3,0 31 161 3,4 48 550 3,2 52 826 3,2 64 858 3,0
Division 35 - Metals, metal products, machinery and equipment
135 213 21,3 188 090 20,3 311 606 20,4 313 331 18,7 365 853 16,6
Division 36 - Electrical machinery and apparatus
15 291 2,4 23 412 2,5 34 286 2,2 49 462 3,0 67 632 3,1
Division 37 - Telecommunication, medical and optical equipment and watches and clocks
7 546 1,2 8 716 0,9 12 873 0,8 14 499 0,9 16 279 0,7
Division 38 - Transport equipment 77 361 12,2 149 446 16,1 246 696 16,2 248 247 14,8 329 564 15,0
Division 39 - Furniture, other manufacturing and recycling
38 562 6,1 32 533 3,5 59 732 3,9 57 276 3,4 59 522 2,7
Total 634 318 100,0 926 750 100,0 1 526 502 100,0 1 676 623 100,0 2 197 895 100,0
(Source: Report No. 30-02-03) The total income for the manufacturing industry in 2014 was R2 197,9 billion. The total income represents an increase of 9,4% per annum over the income reported in the corresponding
survey of 2011 (R1 676,6 billion). Comparing 2011 and 2014, large increases were reported for ‘coke, petroleum, chemical products, rubber and plastic’ (+R248,1 billion), ‘food products and
beverages’ (+R88,6 billion) and ‘transport equipment’ (+R81,3 billion).
Between 2001 and 2014, the ‘coke, petroleum, chemical products, rubber and plastic’ division gained the biggest percentage share of income (13,2 percentage points) (from a percentage contribution of 20,9% in 2001 to 34,1% in 2014). The ‘metals, metal products, machinery and equipment’ division lost the biggest percentage share (4,7 percentage points) in the same period (from 21,3% in 2001 to 16,6% in 2014).
Statistics South Africa 4
Manufacturing industry: Financial, Report No. 30-02-03 (2014)
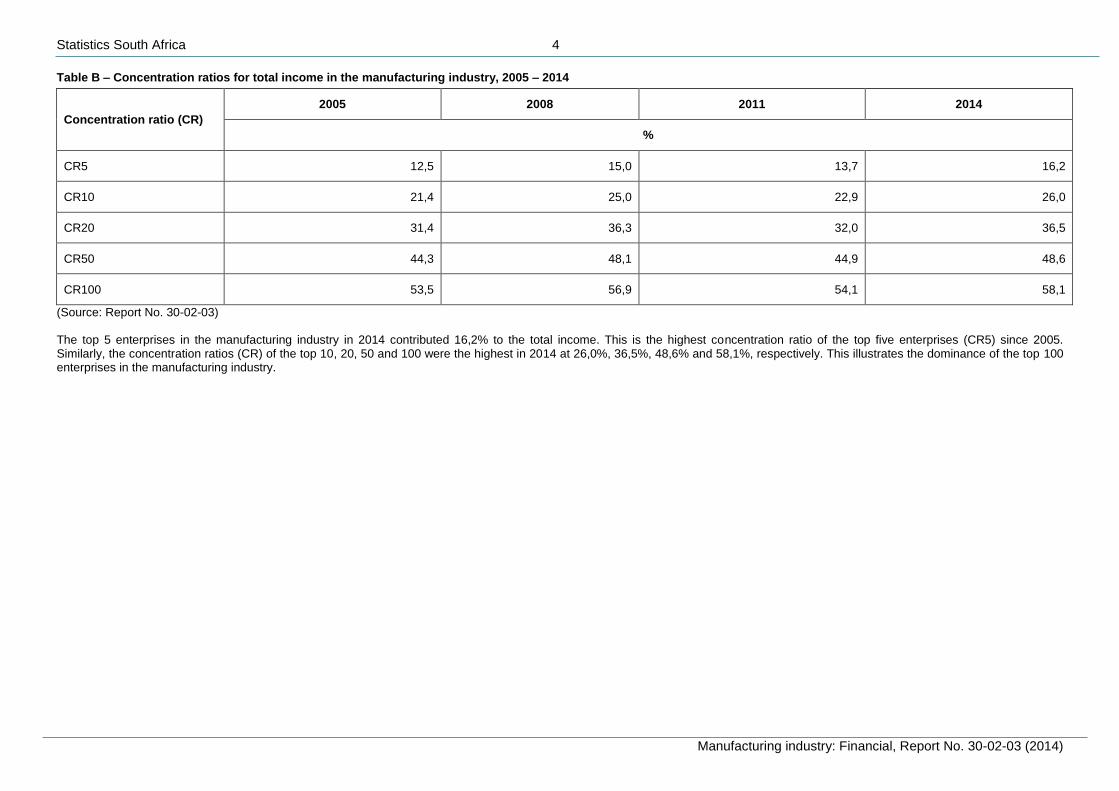
Table B – Concentration ratios for total income in the manufacturing industry, 2005 – 2014
Concentration ratio (CR)
2005 2008 2011 2014
%
CR5 12,5 15,0 13,7 16,2
CR10 21,4 25,0 22,9 26,0
CR20 31,4 36,3 32,0 36,5
CR50 44,3 48,1 44,9 48,6
CR100 53,5 56,9 54,1 58,1
(Source: Report No. 30-02-03)
The top 5 enterprises in the manufacturing industry in 2014 contributed 16,2% to the total income. This is the highest concentration ratio of the top five enterprises (CR5) since 2005. Similarly, the concentration ratios (CR) of the top 10, 20, 50 and 100 were the highest in 2014 at 26,0%, 36,5%, 48,6% and 58,1%, respectively. This illustrates the dominance of the top 100 enterprises in the manufacturing industry.
Statistics South Africa 5
Manufacturing industry: Financial, Report No. 30-02-03 (2014)
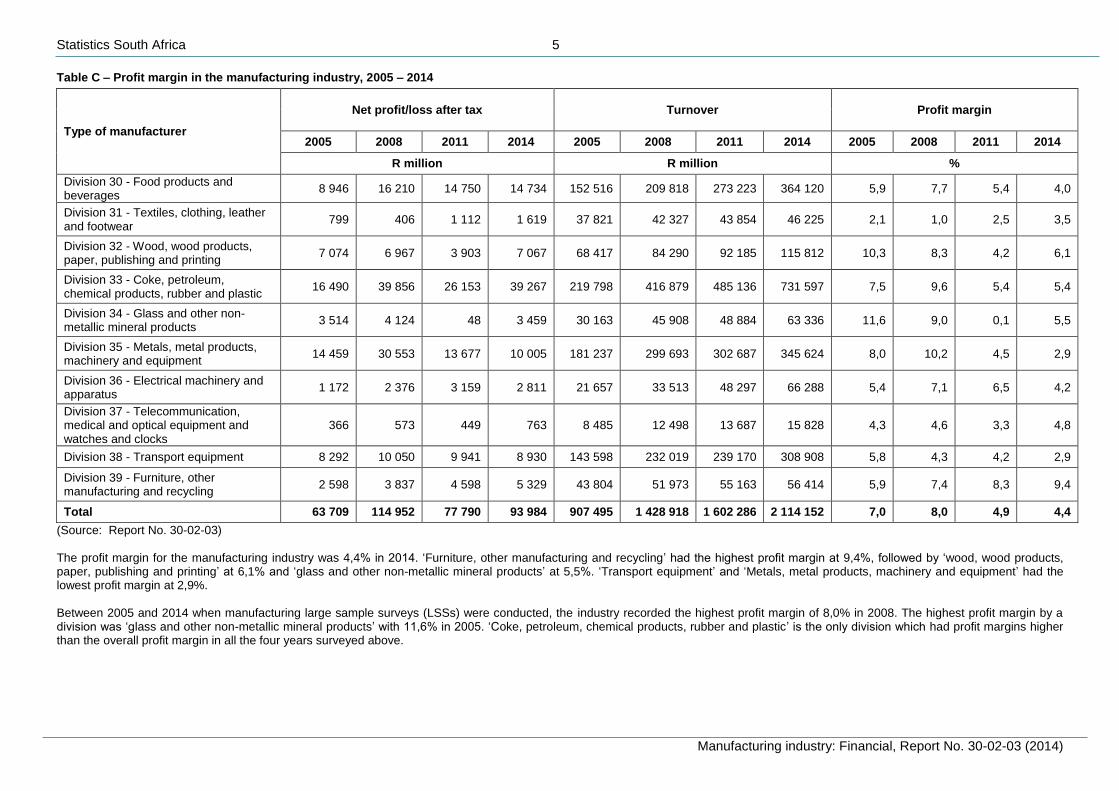
Table C – Profit margin in the manufacturing industry, 2005 – 2014
Type of manufacturer
Net profit/loss after tax Turnover Profit margin
2005 2008 2011 2014 2005 2008 2011 2014 2005 2008 2011 2014
R million R million %
Division 30 - Food products and beverages
8 946 16 210 14 750 14 734 152 516 209 818 273 223 364 120 5,9 7,7 5,4 4,0
Division 31 - Textiles, clothing, leather and footwear
799 406 1 112 1 619 37 821 42 327 43 854 46 225 2,1 1,0 2,5 3,5
Division 32 - Wood, wood products, paper, publishing and printing
7 074 6 967 3 903 7 067 68 417 84 290 92 185 115 812 10,3 8,3 4,2 6,1
Division 33 - Coke, petroleum, chemical products, rubber and plastic
16 490 39 856 26 153 39 267 219 798 416 879 485 136 731 597 7,5 9,6 5,4 5,4
Division 34 - Glass and other non-metallic mineral products
3 514 4 124 48 3 459 30 163 45 908 48 884 63 336 11,6 9,0 0,1 5,5
Division 35 - Metals, metal products, machinery and equipment
14 459 30 553 13 677 10 005 181 237 299 693 302 687 345 624 8,0 10,2 4,5 2,9
Division 36 - Electrical machinery and apparatus
1 172 2 376 3 159 2 811 21 657 33 513 48 297 66 288 5,4 7,1 6,5 4,2
Division 37 - Telecommunication, medical and optical equipment and watches and clocks
366 573 449 763 8 485 12 498 13 687 15 828 4,3 4,6 3,3 4,8
Division 38 - Transport equipment 8 292 10 050 9 941 8 930 143 598 232 019 239 170 308 908 5,8 4,3 4,2 2,9
Division 39 - Furniture, other manufacturing and recycling
2 598 3 837 4 598 5 329 43 804 51 973 55 163 56 414 5,9 7,4 8,3 9,4
Total 63 709 114 952 77 790 93 984 907 495 1 428 918 1 602 286 2 114 152 7,0 8,0 4,9 4,4
(Source: Report No. 30-02-03)
The profit margin for the manufacturing industry was 4,4% in 2014. ‘Furniture, other manufacturing and recycling’ had the highest profit margin at 9,4%, followed by ‘wood, wood products, paper, publishing and printing’ at 6,1% and ‘glass and other non-metallic mineral products’ at 5,5%. ‘Transport equipment’ and ‘Metals, metal products, machinery and equipment’ had the lowest profit margin at 2,9%. Between 2005 and 2014 when manufacturing large sample surveys (LSSs) were conducted, the industry recorded the highest profit margin of 8,0% in 2008. The highest profit margin by a division was ‘glass and other non-metallic mineral products’ with 11,6% in 2005. ‘Coke, petroleum, chemical products, rubber and plastic’ is the only division which had profit margins higher than the overall profit margin in all the four years surveyed above.
Statistics South Africa 6
Manufacturing industry: Financial, Report No. 30-02-03 (2014)
2.2. Employment
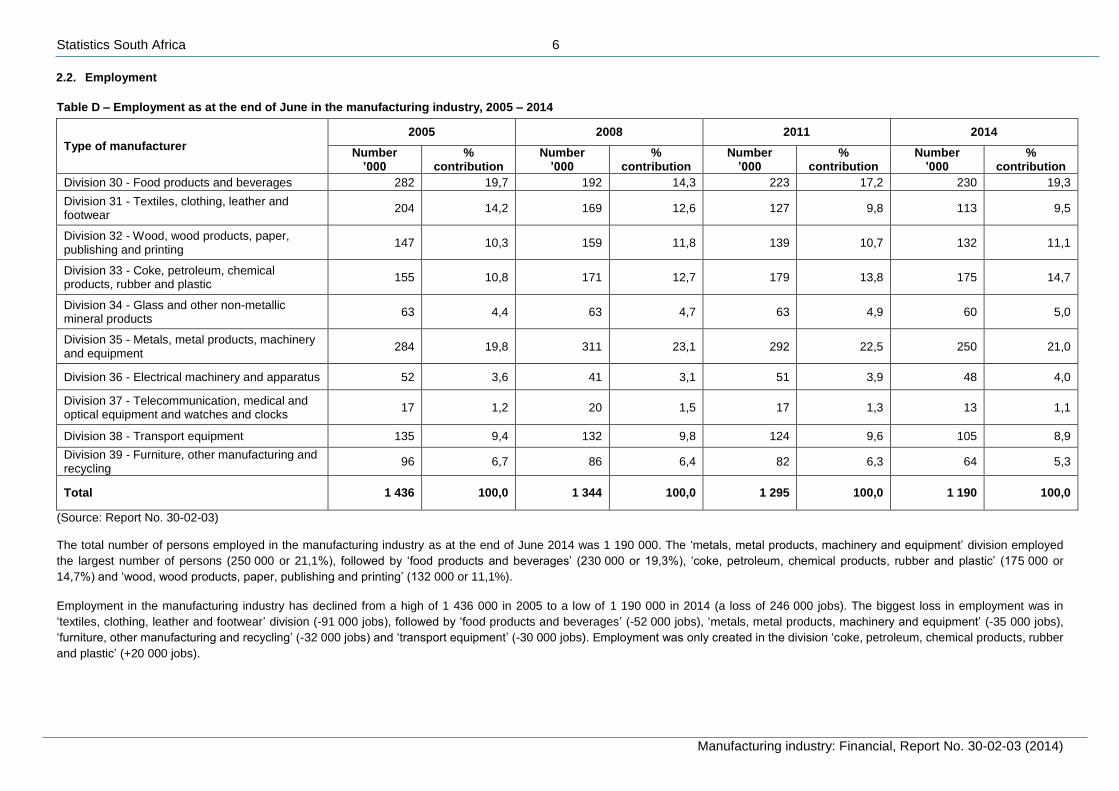
Table D – Employment as at the end of June in the manufacturing industry, 2005 – 2014
Type of manufacturer
2005 2008 2011 2014
Number ’000
% contribution
Number ’000
% contribution
Number ’000
% contribution
Number ’000
% contribution
Division 30 - Food products and beverages 282 19,7 192 14,3 223 17,2 230 19,3
Division 31 - Textiles, clothing, leather and footwear
204 14,2 169 12,6 127 9,8 113 9,5
Division 32 - Wood, wood products, paper, publishing and printing
147 10,3 159 11,8 139 10,7 132 11,1
Division 33 - Coke, petroleum, chemical products, rubber and plastic
155 10,8 171 12,7 179 13,8 175 14,7
Division 34 - Glass and other non-metallic mineral products
63 4,4 63 4,7 63 4,9 60 5,0
Division 35 - Metals, metal products, machinery and equipment
284 19,8 311 23,1 292 22,5 250 21,0
Division 36 - Electrical machinery and apparatus 52 3,6 41 3,1 51 3,9 48 4,0
Division 37 - Telecommunication, medical and optical equipment and watches and clocks
17 1,2 20 1,5 17 1,3 13 1,1
Division 38 - Transport equipment 135 9,4 132 9,8 124 9,6 105 8,9
Division 39 - Furniture, other manufacturing and recycling
96 6,7 86 6,4 82 6,3 64 5,3
Total 1 436 100,0 1 344 100,0 1 295 100,0 1 190 100,0
(Source: Report No. 30-02-03)
The total number of persons employed in the manufacturing industry as at the end of June 2014 was 1 190 000. The ‘metals, metal products, machinery and equipment’ division employed
the largest number of persons (250 000 or 21,1%), followed by ‘food products and beverages’ (230 000 or 19,3%), ‘coke, petroleum, chemical products, rubber and plastic’ (175 000 or
14,7%) and ‘wood, wood products, paper, publishing and printing’ (132 000 or 11,1%).
Employment in the manufacturing industry has declined from a high of 1 436 000 in 2005 to a low of 1 190 000 in 2014 (a loss of 246 000 jobs). The biggest loss in employment was in
‘textiles, clothing, leather and footwear’ division (-91 000 jobs), followed by ‘food products and beverages’ (-52 000 jobs), ‘metals, metal products, machinery and equipment’ (-35 000 jobs),
‘furniture, other manufacturing and recycling’ (-32 000 jobs) and ‘transport equipment’ (-30 000 jobs). Employment was only created in the division ‘coke, petroleum, chemical products, rubber
and plastic’ (+20 000 jobs).
Statistics South Africa 7
Manufacturing industry: Financial, Report No. 30-02-03 (2014)
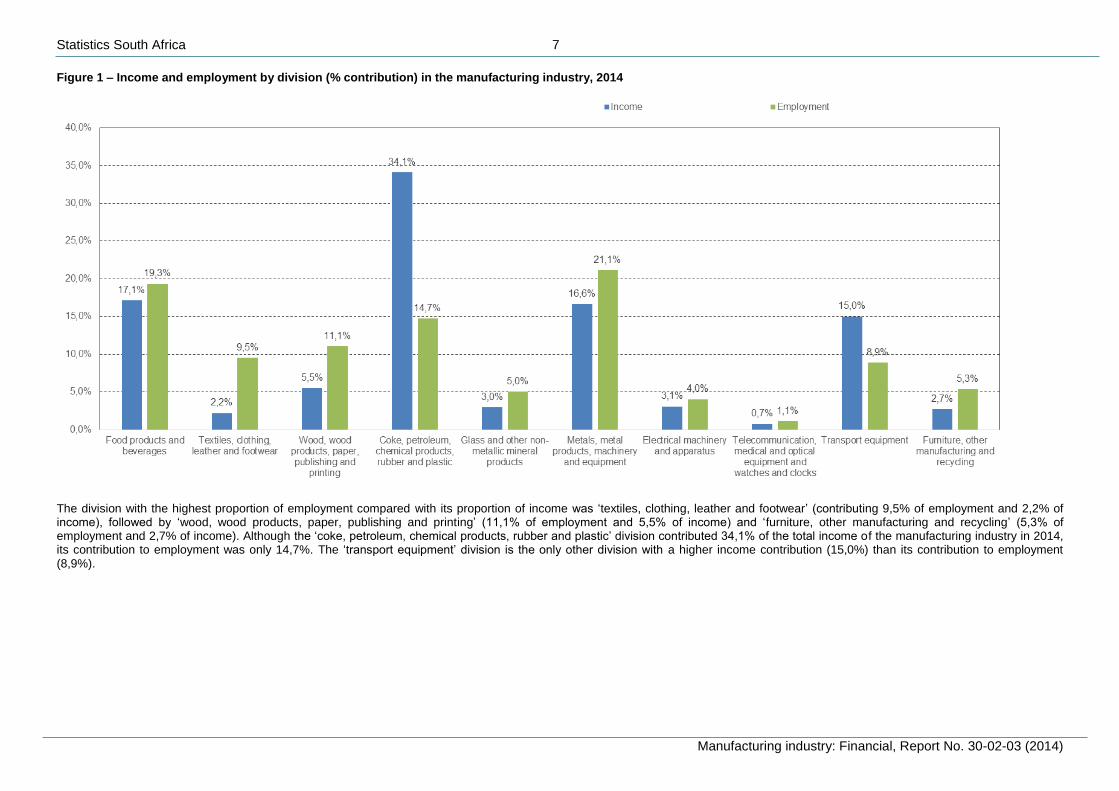
Figure 1 – Income and employment by division (% contribution) in the manufacturing industry, 2014
The division with the highest proportion of employment compared with its proportion of income was ‘textiles, clothing, leather and footwear’ (contributing 9,5% of employment and 2,2% of income), followed by ‘wood, wood products, paper, publishing and printing’ (11,1% of employment and 5,5% of income) and ‘furniture, other manufacturing and recycling’ (5,3% of employment and 2,7% of income). Although the ‘coke, petroleum, chemical products, rubber and plastic’ division contributed 34,1% of the total income of the manufacturing industry in 2014, its contribution to employment was only 14,7%. The ‘transport equipment’ division is the only other division with a higher income contribution (15,0%) than its contribution to employment (8,9%).
Statistics South Africa 8
Manufacturing industry: Financial, Report No. 30-02-03 (2014)
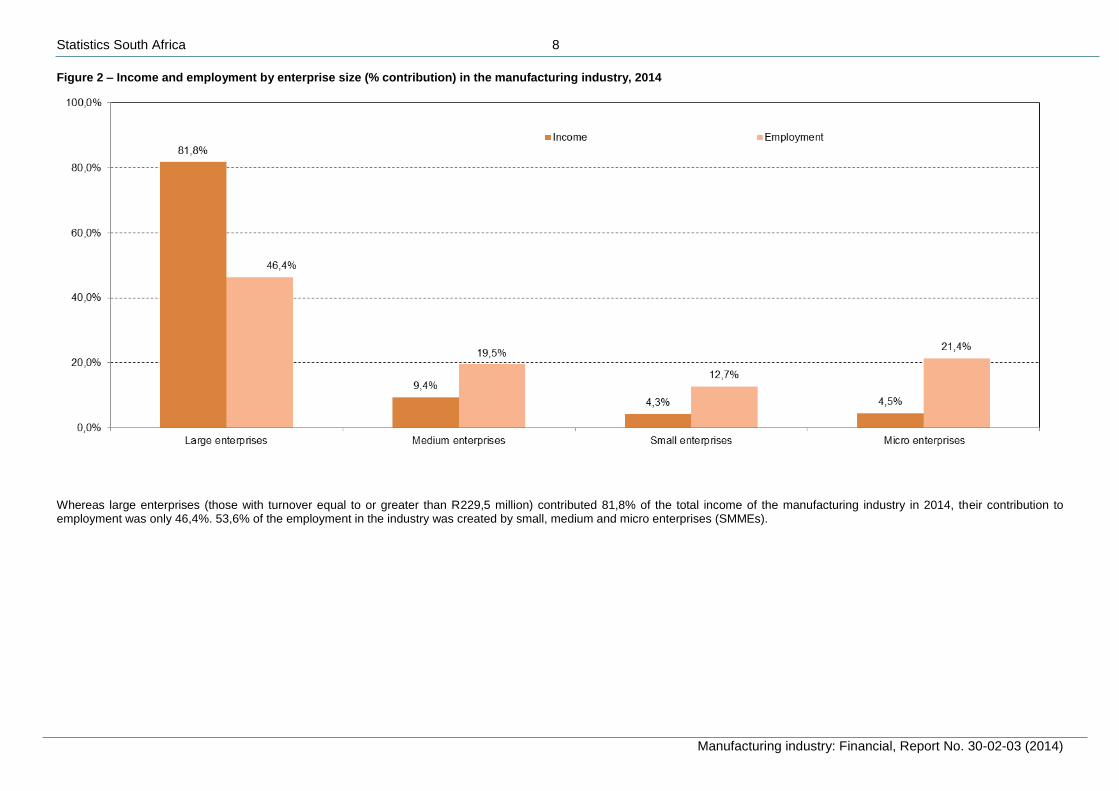
Figure 2 – Income and employment by enterprise size (% contribution) in the manufacturing industry, 2014
Whereas large enterprises (those with turnover equal to or greater than R229,5 million) contributed 81,8% of the total income of the manufacturing industry in 2014, their contribution to employment was only 46,4%. 53,6% of the employment in the industry was created by small, medium and micro enterprises (SMMEs).
Statistics South Africa 9
Manufacturing industry: Financial, Report No. 30-02-03 (2014)
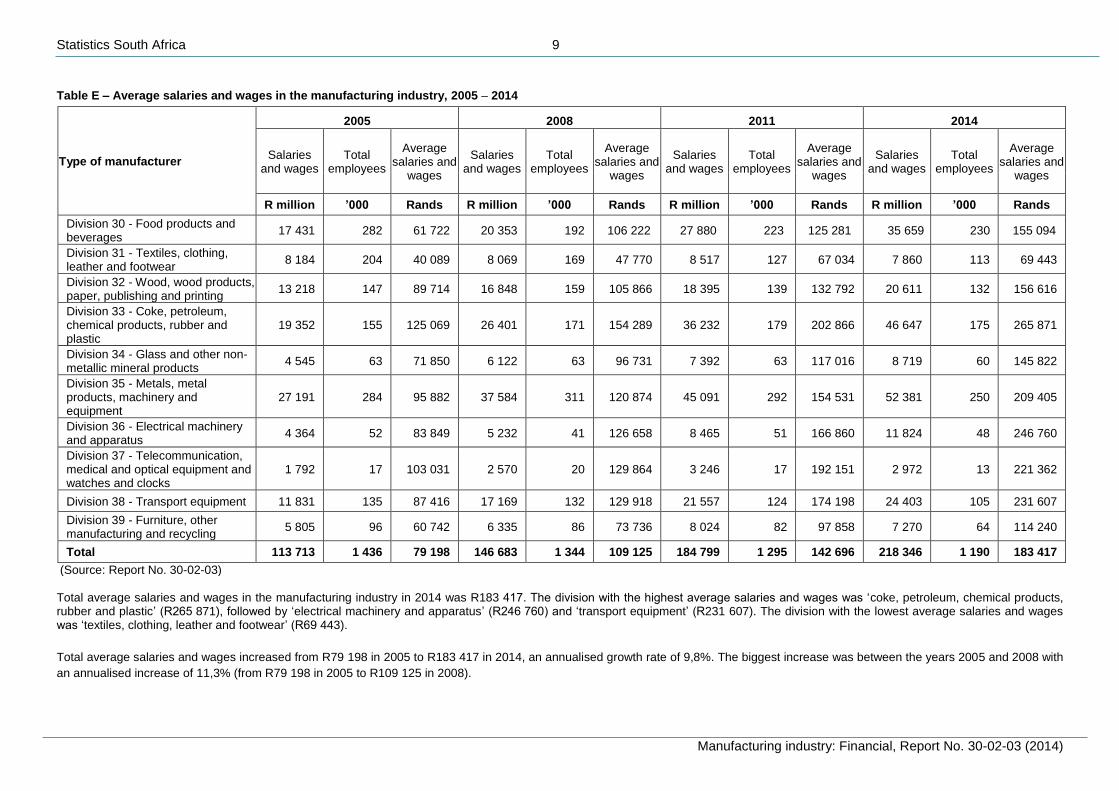
Table E – Average salaries and wages in the manufacturing industry, 2005 – 2014
Type of manufacturer
2005 2008 2011 2014
Salaries and wages
Total employees
Average salaries and
wages
Salaries and wages
Total employees
Average salaries and
wages
Salaries and wages
Total employees
Average salaries and
wages
Salaries and wages
Total employees
Average salaries and
wages
R million ’000 Rands R million ’000 Rands R million ’000 Rands R million ’000 Rands
Division 30 - Food products and beverages
17 431 282 61 722 20 353 192 106 222 27 880 223 125 281 35 659 230 155 094
Division 31 - Textiles, clothing, leather and footwear
8 184 204 40 089 8 069 169 47 770 8 517 127 67 034 7 860 113 69 443
Division 32 - Wood, wood products, paper, publishing and printing
13 218 147 89 714 16 848 159 105 866 18 395 139 132 792 20 611 132 156 616
Division 33 - Coke, petroleum, chemical products, rubber and plastic
19 352 155 125 069 26 401 171 154 289 36 232 179 202 866 46 647 175 265 871
Division 34 - Glass and other non-metallic mineral products
4 545 63 71 850 6 122 63 96 731 7 392 63 117 016 8 719 60 145 822
Division 35 - Metals, metal products, machinery and equipment
27 191 284 95 882 37 584 311 120 874 45 091 292 154 531 52 381 250 209 405
Division 36 - Electrical machinery and apparatus
4 364 52 83 849 5 232 41 126 658 8 465 51 166 860 11 824 48 246 760
Division 37 - Telecommunication, medical and optical equipment and watches and clocks
1 792 17 103 031 2 570 20 129 864 3 246 17 192 151 2 972 13 221 362
Division 38 - Transport equipment 11 831 135 87 416 17 169 132 129 918 21 557 124 174 198 24 403 105 231 607
Division 39 - Furniture, other manufacturing and recycling
5 805 96 60 742 6 335 86 73 736 8 024 82 97 858 7 270 64 114 240
Total 113 713 1 436 79 198 146 683 1 344 109 125 184 799 1 295 142 696 218 346 1 190 183 417
(Source: Report No. 30-02-03) Total average salaries and wages in the manufacturing industry in 2014 was R183 417. The division with the highest average salaries and wages was ‘coke, petroleum, chemical products, rubber and plastic’ (R265 871), followed by ‘electrical machinery and apparatus’ (R246 760) and ‘transport equipment’ (R231 607). The division with the lowest average salaries and wages was ‘textiles, clothing, leather and footwear’ (R69 443). Total average salaries and wages increased from R79 198 in 2005 to R183 417 in 2014, an annualised growth rate of 9,8%. The biggest increase was between the years 2005 and 2008 with
an annualised increase of 11,3% (from R79 198 in 2005 to R109 125 in 2008).
Statistics South Africa 10
Manufacturing industry: Financial, Report No. 30-02-03 (2014)
2.3. Manufacturing industry value added
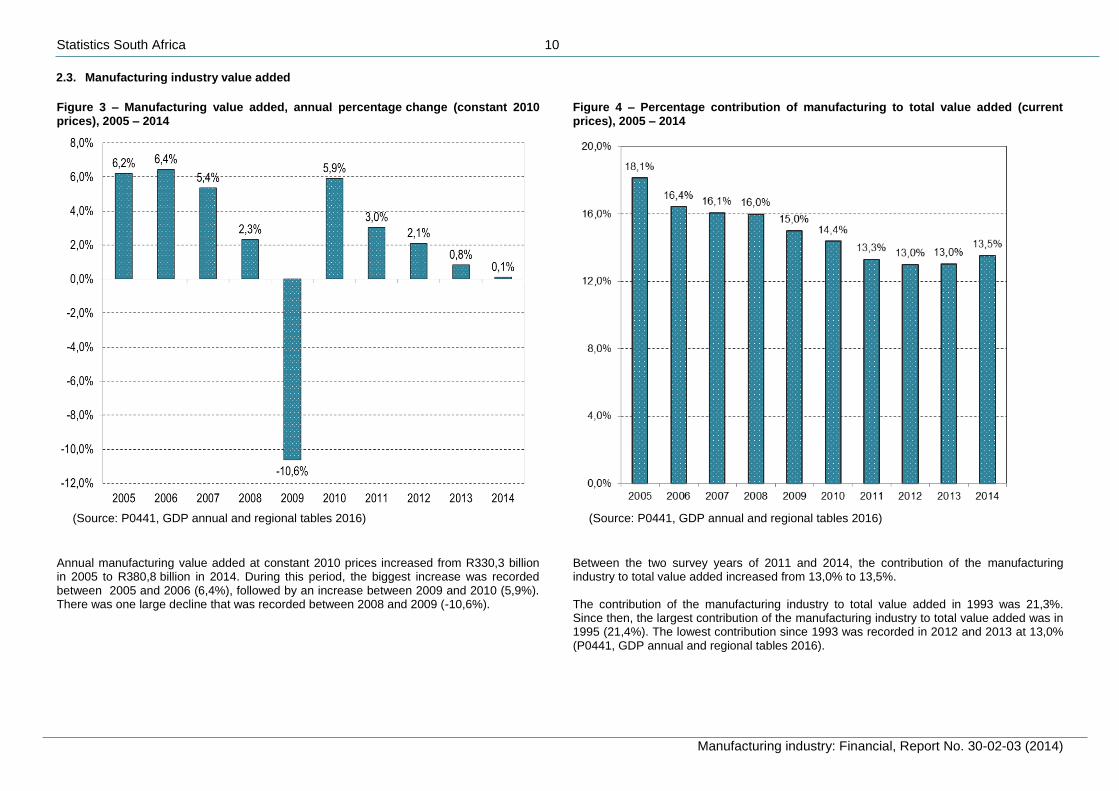
Figure 3 – Manufacturing value added, annual percentage change (constant 2010 prices), 2005 – 2014
Figure 4 – Percentage contribution of manufacturing to total value added (current prices), 2005 – 2014
(Source: P0441, GDP annual and regional tables 2016)
(Source: P0441, GDP annual and regional tables 2016)
Annual manufacturing value added at constant 2010 prices increased from R330,3 billion in 2005 to R380,8 billion in 2014. During this period, the biggest increase was recorded between 2005 and 2006 (6,4%), followed by an increase between 2009 and 2010 (5,9%). There was one large decline that was recorded between 2008 and 2009 (-10,6%).
Between the two survey years of 2011 and 2014, the contribution of the manufacturing industry to total value added increased from 13,0% to 13,5%. The contribution of the manufacturing industry to total value added in 1993 was 21,3%. Since then, the largest contribution of the manufacturing industry to total value added was in 1995 (21,4%). The lowest contribution since 1993 was recorded in 2012 and 2013 at 13,0% (P0441, GDP annual and regional tables 2016).
Statistics South Africa 11
Manufacturing industry: Financial, Report No. 30-02-03 (2014)
2.4. Capital expenditure on new assets
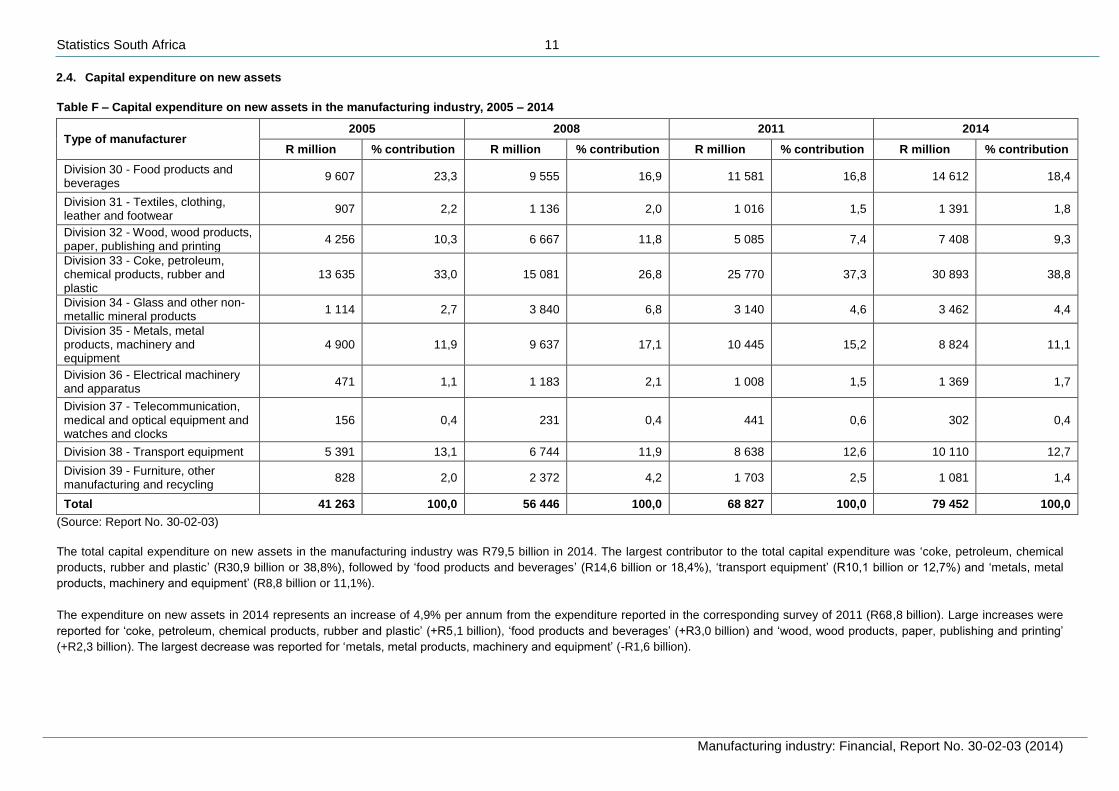
Table F – Capital expenditure on new assets in the manufacturing industry, 2005 – 2014
Type of manufacturer 2005 2008 2011 2014
R million % contribution R million % contribution R million % contribution R million % contribution
Division 30 - Food products and beverages
9 607 23,3 9 555 16,9 11 581 16,8 14 612 18,4
Division 31 - Textiles, clothing, leather and footwear
907 2,2 1 136 2,0 1 016 1,5 1 391 1,8
Division 32 - Wood, wood products, paper, publishing and printing
4 256 10,3 6 667 11,8 5 085 7,4 7 408 9,3
Division 33 - Coke, petroleum, chemical products, rubber and plastic
13 635 33,0 15 081 26,8 25 770 37,3 30 893 38,8
Division 34 - Glass and other non-metallic mineral products
1 114 2,7 3 840 6,8 3 140 4,6 3 462 4,4
Division 35 - Metals, metal products, machinery and equipment
4 900 11,9 9 637 17,1 10 445 15,2 8 824 11,1
Division 36 - Electrical machinery and apparatus
471 1,1 1 183 2,1 1 008 1,5 1 369 1,7
Division 37 - Telecommunication, medical and optical equipment and watches and clocks
156 0,4 231 0,4 441 0,6 302 0,4
Division 38 - Transport equipment 5 391 13,1 6 744 11,9 8 638 12,6 10 110 12,7
Division 39 - Furniture, other manufacturing and recycling
828 2,0 2 372 4,2 1 703 2,5 1 081 1,4
Total 41 263 100,0 56 446 100,0 68 827 100,0 79 452 100,0
(Source: Report No. 30-02-03)
The total capital expenditure on new assets in the manufacturing industry was R79,5 billion in 2014. The largest contributor to the total capital expenditure was ‘coke, petroleum, chemical
products, rubber and plastic’ (R30,9 billion or 38,8%), followed by ‘food products and beverages’ (R14,6 billion or 18,4%), ‘transport equipment’ (R10,1 billion or 12,7%) and ‘metals, metal
products, machinery and equipment’ (R8,8 billion or 11,1%).
The expenditure on new assets in 2014 represents an increase of 4,9% per annum from the expenditure reported in the corresponding survey of 2011 (R68,8 billion). Large increases were
reported for ‘coke, petroleum, chemical products, rubber and plastic’ (+R5,1 billion), ‘food products and beverages’ (+R3,0 billion) and ‘wood, wood products, paper, publishing and printing’
(+R2,3 billion). The largest decrease was reported for ‘metals, metal products, machinery and equipment’ (-R1,6 billion).
Statistics South Africa 12
Manufacturing industry: Financial, Report No. 30-02-03 (2014)
2.5. Selected provincial statistics
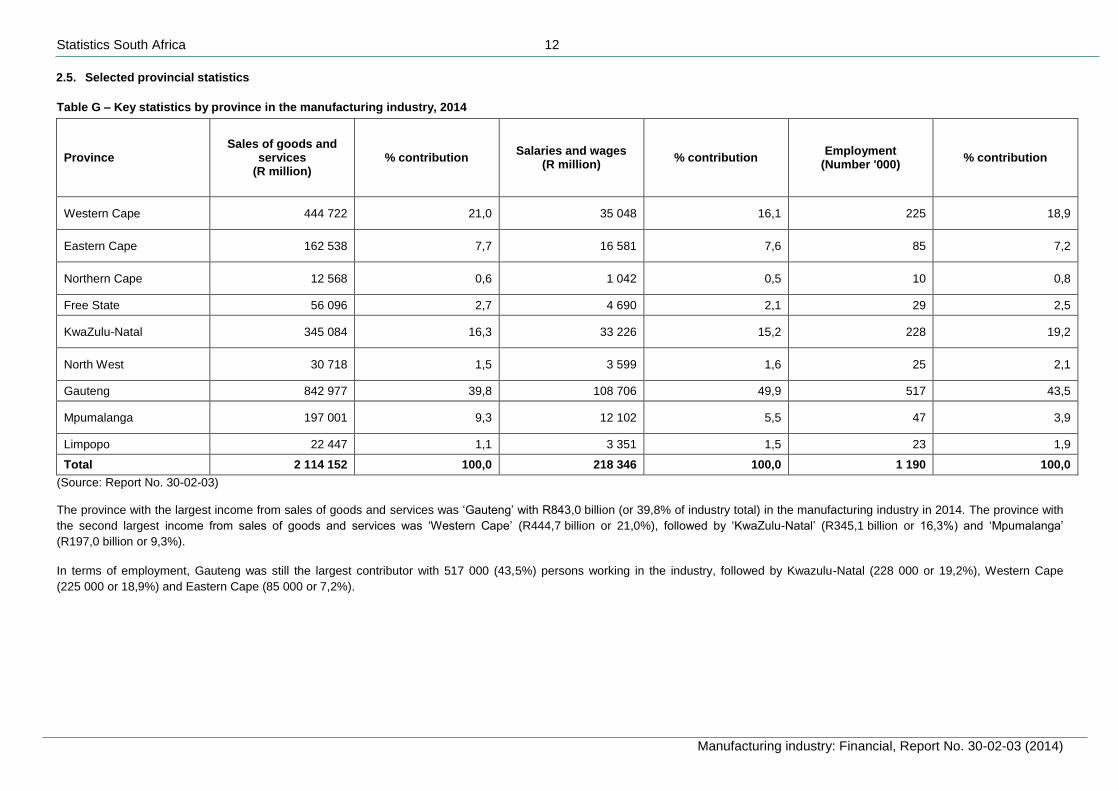
Table G – Key statistics by province in the manufacturing industry, 2014
Province Sales of goods and
services (R million)
% contribution Salaries and wages
(R million) % contribution
Employment (Number '000)
% contribution
Western Cape 444 722 21,0 35 048 16,1 225 18,9
Eastern Cape 162 538 7,7 16 581 7,6 85 7,2
Northern Cape 12 568 0,6 1 042 0,5 10 0,8
Free State 56 096 2,7 4 690 2,1 29 2,5
KwaZulu-Natal 345 084 16,3 33 226 15,2 228 19,2
North West 30 718 1,5 3 599 1,6 25 2,1
Gauteng 842 977 39,8 108 706 49,9 517 43,5
Mpumalanga 197 001 9,3 12 102 5,5 47 3,9
Limpopo 22 447 1,1 3 351 1,5 23 1,9
Total 2 114 152 100,0 218 346 100,0 1 190 100,0
(Source: Report No. 30-02-03)
The province with the largest income from sales of goods and services was ‘Gauteng’ with R843,0 billion (or 39,8% of industry total) in the manufacturing industry in 2014. The province with
the second largest income from sales of goods and services was ‘Western Cape’ (R444,7 billion or 21,0%), followed by ‘KwaZulu-Natal’ (R345,1 billion or 16,3%) and ‘Mpumalanga’
(R197,0 billion or 9,3%).
In terms of employment, Gauteng was still the largest contributor with 517 000 (43,5%) persons working in the industry, followed by Kwazulu-Natal (228 000 or 19,2%), Western Cape
(225 000 or 18,9%) and Eastern Cape (85 000 or 7,2%).
Statistics South Africa 13
Manufacturing industry: Financial, Report No. 30-02-03 (2014)
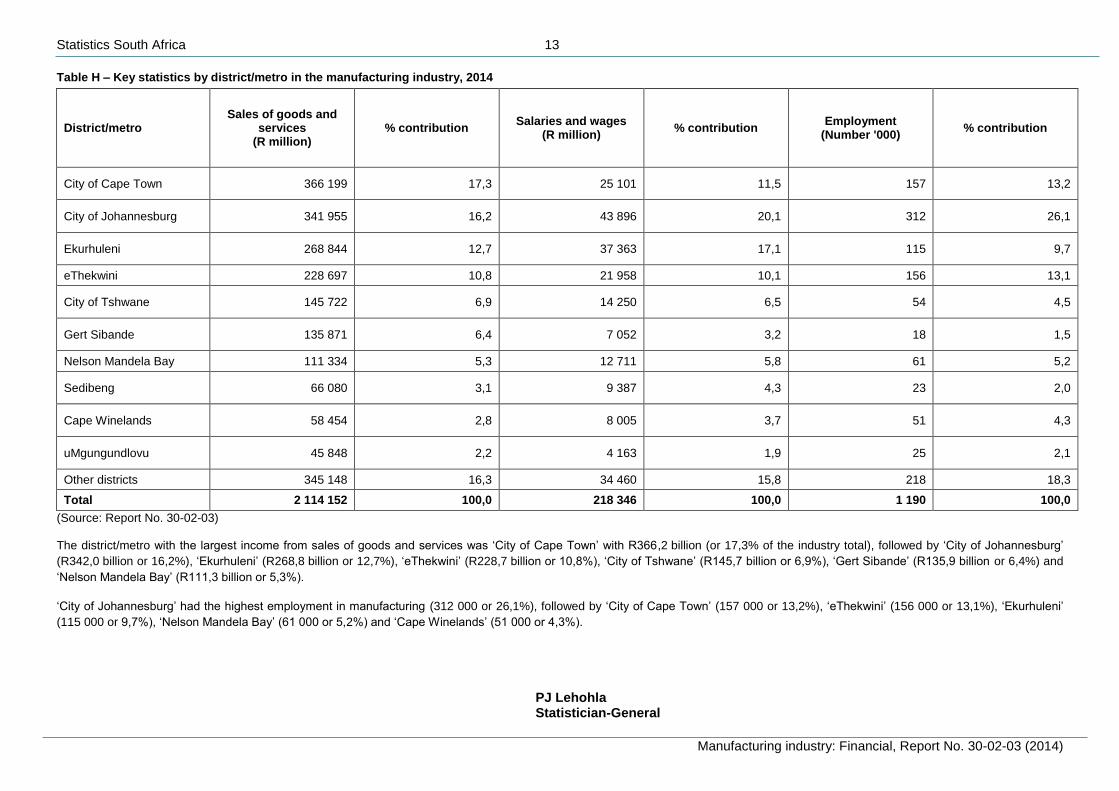
Table H – Key statistics by district/metro in the manufacturing industry, 2014
District/metro Sales of goods and
services (R million)
% contribution Salaries and wages
(R million) % contribution
Employment (Number '000)
% contribution
City of Cape Town 366 199 17,3 25 101 11,5 157 13,2
City of Johannesburg 341 955 16,2 43 896 20,1 312 26,1
Ekurhuleni 268 844 12,7 37 363 17,1 115 9,7
eThekwini 228 697 10,8 21 958 10,1 156 13,1
City of Tshwane 145 722 6,9 14 250 6,5 54 4,5
Gert Sibande 135 871 6,4 7 052 3,2 18 1,5
Nelson Mandela Bay 111 334 5,3 12 711 5,8 61 5,2
Sedibeng 66 080 3,1 9 387 4,3 23 2,0
Cape Winelands 58 454 2,8 8 005 3,7 51 4,3
uMgungundlovu 45 848 2,2 4 163 1,9 25 2,1
Other districts 345 148 16,3 34 460 15,8 218 18,3
Total 2 114 152 100,0 218 346 100,0 1 190 100,0
(Source: Report No. 30-02-03)
The district/metro with the largest income from sales of goods and services was ‘City of Cape Town’ with R366,2 billion (or 17,3% of the industry total), followed by ‘City of Johannesburg’
(R342,0 billion or 16,2%), ‘Ekurhuleni’ (R268,8 billion or 12,7%), ‘eThekwini’ (R228,7 billion or 10,8%), ‘City of Tshwane’ (R145,7 billion or 6,9%), ‘Gert Sibande’ (R135,9 billion or 6,4%) and
‘Nelson Mandela Bay’ (R111,3 billion or 5,3%).
‘City of Johannesburg’ had the highest employment in manufacturing (312 000 or 26,1%), followed by ‘City of Cape Town’ (157 000 or 13,2%), ‘eThekwini’ (156 000 or 13,1%), ‘Ekurhuleni’
(115 000 or 9,7%), ‘Nelson Mandela Bay’ (61 000 or 5,2%) and ‘Cape Winelands’ (51 000 or 4,3%).
PJ Lehohla Statistician-General
Statistics South Africa 14
Manufacturing industry: Financial, Report No. 30-02-03 (2014)
3. Tables
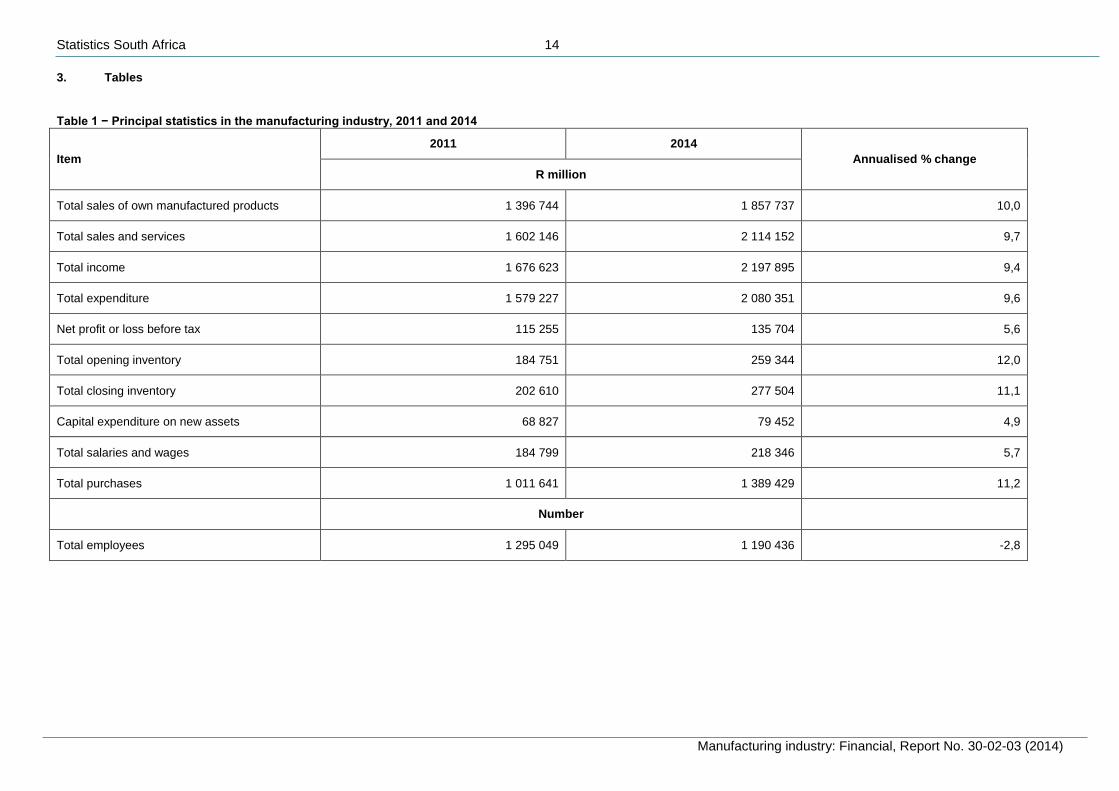
Table 1 − Principal statistics in the manufacturing industry, 2011 and 2014
Item
2011 2014
Annualised % change
R million
Total sales of own manufactured products 1 396 744 1 857 737 10,0
Total sales and services 1 602 146 2 114 152 9,7
Total income 1 676 623 2 197 895 9,4
Total expenditure 1 579 227 2 080 351 9,6
Net profit or loss before tax 115 255 135 704 5,6
Total opening inventory 184 751 259 344 12,0
Total closing inventory 202 610 277 504 11,1
Capital expenditure on new assets 68 827 79 452 4,9
Total salaries and wages 184 799 218 346 5,7
Total purchases 1 011 641 1 389 429 11,2
Number
Total employees 1 295 049 1 190 436 -2,8
Statistics South Africa 15
Manufacturing industry: Financial, Report No. 30-02-03 (2014)
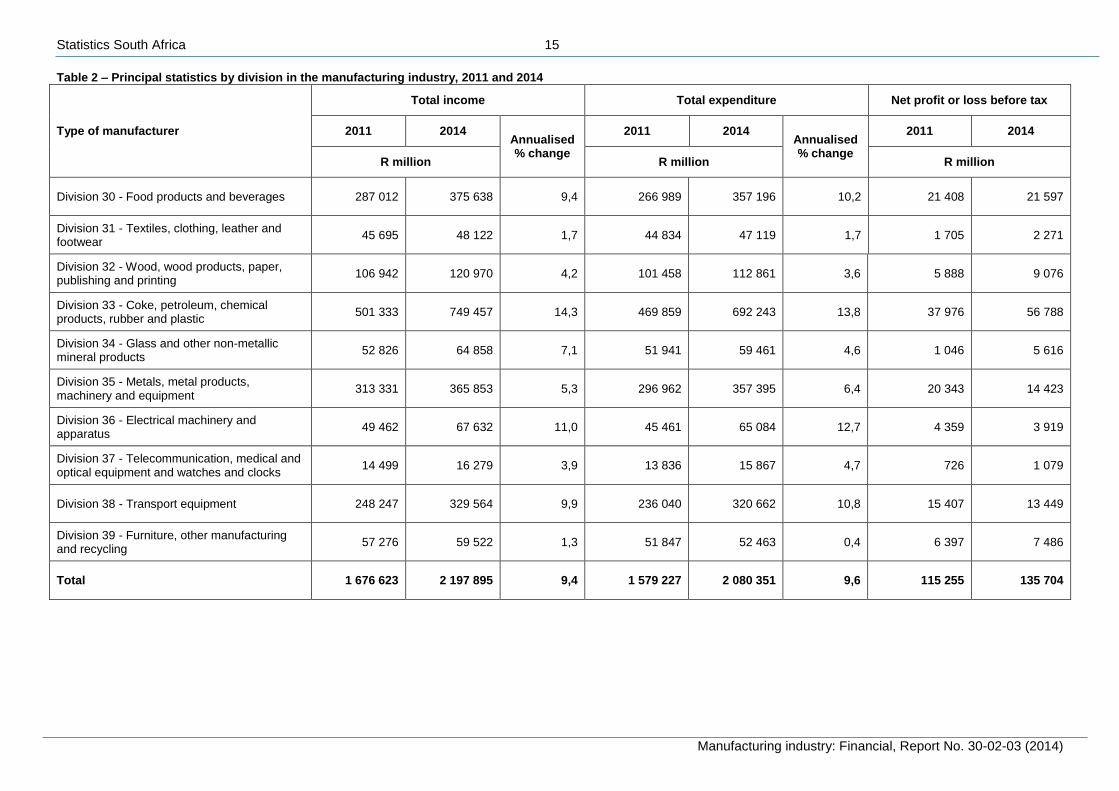
Table 2 – Principal statistics by division in the manufacturing industry, 2011 and 2014
Type of manufacturer
Total income Total expenditure Net profit or loss before tax
2011 2014 Annualised % change
2011 2014 Annualised % change
2011 2014
R million R million R million
Division 30 - Food products and beverages 287 012 375 638 9,4 266 989 357 196 10,2 21 408 21 597
Division 31 - Textiles, clothing, leather and footwear
45 695 48 122 1,7 44 834 47 119 1,7 1 705 2 271
Division 32 - Wood, wood products, paper, publishing and printing
106 942 120 970 4,2 101 458 112 861 3,6 5 888 9 076
Division 33 - Coke, petroleum, chemical products, rubber and plastic
501 333 749 457 14,3 469 859 692 243 13,8 37 976 56 788
Division 34 - Glass and other non-metallic mineral products
52 826 64 858 7,1 51 941 59 461 4,6 1 046 5 616
Division 35 - Metals, metal products, machinery and equipment
313 331 365 853 5,3 296 962 357 395 6,4 20 343 14 423
Division 36 - Electrical machinery and apparatus
49 462 67 632 11,0 45 461 65 084 12,7 4 359 3 919
Division 37 - Telecommunication, medical and optical equipment and watches and clocks
14 499 16 279 3,9 13 836 15 867 4,7 726 1 079
Division 38 - Transport equipment 248 247 329 564 9,9 236 040 320 662 10,8 15 407 13 449
Division 39 - Furniture, other manufacturing and recycling
57 276 59 522 1,3 51 847 52 463 0,4 6 397 7 486
Total 1 676 623 2 197 895 9,4 1 579 227 2 080 351 9,6 115 255 135 704
Statistics South Africa 16
Manufacturing industry: Financial, Report No. 30-02-03 (2014)
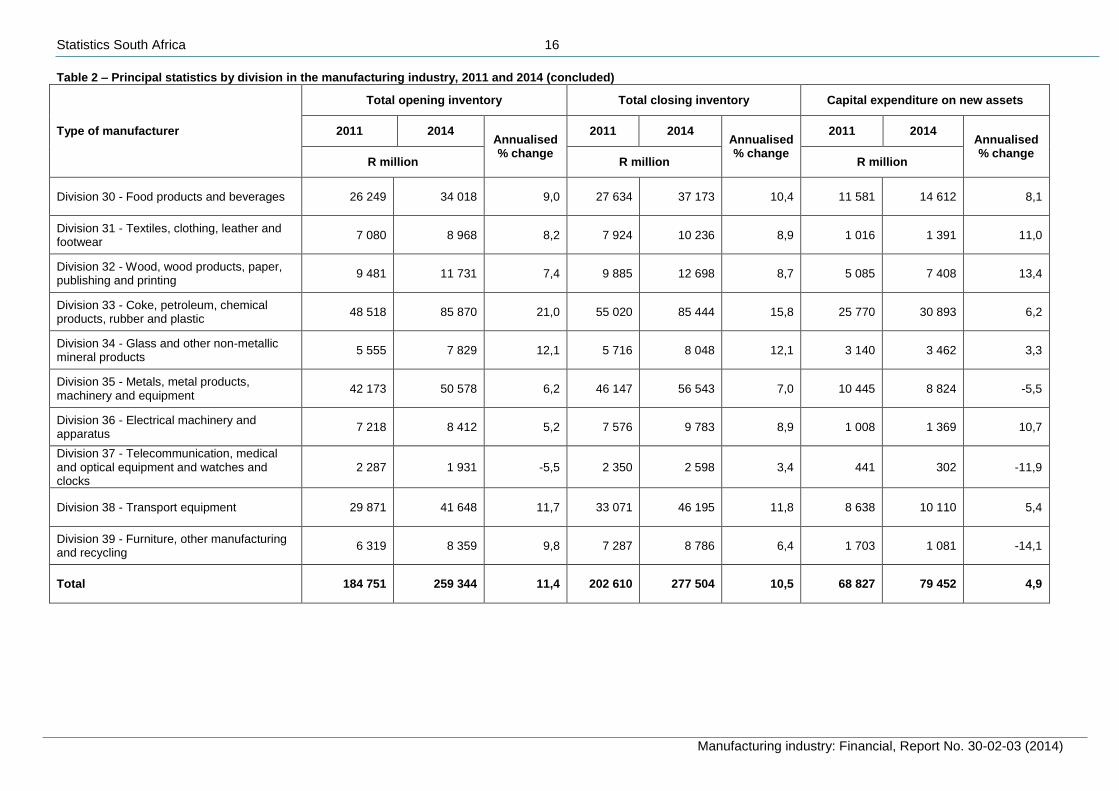
Table 2 – Principal statistics by division in the manufacturing industry, 2011 and 2014 (concluded)
Type of manufacturer
Total opening inventory Total closing inventory Capital expenditure on new assets
2011 2014 Annualised % change
2011 2014 Annualised % change
2011 2014 Annualised % change
R million R million R million
Division 30 - Food products and beverages 26 249 34 018 9,0 27 634 37 173 10,4 11 581 14 612 8,1
Division 31 - Textiles, clothing, leather and footwear
7 080 8 968 8,2 7 924 10 236 8,9 1 016 1 391 11,0
Division 32 - Wood, wood products, paper, publishing and printing
9 481 11 731 7,4 9 885 12 698 8,7 5 085 7 408 13,4
Division 33 - Coke, petroleum, chemical products, rubber and plastic
48 518 85 870 21,0 55 020 85 444 15,8 25 770 30 893 6,2
Division 34 - Glass and other non-metallic mineral products
5 555 7 829 12,1 5 716 8 048 12,1 3 140 3 462 3,3
Division 35 - Metals, metal products, machinery and equipment
42 173 50 578 6,2 46 147 56 543 7,0 10 445 8 824 -5,5
Division 36 - Electrical machinery and apparatus
7 218 8 412 5,2 7 576 9 783 8,9 1 008 1 369 10,7
Division 37 - Telecommunication, medical and optical equipment and watches and clocks
2 287 1 931 -5,5 2 350 2 598 3,4 441 302 -11,9
Division 38 - Transport equipment 29 871 41 648 11,7 33 071 46 195 11,8 8 638 10 110 5,4
Division 39 - Furniture, other manufacturing and recycling
6 319 8 359 9,8 7 287 8 786 6,4 1 703 1 081 -14,1
Total 184 751 259 344 11,4 202 610 277 504 10,5 68 827 79 452 4,9
Statistics South Africa 17
Manufacturing industry: Financial, Report No. 30-02-03 (2014)
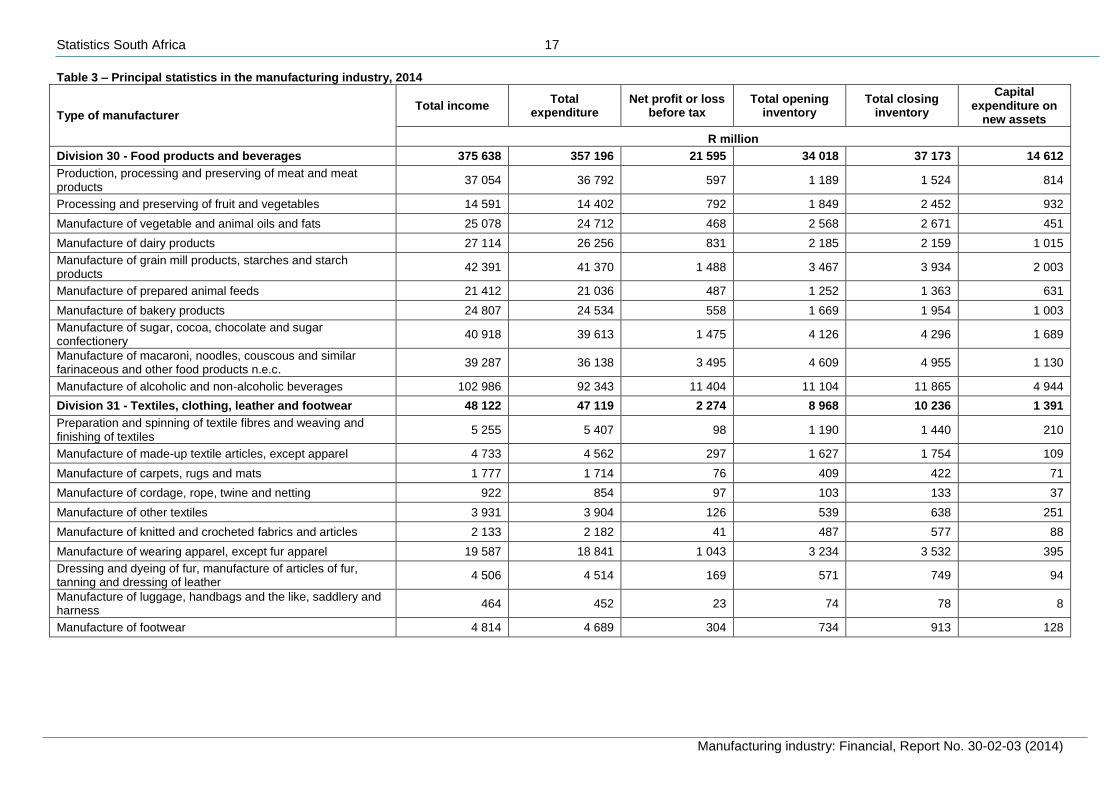
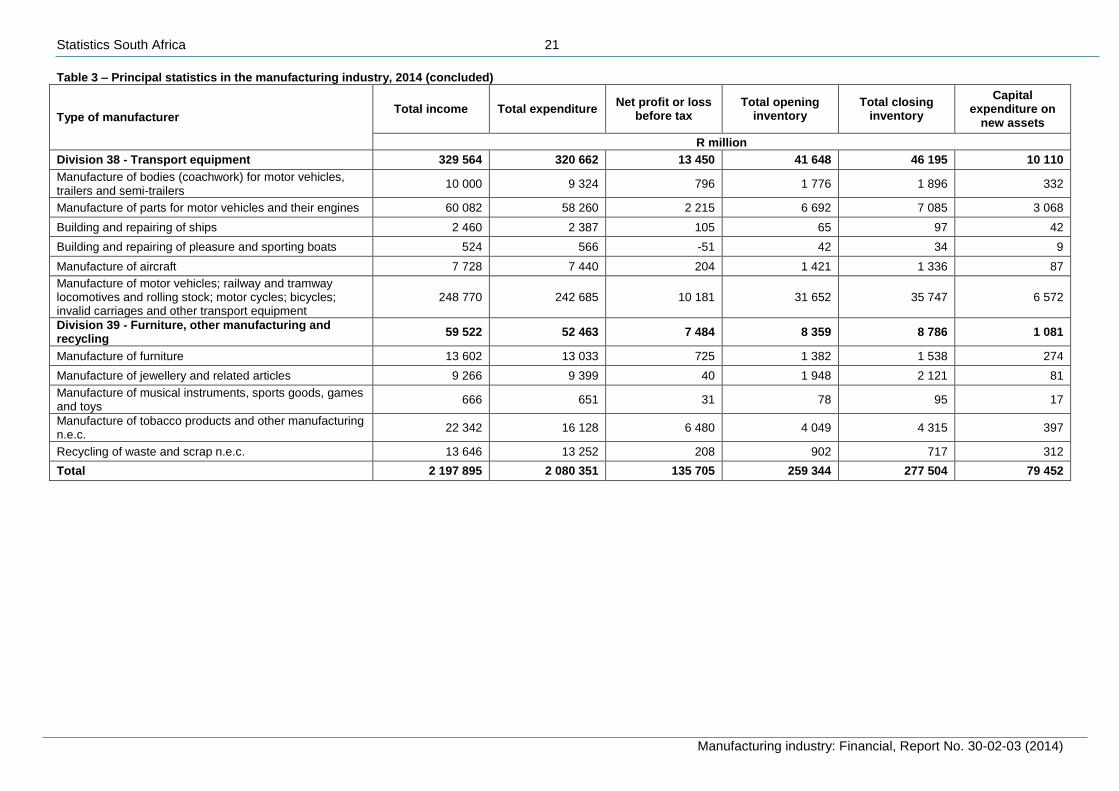
Table 3 – Principal statistics in the manufacturing industry, 2014
Type of manufacturer Total income
Total expenditure
Net profit or loss before tax
Total opening inventory
Total closing inventory
Capital expenditure on
new assets
R million
Division 30 - Food products and beverages 375 638 357 196 21 595 34 018 37 173 14 612
Production, processing and preserving of meat and meat products
37 054 36 792 597 1 189 1 524 814
Processing and preserving of fruit and vegetables 14 591 14 402 792 1 849 2 452 932
Manufacture of vegetable and animal oils and fats 25 078 24 712 468 2 568 2 671 451
Manufacture of dairy products 27 114 26 256 831 2 185 2 159 1 015
Manufacture of grain mill products, starches and starch products
42 391 41 370 1 488 3 467 3 934 2 003
Manufacture of prepared animal feeds 21 412 21 036 487 1 252 1 363 631
Manufacture of bakery products 24 807 24 534 558 1 669 1 954 1 003
Manufacture of sugar, cocoa, chocolate and sugar confectionery
40 918 39 613 1 475 4 126 4 296 1 689
Manufacture of macaroni, noodles, couscous and similar farinaceous and other food products n.e.c.
39 287 36 138 3 495 4 609 4 955 1 130
Manufacture of alcoholic and non-alcoholic beverages 102 986 92 343 11 404 11 104 11 865 4 944
Division 31 - Textiles, clothing, leather and footwear 48 122 47 119 2 274 8 968 10 236 1 391
Preparation and spinning of textile fibres and weaving and finishing of textiles
5 255 5 407 98 1 190 1 440 210
Manufacture of made-up textile articles, except apparel 4 733 4 562 297 1 627 1 754 109
Manufacture of carpets, rugs and mats 1 777 1 714 76 409 422 71
Manufacture of cordage, rope, twine and netting 922 854 97 103 133 37
Manufacture of other textiles 3 931 3 904 126 539 638 251
Manufacture of knitted and crocheted fabrics and articles 2 133 2 182 41 487 577 88
Manufacture of wearing apparel, except fur apparel 19 587 18 841 1 043 3 234 3 532 395
Dressing and dyeing of fur, manufacture of articles of fur, tanning and dressing of leather
4 506 4 514 169 571 749 94
Manufacture of luggage, handbags and the like, saddlery and harness
464 452 23 74 78 8
Manufacture of footwear 4 814 4 689 304 734 913 128
Statistics South Africa 18
Manufacturing industry: Financial, Report No. 30-02-03 (2014)
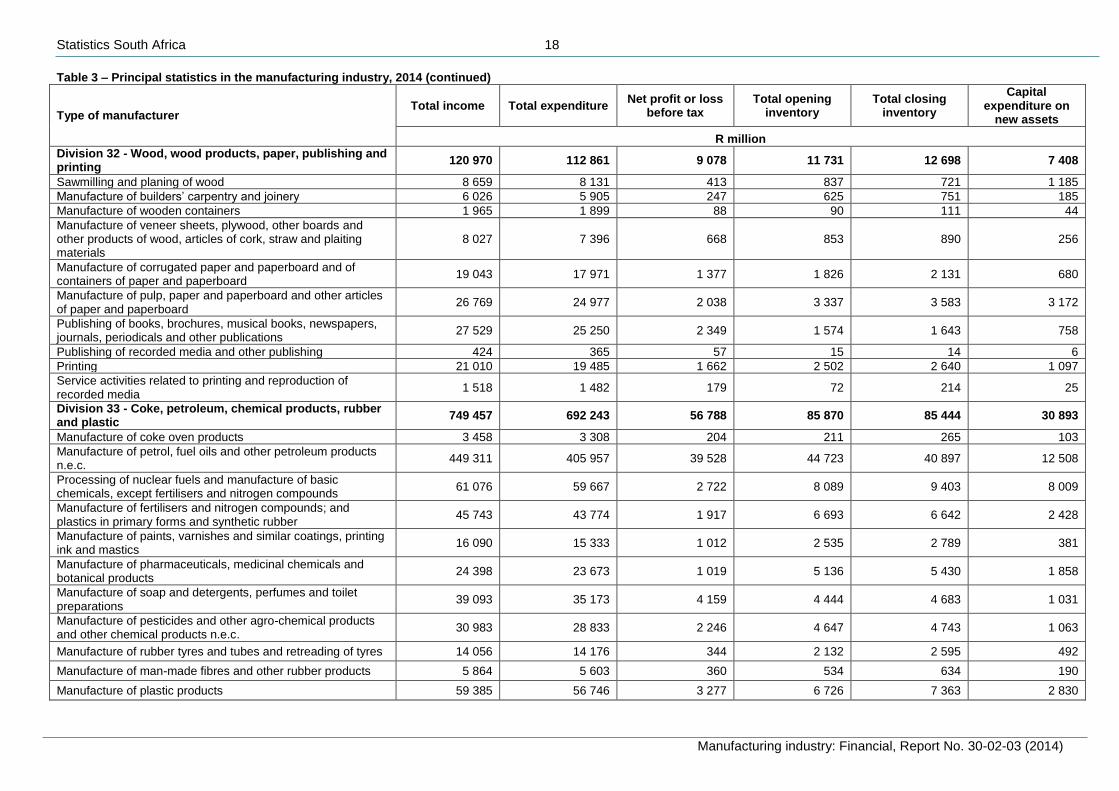
Table 3 – Principal statistics in the manufacturing industry, 2014 (continued)
Type of manufacturer Total income Total expenditure
Net profit or loss before tax
Total opening inventory
Total closing inventory
Capital expenditure on
new assets
R million
Division 32 - Wood, wood products, paper, publishing and printing
120 970 112 861 9 078 11 731 12 698 7 408
Sawmilling and planing of wood 8 659 8 131 413 837 721 1 185
Manufacture of builders’ carpentry and joinery 6 026 5 905 247 625 751 185
Manufacture of wooden containers 1 965 1 899 88 90 111 44
Manufacture of veneer sheets, plywood, other boards and other products of wood, articles of cork, straw and plaiting materials
8 027 7 396 668 853 890 256
Manufacture of corrugated paper and paperboard and of containers of paper and paperboard
19 043 17 971 1 377 1 826 2 131 680
Manufacture of pulp, paper and paperboard and other articles of paper and paperboard
26 769 24 977 2 038 3 337 3 583 3 172
Publishing of books, brochures, musical books, newspapers, journals, periodicals and other publications
27 529 25 250 2 349 1 574 1 643 758
Publishing of recorded media and other publishing 424 365 57 15 14 6
Printing 21 010 19 485 1 662 2 502 2 640 1 097
Service activities related to printing and reproduction of recorded media
1 518 1 482 179 72 214 25
Division 33 - Coke, petroleum, chemical products, rubber and plastic
749 457 692 243 56 788 85 870 85 444 30 893
Manufacture of coke oven products 3 458 3 308 204 211 265 103
Manufacture of petrol, fuel oils and other petroleum products n.e.c.
449 311 405 957 39 528 44 723 40 897 12 508
Processing of nuclear fuels and manufacture of basic chemicals, except fertilisers and nitrogen compounds
61 076 59 667 2 722 8 089 9 403 8 009
Manufacture of fertilisers and nitrogen compounds; and plastics in primary forms and synthetic rubber
45 743 43 774 1 917 6 693 6 642 2 428
Manufacture of paints, varnishes and similar coatings, printing ink and mastics
16 090 15 333 1 012 2 535 2 789 381
Manufacture of pharmaceuticals, medicinal chemicals and botanical products
24 398 23 673 1 019 5 136 5 430 1 858
Manufacture of soap and detergents, perfumes and toilet preparations
39 093 35 173 4 159 4 444 4 683 1 031
Manufacture of pesticides and other agro-chemical products and other chemical products n.e.c.
30 983 28 833 2 246 4 647 4 743 1 063
Manufacture of rubber tyres and tubes and retreading of tyres 14 056 14 176 344 2 132 2 595 492
Manufacture of man-made fibres and other rubber products 5 864 5 603 360 534 634 190
Manufacture of plastic products 59 385 56 746 3 277 6 726 7 363 2 830
Statistics South Africa 19
Manufacturing industry: Financial, Report No. 30-02-03 (2014)
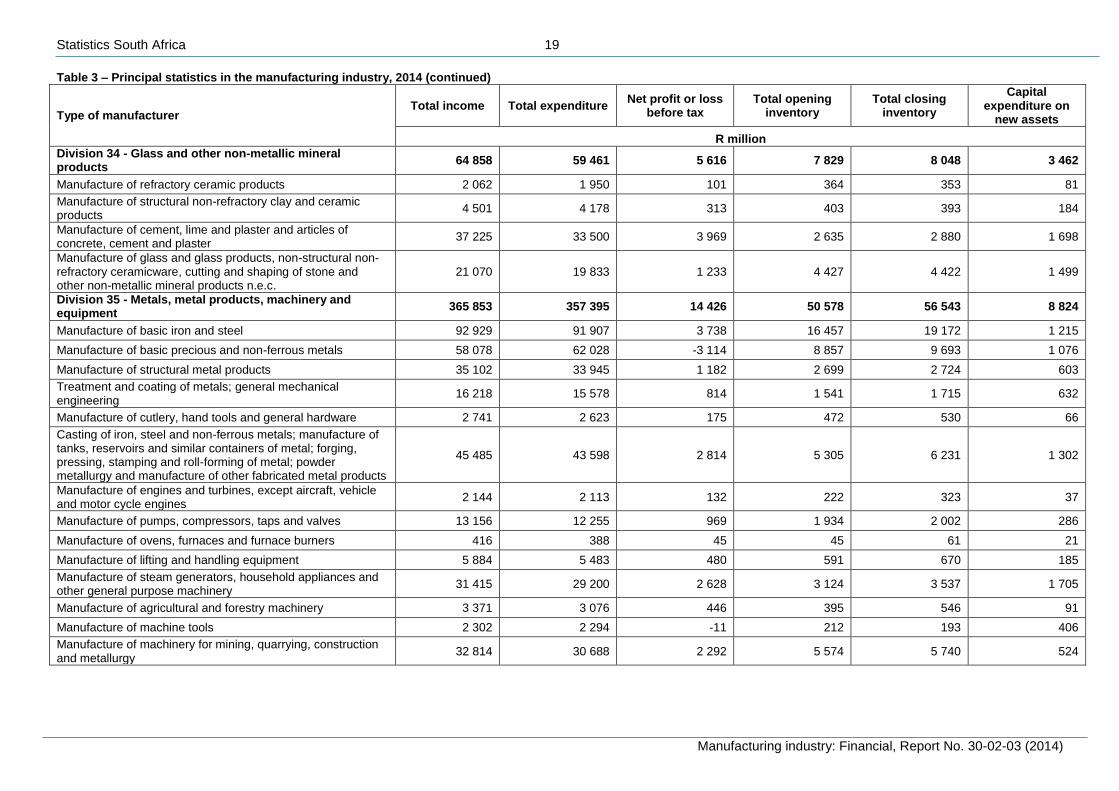
Table 3 – Principal statistics in the manufacturing industry, 2014 (continued)
Type of manufacturer Total income Total expenditure
Net profit or loss before tax
Total opening inventory
Total closing inventory
Capital expenditure on
new assets
R million
Division 34 - Glass and other non-metallic mineral products
64 858 59 461 5 616 7 829 8 048 3 462
Manufacture of refractory ceramic products 2 062 1 950 101 364 353 81
Manufacture of structural non-refractory clay and ceramic products
4 501 4 178 313 403 393 184
Manufacture of cement, lime and plaster and articles of concrete, cement and plaster
37 225 33 500 3 969 2 635 2 880 1 698
Manufacture of glass and glass products, non-structural non-refractory ceramicware, cutting and shaping of stone and other non-metallic mineral products n.e.c.
21 070 19 833 1 233 4 427 4 422 1 499
Division 35 - Metals, metal products, machinery and equipment
365 853 357 395 14 426 50 578 56 543 8 824
Manufacture of basic iron and steel 92 929 91 907 3 738 16 457 19 172 1 215
Manufacture of basic precious and non-ferrous metals 58 078 62 028 -3 114 8 857 9 693 1 076
Manufacture of structural metal products 35 102 33 945 1 182 2 699 2 724 603
Treatment and coating of metals; general mechanical engineering
16 218 15 578 814 1 541 1 715 632
Manufacture of cutlery, hand tools and general hardware 2 741 2 623 175 472 530 66
Casting of iron, steel and non-ferrous metals; manufacture of tanks, reservoirs and similar containers of metal; forging, pressing, stamping and roll-forming of metal; powder metallurgy and manufacture of other fabricated metal products
45 485 43 598 2 814 5 305 6 231 1 302
Manufacture of engines and turbines, except aircraft, vehicle and motor cycle engines
2 144 2 113 132 222 323 37
Manufacture of pumps, compressors, taps and valves 13 156 12 255 969 1 934 2 002 286
Manufacture of ovens, furnaces and furnace burners 416 388 45 45 61 21
Manufacture of lifting and handling equipment 5 884 5 483 480 591 670 185
Manufacture of steam generators, household appliances and other general purpose machinery
31 415 29 200 2 628 3 124 3 537 1 705
Manufacture of agricultural and forestry machinery 3 371 3 076 446 395 546 91
Manufacture of machine tools 2 302 2 294 -11 212 193 406
Manufacture of machinery for mining, quarrying, construction and metallurgy
32 814 30 688 2 292 5 574 5 740 524
Statistics South Africa 20
Manufacturing industry: Financial, Report No. 30-02-03 (2014)
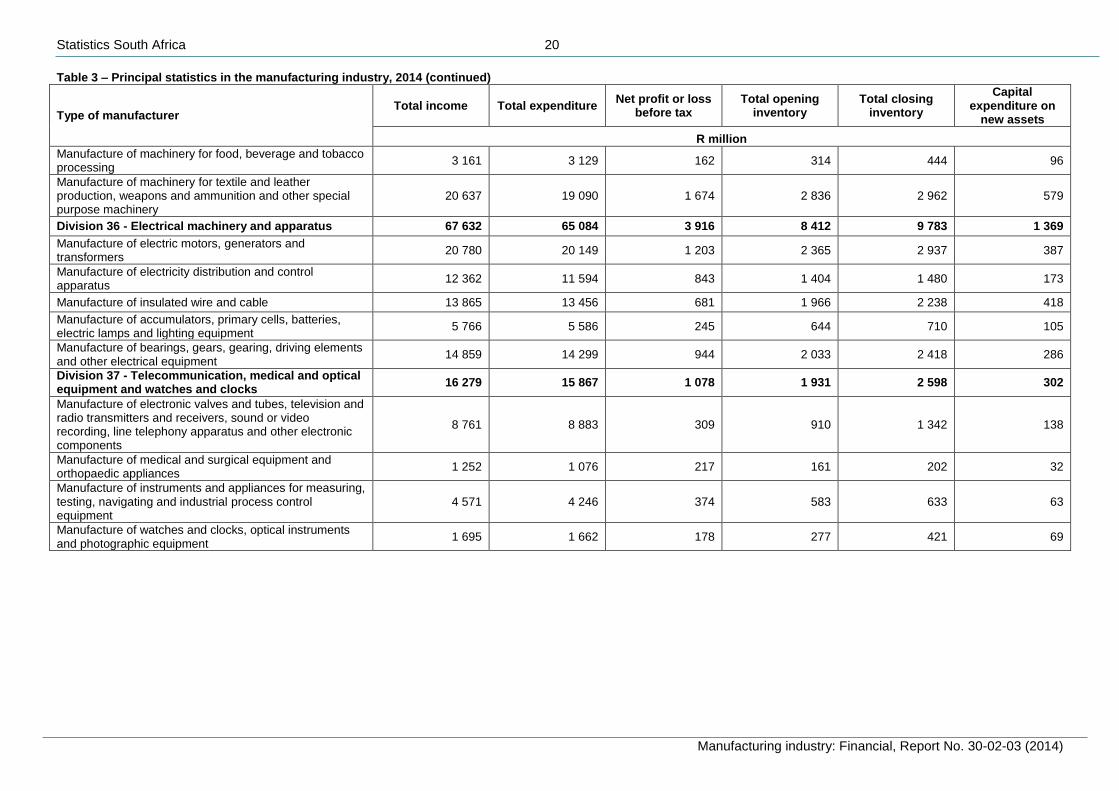
Table 3 – Principal statistics in the manufacturing industry, 2014 (continued)
Type of manufacturer Total income Total expenditure
Net profit or loss before tax
Total opening inventory
Total closing inventory
Capital expenditure on
new assets
R million
Manufacture of machinery for food, beverage and tobacco processing
3 161 3 129 162 314 444 96
Manufacture of machinery for textile and leather production, weapons and ammunition and other special purpose machinery
20 637 19 090 1 674 2 836 2 962 579
Division 36 - Electrical machinery and apparatus 67 632 65 084 3 916 8 412 9 783 1 369
Manufacture of electric motors, generators and transformers
20 780 20 149 1 203 2 365 2 937 387
Manufacture of electricity distribution and control apparatus
12 362 11 594 843 1 404 1 480 173
Manufacture of insulated wire and cable 13 865 13 456 681 1 966 2 238 418
Manufacture of accumulators, primary cells, batteries, electric lamps and lighting equipment
5 766 5 586 245 644 710 105
Manufacture of bearings, gears, gearing, driving elements and other electrical equipment
14 859 14 299 944 2 033 2 418 286
Division 37 - Telecommunication, medical and optical equipment and watches and clocks
16 279 15 867 1 078 1 931 2 598 302
Manufacture of electronic valves and tubes, television and radio transmitters and receivers, sound or video recording, line telephony apparatus and other electronic components
8 761 8 883 309 910 1 342 138
Manufacture of medical and surgical equipment and orthopaedic appliances
1 252 1 076 217 161 202 32
Manufacture of instruments and appliances for measuring, testing, navigating and industrial process control equipment
4 571 4 246 374 583 633 63
Manufacture of watches and clocks, optical instruments and photographic equipment
1 695 1 662 178 277 421 69
Statistics South Africa 21
Manufacturing industry: Financial, Report No. 30-02-03 (2014)
Table 3 – Principal statistics in the manufacturing industry, 2014 (concluded)
Type of manufacturer Total income Total expenditure
Net profit or loss before tax
Total opening inventory
Total closing inventory
Capital expenditure on
new assets
R million
Division 38 - Transport equipment 329 564 320 662 13 450 41 648 46 195 10 110
Manufacture of bodies (coachwork) for motor vehicles, trailers and semi-trailers
10 000 9 324 796 1 776 1 896 332
Manufacture of parts for motor vehicles and their engines 60 082 58 260 2 215 6 692 7 085 3 068
Building and repairing of ships 2 460 2 387 105 65 97 42
Building and repairing of pleasure and sporting boats 524 566 -51 42 34 9
Manufacture of aircraft 7 728 7 440 204 1 421 1 336 87
Manufacture of motor vehicles; railway and tramway locomotives and rolling stock; motor cycles; bicycles; invalid carriages and other transport equipment
248 770 242 685 10 181 31 652 35 747 6 572
Division 39 - Furniture, other manufacturing and recycling
59 522 52 463 7 484 8 359 8 786 1 081
Manufacture of furniture 13 602 13 033 725 1 382 1 538 274
Manufacture of jewellery and related articles 9 266 9 399 40 1 948 2 121 81
Manufacture of musical instruments, sports goods, games and toys
666 651 31 78 95 17
Manufacture of tobacco products and other manufacturing n.e.c.
22 342 16 128 6 480 4 049 4 315 397
Recycling of waste and scrap n.e.c. 13 646 13 252 208 902 717 312
Total 2 197 895 2 080 351 135 705 259 344 277 504 79 452
Statistics South Africa 22
Manufacturing industry: Financial, Report No. 30-02-03 (2014)
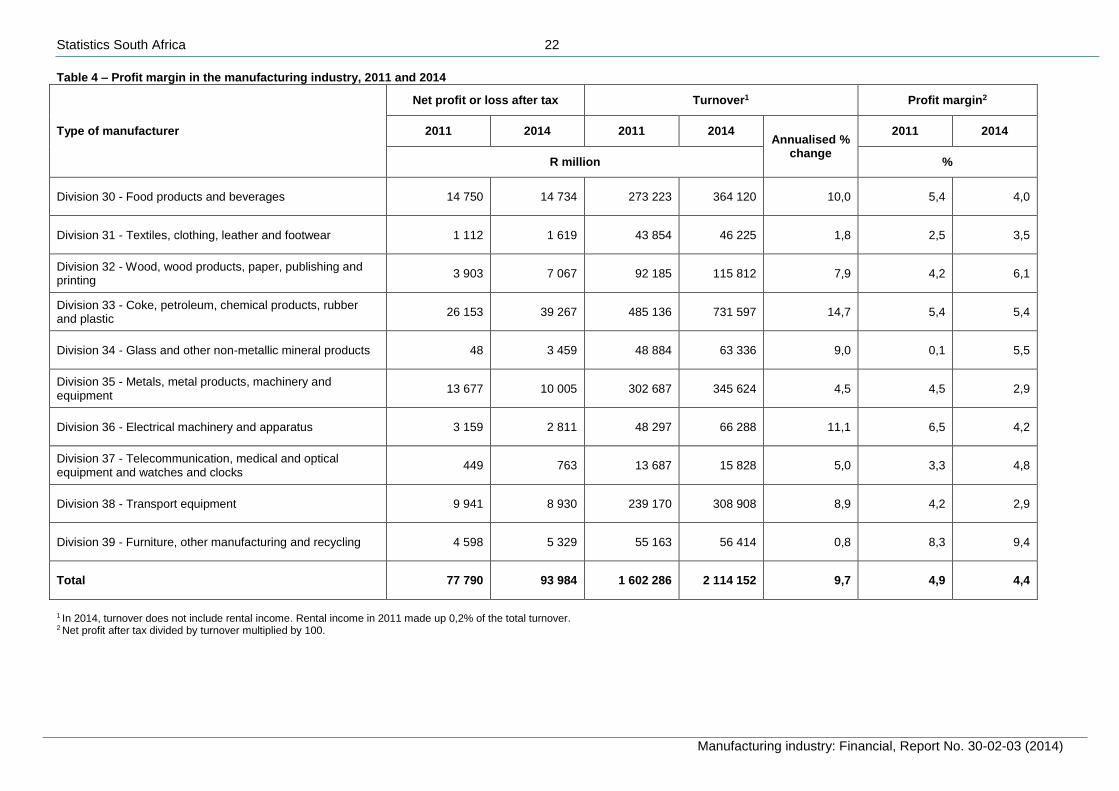
Table 4 – Profit margin in the manufacturing industry, 2011 and 2014
Type of manufacturer
Net profit or loss after tax Turnover1 Profit margin2
2011 2014 2011 2014 Annualised %
change
2011 2014
R million %
Division 30 - Food products and beverages 14 750 14 734 273 223 364 120 10,0 5,4 4,0
Division 31 - Textiles, clothing, leather and footwear 1 112 1 619 43 854 46 225 1,8 2,5 3,5
Division 32 - Wood, wood products, paper, publishing and printing
3 903 7 067 92 185 115 812 7,9 4,2 6,1
Division 33 - Coke, petroleum, chemical products, rubber and plastic
26 153 39 267 485 136 731 597 14,7 5,4 5,4
Division 34 - Glass and other non-metallic mineral products 48 3 459 48 884 63 336 9,0 0,1 5,5
Division 35 - Metals, metal products, machinery and equipment
13 677 10 005 302 687 345 624 4,5 4,5 2,9
Division 36 - Electrical machinery and apparatus 3 159 2 811 48 297 66 288 11,1 6,5 4,2
Division 37 - Telecommunication, medical and optical equipment and watches and clocks
449 763 13 687 15 828 5,0 3,3 4,8
Division 38 - Transport equipment 9 941 8 930 239 170 308 908 8,9 4,2 2,9
Division 39 - Furniture, other manufacturing and recycling 4 598 5 329 55 163 56 414 0,8 8,3 9,4
Total 77 790 93 984 1 602 286 2 114 152 9,7 4,9 4,4
1 In 2014, turnover does not include rental income. Rental income in 2011 made up 0,2% of the total turnover. 2 Net profit after tax divided by turnover multiplied by 100.
Statistics South Africa 23
Manufacturing industry: Financial, Report No. 30-02-03 (2014)
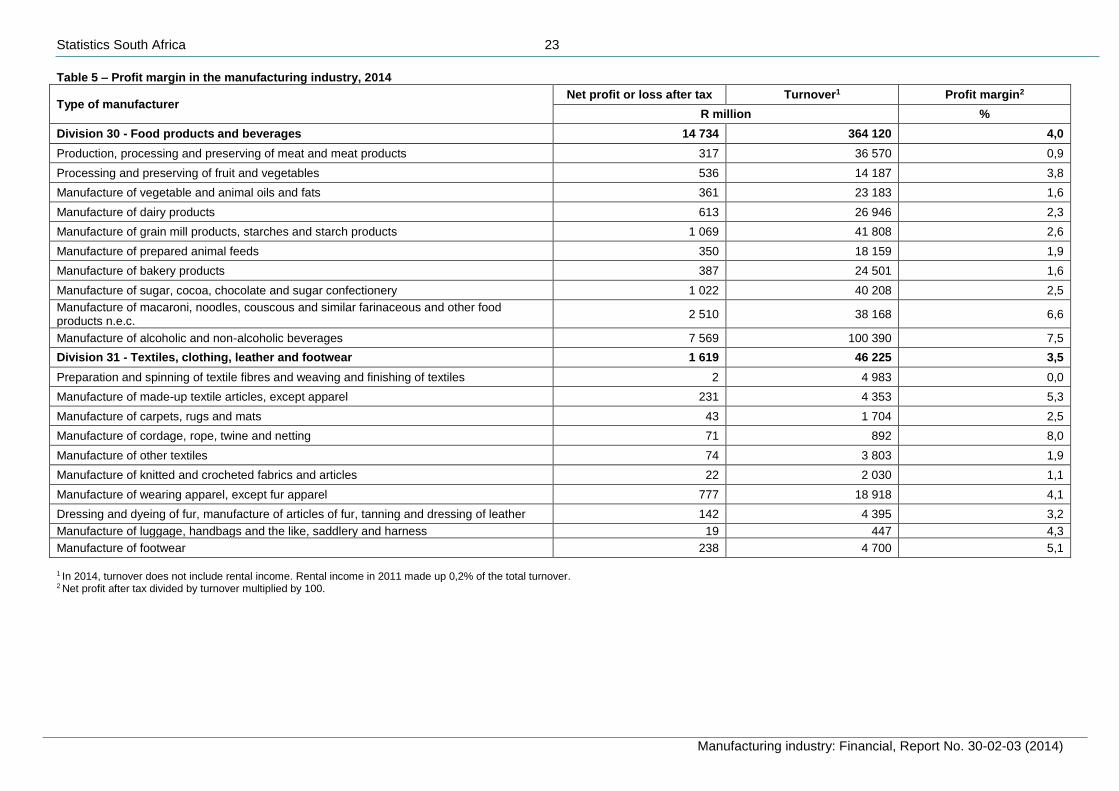
Table 5 – Profit margin in the manufacturing industry, 2014
Type of manufacturer Net profit or loss after tax Turnover1 Profit margin2
R million %
Division 30 - Food products and beverages 14 734 364 120 4,0
Production, processing and preserving of meat and meat products 317 36 570 0,9
Processing and preserving of fruit and vegetables 536 14 187 3,8
Manufacture of vegetable and animal oils and fats 361 23 183 1,6
Manufacture of dairy products 613 26 946 2,3
Manufacture of grain mill products, starches and starch products 1 069 41 808 2,6
Manufacture of prepared animal feeds 350 18 159 1,9
Manufacture of bakery products 387 24 501 1,6
Manufacture of sugar, cocoa, chocolate and sugar confectionery 1 022 40 208 2,5
Manufacture of macaroni, noodles, couscous and similar farinaceous and other food products n.e.c.
2 510 38 168 6,6
Manufacture of alcoholic and non-alcoholic beverages 7 569 100 390 7,5
Division 31 - Textiles, clothing, leather and footwear 1 619 46 225 3,5
Preparation and spinning of textile fibres and weaving and finishing of textiles 2 4 983 0,0
Manufacture of made-up textile articles, except apparel 231 4 353 5,3
Manufacture of carpets, rugs and mats 43 1 704 2,5
Manufacture of cordage, rope, twine and netting 71 892 8,0
Manufacture of other textiles 74 3 803 1,9
Manufacture of knitted and crocheted fabrics and articles 22 2 030 1,1
Manufacture of wearing apparel, except fur apparel 777 18 918 4,1
Dressing and dyeing of fur, manufacture of articles of fur, tanning and dressing of leather 142 4 395 3,2
Manufacture of luggage, handbags and the like, saddlery and harness 19 447 4,3
Manufacture of footwear 238 4 700 5,1
1 In 2014, turnover does not include rental income. Rental income in 2011 made up 0,2% of the total turnover. 2 Net profit after tax divided by turnover multiplied by 100.
Statistics South Africa 24
Manufacturing industry: Financial, Report No. 30-02-03 (2014)
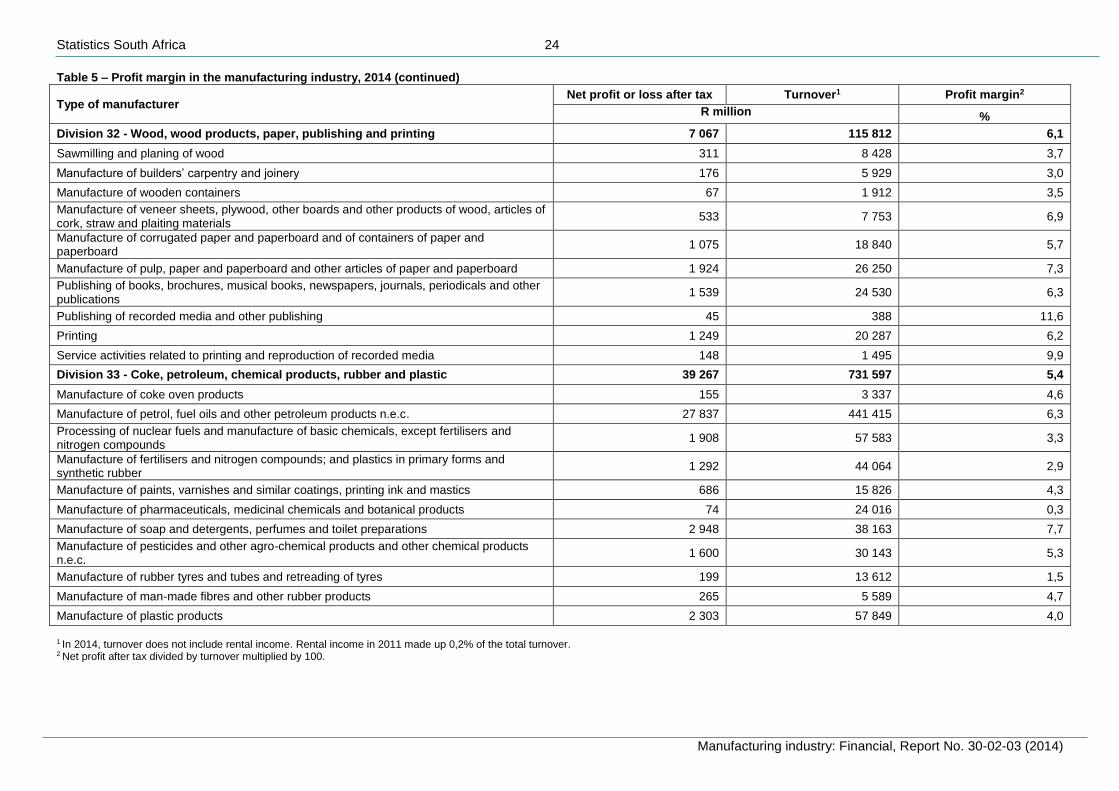
Table 5 – Profit margin in the manufacturing industry, 2014 (continued)
Type of manufacturer Net profit or loss after tax Turnover1 Profit margin2
R million %
Division 32 - Wood, wood products, paper, publishing and printing 7 067 115 812 6,1
Sawmilling and planing of wood 311 8 428 3,7
Manufacture of builders’ carpentry and joinery 176 5 929 3,0
Manufacture of wooden containers 67 1 912 3,5
Manufacture of veneer sheets, plywood, other boards and other products of wood, articles of cork, straw and plaiting materials
533 7 753 6,9
Manufacture of corrugated paper and paperboard and of containers of paper and paperboard
1 075 18 840 5,7
Manufacture of pulp, paper and paperboard and other articles of paper and paperboard 1 924 26 250 7,3
Publishing of books, brochures, musical books, newspapers, journals, periodicals and other publications
1 539 24 530 6,3
Publishing of recorded media and other publishing 45 388 11,6
Printing 1 249 20 287 6,2
Service activities related to printing and reproduction of recorded media 148 1 495 9,9
Division 33 - Coke, petroleum, chemical products, rubber and plastic 39 267 731 597 5,4
Manufacture of coke oven products 155 3 337 4,6
Manufacture of petrol, fuel oils and other petroleum products n.e.c. 27 837 441 415 6,3
Processing of nuclear fuels and manufacture of basic chemicals, except fertilisers and nitrogen compounds
1 908 57 583 3,3
Manufacture of fertilisers and nitrogen compounds; and plastics in primary forms and synthetic rubber
1 292 44 064 2,9
Manufacture of paints, varnishes and similar coatings, printing ink and mastics 686 15 826 4,3
Manufacture of pharmaceuticals, medicinal chemicals and botanical products 74 24 016 0,3
Manufacture of soap and detergents, perfumes and toilet preparations 2 948 38 163 7,7
Manufacture of pesticides and other agro-chemical products and other chemical products n.e.c.
1 600 30 143 5,3
Manufacture of rubber tyres and tubes and retreading of tyres 199 13 612 1,5
Manufacture of man-made fibres and other rubber products 265 5 589 4,7
Manufacture of plastic products 2 303 57 849 4,0
1 In 2014, turnover does not include rental income. Rental income in 2011 made up 0,2% of the total turnover. 2 Net profit after tax divided by turnover multiplied by 100.
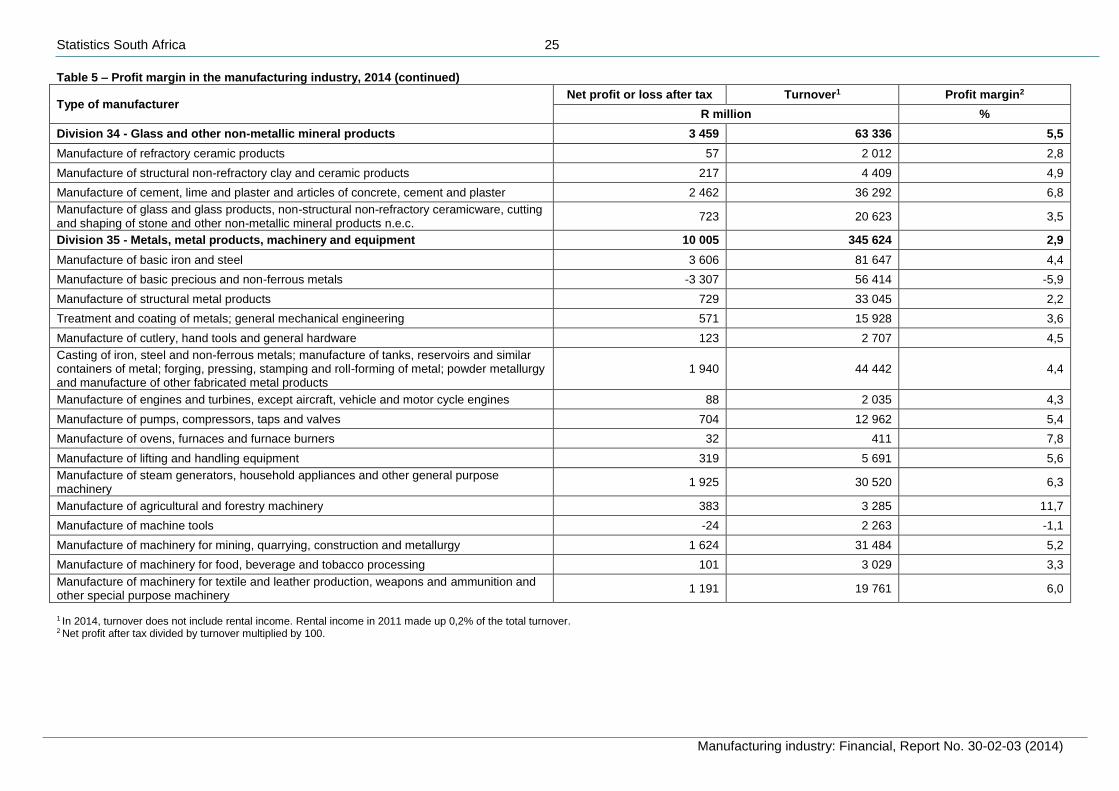
Statistics South Africa 25
Manufacturing industry: Financial, Report No. 30-02-03 (2014)
Table 5 – Profit margin in the manufacturing industry, 2014 (continued)
Type of manufacturer Net profit or loss after tax Turnover1 Profit margin2
R million %
Division 34 - Glass and other non-metallic mineral products 3 459 63 336 5,5
Manufacture of refractory ceramic products 57 2 012 2,8
Manufacture of structural non-refractory clay and ceramic products 217 4 409 4,9
Manufacture of cement, lime and plaster and articles of concrete, cement and plaster 2 462 36 292 6,8
Manufacture of glass and glass products, non-structural non-refractory ceramicware, cutting and shaping of stone and other non-metallic mineral products n.e.c.
723 20 623 3,5
Division 35 - Metals, metal products, machinery and equipment 10 005 345 624 2,9
Manufacture of basic iron and steel 3 606 81 647 4,4
Manufacture of basic precious and non-ferrous metals -3 307 56 414 -5,9
Manufacture of structural metal products 729 33 045 2,2
Treatment and coating of metals; general mechanical engineering 571 15 928 3,6
Manufacture of cutlery, hand tools and general hardware 123 2 707 4,5
Casting of iron, steel and non-ferrous metals; manufacture of tanks, reservoirs and similar containers of metal; forging, pressing, stamping and roll-forming of metal; powder metallurgy and manufacture of other fabricated metal products
1 940 44 442 4,4
Manufacture of engines and turbines, except aircraft, vehicle and motor cycle engines 88 2 035 4,3
Manufacture of pumps, compressors, taps and valves 704 12 962 5,4
Manufacture of ovens, furnaces and furnace burners 32 411 7,8
Manufacture of lifting and handling equipment 319 5 691 5,6
Manufacture of steam generators, household appliances and other general purpose machinery
1 925 30 520 6,3
Manufacture of agricultural and forestry machinery 383 3 285 11,7
Manufacture of machine tools -24 2 263 -1,1
Manufacture of machinery for mining, quarrying, construction and metallurgy 1 624 31 484 5,2
Manufacture of machinery for food, beverage and tobacco processing 101 3 029 3,3
Manufacture of machinery for textile and leather production, weapons and ammunition and other special purpose machinery
1 191 19 761 6,0
1 In 2014, turnover does not include rental income. Rental income in 2011 made up 0,2% of the total turnover. 2 Net profit after tax divided by turnover multiplied by 100.
Statistics South Africa 26
Manufacturing industry: Financial, Report No. 30-02-03 (2014)
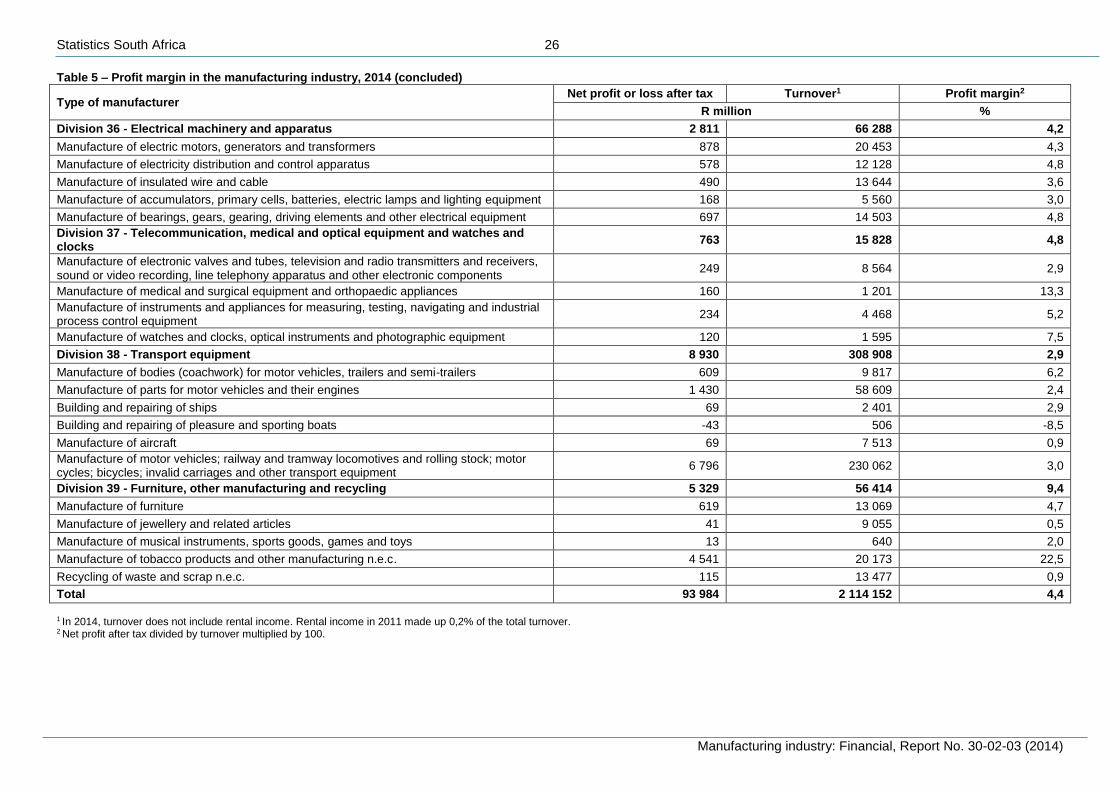
Table 5 – Profit margin in the manufacturing industry, 2014 (concluded)
Type of manufacturer Net profit or loss after tax Turnover1 Profit margin2
R million %
Division 36 - Electrical machinery and apparatus 2 811 66 288 4,2
Manufacture of electric motors, generators and transformers 878 20 453 4,3
Manufacture of electricity distribution and control apparatus 578 12 128 4,8
Manufacture of insulated wire and cable 490 13 644 3,6
Manufacture of accumulators, primary cells, batteries, electric lamps and lighting equipment 168 5 560 3,0
Manufacture of bearings, gears, gearing, driving elements and other electrical equipment 697 14 503 4,8
Division 37 - Telecommunication, medical and optical equipment and watches and clocks
763 15 828 4,8
Manufacture of electronic valves and tubes, television and radio transmitters and receivers, sound or video recording, line telephony apparatus and other electronic components
249 8 564 2,9
Manufacture of medical and surgical equipment and orthopaedic appliances 160 1 201 13,3
Manufacture of instruments and appliances for measuring, testing, navigating and industrial process control equipment
234 4 468 5,2
Manufacture of watches and clocks, optical instruments and photographic equipment 120 1 595 7,5
Division 38 - Transport equipment 8 930 308 908 2,9
Manufacture of bodies (coachwork) for motor vehicles, trailers and semi-trailers 609 9 817 6,2
Manufacture of parts for motor vehicles and their engines 1 430 58 609 2,4
Building and repairing of ships 69 2 401 2,9
Building and repairing of pleasure and sporting boats -43 506 -8,5
Manufacture of aircraft 69 7 513 0,9
Manufacture of motor vehicles; railway and tramway locomotives and rolling stock; motor cycles; bicycles; invalid carriages and other transport equipment
6 796 230 062 3,0
Division 39 - Furniture, other manufacturing and recycling 5 329 56 414 9,4
Manufacture of furniture 619 13 069 4,7
Manufacture of jewellery and related articles 41 9 055 0,5
Manufacture of musical instruments, sports goods, games and toys 13 640 2,0
Manufacture of tobacco products and other manufacturing n.e.c. 4 541 20 173 22,5
Recycling of waste and scrap n.e.c. 115 13 477 0,9
Total 93 984 2 114 152 4,4
1 In 2014, turnover does not include rental income. Rental income in 2011 made up 0,2% of the total turnover. 2 Net profit after tax divided by turnover multiplied by 100.
Statistics South Africa 27
Manufacturing industry: Financial, Report No. 30-02-03 (2014)
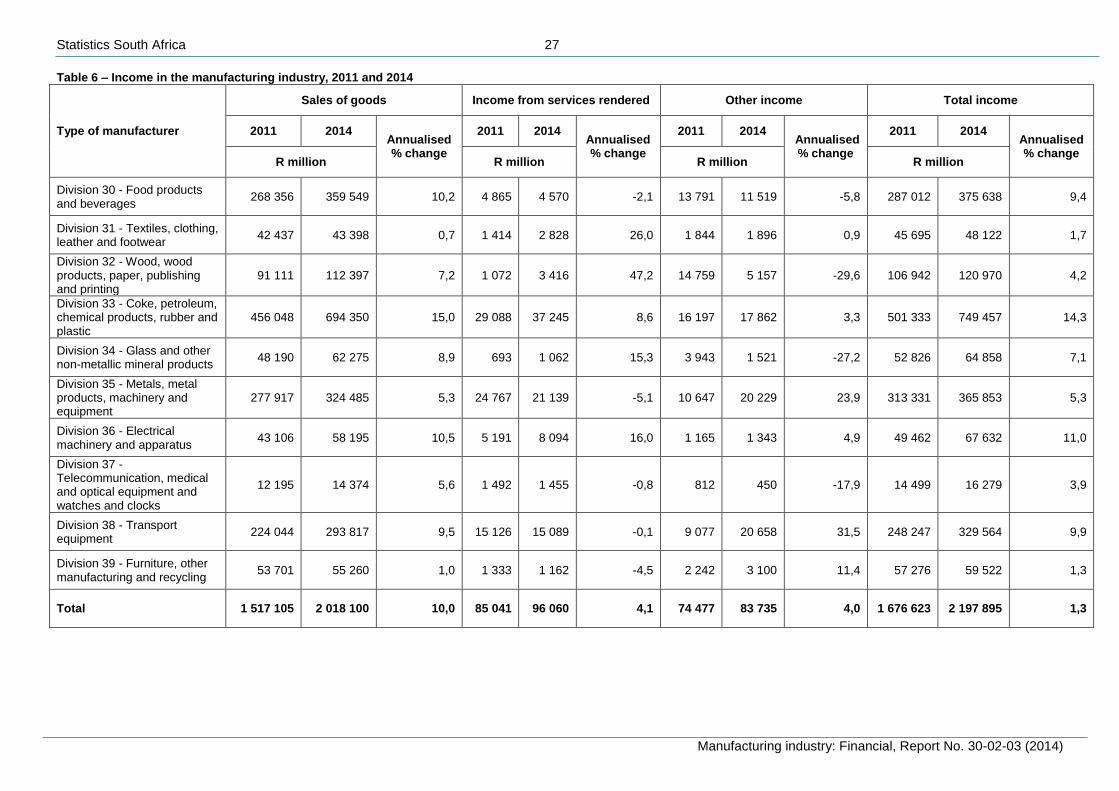
Table 6 – Income in the manufacturing industry, 2011 and 2014
Type of manufacturer
Sales of goods Income from services rendered Other income Total income
2011 2014 Annualised % change
2011 2014 Annualised % change
2011 2014 Annualised % change
2011 2014 Annualised % change
R million R million R million R million
Division 30 - Food products and beverages
268 356 359 549 10,2 4 865 4 570 -2,1 13 791 11 519 -5,8 287 012 375 638 9,4
Division 31 - Textiles, clothing, leather and footwear
42 437 43 398 0,7 1 414 2 828 26,0 1 844 1 896 0,9 45 695 48 122 1,7
Division 32 - Wood, wood products, paper, publishing and printing
91 111 112 397 7,2 1 072 3 416 47,2 14 759 5 157 -29,6 106 942 120 970 4,2
Division 33 - Coke, petroleum, chemical products, rubber and plastic
456 048 694 350 15,0 29 088 37 245 8,6 16 197 17 862 3,3 501 333 749 457 14,3
Division 34 - Glass and other non-metallic mineral products
48 190 62 275 8,9 693 1 062 15,3 3 943 1 521 -27,2 52 826 64 858 7,1
Division 35 - Metals, metal products, machinery and equipment
277 917 324 485 5,3 24 767 21 139 -5,1 10 647 20 229 23,9 313 331 365 853 5,3
Division 36 - Electrical machinery and apparatus
43 106 58 195 10,5 5 191 8 094 16,0 1 165 1 343 4,9 49 462 67 632 11,0
Division 37 - Telecommunication, medical and optical equipment and watches and clocks
12 195 14 374 5,6 1 492 1 455 -0,8 812 450 -17,9 14 499 16 279 3,9
Division 38 - Transport equipment
224 044 293 817 9,5 15 126 15 089 -0,1 9 077 20 658 31,5 248 247 329 564 9,9
Division 39 - Furniture, other manufacturing and recycling
53 701 55 260 1,0 1 333 1 162 -4,5 2 242 3 100 11,4 57 276 59 522 1,3
Total 1 517 105 2 018 100 10,0 85 041 96 060 4,1 74 477 83 735 4,0 1 676 623 2 197 895 1,3
Statistics South Africa 28
Manufacturing industry: Financial, Report No. 30-02-03 (2014)
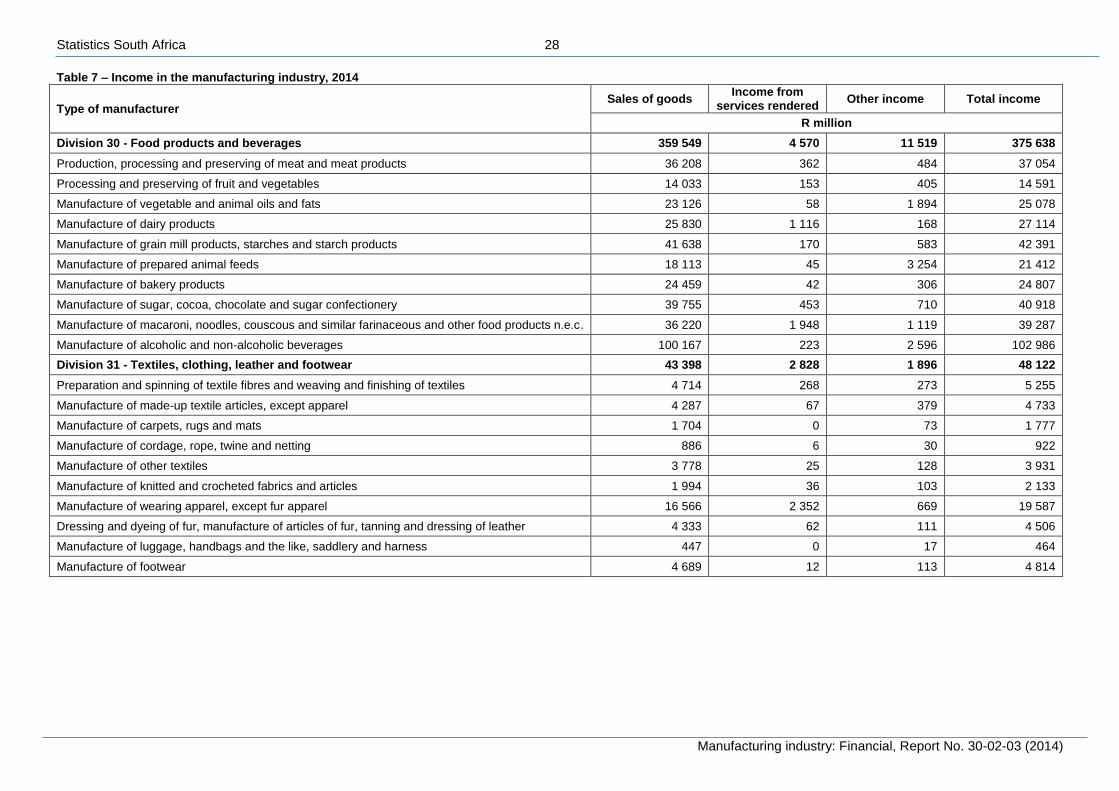
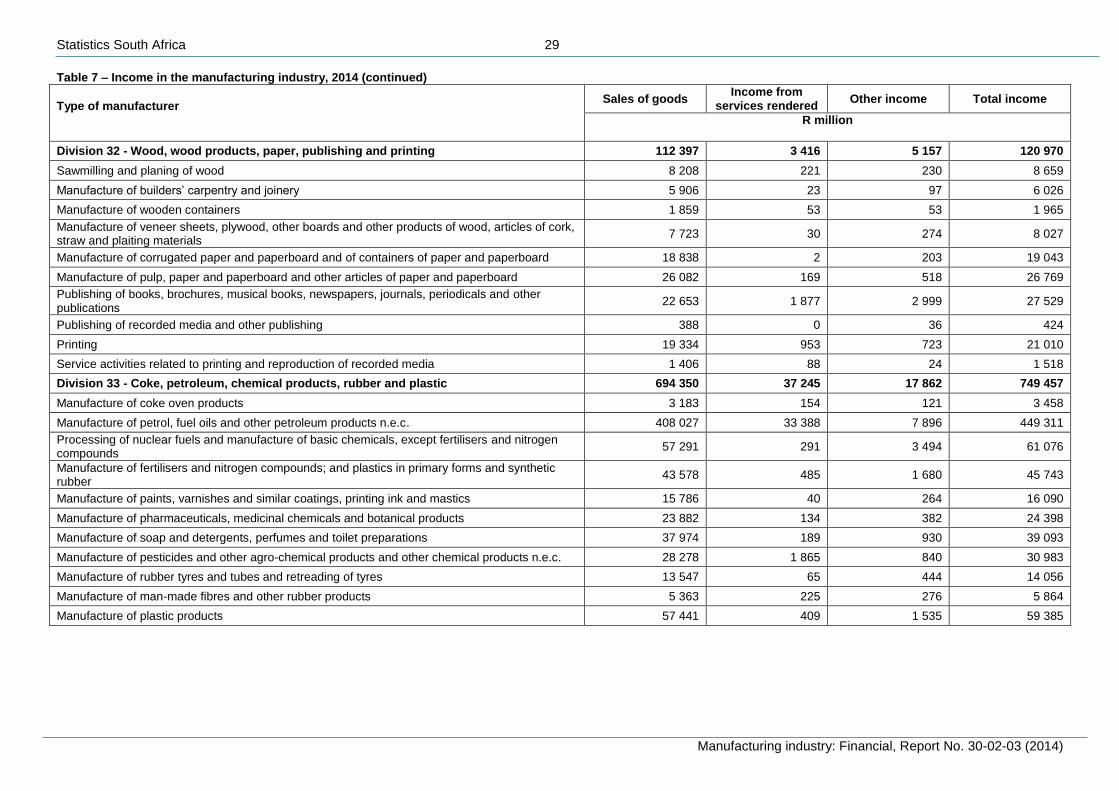
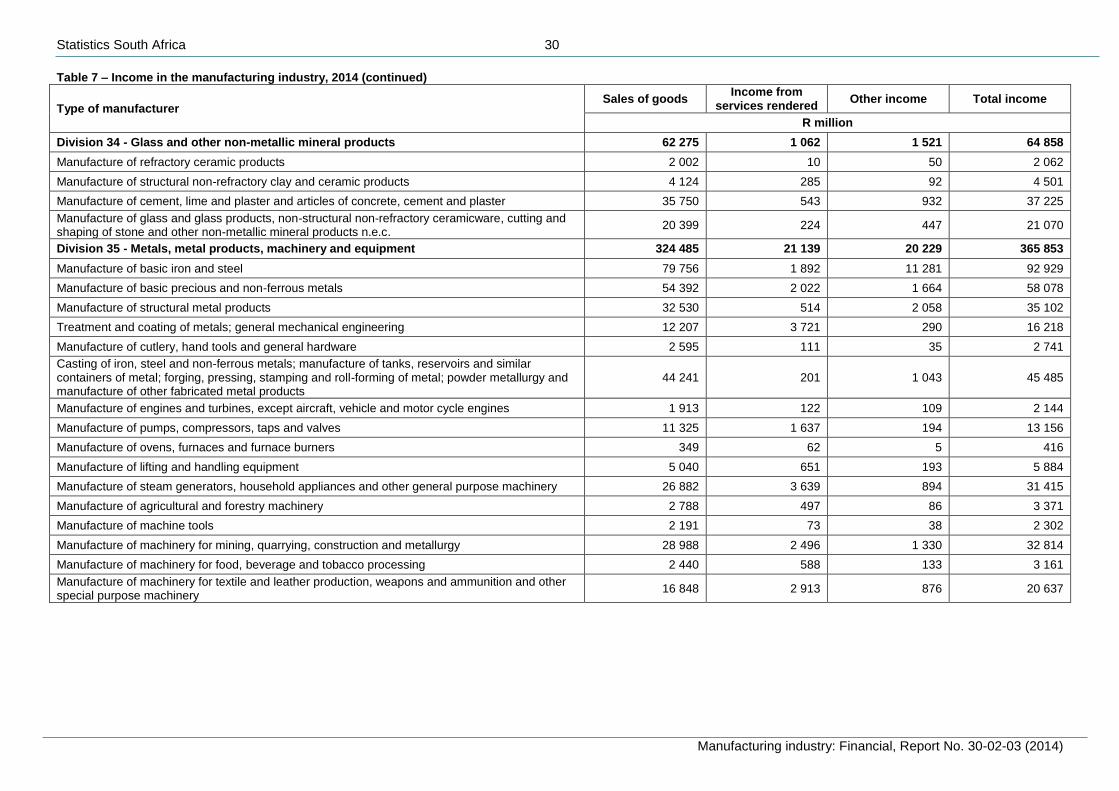
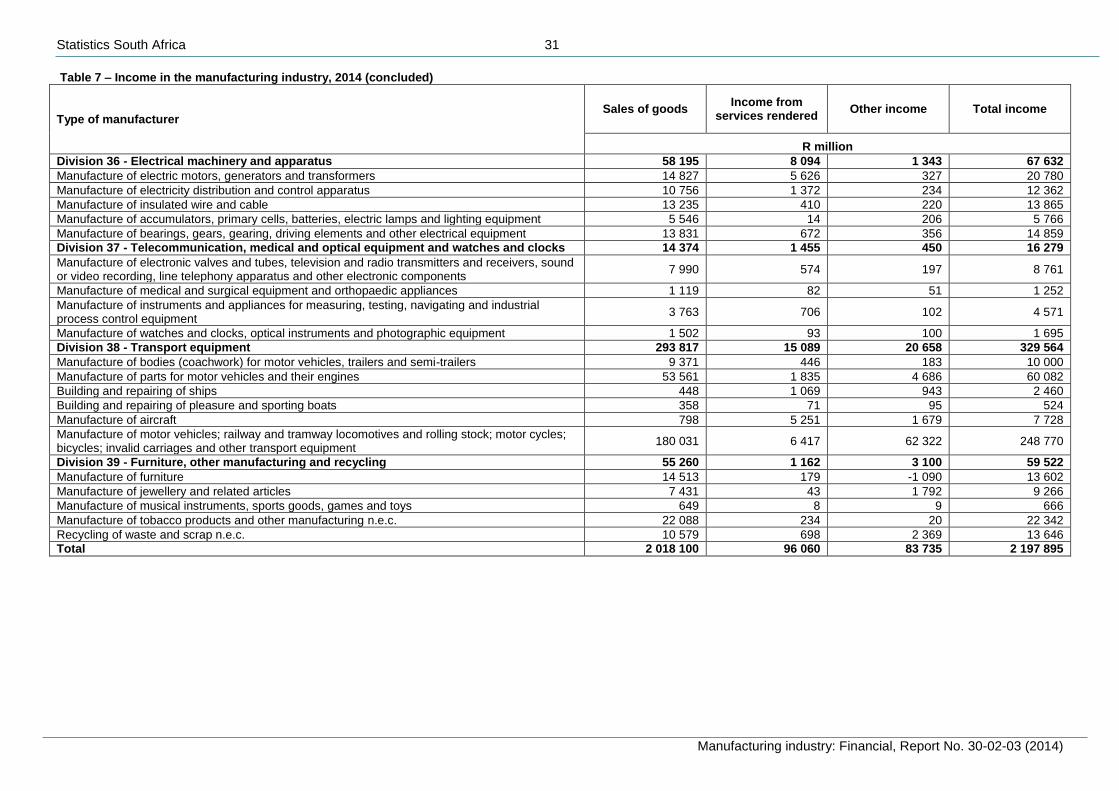
Table 7 – Income in the manufacturing industry, 2014
Type of manufacturer Sales of goods
Income from services rendered
Other income Total income
R million
Division 30 - Food products and beverages 359 549 4 570 11 519 375 638
Production, processing and preserving of meat and meat products 36 208 362 484 37 054
Processing and preserving of fruit and vegetables 14 033 153 405 14 591
Manufacture of vegetable and animal oils and fats 23 126 58 1 894 25 078
Manufacture of dairy products 25 830 1 116 168 27 114
Manufacture of grain mill products, starches and starch products 41 638 170 583 42 391
Manufacture of prepared animal feeds 18 113 45 3 254 21 412
Manufacture of bakery products 24 459 42 306 24 807
Manufacture of sugar, cocoa, chocolate and sugar confectionery 39 755 453 710 40 918
Manufacture of macaroni, noodles, couscous and similar farinaceous and other food products n.e.c. 36 220 1 948 1 119 39 287
Manufacture of alcoholic and non-alcoholic beverages 100 167 223 2 596 102 986
Division 31 - Textiles, clothing, leather and footwear 43 398 2 828 1 896 48 122
Preparation and spinning of textile fibres and weaving and finishing of textiles 4 714 268 273 5 255
Manufacture of made-up textile articles, except apparel 4 287 67 379 4 733
Manufacture of carpets, rugs and mats 1 704 0 73 1 777
Manufacture of cordage, rope, twine and netting 886 6 30 922
Manufacture of other textiles 3 778 25 128 3 931
Manufacture of knitted and crocheted fabrics and articles 1 994 36 103 2 133
Manufacture of wearing apparel, except fur apparel 16 566 2 352 669 19 587
Dressing and dyeing of fur, manufacture of articles of fur, tanning and dressing of leather 4 333 62 111 4 506
Manufacture of luggage, handbags and the like, saddlery and harness 447 0 17 464
Manufacture of footwear 4 689 12 113 4 814
Statistics South Africa 29
Manufacturing industry: Financial, Report No. 30-02-03 (2014)
Table 7 – Income in the manufacturing industry, 2014 (continued)
Type of manufacturer
Sales of goods Income from
services rendered Other income Total income
R million
Division 32 - Wood, wood products, paper, publishing and printing 112 397 3 416 5 157 120 970
Sawmilling and planing of wood 8 208 221 230 8 659
Manufacture of builders’ carpentry and joinery 5 906 23 97 6 026
Manufacture of wooden containers 1 859 53 53 1 965
Manufacture of veneer sheets, plywood, other boards and other products of wood, articles of cork, straw and plaiting materials
7 723 30 274 8 027
Manufacture of corrugated paper and paperboard and of containers of paper and paperboard 18 838 2 203 19 043
Manufacture of pulp, paper and paperboard and other articles of paper and paperboard 26 082 169 518 26 769
Publishing of books, brochures, musical books, newspapers, journals, periodicals and other publications
22 653 1 877 2 999 27 529
Publishing of recorded media and other publishing 388 0 36 424
Printing 19 334 953 723 21 010
Service activities related to printing and reproduction of recorded media 1 406 88 24 1 518
Division 33 - Coke, petroleum, chemical products, rubber and plastic 694 350 37 245 17 862 749 457
Manufacture of coke oven products 3 183 154 121 3 458
Manufacture of petrol, fuel oils and other petroleum products n.e.c. 408 027 33 388 7 896 449 311
Processing of nuclear fuels and manufacture of basic chemicals, except fertilisers and nitrogen compounds
57 291 291 3 494 61 076
Manufacture of fertilisers and nitrogen compounds; and plastics in primary forms and synthetic rubber
43 578 485 1 680 45 743
Manufacture of paints, varnishes and similar coatings, printing ink and mastics 15 786 40 264 16 090
Manufacture of pharmaceuticals, medicinal chemicals and botanical products 23 882 134 382 24 398
Manufacture of soap and detergents, perfumes and toilet preparations 37 974 189 930 39 093
Manufacture of pesticides and other agro-chemical products and other chemical products n.e.c. 28 278 1 865 840 30 983
Manufacture of rubber tyres and tubes and retreading of tyres 13 547 65 444 14 056
Manufacture of man-made fibres and other rubber products 5 363 225 276 5 864
Manufacture of plastic products 57 441 409 1 535 59 385
Statistics South Africa 30
Manufacturing industry: Financial, Report No. 30-02-03 (2014)
Table 7 – Income in the manufacturing industry, 2014 (continued)
Type of manufacturer Sales of goods
Income from services rendered
Other income Total income
R million
Division 34 - Glass and other non-metallic mineral products 62 275 1 062 1 521 64 858
Manufacture of refractory ceramic products 2 002 10 50 2 062
Manufacture of structural non-refractory clay and ceramic products 4 124 285 92 4 501
Manufacture of cement, lime and plaster and articles of concrete, cement and plaster 35 750 543 932 37 225
Manufacture of glass and glass products, non-structural non-refractory ceramicware, cutting and shaping of stone and other non-metallic mineral products n.e.c.
20 399 224 447 21 070
Division 35 - Metals, metal products, machinery and equipment 324 485 21 139 20 229 365 853
Manufacture of basic iron and steel 79 756 1 892 11 281 92 929
Manufacture of basic precious and non-ferrous metals 54 392 2 022 1 664 58 078
Manufacture of structural metal products 32 530 514 2 058 35 102
Treatment and coating of metals; general mechanical engineering 12 207 3 721 290 16 218
Manufacture of cutlery, hand tools and general hardware 2 595 111 35 2 741
Casting of iron, steel and non-ferrous metals; manufacture of tanks, reservoirs and similar containers of metal; forging, pressing, stamping and roll-forming of metal; powder metallurgy and manufacture of other fabricated metal products
44 241 201 1 043 45 485
Manufacture of engines and turbines, except aircraft, vehicle and motor cycle engines 1 913 122 109 2 144
Manufacture of pumps, compressors, taps and valves 11 325 1 637 194 13 156
Manufacture of ovens, furnaces and furnace burners 349 62 5 416
Manufacture of lifting and handling equipment 5 040 651 193 5 884
Manufacture of steam generators, household appliances and other general purpose machinery 26 882 3 639 894 31 415
Manufacture of agricultural and forestry machinery 2 788 497 86 3 371
Manufacture of machine tools 2 191 73 38 2 302
Manufacture of machinery for mining, quarrying, construction and metallurgy 28 988 2 496 1 330 32 814
Manufacture of machinery for food, beverage and tobacco processing 2 440 588 133 3 161
Manufacture of machinery for textile and leather production, weapons and ammunition and other special purpose machinery
16 848 2 913 876 20 637
Statistics South Africa 31
Manufacturing industry: Financial, Report No. 30-02-03 (2014)
Table 7 – Income in the manufacturing industry, 2014 (concluded)
Type of manufacturer Sales of goods
Income from services rendered
Other income Total income
R million
Division 36 - Electrical machinery and apparatus 58 195 8 094 1 343 67 632
Manufacture of electric motors, generators and transformers 14 827 5 626 327 20 780
Manufacture of electricity distribution and control apparatus 10 756 1 372 234 12 362
Manufacture of insulated wire and cable 13 235 410 220 13 865
Manufacture of accumulators, primary cells, batteries, electric lamps and lighting equipment 5 546 14 206 5 766
Manufacture of bearings, gears, gearing, driving elements and other electrical equipment 13 831 672 356 14 859
Division 37 - Telecommunication, medical and optical equipment and watches and clocks 14 374 1 455 450 16 279
Manufacture of electronic valves and tubes, television and radio transmitters and receivers, sound or video recording, line telephony apparatus and other electronic components
7 990 574 197 8 761
Manufacture of medical and surgical equipment and orthopaedic appliances 1 119 82 51 1 252
Manufacture of instruments and appliances for measuring, testing, navigating and industrial process control equipment
3 763 706 102 4 571
Manufacture of watches and clocks, optical instruments and photographic equipment 1 502 93 100 1 695
Division 38 - Transport equipment 293 817 15 089 20 658 329 564
Manufacture of bodies (coachwork) for motor vehicles, trailers and semi-trailers 9 371 446 183 10 000
Manufacture of parts for motor vehicles and their engines 53 561 1 835 4 686 60 082
Building and repairing of ships 448 1 069 943 2 460
Building and repairing of pleasure and sporting boats 358 71 95 524
Manufacture of aircraft 798 5 251 1 679 7 728
Manufacture of motor vehicles; railway and tramway locomotives and rolling stock; motor cycles; bicycles; invalid carriages and other transport equipment
180 031 6 417 62 322 248 770
Division 39 - Furniture, other manufacturing and recycling 55 260 1 162 3 100 59 522
Manufacture of furniture 14 513 179 -1 090 13 602
Manufacture of jewellery and related articles 7 431 43 1 792 9 266
Manufacture of musical instruments, sports goods, games and toys 649 8 9 666
Manufacture of tobacco products and other manufacturing n.e.c. 22 088 234 20 22 342
Recycling of waste and scrap n.e.c. 10 579 698 2 369 13 646
Total 2 018 100 96 060 83 735 2 197 895
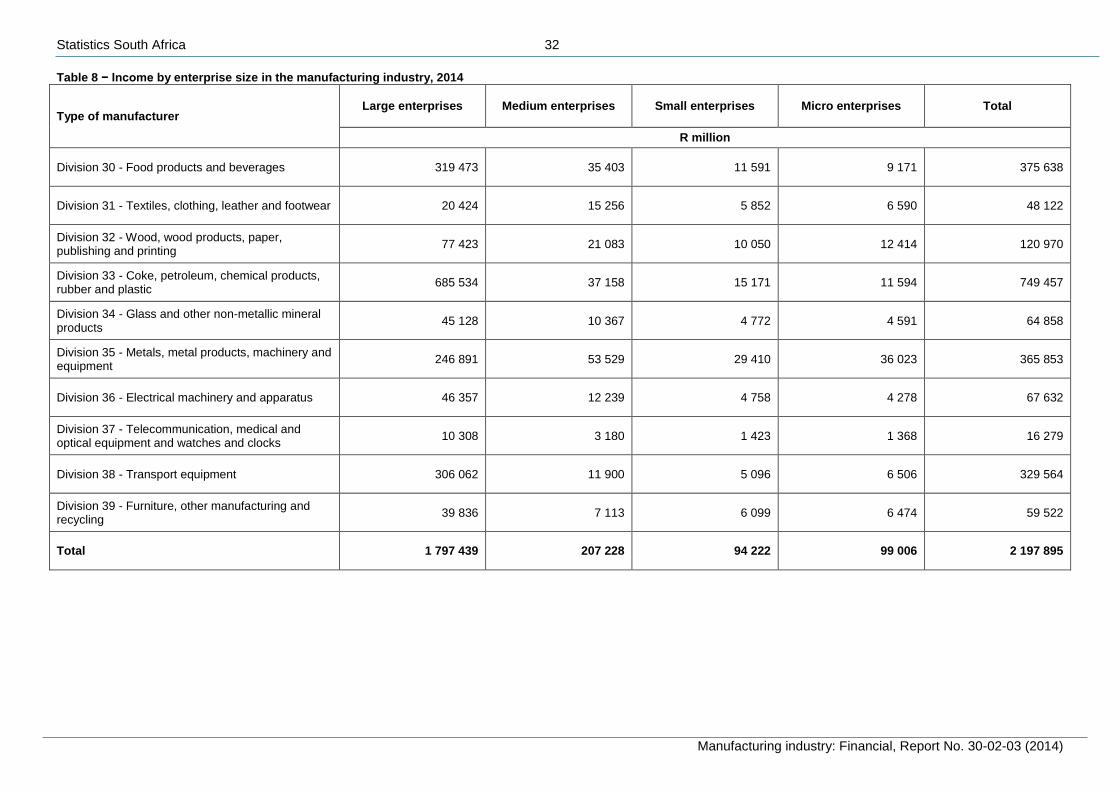
Statistics South Africa 32
Manufacturing industry: Financial, Report No. 30-02-03 (2014)
Table 8 − Income by enterprise size in the manufacturing industry, 2014
Type of manufacturer Large enterprises Medium enterprises Small enterprises Micro enterprises Total
R million
Division 30 - Food products and beverages 319 473 35 403 11 591 9 171 375 638
Division 31 - Textiles, clothing, leather and footwear 20 424 15 256 5 852 6 590 48 122
Division 32 - Wood, wood products, paper, publishing and printing
77 423 21 083 10 050 12 414 120 970
Division 33 - Coke, petroleum, chemical products, rubber and plastic
685 534 37 158 15 171 11 594 749 457
Division 34 - Glass and other non-metallic mineral products
45 128 10 367 4 772 4 591 64 858
Division 35 - Metals, metal products, machinery and equipment
246 891 53 529 29 410 36 023 365 853
Division 36 - Electrical machinery and apparatus 46 357 12 239 4 758 4 278 67 632
Division 37 - Telecommunication, medical and optical equipment and watches and clocks
10 308 3 180 1 423 1 368 16 279
Division 38 - Transport equipment 306 062 11 900 5 096 6 506 329 564
Division 39 - Furniture, other manufacturing and recycling
39 836 7 113 6 099 6 474 59 522
Total 1 797 439 207 228 94 222 99 006 2 197 895
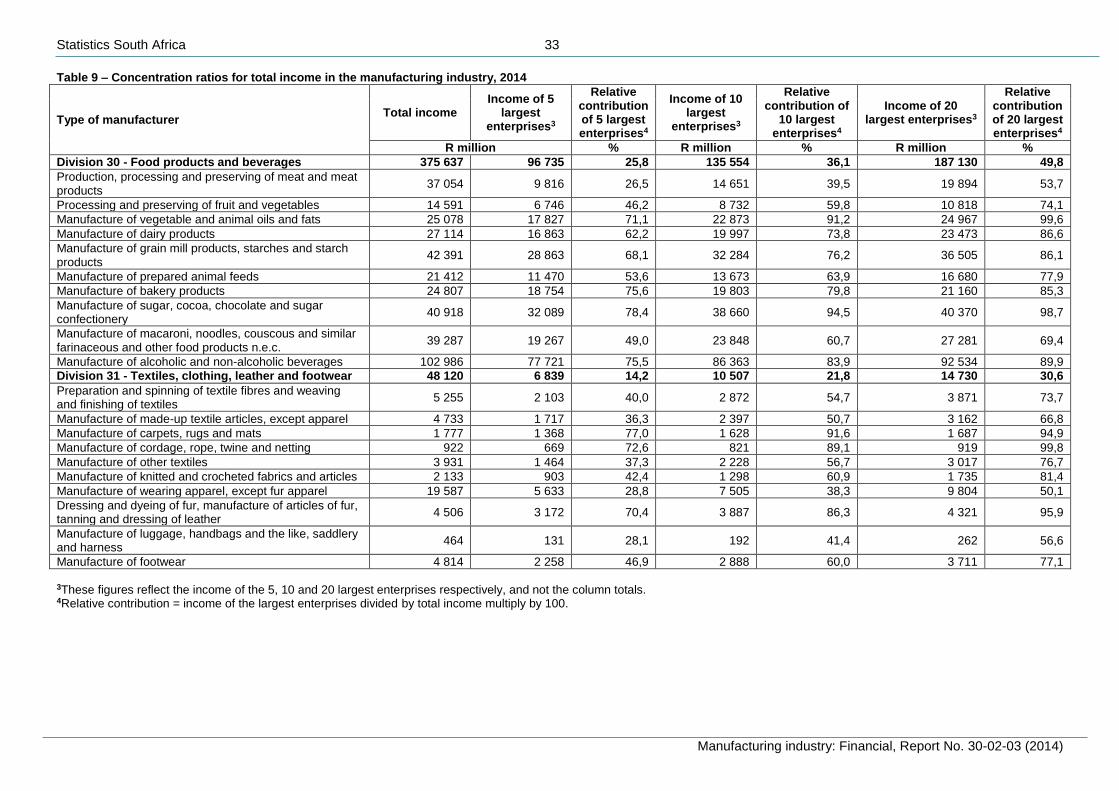
Statistics South Africa 33
Manufacturing industry: Financial, Report No. 30-02-03 (2014)
Table 9 – Concentration ratios for total income in the manufacturing industry, 2014
Type of manufacturer Total income
Income of 5 largest
enterprises3
Relative contribution of 5 largest enterprises4
Income of 10 largest
enterprises3
Relative contribution of
10 largest enterprises4
Income of 20 largest enterprises3
Relative contribution of 20 largest enterprises4
R million % R million % R million %
Division 30 - Food products and beverages 375 637 96 735 25,8 135 554 36,1 187 130 49,8
Production, processing and preserving of meat and meat products
37 054 9 816 26,5 14 651 39,5 19 894 53,7
Processing and preserving of fruit and vegetables 14 591 6 746 46,2 8 732 59,8 10 818 74,1
Manufacture of vegetable and animal oils and fats 25 078 17 827 71,1 22 873 91,2 24 967 99,6
Manufacture of dairy products 27 114 16 863 62,2 19 997 73,8 23 473 86,6
Manufacture of grain mill products, starches and starch products
42 391 28 863 68,1 32 284 76,2 36 505 86,1
Manufacture of prepared animal feeds 21 412 11 470 53,6 13 673 63,9 16 680 77,9
Manufacture of bakery products 24 807 18 754 75,6 19 803 79,8 21 160 85,3
Manufacture of sugar, cocoa, chocolate and sugar confectionery
40 918 32 089 78,4 38 660 94,5 40 370 98,7
Manufacture of macaroni, noodles, couscous and similar farinaceous and other food products n.e.c.
39 287 19 267 49,0 23 848 60,7 27 281 69,4
Manufacture of alcoholic and non-alcoholic beverages 102 986 77 721 75,5 86 363 83,9 92 534 89,9
Division 31 - Textiles, clothing, leather and footwear 48 120 6 839 14,2 10 507 21,8 14 730 30,6
Preparation and spinning of textile fibres and weaving and finishing of textiles
5 255 2 103 40,0 2 872 54,7 3 871 73,7
Manufacture of made-up textile articles, except apparel 4 733 1 717 36,3 2 397 50,7 3 162 66,8
Manufacture of carpets, rugs and mats 1 777 1 368 77,0 1 628 91,6 1 687 94,9
Manufacture of cordage, rope, twine and netting 922 669 72,6 821 89,1 919 99,8
Manufacture of other textiles 3 931 1 464 37,3 2 228 56,7 3 017 76,7
Manufacture of knitted and crocheted fabrics and articles 2 133 903 42,4 1 298 60,9 1 735 81,4
Manufacture of wearing apparel, except fur apparel 19 587 5 633 28,8 7 505 38,3 9 804 50,1
Dressing and dyeing of fur, manufacture of articles of fur, tanning and dressing of leather
4 506 3 172 70,4 3 887 86,3 4 321 95,9
Manufacture of luggage, handbags and the like, saddlery and harness
464 131 28,1 192 41,4 262 56,6
Manufacture of footwear 4 814 2 258 46,9 2 888 60,0 3 711 77,1
3These figures reflect the income of the 5, 10 and 20 largest enterprises respectively, and not the column totals. 4Relative contribution = income of the largest enterprises divided by total income multiply by 100.
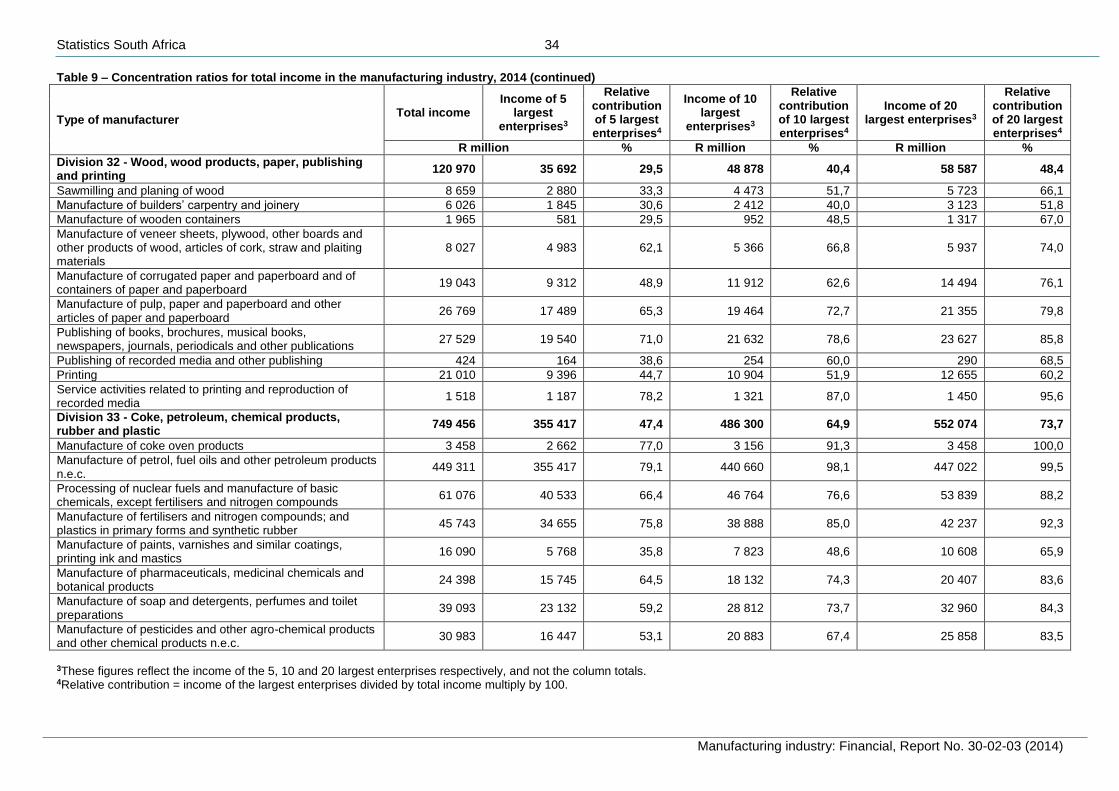
Statistics South Africa 34
Manufacturing industry: Financial, Report No. 30-02-03 (2014)
Table 9 – Concentration ratios for total income in the manufacturing industry, 2014 (continued)
Type of manufacturer Total income
Income of 5 largest
enterprises3
Relative contribution of 5 largest enterprises4
Income of 10 largest
enterprises3
Relative contribution of 10 largest enterprises4
Income of 20 largest enterprises3
Relative contribution of 20 largest enterprises4
R million % R million % R million %
Division 32 - Wood, wood products, paper, publishing and printing
120 970 35 692 29,5 48 878 40,4 58 587 48,4
Sawmilling and planing of wood 8 659 2 880 33,3 4 473 51,7 5 723 66,1
Manufacture of builders’ carpentry and joinery 6 026 1 845 30,6 2 412 40,0 3 123 51,8
Manufacture of wooden containers 1 965 581 29,5 952 48,5 1 317 67,0
Manufacture of veneer sheets, plywood, other boards and other products of wood, articles of cork, straw and plaiting materials
8 027 4 983 62,1 5 366 66,8 5 937 74,0
Manufacture of corrugated paper and paperboard and of containers of paper and paperboard
19 043 9 312 48,9 11 912 62,6 14 494 76,1
Manufacture of pulp, paper and paperboard and other articles of paper and paperboard
26 769 17 489 65,3 19 464 72,7 21 355 79,8
Publishing of books, brochures, musical books, newspapers, journals, periodicals and other publications
27 529 19 540 71,0 21 632 78,6 23 627 85,8
Publishing of recorded media and other publishing 424 164 38,6 254 60,0 290 68,5
Printing 21 010 9 396 44,7 10 904 51,9 12 655 60,2
Service activities related to printing and reproduction of recorded media
1 518 1 187 78,2 1 321 87,0 1 450 95,6
Division 33 - Coke, petroleum, chemical products, rubber and plastic
749 456 355 417 47,4 486 300 64,9 552 074 73,7
Manufacture of coke oven products 3 458 2 662 77,0 3 156 91,3 3 458 100,0
Manufacture of petrol, fuel oils and other petroleum products n.e.c.
449 311 355 417 79,1 440 660 98,1 447 022 99,5
Processing of nuclear fuels and manufacture of basic chemicals, except fertilisers and nitrogen compounds
61 076 40 533 66,4 46 764 76,6 53 839 88,2
Manufacture of fertilisers and nitrogen compounds; and plastics in primary forms and synthetic rubber
45 743 34 655 75,8 38 888 85,0 42 237 92,3
Manufacture of paints, varnishes and similar coatings, printing ink and mastics
16 090 5 768 35,8 7 823 48,6 10 608 65,9
Manufacture of pharmaceuticals, medicinal chemicals and botanical products
24 398 15 745 64,5 18 132 74,3 20 407 83,6
Manufacture of soap and detergents, perfumes and toilet preparations
39 093 23 132 59,2 28 812 73,7 32 960 84,3
Manufacture of pesticides and other agro-chemical products and other chemical products n.e.c.
30 983 16 447 53,1 20 883 67,4 25 858 83,5
3These figures reflect the income of the 5, 10 and 20 largest enterprises respectively, and not the column totals. 4Relative contribution = income of the largest enterprises divided by total income multiply by 100.
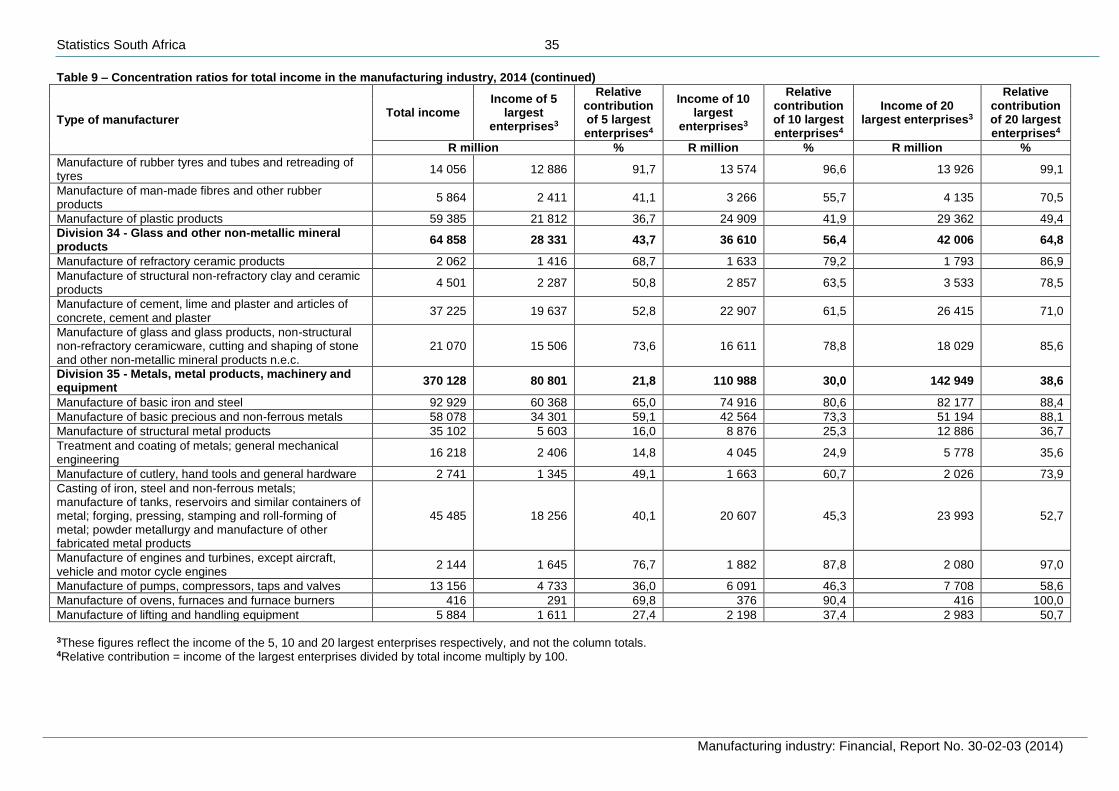
Statistics South Africa 35
Manufacturing industry: Financial, Report No. 30-02-03 (2014)
Table 9 – Concentration ratios for total income in the manufacturing industry, 2014 (continued)
Type of manufacturer Total income
Income of 5 largest
enterprises3
Relative contribution of 5 largest enterprises4
Income of 10 largest
enterprises3
Relative contribution of 10 largest enterprises4
Income of 20 largest enterprises3
Relative contribution of 20 largest enterprises4
R million % R million % R million %
Manufacture of rubber tyres and tubes and retreading of tyres
14 056 12 886 91,7 13 574 96,6 13 926 99,1
Manufacture of man-made fibres and other rubber products
5 864 2 411 41,1 3 266 55,7 4 135 70,5
Manufacture of plastic products 59 385 21 812 36,7 24 909 41,9 29 362 49,4
Division 34 - Glass and other non-metallic mineral products
64 858 28 331 43,7 36 610 56,4 42 006 64,8
Manufacture of refractory ceramic products 2 062 1 416 68,7 1 633 79,2 1 793 86,9
Manufacture of structural non-refractory clay and ceramic products
4 501 2 287 50,8 2 857 63,5 3 533 78,5
Manufacture of cement, lime and plaster and articles of concrete, cement and plaster
37 225 19 637 52,8 22 907 61,5 26 415 71,0
Manufacture of glass and glass products, non-structural non-refractory ceramicware, cutting and shaping of stone and other non-metallic mineral products n.e.c.
21 070 15 506 73,6 16 611 78,8 18 029 85,6
Division 35 - Metals, metal products, machinery and equipment
370 128 80 801 21,8 110 988 30,0 142 949 38,6
Manufacture of basic iron and steel 92 929 60 368 65,0 74 916 80,6 82 177 88,4
Manufacture of basic precious and non-ferrous metals 58 078 34 301 59,1 42 564 73,3 51 194 88,1
Manufacture of structural metal products 35 102 5 603 16,0 8 876 25,3 12 886 36,7
Treatment and coating of metals; general mechanical engineering
16 218 2 406 14,8 4 045 24,9 5 778 35,6
Manufacture of cutlery, hand tools and general hardware 2 741 1 345 49,1 1 663 60,7 2 026 73,9
Casting of iron, steel and non-ferrous metals; manufacture of tanks, reservoirs and similar containers of metal; forging, pressing, stamping and roll-forming of metal; powder metallurgy and manufacture of other fabricated metal products
45 485 18 256 40,1 20 607 45,3 23 993 52,7
Manufacture of engines and turbines, except aircraft, vehicle and motor cycle engines
2 144 1 645 76,7 1 882 87,8 2 080 97,0
Manufacture of pumps, compressors, taps and valves 13 156 4 733 36,0 6 091 46,3 7 708 58,6
Manufacture of ovens, furnaces and furnace burners 416 291 69,8 376 90,4 416 100,0
Manufacture of lifting and handling equipment 5 884 1 611 27,4 2 198 37,4 2 983 50,7
3These figures reflect the income of the 5, 10 and 20 largest enterprises respectively, and not the column totals. 4Relative contribution = income of the largest enterprises divided by total income multiply by 100.
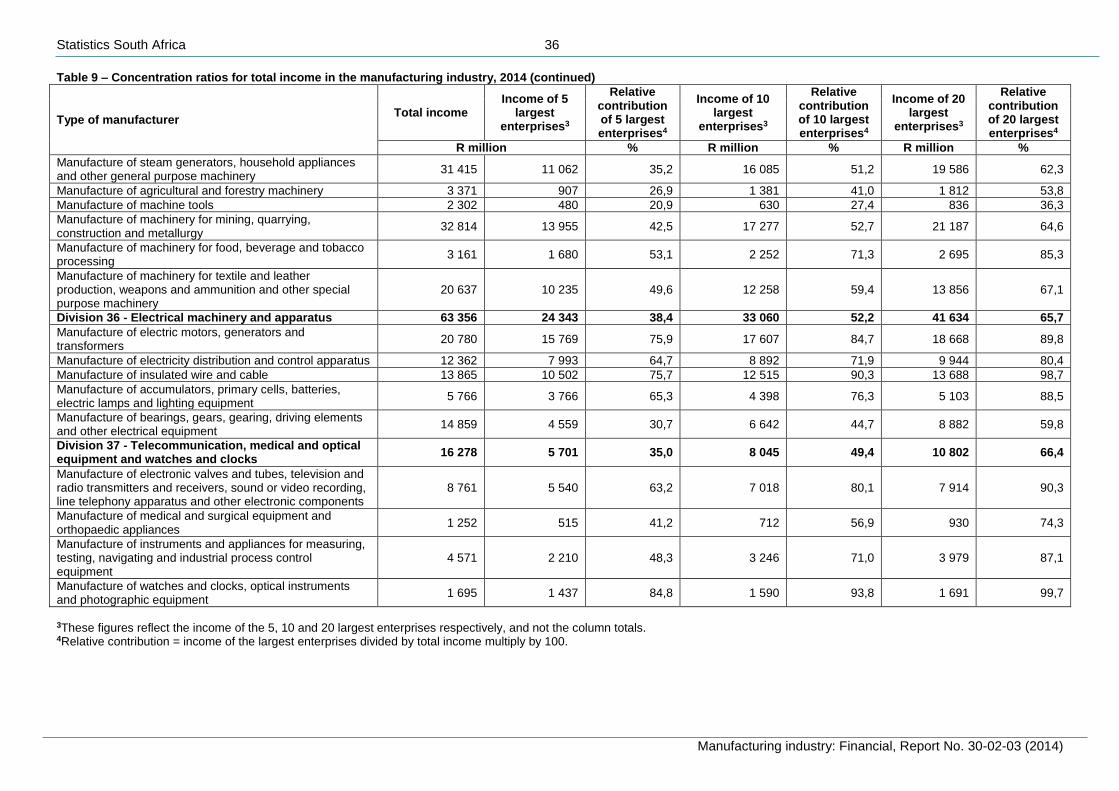
Statistics South Africa 36
Manufacturing industry: Financial, Report No. 30-02-03 (2014)
Table 9 – Concentration ratios for total income in the manufacturing industry, 2014 (continued)
Type of manufacturer Total income
Income of 5 largest
enterprises3
Relative contribution of 5 largest enterprises4
Income of 10 largest
enterprises3
Relative contribution of 10 largest enterprises4
Income of 20 largest
enterprises3
Relative contribution of 20 largest enterprises4
R million % R million % R million %
Manufacture of steam generators, household appliances and other general purpose machinery
31 415 11 062 35,2 16 085 51,2 19 586 62,3
Manufacture of agricultural and forestry machinery 3 371 907 26,9 1 381 41,0 1 812 53,8
Manufacture of machine tools 2 302 480 20,9 630 27,4 836 36,3
Manufacture of machinery for mining, quarrying, construction and metallurgy
32 814 13 955 42,5 17 277 52,7 21 187 64,6
Manufacture of machinery for food, beverage and tobacco processing
3 161 1 680 53,1 2 252 71,3 2 695 85,3
Manufacture of machinery for textile and leather production, weapons and ammunition and other special purpose machinery
20 637 10 235 49,6 12 258 59,4 13 856 67,1
Division 36 - Electrical machinery and apparatus 63 356 24 343 38,4 33 060 52,2 41 634 65,7
Manufacture of electric motors, generators and transformers
20 780 15 769 75,9 17 607 84,7 18 668 89,8
Manufacture of electricity distribution and control apparatus 12 362 7 993 64,7 8 892 71,9 9 944 80,4
Manufacture of insulated wire and cable 13 865 10 502 75,7 12 515 90,3 13 688 98,7
Manufacture of accumulators, primary cells, batteries, electric lamps and lighting equipment
5 766 3 766 65,3 4 398 76,3 5 103 88,5
Manufacture of bearings, gears, gearing, driving elements and other electrical equipment
14 859 4 559 30,7 6 642 44,7 8 882 59,8
Division 37 - Telecommunication, medical and optical equipment and watches and clocks
16 278 5 701 35,0 8 045 49,4 10 802 66,4
Manufacture of electronic valves and tubes, television and radio transmitters and receivers, sound or video recording, line telephony apparatus and other electronic components
8 761 5 540 63,2 7 018 80,1 7 914 90,3
Manufacture of medical and surgical equipment and orthopaedic appliances
1 252 515 41,2 712 56,9 930 74,3
Manufacture of instruments and appliances for measuring, testing, navigating and industrial process control equipment
4 571 2 210 48,3 3 246 71,0 3 979 87,1
Manufacture of watches and clocks, optical instruments and photographic equipment
1 695 1 437 84,8 1 590 93,8 1 691 99,7
3These figures reflect the income of the 5, 10 and 20 largest enterprises respectively, and not the column totals. 4Relative contribution = income of the largest enterprises divided by total income multiply by 100.
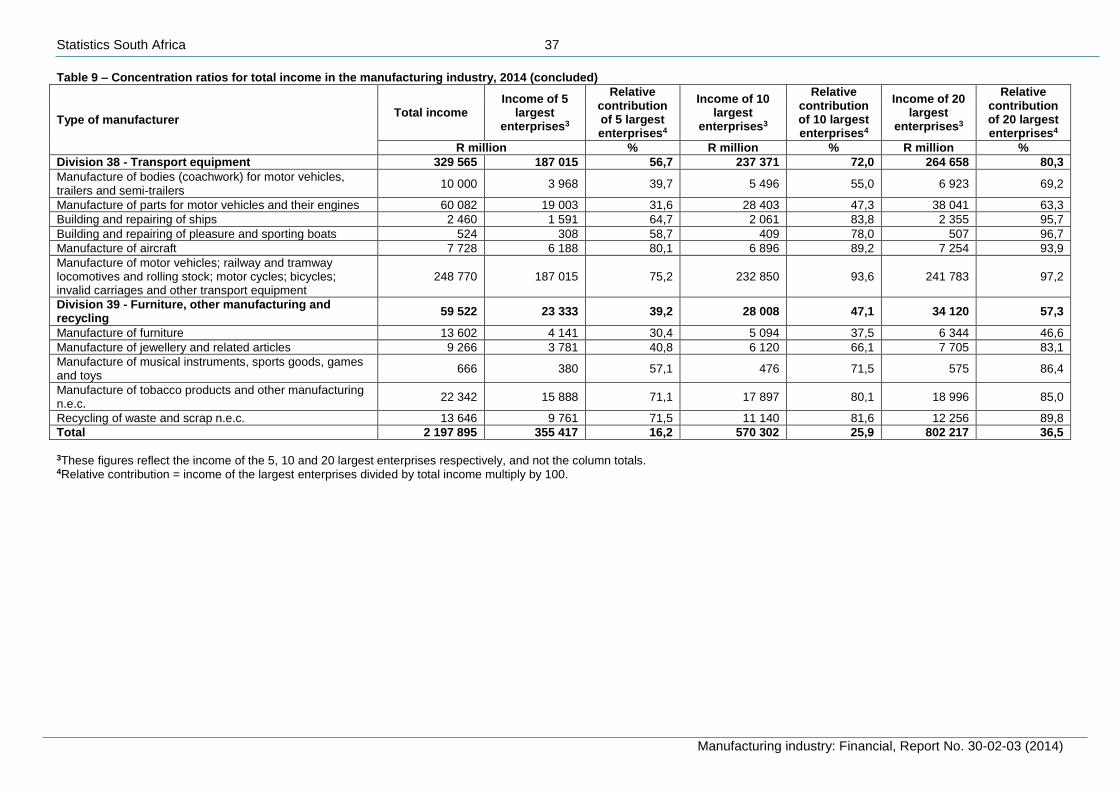
Statistics South Africa 37
Manufacturing industry: Financial, Report No. 30-02-03 (2014)
Table 9 – Concentration ratios for total income in the manufacturing industry, 2014 (concluded)
Type of manufacturer Total income
Income of 5 largest
enterprises3
Relative contribution of 5 largest enterprises4
Income of 10 largest
enterprises3
Relative contribution of 10 largest enterprises4
Income of 20 largest
enterprises3
Relative contribution of 20 largest enterprises4
R million % R million % R million %
Division 38 - Transport equipment 329 565 187 015 56,7 237 371 72,0 264 658 80,3
Manufacture of bodies (coachwork) for motor vehicles, trailers and semi-trailers
10 000 3 968 39,7 5 496 55,0 6 923 69,2
Manufacture of parts for motor vehicles and their engines 60 082 19 003 31,6 28 403 47,3 38 041 63,3
Building and repairing of ships 2 460 1 591 64,7 2 061 83,8 2 355 95,7
Building and repairing of pleasure and sporting boats 524 308 58,7 409 78,0 507 96,7
Manufacture of aircraft 7 728 6 188 80,1 6 896 89,2 7 254 93,9
Manufacture of motor vehicles; railway and tramway locomotives and rolling stock; motor cycles; bicycles; invalid carriages and other transport equipment
248 770 187 015 75,2 232 850 93,6 241 783 97,2
Division 39 - Furniture, other manufacturing and recycling
59 522 23 333 39,2 28 008 47,1 34 120 57,3
Manufacture of furniture 13 602 4 141 30,4 5 094 37,5 6 344 46,6
Manufacture of jewellery and related articles 9 266 3 781 40,8 6 120 66,1 7 705 83,1
Manufacture of musical instruments, sports goods, games and toys
666 380 57,1 476 71,5 575 86,4
Manufacture of tobacco products and other manufacturing n.e.c.
22 342 15 888 71,1 17 897 80,1 18 996 85,0
Recycling of waste and scrap n.e.c. 13 646 9 761 71,5 11 140 81,6 12 256 89,8
Total 2 197 895 355 417 16,2 570 302 25,9 802 217 36,5
3These figures reflect the income of the 5, 10 and 20 largest enterprises respectively, and not the column totals. 4Relative contribution = income of the largest enterprises divided by total income multiply by 100.
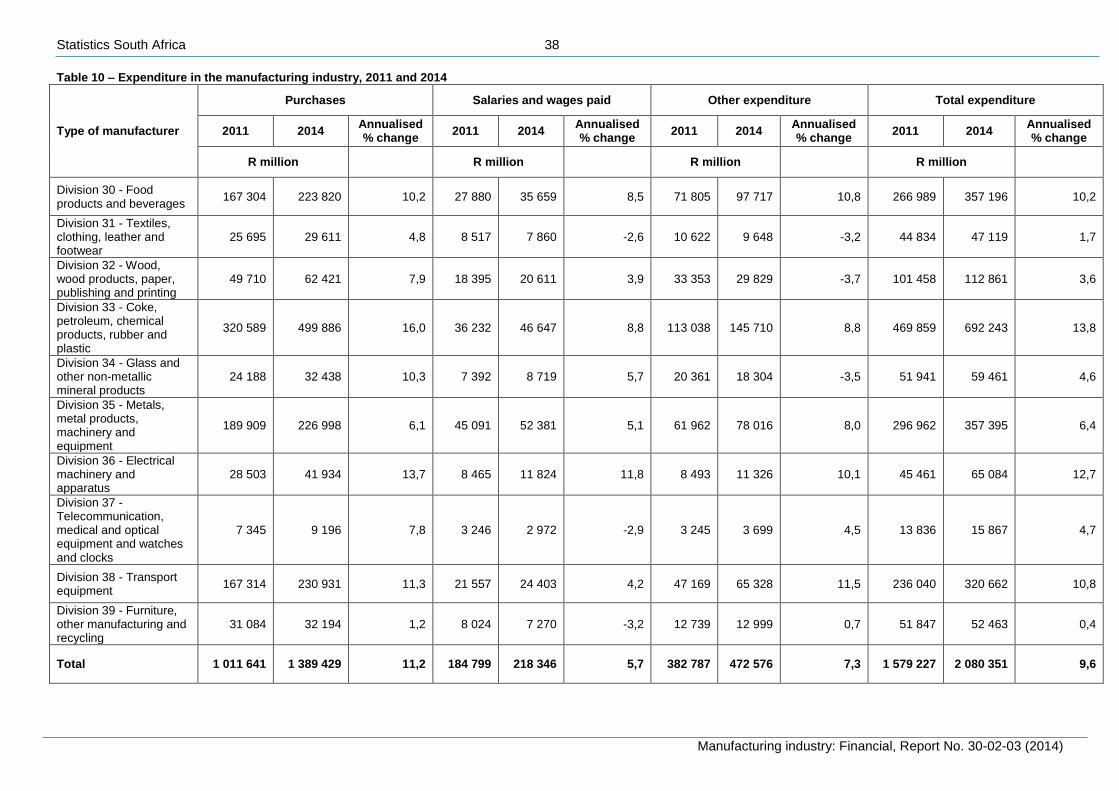
Statistics South Africa 38
Manufacturing industry: Financial, Report No. 30-02-03 (2014)
Table 10 – Expenditure in the manufacturing industry, 2011 and 2014
Type of manufacturer
Purchases Salaries and wages paid Other expenditure Total expenditure
2011 2014 Annualised % change
2011 2014 Annualised % change
2011 2014 Annualised % change
2011 2014 Annualised % change
R million
R million
R million
R million
Division 30 - Food products and beverages
167 304 223 820 10,2 27 880 35 659 8,5 71 805 97 717 10,8 266 989 357 196 10,2
Division 31 - Textiles, clothing, leather and footwear
25 695 29 611 4,8 8 517 7 860 -2,6 10 622 9 648 -3,2 44 834 47 119 1,7
Division 32 - Wood, wood products, paper, publishing and printing
49 710 62 421 7,9 18 395 20 611 3,9 33 353 29 829 -3,7 101 458 112 861 3,6
Division 33 - Coke, petroleum, chemical products, rubber and plastic
320 589 499 886 16,0 36 232 46 647 8,8 113 038 145 710 8,8 469 859 692 243 13,8
Division 34 - Glass and other non-metallic mineral products
24 188 32 438 10,3 7 392 8 719 5,7 20 361 18 304 -3,5 51 941 59 461 4,6
Division 35 - Metals, metal products, machinery and equipment
189 909 226 998 6,1 45 091 52 381 5,1 61 962 78 016 8,0 296 962 357 395 6,4
Division 36 - Electrical machinery and apparatus
28 503 41 934 13,7 8 465 11 824 11,8 8 493 11 326 10,1 45 461 65 084 12,7
Division 37 - Telecommunication, medical and optical equipment and watches and clocks
7 345 9 196 7,8 3 246 2 972 -2,9 3 245 3 699 4,5 13 836 15 867 4,7
Division 38 - Transport equipment
167 314 230 931 11,3 21 557 24 403 4,2 47 169 65 328 11,5 236 040 320 662 10,8
Division 39 - Furniture, other manufacturing and recycling
31 084 32 194 1,2 8 024 7 270 -3,2 12 739 12 999 0,7 51 847 52 463 0,4
Total 1 011 641 1 389 429 11,2 184 799 218 346 5,7 382 787 472 576 7,3 1 579 227 2 080 351 9,6
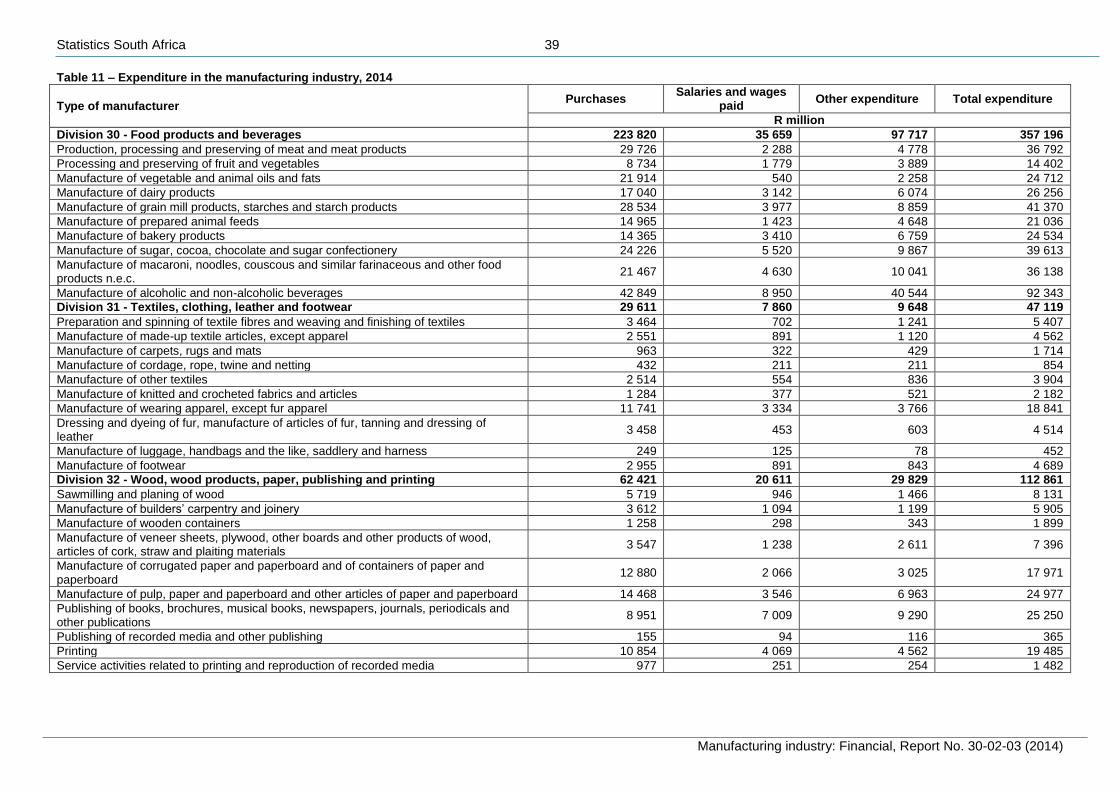
Statistics South Africa 39
Manufacturing industry: Financial, Report No. 30-02-03 (2014)
Table 11 – Expenditure in the manufacturing industry, 2014
Type of manufacturer Purchases
Salaries and wages paid
Other expenditure Total expenditure
R million
Division 30 - Food products and beverages 223 820 35 659 97 717 357 196
Production, processing and preserving of meat and meat products 29 726 2 288 4 778 36 792
Processing and preserving of fruit and vegetables 8 734 1 779 3 889 14 402
Manufacture of vegetable and animal oils and fats 21 914 540 2 258 24 712
Manufacture of dairy products 17 040 3 142 6 074 26 256
Manufacture of grain mill products, starches and starch products 28 534 3 977 8 859 41 370
Manufacture of prepared animal feeds 14 965 1 423 4 648 21 036
Manufacture of bakery products 14 365 3 410 6 759 24 534
Manufacture of sugar, cocoa, chocolate and sugar confectionery 24 226 5 520 9 867 39 613
Manufacture of macaroni, noodles, couscous and similar farinaceous and other food products n.e.c.
21 467 4 630 10 041 36 138
Manufacture of alcoholic and non-alcoholic beverages 42 849 8 950 40 544 92 343
Division 31 - Textiles, clothing, leather and footwear 29 611 7 860 9 648 47 119
Preparation and spinning of textile fibres and weaving and finishing of textiles 3 464 702 1 241 5 407
Manufacture of made-up textile articles, except apparel 2 551 891 1 120 4 562
Manufacture of carpets, rugs and mats 963 322 429 1 714
Manufacture of cordage, rope, twine and netting 432 211 211 854
Manufacture of other textiles 2 514 554 836 3 904
Manufacture of knitted and crocheted fabrics and articles 1 284 377 521 2 182
Manufacture of wearing apparel, except fur apparel 11 741 3 334 3 766 18 841
Dressing and dyeing of fur, manufacture of articles of fur, tanning and dressing of leather
3 458 453 603 4 514
Manufacture of luggage, handbags and the like, saddlery and harness 249 125 78 452
Manufacture of footwear 2 955 891 843 4 689
Division 32 - Wood, wood products, paper, publishing and printing 62 421 20 611 29 829 112 861
Sawmilling and planing of wood 5 719 946 1 466 8 131
Manufacture of builders’ carpentry and joinery 3 612 1 094 1 199 5 905
Manufacture of wooden containers 1 258 298 343 1 899
Manufacture of veneer sheets, plywood, other boards and other products of wood, articles of cork, straw and plaiting materials
3 547 1 238 2 611 7 396
Manufacture of corrugated paper and paperboard and of containers of paper and paperboard
12 880 2 066 3 025 17 971
Manufacture of pulp, paper and paperboard and other articles of paper and paperboard 14 468 3 546 6 963 24 977
Publishing of books, brochures, musical books, newspapers, journals, periodicals and other publications
8 951 7 009 9 290 25 250
Publishing of recorded media and other publishing 155 94 116 365
Printing 10 854 4 069 4 562 19 485
Service activities related to printing and reproduction of recorded media 977 251 254 1 482
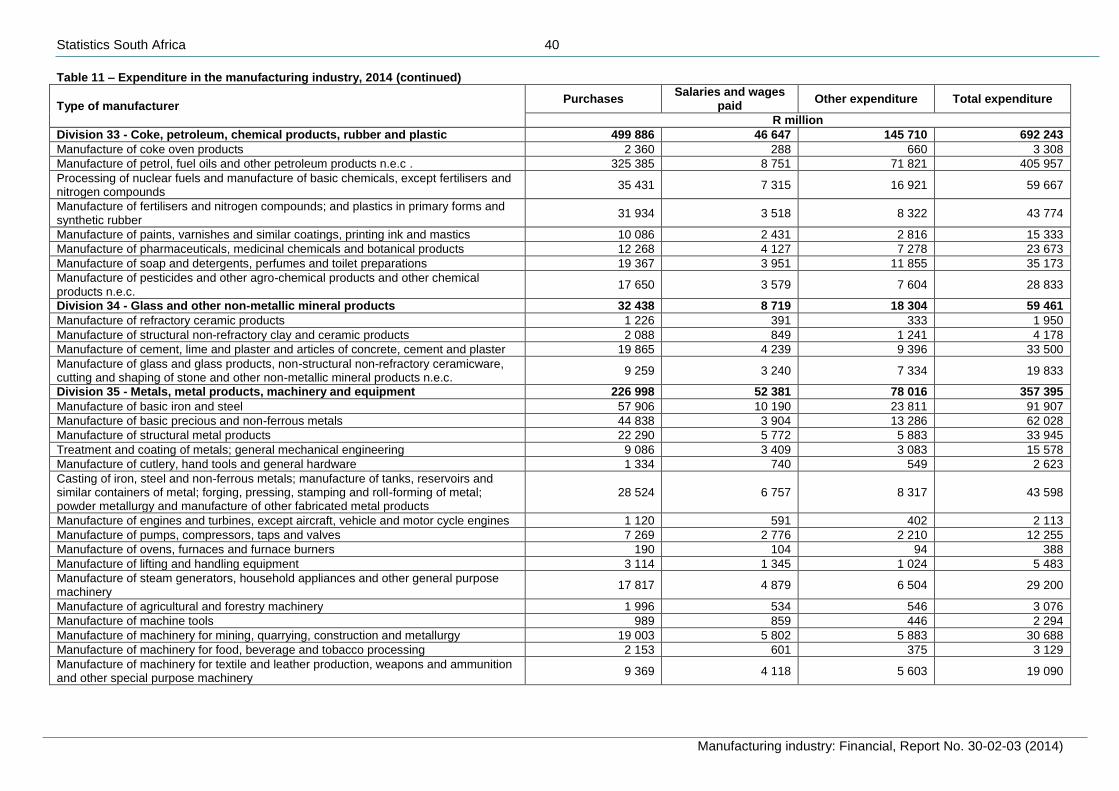
Statistics South Africa 40
Manufacturing industry: Financial, Report No. 30-02-03 (2014)
Table 11 – Expenditure in the manufacturing industry, 2014 (continued)
Type of manufacturer Purchases
Salaries and wages paid
Other expenditure Total expenditure
R million
Division 33 - Coke, petroleum, chemical products, rubber and plastic 499 886 46 647 145 710 692 243
Manufacture of coke oven products 2 360 288 660 3 308
Manufacture of petrol, fuel oils and other petroleum products n.e.c . 325 385 8 751 71 821 405 957
Processing of nuclear fuels and manufacture of basic chemicals, except fertilisers and nitrogen compounds
35 431 7 315 16 921 59 667
Manufacture of fertilisers and nitrogen compounds; and plastics in primary forms and synthetic rubber
31 934 3 518 8 322 43 774
Manufacture of paints, varnishes and similar coatings, printing ink and mastics 10 086 2 431 2 816 15 333
Manufacture of pharmaceuticals, medicinal chemicals and botanical products 12 268 4 127 7 278 23 673
Manufacture of soap and detergents, perfumes and toilet preparations 19 367 3 951 11 855 35 173
Manufacture of pesticides and other agro-chemical products and other chemical products n.e.c.
17 650 3 579 7 604 28 833
Division 34 - Glass and other non-metallic mineral products 32 438 8 719 18 304 59 461
Manufacture of refractory ceramic products 1 226 391 333 1 950
Manufacture of structural non-refractory clay and ceramic products 2 088 849 1 241 4 178
Manufacture of cement, lime and plaster and articles of concrete, cement and plaster 19 865 4 239 9 396 33 500
Manufacture of glass and glass products, non-structural non-refractory ceramicware, cutting and shaping of stone and other non-metallic mineral products n.e.c.
9 259 3 240 7 334 19 833
Division 35 - Metals, metal products, machinery and equipment 226 998 52 381 78 016 357 395
Manufacture of basic iron and steel 57 906 10 190 23 811 91 907
Manufacture of basic precious and non-ferrous metals 44 838 3 904 13 286 62 028
Manufacture of structural metal products 22 290 5 772 5 883 33 945
Treatment and coating of metals; general mechanical engineering 9 086 3 409 3 083 15 578
Manufacture of cutlery, hand tools and general hardware 1 334 740 549 2 623
Casting of iron, steel and non-ferrous metals; manufacture of tanks, reservoirs and similar containers of metal; forging, pressing, stamping and roll-forming of metal; powder metallurgy and manufacture of other fabricated metal products
28 524 6 757 8 317 43 598
Manufacture of engines and turbines, except aircraft, vehicle and motor cycle engines 1 120 591 402 2 113
Manufacture of pumps, compressors, taps and valves 7 269 2 776 2 210 12 255
Manufacture of ovens, furnaces and furnace burners 190 104 94 388
Manufacture of lifting and handling equipment 3 114 1 345 1 024 5 483
Manufacture of steam generators, household appliances and other general purpose machinery
17 817 4 879 6 504 29 200
Manufacture of agricultural and forestry machinery 1 996 534 546 3 076
Manufacture of machine tools 989 859 446 2 294
Manufacture of machinery for mining, quarrying, construction and metallurgy 19 003 5 802 5 883 30 688
Manufacture of machinery for food, beverage and tobacco processing 2 153 601 375 3 129
Manufacture of machinery for textile and leather production, weapons and ammunition and other special purpose machinery
9 369 4 118 5 603 19 090
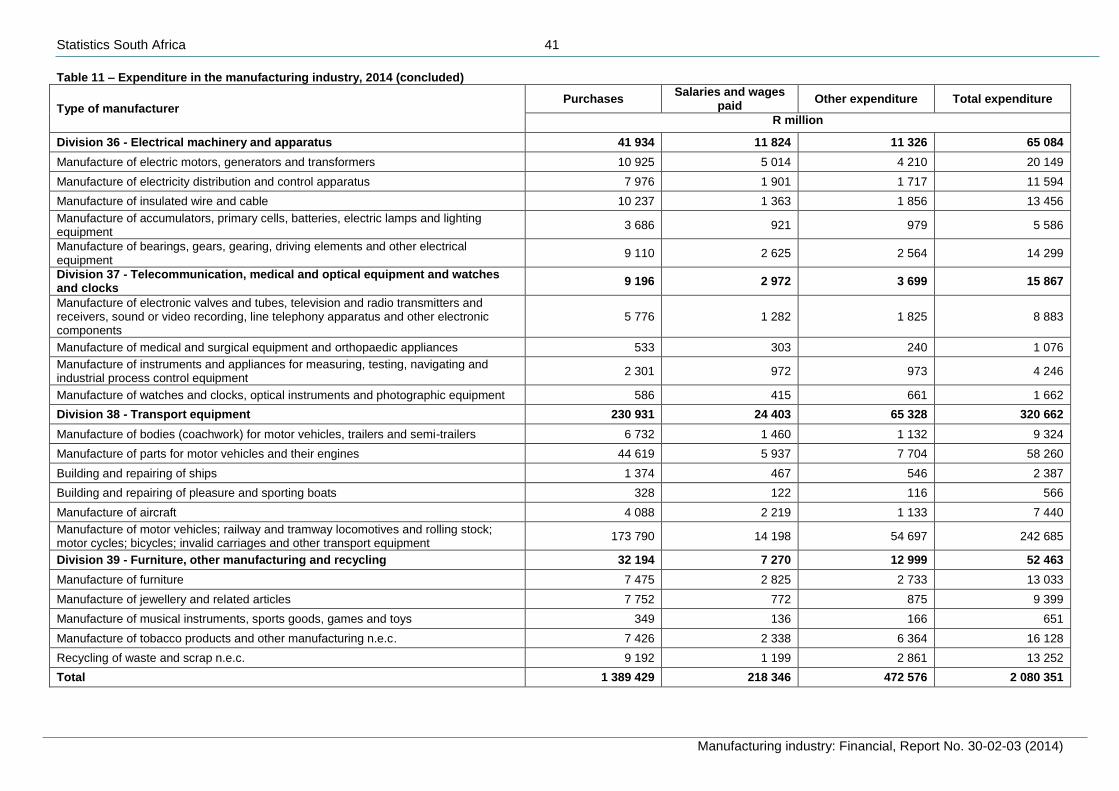
Statistics South Africa 41
Manufacturing industry: Financial, Report No. 30-02-03 (2014)
Table 11 – Expenditure in the manufacturing industry, 2014 (concluded)
Type of manufacturer Purchases
Salaries and wages paid
Other expenditure Total expenditure
R million
Division 36 - Electrical machinery and apparatus 41 934 11 824 11 326 65 084
Manufacture of electric motors, generators and transformers 10 925 5 014 4 210 20 149
Manufacture of electricity distribution and control apparatus 7 976 1 901 1 717 11 594
Manufacture of insulated wire and cable 10 237 1 363 1 856 13 456
Manufacture of accumulators, primary cells, batteries, electric lamps and lighting equipment
3 686 921 979 5 586
Manufacture of bearings, gears, gearing, driving elements and other electrical equipment
9 110 2 625 2 564 14 299
Division 37 - Telecommunication, medical and optical equipment and watches and clocks
9 196 2 972 3 699 15 867
Manufacture of electronic valves and tubes, television and radio transmitters and receivers, sound or video recording, line telephony apparatus and other electronic components
5 776 1 282 1 825 8 883
Manufacture of medical and surgical equipment and orthopaedic appliances 533 303 240 1 076
Manufacture of instruments and appliances for measuring, testing, navigating and industrial process control equipment
2 301 972 973 4 246
Manufacture of watches and clocks, optical instruments and photographic equipment 586 415 661 1 662
Division 38 - Transport equipment 230 931 24 403 65 328 320 662
Manufacture of bodies (coachwork) for motor vehicles, trailers and semi-trailers 6 732 1 460 1 132 9 324
Manufacture of parts for motor vehicles and their engines 44 619 5 937 7 704 58 260
Building and repairing of ships 1 374 467 546 2 387
Building and repairing of pleasure and sporting boats 328 122 116 566
Manufacture of aircraft 4 088 2 219 1 133 7 440
Manufacture of motor vehicles; railway and tramway locomotives and rolling stock; motor cycles; bicycles; invalid carriages and other transport equipment
173 790 14 198 54 697 242 685
Division 39 - Furniture, other manufacturing and recycling 32 194 7 270 12 999 52 463
Manufacture of furniture 7 475 2 825 2 733 13 033
Manufacture of jewellery and related articles 7 752 772 875 9 399
Manufacture of musical instruments, sports goods, games and toys 349 136 166 651
Manufacture of tobacco products and other manufacturing n.e.c. 7 426 2 338 6 364 16 128
Recycling of waste and scrap n.e.c. 9 192 1 199 2 861 13 252
Total 1 389 429 218 346 472 576 2 080 351
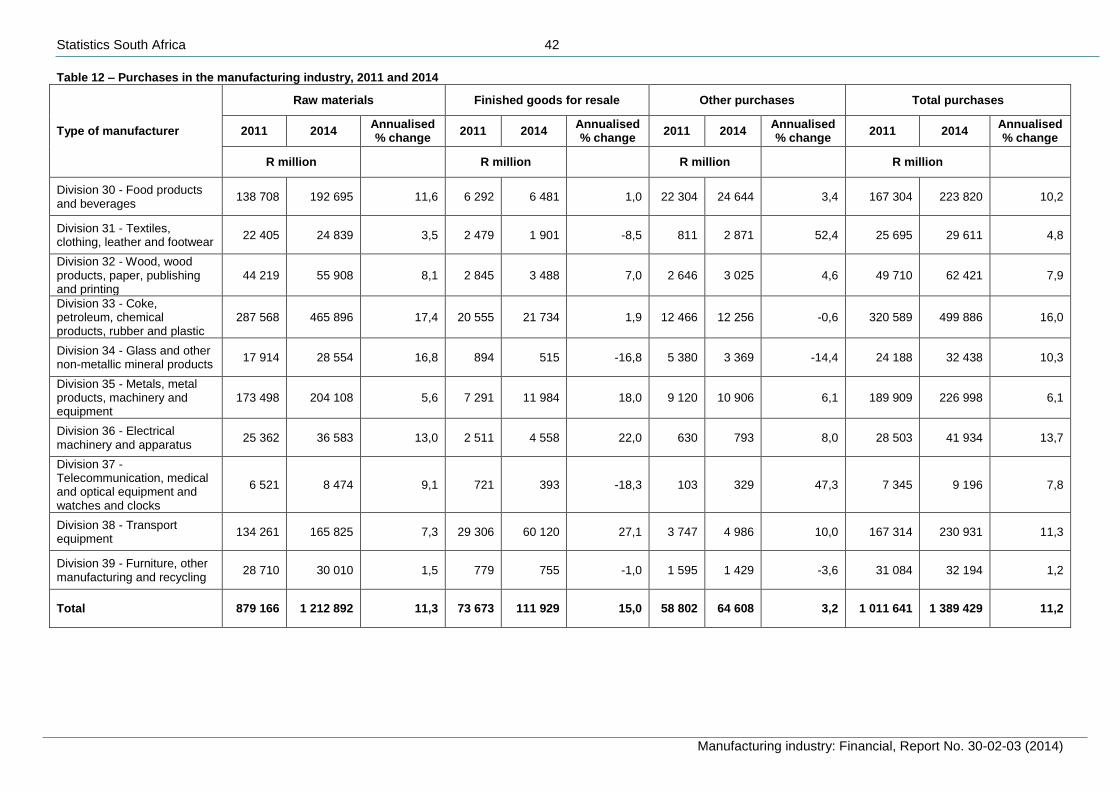
Statistics South Africa 42
Manufacturing industry: Financial, Report No. 30-02-03 (2014)
Table 12 – Purchases in the manufacturing industry, 2011 and 2014
Type of manufacturer
Raw materials Finished goods for resale Other purchases Total purchases
2011 2014 Annualised % change
2011 2014 Annualised % change
2011 2014 Annualised % change
2011 2014 Annualised % change
R million
R million
R million
R million
Division 30 - Food products and beverages
138 708 192 695 11,6 6 292 6 481 1,0 22 304 24 644 3,4 167 304 223 820 10,2
Division 31 - Textiles, clothing, leather and footwear
22 405 24 839 3,5 2 479 1 901 -8,5 811 2 871 52,4 25 695 29 611 4,8
Division 32 - Wood, wood products, paper, publishing and printing
44 219 55 908 8,1 2 845 3 488 7,0 2 646 3 025 4,6 49 710 62 421 7,9
Division 33 - Coke, petroleum, chemical products, rubber and plastic
287 568 465 896 17,4 20 555 21 734 1,9 12 466 12 256 -0,6 320 589 499 886 16,0
Division 34 - Glass and other non-metallic mineral products
17 914 28 554 16,8 894 515 -16,8 5 380 3 369 -14,4 24 188 32 438 10,3
Division 35 - Metals, metal products, machinery and equipment
173 498 204 108 5,6 7 291 11 984 18,0 9 120 10 906 6,1 189 909 226 998 6,1
Division 36 - Electrical machinery and apparatus
25 362 36 583 13,0 2 511 4 558 22,0 630 793 8,0 28 503 41 934 13,7
Division 37 - Telecommunication, medical and optical equipment and watches and clocks
6 521 8 474 9,1 721 393 -18,3 103 329 47,3 7 345 9 196 7,8
Division 38 - Transport equipment
134 261 165 825 7,3 29 306 60 120 27,1 3 747 4 986 10,0 167 314 230 931 11,3
Division 39 - Furniture, other manufacturing and recycling
28 710 30 010 1,5 779 755 -1,0 1 595 1 429 -3,6 31 084 32 194 1,2
Total 879 166 1 212 892 11,3 73 673 111 929 15,0 58 802 64 608 3,2 1 011 641 1 389 429 11,2
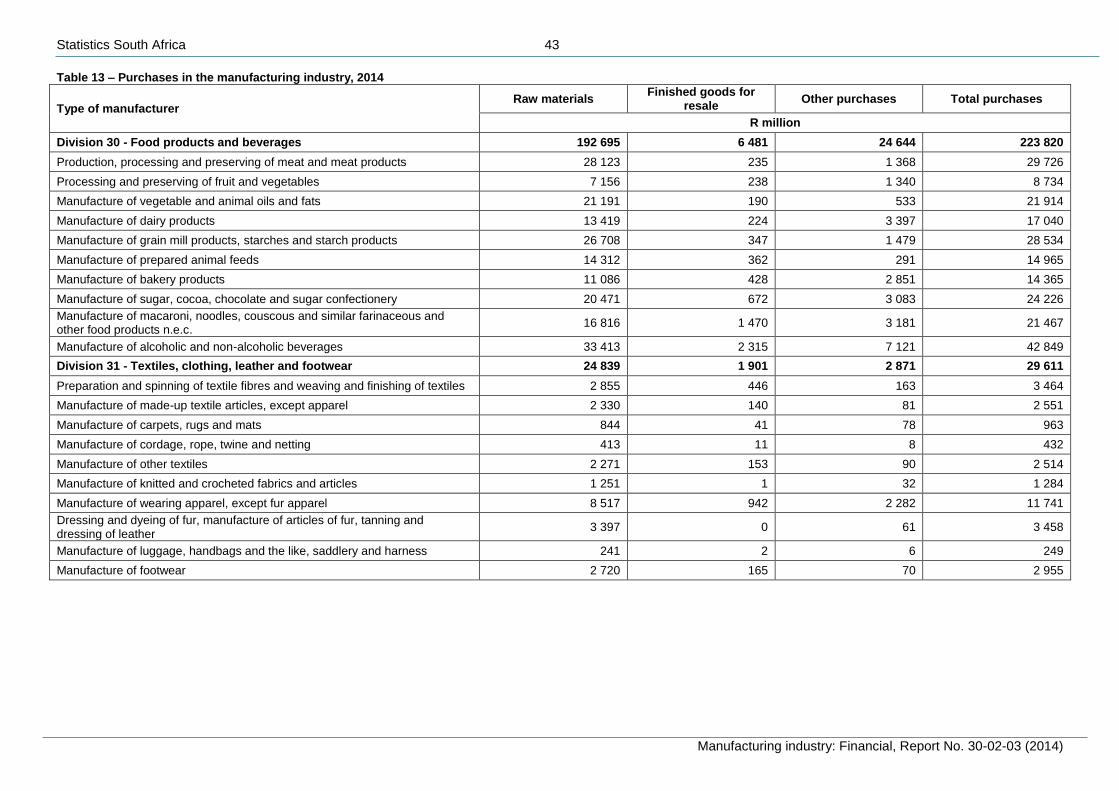
Statistics South Africa 43
Manufacturing industry: Financial, Report No. 30-02-03 (2014)
Table 13 – Purchases in the manufacturing industry, 2014
Type of manufacturer Raw materials
Finished goods for resale
Other purchases Total purchases
R million
Division 30 - Food products and beverages 192 695 6 481 24 644 223 820
Production, processing and preserving of meat and meat products 28 123 235 1 368 29 726
Processing and preserving of fruit and vegetables 7 156 238 1 340 8 734
Manufacture of vegetable and animal oils and fats 21 191 190 533 21 914
Manufacture of dairy products 13 419 224 3 397 17 040
Manufacture of grain mill products, starches and starch products 26 708 347 1 479 28 534
Manufacture of prepared animal feeds 14 312 362 291 14 965
Manufacture of bakery products 11 086 428 2 851 14 365
Manufacture of sugar, cocoa, chocolate and sugar confectionery 20 471 672 3 083 24 226
Manufacture of macaroni, noodles, couscous and similar farinaceous and other food products n.e.c.
16 816 1 470 3 181 21 467
Manufacture of alcoholic and non-alcoholic beverages 33 413 2 315 7 121 42 849
Division 31 - Textiles, clothing, leather and footwear 24 839 1 901 2 871 29 611
Preparation and spinning of textile fibres and weaving and finishing of textiles 2 855 446 163 3 464
Manufacture of made-up textile articles, except apparel 2 330 140 81 2 551
Manufacture of carpets, rugs and mats 844 41 78 963
Manufacture of cordage, rope, twine and netting 413 11 8 432
Manufacture of other textiles 2 271 153 90 2 514
Manufacture of knitted and crocheted fabrics and articles 1 251 1 32 1 284
Manufacture of wearing apparel, except fur apparel 8 517 942 2 282 11 741
Dressing and dyeing of fur, manufacture of articles of fur, tanning and dressing of leather
3 397 0 61 3 458
Manufacture of luggage, handbags and the like, saddlery and harness 241 2 6 249
Manufacture of footwear 2 720 165 70 2 955
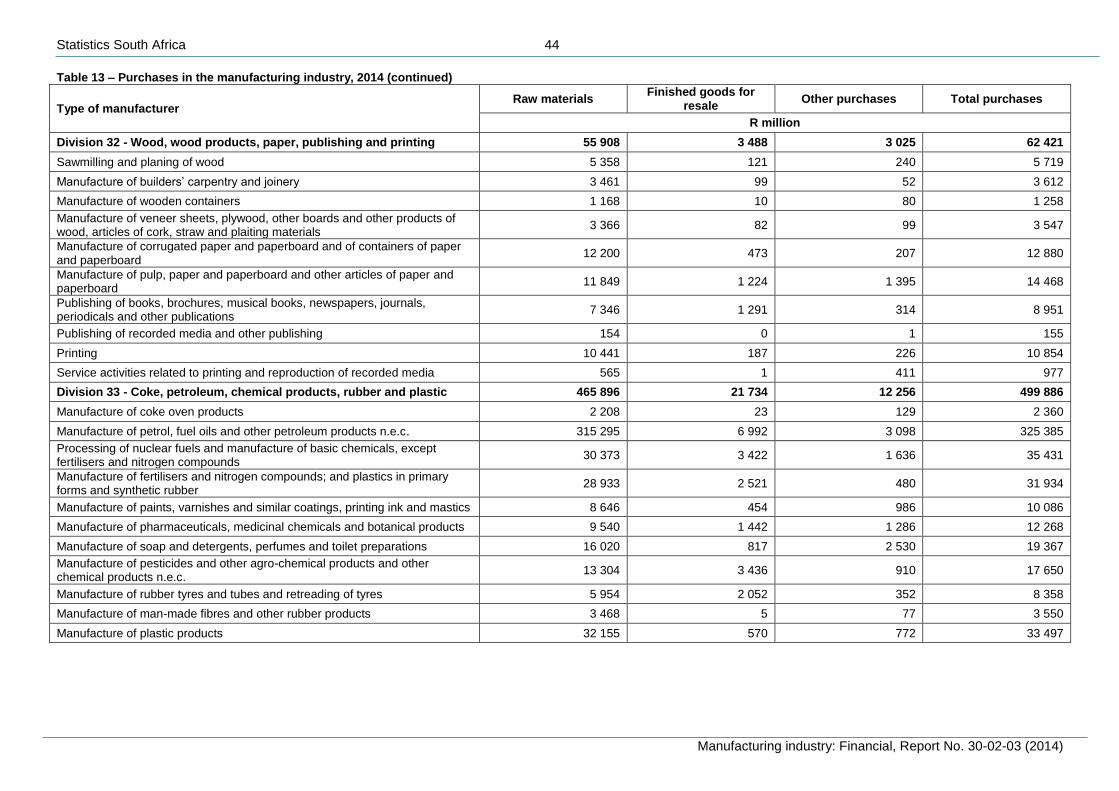
Statistics South Africa 44
Manufacturing industry: Financial, Report No. 30-02-03 (2014)
Table 13 – Purchases in the manufacturing industry, 2014 (continued)
Type of manufacturer Raw materials
Finished goods for resale
Other purchases Total purchases
R million
Division 32 - Wood, wood products, paper, publishing and printing 55 908 3 488 3 025 62 421
Sawmilling and planing of wood 5 358 121 240 5 719
Manufacture of builders’ carpentry and joinery 3 461 99 52 3 612
Manufacture of wooden containers 1 168 10 80 1 258
Manufacture of veneer sheets, plywood, other boards and other products of wood, articles of cork, straw and plaiting materials
3 366 82 99 3 547
Manufacture of corrugated paper and paperboard and of containers of paper and paperboard
12 200 473 207 12 880
Manufacture of pulp, paper and paperboard and other articles of paper and paperboard
11 849 1 224 1 395 14 468
Publishing of books, brochures, musical books, newspapers, journals, periodicals and other publications
7 346 1 291 314 8 951
Publishing of recorded media and other publishing 154 0 1 155
Printing 10 441 187 226 10 854
Service activities related to printing and reproduction of recorded media 565 1 411 977
Division 33 - Coke, petroleum, chemical products, rubber and plastic 465 896 21 734 12 256 499 886
Manufacture of coke oven products 2 208 23 129 2 360
Manufacture of petrol, fuel oils and other petroleum products n.e.c. 315 295 6 992 3 098 325 385
Processing of nuclear fuels and manufacture of basic chemicals, except fertilisers and nitrogen compounds
30 373 3 422 1 636 35 431
Manufacture of fertilisers and nitrogen compounds; and plastics in primary forms and synthetic rubber
28 933 2 521 480 31 934
Manufacture of paints, varnishes and similar coatings, printing ink and mastics 8 646 454 986 10 086
Manufacture of pharmaceuticals, medicinal chemicals and botanical products 9 540 1 442 1 286 12 268
Manufacture of soap and detergents, perfumes and toilet preparations 16 020 817 2 530 19 367
Manufacture of pesticides and other agro-chemical products and other chemical products n.e.c.
13 304 3 436 910 17 650
Manufacture of rubber tyres and tubes and retreading of tyres 5 954 2 052 352 8 358
Manufacture of man-made fibres and other rubber products 3 468 5 77 3 550
Manufacture of plastic products 32 155 570 772 33 497
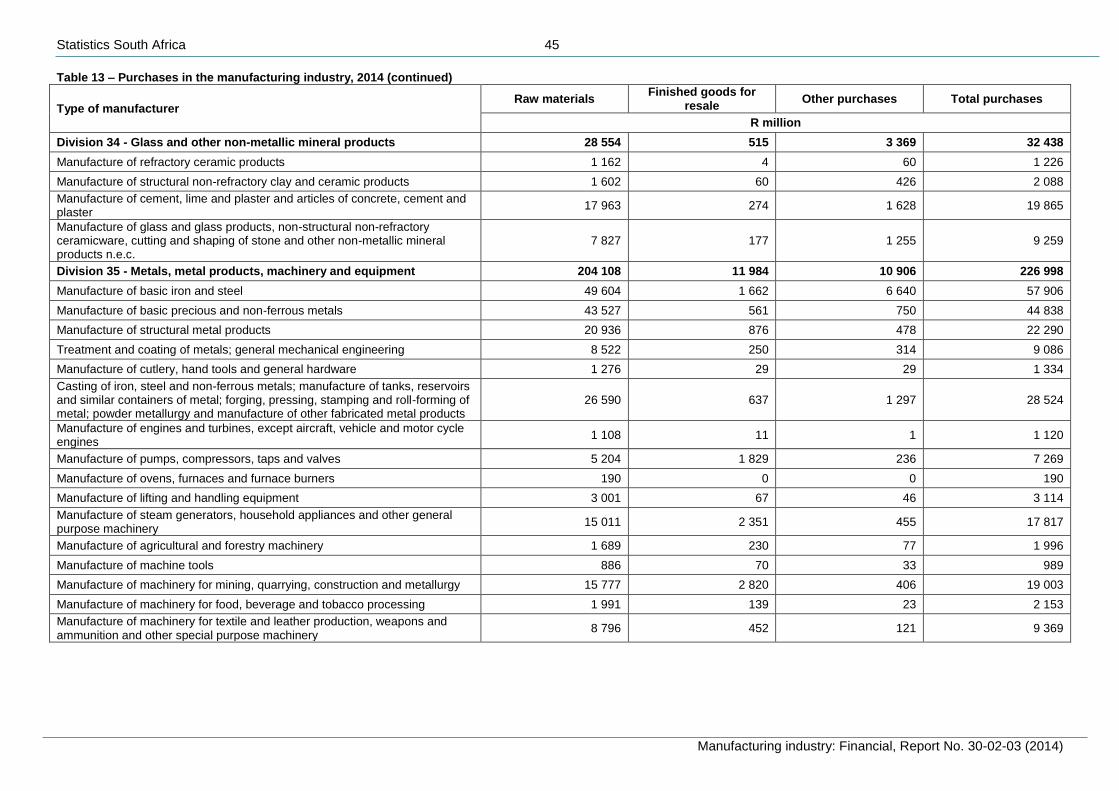
Statistics South Africa 45
Manufacturing industry: Financial, Report No. 30-02-03 (2014)
Table 13 – Purchases in the manufacturing industry, 2014 (continued)
Type of manufacturer Raw materials
Finished goods for resale
Other purchases Total purchases
R million
Division 34 - Glass and other non-metallic mineral products 28 554 515 3 369 32 438
Manufacture of refractory ceramic products 1 162 4 60 1 226
Manufacture of structural non-refractory clay and ceramic products 1 602 60 426 2 088
Manufacture of cement, lime and plaster and articles of concrete, cement and plaster
17 963 274 1 628 19 865
Manufacture of glass and glass products, non-structural non-refractory ceramicware, cutting and shaping of stone and other non-metallic mineral products n.e.c.
7 827 177 1 255 9 259
Division 35 - Metals, metal products, machinery and equipment 204 108 11 984 10 906 226 998
Manufacture of basic iron and steel 49 604 1 662 6 640 57 906
Manufacture of basic precious and non-ferrous metals 43 527 561 750 44 838
Manufacture of structural metal products 20 936 876 478 22 290
Treatment and coating of metals; general mechanical engineering 8 522 250 314 9 086
Manufacture of cutlery, hand tools and general hardware 1 276 29 29 1 334
Casting of iron, steel and non-ferrous metals; manufacture of tanks, reservoirs and similar containers of metal; forging, pressing, stamping and roll-forming of metal; powder metallurgy and manufacture of other fabricated metal products
26 590 637 1 297 28 524
Manufacture of engines and turbines, except aircraft, vehicle and motor cycle engines
1 108 11 1 1 120
Manufacture of pumps, compressors, taps and valves 5 204 1 829 236 7 269
Manufacture of ovens, furnaces and furnace burners 190 0 0 190
Manufacture of lifting and handling equipment 3 001 67 46 3 114
Manufacture of steam generators, household appliances and other general purpose machinery
15 011 2 351 455 17 817
Manufacture of agricultural and forestry machinery 1 689 230 77 1 996
Manufacture of machine tools 886 70 33 989
Manufacture of machinery for mining, quarrying, construction and metallurgy 15 777 2 820 406 19 003
Manufacture of machinery for food, beverage and tobacco processing 1 991 139 23 2 153
Manufacture of machinery for textile and leather production, weapons and ammunition and other special purpose machinery
8 796 452 121 9 369
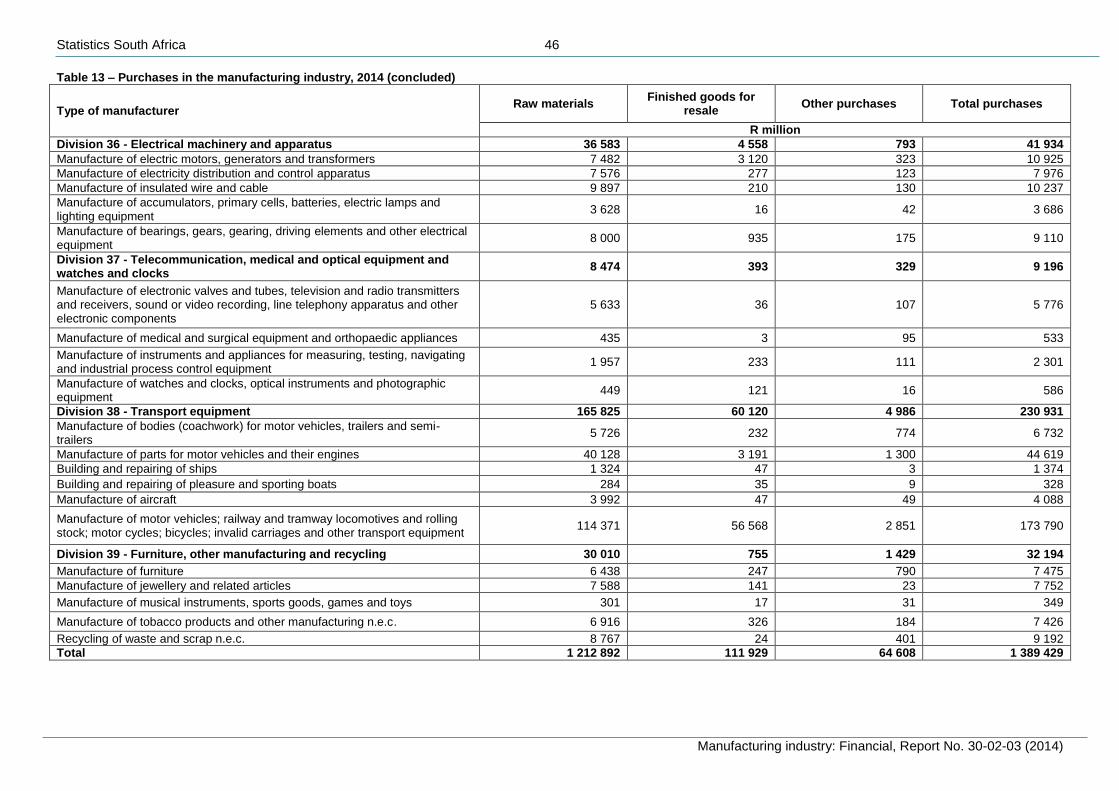
Statistics South Africa 46
Manufacturing industry: Financial, Report No. 30-02-03 (2014)
Table 13 – Purchases in the manufacturing industry, 2014 (concluded)
Type of manufacturer Raw materials
Finished goods for resale
Other purchases Total purchases
R million
Division 36 - Electrical machinery and apparatus 36 583 4 558 793 41 934
Manufacture of electric motors, generators and transformers 7 482 3 120 323 10 925
Manufacture of electricity distribution and control apparatus 7 576 277 123 7 976
Manufacture of insulated wire and cable 9 897 210 130 10 237
Manufacture of accumulators, primary cells, batteries, electric lamps and lighting equipment
3 628 16 42 3 686
Manufacture of bearings, gears, gearing, driving elements and other electrical equipment
8 000 935 175 9 110
Division 37 - Telecommunication, medical and optical equipment and watches and clocks
8 474 393 329 9 196
Manufacture of electronic valves and tubes, television and radio transmitters and receivers, sound or video recording, line telephony apparatus and other electronic components
5 633 36 107 5 776
Manufacture of medical and surgical equipment and orthopaedic appliances 435 3 95 533
Manufacture of instruments and appliances for measuring, testing, navigating and industrial process control equipment
1 957 233 111 2 301
Manufacture of watches and clocks, optical instruments and photographic equipment
449 121 16 586
Division 38 - Transport equipment 165 825 60 120 4 986 230 931
Manufacture of bodies (coachwork) for motor vehicles, trailers and semi-trailers
5 726 232 774 6 732
Manufacture of parts for motor vehicles and their engines 40 128 3 191 1 300 44 619
Building and repairing of ships 1 324 47 3 1 374
Building and repairing of pleasure and sporting boats 284 35 9 328
Manufacture of aircraft 3 992 47 49 4 088
Manufacture of motor vehicles; railway and tramway locomotives and rolling stock; motor cycles; bicycles; invalid carriages and other transport equipment
114 371 56 568 2 851 173 790
Division 39 - Furniture, other manufacturing and recycling 30 010 755 1 429 32 194
Manufacture of furniture 6 438 247 790 7 475
Manufacture of jewellery and related articles 7 588 141 23 7 752
Manufacture of musical instruments, sports goods, games and toys 301 17 31 349
Manufacture of tobacco products and other manufacturing n.e.c. 6 916 326 184 7 426
Recycling of waste and scrap n.e.c. 8 767 24 401 9 192
Total 1 212 892 111 929 64 608 1 389 429
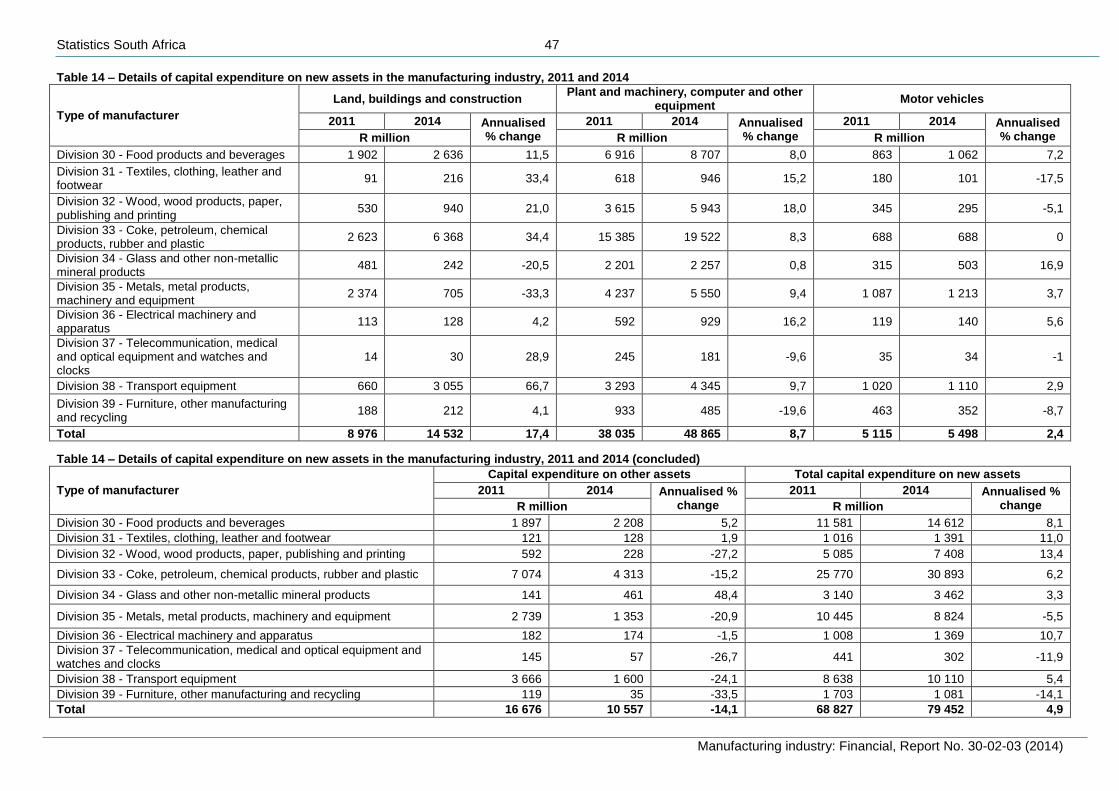
Statistics South Africa 47
Manufacturing industry: Financial, Report No. 30-02-03 (2014)
Table 14 – Details of capital expenditure on new assets in the manufacturing industry, 2011 and 2014
Type of manufacturer
Land, buildings and construction Plant and machinery, computer and other
equipment Motor vehicles
2011 2014 Annualised % change
2011 2014 Annualised % change
2011 2014 Annualised % change R million R million R million
Division 30 - Food products and beverages 1 902 2 636 11,5 6 916 8 707 8,0 863 1 062 7,2
Division 31 - Textiles, clothing, leather and footwear
91 216 33,4 618 946 15,2 180 101 -17,5
Division 32 - Wood, wood products, paper, publishing and printing
530 940 21,0 3 615 5 943 18,0 345 295 -5,1
Division 33 - Coke, petroleum, chemical products, rubber and plastic
2 623 6 368 34,4 15 385 19 522 8,3 688 688 0
Division 34 - Glass and other non-metallic mineral products
481 242 -20,5 2 201 2 257 0,8 315 503 16,9
Division 35 - Metals, metal products, machinery and equipment
2 374 705 -33,3 4 237 5 550 9,4 1 087 1 213 3,7
Division 36 - Electrical machinery and apparatus
113 128 4,2 592 929 16,2 119 140 5,6
Division 37 - Telecommunication, medical and optical equipment and watches and clocks
14 30 28,9 245 181 -9,6 35 34 -1
Division 38 - Transport equipment 660 3 055 66,7 3 293 4 345 9,7 1 020 1 110 2,9
Division 39 - Furniture, other manufacturing and recycling
188 212 4,1 933 485 -19,6 463 352 -8,7
Total 8 976 14 532 17,4 38 035 48 865 8,7 5 115 5 498 2,4
Table 14 – Details of capital expenditure on new assets in the manufacturing industry, 2011 and 2014 (concluded)
Type of manufacturer
Capital expenditure on other assets Total capital expenditure on new assets
2011 2014 Annualised % change
2011 2014 Annualised % change R million R million
Division 30 - Food products and beverages 1 897 2 208 5,2 11 581 14 612 8,1
Division 31 - Textiles, clothing, leather and footwear 121 128 1,9 1 016 1 391 11,0
Division 32 - Wood, wood products, paper, publishing and printing 592 228 -27,2 5 085 7 408 13,4
Division 33 - Coke, petroleum, chemical products, rubber and plastic 7 074 4 313 -15,2 25 770 30 893 6,2
Division 34 - Glass and other non-metallic mineral products 141 461 48,4 3 140 3 462 3,3
Division 35 - Metals, metal products, machinery and equipment 2 739 1 353 -20,9 10 445 8 824 -5,5
Division 36 - Electrical machinery and apparatus 182 174 -1,5 1 008 1 369 10,7
Division 37 - Telecommunication, medical and optical equipment and watches and clocks
145 57 -26,7 441 302 -11,9
Division 38 - Transport equipment 3 666 1 600 -24,1 8 638 10 110 5,4
Division 39 - Furniture, other manufacturing and recycling 119 35 -33,5 1 703 1 081 -14,1
Total 16 676 10 557 -14,1 68 827 79 452 4,9
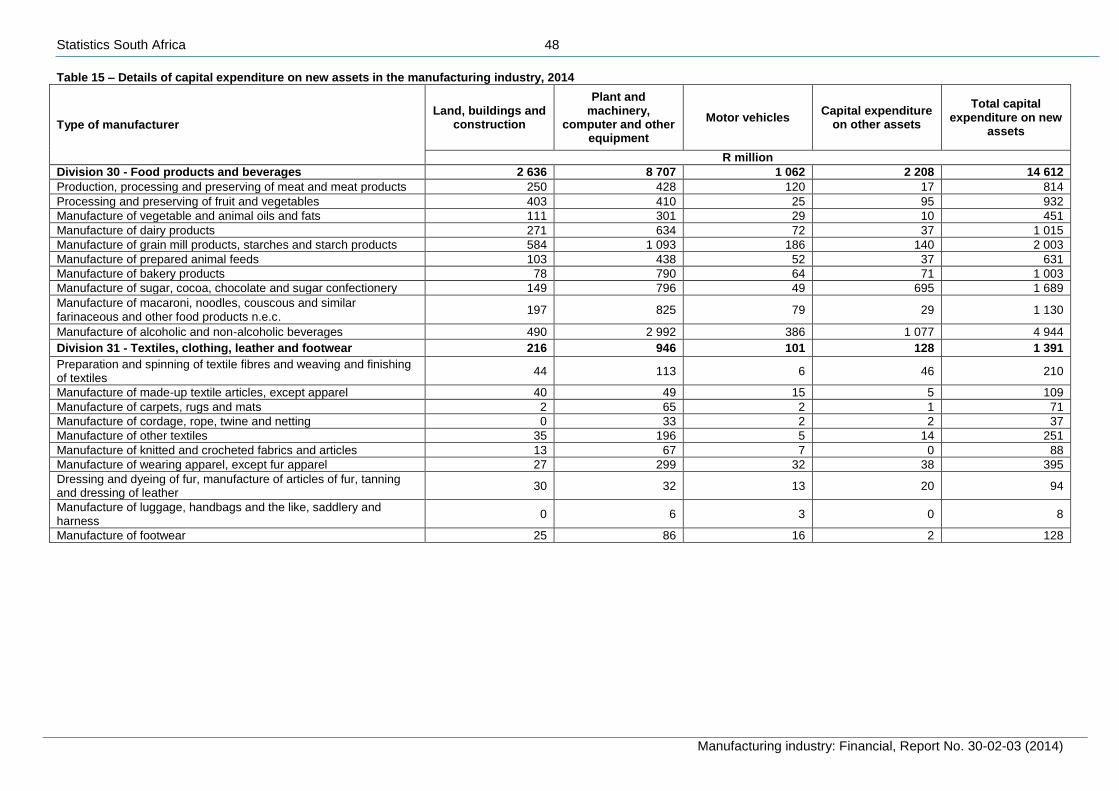
Statistics South Africa 48
Manufacturing industry: Financial, Report No. 30-02-03 (2014)
Table 15 – Details of capital expenditure on new assets in the manufacturing industry, 2014
Type of manufacturer
Land, buildings and construction
Plant and machinery,
computer and other equipment
Motor vehicles Capital expenditure
on other assets
Total capital expenditure on new
assets
R million
Division 30 - Food products and beverages 2 636 8 707 1 062 2 208 14 612
Production, processing and preserving of meat and meat products 250 428 120 17 814
Processing and preserving of fruit and vegetables 403 410 25 95 932
Manufacture of vegetable and animal oils and fats 111 301 29 10 451
Manufacture of dairy products 271 634 72 37 1 015
Manufacture of grain mill products, starches and starch products 584 1 093 186 140 2 003
Manufacture of prepared animal feeds 103 438 52 37 631
Manufacture of bakery products 78 790 64 71 1 003
Manufacture of sugar, cocoa, chocolate and sugar confectionery 149 796 49 695 1 689
Manufacture of macaroni, noodles, couscous and similar farinaceous and other food products n.e.c.
197 825 79 29 1 130
Manufacture of alcoholic and non-alcoholic beverages 490 2 992 386 1 077 4 944
Division 31 - Textiles, clothing, leather and footwear 216 946 101 128 1 391
Preparation and spinning of textile fibres and weaving and finishing of textiles
44 113 6 46 210
Manufacture of made-up textile articles, except apparel 40 49 15 5 109
Manufacture of carpets, rugs and mats 2 65 2 1 71
Manufacture of cordage, rope, twine and netting 0 33 2 2 37
Manufacture of other textiles 35 196 5 14 251
Manufacture of knitted and crocheted fabrics and articles 13 67 7 0 88
Manufacture of wearing apparel, except fur apparel 27 299 32 38 395
Dressing and dyeing of fur, manufacture of articles of fur, tanning and dressing of leather
30 32 13 20 94
Manufacture of luggage, handbags and the like, saddlery and harness
0 6 3 0 8
Manufacture of footwear 25 86 16 2 128
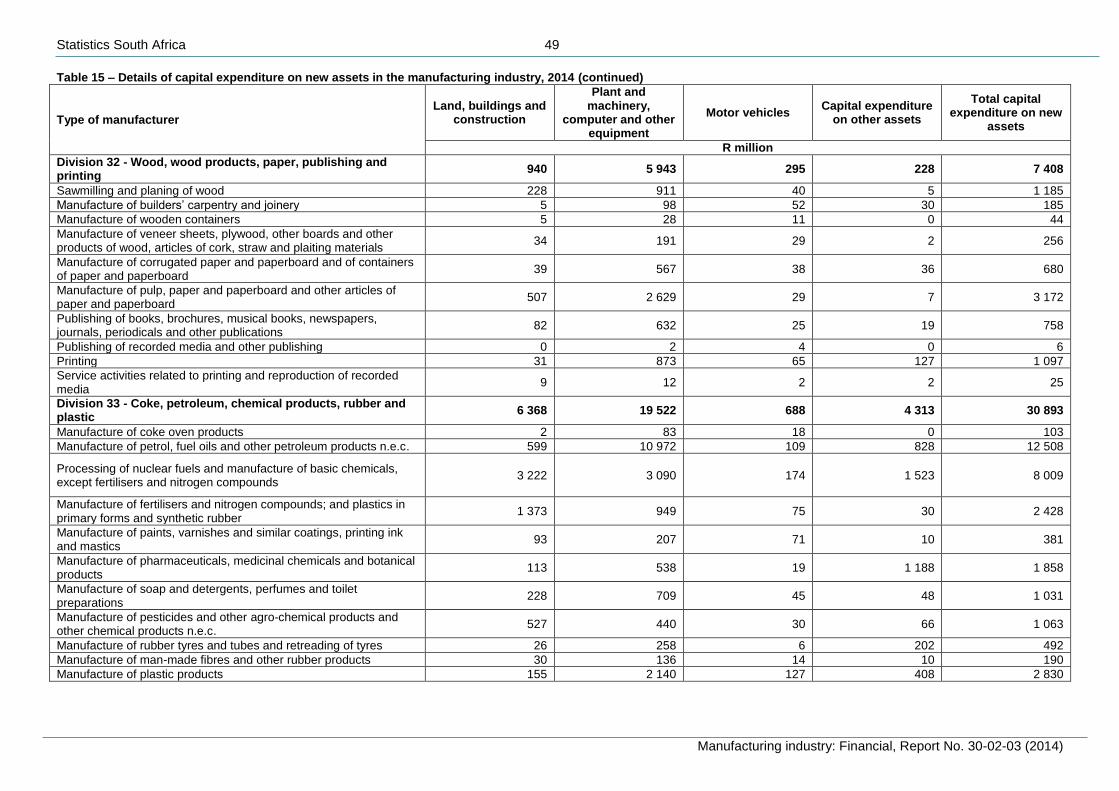
Statistics South Africa 49
Manufacturing industry: Financial, Report No. 30-02-03 (2014)
Table 15 – Details of capital expenditure on new assets in the manufacturing industry, 2014 (continued)
Type of manufacturer
Land, buildings and construction
Plant and machinery,
computer and other equipment
Motor vehicles Capital expenditure
on other assets
Total capital expenditure on new
assets
R million
Division 32 - Wood, wood products, paper, publishing and printing
940 5 943 295 228 7 408
Sawmilling and planing of wood 228 911 40 5 1 185
Manufacture of builders’ carpentry and joinery 5 98 52 30 185
Manufacture of wooden containers 5 28 11 0 44
Manufacture of veneer sheets, plywood, other boards and other products of wood, articles of cork, straw and plaiting materials
34 191 29 2 256
Manufacture of corrugated paper and paperboard and of containers of paper and paperboard
39 567 38 36 680
Manufacture of pulp, paper and paperboard and other articles of paper and paperboard
507 2 629 29 7 3 172
Publishing of books, brochures, musical books, newspapers, journals, periodicals and other publications
82 632 25 19 758
Publishing of recorded media and other publishing 0 2 4 0 6
Printing 31 873 65 127 1 097
Service activities related to printing and reproduction of recorded media
9 12 2 2 25
Division 33 - Coke, petroleum, chemical products, rubber and plastic
6 368 19 522 688 4 313 30 893
Manufacture of coke oven products 2 83 18 0 103
Manufacture of petrol, fuel oils and other petroleum products n.e.c. 599 10 972 109 828 12 508
Processing of nuclear fuels and manufacture of basic chemicals, except fertilisers and nitrogen compounds
3 222 3 090 174 1 523 8 009
Manufacture of fertilisers and nitrogen compounds; and plastics in primary forms and synthetic rubber
1 373 949 75 30 2 428
Manufacture of paints, varnishes and similar coatings, printing ink and mastics
93 207 71 10 381
Manufacture of pharmaceuticals, medicinal chemicals and botanical products
113 538 19 1 188 1 858
Manufacture of soap and detergents, perfumes and toilet preparations
228 709 45 48 1 031
Manufacture of pesticides and other agro-chemical products and other chemical products n.e.c.
527 440 30 66 1 063
Manufacture of rubber tyres and tubes and retreading of tyres 26 258 6 202 492
Manufacture of man-made fibres and other rubber products 30 136 14 10 190
Manufacture of plastic products 155 2 140 127 408 2 830
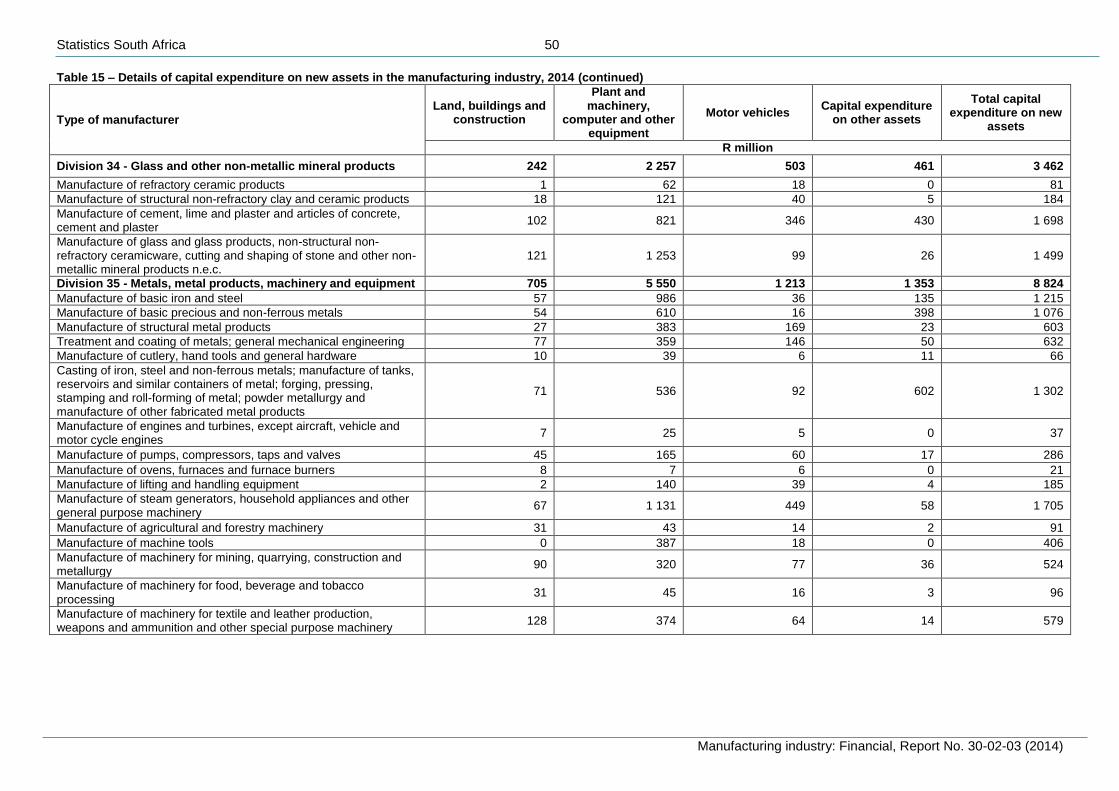
Statistics South Africa 50
Manufacturing industry: Financial, Report No. 30-02-03 (2014)
Table 15 – Details of capital expenditure on new assets in the manufacturing industry, 2014 (continued)
Type of manufacturer
Land, buildings and construction
Plant and machinery,
computer and other equipment
Motor vehicles Capital expenditure
on other assets
Total capital expenditure on new
assets
R million
Division 34 - Glass and other non-metallic mineral products 242 2 257 503 461 3 462
Manufacture of refractory ceramic products 1 62 18 0 81
Manufacture of structural non-refractory clay and ceramic products 18 121 40 5 184
Manufacture of cement, lime and plaster and articles of concrete, cement and plaster
102 821 346 430 1 698
Manufacture of glass and glass products, non-structural non-refractory ceramicware, cutting and shaping of stone and other non-metallic mineral products n.e.c.
121 1 253 99 26 1 499
Division 35 - Metals, metal products, machinery and equipment 705 5 550 1 213 1 353 8 824
Manufacture of basic iron and steel 57 986 36 135 1 215
Manufacture of basic precious and non-ferrous metals 54 610 16 398 1 076
Manufacture of structural metal products 27 383 169 23 603
Treatment and coating of metals; general mechanical engineering 77 359 146 50 632
Manufacture of cutlery, hand tools and general hardware 10 39 6 11 66
Casting of iron, steel and non-ferrous metals; manufacture of tanks, reservoirs and similar containers of metal; forging, pressing, stamping and roll-forming of metal; powder metallurgy and manufacture of other fabricated metal products
71 536 92 602 1 302
Manufacture of engines and turbines, except aircraft, vehicle and motor cycle engines
7 25 5 0 37
Manufacture of pumps, compressors, taps and valves 45 165 60 17 286
Manufacture of ovens, furnaces and furnace burners 8 7 6 0 21
Manufacture of lifting and handling equipment 2 140 39 4 185
Manufacture of steam generators, household appliances and other general purpose machinery
67 1 131 449 58 1 705
Manufacture of agricultural and forestry machinery 31 43 14 2 91
Manufacture of machine tools 0 387 18 0 406
Manufacture of machinery for mining, quarrying, construction and metallurgy
90 320 77 36 524
Manufacture of machinery for food, beverage and tobacco processing
31 45 16 3 96
Manufacture of machinery for textile and leather production, weapons and ammunition and other special purpose machinery
128 374 64 14 579
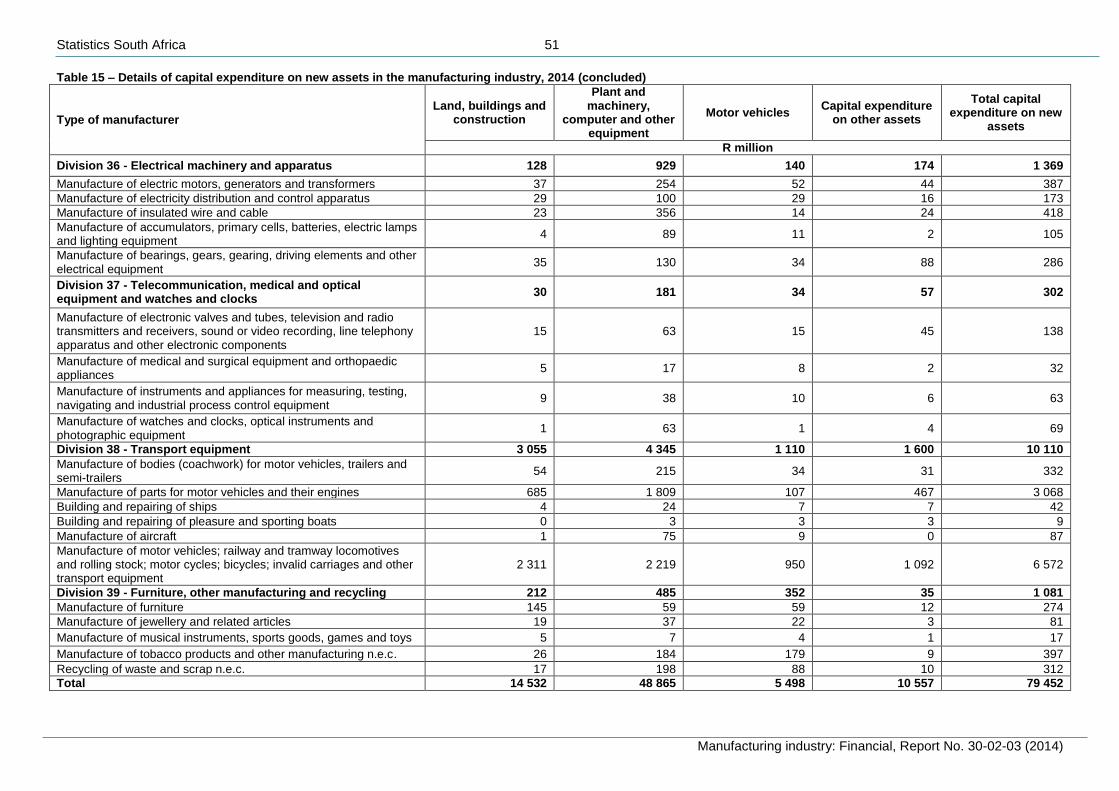
Statistics South Africa 51
Manufacturing industry: Financial, Report No. 30-02-03 (2014)
Table 15 – Details of capital expenditure on new assets in the manufacturing industry, 2014 (concluded)
Type of manufacturer
Land, buildings and construction
Plant and machinery,
computer and other equipment
Motor vehicles Capital expenditure
on other assets
Total capital expenditure on new
assets
R million
Division 36 - Electrical machinery and apparatus 128 929 140 174 1 369
Manufacture of electric motors, generators and transformers 37 254 52 44 387
Manufacture of electricity distribution and control apparatus 29 100 29 16 173
Manufacture of insulated wire and cable 23 356 14 24 418
Manufacture of accumulators, primary cells, batteries, electric lamps and lighting equipment
4 89 11 2 105
Manufacture of bearings, gears, gearing, driving elements and other electrical equipment
35 130 34 88 286
Division 37 - Telecommunication, medical and optical equipment and watches and clocks
30 181 34 57 302
Manufacture of electronic valves and tubes, television and radio transmitters and receivers, sound or video recording, line telephony apparatus and other electronic components
15 63 15 45 138
Manufacture of medical and surgical equipment and orthopaedic appliances
5 17 8 2 32
Manufacture of instruments and appliances for measuring, testing, navigating and industrial process control equipment
9 38 10 6 63
Manufacture of watches and clocks, optical instruments and photographic equipment
1 63 1 4 69
Division 38 - Transport equipment 3 055 4 345 1 110 1 600 10 110
Manufacture of bodies (coachwork) for motor vehicles, trailers and semi-trailers
54 215 34 31 332
Manufacture of parts for motor vehicles and their engines 685 1 809 107 467 3 068
Building and repairing of ships 4 24 7 7 42
Building and repairing of pleasure and sporting boats 0 3 3 3 9
Manufacture of aircraft 1 75 9 0 87
Manufacture of motor vehicles; railway and tramway locomotives and rolling stock; motor cycles; bicycles; invalid carriages and other transport equipment
2 311 2 219 950 1 092 6 572
Division 39 - Furniture, other manufacturing and recycling 212 485 352 35 1 081
Manufacture of furniture 145 59 59 12 274
Manufacture of jewellery and related articles 19 37 22 3 81
Manufacture of musical instruments, sports goods, games and toys 5 7 4 1 17
Manufacture of tobacco products and other manufacturing n.e.c. 26 184 179 9 397
Recycling of waste and scrap n.e.c. 17 198 88 10 312
Total 14 532 48 865 5 498 10 557 79 452
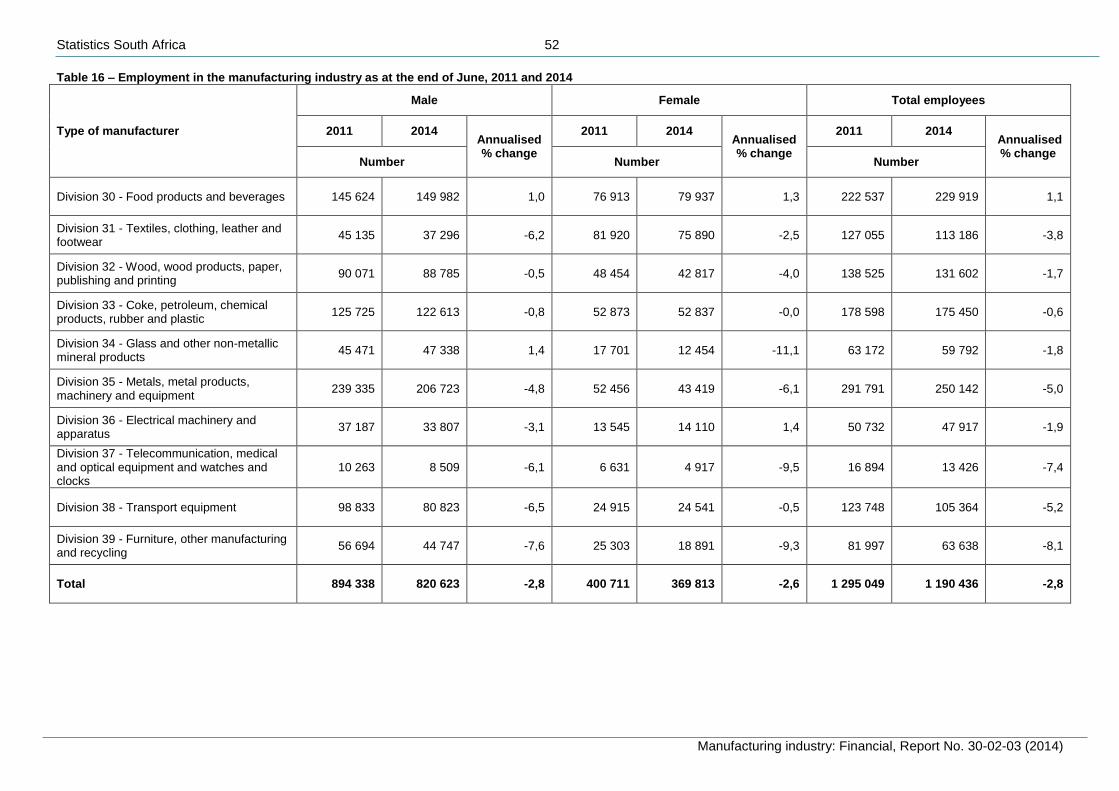
Statistics South Africa 52
Manufacturing industry: Financial, Report No. 30-02-03 (2014)
Table 16 – Employment in the manufacturing industry as at the end of June, 2011 and 2014
Type of manufacturer
Male Female Total employees
2011 2014 Annualised % change
2011 2014 Annualised % change
2011 2014 Annualised % change
Number Number Number
Division 30 - Food products and beverages 145 624 149 982 1,0 76 913 79 937 1,3 222 537 229 919 1,1
Division 31 - Textiles, clothing, leather and footwear
45 135 37 296 -6,2 81 920 75 890 -2,5 127 055 113 186 -3,8
Division 32 - Wood, wood products, paper, publishing and printing
90 071 88 785 -0,5 48 454 42 817 -4,0 138 525 131 602 -1,7
Division 33 - Coke, petroleum, chemical products, rubber and plastic
125 725 122 613 -0,8 52 873 52 837 -0,0 178 598 175 450 -0,6
Division 34 - Glass and other non-metallic mineral products
45 471 47 338 1,4 17 701 12 454 -11,1 63 172 59 792 -1,8
Division 35 - Metals, metal products, machinery and equipment
239 335 206 723 -4,8 52 456 43 419 -6,1 291 791 250 142 -5,0
Division 36 - Electrical machinery and apparatus
37 187 33 807 -3,1 13 545 14 110 1,4 50 732 47 917 -1,9
Division 37 - Telecommunication, medical and optical equipment and watches and clocks
10 263 8 509 -6,1 6 631 4 917 -9,5 16 894 13 426 -7,4
Division 38 - Transport equipment 98 833 80 823 -6,5 24 915 24 541 -0,5 123 748 105 364 -5,2
Division 39 - Furniture, other manufacturing and recycling
56 694 44 747 -7,6 25 303 18 891 -9,3 81 997 63 638 -8,1
Total 894 338 820 623 -2,8 400 711 369 813 -2,6 1 295 049 1 190 436 -2,8
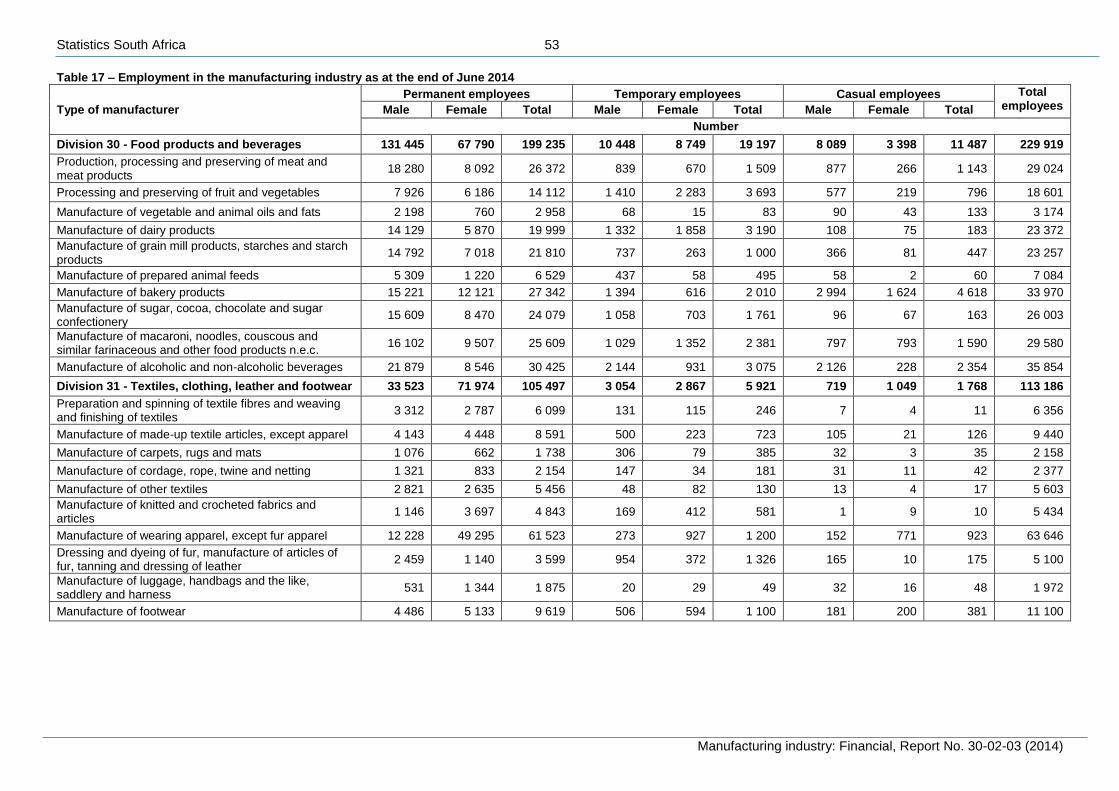
Statistics South Africa 53
Manufacturing industry: Financial, Report No. 30-02-03 (2014)
Table 17 – Employment in the manufacturing industry as at the end of June 2014
Type of manufacturer
Permanent employees Temporary employees Casual employees Total employees Male Female Total Male Female Total Male Female Total
Number
Division 30 - Food products and beverages 131 445 67 790 199 235 10 448 8 749 19 197 8 089 3 398 11 487 229 919
Production, processing and preserving of meat and meat products
18 280 8 092 26 372 839 670 1 509 877 266 1 143 29 024
Processing and preserving of fruit and vegetables 7 926 6 186 14 112 1 410 2 283 3 693 577 219 796 18 601
Manufacture of vegetable and animal oils and fats 2 198 760 2 958 68 15 83 90 43 133 3 174
Manufacture of dairy products 14 129 5 870 19 999 1 332 1 858 3 190 108 75 183 23 372
Manufacture of grain mill products, starches and starch products
14 792 7 018 21 810 737 263 1 000 366 81 447 23 257
Manufacture of prepared animal feeds 5 309 1 220 6 529 437 58 495 58 2 60 7 084
Manufacture of bakery products 15 221 12 121 27 342 1 394 616 2 010 2 994 1 624 4 618 33 970
Manufacture of sugar, cocoa, chocolate and sugar confectionery
15 609 8 470 24 079 1 058 703 1 761 96 67 163 26 003
Manufacture of macaroni, noodles, couscous and similar farinaceous and other food products n.e.c.
16 102 9 507 25 609 1 029 1 352 2 381 797 793 1 590 29 580
Manufacture of alcoholic and non-alcoholic beverages 21 879 8 546 30 425 2 144 931 3 075 2 126 228 2 354 35 854
Division 31 - Textiles, clothing, leather and footwear 33 523 71 974 105 497 3 054 2 867 5 921 719 1 049 1 768 113 186
Preparation and spinning of textile fibres and weaving and finishing of textiles
3 312 2 787 6 099 131 115 246 7 4 11 6 356
Manufacture of made-up textile articles, except apparel 4 143 4 448 8 591 500 223 723 105 21 126 9 440
Manufacture of carpets, rugs and mats 1 076 662 1 738 306 79 385 32 3 35 2 158
Manufacture of cordage, rope, twine and netting 1 321 833 2 154 147 34 181 31 11 42 2 377
Manufacture of other textiles 2 821 2 635 5 456 48 82 130 13 4 17 5 603
Manufacture of knitted and crocheted fabrics and articles
1 146 3 697 4 843 169 412 581 1 9 10 5 434
Manufacture of wearing apparel, except fur apparel 12 228 49 295 61 523 273 927 1 200 152 771 923 63 646
Dressing and dyeing of fur, manufacture of articles of fur, tanning and dressing of leather
2 459 1 140 3 599 954 372 1 326 165 10 175 5 100
Manufacture of luggage, handbags and the like, saddlery and harness
531 1 344 1 875 20 29 49 32 16 48 1 972
Manufacture of footwear 4 486 5 133 9 619 506 594 1 100 181 200 381 11 100
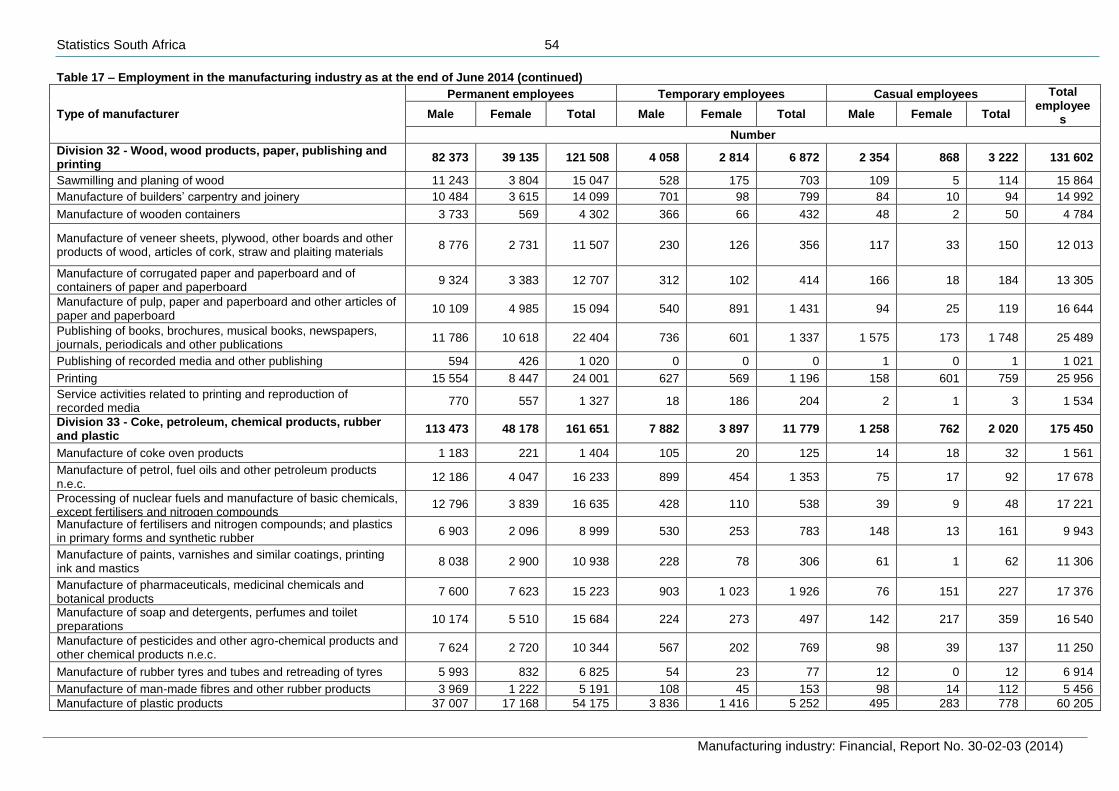
Statistics South Africa 54
Manufacturing industry: Financial, Report No. 30-02-03 (2014)
Table 17 – Employment in the manufacturing industry as at the end of June 2014 (continued)
Type of manufacturer
Permanent employees Temporary employees Casual employees Total employee
s Male Female Total Male Female Total Male Female Total
Number
Division 32 - Wood, wood products, paper, publishing and printing
82 373 39 135 121 508 4 058 2 814 6 872 2 354 868 3 222 131 602
Sawmilling and planing of wood 11 243 3 804 15 047 528 175 703 109 5 114 15 864
Manufacture of builders’ carpentry and joinery 10 484 3 615 14 099 701 98 799 84 10 94 14 992
Manufacture of wooden containers 3 733 569 4 302 366 66 432 48 2 50 4 784
Manufacture of veneer sheets, plywood, other boards and other products of wood, articles of cork, straw and plaiting materials
8 776 2 731 11 507 230 126 356 117 33 150 12 013
Manufacture of corrugated paper and paperboard and of containers of paper and paperboard
9 324 3 383 12 707 312 102 414 166 18 184 13 305
Manufacture of pulp, paper and paperboard and other articles of paper and paperboard
10 109 4 985 15 094 540 891 1 431 94 25 119 16 644
Publishing of books, brochures, musical books, newspapers, journals, periodicals and other publications
11 786 10 618 22 404 736 601 1 337 1 575 173 1 748 25 489
Publishing of recorded media and other publishing 594 426 1 020 0 0 0 1 0 1 1 021
Printing 15 554 8 447 24 001 627 569 1 196 158 601 759 25 956
Service activities related to printing and reproduction of recorded media
770 557 1 327 18 186 204 2 1 3 1 534
Division 33 - Coke, petroleum, chemical products, rubber and plastic
113 473 48 178 161 651 7 882 3 897 11 779 1 258 762 2 020 175 450
Manufacture of coke oven products 1 183 221 1 404 105 20 125 14 18 32 1 561
Manufacture of petrol, fuel oils and other petroleum products n.e.c.
12 186 4 047 16 233 899 454 1 353 75 17 92 17 678
Processing of nuclear fuels and manufacture of basic chemicals, except fertilisers and nitrogen compounds
12 796 3 839 16 635 428 110 538 39 9 48 17 221
Manufacture of fertilisers and nitrogen compounds; and plastics in primary forms and synthetic rubber
6 903 2 096 8 999 530 253 783 148 13 161 9 943
Manufacture of paints, varnishes and similar coatings, printing ink and mastics
8 038 2 900 10 938 228 78 306 61 1 62 11 306
Manufacture of pharmaceuticals, medicinal chemicals and botanical products
7 600 7 623 15 223 903 1 023 1 926 76 151 227 17 376
Manufacture of soap and detergents, perfumes and toilet preparations
10 174 5 510 15 684 224 273 497 142 217 359 16 540
Manufacture of pesticides and other agro-chemical products and other chemical products n.e.c.
7 624 2 720 10 344 567 202 769 98 39 137 11 250
Manufacture of rubber tyres and tubes and retreading of tyres 5 993 832 6 825 54 23 77 12 0 12 6 914
Manufacture of man-made fibres and other rubber products 3 969 1 222 5 191 108 45 153 98 14 112 5 456
Manufacture of plastic products 37 007 17 168 54 175 3 836 1 416 5 252 495 283 778 60 205
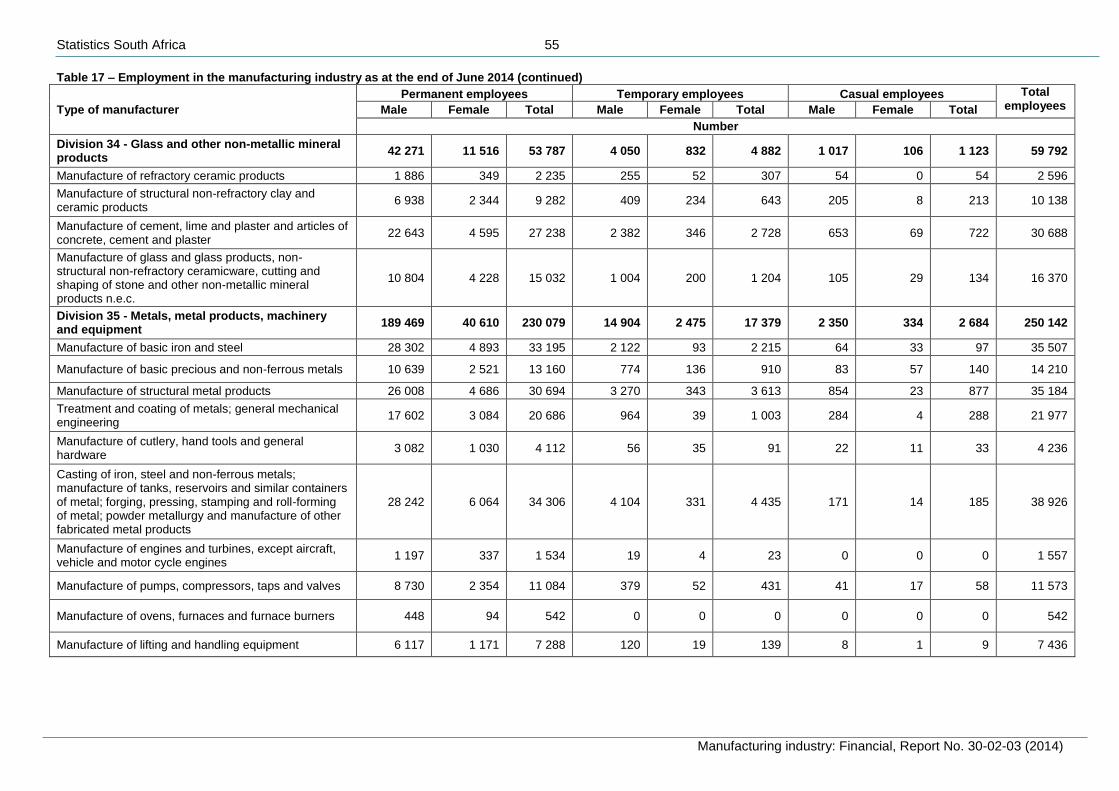
Statistics South Africa 55
Manufacturing industry: Financial, Report No. 30-02-03 (2014)
Table 17 – Employment in the manufacturing industry as at the end of June 2014 (continued)
Type of manufacturer
Permanent employees Temporary employees Casual employees Total employees Male Female Total Male Female Total Male Female Total
Number
Division 34 - Glass and other non-metallic mineral products
42 271 11 516 53 787 4 050 832 4 882 1 017 106 1 123 59 792
Manufacture of refractory ceramic products 1 886 349 2 235 255 52 307 54 0 54 2 596
Manufacture of structural non-refractory clay and ceramic products
6 938 2 344 9 282 409 234 643 205 8 213 10 138
Manufacture of cement, lime and plaster and articles of concrete, cement and plaster
22 643 4 595 27 238 2 382 346 2 728 653 69 722 30 688
Manufacture of glass and glass products, non-structural non-refractory ceramicware, cutting and shaping of stone and other non-metallic mineral products n.e.c.
10 804 4 228 15 032 1 004 200 1 204 105 29 134 16 370
Division 35 - Metals, metal products, machinery and equipment
189 469 40 610 230 079 14 904 2 475 17 379 2 350 334 2 684 250 142
Manufacture of basic iron and steel 28 302 4 893 33 195 2 122 93 2 215 64 33 97 35 507
Manufacture of basic precious and non-ferrous metals 10 639 2 521 13 160 774 136 910 83 57 140 14 210
Manufacture of structural metal products 26 008 4 686 30 694 3 270 343 3 613 854 23 877 35 184
Treatment and coating of metals; general mechanical engineering
17 602 3 084 20 686 964 39 1 003 284 4 288 21 977
Manufacture of cutlery, hand tools and general hardware
3 082 1 030 4 112 56 35 91 22 11 33 4 236
Casting of iron, steel and non-ferrous metals; manufacture of tanks, reservoirs and similar containers of metal; forging, pressing, stamping and roll-forming of metal; powder metallurgy and manufacture of other fabricated metal products
28 242 6 064 34 306 4 104 331 4 435 171 14 185 38 926
Manufacture of engines and turbines, except aircraft, vehicle and motor cycle engines
1 197 337 1 534 19 4 23 0 0 0 1 557
Manufacture of pumps, compressors, taps and valves 8 730 2 354 11 084 379 52 431 41 17 58 11 573
Manufacture of ovens, furnaces and furnace burners 448 94 542 0 0 0 0 0 0 542
Manufacture of lifting and handling equipment 6 117 1 171 7 288 120 19 139 8 1 9 7 436
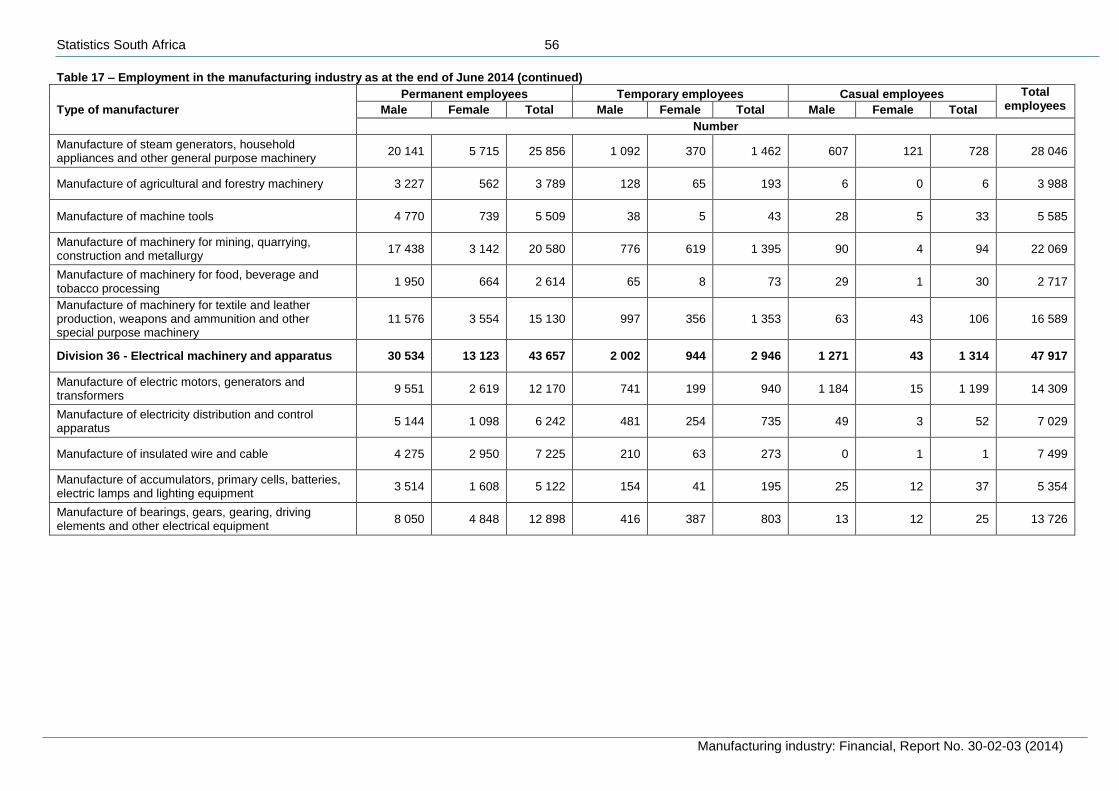
Statistics South Africa 56
Manufacturing industry: Financial, Report No. 30-02-03 (2014)
Table 17 – Employment in the manufacturing industry as at the end of June 2014 (continued)
Type of manufacturer
Permanent employees Temporary employees Casual employees Total employees Male Female Total Male Female Total Male Female Total
Number
Manufacture of steam generators, household appliances and other general purpose machinery
20 141 5 715 25 856 1 092 370 1 462 607 121 728 28 046
Manufacture of agricultural and forestry machinery 3 227 562 3 789 128 65 193 6 0 6 3 988
Manufacture of machine tools 4 770 739 5 509 38 5 43 28 5 33 5 585
Manufacture of machinery for mining, quarrying, construction and metallurgy
17 438 3 142 20 580 776 619 1 395 90 4 94 22 069
Manufacture of machinery for food, beverage and tobacco processing
1 950 664 2 614 65 8 73 29 1 30 2 717
Manufacture of machinery for textile and leather production, weapons and ammunition and other special purpose machinery
11 576 3 554 15 130 997 356 1 353 63 43 106 16 589
Division 36 - Electrical machinery and apparatus 30 534 13 123 43 657 2 002 944 2 946 1 271 43 1 314 47 917
Manufacture of electric motors, generators and transformers
9 551 2 619 12 170 741 199 940 1 184 15 1 199 14 309
Manufacture of electricity distribution and control apparatus
5 144 1 098 6 242 481 254 735 49 3 52 7 029
Manufacture of insulated wire and cable 4 275 2 950 7 225 210 63 273 0 1 1 7 499
Manufacture of accumulators, primary cells, batteries, electric lamps and lighting equipment
3 514 1 608 5 122 154 41 195 25 12 37 5 354
Manufacture of bearings, gears, gearing, driving elements and other electrical equipment
8 050 4 848 12 898 416 387 803 13 12 25 13 726
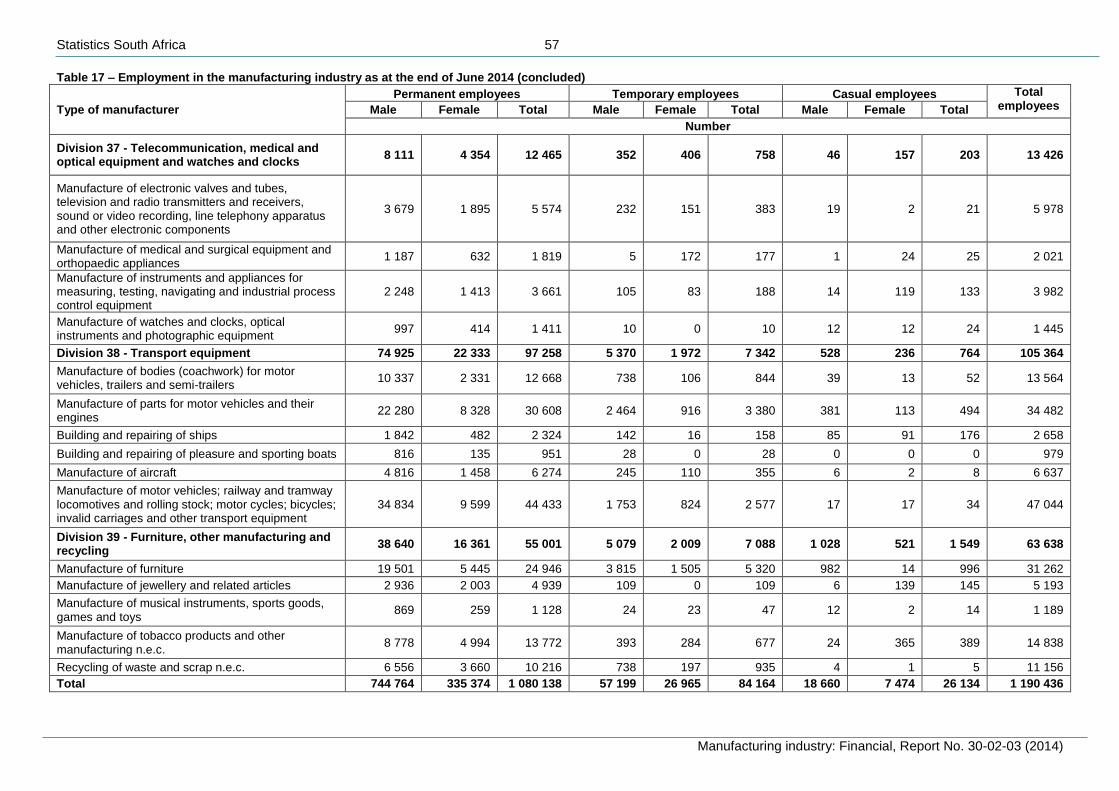
Statistics South Africa 57
Manufacturing industry: Financial, Report No. 30-02-03 (2014)
Table 17 – Employment in the manufacturing industry as at the end of June 2014 (concluded)
Type of manufacturer
Permanent employees Temporary employees Casual employees Total employees Male Female Total Male Female Total Male Female Total
Number
Division 37 - Telecommunication, medical and optical equipment and watches and clocks
8 111 4 354 12 465 352 406 758 46 157 203 13 426
Manufacture of electronic valves and tubes, television and radio transmitters and receivers, sound or video recording, line telephony apparatus and other electronic components
3 679 1 895 5 574 232 151 383 19 2 21 5 978
Manufacture of medical and surgical equipment and orthopaedic appliances
1 187 632 1 819 5 172 177 1 24 25 2 021
Manufacture of instruments and appliances for measuring, testing, navigating and industrial process control equipment
2 248 1 413 3 661 105 83 188 14 119 133 3 982
Manufacture of watches and clocks, optical instruments and photographic equipment
997 414 1 411 10 0 10 12 12 24 1 445
Division 38 - Transport equipment 74 925 22 333 97 258 5 370 1 972 7 342 528 236 764 105 364
Manufacture of bodies (coachwork) for motor vehicles, trailers and semi-trailers
10 337 2 331 12 668 738 106 844 39 13 52 13 564
Manufacture of parts for motor vehicles and their engines
22 280 8 328 30 608 2 464 916 3 380 381 113 494 34 482
Building and repairing of ships 1 842 482 2 324 142 16 158 85 91 176 2 658
Building and repairing of pleasure and sporting boats 816 135 951 28 0 28 0 0 0 979
Manufacture of aircraft 4 816 1 458 6 274 245 110 355 6 2 8 6 637
Manufacture of motor vehicles; railway and tramway locomotives and rolling stock; motor cycles; bicycles; invalid carriages and other transport equipment
34 834 9 599 44 433 1 753 824 2 577 17 17 34 47 044
Division 39 - Furniture, other manufacturing and recycling
38 640 16 361 55 001 5 079 2 009 7 088 1 028 521 1 549 63 638
Manufacture of furniture 19 501 5 445 24 946 3 815 1 505 5 320 982 14 996 31 262
Manufacture of jewellery and related articles 2 936 2 003 4 939 109 0 109 6 139 145 5 193
Manufacture of musical instruments, sports goods, games and toys
869 259 1 128 24 23 47 12 2 14 1 189
Manufacture of tobacco products and other manufacturing n.e.c.
8 778 4 994 13 772 393 284 677 24 365 389 14 838
Recycling of waste and scrap n.e.c. 6 556 3 660 10 216 738 197 935 4 1 5 11 156
Total 744 764 335 374 1 080 138 57 199 26 965 84 164 18 660 7 474 26 134 1 190 436
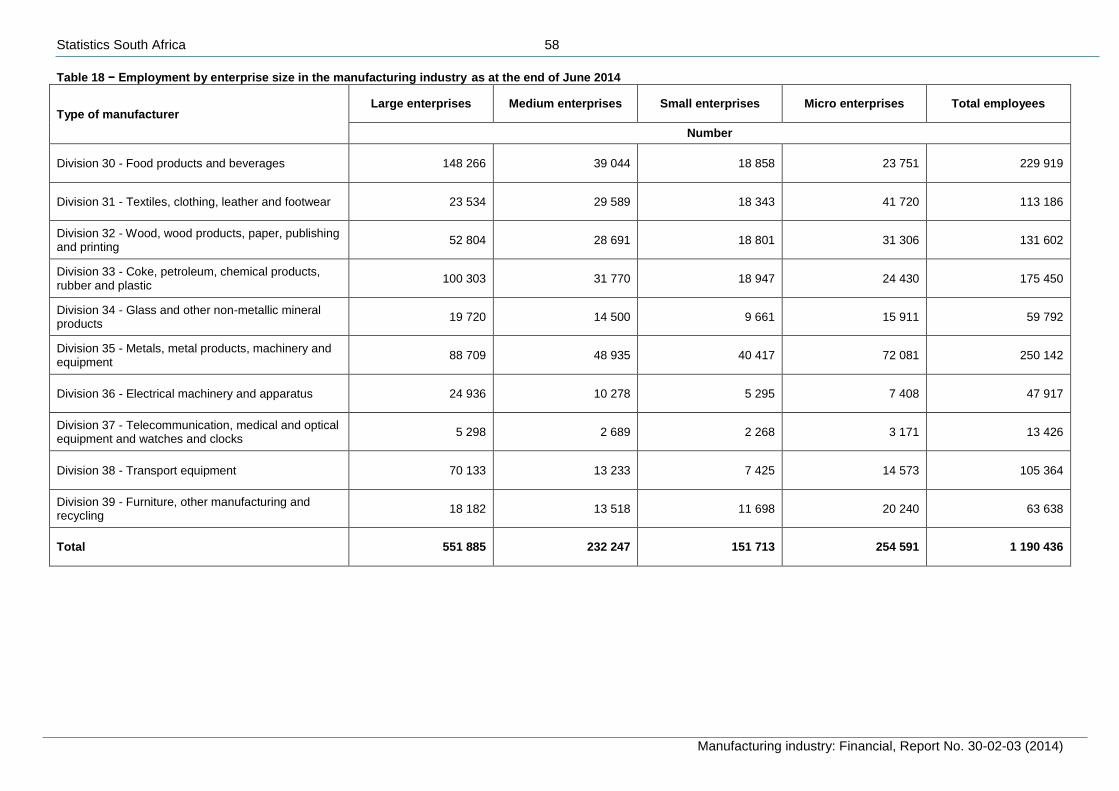
Statistics South Africa 58
Manufacturing industry: Financial, Report No. 30-02-03 (2014)
Table 18 − Employment by enterprise size in the manufacturing industry as at the end of June 2014
Type of manufacturer Large enterprises Medium enterprises Small enterprises Micro enterprises Total employees
Number
Division 30 - Food products and beverages 148 266 39 044 18 858 23 751 229 919
Division 31 - Textiles, clothing, leather and footwear 23 534 29 589 18 343 41 720 113 186
Division 32 - Wood, wood products, paper, publishing and printing
52 804 28 691 18 801 31 306 131 602
Division 33 - Coke, petroleum, chemical products, rubber and plastic
100 303 31 770 18 947 24 430 175 450
Division 34 - Glass and other non-metallic mineral products
19 720 14 500 9 661 15 911 59 792
Division 35 - Metals, metal products, machinery and equipment
88 709 48 935 40 417 72 081 250 142
Division 36 - Electrical machinery and apparatus 24 936 10 278 5 295 7 408 47 917
Division 37 - Telecommunication, medical and optical equipment and watches and clocks
5 298 2 689 2 268 3 171 13 426
Division 38 - Transport equipment 70 133 13 233 7 425 14 573 105 364
Division 39 - Furniture, other manufacturing and recycling
18 182 13 518 11 698 20 240 63 638
Total 551 885 232 247 151 713 254 591 1 190 436
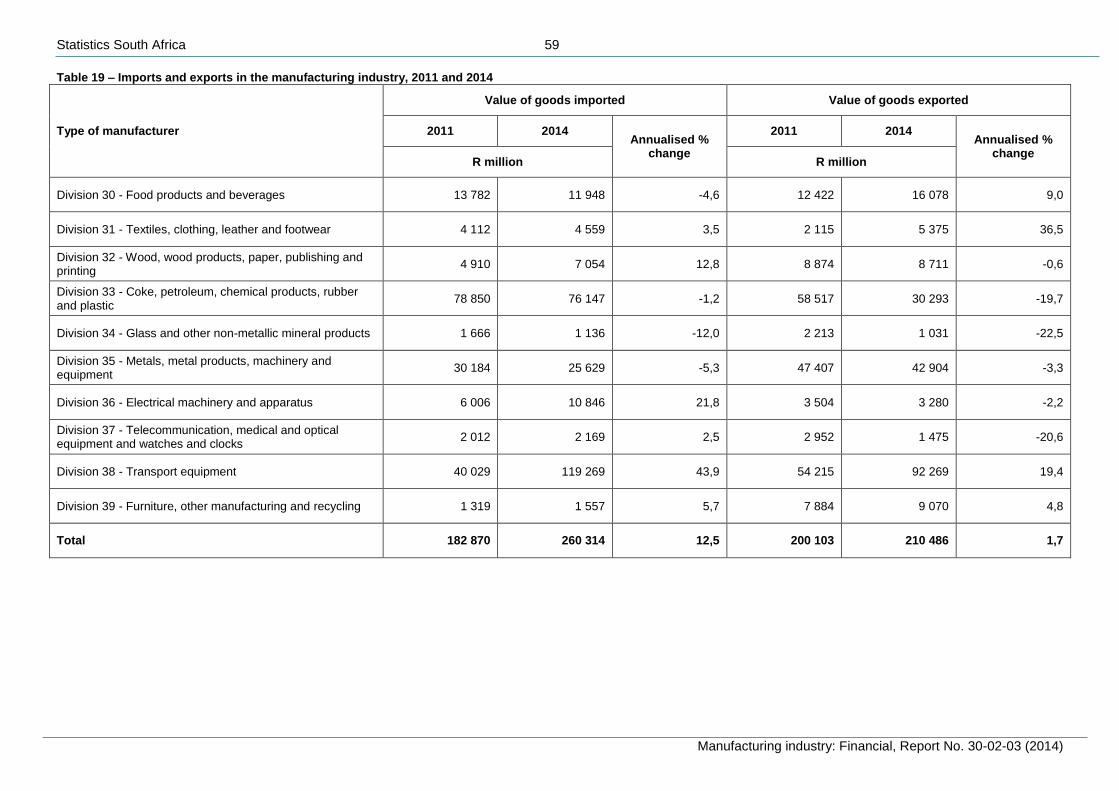
Statistics South Africa 59
Manufacturing industry: Financial, Report No. 30-02-03 (2014)
Table 19 – Imports and exports in the manufacturing industry, 2011 and 2014
Type of manufacturer
Value of goods imported Value of goods exported
2011 2014 Annualised %
change
2011 2014 Annualised %
change R million R million
Division 30 - Food products and beverages 13 782 11 948 -4,6 12 422 16 078 9,0
Division 31 - Textiles, clothing, leather and footwear 4 112 4 559 3,5 2 115 5 375 36,5
Division 32 - Wood, wood products, paper, publishing and printing
4 910 7 054 12,8 8 874 8 711 -0,6
Division 33 - Coke, petroleum, chemical products, rubber and plastic
78 850 76 147 -1,2 58 517 30 293 -19,7
Division 34 - Glass and other non-metallic mineral products 1 666 1 136 -12,0 2 213 1 031 -22,5
Division 35 - Metals, metal products, machinery and equipment
30 184 25 629 -5,3 47 407 42 904 -3,3
Division 36 - Electrical machinery and apparatus 6 006 10 846 21,8 3 504 3 280 -2,2
Division 37 - Telecommunication, medical and optical equipment and watches and clocks
2 012 2 169 2,5 2 952 1 475 -20,6
Division 38 - Transport equipment 40 029 119 269 43,9 54 215 92 269 19,4
Division 39 - Furniture, other manufacturing and recycling 1 319 1 557 5,7 7 884 9 070 4,8
Total 182 870 260 314 12,5 200 103 210 486 1,7
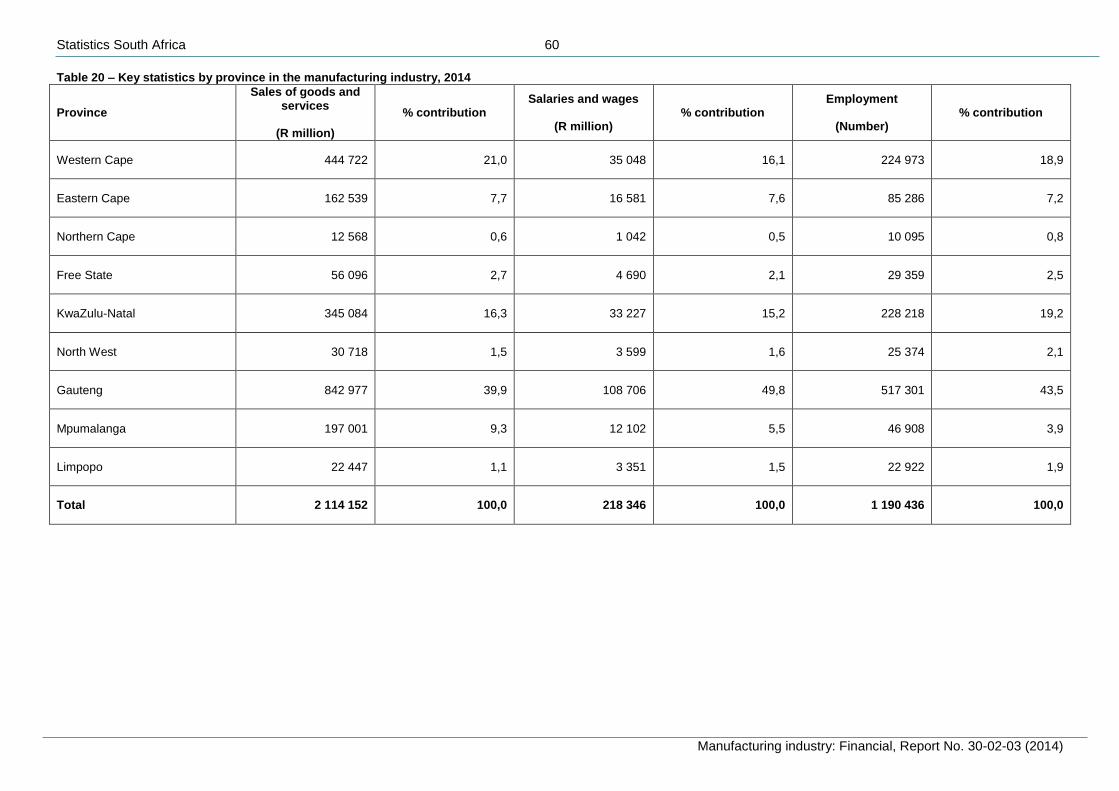
Statistics South Africa 60
Manufacturing industry: Financial, Report No. 30-02-03 (2014)
Table 20 – Key statistics by province in the manufacturing industry, 2014
Province
Sales of goods and services
(R million)
% contribution Salaries and wages
(R million)
% contribution Employment
(Number)
% contribution
Western Cape 444 722 21,0 35 048 16,1 224 973 18,9
Eastern Cape 162 539 7,7 16 581 7,6 85 286 7,2
Northern Cape 12 568 0,6 1 042 0,5 10 095 0,8
Free State 56 096 2,7 4 690 2,1 29 359 2,5
KwaZulu-Natal 345 084 16,3 33 227 15,2 228 218 19,2
North West 30 718 1,5 3 599 1,6 25 374 2,1
Gauteng 842 977 39,9 108 706 49,8 517 301 43,5
Mpumalanga 197 001 9,3 12 102 5,5 46 908 3,9
Limpopo 22 447 1,1 3 351 1,5 22 922 1,9
Total 2 114 152 100,0 218 346 100,0 1 190 436 100,0
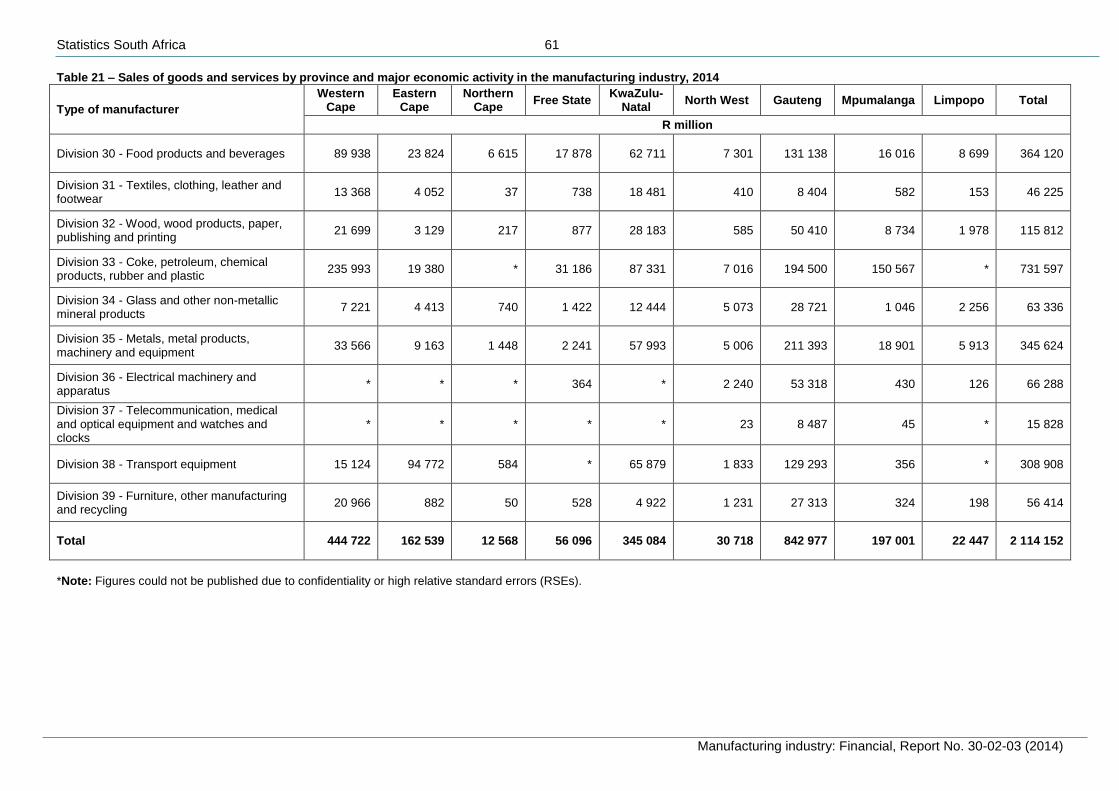
Statistics South Africa 61
Manufacturing industry: Financial, Report No. 30-02-03 (2014)
Table 21 – Sales of goods and services by province and major economic activity in the manufacturing industry, 2014
Type of manufacturer
Western Cape
Eastern Cape
Northern Cape
Free State KwaZulu-
Natal North West Gauteng Mpumalanga Limpopo Total
R million
Division 30 - Food products and beverages 89 938 23 824 6 615 17 878 62 711 7 301 131 138 16 016 8 699 364 120
Division 31 - Textiles, clothing, leather and footwear
13 368 4 052 37 738 18 481 410 8 404 582 153 46 225
Division 32 - Wood, wood products, paper, publishing and printing
21 699 3 129 217 877 28 183 585 50 410 8 734 1 978 115 812
Division 33 - Coke, petroleum, chemical products, rubber and plastic
235 993 19 380 * 31 186 87 331 7 016 194 500 150 567 * 731 597
Division 34 - Glass and other non-metallic mineral products
7 221 4 413 740 1 422 12 444 5 073 28 721 1 046 2 256 63 336
Division 35 - Metals, metal products, machinery and equipment
33 566 9 163 1 448 2 241 57 993 5 006 211 393 18 901 5 913 345 624
Division 36 - Electrical machinery and apparatus
* * * 364 * 2 240 53 318 430 126 66 288
Division 37 - Telecommunication, medical and optical equipment and watches and clocks
* * * * * 23 8 487 45 * 15 828
Division 38 - Transport equipment 15 124 94 772 584 * 65 879 1 833 129 293 356 * 308 908
Division 39 - Furniture, other manufacturing and recycling
20 966 882 50 528 4 922 1 231 27 313 324 198 56 414
Total 444 722 162 539 12 568 56 096 345 084 30 718 842 977 197 001 22 447 2 114 152
*Note: Figures could not be published due to confidentiality or high relative standard errors (RSEs).
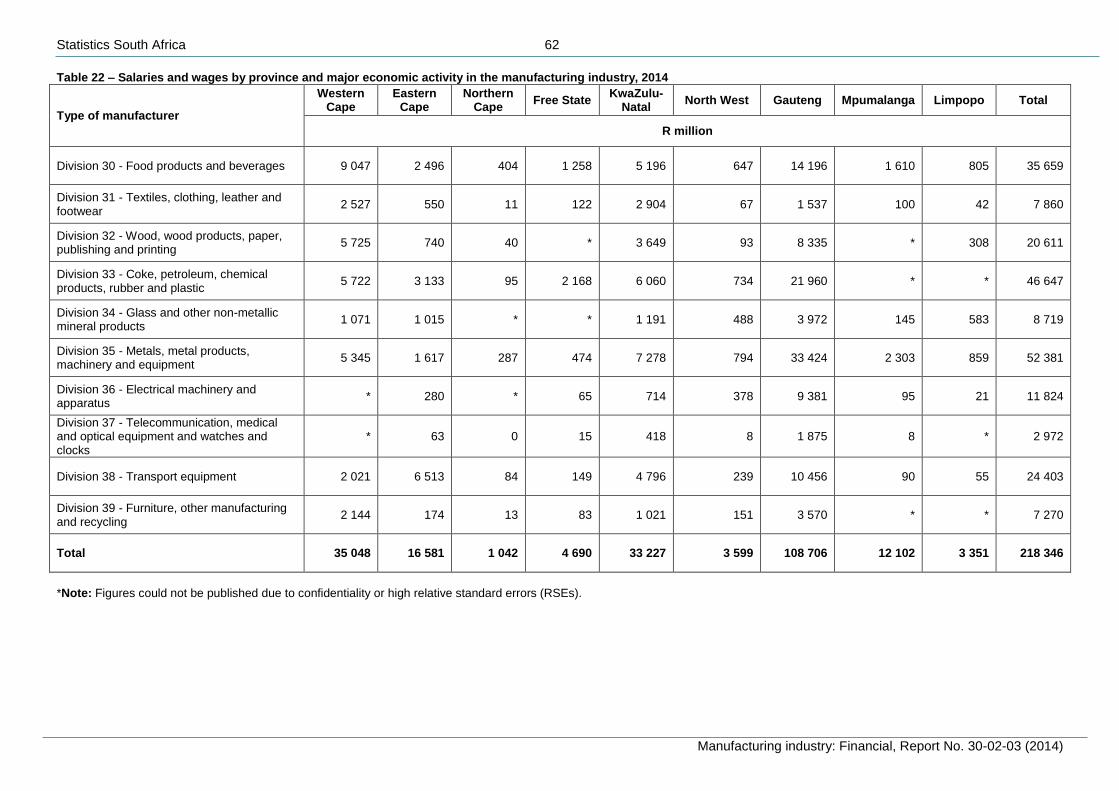
Statistics South Africa 62
Manufacturing industry: Financial, Report No. 30-02-03 (2014)
Table 22 – Salaries and wages by province and major economic activity in the manufacturing industry, 2014
Type of manufacturer
Western Cape
Eastern Cape
Northern Cape
Free State KwaZulu-
Natal North West Gauteng Mpumalanga Limpopo Total
R million
Division 30 - Food products and beverages 9 047 2 496 404 1 258 5 196 647 14 196 1 610 805 35 659
Division 31 - Textiles, clothing, leather and footwear
2 527 550 11 122 2 904 67 1 537 100 42 7 860
Division 32 - Wood, wood products, paper, publishing and printing
5 725 740 40 * 3 649 93 8 335 * 308 20 611
Division 33 - Coke, petroleum, chemical products, rubber and plastic
5 722 3 133 95 2 168 6 060 734 21 960 * * 46 647
Division 34 - Glass and other non-metallic mineral products
1 071 1 015 * * 1 191 488 3 972 145 583 8 719
Division 35 - Metals, metal products, machinery and equipment
5 345 1 617 287 474 7 278 794 33 424 2 303 859 52 381
Division 36 - Electrical machinery and apparatus
* 280 * 65 714 378 9 381 95 21 11 824
Division 37 - Telecommunication, medical and optical equipment and watches and clocks
* 63 0 15 418 8 1 875 8 * 2 972
Division 38 - Transport equipment 2 021 6 513 84 149 4 796 239 10 456 90 55 24 403
Division 39 - Furniture, other manufacturing and recycling
2 144 174 13 83 1 021 151 3 570 * * 7 270
Total 35 048 16 581 1 042 4 690 33 227 3 599 108 706 12 102 3 351 218 346
*Note: Figures could not be published due to confidentiality or high relative standard errors (RSEs).
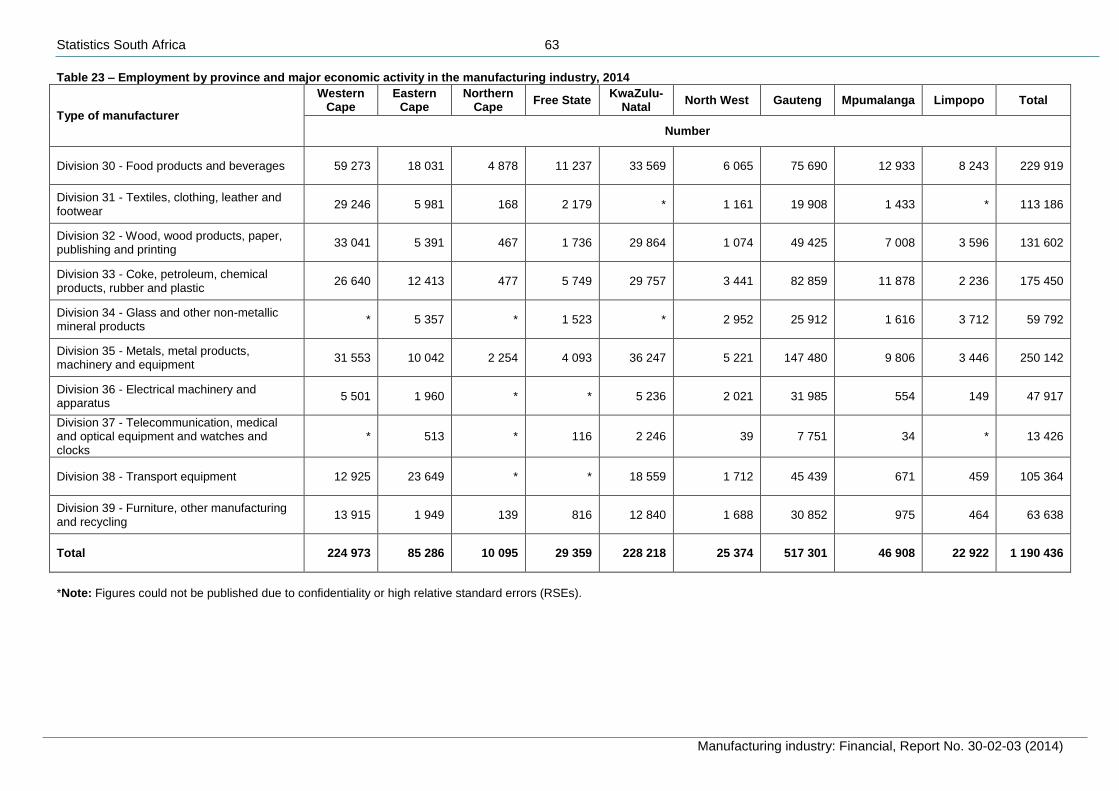
Statistics South Africa 63
Manufacturing industry: Financial, Report No. 30-02-03 (2014)
Table 23 – Employment by province and major economic activity in the manufacturing industry, 2014
Type of manufacturer
Western Cape
Eastern Cape
Northern Cape
Free State KwaZulu-
Natal North West Gauteng Mpumalanga Limpopo Total
Number
Division 30 - Food products and beverages 59 273 18 031 4 878 11 237 33 569 6 065 75 690 12 933 8 243 229 919
Division 31 - Textiles, clothing, leather and footwear
29 246 5 981 168 2 179 * 1 161 19 908 1 433 * 113 186
Division 32 - Wood, wood products, paper, publishing and printing
33 041 5 391 467 1 736 29 864 1 074 49 425 7 008 3 596 131 602
Division 33 - Coke, petroleum, chemical products, rubber and plastic
26 640 12 413 477 5 749 29 757 3 441 82 859 11 878 2 236 175 450
Division 34 - Glass and other non-metallic mineral products
* 5 357 * 1 523 * 2 952 25 912 1 616 3 712 59 792
Division 35 - Metals, metal products, machinery and equipment
31 553 10 042 2 254 4 093 36 247 5 221 147 480 9 806 3 446 250 142
Division 36 - Electrical machinery and apparatus
5 501 1 960 * * 5 236 2 021 31 985 554 149 47 917
Division 37 - Telecommunication, medical and optical equipment and watches and clocks
* 513 * 116 2 246 39 7 751 34 * 13 426
Division 38 - Transport equipment 12 925 23 649 * * 18 559 1 712 45 439 671 459 105 364
Division 39 - Furniture, other manufacturing and recycling
13 915 1 949 139 816 12 840 1 688 30 852 975 464 63 638
Total 224 973 85 286 10 095 29 359 228 218 25 374 517 301 46 908 22 922 1 190 436
*Note: Figures could not be published due to confidentiality or high relative standard errors (RSEs).
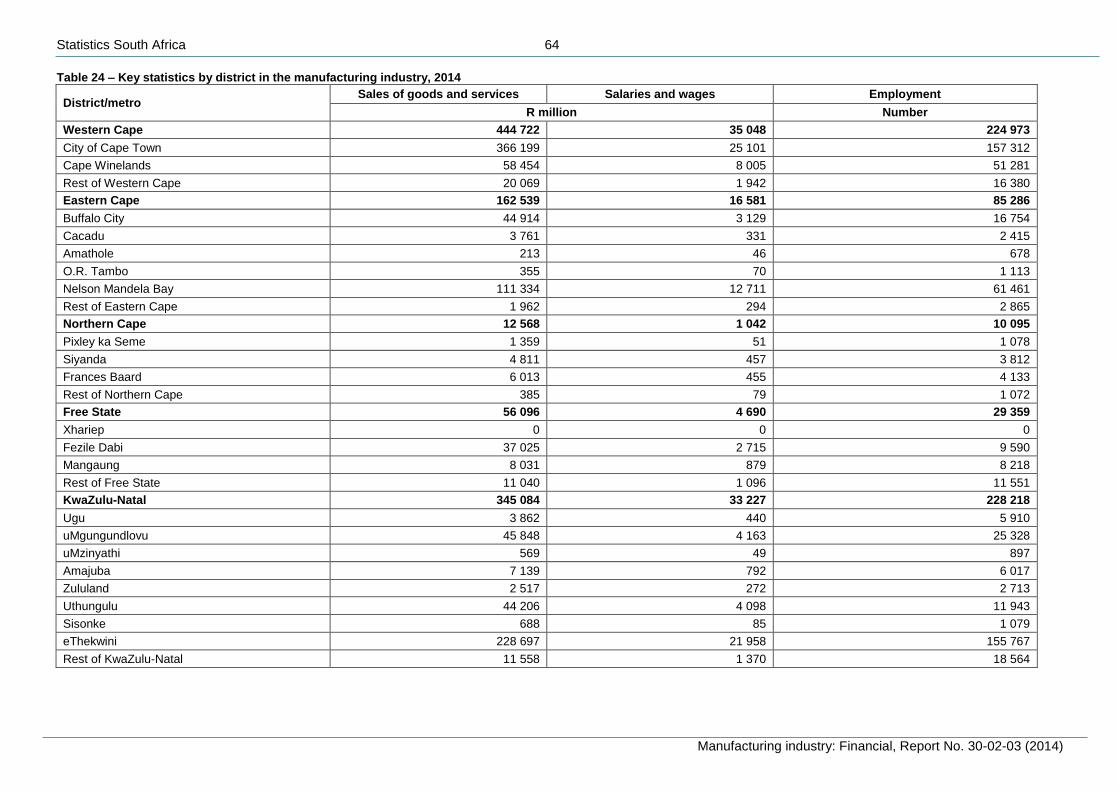
Statistics South Africa 64
Manufacturing industry: Financial, Report No. 30-02-03 (2014)
Table 24 – Key statistics by district in the manufacturing industry, 2014
District/metro Sales of goods and services Salaries and wages Employment
R million Number
Western Cape 444 722 35 048 224 973
City of Cape Town 366 199 25 101 157 312
Cape Winelands 58 454 8 005 51 281
Rest of Western Cape 20 069 1 942 16 380
Eastern Cape 162 539 16 581 85 286
Buffalo City 44 914 3 129 16 754
Cacadu 3 761 331 2 415
Amathole 213 46 678
O.R. Tambo 355 70 1 113
Nelson Mandela Bay 111 334 12 711 61 461
Rest of Eastern Cape 1 962 294 2 865
Northern Cape 12 568 1 042 10 095
Pixley ka Seme 1 359 51 1 078
Siyanda 4 811 457 3 812
Frances Baard 6 013 455 4 133
Rest of Northern Cape 385 79 1 072
Free State 56 096 4 690 29 359
Xhariep 0 0 0
Fezile Dabi 37 025 2 715 9 590
Mangaung 8 031 879 8 218
Rest of Free State 11 040 1 096 11 551
KwaZulu-Natal 345 084 33 227 228 218
Ugu 3 862 440 5 910
uMgungundlovu 45 848 4 163 25 328
uMzinyathi 569 49 897
Amajuba 7 139 792 6 017
Zululand 2 517 272 2 713
Uthungulu 44 206 4 098 11 943
Sisonke 688 85 1 079
eThekwini 228 697 21 958 155 767
Rest of KwaZulu-Natal 11 558 1 370 18 564
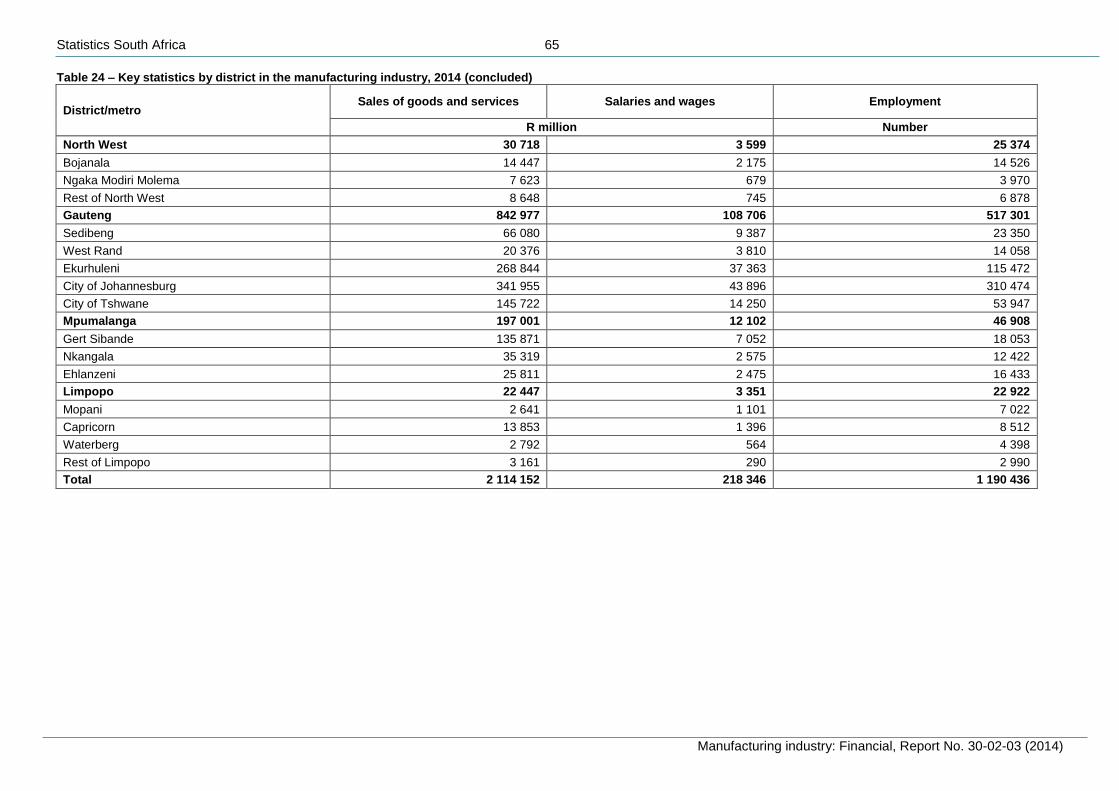
Statistics South Africa 65
Manufacturing industry: Financial, Report No. 30-02-03 (2014)
Table 24 – Key statistics by district in the manufacturing industry, 2014 (concluded)
District/metro Sales of goods and services Salaries and wages Employment
R million Number
North West 30 718 3 599 25 374
Bojanala 14 447 2 175 14 526
Ngaka Modiri Molema 7 623 679 3 970
Rest of North West 8 648 745 6 878
Gauteng 842 977 108 706 517 301
Sedibeng 66 080 9 387 23 350
West Rand 20 376 3 810 14 058
Ekurhuleni 268 844 37 363 115 472
City of Johannesburg 341 955 43 896 310 474
City of Tshwane 145 722 14 250 53 947
Mpumalanga 197 001 12 102 46 908
Gert Sibande 135 871 7 052 18 053
Nkangala 35 319 2 575 12 422
Ehlanzeni 25 811 2 475 16 433
Limpopo 22 447 3 351 22 922
Mopani 2 641 1 101 7 022
Capricorn 13 853 1 396 8 512
Waterberg 2 792 564 4 398
Rest of Limpopo 3 161 290 2 990
Total 2 114 152 218 346 1 190 436
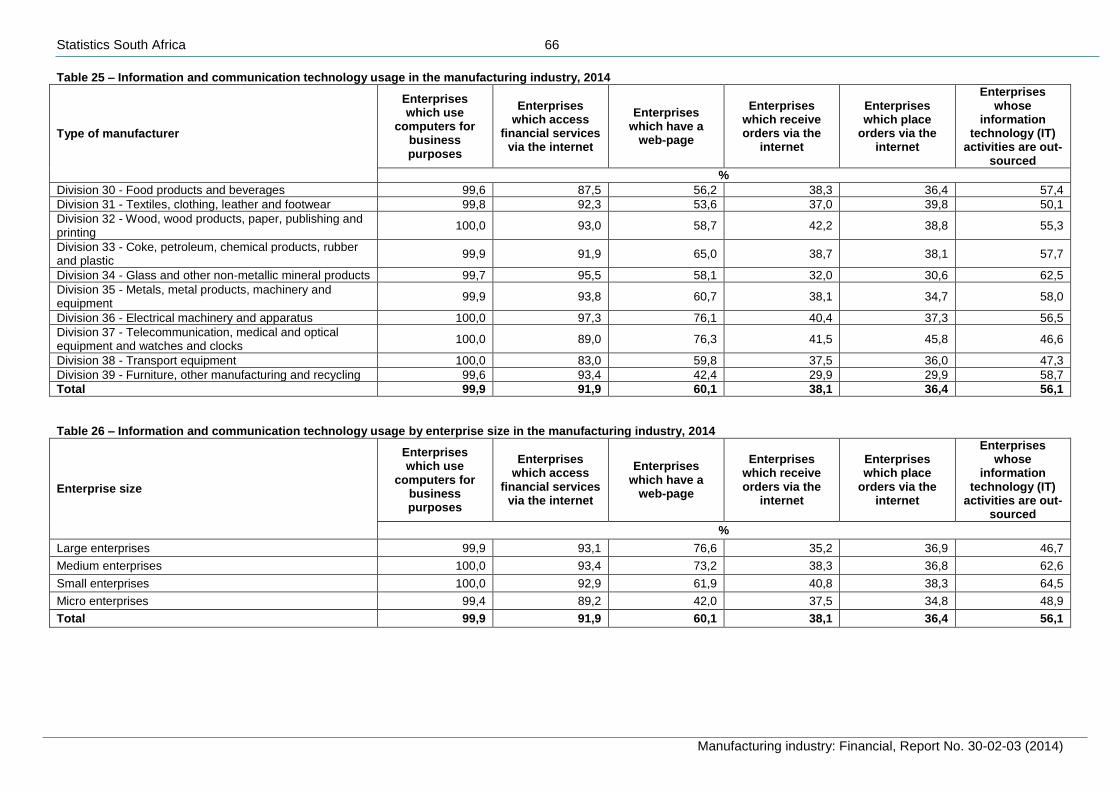
Statistics South Africa 66
Manufacturing industry: Financial, Report No. 30-02-03 (2014)
Table 25 – Information and communication technology usage in the manufacturing industry, 2014
Type of manufacturer
Enterprises which use
computers for business purposes
Enterprises which access
financial services via the internet
Enterprises which have a
web-page
Enterprises which receive orders via the
internet
Enterprises which place
orders via the internet
Enterprises whose
information technology (IT)
activities are out-sourced
%
Division 30 - Food products and beverages 99,6 87,5 56,2 38,3 36,4 57,4
Division 31 - Textiles, clothing, leather and footwear 99,8 92,3 53,6 37,0 39,8 50,1
Division 32 - Wood, wood products, paper, publishing and printing
100,0 93,0 58,7 42,2 38,8 55,3
Division 33 - Coke, petroleum, chemical products, rubber and plastic
99,9 91,9 65,0 38,7 38,1 57,7
Division 34 - Glass and other non-metallic mineral products 99,7 95,5 58,1 32,0 30,6 62,5
Division 35 - Metals, metal products, machinery and equipment
99,9 93,8 60,7 38,1 34,7 58,0
Division 36 - Electrical machinery and apparatus 100,0 97,3 76,1 40,4 37,3 56,5
Division 37 - Telecommunication, medical and optical equipment and watches and clocks
100,0 89,0 76,3 41,5 45,8 46,6
Division 38 - Transport equipment 100,0 83,0 59,8 37,5 36,0 47,3
Division 39 - Furniture, other manufacturing and recycling 99,6 93,4 42,4 29,9 29,9 58,7
Total 99,9 91,9 60,1 38,1 36,4 56,1
Table 26 – Information and communication technology usage by enterprise size in the manufacturing industry, 2014
Enterprise size
Enterprises which use
computers for business purposes
Enterprises which access
financial services via the internet
Enterprises which have a
web-page
Enterprises which receive orders via the
internet
Enterprises which place
orders via the internet
Enterprises whose
information technology (IT)
activities are out-sourced
%
Large enterprises 99,9 93,1 76,6 35,2 36,9 46,7
Medium enterprises 100,0 93,4 73,2 38,3 36,8 62,6
Small enterprises 100,0 92,9 61,9 40,8 38,3 64,5
Micro enterprises 99,4 89,2 42,0 37,5 34,8 48,9
Total 99,9 91,9 60,1 38,1 36,4 56,1
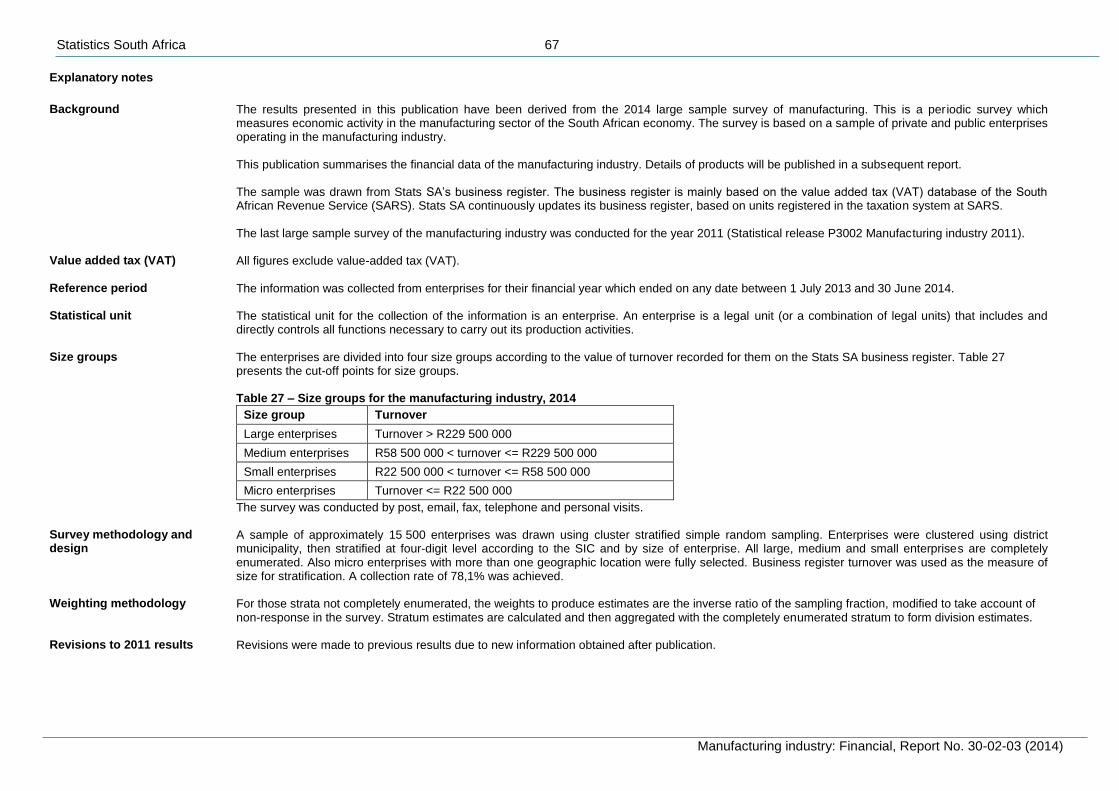
Statistics South Africa 67
Manufacturing industry: Financial, Report No. 30-02-03 (2014)
Explanatory notes
Background The results presented in this publication have been derived from the 2014 large sample survey of manufacturing. This is a periodic survey which
measures economic activity in the manufacturing sector of the South African economy. The survey is based on a sample of private and public enterprises operating in the manufacturing industry. This publication summarises the financial data of the manufacturing industry. Details of products will be published in a subsequent report. The sample was drawn from Stats SA’s business register. The business register is mainly based on the value added tax (VAT) database of the South African Revenue Service (SARS). Stats SA continuously updates its business register, based on units registered in the taxation system at SARS. The last large sample survey of the manufacturing industry was conducted for the year 2011 (Statistical release P3002 Manufacturing industry 2011).
Value added tax (VAT)
All figures exclude value-added tax (VAT).
Reference period The information was collected from enterprises for their financial year which ended on any date between 1 July 2013 and 30 June 2014.
Statistical unit The statistical unit for the collection of the information is an enterprise. An enterprise is a legal unit (or a combination of legal units) that includes and directly controls all functions necessary to carry out its production activities.
Size groups The enterprises are divided into four size groups according to the value of turnover recorded for them on the Stats SA business register. Table 27 presents the cut-off points for size groups. Table 27 – Size groups for the manufacturing industry, 2014
Size group Turnover
Large enterprises Turnover > R229 500 000
Medium enterprises R58 500 000 < turnover <= R229 500 000
Small enterprises R22 500 000 < turnover <= R58 500 000
Micro enterprises Turnover <= R22 500 000
Survey methodology and design
The survey was conducted by post, email, fax, telephone and personal visits. A sample of approximately 15 500 enterprises was drawn using cluster stratified simple random sampling. Enterprises were clustered using district municipality, then stratified at four-digit level according to the SIC and by size of enterprise. All large, medium and small enterprises are completely enumerated. Also micro enterprises with more than one geographic location were fully selected. Business register turnover was used as the measure of size for stratification. A collection rate of 78,1% was achieved.
Weighting methodology For those strata not completely enumerated, the weights to produce estimates are the inverse ratio of the sampling fraction, modified to take account of non-response in the survey. Stratum estimates are calculated and then aggregated with the completely enumerated stratum to form division estimates.
Revisions to 2011 results Revisions were made to previous results due to new information obtained after publication.
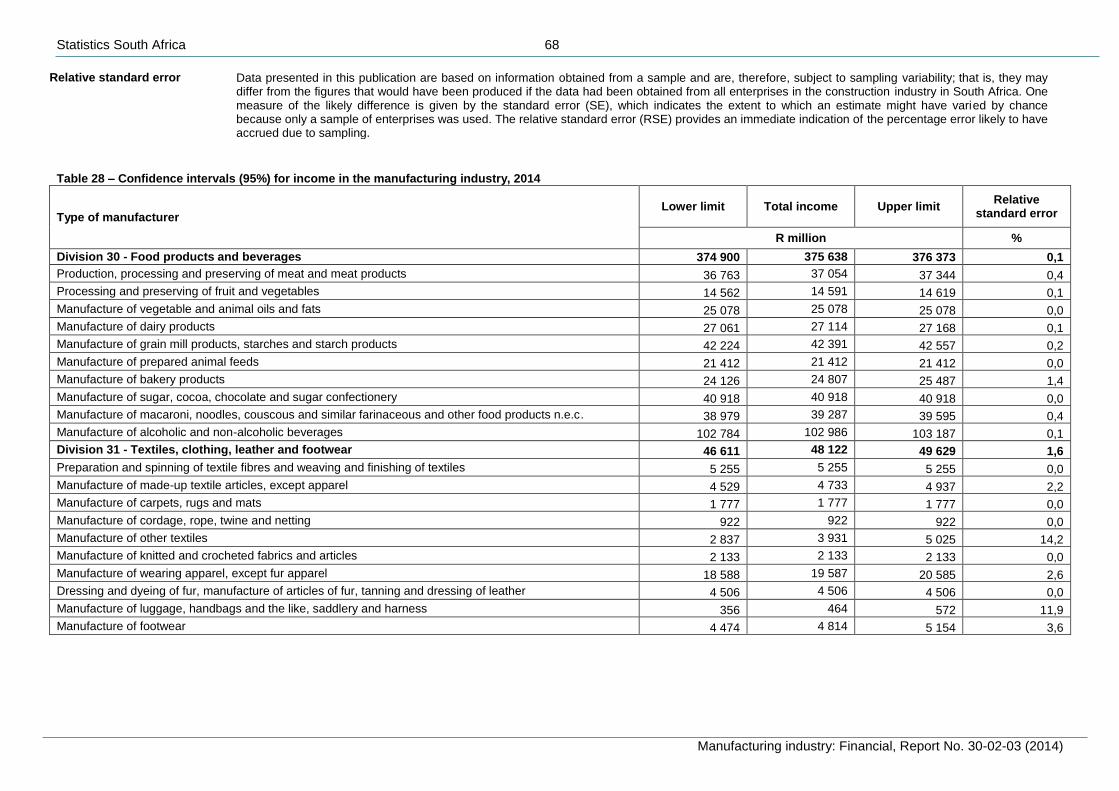
Statistics South Africa 68
Manufacturing industry: Financial, Report No. 30-02-03 (2014)
Relative standard error Data presented in this publication are based on information obtained from a sample and are, therefore, subject to sampling variability; that is, they may differ from the figures that would have been produced if the data had been obtained from all enterprises in the construction industry in South Africa. One measure of the likely difference is given by the standard error (SE), which indicates the extent to which an estimate might have varied by chance because only a sample of enterprises was used. The relative standard error (RSE) provides an immediate indication of the percentage error likely to have accrued due to sampling.
Table 28 – Confidence intervals (95%) for income in the manufacturing industry, 2014
Type of manufacturer Lower limit Total income Upper limit
Relative standard error
R million %
Division 30 - Food products and beverages 374 900 375 638 376 373 0,1
Production, processing and preserving of meat and meat products 36 763 37 054 37 344 0,4
Processing and preserving of fruit and vegetables 14 562 14 591 14 619 0,1
Manufacture of vegetable and animal oils and fats 25 078 25 078 25 078 0,0
Manufacture of dairy products 27 061 27 114 27 168 0,1
Manufacture of grain mill products, starches and starch products 42 224 42 391 42 557 0,2
Manufacture of prepared animal feeds 21 412 21 412 21 412 0,0
Manufacture of bakery products 24 126 24 807 25 487 1,4
Manufacture of sugar, cocoa, chocolate and sugar confectionery 40 918 40 918 40 918 0,0
Manufacture of macaroni, noodles, couscous and similar farinaceous and other food products n.e.c. 38 979 39 287 39 595 0,4
Manufacture of alcoholic and non-alcoholic beverages 102 784 102 986 103 187 0,1
Division 31 - Textiles, clothing, leather and footwear 46 611 48 122 49 629 1,6
Preparation and spinning of textile fibres and weaving and finishing of textiles 5 255 5 255 5 255 0,0
Manufacture of made-up textile articles, except apparel 4 529 4 733 4 937 2,2
Manufacture of carpets, rugs and mats 1 777 1 777 1 777 0,0
Manufacture of cordage, rope, twine and netting 922 922 922 0,0
Manufacture of other textiles 2 837 3 931 5 025 14,2
Manufacture of knitted and crocheted fabrics and articles 2 133 2 133 2 133 0,0
Manufacture of wearing apparel, except fur apparel 18 588 19 587 20 585 2,6
Dressing and dyeing of fur, manufacture of articles of fur, tanning and dressing of leather 4 506 4 506 4 506 0,0
Manufacture of luggage, handbags and the like, saddlery and harness 356 464 572 11,9
Manufacture of footwear 4 474 4 814 5 154 3,6
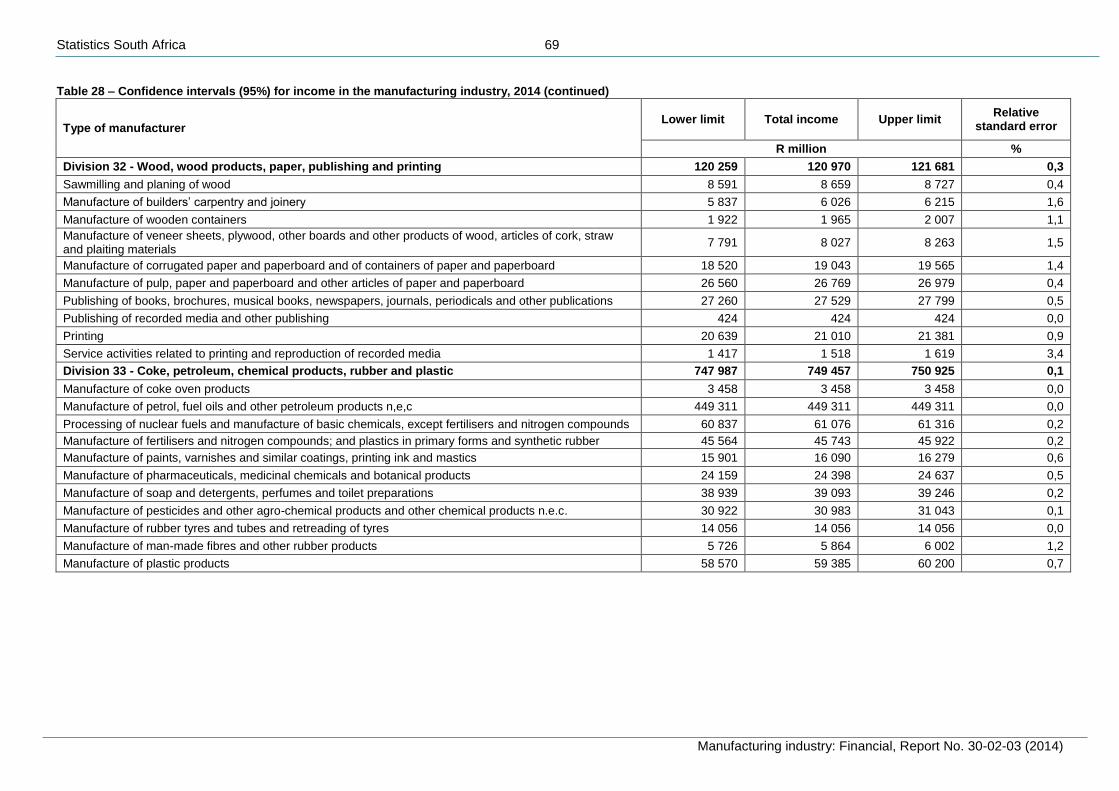
Statistics South Africa 69
Manufacturing industry: Financial, Report No. 30-02-03 (2014)
Table 28 – Confidence intervals (95%) for income in the manufacturing industry, 2014 (continued)
Type of manufacturer Lower limit Total income Upper limit
Relative standard error
R million %
Division 32 - Wood, wood products, paper, publishing and printing 120 259 120 970 121 681 0,3
Sawmilling and planing of wood 8 591 8 659 8 727 0,4
Manufacture of builders’ carpentry and joinery 5 837 6 026 6 215 1,6
Manufacture of wooden containers 1 922 1 965 2 007 1,1
Manufacture of veneer sheets, plywood, other boards and other products of wood, articles of cork, straw and plaiting materials
7 791 8 027 8 263 1,5
Manufacture of corrugated paper and paperboard and of containers of paper and paperboard 18 520 19 043 19 565 1,4
Manufacture of pulp, paper and paperboard and other articles of paper and paperboard 26 560 26 769 26 979 0,4
Publishing of books, brochures, musical books, newspapers, journals, periodicals and other publications 27 260 27 529 27 799 0,5
Publishing of recorded media and other publishing 424 424 424 0,0
Printing 20 639 21 010 21 381 0,9
Service activities related to printing and reproduction of recorded media 1 417 1 518 1 619 3,4
Division 33 - Coke, petroleum, chemical products, rubber and plastic 747 987 749 457 750 925 0,1
Manufacture of coke oven products 3 458 3 458 3 458 0,0
Manufacture of petrol, fuel oils and other petroleum products n,e,c 449 311 449 311 449 311 0,0
Processing of nuclear fuels and manufacture of basic chemicals, except fertilisers and nitrogen compounds 60 837 61 076 61 316 0,2
Manufacture of fertilisers and nitrogen compounds; and plastics in primary forms and synthetic rubber 45 564 45 743 45 922 0,2
Manufacture of paints, varnishes and similar coatings, printing ink and mastics 15 901 16 090 16 279 0,6
Manufacture of pharmaceuticals, medicinal chemicals and botanical products 24 159 24 398 24 637 0,5
Manufacture of soap and detergents, perfumes and toilet preparations 38 939 39 093 39 246 0,2
Manufacture of pesticides and other agro-chemical products and other chemical products n.e.c. 30 922 30 983 31 043 0,1
Manufacture of rubber tyres and tubes and retreading of tyres 14 056 14 056 14 056 0,0
Manufacture of man-made fibres and other rubber products 5 726 5 864 6 002 1,2
Manufacture of plastic products 58 570 59 385 60 200 0,7
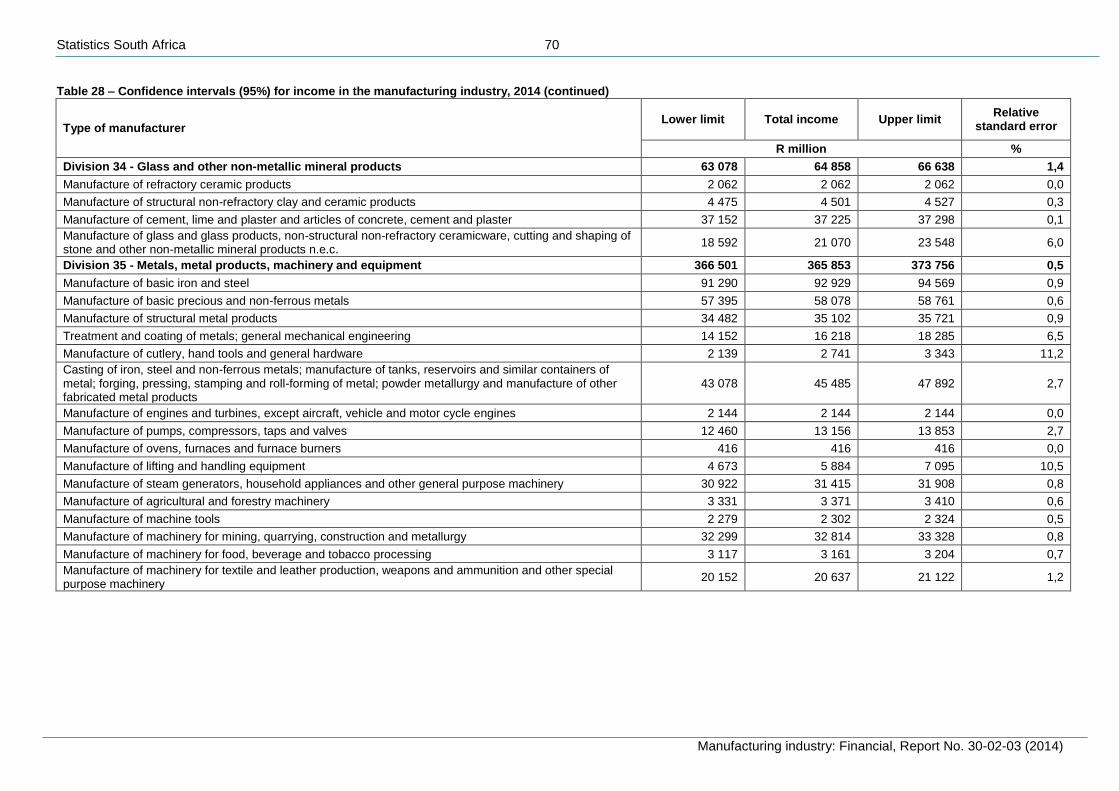
Statistics South Africa 70
Manufacturing industry: Financial, Report No. 30-02-03 (2014)
Table 28 – Confidence intervals (95%) for income in the manufacturing industry, 2014 (continued)
Type of manufacturer Lower limit Total income Upper limit
Relative standard error
R million %
Division 34 - Glass and other non-metallic mineral products 63 078 64 858 66 638 1,4
Manufacture of refractory ceramic products 2 062 2 062 2 062 0,0
Manufacture of structural non-refractory clay and ceramic products 4 475 4 501 4 527 0,3
Manufacture of cement, lime and plaster and articles of concrete, cement and plaster 37 152 37 225 37 298 0,1
Manufacture of glass and glass products, non-structural non-refractory ceramicware, cutting and shaping of stone and other non-metallic mineral products n.e.c.
18 592 21 070 23 548 6,0
Division 35 - Metals, metal products, machinery and equipment 366 501 365 853 373 756 0,5
Manufacture of basic iron and steel 91 290 92 929 94 569 0,9
Manufacture of basic precious and non-ferrous metals 57 395 58 078 58 761 0,6
Manufacture of structural metal products 34 482 35 102 35 721 0,9
Treatment and coating of metals; general mechanical engineering 14 152 16 218 18 285 6,5
Manufacture of cutlery, hand tools and general hardware 2 139 2 741 3 343 11,2
Casting of iron, steel and non-ferrous metals; manufacture of tanks, reservoirs and similar containers of metal; forging, pressing, stamping and roll-forming of metal; powder metallurgy and manufacture of other fabricated metal products
43 078 45 485 47 892 2,7
Manufacture of engines and turbines, except aircraft, vehicle and motor cycle engines 2 144 2 144 2 144 0,0
Manufacture of pumps, compressors, taps and valves 12 460 13 156 13 853 2,7
Manufacture of ovens, furnaces and furnace burners 416 416 416 0,0
Manufacture of lifting and handling equipment 4 673 5 884 7 095 10,5
Manufacture of steam generators, household appliances and other general purpose machinery 30 922 31 415 31 908 0,8
Manufacture of agricultural and forestry machinery 3 331 3 371 3 410 0,6
Manufacture of machine tools 2 279 2 302 2 324 0,5
Manufacture of machinery for mining, quarrying, construction and metallurgy 32 299 32 814 33 328 0,8
Manufacture of machinery for food, beverage and tobacco processing 3 117 3 161 3 204 0,7
Manufacture of machinery for textile and leather production, weapons and ammunition and other special purpose machinery
20 152 20 637 21 122 1,2
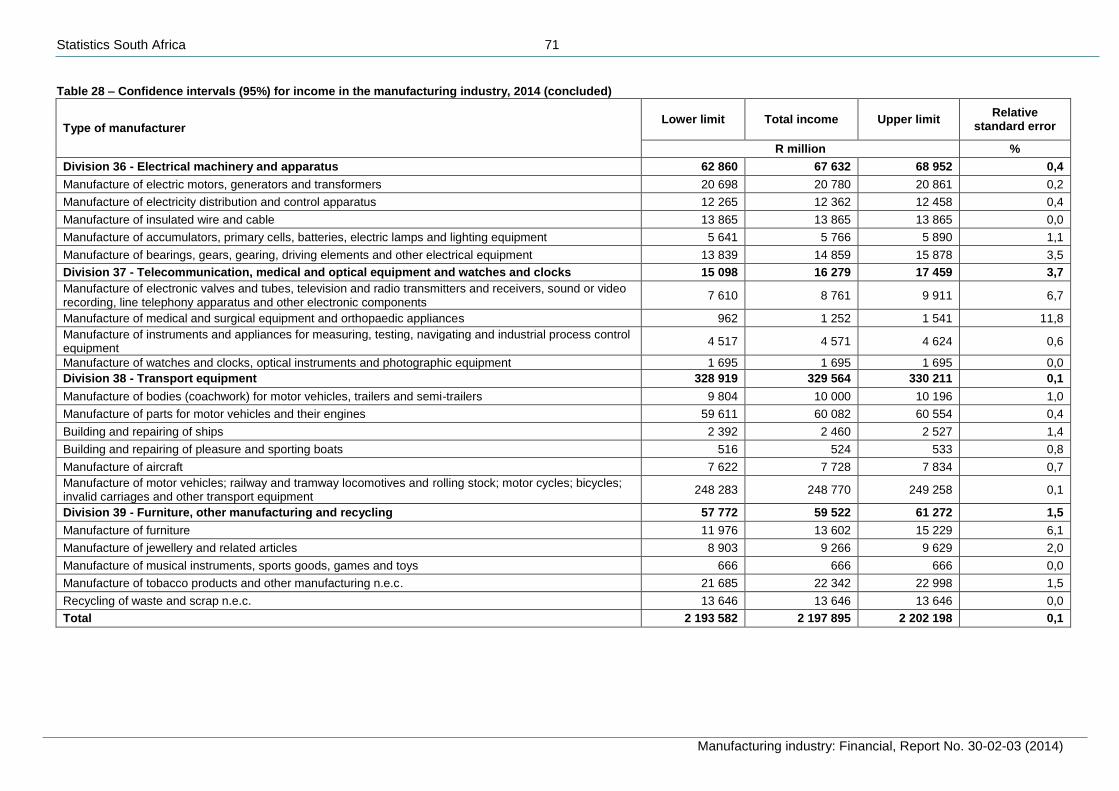
Statistics South Africa 71
Manufacturing industry: Financial, Report No. 30-02-03 (2014)
Table 28 – Confidence intervals (95%) for income in the manufacturing industry, 2014 (concluded)
Type of manufacturer Lower limit Total income Upper limit
Relative standard error
R million %
Division 36 - Electrical machinery and apparatus 62 860 67 632 68 952 0,4
Manufacture of electric motors, generators and transformers 20 698 20 780 20 861 0,2
Manufacture of electricity distribution and control apparatus 12 265 12 362 12 458 0,4
Manufacture of insulated wire and cable 13 865 13 865 13 865 0,0
Manufacture of accumulators, primary cells, batteries, electric lamps and lighting equipment 5 641 5 766 5 890 1,1
Manufacture of bearings, gears, gearing, driving elements and other electrical equipment 13 839 14 859 15 878 3,5
Division 37 - Telecommunication, medical and optical equipment and watches and clocks 15 098 16 279 17 459 3,7
Manufacture of electronic valves and tubes, television and radio transmitters and receivers, sound or video recording, line telephony apparatus and other electronic components
7 610 8 761 9 911 6,7
Manufacture of medical and surgical equipment and orthopaedic appliances 962 1 252 1 541 11,8
Manufacture of instruments and appliances for measuring, testing, navigating and industrial process control equipment
4 517 4 571 4 624 0,6
Manufacture of watches and clocks, optical instruments and photographic equipment 1 695 1 695 1 695 0,0
Division 38 - Transport equipment 328 919 329 564 330 211 0,1
Manufacture of bodies (coachwork) for motor vehicles, trailers and semi-trailers 9 804 10 000 10 196 1,0
Manufacture of parts for motor vehicles and their engines 59 611 60 082 60 554 0,4
Building and repairing of ships 2 392 2 460 2 527 1,4
Building and repairing of pleasure and sporting boats 516 524 533 0,8
Manufacture of aircraft 7 622 7 728 7 834 0,7
Manufacture of motor vehicles; railway and tramway locomotives and rolling stock; motor cycles; bicycles; invalid carriages and other transport equipment
248 283 248 770 249 258 0,1
Division 39 - Furniture, other manufacturing and recycling 57 772 59 522 61 272 1,5
Manufacture of furniture 11 976 13 602 15 229 6,1
Manufacture of jewellery and related articles 8 903 9 266 9 629 2,0
Manufacture of musical instruments, sports goods, games and toys 666 666 666 0,0
Manufacture of tobacco products and other manufacturing n.e.c. 21 685 22 342 22 998 1,5
Recycling of waste and scrap n.e.c. 13 646 13 646 13 646 0,0
Total 2 193 582 2 197 895 2 202 198 0,1
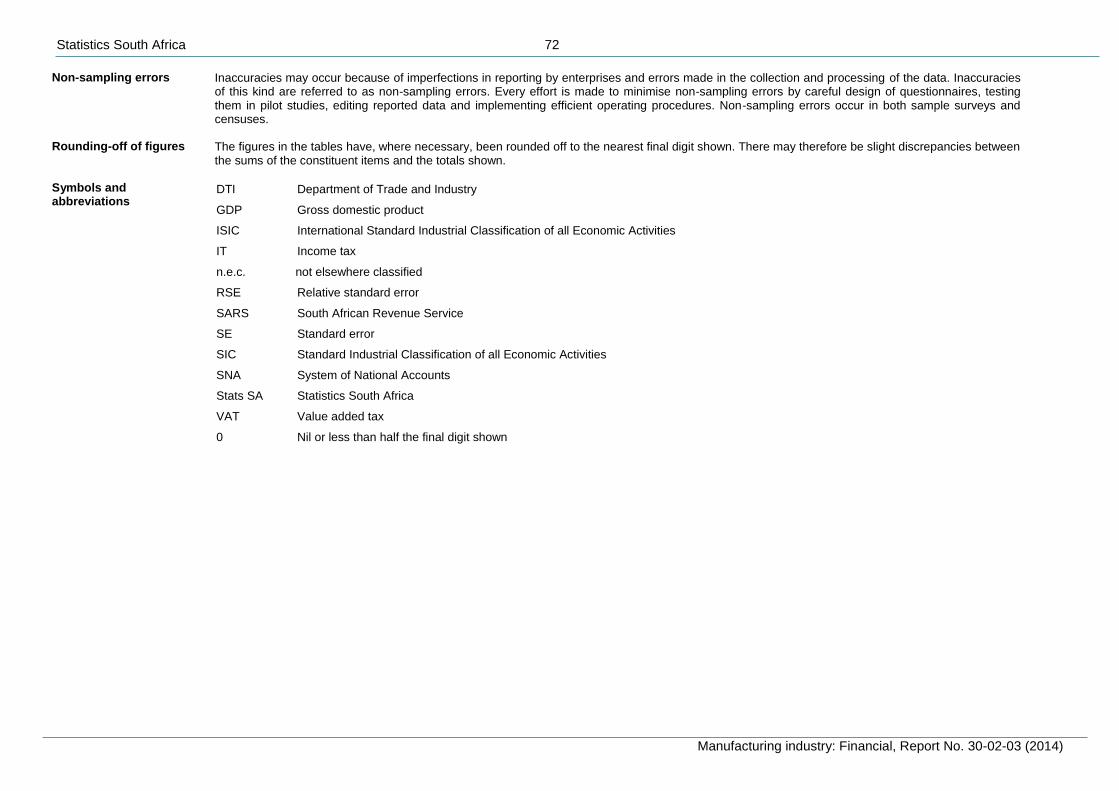
Statistics South Africa 72
Manufacturing industry: Financial, Report No. 30-02-03 (2014)
Non-sampling errors Inaccuracies may occur because of imperfections in reporting by enterprises and errors made in the collection and processing of the data. Inaccuracies of this kind are referred to as non-sampling errors. Every effort is made to minimise non-sampling errors by careful design of questionnaires, testing them in pilot studies, editing reported data and implementing efficient operating procedures. Non-sampling errors occur in both sample surveys and censuses.
Rounding-off of figures The figures in the tables have, where necessary, been rounded off to the nearest final digit shown. There may therefore be slight discrepancies between
the sums of the constituent items and the totals shown. Symbols and abbreviations
DTI Department of Trade and Industry
GDP Gross domestic product
ISIC International Standard Industrial Classification of all Economic Activities
IT Income tax
n.e.c. not elsewhere classified
RSE Relative standard error
SARS South African Revenue Service
SE Standard error
SIC Standard Industrial Classification of all Economic Activities
SNA System of National Accounts
Stats SA Statistics South Africa
VAT Value added tax
0 Nil or less than half the final digit shown
Statistics South Africa 73
Manufacturing industry: Financial, Report No. 30-02-03 (2014)
Glossary
Capital expenditure on new assets
Capital expenditure on new assets includes:
the erection of new buildings and works, and additions to and alterations of existing buildings and works;
work in progress capitalised;
new plant, machinery, equipment and vehicles;
new computers, network equipment and other information technology equipment;
intangible assets;
used plant and machinery which was imported by or on behalf of the enterprise, whether paid to outside contractors/concerns or which was done by the enterprise itself; and
other new assets not specified. and excludes:
acquisition of land;
existing buildings and works;
used plant and machinery and vehicles;
transfers-in of property, plant, equipment and intangible assets; and
other existing assets.
Collection rate
Collection rate = (Number of collected questionnaires + number of out-of-scope and inactive (zero contributing) enterprises)*100/sample size.
Concentration ratio The concentration ratio is the ratio of the income of the n largest enterprises to the total income.
Employees People employed by the business or organisation who received payment (salaries, wages, commission, piece rates or payments in kind) for the last pay period ended on or before 30 June 2014.
Enterprise A legal entity or a combination of legal units that includes and directly controls all functions necessary to carry out its production activities.
Exports Outward flow of goods and services leaving the economic territory of a country to the outside world.
Formal employment Employment by the formal sector. The formal sector includes all businesses that are registered for VAT.
Imports Inward flow of goods and services entering the economic territory of a country from the outside world.
Informal employment Employment by the informal sector. The formal sector includes all businesses that are not registered for VAT.
Statistics South Africa 74
Manufacturing industry: Financial, Report No. 30-02-03 (2014)
Industry An industry is made up of enterprises engaged in the same or similar kinds of economic activity. Industries are defined in the System of National Accounts (SNA) in the same way as in the Standard Industrial Classification of all Economic Activities, Fifth Edition, Report No. 09-90-02 of January 1993 (SIC).
Net profit or loss before tax Net profit or loss before tax is derived as: Total income plus closing inventories minus total expenditure minus opening inventories
Other expenditure
Other expenditure includes:
professional services, e.g. audit and other professional business services, legal expenses and data processing services;
donations and sponsorship;
amortisation; and
subscriptions.
Profit margin Profit margin is derived as: Net profit or loss after tax divided by turnover multiplied by 100
Salaries and wages Salaries and wages include:
salaries and/or fees paid to directors, executives and managers;
commissions paid;
employer's contribution to pension, provident, medical aid, sick pay and other funds;
payments made from South Africa to employees based abroad;
payments for all types of leave;
incentive payments for piecework or profit-sharing schemes;
fringe benefits paid in cash;
allowances and penalty payments;
value of any salary sacrificed; and
bonuses. Statistical unit
A unit about which statistics are tabulated, compiled or published. The statistical units are derived from and linked to the South African Revenue Service (SARS) administrative data.
Stratum A stratum is constructed by concatenating the SIC classification and size group variables.
Statistics South Africa 75
Manufacturing industry: Financial, Report No. 30-02-03 (2014)
Turnover Turnover includes:
the value of sales;
amounts received for work done;
amounts received for services rendered;
rent and/or lease payments received for land and buildings; and
rent, leasing and hiring received for machinery, vehicles and other equipment. Turnover excludes:
value added tax (VAT);
net profit or loss on sales or revaluation of fixed assets (including profit or loss on foreign exchange);
export freight charges;
interest received; and
excise duty.