manual on flood forecasting and warning
DESCRIPTION
Manual onFlood Forecasting and WarningTRANSCRIPT

WMO-No. 1072
For more information, please contact:
World Meteorological Organization
Communications and Public Affairs Office
Tel.: +41 (0) 22 730 83 14/15 – Fax: +41 (0) 22 730 80 27
E-mail: [email protected]
Hydrology and Water Resources Branch
Climate and Water Department
Tel.: +41 (0) 22 730 84 79 – Fax: +41 (0) 22 730 80 43
E-mail: [email protected]
7 bis, avenue de la Paix – P.O. Box 2300 – CH-1211 Geneva 2 – Switzerland
www.wmo.int MA
NU
AL
ON
fLO
OD
fO
ReCA
stiN
g A
ND
WA
RNiN
g MaNual ONFlOOD FORECaSTiNG aND WaRNiNG
P-Cl
W_1
0210
7
QUALityMANAgeMeNtfRAMeWORk


Manual onFlood Forecasting and Warning
WMO-No. 1072
2011 edition

WMO-No. 1072
© World Meteorological Organization, 2011
The right of publication in print, electronic and any other form and in any language is reserved by WMO. Short extracts from WMO publications may be reproduced without authorization, provided that the complete source is clearly indicated. Editorial correspondence and requests to publish, reproduce or translate this publication in part or in whole should be addressed to:
Chairperson, Publications BoardWorld Meteorological Organization (WMO)7 bis, avenue de la Paix Tel.: +41 (0) 22 730 84 03P.O. Box No. 2300 Fax: +41 (0) 22 730 80 40CH-1211 Geneva 2, Switzerland E-mail: [email protected]
ISBN 978-92-63-11072-5
NOTE
The designations employed in WMO publications and the presentation of material in this publication do not imply the expression of any opinion whatsoever on the part of the Secretariat of WMO concerning the legal status of any country, territory, city or area, or of its authorities, or concerning the delimitation of its frontiers or boundaries.
Opinions expressed in WMO publications are those of the authors and do not necessarily reflect those of WMO. The mention of specific companies or products does not imply that they are endorsed or recommended by WMO in preference to others of a similar nature which are not mentioned or advertised.

Page
FOREWORD ................................................................................................................................................. vii
PREFACE ....................................................................................................................................................... ix
SUMMARY (English, French, Russian and Spanish) .................................................................................... xi
CHAPTER 1. INTRODUCTION ...................................................................................................................... 1-1
1.1 Background ....................................................................................................................................... 1-11.2 Scope and contents of the Manual .................................................................................................... 1-21.3 Types and causes of floods ................................................................................................................ 1-4
1.3.1 Definitions ........................................................................................................................ 1-41.3.2 Types of floods ................................................................................................................. 1-41.3.3 Role of flood forecasting in flood management ................................................................. 1-5
1.4 Fundamental considerations of flood forecasting and warning systems ............................................. 1-61.4.1 Definition of flood forecasting and warning system .......................................................... 1-61.4.2 Meteorogical considerations ............................................................................................. 1-61.4.3 Hydrological considerations .............................................................................................. 1-71.4.4 Nature of risks and impacts .............................................................................................. 1-71.4.5 Dissemination of forecasts and warnings ........................................................................... 1-71.4.6 Institutional aspects .......................................................................................................... 1-81.4.7 Legal aspects .................................................................................................................... 1-9
CHAPTER 2. MAIN ASPECTS OF FLOOD FORECASTING SYSTEMS ............................................................. 2-1
2.1 Basic considerations .......................................................................................................................... 2-12.1.1 Types of catchment .......................................................................................................... 2-12.1.2 Physical processes ............................................................................................................. 2-12.1.3 Type of service .................................................................................................................. 2-32.1.4 Forecast lead time ............................................................................................................ 2-3
2.2 Data requirements ............................................................................................................................ 2-52.2.1 Overall technical requirements ......................................................................................... 2-52.2.2 Hydrological data ............................................................................................................. 2-52.2.3 Meteorological data.......................................................................................................... 2-52.2.4 Topographic data ............................................................................................................. 2-62.2.5 Other information and data .............................................................................................. 2-6
2.3 Infrastructure and human resources .................................................................................................. 2-62.3.1 Infrastructure .................................................................................................................... 2-62.3.2 Human resources .............................................................................................................. 2-7
2.3.2.1 Examples of team structures............................................................................ 2-82.3.2.2 Flood forecasting at a national level ................................................................ 2-82.3.2.3 General requirements for staffing a national flood warning service .................. 2-8
2.4 Establishing the concept of operations .............................................................................................. 2-8
CHAPTER 3. FLOOD FORECASTING METHODS AND MODELS ................................................................... 3-1
3.1 Introduction ...................................................................................................................................... 3-13.2 Precipitation-driven catchment models ............................................................................................. 3-3
3.2.1 Precipitation monitoring and forecasting .......................................................................... 3-33.2.1.1 Rainfall ............................................................................................................ 3-33.2.1.2 Snowmelt ....................................................................................................... 3-4
CONTENTS

Page
3.2.2 Event modelling and continuous simulation...................................................................... 3-43.2.3 Mode of operation of flow forecasting models in real time ............................................... 3-4
3.2.3.1 Models operating in non-updating mode ....................................................... 3-43.2.3.2 Models operating in updating mode ............................................................... 3-5
3.2.4 Types of rainfall–runoff simulation models ........................................................................ 3-63.2.5 Snowmelt–runoff models operating in simulation mode ................................................... 3-63.2.6 Models for forecast updating in real time .......................................................................... 3-63.2.7 The “multi-model” approach to rainfall–runoff modelling and forecasting ........................ 3-6
3.2.7.1 The case for multi-modelling ........................................................................... 3-63.2.7.2 Forms of multi-model systems ......................................................................... 3-73.2.7.3 Ensemble or probabilistic forecasts .................................................................. 3-7
3.2.8 Parameters in hydrological models ................................................................................... 3-83.3 Routing models ................................................................................................................................. 3-8
3.3.1 General ............................................................................................................................ 3-83.3.2 Hydrological routing ......................................................................................................... 3-93.3.3 Hydraulic routing .............................................................................................................. 3-9
3.4 Combined catchment and routing models ........................................................................................ 3-103.5 Special-case models .......................................................................................................................... 3-11
3.5.1 Storm surge ...................................................................................................................... 3-113.5.2 Flash floods ...................................................................................................................... 3-113.5.3 Urban flooding ................................................................................................................. 3-123.5.4 Reservoir flood control ...................................................................................................... 3-13
3.6 Model availability .............................................................................................................................. 3-13
CHAPTER 4. CHOICE OF APPROPRIATE METHODS OR MODELS FOR FLOOD FORECASTING ................... 4-1
4.1 Factors affecting the choice ............................................................................................................... 4-14.1.1 General ............................................................................................................................ 4-14.1.2 Choosing the appropriate model ...................................................................................... 4-14.1.3 Lumped versus distributed models .................................................................................... 4-2
4.2 Hydrological studies to support model development ......................................................................... 4-24.2.1 General ............................................................................................................................ 4-24.2.2 Understanding flood hydrology ........................................................................................ 4-34.2.3 Requirements for analytical flood studies .......................................................................... 4-54.2.4 Ongoing data requirements for modelling support ........................................................... 4-6
4.3 Model calibration and data requirements .......................................................................................... 4-74.3.1 Main objectives ................................................................................................................ 4-74.3.2 Calibration methods ......................................................................................................... 4-84.3.3 Basic steps in calibration ................................................................................................... 4-84.3.4 Data required ................................................................................................................... 4-104.3.5 General requirements ....................................................................................................... 4-10
4.4 Model verification ............................................................................................................................. 4-114.4.1 Numerical-model verification criteria ................................................................................ 4-114.4.2 Graphical-model verification criteria ................................................................................. 4-124.4.3 Forecast verification criteria .............................................................................................. 4-12
4.5 Sources of uncertainties in model forecasting .................................................................................... 4-134.5.1 Model errors ..................................................................................................................... 4-134.5.2 Model parameter errors .................................................................................................... 4-134.5.3 Boundary condition errors ................................................................................................ 4-134.5.4 Initial condition errors ....................................................................................................... 4-144.5.5 Observation errors ............................................................................................................ 4-144.5.6 Forecast input ................................................................................................................... 4-14
4.6 Data assimilation ............................................................................................................................... 4-144.6.1 Purpose ............................................................................................................................ 4-144.6.2 Available techniques ......................................................................................................... 4-14
iv MANUAL ON FLOOD FORECASTING AND WARNING

CONTENTS v
Page
4.7 Coupling meteorological forecasts to hydrological models ................................................................ 4-164.7.1 General considerations ..................................................................................................... 4-164.7.2 Global hydrological forecasts based on the global model .................................................. 4-164.7.3 Global hydrological forecasts based on mesoscale models and nowcasting ....................... 4-19
4.8 Predictive uncertainty in operation .................................................................................................... 4-19
CHAPTER 5. MONITORING NETWORKS ...................................................................................................... 5-1
5.1 Definition of data acquisition networks .............................................................................................. 5-15.2 Evaluating existing networks ............................................................................................................. 5-1
5.2.1 Meteorological networks .................................................................................................. 5-15.2.2 Raingauge networks ......................................................................................................... 5-25.2.3 River-gauging (hydrometric) networks .............................................................................. 5-25.2.4 The Bangladesh river flood warning network .................................................................... 5-2
5.3 Design requirements for hydrometeorological observation networks ................................................. 5-35.3.1 Identification of areas at risk ............................................................................................. 5-35.3.2 Selection of appropriate lead times ................................................................................... 5-65.3.3 Identification of geographical hydrological units ............................................................... 5-65.3.4 Background (antecedent) catchment monitoring and preparedness ................................. 5-75.3.5 Instrumentation and monitoring ....................................................................................... 5-85.3.6 Suitability of data structures .............................................................................................. 5-85.3.7 Software operating systems .............................................................................................. 5-9
5.4 Operation and maintenance of hydrological networks ....................................................................... 5-105.4.1 Field-monitoring equipment ............................................................................................. 5-105.4.2 Office equipment ............................................................................................................. 5-105.4.3 Operational licences and warranty .................................................................................... 5-105.4.4 Staff issues ........................................................................................................................ 5-115.4.5 Mobility and transport ...................................................................................................... 5-11
5.5 Hydrological data rescue ................................................................................................................... 5-115.5.1 Definition of data rescue ................................................................................................... 5-115.5.2 Problems of data archiving ............................................................................................... 5-125.5.3 Justification for hydrological data rescue ........................................................................... 5-125.5.4 WMO past initiatives ........................................................................................................ 5-125.5.5 Data rescue and digitization ............................................................................................. 5-135.5.6 Priorities for data rescue .................................................................................................... 5-14
CHAPTER 6. REAL-TIME DATA TRANSMISSION AND MANAGEMENT........................................................ 6-1
6.1 Data transmission .............................................................................................................................. 6-16.1.1 Basic requirements ........................................................................................................... 6-16.1.2 Choice of communication channels .................................................................................. 6-26.1.3 Interrogation methods and frequency............................................................................... 6-56.1.4 Reliability .......................................................................................................................... 6-8
6.2 Data preprocessing ........................................................................................................................... 6-106.2.1 General considerations ..................................................................................................... 6-106.2.2 Quality control ................................................................................................................. 6-116.2.3 Missing data infilling ......................................................................................................... 6-11
6.3 Development and management of data ............................................................................................ 6-126.3.1 Data management for flood forecasting and warning ....................................................... 6-126.3.2 Data archiving .................................................................................................................. 6-12
6.4 Data dissemination ............................................................................................................................ 6-13

MANUAL ON FLOOD FORECASTING AND WARNINGvi
Page
CHAPTER 7. POTENTIAL APPLICATIONS FROM DEVELOPING TECHNOLOGIES ........................................ 7-1
7.1 Introduction ...................................................................................................................................... 7-17.2 Remote-sensing ................................................................................................................................. 7-1
7.2.1 Radar ................................................................................................................................ 7-17.2.2 Satellite ............................................................................................................................ 7-1
7.3 Numerical weather prediction ........................................................................................................... 7-37.3.1 Large-scale fluvial flooding ................................................................................................ 7-37.3.2 Convective rainfall and small-scale fluvial events ............................................................... 7-3
7.4 Geographical Information Systems .................................................................................................... 7-37.5 Incorporating improvements in quantitative precipitation forecasts ................................................... 7-47.6 Assessment of forecasting uncertainty and hydrological ensemble prediction .................................... 7-77.7 Operational use of forecasting uncertainty to improve decision-making ............................................ 7-8
CHAPTER 8. STRUCTURE AND ORGANIZATION OF FLOOD WARNINGS ................................................... 8-1
8.1 Identification of end-users and their requirements ............................................................................. 8-18.2 Areal definition of warnings ............................................................................................................... 8-18.3 Lead time of meteorological and flood warnings ............................................................................... 8-2
8.3.1 General considerations ..................................................................................................... 8-28.3.2 Meteorological warning .................................................................................................... 8-28.3.3 Flood warning .................................................................................................................. 8-3
8.4 Selection of warning stages ............................................................................................................... 8-48.5 Presentation of warnings to users ...................................................................................................... 8-5
8.5.1 Flood warning symbols ..................................................................................................... 8-58.5.2 Examples of flood warning information outputs ................................................................ 8-6
8.5.2.1 United States .................................................................................................. 8-78.5.2.2 Australia .......................................................................................................... 8-88.5.2.3 United Kingdom ............................................................................................. 8-9
8.6 Warning information contribution to flood response ......................................................................... 8-108.7 Flood alert systems ............................................................................................................................ 8-11
8.7.1 Establishment of flood watch systems including communications ..................................... 8-118.7.2 Establishment of gauges for local flood warning purposes ................................................ 8-11
8.8 Warning and society .......................................................................................................................... 8-128.8.1 Basic considerations .......................................................................................................... 8-128.8.2 Media awareness .............................................................................................................. 8-128.8.3 Involvement of communities in data collection and local flood warning systems ............... 8-138.8.4 An example of an assessment of the need for a local flood warning system in the United States .......................................................................................................... 8-138.8.5 Flood warning effectiveness and human psychology ......................................................... 8-14
CHAPTER 9. TRAINING REQUIREMENTS ..................................................................................................... 9-1
9.1 Consideration of existing resources ................................................................................................... 9-19.2 Professional qualification ................................................................................................................... 9-19.3 Training and continuing education .................................................................................................... 9-29.4 Operational training of personnel in flood forecasting and warning services ...................................... 9-49.5 Establishing understanding of forecasts and warnings by users .......................................................... 9-6
ANNEX I. REFERENCES ................................................................................................................................. An-I-1
ANNEX II. ABBREVIATIONS .......................................................................................................................... An-II-1

FOREWORD
The area of flood forecasting and warning has tradi-tionally been one to which WMO has dedicated considerable effort. This tradition is being contin-ued with the publication of the Manual on Flood Forecasting and Warning.
Floods are without doubt among the most devastat-ing of natural disasters, striking numerous regions in the world each year. During the last decades the trend in flood damages has been growing exponen-tially. The development of hydrological forecasting and warning systems is therefore an essential element in regional and national strategies.
Sustainable economic and social development requires that flood forecasting and warning systems for communities at risk, be continuously devel-oped, which in turn demands an optimal combination of data, forecasting tools and well
trained specialists. A flood forecast system must provide sufficient lead time for communities to respond. I am confident that this Manual will serve as a useful guide to many WMO Members planning to establish such systems.
On behalf of WMO, I would like to express my gratitude to all the experts who have contributed to the preparation and the publication of this Manual and in particular to the members of the Advisory Working Group of the WMO Commission for Hydrology for their role in guiding its preparation.
(M. Jarraud)Secretary-General


As president of the Commission for Hydrology (CHy), I am pleased to report that the preparation of this Manual on Flood Forecasting and Warning was led at the beginning of its development, during the intersessional period between the twelfth and thir-teenth sessions of the Commission for Hydrology, by Professor Jian-yun Zhang (China). He chaired a group of members of the Open Panel of CHy Experts (OPACHE) on Flood Forecasting and Prediction composed of:– Zhiyu Liu (China);– Jean-Michel Tanguy (France);– Kieran M. O’Connor (Ireland), who was
responsible for compiling the first draft;– Ezio Todini (Italy);– James Dent (United Kingdom of Great Britain
and Northern Ireland);– Konstantine Georgakakos (United States of
America);– Curt Barrett (United States of America).
At its thirteenth session, the Commission requested the re-established OPACHE on Flood Forecasting and Prediction to finalize the Manual. The version that followed the Commission’s review process was
completed by James Dent, who also incorporated the comments of the two reviewers, namely:– Johannes Cullmann (Germany), who was
requested by the CHy Advisory Working Group in April 2010 to finalize the Manual;
– Marian Muste (United States of America).
This Manual is the third in the newly established CHy series of publications as decided by the Commission at its thirteenth session in early November 2008. The two manuals issued previ-ously are the Manual on Estimation of Probable Maximum Precipitation (PMP) (WMO-No. 1045) and the Manual on Stream Gauging (WMO-No. 1044). As is the case for these other manuals, CHy is planning demand-driven courses and for this purpose train-ing material to accompany the present Manual on Flood Forecasting and Warning is being prepared.
(Julius Wellens-Mensah)President of CHy
PREFACE


SUMMARY
The Manual on Flood Forecasting and Warning provides the basic knowledge and guidance to develop or to set up an appropriate and tailored system for any case in which a flood forecasting and warning system is required. The aim is to provide a succinct but comprehensive overview of the basic knowledge and information that the relevant personnel of the National Meteorological or Hydrometeorological Services or other flood management service should require. The Manual is based on the latest informa-tion developed in prominent research or consultancy operations around the world and is provided with extensive references and Internet links to guide the reader to further sources of information.
The Manual is divided into several chapters that, it is hoped, will benefit particular situations, either for the evolution and improvement of existing
arrangements, or for the establishment from a very basic or non-existent capacity. The Manual does not set out a step-by-step process for the design of a flood forecasting and warning system along the lines of a particular template or practice in any one country. Rather, presented in all chapters are a number of examples of different practices and tech-nologies, which may reflect different levels of development, ranges of needs and also capacities in a number of different situations.
The Manual describes the various components of a flood warning system, which are:– Design of a flood forecasting system;– Implementation and operation of a flood
forecasting system;– Flood warnings;– Training.
RÉSUMÉ
Le Manual on Flood Forecasting and Warning (Manuel de prévision et d’annonce des crues) présente les éléments de connaissance et d’orientation indis-pensables au développement ou à la création d’un système approprié et adapté, quel que soit le cas où un système de prévision et d’annonce de crues s’impose. Il propose un tour d’horizon, à la fois succinct et fouillé, des connaissances et des rensei-gnements dont pourrait avoir besoin le personnel compétent de Services météorologiques et hydrologiques nationaux ou d’autres services de gestion des crues. Il s’appuie sur les résultats d’importantes missions de recherche et de consulta-tion menées récemment partout dans le monde, et contient un grand nombre de références et de liens Internet qui permettent au lecteur d’avoir accès à des sources d’information supplémentaires.
Le Manuel comprend plusieurs chapitres dont le contenu, on l’espère, se révélera utile dans diverses situations particulières, que ce soit pour améliorer
et faire évoluer des configurations existantes, ou pour créer un système à partir de moyens sommaires voire inexistants. Il ne s’agit pas de décrire les étapes de la conception d’un système de prévision et d’annonce de crues sur le modèle ou les pratiques en application dans un pays en particulier. On trouve plutôt dans tous les chapitres des exemples de pratiques et de techniques différentes correspondant à divers niveaux d’avancement et divers éventails de besoins ou de capacités, dans plusieurs situations différentes.
Le Manuel décrit les différentes composantes d’un système permettant d’établir des annonces de crues, à savoir:– La conception d’un système de prévision des
crues;– La mise en œuvre et l’exploitation d’un système
de prévision des crues;– Les messages d’avis de crues;– La formation.

MANUAL ON FLOOD FORECASTING AND WARNING
РЕЗЮМЕ
В Наставлении по прогнозированию паводков и предупреждениям о них содержатся базовые знания и руководство для разработки или создания надлежащей специализированной системы в тех случаях, когда существует потребность в системе прогнозирования паводков и предупреждений о них. Цель при этом заключается в предоставлении краткого, но всеобъемлющего обзора базовых знаний и информации, которые могут потребоваться соответствующему персоналу национальных метеорологических или гидрометеорологичес-ких служб или других служб, занимающихся вопросами, связанными с управлением паводками. Наставление основано на самой последней информации, полученной в резуль-тате крупных исследований или проведения консультаций во всем мире; в нем также приведено большое количество ссылок на источники и Интернет-ресурсы, которые помогут читателю получить дальнейшую информацию.
Наставление разделено на несколько глав, которые, можно надеяться, будут полезны в
xii
конкретных ситуациях либо при развитии и совершенствовании существующих организаци-онных схем, либо при их разработке, исполь- зуя базовый потенциал или начиная практически с нуля. В Наставлении не приводится пошаговый процесс создания системы прогнозирования паводков и предупреждений о них и не даются конкретные образцы или способы практического осуществления соответствующей деятельности в какой-либо стране. Напротив, во всех главах представлен ряд примеров всевозможных видов практики и технологий, которые могут отражать различные уровни развития, диапазон потребностей, а также возможности в ряде разнообразных ситуаций.
В Наставлении описаны различные компоненты системы предупреждений о паводках:– проектирование системы прогнозирования
паводков;– внедрение и эксплуатация системы прог-
нозирования паводков;– предупреждения о паводках;– подготовка кадров.
RESUMEN
El Manual on Flood Forecasting and Warning (Manual sobre predicción y aviso de crecidas) ofrece los conocimientos básicos y la orientación necesaria para elaborar o incluso implantar un sistema que se adecue y adapte a aquellas situaciones en las que se requiera un sistema de predicción y aviso de crecidas. Su objetivo consiste en presentar una visión sucinta pero completa de los conocimientos básicos y la información que necesite el personal competente de los Servicios Meteorológicos e Hidrológicos Nacionales u otro servicio de gestión de crecidas. El Manual se basa en la información más reciente obtenida en importantes actividades de investigación y asesoría de todo el mundo e incluye numerosas referencias y enlaces de Internet que permiten al lector acceder a otras fuentes de consulta.
El Manual se compone de varios capítulos cuyo contenido, es de esperar, será de gran utilidad en
situaciones concretas, bien para desarrollar y mejorar los estructuras ya existentes, bien para establecerlas a partir de una capacidad muy básica o inexistente. En el Manual no se describe paso a paso la forma de diseñar un sistema de predicción y aviso de crecidas siguiendo un modelo o las prácticas utilizadas en un país en concreto. Más bien, en todos los capítulos se ilustran ejemplos de diferentes prácticas y tecnologías, que pueden reflejar diferentes niveles de desarrollo, tipos de necesidades y también capacidades en diversas situaciones.
En el Manual se describen los diversos componen-tes de un sistema de aviso de crecidas, a saber:– el diseño de un sistema de predicción de crecidas;– el funcionamiento y explotación de un sistema
de predicción de crecidas;– los avisos de crecidas;– la formación professional.
1.1 BACKGROUND
The twelfth session of the Commission for Hydrology, held in Geneva in October 2004, established flood forecasting and prediction as one of the thematic panel areas. Within this area the preparation of a manual on flood forecasting and warning was considered to be the most important activity. The thirteenth session of the Commission, held in Geneva in November 2008, requested the same re-established panel to complete the Manual.
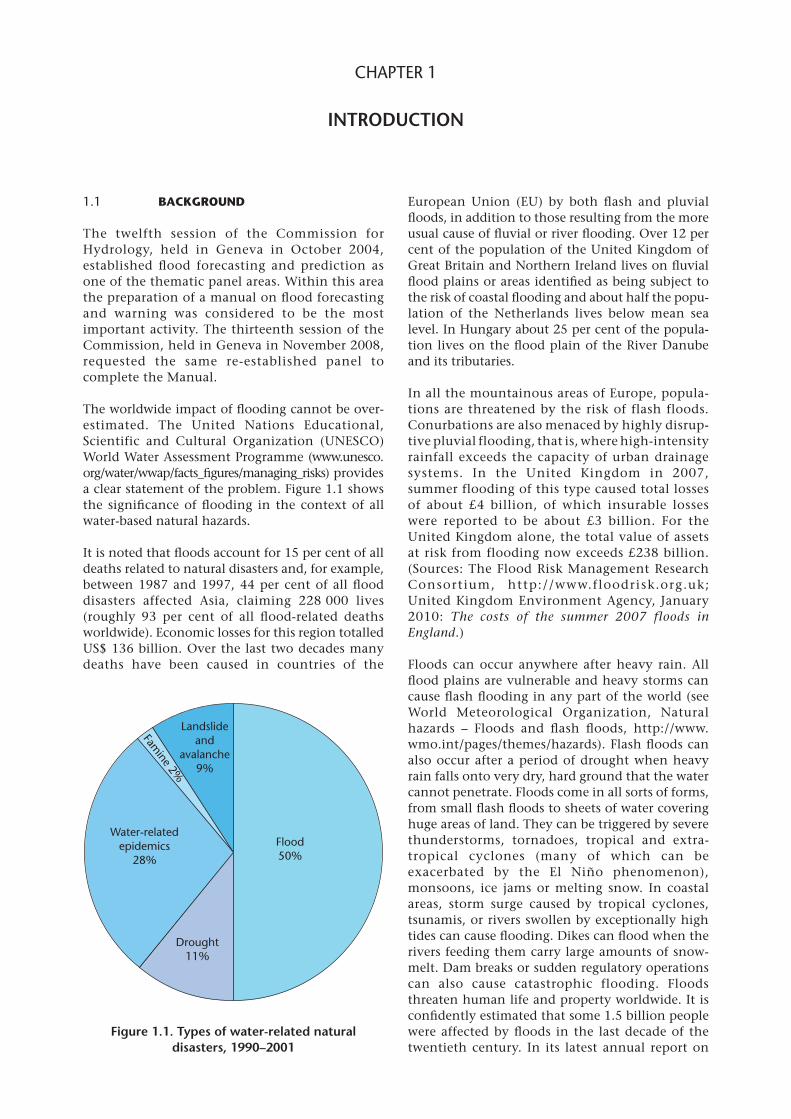
The worldwide impact of flooding cannot be over-estimated. The United Nations Educational, Scientific and Cultural Organization (UNESCO) World Water Assessment Programme (www.unesco.org/water/wwap/facts_figures/managing_risks) provides a clear statement of the problem. Figure 1.1 shows the significance of flooding in the context of all water-based natural hazards.
It is noted that floods account for 15 per cent of all deaths related to natural disasters and, for example, between 1987 and 1997, 44 per cent of all flood disasters affected Asia, claiming 228 000 lives (roughly 93 per cent of all flood-related deaths worldwide). Economic losses for this region totalled US$ 136 billion. Over the last two decades many deaths have been caused in countries of the
European Union (EU) by both flash and pluvial floods, in addition to those resulting from the more usual cause of fluvial or river flooding. Over 12 per cent of the population of the United Kingdom of Great Britain and Northern Ireland lives on fluvial flood plains or areas identified as being subject to the risk of coastal flooding and about half the popu-lation of the Netherlands lives below mean sea level. In Hungary about 25 per cent of the popula-tion lives on the flood plain of the River Danube and its tributaries.
In all the mountainous areas of Europe, popula-tions are threatened by the risk of flash floods. Conurbations are also menaced by highly disrup-tive pluvial flooding, that is, where high-intensity rainfall exceeds the capacity of urban drainage systems. In the United Kingdom in 2007, summer flooding of this type caused total losses of about £4 billion, of which insurable losses were reported to be about £3 billion. For the United Kingdom alone, the total value of assets at risk from flooding now exceeds £238 billion. (Sources: The Flood Risk Management Research Consortium, http://www.floodrisk.org.uk; United Kingdom Environment Agency, January 2010: The costs of the summer 2007 floods in England.)
Floods can occur anywhere after heavy rain. All flood plains are vulnerable and heavy storms can cause flash flooding in any part of the world (see World Meteorological Organization, Natural hazards – Floods and flash floods, http://www.wmo.int/pages/themes/hazards). Flash floods can also occur after a period of drought when heavy rain falls onto very dry, hard ground that the water cannot penetrate. Floods come in all sorts of forms, from small flash floods to sheets of water covering huge areas of land. They can be triggered by severe thunderstorms, tornadoes, tropical and extra- tropical cyclones (many of which can be exacerbated by the El Niño phenomenon), monsoons, ice jams or melting snow. In coastal areas, storm surge caused by tropical cyclones, tsunamis, or rivers swollen by exceptionally high tides can cause flooding. Dikes can flood when the rivers feeding them carry large amounts of snow-melt. Dam breaks or sudden regulatory operations can also cause catastrophic flooding. Floods threaten human life and property worldwide. It is confidently estimated that some 1.5 billion people were affected by floods in the last decade of the twentieth century. In its latest annual report on
CHAPTER 1
INTRODUCTION
Figure 1.1. Types of water-related natural disasters, 1990–2001
Flood50%
Drought11%
Famine 2%
Landslideand
avalanche9%
Water-relatedepidemics
28%

MANUAL ON FLOOD FORECASTING AND WARNING1-2
flooding, the Bangladesh Water Development Board (Annual Flood Report, 2009) estimated the cost of flood damages at around US$ 750 million in the water sector alone. Although the accumulated flooded area was 19.4 per cent of the whole coun-try, which was lower than average, the vulnerability of economic activities and assets has greatly increased in recent years.
It is the exponentially increasing impact of flood-ing that has raised the profile of the practice of flood forecasting and warning. Since the late 1980s there has been a move away from the primacy of major structural interventions for flood control towards a more integrated approach, of which flood forecasting and warning is a component. The Integrated Flood Management Concept (World Meteorological Organization–Global Water Partnership: Associated Programme on Flood Management, http://www.apfm.info) encourages a shift from the traditional, frag-mented and localized approach, towards the use of the resources of a river basin as a whole, employing strategies to maintain or augment the productivity of flood plains, while at the same time providing protective measures against losses due to flooding.
Flooding is a chronic natural hazard with poten-tially devastating consequences, giving rise to a third of all losses due to natural events. Extreme weather events over the last decade have fuelled the perception that, whether due to anthropo-genic global warming or otherwise, flooding is becoming more extreme, more widespread and more frequent. As the risks and the costs of such natural disasters are likely to increase due to global social and environmental changes, there is widespread debate among stakeholders and activ-ists “on issues of responsibility and liability, as well as on the appropriate measures for mitigat-ing losses and providing relief to victims” (Linnerooth-Bayer and Amendola, 2003). Such prospective developments have given rise to increased emphasis on the improvement of oper-ational flood forecasting and the enhancement and refinement of flood-risk management systems (Arduino et al., 2005).
The control and harnessing of floods is often beyond effective human intervention and “complete protection from flooding is rarely a viable goal” (Moore et al., 2005). Different inputs (mainly precipitation) and physical factors (such as catchment descriptors) and their combinations act as driving forces to produce high flows in natural surface water channels giving rise, in the more extreme cases, to flooding due to failure of the channel network or river reach to accommodate such flows.
The purpose of a national flood forecasting and warning system is to provide as much advance notice as possible of an impending flood to the authorities and the general public. Over time, the demands for flood forecasts evolve from a general indication of the likelihood of flooding, for exam-ple on major rivers, to a more definitive prediction of magnitude and timing at key locations. The main components of a national flood forecasting and warning system are the following:(a) Collection of real-time data for the prediction
of flood severity, including time of onset and extent and magnitude of flooding;
(b) Preparation of forecast information and warn-ing messages, giving clear statements on what is happening, forecasts of what may happen and expected impact;
(c) Communication and dissemination of such messages, which can also include what action should be taken;
(d) Interpretation of the forecast and flood obser-vations, in order to provide situation updates to determine possible impacts on communities and infrastructure;
(e) Response to the warnings by the agencies and communities involved;
(f) Review of the warning system and improvements to the system after flood events.
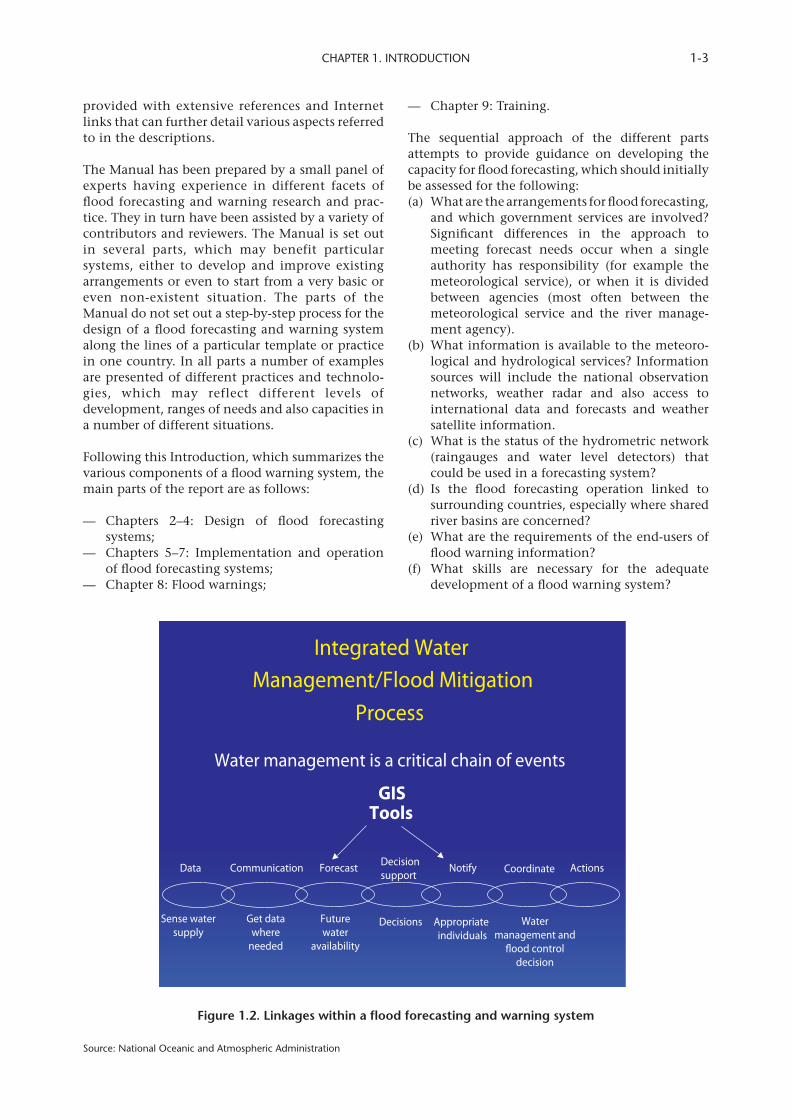
The linkages between the above elements and the application of Geographical Information Systems (GIS) tools are illustrated in Figure 1.2.
Flood forecasting requires an understanding of both meteorological and hydrological behaviour for the particular conditions of the country in question. Ultimate responsibility lies with the appropriate government agencies at a national level, but information and operational activities need to be made available at more localized levels, for example a river basin or a centre of population.
1.2 SCOPEANDCONTENTSOFTHEMANUAL
This Manual provides the basic knowledge and guidance to develop or even set up an appropriate and tailored system suitable for any case where flood forecasting and warning is to be developed. The aim is to provide a succinct but comprehen-sive overview of the basic knowledge and information that the relevant personnel of the national meteorological or hydrometeorological services or other flood management service should require. The Manual is built on the latest informa-tion developed in prominent research or consultancy operations around the world and is
CHAPTER 1. INTRODUCTION 1-3
provided with extensive references and Internet links that can further detail various aspects referred to in the descriptions.
The Manual has been prepared by a small panel of experts having experience in different facets of flood forecasting and warning research and prac-tice. They in turn have been assisted by a variety of contributors and reviewers. The Manual is set out in several parts, which may benefit particular systems, either to develop and improve existing arrangements or even to start from a very basic or even non-existent situation. The parts of the Manual do not set out a step-by-step process for the design of a flood forecasting and warning system along the lines of a particular template or practice in one country. In all parts a number of examples are presented of different practices and technolo-gies, which may reflect different levels of development, ranges of needs and also capacities in a number of different situations.
Following this Introduction, which summarizes the various components of a flood warning system, the main parts of the report are as follows:
— Chapters 2–4: Design of flood forecasting systems;
— Chapters 5–7: Implementation and operation of flood forecasting systems;
— Chapter 8: Flood warnings;
— Chapter 9: Training.
The sequential approach of the different parts attempts to provide guidance on developing the capacity for flood forecasting, which should initially be assessed for the following:(a) What are the arrangements for flood forecasting,
and which government services are involved? Significant differences in the approach to meeting forecast needs occur when a single authority has responsibility (for example the meteorological service), or when it is divided between agencies (most often between the meteorological service and the river manage-ment agency).
(b) What information is available to the meteoro-logical and hydrological services? Information sources will include the national observation networks, weather radar and also access to international data and forecasts and weather satellite information.
(c) What is the status of the hydrometric network (raingauges and water level detectors) that could be used in a forecasting system?
(d) Is the flood forecasting operation linked to surrounding countries, especially where shared river basins are concerned?
(e) What are the requirements of the end-users of flood warning information?
(f) What skills are necessary for the adequate development of a flood warning system?
Figure 1.2. Linkages within a flood forecasting and warning system
Source: National Oceanic and Atmospheric Administration
Integrated WaterManagement/Flood Mitigation
Process
Water management is a critical chain of events
GISTools
/
Data
Sense watersupply
Get datawhere
needed
Futurewater
availability
Decisions Appropriate individuals
Watermanagement and
�ood controldecision
Communication Forecast Decisionsupport
Notify Coordinate Actions

MANUAL ON FLOOD FORECASTING AND WARNING1-4
1.3 TYPESANDCAUSESOFFLOODS
1.3.1 Definitions
There are numerous definitions from a range of sources, national and international. For consist-ency, it is recommended that one use the World Meteorological Organization (WMO)/UNESCO International Glossary of Hydrology (WMO-No. 385, 1992), in which terms are defined in several languages.
The Glossary defines “flood” as follows:(1) Rise, usually brief, in the water level in a stream
to a peak from which the water level recedes at a slower rate.
(2) Relatively high flow as measured by stage height or discharge.
(3) Rising tide.
“Flooding”, signifying the effects of a flood as distinct from the flood itself, is defined as: Overflowing by water of the normal confines of
a stream or other body of water, or accumula-tion of water by drainage over areas that are not normally submerged.
The Glossary gives definitions of a comprehensive range of terms used in relation to floods and flooding and it is not necessary to catalogue them in this Manual. By way of introduction, the main features of different types of flooding are summarized below.
1.3.2 Typesoffloods
Flash floods
These floods are frequently associated with violent convection storms of a short duration falling over a small area. Flash flooding can occur in almost any area where there are steep slopes, but is most common in mountain districts subject to frequent severe thunderstorms. Flash floods are often the result of heavy rains of short duration. This partic-ular type of flooding commonly washes away houses, roads and bridges over small streams and so has a critical impact on communities and trans-port in these often remote areas. Flash flooding can also occur in localized areas when ground has been baked hard by a long, dry period.
Fluvial (riverine) floods
Fluvial flooding is the main focus of this Manual and occurs over a wide range of river and catch-ment systems. Floods in river valleys occur mostly on flood plains or wash lands as a result of flow exceeding the capacity of the stream channels and spilling over the natural banks or artificial
embankments. Flash floods are often more damaging, occurring in narrow, steep and confined valleys, characterized as the name implies by the rapidity of formation following rainfall and high flow velocities. The rapidity makes them particularly dangerous to human life.
Single event floods
This is the most common type of flooding, in which widespread heavy rains lasting several hours to a few days over a drainage basin results in severe floods. Typically, these heavy rains are associated with cyclonic disturbances, mid-latitude depres-sions and storms, with well-marked synoptic scale frontal systems.
Multiple event floods
These result from heavy rainfall associated with successive weather disturbances following closely after each other. On the largest scale, these include for example floods in the Indo-Gangetic plains and central Indian regions often caused by the passage of a series of low-pressure areas or depressions from the Bay of Bengal, more or less along the same path. Multiple event floods can also affect large basins in mid-latitude areas in winter, when sequences of active depressions occur, for example over western Europe.
Seasonal floods
These are floods that occur with general regularity as a result of major seasonal rainfall activity. The areas of the world subject to a monsoonal type climate are typically the areas most affected and critical situations arise when “normal” flooding is replaced by extended or high-runoff floods. Flooding is frequently a basin-wide situation that can last for periods of several weeks. Within active monsoon conditions, a number of individual peak events can occur during a flood season. Seasonal floods can also result from high water levels in lakes in the upper reaches of a river basin, for example Lake Victoria and the River Nile. Another type of seasonal flood can result from wet conditions in an upper portion of a catchment, which experiences a different climate regime from the lower, affected areas. The Nile and Yangtze rivers are good examples.
Coastal floods
Storm surges and high winds coinciding with high tides are the most frequent cause of this type of flooding. The surge itself is the result of the raising of sea levels due to low atmospheric pressure. In particular configurations, such as major estuaries or

CHAPTER 1. INTRODUCTION 1-5
confined sea areas, the piling up of water is ampli-fied by a combination of the shallowing of the seabed and retarding of return flow. Major deltas such as the Mississippi and Ganges are prone to this type of flooding when affected by hurricanes (cyclones). Another sensitive area is the southern North Sea in western Europe as a result of particular tracks of winter depressions. If the surge takes place near the mouth of a river issuing into the sea, the river flow will be obstructed due to the surge, result-ing in severe flooding over and near the coastal areas. Tsunamis resulting from sub-seabed earth-quakes are a very specific cause of occasionally severe coastal flooding.
Estuarine floods
Estuaries are inlet areas of the coastline where the coastal tide meets a concentrated seaward flow of fresh water in a river. The interaction between the seaward flow of river water and landward flow of saline water during high tides may cause a build-up of water or inland-moving tidal bore. Frequently, the funnel shape characteristic of many estuaries causes an increase in high water levels in the upper, narrowing reaches of the associated river. These types of floods are mostly experienced in deltaic areas of rivers along the coasts, for example the Mouths of the Ganges. They are more frequent and less severe in terms of inundated depth and area than flooding caused by storm surges.
Urban floods
Urban flooding occurs when intense rainfall within towns and cities creates rapid runoff from paved and built-up areas, exceeding the capacity of storm drainage systems. In low-lying areas within cities, formation of ponds from runoff occurs not only because of high rainfall rates but also due to drain-age obstructions caused by debris blocking drainage culverts and outlets, often because of lack of main-tenance. A number of major cities situated in delta areas, for example New Orleans, Dhaka and Bangkok, are protected by embankments and pumped drainage systems. When rainfall rates exceed pumping capacity, rapid accumulation of storm runoff results in extensive flooding.
Snowmelt floods
In upland and high-latitude areas where extensive snow accumulates over winter, the spring thaw produces meltwater runoff. If temperature rises are rapid, the rate of melting may produce floods, which can extend to lower parts of river systems. The severity of meltwater floods will increase if the thaw is accompanied by heavy rainfall and can be further exacerbated if the subsoil remains frozen. Although a seasonal occurrence where major
snowfields exist in headwaters, which may produce beneficial flooding in downstream areas, severe effects can occur on smaller scales, especially in areas subject to changes between cold and warmer rainy winter weather.
Ice- and debris-jam floods
In areas that experience seasonal melting, if this is rapid ice floes can accumulate in rivers, forming constrictions and damming flows, causing river levels to rise upstream of the ice jam. A sudden release of the “ice jam” can cause a flood wave similar to that caused by a dam break to move downstream. Both meltwater and heavy rainfall in steep areas can cause landslips and debris flows. As these move downstream, major constrictions can build up. When these collapse or are breached, severe flooding can result. Both of these phenom-ena are very difficult to predict.
1.3.3 Roleoffloodforecastinginfloodmanagement
Flood forecasting is a necessary part of flood management, given that no preventative or defence measures can be completely effective. The reality of economic limits to the provision of defences, together with the possibility that the capacity of defence systems may be exceeded or that they may fail, require that other measures are in place. Provision of flood forecasting will also form part of flood management planning and development strategies, which recognize that there are occupied flood plain areas where non-structural measures can be effective. This can include the use of tempo-rary defences (flood gates or demountable barriers), domestic protection (sandbagging) and local evacuation (to flood shelters).
Flood management requires a variable degree of response from the water management agency, local or municipal authorities, transport and communi-cations operations and emergency services. Flood forecasting has to provide information to these users both for preparation and response: at the most extreme level, flood forecasting is part of the wider disaster management capacity, which devolves from the highest level of government.
The precise role of flood forecasting will vary according to the circumstances dictated by both the hydrometeorological environment and the built environment. Cities present different problems from rural areas: the location of flood-risk areas in relation to rivers, coasts or mountain ranges has a significant bearing on the types of flood forecasting involved, as indicated in 1.3.2. The nature of flood-ing events is also important, particularly whether floods are regular in occurrence, as in a highly

MANUAL ON FLOOD FORECASTING AND WARNING1-6
predictable seasonal climate, such as monsoon or hurricane seasons, or irregular, such as violent thunderstorms. There is thus no set design for a flood forecasting system, and the balance between particular components, for example meteorological and hydrological forecasts, scale and timing, have to be adapted to circumstances. Within a given country a number of different flood types may be encountered and each will require a different forecasting approach. Thus headwater areas may require a system concentrating on flash floods, whereas flood plain areas may need a system to be focused on the slow build-up of flooding and inundation.
1.4 FUNDAMENTALCONSIDERATIONSOFFLOODFORECASTINGANDWARNINGSYSTEMS
1.4.1 Definitionoffloodforecastingandwarningsystem
To form an effective real-time flood forecasting system, the basic structures need to be linked in an organized manner. This essentially requires:(a) Provision of specific forecasts relating to rainfall
for both quantity and timing, for which numer-ical weather-prediction models are necessary;
(b) Establishment of a network of manual or auto-matic hydrometric stations, linked to a central control by some form of telemetry;
(c) Flood forecasting model software, linked to the observing network and operating in real time.
Flood warnings are distinct from forecasts, as they are issued when an event is occurring, or is immi-nent. Flood warnings must be issued to a range of users, for various purposes. These purposes include:(a) To bring operational teams and emergency
personnel to a state of readiness;(b) To warn the public of the timing and location
of the event;(c) To warn as to the likely impacts on, for example,
roads, dwellings and flood defence structures;(d) To give individuals and organizations time to
take preparatory action;(e) In extreme cases, to give warning to prepare for
evacuation and emergency procedures.
Early warning of a flood may save lives, livestock and property and will invariably contribute to less-ening of the overall impact. Flood warnings need to be understood quickly and clearly and so consider-able attention has to be given to how technical information is conveyed to non-specialists from organizations, the public, the media and in some cases illiterate population groups.
There are a number of features common to all flood forecasting and warning systems, which are related to causes, impacts and risks. The following main and subsidiary characteristics require full consideration.
1.4.2 Meteorologicalconsiderations
Meteorological phenomena are the prime natural causes of flooding, either as rainfall or snow and snowmelt. Clearly the ability to forecast critical events, in both time and space and also quantita-tively, is of significant value in flood forecasting and warning. Meteorological knowledge associated with flood warning issues fall into two broad areas, namely the climatology behind flooding and the operational meteorology involved. The National Meteorological Service would be expected to be the best equipped to provide both, perhaps with the assistance of appropriate research organizations.
Climatology includes the understanding of rain-bearing systems, their seasonality and the extremes of their behaviour. Understanding the types of weather systems from which flooding can originate will contribute largely to decisions about what sort of observational and forecast systems may be required. Thus in an arid zone, where flash floods are predominant, the observation and forecasting facilities must be geared towards rapid recognition of an event. The most effective means for this would be by satellite or radar, while broad scale, synoptic forecasting would be of limited value.
Understanding the seasonality of rain-bearing systems is very important operationally, as this will have a bearing on staff assignments and the organi-zation of alert and background working patterns. For areas in which the rainy season is well defined, for example Monsoon Asia, tropical Africa and Central America, attention needs to be paid to ensuring sufficient staff cover to allow both regular situation updates and round-the-clock monitoring of severe conditions. In temperate and continental areas however, flood events are more random in their occurrence, so flexibility within organizations is required, so that staff can undertake flood warn-ing duties as necessary, though their routine tasks may be wider.
Hydrometeorological statistics (primarily rainfall, but also evaporation) are vital to flood forecasting and warning operations and they are usually dealt with separately from climatology data. The purpose of the data and statistics is to estimate the severity and probability of actual or predicted events and to place them in context. Long-term records are essen-tial and this requires investment to install and maintain raingauge networks (plus evaporation and/or climatological stations), to assure staff and

CHAPTER 1. INTRODUCTION 1-7
facilities to process and analyse records and to maintain a flexible and accessible database.
Hydrometeorological data are also vitally required in real time for the provision of flood forecasts and warnings. It is important that a representative proportion of the raingauge network is linked to the forecasting and warning control centre by telemetry. This has a three-fold aim:(a) To allow staff to monitor the situation in
general terms;(b) To give warnings against indicator or trig-
ger levels for rainfall intensity and–or accumulations;
(c) To provide inputs into forecast models, particu-larly for rainfall–runoff models.
1.4.3 Hydrologicalconsiderations
The requirements concerning hydrological infor-mation for a flood forecasting and warning system are similar to those for meteorology, in that it is necessary to have an understanding of the overall flood characteristics of the area as well as having real-time information for operational purposes. Key observation and data requirements are for water levels in lakes and rivers, river discharge and in some cases groundwater levels. The observation stations have a dual role in providing data for long-term statistics and through telemetry to provide data to a control centre. Water level ranges at given points can be linked to various extents of flooding, so a series of triggers can be set up to provide warn-ing through telemetry. The upstream-downstream relationship between water levels is an important means of prediction. Early flood warning systems depended on knowledge of the comparative levels from a point upstream to resulting levels at a point of interest at the flood-risk site and the time taken from a peak at an upstream point to reach a lower one. These were presented as tables or graphs of level-to-level correlations and time of travel. Developments in real-time flood modelling now provide the facility to provide more comprehensive information on predictions of levels, timing and extent of flooding.
1.4.4 Natureofrisksandimpacts
Risk may be defined as the probability of harmful consequences or expected human injury, environ-mental damage, loss of life, property and livelihood, resulting from interactions between natural or human hazards and vulnerable condi-tions. Flood risks are related to hydrological uncertainties, which are inextricably linked to social, economic and political uncertainties. In fact, in characterizing future flood risk, the biggest and most unpredictable changes are expected to result from population growth and economic
activity. This can be demonstrated by the histori-cal development of coping with flooding, where the initial resilience of a largely rural population is lost by more complex societies. Flood-risk manage-ment consists of systematic actions in a cycle of preparedness, response and recovery and should form a part of Integrated Water Resources Management (IWRM). Risk management calls for the identification, assessment, and minimization of risk, or the elimination of unacceptable risks through appropriate policies and practices.
Flood warning activities are largely designed to deal with certain design limits of flooding, for example within a range of probabilities, and moni-toring, modelling and operational systems can be set up in relation to known risks and impacts. In particular, these will focus on areas of population, key communications and infrastructure and the need to operate effective responses to flood. The magnitude of flood events and hence impacts are variable, so flood forecasting and warning has to operate over a range of event magnitudes. These vary from localized, low-impact flooding, which can be countered by relatively simple measures, such as installing temporary defences, closing flood gates and barriers, to larger scale flooding, where property damage and losses occur, road and rail closures arise and evacuation of areas at risk takes place. Defence and remedial measures are designed or planned to operate up to a particular severity of flooding, which may be designated as having a particular probability. The measures are related to an economic decision relating costs against losses. Typical design criteria are 100 years (an event that is considered to have a 1 per cent chance of occurring in any given year) for urban areas with key infrastructure, 50 years (2 per cent) for lesser population centres and transport facili-ties, 20 years (5 per cent) for rural areas and minor protection structures.
Beyond the limits of designed flood management and particularly for catastrophic events, for example dam or embankment failure, some aspects of flood forecasting and warning provisions may not be fully effective. However, it is important that in these cases monitoring facilities are sufficiently robust, as some continuing observations will be of vital assistance to emergency response and relief activities. In this respect, resilience of monitoring instruments, their structure and telemetry, are of considerable impor-tance, especially as on-the-ground reporting may have become impossible.
1.4.5 Disseminationofforecastsandwarnings
The effective dissemination of forecasts and warn-ings is very important. A balance has to be struck

MANUAL ON FLOOD FORECASTING AND WARNING1-8
between information to the public and information to other bodies involved with flood management. Historically, this has resulted in a dichotomy for flood warning services, which have to partition support resources between the community and government. The subject has been the focus of severe criticism in the light of past failures at service delivery. Thus, the language used and the type of information passed on has to be carefully consid-ered and structured. There has been a gradual evolution away from confining flood forecasting and warning information to authorities, that is, government, to a more direct involvement of the public. This has been helped by the growth in tele-communications, the computer, the IT revolution and increased ownership and coverage of media, such as radio and television. It is important, however, to maintain a broad spectrum for dissemi-nation and not to be seduced by high-tech approaches. Even in technically advanced societies it is doubtful whether Internet communication of flood warning information can be entirely effective. The elderly and poor members of the community may not have the necessary facilities at home and it may also be doubtful whether people will consult Websites when a dangerous situation is in place. It must also be remembered that these systems are dependent on telecommunications and power links that are themselves at risk of failure during flood events.
As a counter to over-sophistication and reliance on high-tech methods some alternative facilities need to be provided. In the past, in most parts of the world, emergency services (police, fire service, civil defence) have been closely involved in flood relief activities. Their role may change with chang-ing technology but they still need to be involved in communicating flood warnings and rescue. Other general warning systems, such as flood wardens and alarm sirens should not be aban-doned without careful consideration of the consequences.
1.4.6 Institutionalaspects
A flood forecasting and warning system needs to have clearly defined roles and responsibilities. These are wide ranging, covering, inter alia, data collection, formulation and dissemination, uncer-tainty of outputs and any legal or liability requirements. Whatever the functional and opera-tional responsibilities of the separate agencies involved in flood forecasting and warning, there is a fundamental responsibility through central government for public safety and emergency management. There may not be, however, a general statutory duty of the government to protect land or property against flooding, but government recog-nizes the need for action to be taken to safeguard
the wider social and economic well-being of the country. Operating authorities may have permis-sive powers but not a statutory duty to carry out or maintain flood defence works in the public interest. However, such responsibilities may be incorporated through legislation within acts and regulations under which different government departments operate. When legislation is set up or amended, it is therefore extremely important that interfaces between the duties and obligations of affected departments are carefully considered before statu-tory instruments are introduced.
The institutional structure and responsibility may become complicated for the following reasons. Several ministries may carry separate responsibili-ties for activities related to flood forecasting and warning. Furthermore, within implementing organizations, flood forecasting and warning duties may represent only a fraction of their overall responsibilities. The following examples illustrate the possible complexities that arise.
United Kingdom: Weather forecasts are supplied to the Environment Agency (responsible for flood forecasting and warning) by the Met Office, which is under the Ministry of Defence. The Environment Agency is part of the Department for Environment, Food and Rural Affairs. Although the Environment Agency issues flood warnings, it is not responsible for implementing response actions. These largely fall between local authorities (Department for Communities and Local Government) and the emergency services (Home Office).
Bangladesh: Some weather information is provided to the Flood Forecasting and Warning Centre (FFWC) by the Bangladesh Meteorological Department (BMD), which is part of the Ministry of Defence. FFWC is a unit within the Department of Hydrology (Water Development Board), under the Ministry of Water Resources. Response and post-actions are shared between many ministries and departments and there is some coordination by the Disaster Management Bureau, part of the Ministry of Food and Disaster Management.
Papua New Guinea: This example relates to the situ-ation in the late 1980s. Flood warnings were mostly handled by individual local authorities, with over-all coordination by the Department of Works. Severe weather warnings were provided by the Bureau of Meteorology, which was under the Ministry of Minerals and Energy, as was the Bureau of Water Resources, which had responsibility for hydrological data collection, including rainfall. Subsequently, the Bureau of Meteorology came under the Department of Aviation and that of Water Resources under the Ministry for Environment.

CHAPTER 1. INTRODUCTION 1-9
A number of countries have a combined hydrologi-cal and meteorological service, for example Russia, Iceland, some eastern European countries and Nepal. This theoretically eases issues over data collection, use and dissemination that arise when one organization collects atmospheric data and the other provides rainfall and river data. In many cases rainfall data are collected by both the meteorologi-cal and hydrological agencies and the type of data is influenced by historical factors, or the primary requirement for rainfall data. In Sri Lanka, rainfall data are collected by the Meteorological Department as part of their agrometeorological service, by the Department of Irrigation and by the Department of Agriculture.
Flood forecasting and warning as a focused activ-ity in the hydrometeorological sector is a relatively recent development. This may be an evidence of the growing seriousness of flood impacts, both as a result of greater financial investment and pressure of population. Previously in the United Kingdom, France and other European countries, response focused on flood defence and warning through the general meteorological forecasting of severe weather. However, the occurrence of a number of severe events from 1995 to 2003 led to the setting up of national flood forecasting and warning centres. This has provided the opportunity to enhance the development of monitoring networks specifically for flood forecasting and warning purposes. Hydrological networks comprise instru-ments that have electronic facilities for data storage and transmission (raingauges and water level recorders) and meteorological effort has focused on collection and delivery of satellite and radar data.
1.4.7 Legalaspects
Any flood forecasting and warning system has to deal with uncertainty. This is inherent due to the nature of the meteorological and hydrological phenomena involved. To this has to be added the
uncertainties involved with equipment and human error within an operational structure. Uncertainty may be dealt with in the design and planning proc-esses, where a decision is made on the level of uncertainty, that is, the risk of failure that is accept-able. This then becomes a balance between the cost of safe design against that of the losses caused by damage. Except where “total protection” is provided for key installations such as national security loca-tions and nuclear plants, aspects of uncertainty can be approached through probabilistic methods. The probabilistic approach is increasingly being used as part of risk analysis, where impact and consequence in human and economic terms are linked with the causative meteorological and hydrological characteristics.
Liability in strict legal terms is difficult to apply to the various activities in flood forecasting and warn-ing. Whereas a contractor may face liability for the failure of a flood protection structure (for example a dam or a flood wall) or a manufacturer for a prod-uct not meeting specifications as to flood resistance or proofing, most national and international legal systems and codes regard floods and the causes thereof as “Acts of God”. Liability in regard to flood-ing tends to operate in a “reverse” way, that is, that compensation or redress for losses and damage may not be given if a case shows that there has been some form of negligence in design or that guide-lines have been ignored. In many countries governments or international agencies can provide compensation or assistance in rebuilding, but there is no legal obligation. Insurance is increasingly fulfilling the role of government in recovery actions, particularly in developed countries where it is a commercial arrangement. Increasing use of insurance has, however, meant that when events occur, the cost to insurance companies becomes larger, leading to rises in premiums. This situation also leads to insurance companies deciding on what is or is not a worthwhile risk, which often leads to properties in high-flood-risk areas being uninsurable.


2.1 BASICCONSIDERATIONS
The recognition of the need for flood forecasting and warning systems is witness to the reality of the limitations of structural flood protection systems. Due to the existence of settlements in flood-prone areas and to the need to meet present-day expecta-tions of community safety and protection of assets, the provision of an adequate flood forecasting and warning service is a growing necessity in many countries. Flood forecasting and warning services have many local benefits, but on the wider scale ultimately operate in support of the civil protection and emergency response services. Forecasting and warning services are, in most cases, state services and their main goal is to deliver reliable and timely information to the civil protection services as well as to the general public. This should be accom-plished with enough lead time to allow people to take measures to protect themselves from flooding or take appropriate actions.
The goal of a national flood forecasting service is to provide a full level of operations throughout the country. This may not always be possible and so a compromise is often sought, which may include a lesser sophistication of service or equipment over low-risk areas, or a decision to use a phased approach that concentrates on high-risk areas first.
To design a suitable flood forecasting service, it is necessary to understand:(a) The hydromorphological characteristics of the
basin, topography, geology and soils, and the degree of structural development;
(b) The main physical processes occurring during hydrometeorological events;
(c) The type of service that is required or can be achieved technically and economically.
Items (a) and (b) are matters relating to the physical conditions of the catchments concerned, whilst item (c) concerns organizational and operational considerations. Each point will be examined in the following subsections.
2.1.1 Typesofcatchment
There is a wide range of river basins and systems in the world and to a greater or lesser extent they have their own particularities, reacting quite specifically to heavy rain, storms or combined effects of sea and inland meteorological events. In general however, it is possible to define five main types of basin
characterized by their different temporal and spatial responses to a hydrometeorological event:(a) Urban basins that are very small (a few square
kilometres), densely populated and have a high proportion of impermeable surfaces that respond in the order of one or two hours and can overwhelm the capacity of the drainage network;
(b) Upper watersheds and small to medium catchments, with an area of between 10 and 500 square kilometres, which will respond in a few hours. Those catchments located in upland areas and with steep slopes react quickly;
(c) Medium-sized rivers with catchment areas of between 500 and 10 000 square kilometres, characterized by long-distance flow propaga-tion with varying contribution of tributaries. For these basins, flood can take days to affect the lower reaches. Basins and continental rivers with catchments in excess of 10 000 square kilo-metres form a subset of large rivers for which flood response is in terms of weeks and reflects major seasonal meteorological conditions;
(d) The very specific domain of estuaries, under the combined influence of maritime storm surge, tide effects and upstream incoming flood. In the case of wide estuaries, the water level can be greatly affected by strong wind. Propaga-tion lead time in estuaries is of the order of several hours when the riverine flood predomi-nates, depending on the length of the fluvial upstream reach;
(e) Groundwater-controlled river systems, subject to long, periodic fluctuations of the water table. This can produce long-duration flooding, lasting several weeks in some cases.
2.1.2 Physicalprocesses
The nature of any forecasting services that may be provided is firstly dependent above all on the types of flooding processes occurring in the basin. The table below illustrates these processes and clearly shows that any one service may need to accommo-date a range of basin types.
For example, upper basins are characterized by a quick response to heavy, intense rain, which would be exacerbated if infiltration were reduced because of catchment wetness. Propagation of flood volumes downstream will also contribute as numbers of headwater tributaries combine. The reduction of infiltration as a result of urbanization is a more important consideration in smaller catchments
CHAPTER 2
MAIN ASPECTS OF FLOOD FORECASTING SYSTEMS

MANUAL ON FLOOD FORECASTING AND WARNING2-2
that would in any case demonstrate a rapid response.
Urban basins present highly specific features through the scale of paved areas and the capacities, or lack thereof, of urban drainage systems. Rainfall intensity is a significant factor in flood response and recently this type of flooding has been termed “pluvial flooding”. Recent studies in the United Kingdom conducted by the Department for Environment, Food and Rural Affairs (Defra) have examined critical rainfall thresholds that might be beneficial in any rainfall forecast application and for the identification of flooding “hot-spots”, which occur in low-lying parts of towns or where surface water drainage is insufficient.
The main processes in both the upper and urban catchment areas are thus the interaction of infiltra-tion and runoff that combine to produce high flow concentration in lower reaches of rivers and low-lying topographic areas. In the case of long rivers, which by their nature will have large catchment areas, the combination of subcatchment floods and the means by which they combine, that is, the occur-rence of peaks either at separate times or almost synchronously, will affect the way a flood may prop-agate towards the lower reaches. Complications can arise where lower reaches of rivers feed into estuar-ies, when tides and wind can significantly affect the progress of a flood peak. In some large catchments there may also be significant areas where aquifers will modify flood response through groundwater characteristics. These may reduce the initial response to a major rainfall or snowmelt event, but delayed outflow from groundwater may extend the duration of flooding in the lower reaches of the river system.
The processes outlined above can be monitored and predicted by a combination of observation and modelling, and it is necessary to design a flood forecasting and warning service based on a given combination of conditions. Each type of basin
flooding will require different approaches to the necessary monitoring and modelling facilities. Upland and urban catchments present particular challenges to assuring sufficient lead time for responses to be put in place. Thus, the emphasis must be on effective real-time observation and rapid transmission and processing of data. In these areas it is important to have good quality meteorological observations and forecasts that may be used to produce early, modelled flood estimates. Detailed understanding of the behaviour of localized, high-intensity rainfall and the capacity of drainage structures become important considerations.
In larger catchment areas the lead time associated with rainfall forecast and observation may not be so critical, and over very large basins data sampling may only be necessary at intervals of several hours. More emphasis will, however, need to be placed on identifying the distribution and patterns of rainfall that occur, and on the observation of the hydro-logical response of contributing basins. Some large catchments may present problems with “drainage congestion”, which will arise when the main river level is high, thus preventing floods from escaping smaller catchments and adjacent low-lying areas. In these cases, local rainfall observations, by tele-metric raingauges or radar, assume considerable importance because localized flood response will be different from the behaviour in the majority of the catchment.
An interesting case in point occurred in the United Kingdom city of Hull in June 2007. Hull lies on a major estuary and is surrounded by low-lying areas, where rivers are extensively controlled and subject to tidal blocking. A prolonged period of heavy rain had resulted in the surrounding rivers rising to a level where “alerts” were issued. However, although the levels continued to rise, this was slow, and the higher level requiring “warning” was not reached before localized heavy rain fell over the city,
Interaction between basin size, physical process and flood response
Type of basin Physical process
Wind Infiltration Rainfall intensity
Runoff Propagation Tide and surge
Water table
Urban X XXX XXX X
Upper basin XX XX XXX X
Long river X X XX XXX X
Estuary XXX XX XXX
Aquifer X X X XXX
XXX: dominant effect XX : direct effect X: minor effect

CHAPTER 2. MAIN ASPECTS OF FLOOD FORECASTING SYSTEMS 2-3
causing major urban flooding. As the authorities largely relied on river (fluvial) flood warnings, and no specific warning system was in place for heavy rainfall and sewer flooding, major disruption and damage occurred.
2.1.3 Typeofservice
The most advanced form of forecasting and warn-ing service that can be provided is for inundation extent and depth. Even in highly developed coun-tries, it is not possible to offer this level of service throughout the country. The limitations on the level of service are largely dictated by cost and the complexity of modelling, but the following reasons can also influence the choice of the relevant level of the service:(a) There are too few locations vulnerable to flood-
ing or of economic importance in the basin to warrant the setting up of extensive and costly instrumentation;
(b) The nature of the hydrometeorological condi-tions in the basin does not generate sufficiently severe or frequent events to justify investment, for example in arid and semi-arid areas;
(c) Despite the knowledge of the hydrologi-cal response of the basin, the state of the art in hydrological monitoring and modelling is not advanced enough to produce sufficiently accurate forecasts, for example in urban areas;
(d) The level of development and economic condi-tions of a country or region are insufficient to provide and maintain technical services.
The type and level of service that can be provided is thus a balance between the technical feasibility to forecast the flood hazards and the economic justifi-cation for protecting vulnerable populations, areas of importance and infrastructure. The different types of services, from the basic minimal levels to those of greatest quality, may be summarized as follows:(a) Threshold-based flood alert: This service can be
based on real-time data measurements along rivers. This is not quantitative forecasting but qualitative estimation of the increase in river flow or level. No hydrological or hydrodynamic model is required, as trends are extrapolated pro rata to estimate if and when critical levels may be reached. The basic information needed is knowledge of the behaviour of the river, that is, the flood hydrograph, at specific observa-tion points. Extrapolations are made at time intervals to revise the projection of potential or actual flood conditions.
(b) Flood forecasting: This is a more defini-tive service based on the use of simulation tools and modelling. The means of simula-tion can include simple methods such as statistical curves, level-to-level correlations
or time-of-travel relationships. These meth-ods can all allow a quantified and time-based prediction of water level to provide a flood warning to an acceptable degree of confidence and reliability. Whether this simple approach is used, or a more sophisticated approach through models that integrate and replicate the behaviour of rivers throughout the basin, simu-lation tools must be calibrated beforehand by using historical data from recorded floods. The simulation methods also need regular checking and revision to ensure that catchment relations remain properly identified. The information delivered by a warning service is not confined to station locations, as in the flood alert, but can be focused on specified locations at risk.
(c) Vigilance mapping: This is a development of the site-specific warning approach described in (b). Flood warning services in a number of countries now produce a map-based visu-alization (for example the “vigilance map” in France) as an Internet service. The levels of risk derived from observations or models are characterized by a colour code (in the French example, green, yellow, orange, red) indicating the severity of the expected flood.
(d) Inundation forecasting: This is the most sophis-ticated service that can be delivered to the public. It requires the combination of a hydro-logical or hydrodynamic level-and-flow model with digital representation of the flood plain land surface. The level of detail and accuracy of the terrain model depends on the nature of the area at risk. The greatest level of complex-ity should be applied to sensitive areas of flood plain, where flood extent is dictated by minor relief, and to urban areas. Such models do have the ability to predict flooding to very precise locations, for example, housing areas or critical infrastructure locations such as power stations and road or rail bridges. Development of this approach also requires a thorough knowledge of inundation from previous severe events.
2.1.4 Forecastleadtime
The forecast lead time that it is possible to achieve is related to the type of catchment. However, the basic principle for assessing lead time requirements is the minimum period of advance warning neces-sary for preparatory action to be taken effectively. This will depend on the needs of the target commu-nity or area. Individual householders and businesses may require from one to two hours to move vulner-able items to upper storeys or put sandbags or small barriers in place. Protection of larger infrastructure, setting up of road diversions and movement of farm animals to a place of safety may require lead times of several hours. On large rivers with a long lead time but major potential impact, the lead time

MANUAL ON FLOOD FORECASTING AND WARNING2-4
for evacuating populations at risk may be in the order of days. Thus, the concept of lead time has to be flexible and the minimum time may be entirely dependent on the catchment structure and the forecasting and warning system facilities. For small and urbanized catchments, flood response time may be so short that it is extremely difficult to provide an effective warning. If a high-risk, high-impact situation exists, then the problem of short lead times may be addressed by sophisticated auto-mated alarm systems linked to real-time hydrological and hydraulic modelling.
The following three situations illustrate some of the issues affecting forecast lead time:(a) In the situation where only forecasts based
on historical water level records are available, extrapolation of the water level over a period of a few hours is possible, dependent on the catchment characteristics and nature of the causative event.
(b) In the case that telemetric raingauge data or radar rainfall information are available, these can provide additional advance warning. In this case, an experienced forecaster using subjective judgement can estimate the likely flood response time. In a more sophisticated arrangement, data can be used as input into a hydrological forecast model.
(c) Further to the situation described in (b), addi-tional lead time can be provided if a rainfall forecast is available from a meteorological serv-ice. If this forecast can be presented as input suitable for the catchment forecast model, several hours may be added to the flow-forecast lead time. This presumes a high level of agreed cooperation between the meteorological serv-ice provider and the flood warning service.
As an example of the last point, in the rapid response catchments in upland hilly areas in the south of France, the rain-forecast lead time provided can be from 6 to 12 hours and the hydrological lead time (catchment response) around 10 hours. Thus, this local service can provide a forecast of flood risk with a lead time of 15 to 20 hours, which is then published in the form of a vigilance map, as shown in the figure below. The lowest level of alert, indicating the likelihood of low-impact flooding, is marked in yellow for two catchments.
Many examples of the presentation of lead time and information of forecasts and warnings are available from national flood warning services. Typical examples can be found on the following Websites:– United Kingdom: http://www.environment-
agency.gov.uk/homeandleisure/floods;
French Government “vigilance map” for 17 December 2008
Source: http://www.vigicrues.ecologie.gouv.fr (French government Website)

CHAPTER 2. MAIN ASPECTS OF FLOOD FORECASTING SYSTEMS 2-5
– France: http://www.vigicrues.ecologie.gouv.fr;– Bangladesh: http://www.ffwc.gov.bd;– United States of America: http://www.weather.gov.
ahps;– Australia: http://www.bom.gov.au/hydro/flood.
Some specific forecast and warning outputs are presented in Chapter 8.
2.2 DATAREQUIREMENTS
2.2.1 Overalltechnicalrequirements
The precise details of data requirements will depend on the particular nature of a flood warning system and its objectives. These details will be discussed in the subsequent chapters of this Manual. The overall technical requirements of a flood forecasting system are summarized below (Bruen, 1999):(a) A real-time data collection subsystem for receiv-
ing and processing the relevant information. This will include meteorological informa-tion, the discharge data at appropriate gauged sections in rivers (or water levels and rating curves) and from impoundments, and also soil-moisture measurements if required. This may involve manual or automatic recording gauges, terrestrial data-collection platforms, ground-based radars, satellites, airborne sensors and extensive use of GIS to present such informa-tion in useful format;
(b) Access to the outputs of a numerical meteor-ological forecasting subsystem, that is to say numerical weather prediction (NWP) models for meteorological forecasting inputs, for example the quantitative precipitation fore-cast (QPF), during the required lead time of the flood forecasting model;
(c) A subsystem to combine optimally the data from various sources and to provide a feedback mechanism for the recalibration of measuring tools and techniques, and for the initialization of model error correction;
(d) A catchment modelling subsystem, embed-ded in a user-friendly interface, to estimate the total discharge at the catchment outlet, at the required time intervals, along with a corre-sponding statement of uncertainty;
(e) A subsystem comprising a hydrodynamic or a hydrological channel routing model to esti-mate the movement of the flood wave along the channel, the water levels, the effects of dyke breaches and reservoir operation, and the interaction with the flood plain and flooded areas, giving a flood inundation forecast;
(f) An error correction subsystem incorporating an algorithm to improve the estimates of discharge
based on recent feedback from river-gauge data;(g) A subsystem for tide or estuary modelling in
the case of backwater effects influencing the flood;
(h) Appropriate communications, GIS networks and decision support systems, producing fore-cast details at various levels and map forecasts showing flood inundation in real time.
Some further general considerations of the main data types are examined in the remaining sections of this chapter.
2.2.2 Hydrologicaldata
This data essentially relate to measurement of river flow and level, and the monitoring instruments should be able to record accurately peak values of both. A flood forecasting system will require a network of stream gauges. There are many types of stream gauges, ranging from simple staff gauges to Doppler or ultrasonic sensing devices measuring level or flow. The composition of the stream gauge network is determined by the requirements for lead time and accuracy and also the locations where forecasts are needed (forecast points). Forecast points are usually coincident with a stream gauge location, partly as a result of the modelling approach and partly to give operational verification. However, forecast points can also be designated for a specific reach of a river where flood impact is potentially high, such as near towns, cities or agricultural areas. In the case of a forecast point being located at a flow gauging station, an accurate rating (stage–discharge rela-tionship) should be maintained. Flow gauges at forecast points should have telemetric links to the operational control centre.
2.2.3 Meteorologicaldata
Rainfall intensity and duration, precipitation fore-casts and past data for calibration of rainfall–runoff models are all necessary prerequisites to develop and operate a successful flood forecasting and warn-ing system. Meteorological data and forecasts are required in real time to maximize the lead time for flood forecasts and warnings. The principal item of meteorological data used is rainfall and this is required from a network of raingauges or radar coverage. These data will provide a best estimate of rainfall over the area modelled, whether over a grid or to obtain a basin average.
The traditional techniques for rainfall forecasting, based upon ground-based telemetric raingauges and meteorological radars (to indicate spatial distri-bution), are still widely used. This is because networks have been progressively developed from conventional and broad-based hydrometeorlogical

MANUAL ON FLOOD FORECASTING AND WARNING2-6
networks and are deemed cost-effective (Todini, 2001). The three major benefits claimed for using radar data are:(a) A finer spatial resolution of the precipitation
field;(b) Real-time data availability;(c) The ability to track approaching storms even
before they reach the boundary catchment of interest.
Radar has advantages, in particular, where rain-gauges are sparse and/or storms are localized. However, if storms are large in area, simultaneously covering the sites of many raingauges, the gauges tend to produce more accurate measurements of rainfall than radar. Radar will still give a better indi-cation of the spatial distribution than that achieved by classical methods such as Thiessen polygons or Kriging interpolation.
With rapid technological advances, it is anticipated that the increasing capabilities of the meteorologi-cal satellites will soon enable them to distinguish between ice and water clouds, and to detect low cloud and fog, apart from providing information about the vertical structure of the atmosphere.
Real-time observations of climatological data are frequently used to compute evapotranspiration for input into hydrological models. In addition to real-time data, for it to be operational, the hydrological model to be used will need to be calibrated with input from historical precipitation and climatologi-cal data over an extended period of record.
Numerical climate-prediction models at the global, regional or local levels (regional climate model – RCM; local- or limited-area climate models – LAM) may be utilized, where available, to provide rainfall forecasts as inputs into flood forecasting models. These may be part of complex forecast arrange-ments, such as the United Kingdom Met Office Short-Term Ensemble Prediction System (STEPS) (Bowler et al., 2006), to provide QPFs, or as value-added products for qualitative forecasts to assist decision-making in a flood warning operation. Although QPFs have considerable uncertainty and thus may have limited value in hydrological models, their use can extend lead time significantly and they hold considerable prospects for the future, if sufficient accuracy can be realized.
2.2.4 Topographicdata
Topographic data are increasingly required for the development of flood forecasting systems, as more demands are made for models to produce realistic estimates of spatial flooding. There is a distinction to be made between “conventional” topographic information, which can be obtained from maps
and used to delineate catchment areas, and the more detailed information now available from terrain or digital elevation model (DEM) data. The latter is available from national and international agencies in a variety of horizontal and vertical scale definitions. Satellite sources are available to provide data globally at a horizontal resolution of 90 metres with a vertical resolution of ± 2 metres. This may not be sufficient for detailed modelling to provide an accurate indication of flood plain and channel capacity for hydraulic models. Data to a resolution of 20 metres horizontal and 0.5 metres vertical or better can be obtained from light detection and ranging (LIDAR) or side-looking airborne radar (SLAR) surveys (Veneziano, 2002). These high-resolution DEM data can be linked to a GIS to provide visualization of flood inundation extent and flood plain infrastructure.
2.2.5 Otherinformationanddata
A wide range of data and information, and how it is used as part of the flood warning system, needs to be considered for the development of a flood fore-casting model. Physical catchment data, such as geology, soil and vegetation (land-use) data are also used to estimate hydrological model parameters as part of calibration. Other useful information may include:(a) Population and demographic data to indicate
settlements at risk;(b) Inventories of properties at risk;(c) Reservoir and flood protection infrastructure
control rules;(d) Location of key transport, power and water
supply infrastructure;(e) Systematic post-flood damage assessments.
2.3 INFRASTRUCTUREANDHUMANRESOURCES
2.3.1 Infrastructure
A flood forecasting and warning service requires a central operational base to communicate with outstations and those dependent on the service. This section examines the basic physical require-ments within which the service and its staff need to operate.
The facilities of a flood forecasting and warning service are usually physically located in buildings belonging to their parent government department. Even though the personnel that operate the serv-ices may have their own office accommodation, it is necessary that there is a specially designated operations room in which all facilities are available and space is provided for all the duty staff. Within

CHAPTER 2. MAIN ASPECTS OF FLOOD FORECASTING SYSTEMS 2-7
the operations room there must be adequate space for desks, computer terminals and work-stations, data display facilities, and printing and copying equipment. In the case that a service relies on radio (wireless) communication with outstations, it is desirable that operators have their own room to prevent disturbance of other workers.
A separate room should be provided for computers and telemetric equipment that are operation criti-cal, to minimize the risk of damage and to assure high-quality environmental conditions. The condi-tions should cover:(a) Air conditioning to provide controlled
temperature and humidity;(b) Controls to minimize the entry of dust and
dirt;(c) Rack-mounting equipment for ease of mainte-
nance and to allow good air circulation;(d) Ducting of cables for operator safety and to
avoid accidental damage.
A suitable office needs to be provided for the head of operations, with its own direct line telephone, fax and Internet access, as this officer may have to deal with high-level external contacts during an emergency. Some units also have a briefing room with radio and television transmission facilities for contact with the media.
A flood forecasting and warning centre has to be accessible to duty staff at all times, especially when staff have to be called in for duty outside office hours. Duty staff need to be provided with keys, passes and security clearance to avoid being refused access under security arrangements. Within a building, the flood forecasting and warning centre may require controlled access to authorized staff only.
The facilities and equipment in the centre require a high level of resilience. Equipment should be supplied with uninterruptible power supply (UPS) devices to avoid short-lived supply failures. If power supplies are unreliable, standby generator facilities need to be provided. Power supplies have to be of sufficient capacity to support power and lighting to the unit for perhaps many hours and be set up so they are activated automatically when power drops or fails.
The flood forecasting and warning centre needs to be located such that it is largely clear of risk to its accessibility. It should not be at risk of floods that could prevent access, or at risk of water entering the premises to cause serious damage to equipment. If the location is unavoidably in an area at risk of flooding, the operations centre should not be located on the ground floor of the premises.
Even though the facilities may have a high level of resilience, consideration has to be given to provid-ing a backup location for the flood forecasting and warning centre to ensure that there is a fail-safe system for an operation of national impor-tance. In the United Kingdom, full duplicate data-management hubs for all hydrological and meteorological data feeds have been established in two centres over 200 kilometres apart, primarily to avoid the impact of a national grid power failure. In some countries, local security issues may make it prudent to have a backup centre in a high-security location, for example a military base, in case of civil disturbance during a major emergency.
2.3.2 Humanresources
Adequate and suitably qualified staffing of flood forecasting and warning units is imperative, given the level of present-day risks and impacts on popu-lations, property and infrastructure. Bangladesh is one of the few countries in which a dedicated flood warning centre has been in existence for 30 years or more, but this is understandable given the signifi-cance of flooding in this country. In many countries establishment of a reliable service has been more recent. The United Kingdom is a good example: although flood warning systems had existed in the country for many years, mostly in the form of manual or automatic river monitoring, there was little in the way of formal staffing for such opera-tions. A core team of engineers may have had flood warning duties incorporated into their job descrip-tions, but this would not have been their primary role and they and other operating staff would be assigned to various duties. Many of the temporarily assigned staff came from disciplines outside hydrol-ogy and river engineering.
Legislation and the changing role of water manage-ment authorities in the United Kingdom over the last 20 years have brought about significant changes. The following descriptions are based on structures in the United Kingdom Environment Agency, which has a two-tier organization for flood forecasting and warning. At the higher level of the region, the focus is on forecasting, and the permanent team is responsible for the data feeds, maintenance and running of models, and the production of flood forecasts (river and coastal). A typical region contains three or more areas, which have the responsibility for responding to the fore-casts and providing flood warnings to the public and professional partners. During a flood situa-tion, both region and area will be fully operational and in constant liaison. In April 2009, a third and higher tier was introduced in the form of a National Flood Warning Centre, which is jointly staffed and operated with the United Kingdom Met Office.

MANUAL ON FLOOD FORECASTING AND WARNING2-8
2.3.2.1 Examples of team structures
In a typical Regional Flood Forecasting Team, there are 24 duty officers on four rosters of six to staff the Regional Flood Management Forecast Centre (RFMFC). Each of these rostered staff have responsi-bility for a particular area but they are able to operate on any area if necessary. As well as flood forecasts the RFMFC has to deal with external liai-son requests. The principal rostered officers are drawn from within the permanent flood-risk management (FRM) staff structure, which is composed mostly of hydrological or modelling professionals.
An Area Flood Warning Team will be responsible for one or more larger river basins. The team will oper-ate with staff assigned to four permanent roles, covering base control, operating duties and infor-mation. They are provided with field support from staff who respond to local incidents and check equipment. The staff are also employed within the broader FRM structure.
2.3.2.2 Flood forecasting at a national level
In April 2009, the Environment Agency and the United Kingdom Met Office established a joint operations centre for flood warning and related extreme weather events. This development was a response to serious flooding events in the country in 2007, which raised concerns over high-level coordination. Both organizations undertook to combine their expertise to find a better means of providing the most complete assessment of opera-tional flood risk, from the developing weather conditions through to the actual flooding event itself. The combined expertise of the Environment Agency and the Met Office is used to forecast river, tidal and coastal flooding, as well as extreme rainfall that may lead to surface flooding.
The Flood Forecasting Centre (FFC) provides the following services:(a) Extreme rainfall alert service;(b) National flood guidance statements;(c) Web service.
As the centre is required to provide national flood guidance, this does not impinge on the roles and duties of forecasting and warning carried out through the regional and area arrangements described in 2.3.2.1 and 2.3.2.2.
The current FFC staff consists of 27 posts in total. Similarly, the Flood Forecasting and Warning Centre of Bangladesh has a staff compliment of 22, but does not employ any meteorologists. The United Kingdom FFC provides daily routine weather forecasts for the Environment Agency and a daily
flood guidance statement for the main civil respond-ers. When heavy rainfall is either forecast or occurring, the centre also provides a range of precipitation forecasts for the Environment Agency and also extreme rainfall alerts for the civil contin-gency responders. During periods of high tides and storms, tidal and storm surge alerts and warnings are issued.
2.3.2.3 General requirements for staffing a national flood warning service
The decision to establish national and regional flood forecasting centres and the way they are related to and supported by National Hydrological and Meteorological Services will, in part, be constrained by the existing service structures and historical development of responsibilities. There is no fixed optimum pattern to follow, but the follow-ing capacities must be available:(a) Hydrological forecasters and modellers;(b) Meteorological forecasters (in the case of
the meteorological and water management services being separated, the meteorologists involved need to have specific appreciation of hydrological requirements);
(c) IT and operational technical communications specialists;
(d) Communications with the media, public and government;
(e) Management and administration;(f) Research and development.
It is now recognized that the importance of flood forecasting and warning as a process in managing flood risk and impacts requires a full-time and structured organizational approach. It is no longer something that can be added on as a temporary contingency operation within an organization fulfilling other primary roles, for example public works or municipalities. Staff complement, pay and allowances, office facilities and equipment all have to be fully financed to reflect the importance of the services.
2.4 ESTABLISHINGTHECONCEPTOFOPERATIONS
The concept of operations is the defined interaction between the data, the forecast technology and the users. It defines how the operational forecast serv-ice will function to assure that users’ requirements are met. There are many ways to configure an oper-ational forecast service as reflected by the variety of country forecast operational structures. There are, however, a number of critical factors that are neces-sary to ensure that a credible delivery of service occurs that meets the needs of the diverse user

CHAPTER 2. MAIN ASPECTS OF FLOOD FORECASTING SYSTEMS 2-9
community. Once the operational concept has been defined it becomes established in the “opera-tions manual” that defines the day-to-day operating environment (“background” or “standby”) as well as how the forecast service will operate during flooding conditions. The following factors should be mentioned:
Forecast centre mission
The legal mandate and mission of the organization(s) providing the service, probably through a dedicated forecast centre, are usually defined in a statutory manner. There are likely to be many users that have different requirements for forecasts and informa-tion. Examples of users include emergency services, civil defence or contingency managers, the media, agriculture, industry, hydropower organizations, water resource and flood control managers, water transportation and municipal water supply organi-zations. The varying types of information needed have to be specified by individual arrangements and service agreements.
Communications
This comprises the hardware and software required to receive data and transmit forecasts, which will include arrangements with telecommunications companies or authorities and assurance that the necessary licences for operating wavebands are in place.
Operation of the hydrometeorological network
This element concerns the definition of the network, including stream and precipitation gauges, the meteorological network and also other sources of data needed for forecasts, such as the radar network and satellite downlink products to be received.
Forecast centre organization
It is necessary to define the staff complement and structure, for example, how many technicians or professionals will staff the centre during routine and emergency operations. The roles and responsi-bilities of the staff have to be clearly set out and how operational duties are to be organized in shifts. The educational and training requirements of the different types of staff need to be well defined. Although it is not always possible or desirable to insist on rigid qualifications, it is essential that all staff have a thorough grounding in the tasks required for operations.
User product definition: This covers the types of products and information (outputs) that are neces-sary to meet the user requirements. This includes
the timing arrangements and deadlines for dissemi-nation. It is useful to maintain examples of all output products in the Operations Manual both for training purposes and for reference when queries from users arise.
Interaction with meteorological forecast services
This particularly applies in countries where the flood forecasting service is an entity operating under a government department separate from the meteorological service. Close cooperation between the meteorological forecast service and the river forecast centre is essential, as the latter has a key dependence on the output of the former. The proce-dure (or system definition) for the acquisition of data and forecasts, as well as analysis is needed as input to hydrological forecasts and should be defined in the operations concept.
Operations policy
The policy and role of the forecast service during both full operational and “standby” conditions must be carefully considered. Under the operating conditions, that is, during active flood warning operations, the role is to collect data, perform qual-ity control on information, receive and analyse meteorological forecasts, run the forecasting systems, analyse present and future hydrological conditions, and produce the forecast products for distribution to users. Under conditions of a severe event, data-flow volume and also staffing resources increase as more products must be delivered to more users within short deadlines. Frequently, the hours of operation must be expanded to meet the increasing demand for service.
Before the vital importance of flood forecasting and warning was fully recognized, it was often the case that organizations did not include a permanent forecast unit. Personnel were drafted according to the requirements of the situation, although key staff would have their role defined as part of their post or duty statement. In a permanent forecasting centre, the policy during times outside events should be for staff to maintain and improve the functions of the centre. This should include activi-ties such as updating essential data such as rating curves, evaluating operational performance, cali-brating models, analysing the need to improve future forecasts and the production of post-event reports.
It is never possible to achieve a continuous and total reliability of hardware, software and power for operations, even with responsible maintenance programmes. National flood warning services must establish backup procedures to assure relia-ble forecast services whenever needed. Backup

MANUAL ON FLOOD FORECASTING AND WARNING2-10
procedures for all components of the operation are required, including data collection, forecast system operations (including backup of hardware, soft-ware and data), dissemination communications, power (UPS and backup generators), staff access and safety. It is strongly recommended that an alternative site for a backup operations centre be established, in case the forecast centre location becomes non-operational. The alternative centre needs to be on a completely different site than the normal centre to avoid being affected by the same adverse conditions as prevented the functioning of the latter.
The key to achieving the operational reliability of a forecast centre is to establish a robust maintenance programme. It must be realized that this can be an expensive activity, especially if the network is widespread and remote to access. All hardware and
software must be routinely maintained, otherwise the system may not function when needed most. It is recommended that, in addition to the professional and technical forecast staff, the forecast centre organization include a system administrator responsible for maintaining the hardware and software of the communications and forecast system. It is also recommended that certain staff be dedicated to maintaining dissemination products. As an example, the proposal for the reorganization of the Storm Warning Centre at the Bangladesh Meteorological Department recommends four units within the operational structure:(a) Modelling and forecast production;(b) Field instrumentation and communications
maintenance;(c) IT hardware and software management;(d) Product dissemination and Website manage-
ment.
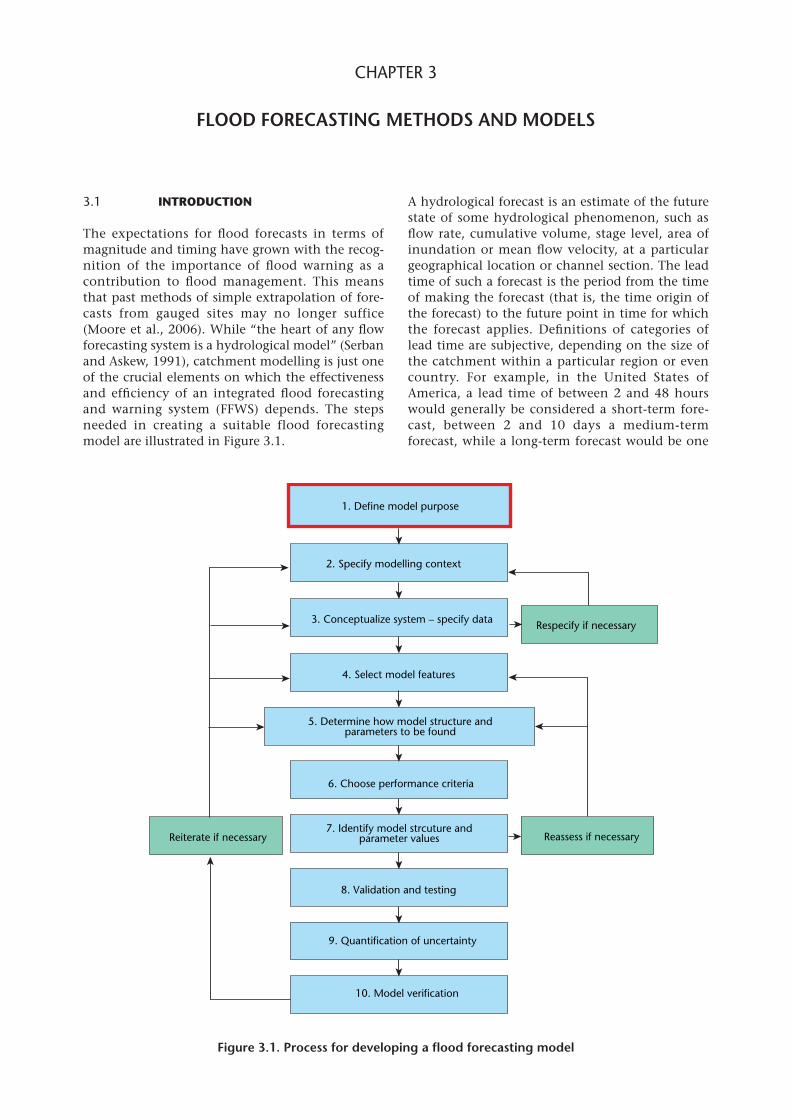
3.1 INTRODUCTION
The expectations for flood forecasts in terms of magnitude and timing have grown with the recog-nition of the importance of flood warning as a contribution to flood management. This means that past methods of simple extrapolation of fore-casts from gauged sites may no longer suffice (Moore et al., 2006). While “the heart of any flow forecasting system is a hydrological model” (Serban and Askew, 1991), catchment modelling is just one of the crucial elements on which the effectiveness and efficiency of an integrated flood forecasting and warning system (FFWS) depends. The steps needed in creating a suitable flood forecasting model are illustrated in Figure 3.1.
A hydrological forecast is an estimate of the future state of some hydrological phenomenon, such as flow rate, cumulative volume, stage level, area of inundation or mean flow velocity, at a particular geographical location or channel section. The lead time of such a forecast is the period from the time of making the forecast (that is, the time origin of the forecast) to the future point in time for which the forecast applies. Definitions of categories of lead time are subjective, depending on the size of the catchment within a particular region or even country. For example, in the United States of America, a lead time of between 2 and 48 hours would generally be considered a short-term fore-cast, between 2 and 10 days a medium-term forecast, while a long-term forecast would be one
CHAPTER 3
FLOOD FORECASTING METHODS AND MODELS
Figure 3.1. Process for developing a flood forecasting model
1. Define model purpose
2. Specify modelling context
3. Conceptualize system – specify data
4. Select model features
5. Determine how model structure andparameters to be found
6. Choose performance criteria
7. Identify model strcuture andparameter values
8. Validation and testing
9. Quantification of uncertainty
10. Model verification
Reassess if necessary
Respecify if necessary
Reiterate if necessary

MANUAL ON FLOOD FORECASTING AND WARNING3-2
for which the lead time exceeds 10 days (WMO-No. 49, Volume III, 2007). However, in the United Kingdom, or in areas with many small catchments, short term is considered to be from two to six hours and long term beyond one day. Very short-range weather forecasting, called “Nowcasting”, having a lead time ranging from a few minutes to two hours, generally relies on the extrapolation of the most recently observed trends. In some locations, “flash-flood forecasting” is needed, that is, when the flood occurs within a few hours of the associated storm rainfall.
Rainfall–runoff models are designed to produce the required flood forecasts from meteorological and other data, so the choice of model or models to be used, as well as the estimation of QPFs over the forecast lead times are crucial to its success. It must be borne in mind that the meteorological inputs to flood forecasting models are a significant source of uncertainty, as they are “dominated by errors in measurements and forecasts of rainfall” (Moore, 2002). There are still “significant problems to be overcome” in using weather radar in combination with raingauges for QPFs (Moore et al., 2005). While some forecasting models can operate without QPFs to produce lead-time forecasts, the use of QPFs considerably enhances the forecasts (Goswami and O’Connor, 2007) and facilitates the effective exten-sion of the forecast lead time (Arduino et al., 2005, see Chapter 1).
As catchments respond to hydrometeorological phenomena in a broadly similar manner, it might be expected that modelling would be narrowly focused, involving a fairly straightforward process of refinement to make the models more scientific. However, the “one size fits all” approach to catch-ment modelling and forecasting does not work. There is sufficient variation in the factors producing the hydrograph, and in their interactions, to tax the ingenuity, capabilities and technical resources of model developers. This results in a bewildering choice of models that work quite well in some cases but poorly in others. A modular approach to model-ling in the context of conceptual models has been suggested (O’Connell, 1991), whereby each identifi-able component of the runoff-generating process (for example snowmelt or groundwater) can be represented as a submodel element to be included in the model as appropriate. In recent years, families of “model toolboxes” have emerged that offer a choice of model structures and variations. These provide modelling capabilities to users who are not model developers. Model development is a special-ist undertaking and, regrettably, there is still a wide gap between developers and practitioners.
The WMO Hydrological Operational Multipurpose System (HOMS), which promotes the transfer of
proven technology, includes sections on models for forecasting streamflow from meteorological data and also models combining streamflow fore-casting and routing. This technology, presented in the form of technical manuals and computer programs, has been made available for inclusion in HOMS by the hydrological services of WMO Member countries. It comprises techniques that have been developed, tested and used in normal operations by these agencies. However, many of these must be considered to be “legacy systems”, which may be difficult to transpose and support. (See: http://www.wmo.int/web/homs/projects/HOMS_EN.html.) There is no formal procedure within the HOMS programme for systematically updating its components or for providing training or help in their application.
To be useful, selected forecasting models must satisfy certain objectives, depending on the require-ments of the stakeholders and the end-users of the forecasts. The degree of complexity of the models should be consistent with the actual “information-carrying capacity” (Klemeš, 2002) of the data available to calibrate and run them (O’Connor, 2006). Increasing model complexity, in terms of the number of components and parameters involved, is not necessarily warranted or justifiable (Perrin et al., 2001, 2003). Best management practice in FFWSs is evolving towards the use of more physi-cally based distributed models or at least an integrated suite of simplified models running simultaneously (that is, the “multi-model” consen-sus approach) (Malone et al., 2007). The problem of forecast uncertainty, arising from data error, model structural inadequacy and suboptimal parameter estimation must also be addressed.
In operational practice, there has been little radical innovation in flood forecasting and recent advances are not widely reflected (Arduino et al., 2005). Many models that were implemented in operational FFWSs decades ago are still in use today, having undergone only occasional refinement or cosmetic interface updating, as the model forecasts produced are still considered adequate by their end-users. Describing all such methods and models and the elaboration of their mathematical development is clearly beyond the scope of this Manual. The main categories or classes of models and some represent-ative examples of each class are indicated, with appropriate references provided.
Apart from the availability of an enormous body of journal literature and proceedings of conferences in this specialized area of hydrological science (for example Arduino et al., 2005; Todini, 2007), there are many standard text books that provide useful insights into catchment modelling and flow fore-casting, although few of the earlier publications

CHAPTER 3. FLOOD FORECASTING METHODS AND MODELS 3-3
concentrate on real-time flood forecasting and warning. The Internet is also an increasingly rich source of reference material, for example the Internet book Integrated flood forecasting, warning and response system, Chapter 3 (http://www.unisdr.org/eng/library/isdr-publication/flood-guidelines/isdr-publication-floods-chapter3.pdf).
3.2 PRECIPITATION-DRIVENCATCHMENTMODELS
In the context of flood forecasting, two forms of precipitation generally dominate, rain and snow. While the distribution of evapotranspiration over time is a significant factor in the modelling of semi-arid and arid catchments, it is generally much less so for humid catchments, although for small and medium-sized events, evapotranspiration is impor-tant to define initial conditions. Most conceptual models have an evapotranspiration procedure embedded as part of a water balance component. There is recent evidence (for example Oudin et al., 2005 a, b) that, in the case of lumped conceptual models that have been applied to French catch-ments, estimation of evapotranspiration can be based on simple temperature methods. (Lumped models have constant parameters, which do not change in space and are typically described by ordi-nary differential equations, while parameters of distributed models, whose physics is described by partial differential equations, may vary in space.) These temperature methods have been shown to be quite adequate in the sense that the simulation effi-ciency is not significantly improved by using more data-demanding methods, such as the Penman approach. In this 3.2, an overview of catchment modelling is provided, with special reference to QPF, the formulation of mathematical models of the rainfall–runoff transformation and, where appropriate, the contribution of snowmelt to the generation of runoff.
3.2.1 Precipitationmonitoringandforecasting
Precipitation data are used in forecasting models in the form of rainfall inputs and, if available, QPFs. Where snowmelt is a significant contributing factor in flood production, a snowmelt component is also required.
3.2.1.1 Rainfall
Currently, the development of Quantitative Precipitation Estimation (QPE) and QPF modelling is restricted to a relatively limited range of temporal and spatial resolution (Moore et al., 2005). Timescales are mostly in the order of one to three days and areas
less than 12 kilometres are not normally available. Current research and development is focusing on extending lead time to between 5 and 10 days, with spatial scales to as small as 2 kilometres. For the precipitation–runoff type of catchment models to produce flood forecasts of reasonable accuracy, the availability and accuracy of the QPFs over the range of desirable forecast lead times are of great impor-tance (Toth et al., 2000).
The three basic systems used for providing such QPFs are:(a) A network of conventional ground-based
telemetering raingauges;(b) Weather radar systems, which have become
increasingly popular since the introduction of dual polarization systems and Doppler radars;
(c) Geostationary satellite systems that are based on the analysis of clouds shown by satellite imagery. While this method is promising, it requires further refinements for general use in operational flood forecasting systems on small or medium-sized catchments, particularly in sub-tropical areas.
Examples of hydrological radar programmes provid-ing inputs to flow forecast models are:(a) Next-Generation Radar (NEXRAD) (United
States) using a network of approximately 175 S-band high-power Doppler weather radars;
(b) Nimrod products received and processed by the Hydrological Radar System (HYRAD) used by the United Kingdom Environment Agency;
(c) A network of 15 C-band radar combined with raingauge and satellite data in Japan;
(d) A system of two C-band radars operated by Met Éireann (Ireland).
The following are examples of widely used Limited Area NWP Models:(a) The high resolution limited area model
(HIRLAM) in Sweden and Ireland;(b) The United Kingdom Met Office mesoscale
model (based on the unified model);(c) The Limited Area Model Bologna (LAMBO) in
Italy;(d) The North American Mesoscale Model (NAM,
formerly ETA), the Global Forecast System (GFS), the Medium Range Forecast Model (MRF) and the Nested Grid Model (NGM) at the National Centres for Environmental Prediction (NCEP) in Washington, United States;
(e) The Navy Operational Global Atmospheric Prediction System (NOGAPS) at the Fleet Numerical Meteorology and Oceanography Centre in Monterey, CA, United States;
(f) The Global Environmental Multiscale (GEM) model at the Canadian Meteorological Centre in Montreal, Quebec;

MANUAL ON FLOOD FORECASTING AND WARNING3-4
(g) The Operational Regional Spectral Model (ORSM) in Hong Kong, China.
3.2.1.2 Snowmelt
In operational use, snowmelt models increasingly rely on remote-sensing (Maurier et al., 2003). The procedures using remote-sensing for forecasting snowmelt runoff can be broadly classified into two categories, the empirical approaches and the model-based approaches (Engman and Gurney, 1991). Apart from the direct empirical approaches, estab-lished models have been modified and new models developed that utilize satellite-derived snow-cover data for predicting and simulating snowmelt runoff.
3.2.2 Eventmodellingandcontinuoussimulation
Event-based modelling is carried out to simulate either individual floods resulting from storms over a catchment, or the outflow in the case of a breach of an embankment or dam. The traditional proce-dure for conceptual event-based modelling of floods in response to storms comprises the following (DeVries and Hromadka, 1993):(a) Computation of area-averaged precipitation at
each time step at the subcatchment scale;(b) Determination of precipitation excess by
considering time-varying loss components;(c) Generation of the direct surface runoff
hydrograph from precipitation excess;(d) Addition of a simplified base flow to the
generated surface runoff;(e) Channel routing;(f) Reservoir routing;(g) Combining of hydrographs.
Critically, in the case of event-based models, realis-tic initial conditions or states in real time need to be specified or estimated. The lack of a “warm-up period” in event modelling introduces subjectivity and adversely affects model performance.
The Hydrologic Modeling System (HMS) of the Hydrologic Engineering Center (HEC) of the United States Army Corps of Engineers is one of the most popular and versatile programmes in the category of event models. HEC software and documentation are available free of charge and can be downloaded from the HEC Website (http://www.hec.usace.army.mil/), together with a list of vendors that market and support the system. Another example, widely used in Australia and elsewhere, is the Runoff Routing Burroughs Event Model (RORB) (Laurenson and Mein) developed at Monash University (Australia) for estimating hydrographs from rainfall and other channel inputs using a runoff-routing procedure (Laurenson, 1962; Laurenson, 1964; Laurenson and Mein, 1995). Free download of
RORB version 8, released in 2008, which is distrib-uted, non-linear and applicable to both urban and rural catchments, is available at the Website http://civil.eng.monash.edu.au/expertise/water/rorb/obtain. Information on RORB is also available from [email protected].
Continuous simulation models, in contrast to event models, account continuously in time (not just for individual storms) for all the precipitation that falls on a catchment and the movement of water through the catchment to its outlet gauging station. They are of considerable complexity as they need to simulate both flood response and also moisture depletion during dry periods. Apart from models based on unit hydrographs and naïve simple linear total response models (SLM), most of the systems-based theoretic black box models are of this type.
In the simpler models, physically plausible rela-tions or empirical formulae are generally used to interlink the subprocess elements. Depending on the degree of spatial variability, the relations are applied either at catchment scale, for example in lumped models, or at subcatchment scale, for example in semi-lumped or semi-distributed models, or by developing a grid of individual elements or pixels as used in distributed models. Vertical variability is represented by subsurface zones or vertical layers of soil for each grid element.
3.2.3 Modeofoperationofflowforecastingmodelsinrealtime
3.2.3.1 Models operating in non-updating mode
This type of model is generally considered to be inefficient in the context of real-time modelling. It is important to distinguish between a rainfall–runoff model operating in simulation (or design) mode and the operation of the same model in a real-time flood forecasting context (Kachroo, 1992). Having calibrated a model using records of inputs (for example rainfall and evaporation) and outputs (for example the observed flows), pure simulation, for design purposes, simply involves its application to observed inputs to produce the corresponding simulated outflows.
Real-time forecasting differs from flow simulation in that it involves the forecasting at a point in real time (defined as the forecast time origin) of the flows at future points in time. Generally, forecasts are required at equidistant time steps, for lead times of one, two, three, ..., N time steps, with the “Lead-1” forecast corresponding to the “one-step-ahead” forecast, and so on. Clearly, forecasting efficiency

CHAPTER 3. FLOOD FORECASTING METHODS AND MODELS 3-5
decreases the further one extrapolates into the future, that is, it decreases with increasing lead time.
In real-time forecasting, there are two possible scenarios. One approach is to use the QPEs or QPFs over the selected flow forecast lead time at each time step, in addition to the actual input values up to the time origin of each forecast, to make the required forecasts. In this non-updating forecasting scenario, the model operates as if in pure simulation mode, without any updating of the forecasts as new flow measurements become available in real time. This approach is limited, as it ignores the availability of the sequence of observed flows up to the time origin of the forecast that could be used for forecast updat-ing. It inevitably leads to the simulated forecasts drifting further away from the subsequently observed flow values.
The lack of fit between the forecasted flood hydrograph, for a specified lead time, and the corre-sponding observed hydrograph, may be attributed to one or more sources of forecast errors (see also 3.2.1.1). These errors include amplitude, phase and shape errors (Serban and Askew, 1991, WMO Technical Report No. 77 (2004)). The graphical representations of these three types of errors are shown in Figure 3.2. Updating procedures, involv-ing feedback, have the objective of minimizing amplitude, phase and shape errors of the non-updated simulated flood hydrographs in real time, as well as the overall volumetric error.
The amplitude or volumetric errors reflect the over-estimation or underestimation of the volume of the flood hydrograph. They imply structural deficien-cies in either the water balance component of the model or the lumped representation of the model, errors in the input and/or output data or, more often, a combination of all of these. The phase errors display inaccuracies in the timing of the flood hydrograph. Although the magnitude of the flood flows are correctly estimated, they are delayed or advanced in time. The shape errors may demon-strate deficiencies in matching both the volume as well as the timing. Both the shape and the phase
errors generally reflect the failure of the routing component of the model to provide a satisfactory redistribution of the generated runoff volumes over time.
3.2.3.2 Models operating in updating mode
This approach is regarded as more efficient and suitable for flood forecasting models than non-updating models. It involves forecast updating based on the recently observed flows up to and including the time origin of the flow forecast. It also involves the most recent exogenous inputs (for example observations of rainfall and evapotranspi-ration) and, if available, the QPFs over the forecast lead time. Updating procedures for real-time flood forecasting for a given lead time attempt to reduce the errors between the forecasted flow values for the non-updated lead time and the corresponding values subsequently observed, irrespective of the sources of such errors.
There is still a lack of appreciation among model practitioners, and perhaps even some developers, of the significance of the relative contributions of the various factors to the goodness of fit of updated fore-casts, particularly with increasing lead time. Even a rainfall–runoff model that performs poorly in simu-lation, using badly estimated QPFs, may be salvaged by an efficient updating procedure to produce respectable forecasts (Tangara, 2005). While the use of an efficient updating procedure can substantially improve the accuracy of the forecasts for short lead times, at longer lead times this can be achieved only through the improvement of the simulation-mode forecasts.
With the exception of the procedure of parameter updating at each time step, the updating procedures outlined above are “non-adaptive” in that the param-eter values of the simulation-mode model are retained until a sufficiently extended record is available to justify recalibration. In the procedure of “adaptive calibration”, the model is effectively recalibrated at each time step, for example by Kalman filter (Szollösi-Nagy, 1976; Szollösi-Nagy, 1982; Szilágyi, 2003), as soon as new data become available, that is, at each
Figure 3.2. Definition of types of error between measured (___) and simulated (---) hydrographs
Source: Serban and Askew, 1991
a) Am plitude errors
Dis
char
ges
Dis
char
ges
Dis
char
ges
TimeTime Time
b) Phase errors c) Shape errors

MANUAL ON FLOOD FORECASTING AND WARNING3-6
consecutive time step the values of some or all the parameters or states may undergo some modification or updating. While this can be effective in improving the forecasts, it is difficult to justify such a short-term evolution of the model on physical grounds considering the quality of data generally available for this purpose. Adaptive calibration becomes extremely difficult in the case of a complex conceptual model or in that of a distributed model.
3.2.4 Typesofrainfall–runoffsimulationmodels
There are many good descriptions available in the literature of the evolution of rainfall–runoff model-ling. That of Todini (2007) is particularly useful as it is comprehensive, up to date and relatively unbi-ased. It is also a genuine attempt to reconcile the two main approaches to modelling, namely, the data-driven models (of both the empirical black box and the “physically inspired” conceptual types) and the more scientific “knowledge-driven” distrib-uted physically based models. The review discusses the relative strengths and weaknesses of different models, and indicates the fields and range of appli-cation of each approach. The various categories of rainfall–runoff models listed below:(a) Empirical data-driven rainfall–runoff models;(b) “Physically inspired” lumped conceptual
rainfall–runoff models;(c) Physically or process-based distributed rainfall–
runoff models;(d) Hybrid physically based/conceptual distributed
models;(e) Hybrid metric–conceptual models.
3.2.5 Snowmelt–runoffmodelsoperatinginsimulationmode
In many countries in cold regions, the contribution of snowmelt to flood flow is significant and requires the linking of land surface snowmelt models with the channel-ice hydraulic models. Even in countries that enjoy a temperate climate, such as Ireland, having a low seasonal temperature range with snow rarely falling on lower ground for more than a few days per year, some of the highest floods on record have occurred in those years when exceptional snowmelt and extreme rainfall have occurred together. In such circumstances, the estimation of snowmelt becomes an essential component of the flood forecasting system. The procedure for modelling snowmelt varies widely in complexity, from single-variable indices of melt to complete energy balances (Gray and Prowse, 1993). Normally the models are catchment-specific and extensive recalibration is required if they are to be used on another catchment, that is, they are not “portable” as regards their parameter values.
3.2.6 Modelsforforecastupdatinginrealtime
There are many ways in which recently observed flows can be used for updating forecasts (Refsgaard, 1997; Moore et al., 2005; Goswami et al., 2005) and various updating procedures are available (see for example Xiong and O’Connor, 2002; Xiong et al., 2004; Shamseldin, 2006). They differ in detail or in their mode of operation, but essentially they provide the hydrological simulation model with feedback information from the most recently observed flows to estimate errors and thereby improve the accuracy of forecasts. The updating procedures can either be continuous, that is, they are applied at each time step, or periodic, which involves periodic recalibration of the model. In the former case, the structure and values of the param-eters of the simulation model and of the updating procedure are usually left unchanged and only the output forecasts are changed. In the latter case, the associated model and the updating procedure are recalibrated at longer intervals. This can be, for example, when significantly more data become available or when the physical catchment descrip-tors or the river morphology have undergone change due to anthropogenic effects such as land drainage, land use changes or other conditions. Real-time forecast updating in event modelling is even more empirical and subjective due to uncer-tainty concerning the initial conditions. A schematic diagram of an updating procedure (after Serban and Askew, 1991) is given in Figure 3.3. The interested reader may also refer to the Operational Hydrology Report, 1992 (WMO-No. 779) on the simulated real-time inter-comparison of hydrological models.
3.2.7 The“multi-model”approachtorainfall–runoffmodellingandforecasting
3.2.7.1 The case for multi-modelling
In the traditional flood forecasting systems, a single substantive rainfall–runoff model or a more complex composite river-network model is usually used. Such a model may have been selected from among a number of competing alternative models based, perhaps, on model efficiency, familiarity, the peculiarities of the catchment and the available data. In this “model-centred” approach, the fore-caster may depend exclusively on the forecasts of the selected substantive rainfall–runoff model. There is clearly a potential danger in relying entirely on one rainfall–runoff model in such systems, as each model provides, through its forecast, an important source of information that may be differ-ent in some detail from those of the other models calibrated with the same data set. Moreover, the

CHAPTER 3. FLOOD FORECASTING METHODS AND MODELS 3-7
failure of the model to yield consistent and reason-ably accurate forecasts may undermine its credibility and the faith the user has in it. Hence, considera-tion may need to be given to the development of more flexible flood forecasting systems. These will not be based on a single substantive rainfall–runoff model, but will efficiently utilize the synchronous flow forecasts of a number of substantive rainfall–runoff models, each having different strengths and weaknesses, to produce improved flow forecasts. The combination of information from these differ-ent model sources would logically be expected to provide a more accurate and reliable forecast, this being a model “consensus”. Such forecasts are known in the literature as “combination”, “aggre-gation”, “consensus”, “committee” or “mixture” approaches. These are different to ensemble fore-casts, which are described in 3.2.7.3.
3.2.7.2 Forms of multi-model systems
In a forecast combination system, the ensemble of river flow forecasts of a number of rainfall–runoff models is used synchronously to produce a
combined flow forecast at each time step, through the aggregation of the results of available alterna-tive model structures, thereby avoiding reliance on a single model. This approach can also be applied to the ensemble of the forecasts obtained from alternative parameter sets of the same model, which produces near equal model efficiency. Although the number of studies that consider extensively the development and applications of multi-model flow forecasting systems is still rather limited, these studies demonstrate the potential capabilities of the multi-model approach in improving flood forecasting accuracy and reliability.
3.2.7.3 Ensemble or probabilistic forecasts
Ensemble or probabilistic forecasts may be considered as a particular category of multi-model forecasts. They are based on numerical prediction methods that are used to attempt to generate a representative sample of the possible future states of a dynamic system. Ensemble forecasting is a form of Monte Carlo analysis: multiple numerical
Figure 3.3. Schematic diagram of forecasting with updating
Simulationmodel
Qo
Qo
QUFUpdatingprocedure
QSF
QSF
Updated hydrograph
Simulated hydrograph
Observed hydrograph
tDate offorecast
Time
Legend:
Qo = Observed/measured hydrograph
QSF = Simulated forecast hydrographQUF = Updated forecast hydrographP = Precipitation forecastsM = Forecasts of other meteorological inputs, if any
(a) Block diagram of forecasting with updating
(b) Illustration of updating
Discharge
Lead time L
P and M
Source: Serban and Askew, 1991
Source: C. Perrin

MANUAL ON FLOOD FORECASTING AND WARNING3-8
predictions are conducted using slightly different initial conditions that are all plausible given the past and current set of observations or measurements. Sometimes the ensemble of forecasts may use different forecast models for different members or formulations of a forecast model. The multiple simulations are conducted to account for the two sources of uncertainty in forecast models: first, the errors introduced by chaos or “sensitive dependence on the initial conditions”; second, the errors introduced because of imperfections in the model. Using the output from a number of forecasts or realizations, the relative frequency of events from the ensemble can be used directly to estimate the probability of a given weather or flood event. Ensemble or probabilistic forecasts are more widely applied to NWP than to hydrological models, with the probabilistic outcome to a number of NWP runs being used to provide the “most likely” scenario for input into a hydrological model. Applying ensemble approaches to both NWP and hydrological models would be prone to producing results with a wide range of uncertainty.
3.2.8 Parametersinhydrologicalmodels
Parameters are used to express the functional relationships between the various subprocesses, and also to define the subprocesses in conceptual, physically based and hybrid physically based/conceptual distributed models. In the case of black box data-driven models, including artificial neural networks (ANNs), the parameters or weights simply define the parametric relation-ships between the model inputs and outputs. In the case of forecast updating models, if the updat-ing is a separate process to that of the simulation, for example if it is based on simulation errors, then each updating model will have a set of parameters different from those of the simulation model to which it is coupled. However, if the updating is built into the simulation model, that is, as an integral part of it, then both parameter sets are calibrated simultaneously and the good-ness of the forecasts cannot be separately attributed to each set.
Two types of model parameters can be identified. The first type has direct physical significance and can be determined either by direct measurement or by indirect estimation by relying on theoreti-cal or empirical relationships that relate such parameters to observable (measurable) character-istics of the watershed. Ideally, for physically based modelling all model parameters should be of this type. The second type cannot be measured directly but has to be calibrated, usually by auto-matic optimization, searching within the feasible or the behavioural range, that is, between physi-cal limits or thresholds, by matching the model
output to the corresponding observed discharge. In practice, most of the “physically based” models do require some element of calibration or at least fine-tuning of some of their parameters. In contrast, parameters of black box models, whether for simulation, updating or a combination of both, have no physical significance and must all be calibrated. (For a systematic and comprehen-sive treatment of model calibration and parameter uncertainty in the calibration process, see Duan et al., 2003, and Vrught, 2004.)
3.3 ROUTINGMODELS
3.3.1 General
Routing a flood through the concentrated storage of a reservoir, or the distributed storage of a reach of an open channel, is a mathematical procedure for estimating the changes in magnitude, speed and shape of an inflow flood hydrograph at one or more downstream points along a channel as the flood wave progresses downstream. The inflow hydrograph at the upstream section can result from runoff produced by precipitation on the upstream contributing area, an upstream reservoir release, or even a landslide into upstream reservoirs. The outflow hydrograph at the downstream section is characterized by a proportionally lower peak, a longer time base and a time lag between the peaks of the inflow and the outflow hydrographs, that is, attenuation (Mutreja, 1986). There are many excel-lent treatments of routing, including those of Dooge (1986), Beven and Wood (1993), Fread (1993) and Singh (1996).
Routing techniques are broadly classified as either hydrological or hydraulic routing, as shown in Figure 3.4.
Different forms of routing models have been devel-oped spanning a wide range of complexity and computational requirements. In comparison to hydrological routing, which is largely empirical and focuses on the relationship between the hydrographs at the upstream and downstream sections of a channel reach, hydraulic routing provides a more physically based description of the dynamics of flow, for example the velocity and depth as functions of distance and time. However, hydraulic routing requires details of the channel sections and much greater computational effort. As a prelude to exploring the possibilities of using two-dimensional dynamic wave routing, Rehman et al. (2003) provide a useful comparison of hydrological and hydraulic routing techniques applied in hydro-logical models, citing the limitation of hydrological models through the lumping of parameters in a

CHAPTER 3. FLOOD FORECASTING METHODS AND MODELS 3-9
simplified manner. Good literature reviews of such models can be found in Fread (1993) and WMO Technical Report No. 77 (2004).
3.3.2 Hydrologicalrouting
Hydrological routing models can be broadly classi-fied into two groups: first, the level-pool type used for concentrated or lumped storage, such as reser-voirs or lakes; second, the distributed storage type used for rivers or long narrow lakes. In both catego-ries, the models may be either linear or non-linear and either parametric or non-parametric. Although some authors (for example Fread, 1993) consider systems-type black box models as a separate cate-gory of routing model, this distinction is perhaps unnecessary as it is really based on whether the model has its origins in systems theory or can be interpreted as such. In hydrological routing, in contrast to hydraulic routing discussed later in this section, all the parameters are lumped and applica-ble only to the channel reach for which they were determined. The following characteristics of the two groups may be noted:(a) In level-pool reservoir routing, a level water
surface of the storage is assumed at all times. The water surface elevation changes with time and the outflow from the reservoir is assumed to be a unique non-hysteretic function of the water surface elevation and therefore of the storage in the reservoir. This method
can be used for reservoirs with uncontrolled overflow spillways such as the ogee-crested, broad-crested and morning-glory types. It can also be extended to gate-controlled spillways if the outflow can be expressed as a known function of the water surface elevation and the extent of gate opening (Fread, 1993). The “modified Puls”, the “Runge–Kutta” and the “Iterative Trapezoidal Integration” are exam-ples of level-pool routing methods.
(b) In the distributed storage type of routing used for rivers, a sloping water surface profile due to the passage of a flood wave is considered. The most popular routing of this type is the Muskingum routing method, in which a storage–discharge relation is assumed in which the total storage is the sum of the prism storage and the wedge stor-age in the reach. The method provides reasonably accurate results for moderate to slow rising floods passing through mild to steep sloping rivers or channels. Other storage type routing methods in this category include the “Kalinin–Miljukov” and “lag and route” methods.
3.3.3 Hydraulicrouting
In one-dimensional hydraulic routing, the flow is computed as a function of time at several cross sections simultaneously along the channel reach under investigation. This approach is based on the solution of the standard one-dimensional Saint
Figure 3.4. Classification of streamflow routing models
Source: WMO, 2004
STREAMFLOW ROUTING MODELS
Hydraulic models
Diffusonwavemodel
Kinematicwavemodel
Transferfunctionmodel
Linear
Muskingummodel
Hydrological models
Cascade ofreservoirs
model
Non-linear
Correlationmodel
ARIMAmodel
Statistical/stochasticmodels
Othermodels
LinearKalinin–Miljukovmodel
Lag androutemodel
Thresholdmodel
Non-linear
Dynamicwavemodel

MANUAL ON FLOOD FORECASTING AND WARNING3-10
Venant equations of open channel flow, that is, the “continuity” or “mass conservation” equation:
∂
∂+
∂∂
+∂
∂=
yt
DVx
Dyx
qb (3.1)
and, in dimensionless form, the equation of motion known as the “dynamic” or “momentum” equation:
S Syt
Vg
Vx g
ytf o= −
∂∂
−∂∂
−∂∂
1
(3.2)
where:g = is the acceleration due to gravity;y = is the flow depth;V = is the velocity;qb = discharge at section of width b;t = time;So = slope at bottom of channel;Sf = friction slope.
The assumptions used are:(a) The flow is one-dimensional;(b) The length L of the reach considered for routing
is many times greater than the flow depth y;(c) The vertical accelerations are negligible and
the vertical pressure distribution in the wave is hydrostatic;
(d) The water density is constant;(e) The channel bed and banks are fixed in time;(f) The bed slope of the channel is relatively small
(Fread, 1993).
Hydraulic routing based on the complete Saint-Venant equations is referred to as “dynamic routing”. The most commonly used dynamic rout-ing models are the “method of characteristics” and the “direct method”. In the method of characteris-tics, the pair of Saint-Venant equations and their corresponding consistency relations are first trans-formed into an equivalent set of four ordinary differential equations. These are then approximated by finite difference schemes to obtain the solution. Although conceptually elegant, in many practical applications this method has few advantages over the simpler direct methods. Direct methods can be “explicit” or “implicit”. In the explicit method, the differential equations are transformed into a set of algebraic equations that are solved sequentially for the unknown velocity and depth at each cross section and at each time step. In the implicit method, the differential equations are transformed into a set of algebraic equations that are solved simultaneously, at each time step, for all incremen-tal computational reaches. The implicit method is generally preferred over the explicit because of its computational efficiency. Finite-element methods
are also used instead of finite difference forms to solve the Saint-Venant equations, but are perhaps more appropriate for two- and three-dimensional flow computations. Whereas the full dynamic equa-tion is required for the solution of problems of rapidly varied flow, involving large values of the Froude Number, such as the “dam breach” prob-lem, simpler forms are adequate for normal routing. Thus, simplified forms of the Saint-Venant equa-tions, known as the “diffusion” and “kinematic”equations, are widely used.
For an elaborate treatment of hydraulic channel routing methods, including variable-parameter and non-linear variations of the Muskingum–Cunge and other diffusion wave approximations as special cases (for example the Koussis model, which has the improved “discretely coincident” modified form of the Muskingum model of Nash, and the Kalinin and Milyukov model), see Singh (1996), Knight and Shamseldin (2006).
3.4 COMBINEDCATCHMENTANDROUTINGMODELS
Catchment models are used to simulate the response of the catchment to produce runoff at a point which, depending on the type of model and scale used, may be the outlet of a hydrological response unit (HRU), that is, a parcel of the land-scape or distributed-model grid element, a subcatchment or the entire catchment. This runoff is then routed appropriately using different proce-dures, depending on the type of model and scale of application, to obtain the simulated flow at the point of interest in the catchment.
In lumped form, black box-type catchment models do not explicitly account for the water balance and the routing of runoff of the actual hydro- logical process of transforming the inputs to output. Instead, they consider the whole process in a lumped, integrated manner by way of system-theoretic linear or non-linear expressions. In this form, conceptual models generally involve some explicit routing of the runoff components generated by their various water balance modules, involving one or more routing elements. In some models, the generated runoff components are routed through one or more storage elements, for example the cascade-type (consisting of a series of linear reservoirs), with a parallel single linear reser-voir. For example, in the soil-moisture accounting and routing (SMAR) conceptual model, the Nash equal-reservoir cascade is used in parallel with a single linear reservoir, the former to route the quick response surface runoff and the latter the slow response groundwater runoff. In the case of the

CHAPTER 3. FLOOD FORECASTING METHODS AND MODELS 3-11
classic Sugawara tank model (Sugawara, 1995), there is no explicit process of flow routing. In this case the outputs from the four storage tanks are taken as being surface runoff, intermediate runoff, sub-base runoff and baseflow respectively, these becoming the components of the total discharge at the catchment outlet. Although the tanks provide a form of time lag, this is often insufficient and (as in many other models) an explicit time lag has to be introduced.
Explicit routing elements are incorporated into the distributed forms of the conceptual and the physi-cally based models. For example, in the Xinanjiang conceptual model (Zhao et al., 1980; Zhao and Liu, 1995), the generated interflow and groundwater components are routed through linear reservoirs that are then added to the surface runoff compo-nent to produce the inflow to the channel network. The channel network routing within a subcatch-ment is represented by the convolution of this inflow with an empirical unit hydrograph or by the “lag and route” model, the result of this convolu-tion being the outflow from the subcatchment. Finally, the subcatchment outflow is routed by the Muskingum successive-reaches model to produce the flow at the catchment outlet. Other distributed models include TOPMODEL (Beven and Kirkby, 1979; Beven, 1997 a, b), and the topographic kine-matic approximation and integration model (TOPKAPI: Ciarapica and Todini, 2002; Todini and Ciarapica, 2002). On the River Danube, the Hungarian Forecasting Service has experience over several decades of using a flood routing model termed the discrete linear cascade model (DLCM).
3.5 SPECIAL-CASEMODELS
3.5.1 Stormsurge
Storm surges are caused by a combination of low atmospheric pressure and strong winds, which raise the sea level on reaching the coastline. A drop in pressure of 10 hectopascal causes the sea level to rise by approximately 10 centimetres, depending on the topography of the seabed and how quickly the depression moves. Far from the coastline and in deep water, the rise in sea level caused by a low pressure (for example a cyclone) will remain limited. Close to the coastline, the dynamic effects increase in scale and magnify the storm surge. For example, a storm surge of 6 metres was observed during the arrival of Hurricane Hugo at the United States coastline in 1989 while, out at sea, water levels rose by less than 1 metre.
Two types of models, statistical and dynamic, can be used to forecast storm surges. Statistical models
require continuous recording of sea levels over a relatively long period, as this enables the model to be fine-tuned in accordance with a certain number of atmospheric predictors. Although this type of model is quick to calculate, forecasts can only be made for points where measurements have been taken. As calculation methods have developed, dynamic models are now used that enable storm surges to be forecast along the length of a coast-line. The use of digital models for forecasting storm surges is now a well-established technique and forms the basis for operational forecasting methods. Deterministic models, on the other hand, are based on solving equations representing the different components of physical processes. These models have to be adjusted in accordance with past events, with the value of certain param-eters being modified depending on the physical features of the environment (for example friction) and the flow characteristics (for example turbu-lence). The calculations involved require a long time to complete and users must have solid expertise in their use.
The same types of models are used for estuaries. Some management or water level forecasting serv-ices use mainly statistical models to establish a correlation between what happens at the mouth of the estuary and other sensitive sites. This is the case at the Gironde Estuary, France, where the High Water Level Forecasting Service (Service de Prévisions des Crues – SPC) still uses a statistical model for carrying out forecasts in Bordeaux, based on record-ings made on the Verdon River. These models can only be used in the area covered by the measured events.
However, new technologies have enabled new deterministic models to be developed that would formerly have been too unwieldy to use in a fore-cast application. The models are one-, two- and even three-dimensional. They are the same as those used at sea, but take into account friction on the bottom and banks of estuaries, as well as the modi-fication of water density caused by the coexistence of salt and river water and the presence of a high concentration of silt.
3.5.2 Flashfloods
Flash floods are rapidly rising flood waters that are the result of excessive rainfall or dam break events. Rain-induced flash floods are excessive water flow events that develop within a few hours of the occur-rence of the causative rainfall event, usually in mountainous areas or in areas with extensive impervious surfaces (see 3.5.3). Although most of the flash floods observed are rain-induced, breaks of natural (for example ice or temporary debris dams) or human-made dams can also cause the release of

MANUAL ON FLOOD FORECASTING AND WARNING3-12
excessive volumes of stored water in a short period of time, with catastrophic consequences downstream.
Flash floods can be extremely destructive and it is estimated that nearly one half of the United States annual flood damage and 80 per cent of the country’s flood-related fatalities in the decade prior to 2005 were caused by flash flooding (NOAA–NWS, 2005). On a global scale, the number of fatalities from flash flooding is disproportionately high when compared to other forms of flooding. Jonkman (2005) reports that fatalities stand at 4 per cent with respect to the total number of people affected by flash flooding, while for the other types of flooding fatalities are less than 1 per cent. Some projections of the impacts of climatic change have indicated an intensification of precipitation events that lead to flash floods.
Flash floods need to be treated as a hydrometeoro-logical event, rather than solely a hydrological one, to afford reasonable lead times for response. Real-time cooperation of meteorological and hydrological services is necessary for reliable flash-flood forecast-ing and warning. Similarly, flash-flood forecasting and warning services require continuous (24 hours per day, seven days per week) operations. Successful numerical models for flash-flood prediction require extensive and timely use of local precipitation and flow information, and effectively coupled systems (or even models) for short-term forecasting of these components (for example see Georgakakos, 1986). Accurate and reliable forecasting requires accurate data and forecasts on small spatial scales. It is neces-sary to take into account the properties of the errors associated with continuous spatial surveillance through remote-sensing platforms (radars and satel-lites) and spatially distributed forecasts produced by distributed hydrological models. Timely and effective communication of forecast uncertainty in flash-flood predictions is very important (see for example NRC, 2006).
3.5.3 Urbanflooding
By the year 2025 the world urban population is projected to increase to 5.5 billion, representing 61 per cent of the world total. Continued urbaniza-tion of natural floodplains has caused significant loss of life and damage to property and the trend is increasing alarmingly (NRC, 1991; Chagnon, 1999). There is a pressing need for advances in urban water management worldwide (WMO, 1994; Pielke and Downton, 2000; Dabberdt et al., 2000). A considera-ble volume of literature is available on urban hydrology and water management (see for example reviews in Urbonas and Roesner, 1993; Kovar and Nachtnebel, 1996; Dabberdt et al., 2000). The partic-ular characteristics of urban hydrology are, firstly,
the existence of large areas of impervious or near-impervious areas and, secondly, the coexistence of both natural and technological drainage systems (for example sewers, levees, pumps and detention basins). As a result, surface runoff production from rainfall is highly variable and non-homogeneous, and the flow of water and contaminants is acceler-ated towards higher peaks of outlet hydrographs. High spatio-temporal variability in rainfall is trans-lated into high spatio-temporal variability in runoff, as the urban catchments do not significantly dampen such fluctuations. The technological drainage and improvements in the natural drainage systems make for earlier and higher peak flows. With respect to hydrology impacts, the flood prediction and control problem becomes severe for events considered to have return periods of from 5 to 100 years (between 20 and 1 per cent chance of occurring in any given year) and attendant water quality problems can be severe.
Because of these characteristics, very high spatial and temporal resolution in data, models and controls over large urban areas is necessary for effective flood management (see for example Dabberdt et al., 2000). Thus, weather radar data combined with in situ automated raingauge data (Cluckie and Collier, 1991; Braga and Massambani, 1997; Georgakakos and Krajewski, 2000), GIS, digital terrain elevation data and distributed hydrological models (Kovar and Nachtnebel, 1996; Riccardi et al., 1997) are needed to develop urban runoff forecast and management systems. In areas where significant urban growth is combined with hilly terrain and convective storms (Kuo, 1993), there is an even greater need to develop systems capable of very high resolution over large urban areas.
Urban flooding can result from two causes. First, urban areas can be inundated by the rivers that pass through them overflowing their banks (fluvial flooding), and this can be accommodated by specific river stage forecasts. Second, urban flooding can occur as a special case of flash flooding from local drainage (pluvial flooding). In this case, intense rainfall over the urban area may cause flash flooding of streets and property in low-lying areas, in old waterways, underpasses and depressions in highways. Often such flooding is exacerbated by debris that clogs inlets to pipes and channels, or outlets of retention basins. Flood warning schemes similar to those outlined for flash floods can be employed, which consist of local automated flash-flood warning systems or generalized warnings that are based on national flash-flood guidance opera-tions. It is also possible to specialize the flash-flood guidance estimates for the urban environment on the basis of very high-resolution digital spatial data-bases of terrain, drainage networks (natural and technological) and existing hydraulic works.

CHAPTER 3. FLOOD FORECASTING METHODS AND MODELS 3-13
3.5.4 Reservoirfloodcontrol
Flood retention reservoirs, where available, can play a crucial role in flood control. For optimum operation of such reservoirs, reliable forecast esti-mates of the incoming flood flow over the time required for filling and emptying the reservoir are needed.
In the case of most reservoirs, whose primary purpose is water supply, flood operation is an important component of their management. The minimum draw down level (MDDL) is fixed from design considerations to meet the objectives of water use. Most floods can be expected to occur in the wet season, and even if the reservoir is full, some attenuation of the incoming flood hydrograph will occur due to the size of the reservoir, the outflowing flood being released through either uncontrolled or controlled spillways. Reservoirs are designed with particular characteristics defined by storage and outflow up to a maximum water level (MWL). However, in the case of very large floods, this design capacity may be exceeded and water may have to be released. Depending on the flood-ing scenario in the area downstream of the dam, which may already be critical during the wet season, such flood release from reservoirs may have devas-tating effects and effective management and control must be devised.
The controlling methods are designed on the basis of risk–benefit analysis, and the operation policies or rule curves are prepared to achieve the maxi-mum benefit from the storage capacity. It has been common practice in the past to base the operating rules on current knowledge of the available storage in the reservoir and, in the absence of inflow fore-casts, to include uncertainty estimates to improve the level of flood protection by more efficient reservoir operation.
In contrast, where the primary purpose of a reser-voir is flood control, the reservoir is maintained at the lowest possible level to contain any incoming flood. The flood water is gradually released from the storage depending on the capacity of the down-stream channel to safely propagate the released flow. After the passage of the flood hydrograph, modified by the temporary retention, the subse-quent incoming flow is continually released without storage until a new flood appears.
To operate for flood control in a multi-functional reservoir it is imperative that forecast estimates of the incoming flood are available. It is necessary that such forecasts are integrated with those for downstream riparian areas, as flooding in these areas may occur independently of any release from the upstream reservoir. The flooding scenario
downstream of the reservoir must be assessed to decide on quantities of flood water to be released from the reservoir to avoid aggravation of the downstream conditions. Generally, the objective in such flood control operations is not necessarily to retain the peak of the incoming flood hydrograph within the reservoir. It is rather to ensure the great-est possible attenuation at one or several downstream locations with an acceptable lag time.
In the case of a cascade of more than one reservoir on one river, or a number of reservoirs located on different tributaries of the same river, the operation becomes more complex but also provides more flexibility in operation. In such cases, all the reser-voirs must be considered as comprising a single system, as coordinated operation of all reservoirs will perform much more efficiently.
Many references on models and techniques of reservoir operation are available in the literature (for example, for the development of a reservoir-release forecast model, Bowles et al., 2004; for a monthly model for a single reservoir, Mariño and Mohammadi, 1985; both for daily operation of a multiple reservoir system and for multi-purpose reservoir operation, Mohammadi and Mariño, 1984; for optimization of large-scale, multi-purpose reservoir systems, Bonazountas and Camboulives, 1981; for a technique to determine reservoir opera-tion rules, Rohde and Naparaxawong, 1981; for the optimal operation of a single multi-purpose reser-voir by a dynamic programming model, Güitrón, 1981).
3.6 MODELAVAILABILITY
Models can be developed in-house by the flood forecasting centres or institutes if the required facilities exist. However, it is becoming increas-ingly rare for such developments to take place due to the complexity of modelling and systems management required. More commonly, the development may be contracted to a specialist consultancy, which in addition to the develop-ment and implementation costs will also require an ongoing licence fee for the use of the model, and ongoing arrangements for support and upgrades. Another source of well-established models is the World Wide Web. Downloads, free or at a price, are possible in many cases. However, these sources do not usually provide ongoing support, training and development.
Websites of modelling software inventories worth visiting are:– http://www.wmo.ch/web/homs/projects/
HOMS_EN.html (WMO HOMS);

MANUAL ON FLOOD FORECASTING AND WARNING3-14
– http://www.sahra.arizona.edu/software/index_main.html (SAHRA Hydroarchive);
– http://www.toolkit.net.au/cgi-bin/WebOb-jects/toolkit (eWater Catchment Modelling Toolkit);
– http://www.usbr.gov/pmts/rivers/hmi/ (United States Bureau of Reclamation Hydrological Modelling Inventory);
– http://effs.wldelft.nl/index.htm (European Flood Forecasting System).
In the United States the Sacramento model is used by the National Weather Service (NWS) for flood analyses, and in particular the “ALERT” version for real-time flood forecasting. In Canada various models of the continuous simulation type, with associated snow accumulation and melt compo-nents, are used for the management of large interconnected reservoir systems.
In the United Kingdom there has been a move away from individual catchment management agencies developing their own models, to a more integrated system, known as an “open architecture system”. In this system, core model structures are provided by a major specialist in flood modelling, but it is never-theless possible for some existing systems (legacy systems) to be incorporated. To increase the lead time for flood prediction, the system is coupled with state-of-the-art NWP models from the United Kingdom Met Office. The latest of these models is STEPS, which combines NWP and rainfall radar data.
In Germany, and especially for the rivers Rheine, Mein and Lech, techniques based on continuous flood models are used and in some cases, for exam-ple the Rheine at Koblenz and Kaub, Wiener filters are used. In France predominant use (for example on the Loire, Seine, Garonne and Saone) is made of event models based on transfer function identifica-tion techniques developed at the University of Grenoble (Nalbantis et al., 1988).
In Italy, the ARNO model, which incorporates linear parabolic routing on catchment slopes and in channels, has been used for many years as the core of the European Flood Forecasting Operational Real-Time System (EFFORTS). The system, origi-nally developed for the Fuchun River in China, was successively applied to the Danube in Germany as well as to several Italian rivers. In recent years, the TOPKAPI model, a physically based distributed model, has been incorporated into EFFORTS within the framework of the Multi-sensor Precipitation Measurements Integration Project (MUSIC) and is operationally active on the rivers Arno and Reno and nine additional smaller rivers in Italy.
In most eastern European countries the use of continuous models has been developed under the action of the WMO system HOMS, through which most of the rainfall–runoff computer programmes (CLS, Natale and Todini, 1977; SACRAMENTO; Streamflow Synthesis and Reservoir Regulation (SSARR); TANK; Continuous API, Sittner et al., 1969) have been made available, either directly or within the context of international cooperation projects (WMO–United Nations Development Programme (UNDP).
In Bangladesh, FFWC uses GIS techniques exten-sively to display water level and rainfall status that is used for the flood forecast model MIKE 11 FF. The centre uses a one-dimensional fully hydrody-namic model (MIKE 11 HD) incorporating all major rivers and flood plains, which are linked to a lumped conceptual rainfall–runoff model (MIKE 11 RR), which in turn generates inflows from secondary catchments within the country. In the Republic of Korea, a GIS-based Korean Flood Monitoring and Warning System (KFMWS) has been developed in B/S environment for five major rivers since 1987, and the system has been recently expanded for the flood control of several second-ary rivers.
The Mekong River Commission (MRC) presently uses mathematical models (SSARR, regression, ANN) to provided a three-day flood forecast during the rainy season for more than 20 locations along the mainstream, based on daily data from 37 hydrological and 22 rainfall stations.
China has largely developed its flood forecasting systems internally from a range of models. During the flood period, the National Flood Forecasting Centre of the Ministry for Water Resources carries
Flood forecasting models employed in the CNFFS
1. Xinanjiang model 10. SMAR model
2. API Model, AI model 11. NAM model
3. Jiangwan runoff model 12. Tank model
4. Hebei storm flood model
13. Sacramento model
5. Shanbei model 14. SCLS model
6. Xinanjiang model for semiarid areas
15. Index recession method
7. Liaoning model 16. Recession curve method
8. Double attenuation curve model
17. Unit hydrograph method
9. Double excess runoff yield model

CHAPTER 3. FLOOD FORECASTING METHODS AND MODELS 3-15
out real-time flood forecasts every six hours, on the basis of some 3 000 raingauge stations distrib-uted throughout the country, for the seven largest rivers (including the Yangtze, the Yellow River, the Huaihe River and the Pearl River) using the China National Flood Forecasting System (CNFFS). Many different flood forecasting models are employed in the system, including the Xinanjiang model (Zhao et al., 1980; Zhao, 1992; Zhao and Liu, 1995), and other models such as API, Sacramento, Tank, SMAR (Tan, 1996), and the synthetic constrained linear system (SCLS), as listed in the table.
In the United States the NWS of the National Oceanic and Atmospheric Administration (NOAA) is responsible for providing river and flood fore-casts for the nation. The NWS uses the National Weather Service River Forecasting System (NWSRFS), which contains over 30 hydrological models used in operational forecasting by 13 River Forecast Centres. In addition to NWSRFS, many other flash-flood forecasting models are used by Weather Service Forecast Offices (WFOs), which are staffed 24 hours per day, seven days per week, to provide general county-wide and site-specific forecasts for flash-flood warnings.


4.1 FACTORSAFFECTINGTHECHOICE
4.1.1 General
The main factor affecting the choice of a method or model for flood forecasting is the understanding and correct definition of the purposes for which the method or model will be used. Once the scope for which the model is being built is well defined and well understood, it is the availability of data that conditions the selection of the type of modelling approach. Approaches range from simple statistical methods to extremely detailed physical-process models.
With respect to real-time flood forecasting, the following additional factors have to be considered when selecting a model:(a) The choice of forecasting lead time versus time
of concentration (or travel time when dealing with routing problems);
(b) The robustness of the approach, in the sense that, when dealing with real-time forecasting, sudden instabilities or large forecasting errors must be avoided at all cost, even by resorting to slightly less accurate approaches;
(c) The computational time required, in that the forecast must be made available in time to the flood managers and dependent responders to guarantee the effectiveness of their decisions. Frequently, this requirement discourages the use of sophisticated and accurate, but time- consuming, approaches.
4.1.2 Choosingtheappropriatemodel
There is no specific type of model that can be chosen as the most appropriate for flood forecast-ing (refer to the review of model types in Chapter 3). Each category of models has its own advantages and disadvantages. As a general rule of thumb, the forecasting model must be used to reduce the forecasting uncertainty. However, there is also a balance to be reached between the model considered more reliable by the decision-maker, and, if the decision-maker has no views on it, the model considered most satisfactory according to the scientific knowledge of the developer. There are also practical considerations to be taken into account, such as the limitations introduced by the financial means available and the commercial avail-ability of a particular “off-the-shelf” model, provided through funding arrangements. In such cases, account has to be taken as to the intended
working life, the procurement cycle of the purchas-ing organization and the level of obsolescence inherent in software systems. There are a number of specific issues that may limit the use of one type of modelling approach with respect to another one, and these are considered in Boxes 4.1 to 4.3.
CHAPTER 4
CHOICE OF APPROPRIATE METHODS OR MODELS FOR FLOOD FORECASTING
Box 4.1. Data-driven models
Data-driven models are generally simple and easy to calibrate, but many end-users fear that the models could be less reliable beyond the range of the historical data on which they are based. Data-driven models should be preferably used where:(a) The predictand, namely the quantity of interest
to be forecast, is at a gauged river section (extension of their use to ungauged cross sections is practically impossible);
(b) Relatively long data time series are available that encompass most of the range of variability over time of the predictand;
(c) The required forecasting span is relatively short compared to the concentration time (or the travel time) of the catchment to the cross section of interest.
Box 4.2. Conceptual (hydrological) models
Conceptual models are the most widely used for flood forecasting. This is largely because they are more easily understood by flood managers (usually civil engineers) in that they try to describe rationally the different components of the hydrological cycle. This is achieved by using simple analogues of processes, whilst avoiding the “system engineer” jargon typical of data-driven models. Continuous time conceptual models should be used where:(a) The predictand is at a gauged river section
(extension of their use to ungauged sections is often difficult);
(b) Relatively long data time series are available that encompass most of the variability over time of the predictand;
(c) The required forecasting span is of the same order of magnitude as the concentration time (or the travel time) to the cross section of interest.
Event-type models (as distinct from continuous time models) should be restricted to cases where the initial conditions are known and thus do not have a significantly varying impact on response, for example when floods always happen during the same period of the year when the soil moisture content is high.

MANUAL ON FLOOD FORECASTING AND WARNING4-2
4.1.3 Lumpedversusdistributedmodels
The original conceptual hydrological models were inevitably lumped models. This reflected the limited computational resources available at the time, the lack of spatial description of catchment geomorphological characteristics and the limited point rainfall measurements that could be easily lumped in areal means. Over the past decade or so, many aspects have changed. Radar rainfall esti-mates are quite widely available as grid-based pixels of varying dimensions, from 1 to 5 kilometres being the size normally used. Digital terrain models (DTM) of several square kilometres, usually based on grids of between 50 to 500 metres (0.0025 to 0.25 square kilometres), have become available for many countries, along with soil-type and land-use maps. Computer capacity and speed has increased exponentially and large data and formulae arrays can be treated in very short times. An empirical rule (Moore’s Law) postulates that computer speed doubles every 18 months, and present-day micro-processors have greater capacity than early mainframe computers. This has enabled the recent development of large distributed models that can also run in real time, although examples of fully distributed models in operational real-time fore-casting are still rare. Most of the operational hydrological models in use are of the lumped type, generally configured as semi-distributed models to represent large and complex catchments (for exam-ple, the Sacramento, NAM, Xinanjiang and ARNO models).
Although the interest in the use of distributed, physical process-based models is increasing, at present only the TOPKAPI model has been opera-tionally implemented for flood forecasting on a
number of Italian rivers (the Arno, Tiber, Reno and Po, among others). The use of a distributed model instead of a lumped model has the advan-tage of making the best use of the distributed information on rainfall that is now provided by meteorological radars and by NWP models, although, conversely, lumped models can run faster. The physical nature of the parameters in the distributed models generally allows for a faster calibration from physical measurements or equations compared to the calibration of the lumped-model parameters, which is obtained either by trial and error or by automatic parameter-optimization techniques.
An important consideration for the comparison between the two types of models is their capability of being extended to ungauged catchments. It has been shown that, due to the lumping, the parame-ters in lumped models lose their physical meaning and are difficult to consistently correlate with the geomorphological characteristics of a basin. In contrast, the parameters of physical-process distrib-uted models can preserve the physical meaning up to a certain pixel size (generally, however, to dimen-sions of only a few square kilometres) and can be extrapolated to other catchments. In summary, although the tendency is towards the use of distrib-uted physical-process models, there are no strong reservations regarding the use of semi-distributed or even lumped models, as judged by the success of the end product in providing a sufficiently reliable service.
4.2 HYDROLOGICALSTUDIESTOSUPPORTMODELDEVELOPMENT
4.2.1 General
When developing a new flood forecasting and warning system, it is more likely that a pre-existing model will be used, rather than devel-oping a new, specific model from basics. The available models, however, still have to be custom-ized to meet requirements, and a full understanding of the hydrology of the catchment is necessary, underpinning the need for calibration and verifi-cation, which are covered in the next sections. Flood forecasting and warning systems are usually operated by national or regional catchment management agencies, and these have historical involvement with collection and processing of hydrological data, that is, data describing the vari-ous aspects of the water cycle. However, it is often the case that the historical data have not been collected for the purposes of flood studies, and this problem has to be addressed to provide a sound basis for flood modelling. This section deals with
Box 4.3. Physical-process models
In physical-process models, the different parts of the hydrological cycle are more specifically represented by mathematics of the physical process, for example fluid flow in rivers and through porous media in aquifers. In particular, spatially distributed process models should be used when:(a) Sufficient geomorphological and
hydromorphological data are available;(b) There is a particular requirement to extrapolate
the forecasts to ungauged locations;(c) The model computational time required is
sufficiently small to allow for timely forecasts;(d) The rainfall input is available in spatially
distributed form (for instance as pixels from radar output);
(e) The spatially distributed rainfall input shows marked variability over different parts of the catchment.

CHAPTER 4. CHOICE OF APPROPRIATE METHODS OR MODELS FOR FLOOD FORECASTING 4-3
establishing an understanding of flood hydrology, the data requirements and the need to re-evaluate historical data.
4.2.2 Understandingfloodhydrology
When developing models and systems for flood warning, it is fundamental to understand the causes of flooding in any given catchment or river basin. The size, shape and topographical structure of the catchment control the basic response to the key driver of flooding, which is the input of precipitation.
Land use, geology, soils and vegetation affect the speed of response of the catchment to rainfall, and the losses to soil and deeper recharge are also major features of flood response. The extent of urbaniza-tion is also important, not only through the introduction of impermeable areas, but also through the modifications to urban drainage through sewers, culverts and engineered river reaches, which act to increase the rapidity of response of flood flow in the catchment. The influ-ence of river and drainage controls can also introduce elements of uncertainty, through block-age, overflow of structures and the elimination of detention storage.
All of the above features can be parameterized to a greater or lesser extent by hydrological and hydraulic models of varying complexity. These are discussed in detail in Chapter 3 and also in 4.3 to 4.7 below. Simpler forms of flood estima-tion can be carried out using multivariate equations, which require estimates of the key components to be extracted from mapped infor-mation or other spatial data. It is essential as a preliminary to more detailed modelling for flood hydrologists to have a thorough understanding of the nature of the catchments involved. Information on catchment size and shape can be obtained from basic topographic mapping. Natural characteristics can be obtained from geological, land-use, soil and vegetation mapping. In more detailed models, man-made features and structures need to be identified and their opera-tional characteristics detailed from design reports and operation manuals.
The nature of the precipitation that causes flooding needs to be fully understood both in the context of events and seasonal climatology. Significant types of precipitation leading to flooding are:(a) Short-duration, high-intensity rainfall (often
localized);(b) Long-duration, widespread rainfall;(c) Snowfall and snowmelt;(d) Extended seasonal rainfall (monsoon
conditions).
The different types of precipitation will cause vary-ing responses in a given catchment, and the relative importance of the impact of different types of events need to be evaluated in order to define the most appropriate approach to developing flood warning. In areas where there is a regular and significant pattern of seasonal rainfall, a fixed observation network for rainfall and river levels can be established as the basis for the flood warning system. These can be distributed in such a way as to provided regular, spatial representation or located at key points with regard to flood risk.
Where rainfall is more infrequent, and often inher-ently more variable both in quantity and spatial distribution, the fixed, representative network approach is less suitable. These conditions, which are typical of more arid climates, are also more diffi-cult to model by the commonly available hydrological and hydraulic models. Typical prob-lems encountered in arid or semi-arid areas are:(a) Highly localized rainfall, which may not be
captured by raingauges, particularly if these are sparsely distributed;
(b) Highly seasonal rivers, with a large range of discharge and level. These are difficult to meas-ure with both structures or at rated sections by current meter, as channel conditions change during and after each flood event;
(c) Ephemeral rivers, which exhibit considerable losses through the channel bed along lower reaches;
(d) Major changes in the course of rivers and destruction of measuring devices by flood flows;
(e) Problems of maintenance and performance of monitoring equipment in harsh conditions, especially dust and heat.
Under these conditions, modern techniques of remote-sensing can prove more useful than conven-tional instrumentation. It may be possible to use satellite or radar-based monitoring for the observa-tion of rainfall. River conditions will need to be observed at suitable places for locations at risk, but it is imperative that these provide adequate lead time, as the high speed of flooding is also a common feature of arid and semi-arid regions.
Understanding the history of flooding in any catch-ment is very important. As well as being obtained from archived data collected for hydrological and meteorological purposes, information should be sought from general archive sources, especially newspapers and photographs. Older historical records are available from municipal authorities, estate archives and even chronicles from religious establishments. Flood marks on bridges and build-ings are also vital for the understanding of catchment flood behaviour and its potential

MANUAL ON FLOOD FORECASTING AND WARNING4-4
present-day impact. Such non-technical historical records are useful where data-based information is short, but they are also helpful as a check on recorded data. There is an unfortunate propensity in flood analysis to use only the easily available, electronic-format records, and ignore a wealth of information that can be gleaned through intelli-gent investigation.
The British Hydrological Society together with the University of Dundee has produced a Website, Chronology of British Hydrological Events (British Hydrochronology) (http://www.dundee.ac.uk/geography/cbhe). This is a public repository for hydrological facts and aims to provide material on the spatial extent of events, and may allow their relative severity to be assessed. Typical entries for a portion of the record for the Great Ouse catchment in northern England are presented in Box 4.4. The complete entries give considerable historical detail to augment the instrumental record, and also help the understanding of the cause and impacts of flood events.
Older editions of topographic maps can also be useful as they show settlement and communica-tions prior to modern developments. The older maps can show flood plains and river crossings before the unchecked expansion of towns and of most major engineering and road developments, which have in many cases ignored the presence of flood-risk areas. Old maps can also show the different courses that rivers occupied in even recent historical time. This information can reveal the dynamic instability of rivers, which could indicate the potential for a change of river course or major river training failure during an extreme event.
The focus of flood risk and the required responses for flood forecasting and warning have to be determined from detailed studies. This has lately been characterized by the approach of “Source-Pathway-Receptor”, as illustrated in Figure 4.1.
The understanding of flood hydrology must extend from the catchment and river system to the
Box 4.4. Typical entries for a portion of the record for the Great Ouse catchment in northern England
Year Month Details1866 11 1866 November 15–17: “The Ouse at York rose 15 feet above its ordinary level.”
1866 11 1866 November 15–17: “The Aire at Leeds rose higher than had ever been known before.”
1866 11 1866 November 15–17: Rainfall observer at Halifax (Well Head) noted “On 15th and 16th, 3.25 inches of rain, and between 13th and 17th 4.25 inches, the result being destructive floods in all the West Riding and Lancashire valleys. In the valley of the Calder the flood far exceeded anything within memory, and no old flood marks are so high as the present ones.” (River Calder)
1872 6 1872 June 18: Rainfall observer for Otterburn-in-Craven noted “The destruction of floodgates, culverts, and small bridges on the streams flowing down the sides of these ranges into the Ribble and Wharfe valleys was enormous on this day.” (River Wharfe; upper River Ribble)
1872 6 1872 June 24: Rainfall observer for Thorganby (Thicket Priory) remarked “ (...) these continuous thunderstorms have caused greater floods than have been known for 42 summers.” (River Derwent, Yorkshire)
1872 9 1872 September 26–28: Thunderstorm and floods in North Yorkshire.
1900 7 1900 July 12: “Bradford Beck drains an area of 10 915 acres. At Bradford Exchange rain between 3.10 p.m. and 6 p.m. was 1.31 inches (...) in the higher reaches of the Beck a violent storm was raging before the storm commenced in the lower part of the city (...) the storm travelled down the valley and reached Bradford Exchange 3.10, 1 hour and 25 minutes after it had reached Brayshaw about 3 miles away. On the high steep hills 3.30 inches fell in 3 hours. At Bradford Exchange 0.86 inches fell in 20 minutes. This enormous excess of water flooded Amblers Works and all the other works on the Beck, flooded all the shops and warehouses in the lower part of the City – turned Market Street, Forster Square etc. into rivers, causing great loss (...) over a large area. In general - wrought havoc and devastation the like of which was never before known. At Shepley, Bingley, Morton, Ilkley, low lands flooded for many miles along the course – uprooting trees, removing immense boulders. At Ilkley, bridges and houses were swept away. At Bingley, the Midlands Railway stood in a sea of water. At Sunnydale or Morton Beck - drainage area of 1 000 acres on which 4 inches fell in 2 hours – old disused reservoir constructed over 60 years ago - waste weir 30 feet wide by 3 feet deep – never before known to be full - not only full, but 9 inches in depth of water passed over the whole length of the embankment - equal to 61 000 cubic feet per minute.”
1901 11 1901 November 11–12: Rainfall observer for Todmorden (Fielden Hospital) noted “Heavy rain resulting in one of the worst floods known; many parts of the town were covered to a depth of several feet.” (River Calder)

CHAPTER 4. CHOICE OF APPROPRIATE METHODS OR MODELS FOR FLOOD FORECASTING 4-5
“targets”. These can range from scattered, poorly connected, rural settlements in flood plains subject to major inundations, to major urban centres with a concentration of high-value, sometimes critical infrastructure, for example hospitals. Both have specific time-critical requirements for the receipt of the necessary warning information of location and potential extent of flooding. The different targets may need varying approaches to provide the infor-mation for an effective response. For example, the rural, flood plain populations will need time to move livestock and property to higher areas or purpose-built flood refuges. Urban areas will need time for the organization of road closures and diver-sions, the erection of temporary flood barriers and possibly for evacuation.
An often neglected feature of understanding flood hydrology is the understanding of how floods decline after the peak is passed. This is important to know when access can be achieved, firstly, perhaps, by emergency vehicles and plant needed to initiate immediate repair works, and later to allow occupants to return to their property. Most flood warning systems include an “all-clear” or “out-of-danger” category in relation to river levels. However, many lower areas of major catchments, especially deltas, can remain flooded when higher levels in the river have declined. Catchments with a strong groundwater contribution can also remain
flooded from groundwater sources for extended periods.
4.2.3 Requirementsforanalyticalfloodstudies
Much of the previous subsection provides a qualita-tive approach to understanding flooding. The more quantitative analysis of flood studies relies heavily on measurement and calculation. The qualitative knowledge should always be used as a “reality check”. Flood analysis is fundamentally required to identify the characteristics of the relevant flood hydrograph for the catchment in question. In effect, the hydrograph provides the complete inte-gration of rainfall and catchment characteristics. When the flood hydrograph is considered in rela-tion to channel capacity and flood plain topography, then the two-dimensional nature of the level or flow quantity against time can be considered in a third, spatial dimension. The necessary informa-tion for analytical studies is obtained from:(a) Daily recording raingauges;(b) Water level recorders with rated sections or
measuring structures to provide river discharge measurements;
(c) Climatological data, particularly to provide esti-mation of evaporation losses and water balance;
(d) General topographical and land-use mapping to define catchment characteristics;
Figure 4.1. The source-pathway-receptor approach
Source: Hankin et al., 2008
Climate change: increased intensity of summer storms
Overland runoff and muddy flowing due to intense rainfall
Direct overland flow and ponding in low spots (sinks)
Flooding through all alluviais
Sources, pathways and receptors for flooding from other sources
Groundwater flooding due to raised water table
Surcharged sewer causes basement flooding
Sewer exceedance flooding
Urban creep: increased paving
Blockage or sewer collapse
Small reservoir or canal breach
Imprevious paved area

MANUAL ON FLOOD FORECASTING AND WARNING4-6
(e) Detailed topographic survey of the river and adjacent flood plain (the flood corridor or functional flood plain);
(f) Identification of areas at risk, which may require more detailed topographic survey and accurate flow measurement.
These data provide the building blocks for model studies, calibration of models and identification of the flood warning system requirements. Although similar to general flood studies, the focus on an operational forecasting and warning system requires accurate knowledge of timing of flood response and speed of flood movement. It is there-fore essential to have access to sets of information (at the very least, rainfall and flow) from various contributing portions of the catchment, particu-larly data from upper reaches. The essential requirements may be considered as the following:(a) Measurement of rainfall and runoff from main
upland portions of the catchment (watershed), to define early flood generation;
(b) Measurement of rainfall, runoff and timing close to the major confluence points within the river system, to identify time of travel and relative significance of different catchment contributions;
(c) Measurement of river levels, flows and flood plain characteristics upstream of high-risk areas;
(d) Identification of drainage congestion problems in lowland areas, needing accurate water level measurement and timing;
(e) Local rainfall data in areas of drainage conges-tion and urban areas, to identify pluvial flood risk.
It is not possible or cost-effective to instrument every subcatchment within a flood warning area. If a sufficient sample of observations is obtained from representative catchments, for example urban, rural, steep and low-lying, then modelled relation-ships can be established to synthesize behaviour in ungauged catchments. Most commercially availa-ble models used as the basis of flood warning systems have the facility to use data to calibrate model algorithms and parameters and contain opti-mization techniques to apply these to ungauged catchments.
Analytical flood studies will require many years of data encompassing enough events in terms of magnitude and impact to build up an effective model. This will require both general and specific data. However, the broader public need for a flood warning service is often such that time is not avail-able for extended studies and analyses to be carried out. In fact, most modern, model-based flood warn-ing systems have evolved from manual systems, which were set up with manual field observations
and simple graphical techniques for hydrograph forecasts, time-of-travel and gauge-to-gauge corre-lations. Modern systems still rely heavily on an evolutionary approach to maintain and improve flood warning, as discussed in 4.2.4.
4.2.4 Ongoingdatarequirementsformodellingsupport
A flood warning model only provides a single representation of a complex system, which changes over time to a greater or lesser degree. River channels and systems change morphologi-cally over time through long- and short-term cycles of erosion and deposition. Catchment char-acteristics change over time, sometimes in very significant ways, especially land use, urbanization, change of forest cover, or the introduction of major management structures, such as dams, reservoirs and flood protection structures. Thus, the basic catchment descriptors used to develop the model need to be checked and updated, and recalibration carried out, as required.
As further events are experienced, the model param-eters will need modifying and refining. It is particularly important to establish any differences in flood behaviour during the “normal” range of flooding and behaviour during more extreme events. Events with long durations and wide geographical extent can also produce differing responses from the interrelated catchment and river systems compared to a discrete event over a single catchment. All this requires that models should be frequently checked and recalibrated, particularly in the early years of model operation. Thus it is certainly not an option to close observa-tion stations once the initial model and warning system is in place. The importance of continued support and investment in models needs to be made clear in the strongest terms to the financial controllers of a flood forecasting and warning system.
A periodic review of flood forecasting and warning performance and model recalibration is recom-mended as standard good practice. At the end of each event it is recommended to check the perform-ance of field observations and note periods of breakdown of instruments or data transmission. If this is carried out each time, it becomes straightfor-ward to identify any particularly sensitive parts of the network and to refine programmes of maintenance.
Where discharge measurements are important (as opposed to simply measurements of level), particu-lar importance needs to be given to the calibration of rated river measurement sections. In rivers with mobile beds, which are commonly encountered in

CHAPTER 4. CHOICE OF APPROPRIATE METHODS OR MODELS FOR FLOOD FORECASTING 4-7
upland reaches and in active delta areas, frequent current metering is required to check and recali-brate the rating curve. It is essential that the most up-to-date rating relationship is used, and this may entail some recalibration of the flood warning river model.
More stable river sections may also be altered by a high flood through erosion or deposition, so these must also be checked. Sometimes the only indica-tion that data problems exist, for example erroneous discharge or rainfall data, is when model results are problematical. It should not be an immediate response to try to recalibrate the model to produce a better fit, but to carefully investigate the cause from both sides, observation and modelling.
Rated structures such as weirs or ultrasonic sections used for flow estimation are designed for specific conditions and may not be adequate to measure high flood flows, particularly when banks are exceeded. Estimates of high flow should be made by extrapolation of the rating curve by a mathe-matical equation, or by a hydrodynamic model of the channel and adjacent flood plain. Both of these require that the river and flood plain cross-sections are accurately surveyed, and that correct values of roughness are applied to ground cover. Attention needs to be paid to seasonal changes in vegetation cover on the flood plain or weed growth in the river channel.
It is common for checks of field instrumentation and sites to be carried out by a general hydrometric unit within the water management structure. Their routine of inspection is geared to “normal” condi-tions, and may entail annual or longer intervals. This is unlikely to be sufficient for the purposes of the flood warning operation. Specific arrangements may need to be established between the flood warn-ing and hydrometric units to allow extra inspection and measurement to take place. The practice of carrying out a site inspection by senior members of the flood warning team following major flood events, or at the end of the flood season, as done by the Bangladesh Flood Forecasting and Warning Centre, is strongly recommended.
4.3 MODELCALIBRATIONANDDATAREQUIREMENTS
4.3.1 Mainobjectives
Ideally the objective of calibration is to remove all possible bias and eliminate all possible noise included in the model. In reality, because of the constraint of input data quantity and quality, and
simplistic assumptions that may be inherent in the model, care should be taken to achieve the proper balance between the calibration objectives and goodness-of-fit statistics. Sometimes, the latter may have to be sacrificed somewhat in order to achieve spatial consistency of the parameters.
Generally, there are three main objectives when calibrating conceptual hydrological models to an entire river basin for river forecasting applications:(a) Produce a good reproduction of the observed
hydrograph at each individual key forecast point on the river system: the aim is to achieve a fit that contains the minimum amount of error bias possible, that is, all errors are random. This includes all types of bias: overall bias, bias related to the magnitude of flow, seasonal bias patterns, bias related to specific catch-ment conditions, for example snow and soil moisture. The amount of random error in the forecast output data should be largely a func-tion of the random error associated with the input variables, especially precipitation. Errors in the amount of precipitation, as categorized by the typical spatial variability of this input variable, are the primary reason that lumped models do not produce consistently satisfac-tory results over all areas.
(b) The parameters of the models should func-tion as they are intended: conceptual models were designed to have a physical basis and the parameters control portions of the models that represent specific components of the over-all process. The effects of each parameter are designed to be reflected in specific sections of the simulated hydrograph, for example rate of rise, peaks and flood volume. To be consistent with the physical basis of a model, and to produce results that will not only best reproduce the full range of historical observa-tions, but also be most likely to extrapolate correctly beyond what was observed in the available historical record, each parameter should be used as it was intended. This means that parameters should not be adjusted or weighted intuitively to modify the final output statistics.
(c) There should be a realistic variation in param-eter values from one area (headwater, local, or subdivision within a drainage) to another within the river basin and compared to areas in adjacent river basins: changes in parameter values from one area to the next should be explainable based on changes in physiographic factors, climatic conditions or hydrograph response. Not only is this objective reasonable from a physical point of view, but if adhered to, it becomes much easier to monitor and under-stand operational variations and run time adjustments to state variables.

MANUAL ON FLOOD FORECASTING AND WARNING4-8
4.3.2 Calibrationmethods
Model calibration in hydrological and hydraulic modelling has been tackled with a wide variety of approaches, mainly in relation to the chosen type of model. For the sake of clarity, it is important to point out what is meant by model calibration. In general, this means that, conditional to the choice of a specific model, its parameters will be adjusted to make the predicted values of the model resemble the observed ones. It is also important to recognize that model parameters may not fully incorporate a physical meaning, but are mostly uncertain quanti-ties that reflect all the sources of error. In which case, parameter estimation, and consequently model calibration, loose their original meaning, and the full probability density of the parameters must be derived, as will be discussed in 4.7.2 and 4.7.3. Moreover, if we consider that the parameters of a physical-process model have a clear physical meaning and are marginally affected by the scale of the representation, the parameter values should not be estimated but set to reflect the a priori knowledge. The reason for this lies in the fact that parameter estimation (particularly when using least squares techniques) tends to discard the extremes in the predicted values, since the method generally aims at preserving the central moments of the observed quantities.
There are two basic methods for the calibration of hydrological models. A priori estimation of param-eters is available for many models. An initial estimate of parameters of physically based models such as Sacramento can be accomplished by relat-ing them to physical features of the basin such as vegetation, soils and basin geometry, and can be used to predefine the likelihood of parameter values. In many instances, this may be the only approach possible to define some model parameters because of the absence of valid data:(a) The trial and error method: The user’s knowl-
edge of the model and how each parameter affects the results are used to control changes to parameter values. Decisions as to which parameters to change are made primarily by comparing simulated versus observed values, especially hydrograph plots. This procedure is most effective when interactive, graphical soft-ware is available to view the results and make parameter changes. The calibration is finished when the user subjectively determines that the objectives have been met.
(b) Automated parameter optimization: In this method, various computer algorithms are used to achieve the best-simulated reproduction of observed values, for example the Newton, Rosenbrock, simplex or generic algorithms. These algorithms contain strategies for varying the values of user-specified parameters in an
attempt to obtain an optimal fit. Typically, the user can apply limits on the range over which parameter values can vary, in order to obtain more physically realistic results.
The quality of the end result may often be deter-mined by a single, statistical, objective function, such as the minimization of the root mean square error (RMSE) of a daily dataset. Sometimes a series of steps are used in which different groups of parameters and different objective functions are used at each step. In some approaches multiple objective functions are used to try to find a group of parameter sets that will produce acceptable results based on several criteria. The user then has the option to choose subjectively from this group of parameter sets. Automatic optimization has been used primarily for the calibration of individual catchments, mainly in smaller headwaters with a good degree of homogeneity. The strategies availa-ble for using automated optimization over major river basins are limited.
The biggest difference between the two methods is that the trial and error method allows for the user to maintain a subjective appreciation of the physi-cal basis of the models, whereas the automated method relies on various algorithms to achieve a statistical best-fit determination of the parameter values. How to use the two methods depends on the given situation. The biggest obstacle for the successful use of the trial and error method is the time required to develop a knowledge of the model structure and how to isolate the effects of each parameter. So, for an individual watershed, auto-mated optimization methods can, in many cases, achieve a good simulation of streamflow quicker than the trial and error method. For a large area such as an entire, major river basin, the trial and error method can be used in a more efficient manner than automated optimization methods, because it can produce parameter sets for separate, individual subcatchments that meet all the listed objectives.
4.3.3 Basicstepsincalibration
When calibrating any hydrological model for a river basin there are five steps that it is recom-mended to follow:(a) Gather information and data: this includes all
available historical data, plus a determination of what real-time data are available. It requires obtaining:(i) Maps and datasets that describe physi-
ographic features such as topography, vegetation, and soils;
(ii) Analyses of the variability of quantities such as precipitation, temperature, evap-oration and snow cover;

CHAPTER 4. CHOICE OF APPROPRIATE METHODS OR MODELS FOR FLOOD FORECASTING 4-9
(iii) Information about control structures and their effect on streamflow;
(iv) Data on diversions into or out of the basin, or between catchments within the basin and any irrigation effects.
Information is also needed on current and possible future forecast requirements. After all this information and data are gathered, the pertinent values need to be accessed and put into the form needed for further processing.
(b) Assess spatial variability of hydrological factors: the next step in the calibration process is to analyse the gathered information and data and to establish how the various hydrologi-cal factors vary over the river basin. Amongst these factors are included the variables such as precipitation, temperature, evaporation, snow cover and also features such as topogra-phy, vegetation, soils and geology. The spatial variability of conditions over the basin, as well as any existing monitoring facilities and high-flood-risk sites, are very important factors in determining which streamflow points should be included in the calibration. Understanding climatic variability over time may determine the methods used to analyse and process the historical data. It may also be necessary to determine whether a major catchment needs to be subdivided into elevation bands or accord-ing to significant variability of geology, soils or vegetation. This analysis of spatial variability will also be of great benefit in predicting how model parameter values might vary over the river basin. It may also form the basis for select-ing initial parameter values and for assigning values to model parameters for portions of the basin that cannot be calibrated due to lack of suitable data.
(c) Analyse historical data and prepare them for use in hydrological models: the objectives at this step are to make accurate estimates that reflect the statistical characteristics of the phenomena as they occur. It is necessary to ensure as far as possible that there will be minimal bias between historical and opera-tional estimates of data quantities. Checking the historical records for consistency, accuracy and reliability is another important step in precalibration analysis. Checking the validity of all input time series, especially precipitation and stream gauge data, is required to assure realistic parameter values can be determined. Typical analyses involve the generation of areal average values of precipitation, tempera-ture and evaporation for the local drainage above each simulation point. Time series anal-ysis may be necessary to reveal the statistical structure, especially relating to ranges and vari-ability of data items. Analysis may also reveal
whether catchment subdivisions are required, not just semi-intuitively based on topographic or geological grounds, but as may be revealed through different flood hydrograph shape. This step also includes the adjustment of flow (discharge) data, to account for diversions and other factors. This enables a “naturalized” flow series to be created, which allows direct calibration with other inputs into the hydro-logical balance. The regional or catchment water balance computations are an impor-tant part of this step to ensure that the model components representing the hydrological cycle are physically reasonable and consistent.
(d) Select flow points and period of record for cali-bration: the determination of where stream flow is to be simulated during the calibration process is dependent on a number of factors. These include the availability of historical stream flow and reservoir data, and the location of current and future forecast points, including those needed to meet all user requirements. The length of record to be used for calibration is dependent on the period of record of the historical data, especially concerning precipita-tion and stream flow. These have invariably a history of growth from a few initial stations, through periods of expansion, and often a decline due to factors including rationalization, a change of operating agency and sites becom-ing unsuitable. The aim should be to identify a suitable period when maximum levels of good quality data are available over a large propor-tion of the catchment to be modelled. It is also essential to establish the influence of physical changes that have occurred within the basin over the selected data period. These can include the building of control structures or diversions, increases or decreases in irrigated acreage, and vegetation and land use changes. It is necessary to distinguish between the period of data used to analyse the behaviour of the catchment and the period used for calibration proper. In the first case, as long a period as possible should be used, this being dependent on the length of the available historical records, the consist-ency of the historical network over time and the type of forecast products to be generated. In the second case, the period of record to use for calibration is usually a subset of the full histori-cal record, and should cover a period of a few years when a high proportion of all data types is available. The calibration period is usually taken from the more recent records, where confidence in data is high (although this is not necessarily the case, as many countries, unfor-tunately, show a decline of data availability and quality in recent years).
(e) Implement calibration results for operational use: this final step in the process integrates

MANUAL ON FLOOD FORECASTING AND WARNING4-10
the results of the data analysis and the model calibration into the operational systems. It is necessary to ensure that the operational imple-mentation of the results does not produce any bias between the operational application and the historical simulations produced during cali-bration. Managers of the operational system must still try to reduce random variations to a minimum through the use of new data sources, dynamic data analysis methods and real-time model adjustment techniques. Bias can occur due to differences in data networks, in data types and data-processing methods, and to operational modifications made to state vari-ables.
4.3.4 Datarequired
Points (a) and (b), following, consider the type and duration of data required for model calibration:(a) Data types: The data for calibrating a concep-
tual hydrological model to an entire river basin or catchment are, as discussed previously, basic information and historical (statistical) data. Basic information includes norms and areal climatological information, and may be represented as area distribution maps, for example isohyetal maps. It also includes spatial (geographical) and physical information on the nature of the river system, vegetation cover, land-use, soil classification and geology. Once again, maps or GIS layers are a convenient means of holding such data. Information on the built environment and river control structures can also be represented in this way. Histori-cal data include, as mentioned previously, all relevant hydrometeorological datasets. These are generally in the form of time series datasets, where the item of data may be an hourly, daily or monthly observation or estimate. Histori-cal time series can be analysed to provide the statistical characteristics of any variable, and within the bounds of good scientific method can be used to estimate extreme values outside the period of the data record (extreme-event analysis). Historical data can also be used to reconstruct major storm events of the past to provide information on depth, area and dura-tion, which will help to define the structures of the model and the real-time data provision systems.
(b) Historical data length: There are no hard and fast rules to stipulate an optimum period of record needed for the calibration of a fore-casting model from historical time series. In general, the longer a record length the better, so that a wide range of conditions can be included. Commonly, meteorological and hydrological services aim for “standard peri-ods” of about 30 years. A distinction must be
made between the requirements for model development in general, and the more specific focus of a flood forecasting model. The follow-ing may be considered:(i) The longer the period of record the
greater the chance that the data noise will be random, thus resulting in unbi-ased parameter values. In areas where the model results are generally marginal, a longer period of record is needed in order to contain enough events and to mini-mize the noise caused by the typical large spatial variability of rainfall that occurs in these regions. In regions where model results are typically unsatisfactory it is unlikely that any length of record will be sufficient to determine parameter values with any significant degree of confidence. It is recommended that besides the period used to calibrate the model parameters, another period be used for verification of the calibration results. This period should ideally be at least as long as the calibration period: the validation period recommended by WMO is two years. Verification is discussed in more detail in 4.4.
(ii) In catchment areas where the physical characteristics have remained more or less constant over the period used to generate the input time series, any portion of the period that contains sufficient variability in hydrological conditions can be used to calibrate the models. However, in areas where there are significant changes in vegetation or land use, the portion of the period of record that should be used to calibrate the models is that which most closely reflects current conditions.
4.3.5 Generalrequirements
There are a number of other factors that are important for the completion of a large-scale cali-bration effort in a reasonably efficient manner and to achieve good quality results. It is a fallacy to consider that if a commercially available model is to be used as the basis of a flood forecasting model, that this presents an “off-the-shelf” solu-tion. Some of the most important requirements are knowledge, experience, teamwork and leader-ship for the people involved. It is necessary to maximize the benefits of the computerized tools available, and follow proven procedures and strategies:(a) Knowledge and experience: It is important,
when starting work on model calibration, that sufficient time be allocated for team members to learn about the modelling process and to understand the characteristics of the

CHAPTER 4. CHOICE OF APPROPRIATE METHODS OR MODELS FOR FLOOD FORECASTING 4-11
catchments for which the model is being developed. This will pay large dividends when the eventual operators start to use the models and procedures to produce operational forecasts. Those that have gained a reasonable level of experience should be assigned to mentor those that are new to model calibration. If a person receives the proper training, the right guidance and a reasonable period of time to gain some experience (in the order of six months), they should be able to become a productive member of a calibration team.
(b) Teamwork: The total model calibration and implementation process involves having people with skills in areas such as data analysis, the development of parameters for routing models, hydrodynamic modelling of river reaches, reservoir operations, operational procedures and the application of GIS. Thus, calibration is a team effort and it is important for its success-ful completion to have people with a variety of skills involved and to make maximum use of the abilities of each team member to accom-plish the final goal.
(c) Leadership: It is equally important that the team has the proper leadership and that the results of the project are carefully monitored and evaluated. Leadership is generally best provided by someone with experience in, and a good knowledge of all aspects of the calibration process, and who also has a full appreciation of the final model requirements. They should also have the necessary leadership skills to work with the other team members and be able to clearly communicate goals, progress and resource needs to those at higher levels within the organization, whose main interests are in outcomes and results.
(d) Computerized tools: For the overall calibra-tion process to be done in an efficient manner, a number of computer tools must be available and used properly. These tools include statis-tical analysis routines for the processing of data, GIS applications to display information and generate new data fields, and interactive, graphic interface programs that allow the user to better understand the outputs of models and to interact with the models and data.
(e) Follow proven procedures and strategies: Innovation is sometimes required during the calibration process, but there is much that has already been tried and learned and in many cases procedures are integrated within established programme suites. Many of the procedures and strategies for model development have been tested and proved, which will make the procedures efficient and more likely to produce consistent, quality results. It is much better to follow these procedures and benefit from this experience than to try to invent new methods.
It is for these reasons that a number of “stand-ard”, internationally available models are used as the basis of most national and regional flood forecasting systems. Principal provid-ers of these suites of programmes include the Danish Hydraulic Institute, Delft Hydraulics, HR Wallingford and the United States Corps of Engineers. As well as having the benefit of many years of experience, these providers also have the capacity to provide support, trouble-shooting and maintenance for models.
4.4 MODELVERIFICATION
4.4.1 Numerical-modelverificationcriteria
The validation period used for verification should be long enough to incorporate several observed flood events, so it may need to be of two or more years extent. A number of statistical methods are available to determine the success or otherwise of verification, and these can be applied to all model estimation points. Common analysis methods are:
Root mean square error: RMSEQ Q
N
i ii
N
=−
=∑( ˆ )2
1 (4.1)
Average absolute error: (4.2)
Explained variance: (4.3)
Nash-Sutcliffe coefficient: (4.4)
Coefficient R2: (4.5)
where:i = time step;N = total number of time steps considered;Q̂i = computed discharge at the i-th time step;Qi = observed discharge at the i-th time step;Q = mean observed discharge;Q̂ = mean computed discharge.
Comparing hydrographs provides a qualitative evaluation of the simulation skill, as the graphical representation permits a quick comparison between simulated and observed levels within a time frame.
AAEN
Q Q
Qi i
ii
N
=−( )
=∑1
1
ˆ
NASHQ Q
Q Q
i ii
N
ii
N= −
−( )−( )
=
=
∑
∑1
2
1
2
1
ˆ
EVQ Q
NQ Q
Q
i i i ii
N
i
N
i
= −
−( )− −( )==∑∑
1
1
1
2
1
ˆ ˆ
−−( )=∑ Qi
N 2
1
[ ]
[ ]2
RQ Q Q Q
Q Q Q
i ii
N
ii
N
i
2 1
2
1
=−( ) −( )
−( )=
=
∑
∑
ˆ ˆ
ˆ −−( )=∑ Q̂i
N 2
1
2
[ ]

MANUAL ON FLOOD FORECASTING AND WARNING4-12
This allows useful comparisons to be made with alarm levels and forecast lead time. The accurate representation of flood volume is also important, in that it demonstrates how effective the model is at relating the rainfall and runoff responses, and with regards to flood modelling, especially for out-of-bank flows. The shape characteristics of the modelled and observed floods can be tested by the following parameters:(a) Peak percentage difference between observed
and simulated floods:
(4.6)
where:Qmax = observed peak flow;ˆ
maxQ = simulated peak flow.
(b) Phase difference of the peak flow (hours):
Dt h t tmax max max= − (4.7)
where:tmax = time (hours) at which the observed peak
reaches the control section;
m̂axt = time (hours) at which the simulated peak reaches the control section.
For selected flood events it is also recommended to test performance by defining a water stage thresh-old level to compare the time and volume of both the observed and computed hydrographs above the threshold. This could be done for a proposed or existing alarm or danger level, or a flow exceed-ence category, for example the level exceeded by 10 per cent of the flow values.
The volumetric difference can be evaluated as follows:
(4.8)
(the per cent difference between observed and computed volumes)
Volume control = (4.9)
Chiew and McMahon = (4.10)
Willmott = (4.11)
where:V = observed volume;V̂ = corresponding simulated volume;V = mean observed volume.
4.4.2 Graphical-modelverificationcriteria
As an alternative to numerical verification criteria, several graphical verification criteria have been advocated for their immediateness in the identification of quality of fit. These graphical veri-fication criteria range from simple plots of observed and forecasted values, scatter plots of the two quan-tities, to several types of mass plots. These methods are important and should always be used as a basic control check, and will also build the ability of the staff to understand the model and the meaning of data.
4.4.3 Forecastverificationcriteria
Forecast verification is somewhat different from the model verification described above, and has been an established feature of meteorological best prac-tice for some time. A number of criteria exist to verify forecasts and the evaluation is used to improve models and to develop confidence in deci-sions made according to forecasts. A selection of criteria, together with their rationale, is summa-rized in a document made available to the public at the Australian Bureau of Meteorology Website: http://www.bom.gov.au/bmrc/wefor/staff/eee/verif/verif_web_page.html.
The hydrological community has recently begun to adopt some of these criteria. Examples include the skill scores known as probability of detection (PoD), false alarm rate (FAR), the relative operating characteristic (ROC) and the Brier skill score. There has also been progress in evaluating the economic value of the forecasts, for example with the Relative Value (RV) score. It is recommended that the use of these techniques should become more widespread amongst flood warning practitioners, to gain a full perspective of the usefulness of hydraulic and hydrological models and to improve operational decisions.
“Continuous measures” such as bias (mean error), the root mean square error (RMSE) and the mean absolute error (MAE) all measure differences between forecast and actual quantities in numerical terms. There is no absolute measure of what consti-tutes a “good” or “poor” score. However, after a period of use it can be decided what ranges are acceptable for the application in question. The methods will provide a means whereby successive sets of results will indicate whether the accuracy of measures are improving or not.
In the case that forecasts relate to a threshold, either a quantity or a time, for example a flood peak fore-cast, then appropriate measures will be used based on the contingency table or “categorical measures” approach. These may include the hit rate (HR) or
[ ]
QQ Q
Qmaxmax max
max
%ˆ
*=−
100[ ]
VV V
V%
ˆ*=
−100D [ ]
1− −∑∑
∑∑
ˆ
ˆV
V
V
V( )1
2
2−−( )−( )
∑
∑
V̂ V
V V( )1
2
2−−( )
−( ) + −( )( )∑
∑
ˆ
ˆ
V V
V V V V

CHAPTER 4. CHOICE OF APPROPRIATE METHODS OR MODELS FOR FLOOD FORECASTING 4-13
PoD, FAR (which is 1 / probability of occurrence [PoO]), and the threat score (TS) or conditional success index (CSI). These measures allow a target index to be established, whereby an ideal level of successful achievement, for example 75 per cent, could be defined in terms of numbers of hits, misses and false alarms. The following explanations of measures and their use are taken from a report by the United Kingdom Met Office (Golding, 2006):
TS or CSI: TS = hits / (hits + false alarms + misses): TS is a composite of the hit and false alarm rates, which gives equal weight to misses and to false alarms, but ignores correct rejections. It is therefore “event” orientated, but takes no account of the potentially large cost–loss ratios that might arise from extreme events. This score can be a helpful general indicator of the ability to forecast an uncommon event. In common use, a threshold of 33 per cent is often taken for a useful forecasting system, based on a 50 per cent HR and a 50 per cent FAR.
PoO: PoO = hits / (hits + false alarms); 1 / PoO = FAR: if the event is forecast, the interest is in the probability that it will actually occur (or equiva-lently in the FAR, that is, the probability that it will not occur). For a high-impact event, false alarms are more acceptable than misses, so a lower probability of occurrence is acceptable. On the other hand, if the PoO is too low relative to the action that is to be carried out, it will be ignored (the “crying wolf” syndrome). In Golding’s report (cited above) he notes that a PoO of less than 10 per cent is unlikely to be considered useful.
HR or PoD: PoD = hits / (hits + misses): if the event is not forecast, no mitigation response can be carried out, so there is no possible benefit from having the forecast. If the impact of the event is very large, and mitigation is feasible given a fore-cast, HR is the critical measure. In Golding’s report, it is assumed that, regardless of other measures, an HR of less than 33 per cent (that is, two misses for every hit) is useless for flood fore-casting purposes.
4.5 SOURCESOFUNCERTAINTIESINMODELFORECASTING
Model forecasts are inevitably affected by different sources of errors, which can be summarized as:(a) Model errors;(b) Model parameter errors;(c) Boundary condition errors;(d) Initial condition errors;(e) Observation errors;(f) Input forecast errors.
In theory, the degree and influence of all these errors should be accounted for to obtain an unbi-ased minimum variance forecast. From statistical theory it is known how best to account for, and possibly eliminate, errors in forecasts. Following the statistical approach, each error source should be described through its probability density function and marginalized from the predictive probability. Unfortunately, most of the relevant probability densities are not only unknown but also extremely difficult to infer. Even the choice of model has a degree of error involved. This section discusses the different sources of errors and uncertainty regard-less of their actual use when dealing with forecasting.
4.5.1 Modelerrors
Models are always simple and schematic represen-tations of reality: even the most sophisticated ones will inevitably embed schematization error. Moreover, model structures can also be wrong, for instance when a linear model is used as an approxi-mation of a non-linear phenomenon. This implies that a small or large model error will always be inherent in any model. In general, model errors can, to a greater or lesser extent, be compensated fully or in part by parameter calibration and this can be one of the reasons why estimated parame-ters may strongly disagree with physically meaningful values.
4.5.2 Modelparametererrors
If it is assumed that the model structure represents the physical behaviour of the system as effectively as possible at its representation scale, then it would also be assumed that a successful outcome could be achieved by providing the model with physically meaningful values for the parameters. These would only need small adjustments to cope with the non-infinitesimal scale at which the ruling equations are generally derived. This is, for instance, the case of a flood routing model: the Manning’s “n” can be more or less established on the basis of the known materials and the nature of the river bed and flood plain. In this case the forecasting uncertainty will be “conditional” on the model structure as well as on the parameters. However, if parameters are esti-mated regardless of the complexity of their statistical characteristics, they will inevitably become “sinks”, to encompass all the uncertainties.
4.5.3 Boundaryconditionerrors
Errors in boundary conditions, in general also defined as time-invariant conditions, also heavily affect the forecast, particularly when dealing with physical-process models, for which the description

MANUAL ON FLOOD FORECASTING AND WARNING4-14
of the terrain, the channel cross-sections and slopes and the elevation of the dykes may radi-cally change the results. Again, boundary condition errors may be compensated by parameter estimation.
4.5.4 Initialconditionerrors
Initial condition errors can affect not only physical-process model results, such as in the case of flood routing or flood inundation models, but also determine extremely strong errors and forecasting uncertainty in the case of rainfall–runoff models. As an example, whatever type of model (data-driven, conceptual or physically meaningful) is used, the soil moisture content at the outset of an event may change the predicted outflow by an order of magnitude. This type of error is more severe for event-type models, for which it is extremely difficult to infer the right soil moisture. With continuous-time models, using explicit updating of the water balance in the soil, effects are less marked.
4.5.5 Observationerrors
Input measurements from observations or esti-mates through fitted relationships are another important source of errors. Input can include distributed or lumped rainfall, water levels or discharge estimated by a rating curve or weir equa-tion. Errors in spatially averaged rainfall alone can easily be between 20 and 30 per cent, while water level measurements and discharges can be biased or affected by instrument errors.
To correctly estimate the “true” parameter values of a physical-process model, it is necessary to repre-sent all the uncertain quantities in terms of their probability density curves, and the interaction or cumulative effect of all the probability functions. This is an almost impossible task.
4.5.6 Forecastinput
Another important uncertainty introduced to flood forecasting is from the fact that meteorological forecasts are characterized by their own significant errors. It is unlikely that these can be effectively incorporated into the derivation of the conditional predictive probability of the flood forecast model. There is quite an amount of literature on this subject, but a final agreement on the best way for accounting this uncertainty has not yet been reached.
Meteorological practice is now progressively moving towards the provision of ensemble fore-casts. The ensemble forecasts are a number of future rainfall projections from a starting point where
initial conditions are subject to alternative but physically feasible developments. The output can suggest a “most likely outcome”, as well as the range of possible outcomes. The predictive proba-bility of the ensemble method is not fixed, for example in the relationship between maximum and mean rainfall intensity, but the format of the output does allow a probability assessment of the outcome (the forecast) in each case.
4.6 DATAASSIMILATION
4.6.1 Purpose
In real-time flood forecasting, a large number of observations have to be collected in real time. These observations cover a range of variables to be used as model inputs, or additional information to provide model adjustment. The scope of data assimilation is the incorporation of this information into the model state variables or into the model parameters to improve the forecasting performances.
4.6.2 Availabletechniques
Several techniques are available for data assimilation. Those commonly used are the Kalman filter (KF), the extended Kalman filter (EKF), the ensemble Kalman filter (EnKF) and the particle filter (PF). Additional techniques are also used in meteorology and in groundwater modelling. In meteorological applications, variational techniques, known as 3-Var or 4-Var, are widely used to cope with the large number of state variables involved. These techniques, not too different from KF techniques, can also be used in the case of hydrological distributed models – for instance for incorporating satellite imagery of soil-moisture conditions. Given the importance of the KF in real-time updating of forecasting models, it is considered useful to provide its basic elements, as follows.
The KF (Kalman, 1960) is the recursive extension of the Wiener filter applied to linear (or locally linear-ized in time) stationary, as well as non-stationary, processes. Its original derivation comes from the classical state-space formulation of dynamic systems in its time-discretized form:
(4.12)
(known as the “model” or “system” equation);
and,(4.13)
(known as the “measurement” equation);
x xt t t t t t= − −Φ Γ1 1, η
z H xt t t t= + ε
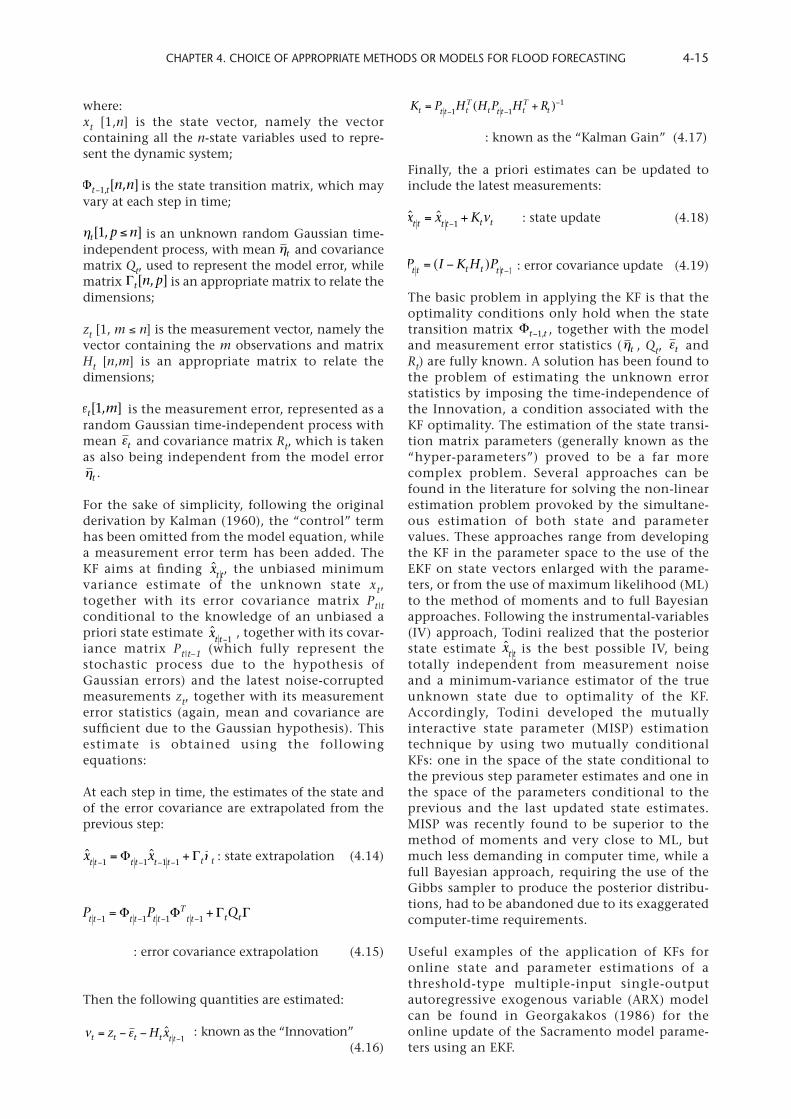
CHAPTER 4. CHOICE OF APPROPRIATE METHODS OR MODELS FOR FLOOD FORECASTING 4-15
where:xt [1,n] is the state vector, namely the vector containing all the n-state variables used to repre-sent the dynamic system;
Φt t n n−1, [ , ] is the state transition matrix, which may vary at each step in time;
ηt p n[ , ]1 ≤ is an unknown random Gaussian time-independent process, with mean ηt and covariance matrix Qt, used to represent the model error, while matrix Γt n p[ , ] is an appropriate matrix to relate the dimensions;
zt [1, m ≤ n] is the measurement vector, namely the vector containing the m observations and matrix Ht [n,m] is an appropriate matrix to relate the dimensions;
εt m[ , ]1 is the measurement error, represented as a random Gaussian time-independent process with mean εt and covariance matrix Rt, which is taken as also being independent from the model error ηt .
For the sake of simplicity, following the original derivation by Kalman (1960), the “control” term has been omitted from the model equation, while a measurement error term has been added. The KF aims at finding x̂t t, the unbiased minimum variance estimate of the unknown state xt, together with its error covariance matrix Pt|t conditional to the knowledge of an unbiased a priori state estimate ̂x
t t−1, together with its covar-
iance matrix Pt|t–1 (which fully represent the stochastic process due to the hypothesis of Gaussian errors) and the latest noise-corrupted measurements zt, together with its measurement error statistics (again, mean and covariance are sufficient due to the Gaussian hypothesis). This estimate is obtained using the following equations:
At each step in time, the estimates of the state and of the error covariance are extrapolated from the previous step:
ˆ ˆx xt t t t t t t t− − − −
= +1 1 1 1
Φ Γ η : state extrapolation (4.14)
P P Qt t t t t t
Tt t t t t
T− − − −= +
1 1 1 1Φ Φ Γ Γ
: error covariance extrapolation (4.15)
Then the following quantities are estimated:
v z H xt t t t t t= − −
−ε ˆ
1 : known as the “Innovation”
(4.16)
K P H H P H Rt t t tT
t t t tT
t= +− −
−1 1
1( )
: known as the “Kalman Gain” (4.17)
Finally, the a priori estimates can be updated to include the latest measurements:
ˆ ˆx x K vt t t t t t= +−1 : state update (4.18)
P I K H Pt t t t t t= −
−( )
1 : error covariance update (4.19)
The basic problem in applying the KF is that the optimality conditions only hold when the state transition matrix Φt t−1, , together with the model and measurement error statistics (ηt , Qt, εt and Rt) are fully known. A solution has been found to the problem of estimating the unknown error statistics by imposing the time-independence of the Innovation, a condition associated with the KF optimality. The estimation of the state transi-tion matrix parameters (generally known as the “hyper-parameters”) proved to be a far more complex problem. Several approaches can be found in the literature for solving the non-linear estimation problem provoked by the simultane-ous estimation of both state and parameter values. These approaches range from developing the KF in the parameter space to the use of the EKF on state vectors enlarged with the parame-ters, or from the use of maximum likelihood (ML) to the method of moments and to full Bayesian approaches. Following the instrumental-variables (IV) approach, Todini realized that the posterior state estimate x̂t t is the best possible IV, being totally independent from measurement noise and a minimum-variance estimator of the true unknown state due to optimality of the KF. Accordingly, Todini developed the mutually interactive state parameter (MISP) estimation technique by using two mutually conditional KFs: one in the space of the state conditional to the previous step parameter estimates and one in the space of the parameters conditional to the previous and the last updated state estimates. MISP was recently found to be superior to the method of moments and very close to ML, but much less demanding in computer time, while a full Bayesian approach, requiring the use of the Gibbs sampler to produce the posterior distribu-tions, had to be abandoned due to its exaggerated computer-time requirements.
Useful examples of the application of KFs for online state and parameter estimations of a threshold-type multiple-input single-output autoregressive exogenous variable (ARX) model can be found in Georgakakos (1986) for the online update of the Sacramento model parame-ters using an EKF.

MANUAL ON FLOOD FORECASTING AND WARNING4-16
4.7 COUPLINGMETEOROLOGICALFORECASTSTOHYDROLOGICALMODELS
4.7.1 Generalconsiderations
The ultimate goal of flood forecasting is to provide accurate forecasts of hydrological conditions from a forecast meteorological situation. Currently, deter-ministic and probabilistic forecasts, or ensemble quantitative precipitation forecasts (EQPF), and other forecasted meteorological parameters (such as temperature) can be applied as input to hydrologi-cal models to derive hydrological forecasts using numerical modelling methods. The coupling of meteorological forecasts as input to models is an important process that needs to be integrated to produce meaningful hydrological forecasts. As meteorological forecasts are becoming increasingly useful as input to hydrological modelling, National Hydrological Services (NHSs) and National Meteorological Services (NMSs) need to develop close coordination and collaboration to maximize the quality and value of meteorological products and services to the water resources user community.
The science incorporated into meteorological, climatic and hydrological models has advanced significantly over the past decade as a result of rapid evolution in computer speed and capacity. This presents the opportunity to couple meteoro-logical and hydrological models directly and must be considered as a separate approach to the use of outputs from meteorological models as discretized inputs into hydrological forecast models. In 2002, the United Kingdom Met Office commissioned HR Wallingford to provide a review on existing and future capabilities for the direct coupling of meteorological and hydrologi-cal models (HR Wallingford, 2002). Such systems are defined as global hydrological forecasts (GHF). GHFs are global in the sense that they can be put into operation at any point in the world and at any time, subject to the necessary infrastructure for running the hydrological models being avail-able. The term GHF is applied only to cases where the meteorological models are embedded within the package, with only modest intervention between the NWP and the hydrological forecast. This distinguishes them from the common situa-tion where a hydrological forecast office uses weather forecasts, numerical or otherwise, to issue generalized alerts or to activate other fore-casting activity “offline”.
Three basic cases of coupling can be considered, according to the source of the input data: the global model, the mesoscale model and nowcasting systems. These differ in terms of geographical scale
and, correspondingly, function within a longer to a shorter time frame. A number of variations based on these basic coupling methods can be recognized, which relate to:(a) The number and “depth” of hydrological add-
ons (runoff, stage, inundated area);(b) The availability of ground truth and the way it
is assimilated;(c) The use made of ensemble and probabilistic
presentations of results.
While the hourly time step used by NWP models satisfies most temporal requirements for flood forecasting, their spatial scale severely limits application. This problem, common to all GHFs, arises from the discretized equations used to describe atmospheric processes, especially precipitation. Perturbations with wavelengths similar to the grid sides are distorted so that only precipitation features of four grid intervals or greater are well represented (Golding, 2006). This implies that the minimum catchment area that can be modelled explicitly by the global model is about 50 000 square kilometres, and by the mesoscale model about 2 500 square kilometres. Only larger European rivers such as the Rhine, Rhone or Danube meet the former criterion. There are clear benefits to using GHFs for continental river basins, as they can also be free of cross-border data-sharing problems, which can be bypassed if the international data-transfer capabilities can be fully utilized. An example of this problem is the heavy restriction on availability of rainfall and river level data on the Ganges in India to the organization responsible for flow forecasting systems in Bangladesh.
Brief summaries on the approach to model coupling on the three scales are presented in the two follow-ing subsections.
4.7.2 Globalhydrologicalforecastsbasedontheglobalmodel
Figure 4.2 gives a schematic illustration of how a GHF model could use the output from the United Kingdom Met Office Unified Model (UM 1° × 1° global model), including output from the Met Office Surface Exchange Scheme (MOSES) submodel that describes surface processes within the UM. MOSES models incorporate vertical exchanges of heat and moisture between the surface (including vegetation) and the atmosphere, and also include four soil-moisture boxes to model vertical and lateral movement of water below ground. The probability moisture distribution (PDM) or TOPMODEL models are embedded in the MOSES upper soil zone, providing a statistical representation of variability in land cover and soil properties within a gridsquare.

CHAPTER 4. CHOICE OF APPROPRIATE METHODS OR MODELS FOR FLOOD FORECASTING 4-17
The lateral transport can be interpreted as runoff and is available either as a grid square total or as a frequency distribution according to the rules set by the PDM or TOPMODEL: X proportion of the grid square yields Y proportion of the runoff. In “climate modelling” mode the UM grid square runoff is accumulated along flow paths using the Oki and Sud scheme after applying appropriate delay coef-ficients. Information on the Oki and Sud scheme is available from P. Cox of the Met Office, Hadley Centre, United Kingdom.
The chosen hydrological model for the European Flood Forecasting System (EFFS) is LISFLOOD, developed by Delft Hydraulics. This is a 1-kilometre grid-based model covering the major rivers of western Europe. It uses 4–10-day precip-itation forecasts from the European Centre for Medium-Range Weatherforecasts (ECMWF) as input. LISFLOOD simulates runoff and flooding
in large river basins as a consequence of extreme rainfall. It is a distributed rainfall–runoff model taking into account the influences of topogra-phy, precipitation amounts and intensities, antecedent soil moisture content, land use and soil type.
Outputs of LISFLOOD are time series of discharge at user-defined catchment outlets and subout-lets. Furthermore, final maps of source areas of water, total rainfall, total interception and total infiltration can be produced, as well as a series of maps showing changes with time of certain vari-ables, such as the water depth in each pixel. The LISFLOOD model was developed in two pilot studies of flooding problems in the Meuse catch-ment, covering parts of France, Belgium and the Netherlands, and also the Oder basin, covering parts of the Czech Republic, Poland and Germany.
UM: United Kingdom Met Office Unified Model
Figure 4.2. Schematic for the first option of GHF, the global model (GHF-1)
Type of model
forecastbased on
Global Mesoscale
60-km precipitation �eld up to 6 days
ahead
60-km MOSES runo��eld up to 6 days ahead.
Not spatially resolved
MOSES-PDM runo��eld up to 6 days ahead.
Downscaled to basin level
12-km precipitation �eld up to 48 hours
ahead
UMGANDAL/NIMRODradar, satellite and
mesoscale model-basedprecipitation �elds for
up to 6 hours ahead
Modelled �ow hydro-graph for catchments
> c.20 km2 up to 6 hr + memory
Nowcast
GHF-1
Assimilation ofregional runo�data or remotelysensed soil and ground wetness
Error correction

MANUAL ON FLOOD FORECASTING AND WARNING4-18
Flood forecasting on very large rivers can therefore make direct use of the UM. However, it has to be borne in mind that the typical rise and fall time of hydrographs from large rivers is of the order of weeks. There may be few circumstances, therefore, when an addition of five days forecast from GHF-1 would offer significant advantage.
Although it is theoretically possible to conceive of GHF-1 running free, the magnitude of the errors are such that it would invariably require ground truth to tie the start of the forecast period back to reality.
Real-time data on river flow are a prerequisite of error correction. There are two international initia-tives that can assist with providing this: the World Hydrological Cycle Observing System (WHYCOS) and the Global Runoff Data Centre (GRDC, located at the German Federal Hydrological Institute in Koblenz). WHYCOS was launched in 1993 by WMO and the World Bank, with the objective of estab-lishing a global network of hydrological observatories to provide information of a consist-ent quality, transmitted in real time or near real time to national and regional databases. Scope also
Figure 4.3. GHF based on mesoccale model fields (GHF-2)
Type ofmodel forecast
based on
60-km precipitation eldup to 6 days ahead
12-km precipitation eldup to 48 hours ahead
Global Mesoscale
UM
Modelled �ow hydrographfor catchments
> c.2,500 km 2 up to48 hours ahead
Modelled stage hydrographfor catchments
> c.2,500 km 2 up to48 hours ahead
Modelled inundationmaps for rivers with
for catchments> c.2,500 km 2 up to
48 hours ahead
GHF- 2
Assimilation ofregional runo�and stage, data
or remotely sensedsoil and ground
wetness
Error correction

CHAPTER 4. CHOICE OF APPROPRIATE METHODS OR MODELS FOR FLOOD FORECASTING 4-19
exists for the use of satellite remote-sensing for updating soil-moisture fields. The overpass interval of suitable radars is of the order of days, but this may suffice for a slowly developing situation on a large catchment.
4.7.3 Globalhydrologicalforecastsbasedonmesoscalemodelsandnowcasting
Figure 4.3 shows a version of a GHF based on the United Kingdom Met Office or similar mesoscale model. Typically, a mesoscale model provides hourly forecasts of rain updated every six hours. Mesoscale models are computationally complex and rely to an important extent on extensive data assimilation. As a result, forecasts may not become available until up to three hours after the time of observations. Despite this it is considered that a 36- to 48-hour addition to forecast lead time has real value for more rapidly responding catchments of greater than 2 500 square kilometres, subject, of course, to achieving adequate accuracy.
One example of a near-operational GHF-like system based on a mesoscale model is from South Island, New Zealand, which uses a Regional Atmospheric Modelling System (RAMS) for QPF with a version of TOPMODEL to convert to flow. RAMS has a 20-kilometre resolution and is driven by the United Kingdom Met Office 120-kilometre forecasts. Forecast data are available from Bracknell at 8 p.m. local time, and with overnight running of RAMS a hydrological forecast is available at 8 a.m., provid-ing a 27-hour lead time of events 48 hours from initial receipt. Conceptually, TOPMODEL empha-sizes the infiltration process over channel routing in headwaters, so it should be well suited to the more mountainous catchments involved. Early results showed that very large under- and overesti-mates of flood magnitude occurred when the model was allowed to run free. This illustrates the neces-sity for updating with observed rainfall and river flow data.
A modified version of the mesoscale model can be constructed, for example supplementing GHF-2 with a Nowcast system. This acts as a further assimi-lation process, in which a combined radar–NWP model with a forecast lead time out to six hours can be introduced.
4.8 PREDICTIVEUNCERTAINTYINOPERATION
When dealing with flood emergency management, operational decisions may lead to dramatic conse-quences (economical losses and casualties).
Nonetheless, emergency managers are required to take decisions under the stress of their uncertainty about the evolution of future events. Decision theory has developed into an extensive topic of mathematical study.
One of the issues in the debate among hydrologists is how to demonstrate the benefits arising from the operational use of predictive uncertainty. The corol-lary of this is how to communicate uncertainty to the end-users, namely the decision makers such as water and emergency managers, who may have a certain difficulty in perceiving these benefits. Statements such as “the probability of flooding within the next 12 hours is 67.5 per cent” is often meaningless to an end-user. The information has to answer the basic question “what are the expected benefits and drawbacks of issuing a flood alert for the next 12 hours?”. Therefore, hydrologists must define, in dialogue with end-users, subjective utility functions, which can be used to compute the expected benefits or damages contingent on the predictive density of the quantity of interest.
A schematic example of such utility functions is shown in Figure 4.4, for the case of a flood alert (note that in this simple schematic example, casu-alties are not taken into account). The dashed line represents the end-user perception of the damage (not necessarily the real one) that will occur if the dykes are overtopped, namely if Q > Q*, where Q* is the maximum discharge that may safely flow in the river. The solid line represents the perception of cost plus damages when an alert has been issued. As can be seen from Figure 4.4, if an alert is issued a cost must inevitably be incurred for mobi-lizing civil protection agents, alerting the population, laying sandbags and taking other necessary measures. However, the damage in that
Figure 4.4. The utility functions deriving from a flood alert problem: solid line represents cost and
damage perceived by the end-user if an alert is issued; dashed line represents perceived cost and
damage if an alert is not issued; Q* is the maximum discharge that may safely flow in the river
Q*
Discharge
Dam
ages
Q*Q*Q*
DischargeQ*
No alertAlarm

MANUAL ON FLOOD FORECASTING AND WARNING4-20
case will be smaller than in the “no-alert” case, due to the raised awareness of the incoming flood. The decision on whether or not to issue an alert will then depend on the comparison of the “expected damage” for the two options, obtained by integrating the product of the cost function multiplied by the predictive uncertainty probabil-ity density function over all possible values of future discharge. It should be noted that the “expected damages” are a function of the actual future discharge that will happen, not of the discharge predicted by the model. By using the expected value of damage instead of the “model forecast”, the probability of false alarms as well as of missed alarms should be much reduced, as the uncertainty about the future discharge is taken into account. In addition, the peakier the predic-tive density is, the more reliable will the resulting decision be, so that improvements in forecasting, rather than looking for a better “deterministic” forecast, must essentially aim at reducing predic-tive uncertainty by whatever means is available.
To show how predictive uncertainty can be used in operation, the Lake Como real-time management decision support system is given as one of the few existing successful examples (Todini and
Bongioannini Cerlini, 1999). Lake Como is a natu-ral lake in northern Italy closed at its exit and managed as a multi-purpose lake for flood control, irrigation and electric power production. Using a stochastic dynamic programming approach, a standard operating rule was developed on a 10 day basis to optimize long-term irrigation and energy production. However, when a flood is forecast, the reservoir manager needs to modify the standard operating rule. To achieve this, a utility function describing the damage perception of the manager was developed. Every morning an incoming flood forecast, together with its predictive uncertainty, is issued, and an optimal release, computed by mini-mizing the expected damage using the inflow predictive uncertainty, is then proposed. All this process is totally hidden from the water manager, who is aware only of the suggested optimal release and of its expected consequences (Figure 4.5).
The performance of the system was assessed on the basis of a hindcast simulation for the 15-year period from 1 January 1981 to 31 December 1995. The results are presented in the table below. When applying the optimized rule, the lake level never fell below the acceptable lower limit of –0.4 metres, while historically this was observed on 214 days.
Figure 4.5. The Lake Como operational decision support system. The system, on the basis of the expected value of inflows to the lake (light blue line) and its uncertainty (not shown, but used in the process)
suggests to the water manager the optimal (red line – not shown) and possible (green line) releases that minimize the expected damage. It also shows the consequent expected lake level (blue line)
for the following 10 days.
Forecasting horizon:Inflow [m3 s-1]
Vol [m3 x 106] Optimal releasesPossible releases
Levels at Malgrate [cm]Forecasting horizon:
In�ow[m3 s-1]
Vol [m3 x 106] Optimal releasesPossible releases
Levels at Malgrate [cm]
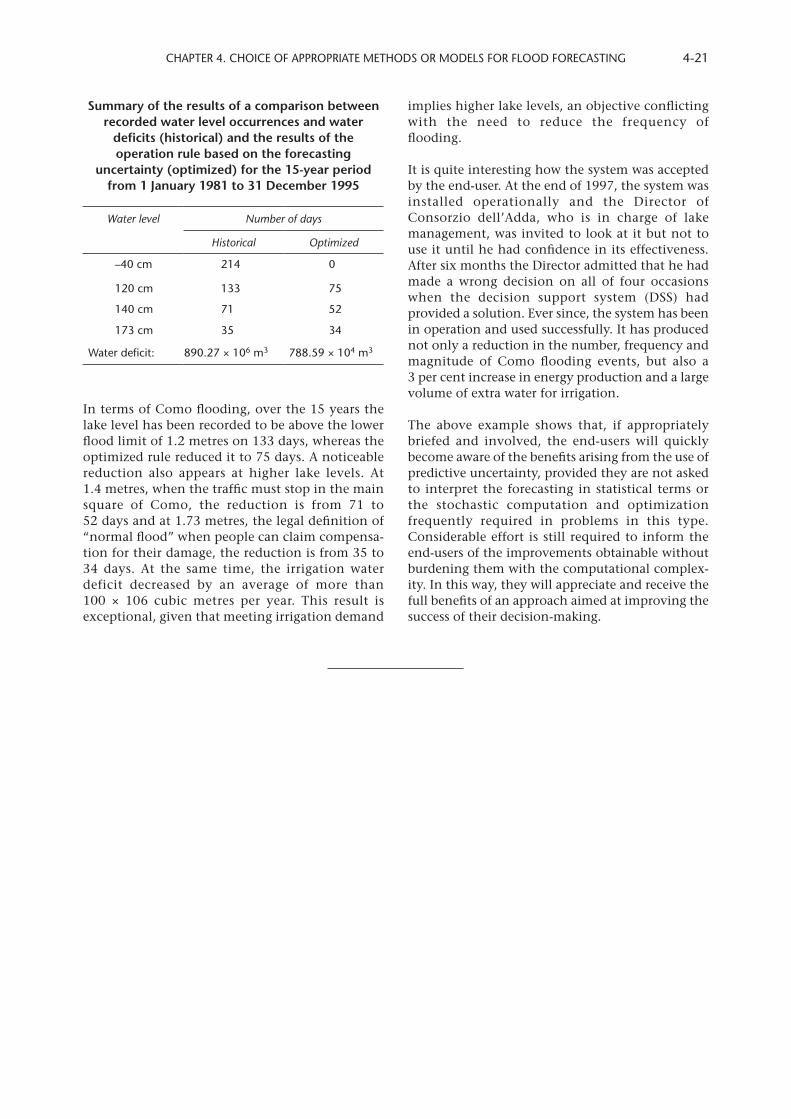
CHAPTER 4. CHOICE OF APPROPRIATE METHODS OR MODELS FOR FLOOD FORECASTING 4-21
Summary of the results of a comparison between recorded water level occurrences and water
deficits (historical) and the results of the operation rule based on the forecasting
uncertainty (optimized) for the 15-year period from 1 January 1981 to 31 December 1995
implies higher lake levels, an objective conflicting with the need to reduce the frequency of flooding.
It is quite interesting how the system was accepted by the end-user. At the end of 1997, the system was installed operationally and the Director of Consorzio dell’Adda, who is in charge of lake management, was invited to look at it but not to use it until he had confidence in its effectiveness. After six months the Director admitted that he had made a wrong decision on all of four occasions when the decision support system (DSS) had provided a solution. Ever since, the system has been in operation and used successfully. It has produced not only a reduction in the number, frequency and magnitude of Como flooding events, but also a 3 per cent increase in energy production and a large volume of extra water for irrigation.
The above example shows that, if appropriately briefed and involved, the end-users will quickly become aware of the benefits arising from the use of predictive uncertainty, provided they are not asked to interpret the forecasting in statistical terms or the stochastic computation and optimization frequently required in problems in this type. Considerable effort is still required to inform the end-users of the improvements obtainable without burdening them with the computational complex-ity. In this way, they will appreciate and receive the full benefits of an approach aimed at improving the success of their decision-making.
Water level Number of days
Historical Optimized
–40 cm 214 0
120 cm 133 75
140 cm 71 52
173 cm 35 34
Water deficit: 890.27 × 10⁶ m3 788.59 × 10⁴ m3
In terms of Como flooding, over the 15 years the lake level has been recorded to be above the lower flood limit of 1.2 metres on 133 days, whereas the optimized rule reduced it to 75 days. A noticeable reduction also appears at higher lake levels. At 1.4 metres, when the traffic must stop in the main square of Como, the reduction is from 71 to 52 days and at 1.73 metres, the legal definition of “normal flood” when people can claim compensa-tion for their damage, the reduction is from 35 to 34 days. At the same time, the irrigation water deficit decreased by an average of more than 100 × 106 cubic metres per year. This result is exceptional, given that meeting irrigation demand


5.1 DEFINITIONOFDATAACQUISITIONNETWORKS
There are many factors that should be considered when designing an operational network to support a flood forecasting and warning operation. Essentially the network is based on a combination of rainfall and river level (and possibly flow) moni-toring points, reporting in real or near-real time to a central operation and control system. As the output is of high value to the national interest, that is, it concerns timely, detailed flood warnings with maxi-mum accuracy, the networks require high reliability and resilience and are largely built around auto-matic data monitoring, processing and retrieval. Although some monitoring facilities may be shared with other uses within the owning agencies, these often being water management and meteorological services, the components of the flood forecasting monitoring system have to be considered and oper-ated as a single entity. Thus, within the individual agencies responsible, a matching high level of criti-cal infrastructure support must be assigned. This entails devoting adequate funding both to purchase and maintain the network, and to ensure suitable levels of staffing to maintain the functions. In addi-tion to the need for equipment to operate round the clock, it is also important that staffing allows for periods of emergency operation, so the provision of cover, duty assignment and additional staff call-out have to be considered.
Most importantly, the data network must deliver information in relation to areas where high risk of flooding combines with high impact of flooding. Thus, there must be a sufficient number of stations reporting the detail that will allow the develop-ment of the flood to be observed and to provide sufficient time for forecasting models to run and produce outputs for timely warnings to be issued and necessary decisions taken (see Box 5.1). The sections that follow in this chapter will exam-ine the requirements for a successful network,
whilst Chapters 6 and 7 consider in more detail some of the technical issues. This chapter will also examine instrumentation requirements in general, but does not aim to include detailed specification of individual instruments.
5.2 EVALUATINGEXISTINGNETWORKS
Networks used for flood forecasting and warning systems are most frequently based on existing hydrometeorological networks. This may to a greater or lesser extent influence the structure of the required network to economize on the intro-duction of new sites. The use of existing networks has the benefit that, as well as equipment and site infrastructure, the locations used will have an established database to provide a good foundation of information for model development. The main issues to be addressed when evaluating existing networks concern their geographical suitability for flood forecasting purposes. As existing networks may have been developed by separate operational entities, for example a water resources or meteoro-logical organization, there may also be ownership and management matters to consider.
As mentioned in 5.1, the most important require-ment is for the network to deliver useful and timely information. Thus, although it may be convenient to use existing networks from an economic or oper-ational point of view, their suitability for the end purpose in flood warning must be carefully consid-ered. Some of the most important considerations are explained in this section, but details of the design of a network are given in 5.3.
5.2.1 Meteorologicalnetworks
Observation networks operated by NMSs have generally evolved from two main historical require-ments. Synoptic observations of a range of variables have been collected for many years to understand current weather conditions and develop knowledge and methods for weather forecasts. Data from synoptic stations and other “primary” stations are intended to build up a picture of general or specific climatology, for example agroclimatology. For both of these types of network, the principal require-ment is to sample conditions across a region or country with sufficient detail to characterize areal and temporal variations. Data recording is generally on a daily basis, with principal synoptic
CHAPTER 5
MONITORING NETWORKS
Box 5.1
Except for major river basins, the density of meteorological stations and their reporting arrangements for resource management are insufficient in most cases for them to operate as part of a flood forecasting and warning network.

MANUAL ON FLOOD FORECASTING AND WARNING5-2
stations taking measurements at three- or six-hour intervals. Although the majority of synoptic and climatological stations now use automatic elec-tronic sensors and data storage, not all have the telemetry requirement for flood forecasting. These types of data are not always fully useful for flood warning, as the reporting interval is too long and the locational distribution is not focused on flood behaviour. Shrot-period rainfall is not the variable of main interest at these stations, so data tend to be presented as a total over 24 hours, even if observations are made several times per day.
5.2.2 Raingaugenetworks
Rainfall has been observed over many years in most countries, principally on a daily basis, but only a small proportion of these countries have recorded rainfall on a continuous basis. Networks have been established and operated by a variety of agencies, although as a general rule the data are now managed for archive purposes by NMSs or water manage-ment agencies. Development of raingauge networks has been piecemeal, and has been much influenced by different purposes. The size and composition of networks have changed over time, as have the agencies that manage them. Examination of the locations of raingauges within the networks of most countries show their origins to be from:(a) Local administrative centres;(b) Water and sewage treatment works;(c) Reservoirs;(d) Agricultural and forestry establishments;(e) Irrigation services;(f) Research units;(g) Schools and colleges.
With a few exceptions, the types of organization listed above will result in the sites for gauges having a bias towards location in lowland sites and centres of population. However, a flood fore-casting system requires raingauges to be at some distance from the sites of flood risk and in head-water areas to provide adequate lead time. Thus, a number of sites are required in more remote areas (see Box 5.2).
Although current management of data may have become centralized, the managing agencies may not have any control in maintaining regular observations and may rely heavily on the goodwill
and dedication of volunteers. Rainfall observation stations for a flood forecasting and warning operation may be selected from existing sites, but it will always be necessary to upgrade them to the high level of technical status and reliability required.
5.2.3 River-gauging(hydrometric)networks
The development of river-gauging networks has been in some ways similar to that of raingauges, in that a number of different organizations may have been responsible for their origins, before their current operation by a national water manage-ment authority. This fact will be reflected in their sites being specific to water management struc-tures, such as reservoirs, barrages and intake. Except for the former, these sites are also likely to be predominantly in lowland areas, and so there will be few suitable sites that can provide early warning of flood development. The bias towards requirements for water management at these sites also tends to focus on accurate measurement of low flows, that is, to identify resource reliability. This is reflected in measurement structures, partic-ularly for flow, which are not designed to measure high or out-of-bank flows. The latter information is vital for flood routing and inundation model-ling. Therefore, in the case that existing river-gauging sites are selected to form part of a flood forecasting and warning system, their design will require significant modification before they are effective (see Box 5.3).
As with raingauges, the original purpose of most flow gauges required that their data were only sampled and analysed at intervals. Thus for water level, whether manually recorded at set times, for example daily, or continuously recorded in some way (by chart or logger), these data are rarely avail-able in real time, and flow, in particular, is calculated retrospectively in batches.
5.2.4 TheBangladeshriverfloodwarningnetwork
Because of its unique physical setting as a nation almost entirely within a delta area, and prone to
Box 5.2
The raingauge network for flood forecasting and warning may be selected from an existing network, but the existing stations will require upgrading, and additional stations will be required in more suitable locations.
Box 5.3
Existing river-gauging networks do not cover the necessary parts of the catchment required for flood warning, particularly headwater areas. Sites will also require redesign and upgrading of equipment to provide real-time transmission of flow across a larger range than provided by the existing network.

CHAPTER 5. MONITORING NETWORKS 5-3
regular and extensive flooding, the monitoring network operated by the Bangladesh Flood Forecasting and Warning Centre has long-established origins. As flood monitoring was a prime concern from the initial activities of the hydrological network, its structure reflects the main require-ments for:(a) Early observation of the development of flood-
ing – in this case at the borders where rivers cross from India;
(b) Successive monitoring points along main rivers and tributaries to identify the progress of flood-ing;
(c) Location of gauges at principal infrastructure points, rail bridges and ferry crossings;
(d) Detailed monitoring close to the capital city;
(e) Early development of operator reporting of river levels and rainfall by radio, to provide rapid situation appraisal;
(f) Simple graphical forecast procedures using time-of-travel and level-to-level correlation.
The original system has undergone several stages of development to reach the current situ-ation, which has significant levels of automation and sophisticated river forecasting. Figure 5.1 shows the network and the status reporting codes.
5.3 DESIGNREQUIREMENTSFORHYDROMETEOROLOGICALOBSERVATIONNETWORKS
Consideration of model types and their suitability to flood forecasting and warning has been exam-ined in Chapters 3 and 4, and the requirements for physical operation are covered in Chapter 6 and elsewhere. This section deals with the basic struc-ture of the observation system to provide the model with the required data, and also the salient issues that have to be considered in network design.
5.3.1 Identificationofareasatrisk
Flood forecasting and warning must be focused on the communities and infrastructure within a river basin or other management area (city, district, region). Some early attempts at flood forecasting and warning in the United Kingdom and elsewhere were criticized because they focused too much on the river system, and not enough on the areas at risk. This partly arose because the forecasting and warning systems were developed by modifying existing hydrometric networks, and also because the information was considered primarily for the benefit of the catchment managers. Although the managers may have been satisfied that the informa-tion received was sufficient for their primary response actions, for example strengthening defences, calling out emergency work teams and operating flood control gates, it was of limited use outside the organization. Thus, the network design must meet the needs of forecasting for specific areas.
A wide range of sites in a catchment may be consid-ered to be at risk from flooding, but these need to be prioritized in terms of the level of risk and the magnitude of the impact. By categorizing levels of risk, usually by return period of flooding related to particular trigger levels, and the level of impacts, usually in terms of economic costs and disruption, the requirement for forecasting and warning can be identified. A matrix form of analysis, as illustrated in Table 5.1, can be a useful approach, in which the risk and impacts over different categories can be qualitatively related to the benefit of receiving flood forecasts and warnings.
The categorizing of the impact zone with type of land use may vary from basin to basin, or according to the relative importance of, for example, agricul-ture and industry within the national or regional context. Defining the importance of flood forecast-ing and warning cannot be solely dependent on a flood-risk zone, that is, by return period. The cate-gories used in the table below are general, and can be served to illustrate the concept.
Figure 5.1. The Bangladesh Flood Warning Monitoring Network
Level stationsNormalWarningDangerSevereNo dataRiversDistricts

MANUAL ON FLOOD FORECASTING AND WARNING5-4
Undeveloped land
This may be in the upper reaches of catchments (hill pastures, forests) or the lowest parts (flood plains, marshes), where impacts of flooding are low, and in fact frequency of flooding is often high. Predicting flooding through models is generally not significant in terms of impact. Exceptions can arise if these areas are important for flood diversion and retention.
Agricultural land
Within this category, impacts can be quite variable, depending on the type of agriculture. Impacts on arable land may be high, but little can be achieved by flood warning. However, in the case that a flood warning is useful to make decisions about imple-menting measures, such as gate controls or river diversions, more weight should be given. This is particularly so when irrigation systems are of major national importance. In pastoral areas, flood warn-ing is also beneficial, as it allows time for livestock to be moved to safer areas.
Low-density urban areas
These areas are best considered as the scattered villages and small towns within a specific subcatch-ment or river reach. For certain portions of these areas, for example in or adjacent to flood plains or behind major defences, site-specific flood warnings are impractical. It is in these areas that flood warn-ings may need to apply to a certain portion, where levels of risk and impact may vary. Effectiveness of flood warnings in these areas will depend on the awareness of the recipients and on the gradations of the severity in which the warnings are presented.
Urban centres and key infrastructure
Many major cities have grown up, for various historical reasons, adjacent to river sand in flood plain areas, and now have to be provided with flood defences. In view of the concentration of high-value property and key infrastructure, flood
defences have to be backed up by targeted flood warnings to mobilize flood management actions. Actions may include the closing of flood barrages (London), installation of demountable defences (Prague) or, in extreme cases, preparations for evacuation (New Orleans).
Understanding the different characteristics of catchment areas and flood behaviour is essential for the identification of these areas at risk. Recent stud-ies in Scotland by the Scottish Environment Protection Agency (SEPA) (SEPA, 2007) have approached the upgrading of flood forecasting and warning services by considering flood risk as arising from three sets of risk components, as described in Box 5.4. These components can be most effectively illustrated by maps and through GIS, as in the example given by Figure 5.2, illustrating the categorization of fixed risk by catchment.
The mapping of fixed risk is an effective means of defining the most critical areas, and thus those areas that require the greatest effort to provide an adequate network. In the case of Scotland, where there are many undeveloped upland areas, the aim has been to identify which catchments should be concentrated on for the design of a high-specification flood forecasting and warning system, based on river forecast models and
Flood risk
Flood impact zone
Undeveloped area (low)
Agricultural land (medium)
Low density urban (high)
Urban centres and key infrastructure (very high)
High High/low High/medium High/high High/very high
Medium Medium/low Medium/medium Medium/high Medium/very high
Low Low/low Low/medium Low/high Low/very high
Risk impacts matrix
Box 5.4. Component of flood risk
(a) Fixed risk, derived from various catchment variables, such as shape, river channel steepness, channel hydraulics and obstructions in urban areas, along with housing and infrastructure at risk;
(b) Antecedent risk, dependent primarily on the monitoring of catchment wetness, reservoir states and snow cover;
(c) Storm (event) risk, which contains most of the variables included as inputs to models or a DSF, for example rainfall quantity, distribution and intensity, changing river state, storm movement and QPFs.

CHAPTER 5. MONITORING NETWORKS 5-5
Figure 5.2. Fixed risk susceptibility to flooding in Scotland

MANUAL ON FLOOD FORECASTING AND WARNING5-6
telemetry, and which catchments could be provided with a satisfactory system based on less intense monitoring and simplified modelling, for example a computer-based decision support framework (DSF). The DSF approach also has the benefit of providing an early alert to authorities to allow some preparatory actions to take place, prior to reaching the full operational status when the real-time flood forecasting model is utilized (SEPA, 2008).
5.3.2 Selectionofappropriateleadtimes
The lead time provided by a flood warning has to be sufficiently long to allow response action to take place. The delivery of data from the observation system and the model forecast runs has to be suffi-ciently fast to have the information available so that forecasts can be issued in due time.
In the United Kingdom, where catchments are small by world standards, the Environment Agency, the main flood warning authority, has stipulated that the minimum lead time is to be two hours. This is aimed at very rapid response catchments and is considered to be the minimum time necessary to allow authorities and residents to take the basic necessary actions. This requires high specification and reliability of equipment and services to deliver products in a timely
manner. The minimum level of service is not necessarily applied at all locations in the country, and on larger rivers, forecast lead time can be longer. In an attempt to categorize the various catchments and to identify areas where rapid response is necessary, the Environment Agency produced a national map of time to peak (Tp) of the river network, defined in categories of zero to three hours, three to nine hours and greater than nine hours. The map of the catchments with a Tp of less than three hours is shown in Figure 5.3. Most of the rapid response catchments are in upland areas, but many are also in conurbations. When overlaid against a map of towns and cities, this approach provides a useful guide as to how the flood forecast model needs to be structured. A particular application was to identify which loca-tions would require more detailed hydraulic models for river and flood plain reaches, to provide more accurate predictions of flood level and extent.
Selection of a minimum lead time does not mean that warnings should only be issued at that time. The more warning time given, the better the opportunity to prepare and activate response and relief actions. Many flood warning agencies provide forecasts and related warnings for a period 48 hours ahead (T+48), as in the example from the United States shown in Figure 5.4. In Bangladesh, where the flood warning service deals mostly with slow-responding rivers, the forecast horizon is 72 hours (T+72). In these cases, the river situation is usually reported at specific intervals, for exam-ple in steps of three or six hours. Thus, the design of the observation and telemetry network for rain-fall stations and river levels (and flows) needs to be such that all data delivery and processing for flood warning can be accomplished within these time steps.
5.3.3 Identificationofgeographicalhydrologicalunits
As well as providing forecasts and warnings at specific points, aimed to be for the benefit of users, the observation network needs to be distributed so that professional meteorologists, hydrologists and flood mangers can understand the behaviour of the flood in its geographical setting. Monitoring points need to be placed to adequately identify conditions in contributing subcatchments, and to monitor progress of a flood from upstream to downstream areas. This will require a certain number of observa-tion points in remote, upstream areas, which are the most common flood generating zones in any catchment.
However, in major river systems, the minor tribu-tary catchments must not be neglected. These will
Figure 5.3. Rivers and catchments with Tp of less than three hours in England and Wales. Rivers and flood plains are shown in red and the grey area is
the related catchment area.

CHAPTER 5. MONITORING NETWORKS 5-7
respond more quickly than the main river. More importantly, if the main river is in a flood condi-tion, then floods in the tributary catchments may be more critical. This was the case for the severe floods in central Europe in the summer of 2002. Large areas of major catchments, such as the Elbe and Danube, suffered extensive flooding, but some of the most significant damage occurred in subcatchments, where critical conditions were not quickly identified.
In conjunction with monitoring for constituent subcatchments within the total area of interest, sufficient monitoring of river levels along the course of larger rivers is essential, which entails selection of suitable lengths or reaches of rivers. The selection of lengths of reaches and the posi-tioning of monitoring points should take into account the time of travel downstream of the flood peak in relation to timing at the flood warning foci, and include the joining points of major subcatchments, which may significantly increase flood volume or raise levels due to backwater effects.
5.3.4 Background(antecedent)catchmentmonitoringandpreparedness
This is a separate topic from the need to provide enough coverage in a catchment to identify the
development of flooding. The monitoring of back-ground or antecedent conditions is essential for the initiation of model runs, especially where monitor-ing intervals and operator numbers have to be raised from routine or standby status to fully active. Monitoring of antecedent conditions is also of benefit to provide early advice to professional partners.
The simplest and most common form of anteced-ent condition monitoring uses catchment rainfall. This may be as an integral part of model updating, whereby the relevant variables and algorithms are revised at fixed periods, but the system can also be “off-line”, based on indicator stations at a limited number of sites. The most common indicator vari-able used is the antecedent precipitation index (API), which in United Kingdom practice takes the form:
API5 = 0.5[Pd–1 + (0.5)2 Pd–2 + (0.5)3Pd–3 +
(0.5)4Pd–4 + (0.5)5Pd–5]
where Pd–x is the rainfall total on each of the preceding days.
API is updated daily. Trigger levels, which result in upgrading operational or model status, are selected following the analysis of historical events.
Figure 5.4. Graphical flood forecast to T+48 hours for the Green River at Paradise, Kentucky, United States

MANUAL ON FLOOD FORECASTING AND WARNING5-8
More complex forms of catchment wetness, such as soil-moisture deficit (SMD) or runoff potential (CEH, 2007), use both rainfall and evaporation and therefore depend on both rainfall and climatic data to be monitored, and a suitable method of calculation of actual evapotranspiration to be made. Dependent upon historical analysis and knowledge of the catchments concerned, trigger values are set at low or zero values of SMD.
The difficulty of in situ monitoring of catchment wetness by conductivity or lysimeter measure-ments makes the use of these techniques very uncommon in flood forecasting operations. This is largely due to difficulties in continuous operation and calibration, and the provision of representa-tive sites. However, where catchments have a significant groundwater component due to the presence of a major aquifer, direct readings from key observation boreholes can be accessed in real time. These are used either to update the ground-water subroutines of models, or off-line as catchment indicators.
5.3.5 Instrumentationandmonitoring
Because the speedy and reliable delivery of data from the field to the operations centre is of para-mount importance in a flood forecasting and warning system, the instrumentation required should be electronically sensed and transmitted. The basic types of instruments required are:(a) Tipping bucket raingauge: These have more
or less universally replaced siphon and chart recording types. The tip size can usually be specified as 0.2, 0.5 or 1 millimetre. A 1-millimetre tip is best suited to intense, high-volume rainfall regimes, as tip sequences that are too rapid can interfere with results;
(b) Water level recorder: Float and rotating- sensor types, gas pressure, pressure transducer or ultrasonic types are available. The conver-sion from analog to digital signals in the float and transducer types must be efficiently proc-essed;
(c) Ultrasonic flow measurement devices: These can be effective in narrow width, regular sections, where the hydraulic conditions are stable and can be represented by simple formu-lae. At the site, they need to be combined with level monitoring to relate to local bank condi-tions, and also to provide a rapid check on section calibration;
(d) Climate stations: These are mostly of use in defin-ing antecedent and other catchment conditions, for example snow cover or evapotranspiration, so may not have the same regularity of report-ing as the rainfall and river sensors. They should carry electronic sensors for temperature, humidity, radiation and wind velocity.
Full details of instruments and discussions about their location and siting can be found in the WMO guides referenced (WMO, 1983, 2007, 2008).
There is a wide range of instrument manufacturers across the world offering all or some of these instru-ments. High quality and reliability are required because of the critical nature of the flood forecast-ing and warning operation. Only high-specification instruments from recognized suppliers should be considered. Purchase of cheap instruments and copies made under licence should be avoided, as they represent false economy. In effect, this means that there are increasingly fewer companies operat-ing internationally that should be considered for instrumentation. The advantage of using such companies is that they can provide a good backup of maintenance and spares, which are essential for the efficient operation of a flood forecasting and warning system. It is also advisable that the instru-ment manufacturer has an established agency representation in the country or area of use. Due to the specialized and high-value nature of modern equipment, it is recommended that procurement contracts cover the following elements:(a) Supply of instruments;(b) Compliance with international standards of
manufacture and performance;(c) Installation and calibration;(d) Testing and commissioning of instruments and
the network;(e) Contracts for warranty, service, supply of spares
and maintenance.
Most modern instruments are modular, relying for the most part on electronic circuitry and microproc-essors. Unlike manual instruments, there is little that can be done by way of adjustment or repair by tech-nical staff in the operating authority. In fact, staff should be instructed not to interfere with the inter-nal workings of instruments and components, for as well as being ineffective, this may well break manu-facturers’ warranty agreements. The operating authority technical staff should, however, pay special attention to checking instrument operation and power supplies, along with occasional checks on calibration and structural integrity. Just because instruments are automatic, it should not be assumed that they can operate for long periods without atten-tion. It is also important that sensor, processor and transmitter housings and mountings are also of high specification, especially where extreme weather conditions are encountered.
5.3.6 Suitabilityofdatastructures
As part of the instrument specification, the format of data produced is an important consideration. It is necessary to ensure that the data provided are in suit-able formats for ingestion into data processing routines

CHAPTER 5. MONITORING NETWORKS 5-9
and flood forecasting models. Recognized specialist instrument suppliers understand the data applications required, so processing equipment should accommo-date this with minimum requirement for data format conversion. The important transfers are:(a) Signal from the sensor to a digital data format;(b) Transmission of the digital data in a
communications format;(c) Conversion of the transmission data into
digital format for input into processing and models.
More complicated situations arise when valuable information is generally available in visual display form, for example radar and satellite imagery, and NWP presentations. The fact that these are proc-essed into a final form using pixel arrays means that they can lend themselves to digital conversion. However, the volumes of data involved are very large, and in only a few cases have systems been developed to convert visual data to a directly usea-ble input format. Examples of these systems include HYRAD (United Kingdom) and NEXRAD (United States). The nature of the pixel-based structure of data also means that forecast models have to accom-modate grid-based data, rather than data inputs at specific distributed points.
5.3.7 Softwareoperatingsystems
A number of separate systems contribute to the overall structure of a flood forecasting and warning
operation. It is essential for these separate systems to link effectively, with a high degree of automa-tion and the minimum amount of human intervention, for example in transcribing data from a system output to provide inputs to another. This could involve, for example, transcribing rain-fall data from telemetry into input data for a hydrological model.
The need to coordinate a number of different data streams, and also to accommodate the addition of new features to existing networks, has led to most of the major suppliers of flood forecasting and warning software to structure this as an “open architecture system”. Typically these systems provide a dedicated user interface around hydro-logical and hydraulic models and online meteorological and hydrological data collection. The systems therefore need to have significant capability for data import and processing. Open-architecture systems will contain specialized modules to process the data, and have open inter-faces to allow easy integration of different model capacities. The philosophy of the system is to provide an open “shell” for managing the forecast-ing process. This shell incorporates a wide range of general data-handling utilities, while providing an open interface to a wide range of forecasting models. The structure can thus be customized to the specific requirements of an individual flood forecasting agency. A typical example of an open architecture or shell system is shown in Figure 5.5.
Figure 5.5. The open architecture system structure (after Wallingford Software)
SYSTEM SHELL
FORECASTING MODULE
FORECAST AND WARNING OUTPUTS
DATA-GATHERING MODULE
Telemetry Meteorologicalforecasts
Hydrometric database
Weather radar Satellite imagery
OPERATOR INTERFACE AND INFORMATION CONTROL
Snowmelt model
Rainfall-runo� model
Flow-routing model
Hydrodynamic model
FORECAST DATABASE AND INFORMATION-SYSTEM MODULES

MANUAL ON FLOOD FORECASTING AND WARNING5-10
Although the open architecture system has the capacity to use models of different types and from different origins (legacy systems), the major suppli-ers will provide their own range of compatible and complementary models. Typically these will include:(a) A hydrological-cycle (rainfall–runoff) model;(b) A river-channel hydraulic model;(c) A river-channel and flood-plain model;(d) An automatic alert-generating model.
As well as the comprehensive nature of the data management and range of model types, the sophis-ticated operating systems provide a wide range of display modules and graphics, which form the graphic user interface (GUI). All contain systems for graphical, tabular and map-based summaries.
5.4 OPERATIONANDMAINTENANCEOFHYDROLOGICALNETWORKS
This is a highly critical aspect of flood manage-ment and the operations of a flood forecasting and warning system. It covers a wide range of equip-ment, mobility and the capacity to maintain communications with third parties or service providers, and as such requires maintaining long-term financial arrangements for recurrent expenditure. It is this latter aspect that is often neglected in aid funding arrangements and also given inadequate consideration in the financial organization of national government budgets. Key foci to be considered are detailed in the following subsections.
5.4.1 Field-monitoringequipment
Instruments have to be maintained in good work-ing order. Where manual and mechanical instruments are still used, for example operator-read instruments and chart recorders, then regular visits are required and calibration of instruments maintained. Current meters will have to be returned periodically to a certified calibration facility. Not all countries have such facilities, in which case finan-cial, logistic and customs arrangements have to be in place.
The increasing use of electronic instruments reduces the need for maintenance visits, but it cannot be assumed that these instruments are maintenance free. A consistent, high standard of accuracy and reliability is often overstated by manufacturers and suppliers, so the onus falls upon the user to care-fully review collected data. Thus, a strict programme of data checking by knowledgeable staff is required. It should not be assumed that because an instru-ment or data logger is in an electronic sealed unit,
it is accurate forever. Instruments that are accessed by an operator, either to exchange memory units or download onto a data transfer module or PC, need to be visited regularly to keep databases up to date. A three-month visiting interval should be the minimum target.
Power supplies are of critical importance to field instruments. Even in developed countries a mains power supply is not always available, and it is often necessary and desirable to install instruments in remote locations where there are no power supplies. Battery, wind and solar power all provide solutions for on-site power, but all require maintenance and servicing. In order to keep instrument downtime and network disruption to a minimum, it is neces-sary to have adequate spare instruments and parts, and also plans and arrangements for servicing by manufacturers. Electronic instruments can mostly only be calibrated by manufacturers, which again may require international shipment.
5.4.2 Officeequipment
As with field equipment, office items are increas-ingly becoming electronic. Standard items within a hydrological unit include telephones, fax machines, photo copiers and computer systems of varying complexity. These items quickly become obsolete as manufacturers develop products and change models. Thus the maintenance programme has to make allowance for service and replacement of equipment that manufacturers no longer support. It is important that hydrological services are linked through the World Wide Web and have e-mail facilities. These are all services that carry recurrent costs with service providers, which can be both government and private-sector organizations.
In some countries the poor reliability of telecom-munications services and power supplies requires that internal communications are supported by radio (wireless) communications. Once again, equipment items in this field are constantly evolv-ing, so the same issues regarding spares, service and replacement exists as for field instruments. It may also be the case that licence fees are required to keep dedicated radio bandwidths, especially if contact is operationally critical in emergency situations.
5.4.3 Operationallicencesandwarranty
Hydrological services are increasingly reliant on computer models and other software, for example for flood estimation, databases and GIS. These items are most likely to be provided by interna-tional companies, rather than be developed in-house. Thus the maintenance is dependent on

CHAPTER 5. MONITORING NETWORKS 5-11
the supplier and this is provided through service agreements, software licensing, upgrade provi-sions and warranty arrangements. These are all recurrent expenditure items that have to be identi-fied at the time of acquiring the facilities, and adequate finance provided on a continuing basis. If suppliers are not fully represented in a country, these support arrangements have to be paid for in foreign currency, so exchange facilities are required.
5.4.4 Staffissues
Hydrometric units depend on a range of skilled staff with both technical and professional back-grounds. The educational and work experience must be recognized by suitable remuneration, organizational structures and career opportunities, which can be problematical in what are often small units. Worldwide, there is a problem of staff reten-tion, as the technical and professional qualifications and skills required in hydrology are similar to broader fields of civil engineering and science. Larger organizations both within government and the private sector can often offer better salaries and better career prospects. In the case that hydrology is a small part of a major organization, for example an irrigation or water resources service, internal staff transfers are often the only way to achieve career development. This may result in loss of experienced staff due to their seeking a managerial or executive post, or the drafting in of inadequately qualified or inexperienced staff. The latter situation frequently occurs when a larger organization is restructuring, reducing staff numbers or filling vacancies when there is an embargo on external recruitment.
As hydrological services are invariably govern-ment organizations, they can suffer as part of the broader problems of cutbacks, poor pay scales and low morale. This situation is exacerbated when government salary payments are delayed and other allowances, for example housing, mobility and subsistence allowances, are not forthcoming. Without being particularly danger-ous, hydrological duties do entail some risk, for example the tasks of flood monitoring and river gauging, and may require staff to be away on duty or working extra hours in emergency situa-tions. It is important that these factors are recognized and rewarded.
5.4.5 Mobilityandtransport
Field operation is very dependent on adequate trans-port. Typical major requirements are for suitable field vehicles, boats and outboard motors, and these require high-quality maintenance for reliability and safety, with some built-in extra capacity to support enhanced levels of work during emergencies and to
retain flexibility for unforeseen breakdowns. Some countries have specific local conditions that require specialist equipment. For example, in Bangladesh the large rivers require specially built catamarans for flow gauging, which need to be of high-quality construction and adequately powered to be able to operate in high-flow conditions. They also require qualified pilots for safe operation.
In countries where travel conditions are physically difficult, for example in jungle or mountain terrain (for example Papua New Guinea or New Zealand) or where large distances are involved (for example in Namibia or India) it is of considerable benefit to use light aircraft or helicopters to transport teams and equipment. This requires high levels of recurrent budget support to cover commercial hire or charter rates. The most important factor is that there be adequate funds for the provision of fuel and that travel and subsistence allowances are adequate and promptly paid. If staff are out-of-pocket, they will find excuses not to carry out field duties, or skimp tasks in order to return to base quickly.
5.5 HYDROLOGICALDATARESCUE
5.5.1 Definitionofdatarescue
Data rescue is the process of archiving data at risk to avoid it being lost due to natural deterioration of the storing media, changes over time of data management agencies or natural hazards. The objective is to allow these data to be stored in a form in which they can be safely preserved for future use and easily accessed. This process may involve the electronic transcription of paper archives that are being degraded by humidity or rodent attack. It may equally involve the resurrec-tion of archives stored on out-of-date media or technologies, the provision for storing data in soft-ware and the digitization or image capture of current and past hydrological data into computer-compatible form for easy current and future access.
In a meeting on international data rescue organized by WMO in 2001, the following definition of data rescue was agreed:
An ongoing process of preserving all data at risk of being lost due to deterioration of the medium, and the digitization of current and past data into computer-compatible form for easy access.
This definition implies that:(a) Data should be stored as image files onto media
that can be regularly renewed to prevent the deterioration of the medium (for example cartridges, CDs and DVDs);

MANUAL ON FLOOD FORECASTING AND WARNING5-12
(b) Data already in computer-compatible media should be constantly migrated to storage facili-ties that conform to changing technologies;
(c) If necessary, data should be integrated from existing sources, for example paper archives and year books, in a form that can be used for analyses.
5.5.2 Problemsofdataarchiving
Data archiving is often not given the due impor-tance it deserves. In many countries, data are not well organized but confined to boxes or open shelves in obscure store rooms, and hence subject to moisture, dust, heat and attack by rodents and insects. When space is needed for other activities or office moves take place, the data are often discarded.
Loss of hydrological data amongst WMO Member countries is of major concern. This problem is more serious in developing countries where, due to many constraints, affordability for archiving data is usually limited. Certain efforts have been made to support NHSs in the past through data rescue projects at a very small scale. However, implemen-tation of these projects has revealed that the problem of loss of hydrological data is larger than initially perceived.
Hydrological data are costly, both in terms of effort and resources, to record and collect. Large volumes of data are lost due to being inadequately archived and also due to poor maintenance of data archives. The problems of hydrological data archiving vary from country to country, but the common factor is the storage of the data on computer and other media that are obsolete and not compatible with modern archiving and processing facilities. Such media include punched cards and magnetic tapes with no systems to read them. Some countries still keep volumes of data as hard copies (paper form), which face the danger of being lost, discarded or of deteriorating. Over time, the technology of data processing has evolved and changed so that consid-erable parts of these data have been irretrievably lost.
Chart recording raingauges and water level record-ers were for many years the mainstay of observing systems for hydrometeorology. Unfortunately, there was a tendency for backlogs of charts to build up without the proper analyses and data summaries being carried out. These charts remain to be proc-essed long after the processing routine within the organization has ceased. Large backlogs of unproc-essed chart data exist in both developed and less-developed NMSs and NHSs, and will require special efforts to digitize to make this valuable source of data available.
5.5.3 Justificationforhydrologicaldatarescue
Data rescue is vital for the preservation of histori-cal records related to hydrology. Historical data provide the observational basis for scientific, engi-neering, and economic decisions for national benefit. Numerous data were collected in the past, in some cases during a period of colonial adminis-tration in countries that are now independent. Changes in the latter may exacerbate problems because no detailed inventory has survived the change, but similar problems exist in developed countries with major changes in administrative organization. Once lost, these data can never be replaced, and all the effort made by past genera-tions of hydrologists and meteorologists will have been wasted. Now that climate change is of inter-national concern, it is even more vital that long-period, consistent data are available so that baselines and trends can be effectively established. Comprehensive datasets are critical to ensure that the studies on climate change, variability and extreme events are as correct as possible. Having these valuable data available will contribute to a whole range of societal benefits. In addition, the loss of descriptive station information (metadata) and measurement data can mean that rating curves and the quality of flow records cannot be reassessed.
In the hydrological data rescue survey carried out by WMO in 2007, it was revealed that past activi-ties in this respect have yielded very limited results, and the survey recognized the need for strengthen-ing the capacities in the countries for the development and use of up-to-date data manage-ment systems, including data rescue, that can be used for various societal objectives.
Particular reasons for data rescue include:(a) Forecasting models are more accurate when
longer time series are used;(b) Extreme hydrological phenomena are studied
more thoroughly and accurately;(c) Design of engineering projects, which critically
depend on hydrological information, is more reliable when very long hydrological records are used.
5.5.4 WMOpastinitiatives
The activity of WMO in the field of data rescue has a long history, beginning in 1979 through the RA I data bank project, which led to the later Belgium data-rescue programme. The Belgium-funded programme assisted over 40 African Members in preserving their meteorological data through a microfilm and microfiche process, and a copy of these data is now kept in each of

CHAPTER 5. MONITORING NETWORKS 5-13
the countries. In 1988, WMO established the Archival Climate History Survey Programme (ARCHISS) to retrieve and make available mete-orological data from the national archives of each country.
The general uptake and progress of these programmes has not, however, been fully adopted and many problems still remain and are becoming increasingly severe as time passes. In June 1999, the WMO Secretariat circulated a questionnaire to the Hydrological Advisers in 39 countries in Africa. Twenty-three replies (59 per cent) were received. Based on the replies received, it was clearly indicated that 82 per cent use paper for archiving their data and they requested WMO to assist them in rescuing these data. Following this survey, a pilot project to rescue hydrological data was launched in six English-speaking (Egypt, Eritrea, the Gambia, Ghana, Kenya and the United Republic of Tanzania) and five French-speaking countries (Chad, Congo, Niger, Rwanda and Togo). Under these projects, each country was provided with a computer, a printer, a scanner, and a software package for data processing and management (Hydata for the English-speaking countries and Hydrom for the French-speaking ones). More than 80 national staff were trained in workshops for 10 days on the applications of suitable software for data management, with a view to securing the data in electronic form, in addition to its paper-based status.
As a continuation of this initiative, a survey on hydrological data rescue needs was carried out by WMO in late 2007. It resulted in responses from 57 countries from the different Regions. A full analysis of the responses to the survey has yet to be published. Preliminary results have revealed that past activities have yielded very limited results and that there continues to be a need for strengthening the capacities for the development and use of up-to-date data management systems.
5.5.5 Datarescueanddigitization
Hydrological data should be regarded as significant assets with strategic value. It is imperative to convert physical or manual records such as text and images (microfiche) into efficient and digital forms. Information must be stored in media that ensure the storage is safe and the retrieval is quick. There are different base materials used for digitization, and these are briefly considered in the following points:
Hardcopy:
In many cases, observation books or logbooks are used directly as the source for keying in the data.
These may be handwritten observations, tables with printed data, or strip charts with graphical information. The type of hardcopy material deter-mines to a large extent the digitization method. There are a number of problems concerning digiti-zation of hydrological data from original logbooks. These include:(a) Unreadable data due to decayed material or
overwritten documents;(b) Irregular times of observation;(c) Measurements made with historical or outdated
instruments;(d) Measurements in historical units requiring
conversion to SI units.
Many highly valuable historical records are contained in yearbooks produced by government departments or meteorological archives that ceased publication with the advent of computer-based archives. Very few attempts have been made to digitize these extensive records, with the result that there is a break in continuity and ease of access. As a consequence, these records, which in many cases have a longer duration than the digital database that replaced them, are ignored once the staff with knowledge of pre-digital data sources have retired. The task of digitizing extensive historical records from book sources can be a major undertaking, especially as, to prove useful, they have to be merged with the existing database structure. Simply preserving the old records as scanned format is not satisfactory, as these data cannot be manipulated in the same way as a true digital database.
Hardcopy historical hydrological data are some-times stored as film (or microfiche) when authorities require the information for archive purposes. The quality of the images on films is mostly excellent, especially if high-quality mate-rial such as polyacetate film has been used. Film is an ideal medium for preserving chart data for later digitization, or for maps, plans and diagrams, for example gauging structures and maps of flood extent.
Digital images:
Digital images of data are now generally replacing the use of film, and are obtained by scanning or digitally photographing the hardcopy documents. Digitally imaged data still have to be entered by keying data into the operational database. Some software systems allow digital images to be displayed alongside the user database on the same computer screen, which allows data entry to be easier than typing data from a paper source. Nevertheless, transcription always carries the risk of error, so a rigorous checking system has to be adhered to.

MANUAL ON FLOOD FORECASTING AND WARNING5-14
Secure storage:
In some cases, a preliminary step in data rescue is to remove data from unfavourable conditions to a more secure storage location. The data records require collecting, organizing into some form of indexed or catalogued system, and storing in a controlled atmosphere or in airtight containers to protect them from further deterioration. This method of data storage can be used in situations of limited financial resources and will retain the source data safely until such time as facilities and capacity for full processing allow.
5.5.6 Prioritiesfordatarescue
Worldwide, there are vast quantities of old data-archive material and unprocessed data, as well as data locked up in redundant computer systems. It may be necessary to prioritize the process of digiti-zation as follows:(a) Priority of data:
(i) High-quality current data of importance nationally, regionally or globally that enhance or complete the established, current databases;
(ii) High-quality historical data of impor-tance nationally, regionally or globally that are at risk of loss and are of value in providing data for better statistical, design and trend analysis, or for expand-ing established databases.
(b) Priority of activities:(i) Convert data to computer-compatible
form (digital and image formats);(ii) Establish and maintain backup databases
in different locations that are not suscep-tible to the same risks of loss or damage;
this could be accomplished nationally or regionally.
A recent example of the digitization of extensive rainfall records in the United Kingdom provides an illustration of the complexity and detail involved in such tasks. The publication British Rainfall was produced as a book annually from the 1860s until 1968. It contained the definitive data and statistics for all rainfall stations in the United Kingdom (including the whole of Ireland up to 1930). There is a tendency for this source to be sidelined because of its lack of accessibility by electronic means. The United Kingdom Natural Environment Research Council provided funds for a contractor to digitize the data and make them available on the Website provided by the British Atmospheric Data Centre (BADC: http://badc.nerc.ac.uk/).
The printed archive was divided into three parts: rainfall data, text chronicles and figures. The data (monthly, daily and some subdaily information) were typed into an Excel file for each year with fields of day, month, year, gauge name, county or division, and depth in inches and millimetres. The text chronicles were either scanned with text recog-nition software or typed, depending on the quality of the original, and saved as a Word document for each year. Figures as photos or rainfall maps were scanned and saved as jpeg files together in a sepa-rate folder for each year.
The project required a project coordinator, two supervisory staff and a team of nine operators (mostly students working part-time), and took two years to complete. A high level of checks were made on both data and text, and it is estimated that the total cost of the project was about £40 000.

6.1 DATATRANSMISSION
6.1.1 Basicrequirements
A flood forecasting and warning system is required to operate in real time, that is, the data used are provided from current or very recent observations. This in turn requires a hydrometric data transmis-sion system (HDTS) that transmits data measured at remote telemetry stations to a receiving centre for further processing and operations. The sections following describe the generic specifications of an HDTS and the functional performance that such a system should provide. It does not describe the specifications of the equipment and units consti-tuting an HDTS.
The HDTS should be designed with a full under-standing of the necessity and importance of the flood forecasting and warning service in river basins in which the system is to be used, taking the follow-ing elements into consideration:(a) Functionality;(b) Geographical and physical constraints;(c) Time structures for data and outputs;(d) Installation conditions;(e) Reliability and maintenance;(f) Operator and public safety;(g) Economy.
The final system specifications should be deter-mined through a process of collaboration between technical specialists in the fields of hydrology, data management and telecommunications. The conceptual configuration of an HDTS is shown in Figure 6.1.
The HDTS comprises remote telemetry stations and a receiving centre. The remote telemetry stations are installed at hydrometric points and the receiving centre is installed at a point needing hydrometric data to prepare flood forecasting information. A remote telemetry station basically consists of moni-toring and telemetry communications equipment, to which power is supplied from power supply equip-ment. The telemetry equipment is connected to sensors that measure hydrometric data. The equip-ment communicates with the receiving centre in accordance with a preset data acquisition sequence.
The remote telemetry stations are connected to the receiving station via a communication system, which can be by a variety of means. The receiving station basically consists of communications and
monitoring equipment, linked to an operations and control facility. This facility has a range of functions, including the collection of hydrometric data from remote telemetry stations in a preset collection sequence, data processing, online stor-age, data display and printing, and recording. Information processing and archiving may be installed as part of this system.
The HDTS should be designed to have an optimal economic performance in terms of required func-tions and reliability in relation to both capital and recurrent costs. The economy of the system should be evaluated considering the entire timespan for which it is intended to function, and should include the initial cost, the operational cost and the costs of maintenance, spares and a proportion of full replacement of units for anticipated breakdowns and serious damage. Cost estimates for the HDTS should allow for future updating or expansion.
The HDTS is required to carry out both data meas-urements and processing. The requirements for observation and measurement of data to be acquired have to be based on operational purposes. The usual range of data items is as follows:(a) Data type and number of measuring points;(b) Range of measurement, effective digits, meas-
uring accuracy and resolution;(c) Timing of measurement;(d) Input interfaces;(e) Threshold values for detecting alarms;(f) Outstation functionality reporting.
The results of data measurements may be transmit-ted as raw data without being processed. However, it is more usual for data to be preprocessed into a form that can be transmitted at the interfaces with the sensors, and in some cases it may be useful to carry out data manipulations, for example to calcu-late the moving average, that is, the maximum and minimum values of the data measured at successive time points, at the remote telemetry stations and transmit the calculated results. The bulk of data processing is normally carried out at the receiving centre (the operational control) to prepare data in formats for model input.
The HDTS will have functions to store data and information on the system. The data storage in the HDTS should be intended for the following functions:(a) Buffering measured data until they can be
transmitted to an information-processing
CHAPTER 6
REAL-TIME DATA TRANSMISSION AND MANAGEMENT
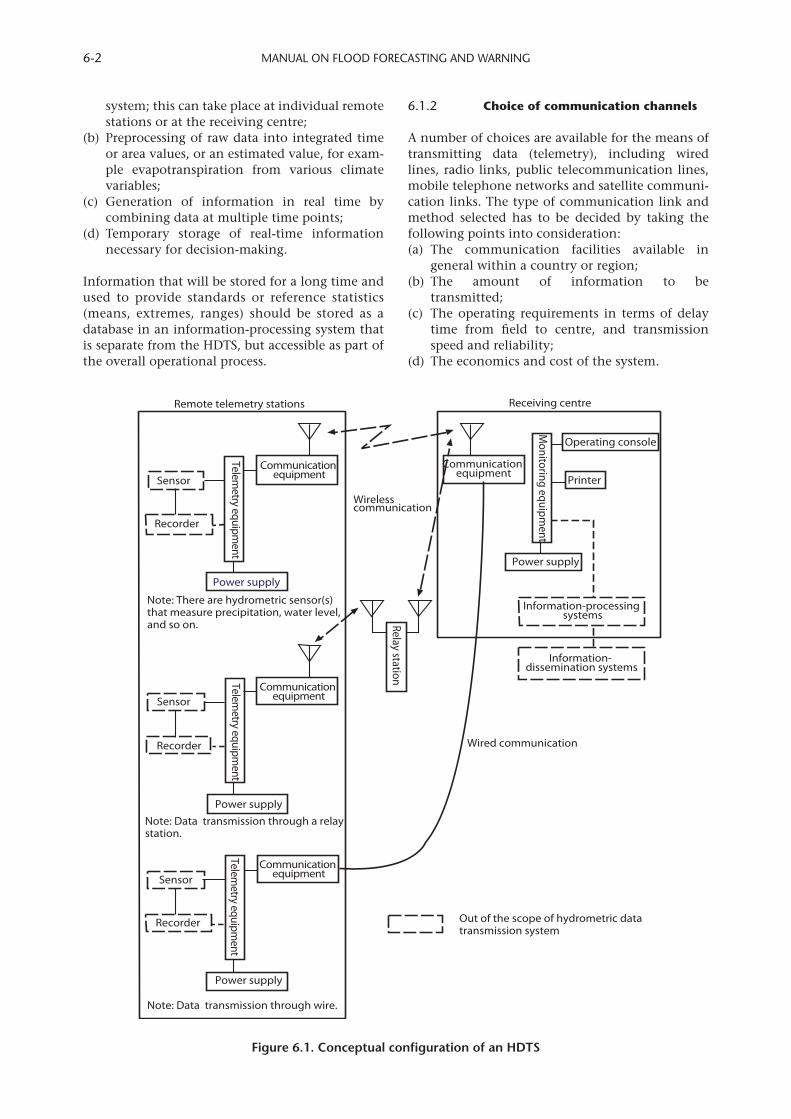
MANUAL ON FLOOD FORECASTING AND WARNING6-2
system; this can take place at individual remote stations or at the receiving centre;
(b) Preprocessing of raw data into integrated time or area values, or an estimated value, for exam-ple evapotranspiration from various climate variables;
(c) Generation of information in real time by combining data at multiple time points;
(d) Temporary storage of real-time information necessary for decision-making.
Information that will be stored for a long time and used to provide standards or reference statistics (means, extremes, ranges) should be stored as a database in an information-processing system that is separate from the HDTS, but accessible as part of the overall operational process.
6.1.2 Choiceofcommunicationchannels
A number of choices are available for the means of transmitting data (telemetry), including wired lines, radio links, public telecommunication lines, mobile telephone networks and satellite communi-cation links. The type of communication link and method selected has to be decided by taking the following points into consideration:(a) The communication facilities available in
general within a country or region;(b) The amount of information to be
transmitted;(c) The operating requirements in terms of delay
time from field to centre, and transmission speed and reliability;
(d) The economics and cost of the system.
Figure 6.1. Conceptual configuration of an HDTS
Sensor
Sensor
Sensor
Recorder
Recorder
Recorder
Remote telemetry stations Receiving centre
Operating console
Printer
Power supply
Power supply
Power supply
Power supply
Information- dissemination systems
Information-processing systems
Communication equipment
Communication equipment
Communication equipment
Monitoring equipm
ent
Telemetry equipm
entTelem
etry equipment
Telemetry equipm
ent
Communication equipment
Wired communication
Wirelesscommunication
Out of the scope of hydrometric datatransmission system
Note: There are hydrometric sensor(s)that measure precipitation, water level, and so on.
Note: Data transmission through a relaystation.
Note: Data transmission through wire.
Relay station

CHAPTER 6. REAL-TIME DATA TRANSMISSION AND MANAGEMENT 6-3
The principal features, advantages and disadvan-tages of different communication methods are outlined in the following paragraphs.
Telephone lines
Telephone lines provide a switched telephone network with dial pulse or multi-frequency signal-ling. The cost is usually based on a communication time-dependent charge rate, although in some areas, service providers have a fixed rate, which may be negotiable with the company concerned. Analog and digital lines may be available. The transmission standards will conform to interna-tional or domestic standards and the communication quality is guaranteed.
The transmission speed on an analog line using communication modems is over 50 kilobits per second (kbps) if the line is of good quality. The transmission speed on a digital line using communication modems is usually over 100 kbps. The traffic on the lines may drastically increase during critical times, for example during a major flood event, and problems with delay and interruption may ensue due to congestion.
Mobile phone connections
Mobile phone links provide a switched mobile telephone network with multi-frequency signal-ling. For data communication, the cost may not be dependent on the communication time, but on the amount of data (that is, the number of pack-ets). There are examples of fixed cost but with limitation to data communications. Both analog and digital systems are available, although the analog system is classified as first generation, and is usually inappropriate for data communications. The digital system of the second generation allows data communication at 9 600 bits per second (bps) or more. Generations 2.5 and 3 of mobile commu-nications allow high-speed data communication at several hundreds of kbps. The service specifica-tions usually conform to international or domestic standards, and the communication quality is guaranteed.
Mobile phone services use both wireless base stations on land and satellites. The latter services use a switching system, including those in the packet-cost or fixed-cost system. As with conven-tional telephone services, traffic on the lines may drastically increase at critical times and problems of communication may result. Mobile phone services can also use the short message service (SMS) provision for the transmission and recep-tion of words and characters between points in a network.
Common-carrier leased lines
Common-carrier leased lines provide dedicated line service to a specific user or group of users. The cost is usually fixed by negotiation with a service provider, and as for public service tele-phone lines can carry analog and digital signals. Usually, their transmission performances conform to international or domestic standards, and the communication quality is guaranteed.
The transmission speed on an analog line using communication modems is over 50 kbps if the line is of good quality. Transmission speed on a digital line can be 50 kbps or over. Some provid-ers may have high-density, high-speed services at speeds up to several hundreds of megabits per second (Mbps). Since lines under this type of arrangement are for exclusive use, there should be no congestion problems caused by increase in traffic.
Internet connection
A constantly connected high-speed line service is available for exclusive use of data communication through the Internet. Depending on the transmis-sion routes to be used, these services can be provided by optical fibre cables, digital subscriber line (DSL) and cable television (CATV). The lines are constantly connected and the cost is usually fixed. The available communication protocol is limited to Internet protocol (IP). Service on the Internet is based on the “best effort” of the Internet service provider (ISP), and there may be problems of congestion at busy times. Another source of problems could be random outage by the ISP, or a breakdown in their own facilities over which the end-user has no control.
Privately owned lines
In this situation, lines can be installed and oper-ated by users themselves, similar to railway signalling or emergency services. The initial investment may be high, but operating costs are very low. Various transmission media are availa-ble, such as copper twisted-pair cables, coaxial and optical-fibre cables. There are various types of line terminal equipment available from simple communication modems to multiplex terminal equipment. It is possible to select a suitable range of communication speeds from several tens of bps to several giga bits per second (Gbps) by combining the mentioned communication media and line terminal equipment. The quality of performance on private links is the responsibility of the users themselves, and thus there is a need for appropriate internal staff and logistic resources to manage the operation, especially when the
MANUAL ON FLOOD FORECASTING AND WARNING6-4
system comes under pressure during critical periods.
Very high frequency and ultra high frequency (VHF and UHF) radio communication links
The effective use of these frequencies is available worldwide, under the control of the International Telecommunication Union (ITU). Frequency ranges are globally specified as follows:VHF: 30–300 megahertz (MHz);UHF: 300–3 000 MHz.
The allotted frequency ranges are different from country to country. The number of central frequen-cies (the number of channels) that can be used in a region or country is usually limited, with one central frequency (one channel) jointly used by a number of remote telemetry stations. To avoid interference, neighbouring systems cannot adopt the same frequency group and the selected frequency for communication has to comply with local regula-tions and laws. Interference and loss of signal cannot be avoided, but risks of disruption can be minimized by careful allocation of frequencies. VHF and UHF can support analog and digital systems.
Radio communication equipment controls the speed and capacity of transmission and recep-tion of signals. The transmission speed is usually 200–1 200 bps on an analog system used for voice communication using frequency shift keying (FSK). The transmission speed on a digital system or analog system by use of minimum shift keying (MSK) or Gaussian MSK (GMSK) is usually 1 200–9 600 bps.
Multiplex radio communication links
The use of frequencies for these systems is available worldwide under the control of ITU. The available frequency range extends from UHF to super high frequency (SHF1: 300 MHz to 30 gigahertz(GHz)). The allotted frequency range varies from country to country. These links are used for multichannel tele-phone communications and high-speed data communications and can support analog and digital signals. If links do not pass through exchanges, the communications are always connected.
In the case that exclusive radio communication links are used, the operating frequencies and output powers are stipulated by international standards and national regulations. Radio communications can operate over distances of several tens of kilome-tres. Relay stations may be needed for longer distances or in hilly areas. As the quality of radio communication depends on the external condi-tions, propagation tests should be made after designing the communication links.
Satellite communication links
The very small aperture terminal (VSAT) and the International Maritime Satellite Organization (INMARSAT) are typical satellite communication facilities used for data transmissions. There are also other satellite communications available from serv-ices internal to individual countries, for example national communications satellites. The digital circuits via VSAT can also provide voice conversa-tion. The transmission speed via VSAT varies depending on the class of service, but it is over 9 600 bps. The transmission speed on INMARSAT also varies depending on the class of service, but is over 200 bps. Problems can ensue as transmission signals may attenuate during heavy rains, causing loss of communication.
As remote telemetry stations are located at selected hydrometric observation points, they are thus distributed over a wide geographical area. Remote telemetry stations cannot always be located at opti-mum hydrological sites. Therefore, depending on the communication medium, relay or transfer stations may need to be provided in the system. These geographical constraints should be consid-ered not only at the time of designing the network but also with respect to plans for its future development.
The locations of remote telemetry stations are determined by considering the distances from the receiving centre and the topography of the sites at the remote stations. The availability of existing communication lines and radio links, the radio propagation conditions (if radio links are chosen), the supply facilities from power sources and the access roads should also be considered as important factors for determining the locations. Examples of the conditions required for locations for the instal-lation of radio communications equipment when VHF or UHF radio communication links are used are as follows:(a) The degree of interference from one radio
station to another should be low enough not to prevent reliable communications;
(b) If two or more antennas are to be installed close to each other within the same site, the degree of mutual interference should be low, so as not to hamper communications; if there is unavoidable interference, this can be minimized by, for example, increasing the distance between the antennae or by insert-ing filters;
(c) Radio communication stations for point-to-point communication should be located at topographical elevations that are as low as possible through comprehensive evaluation of the radio paths, communication links, terrain profiles and conditions of the locations; they
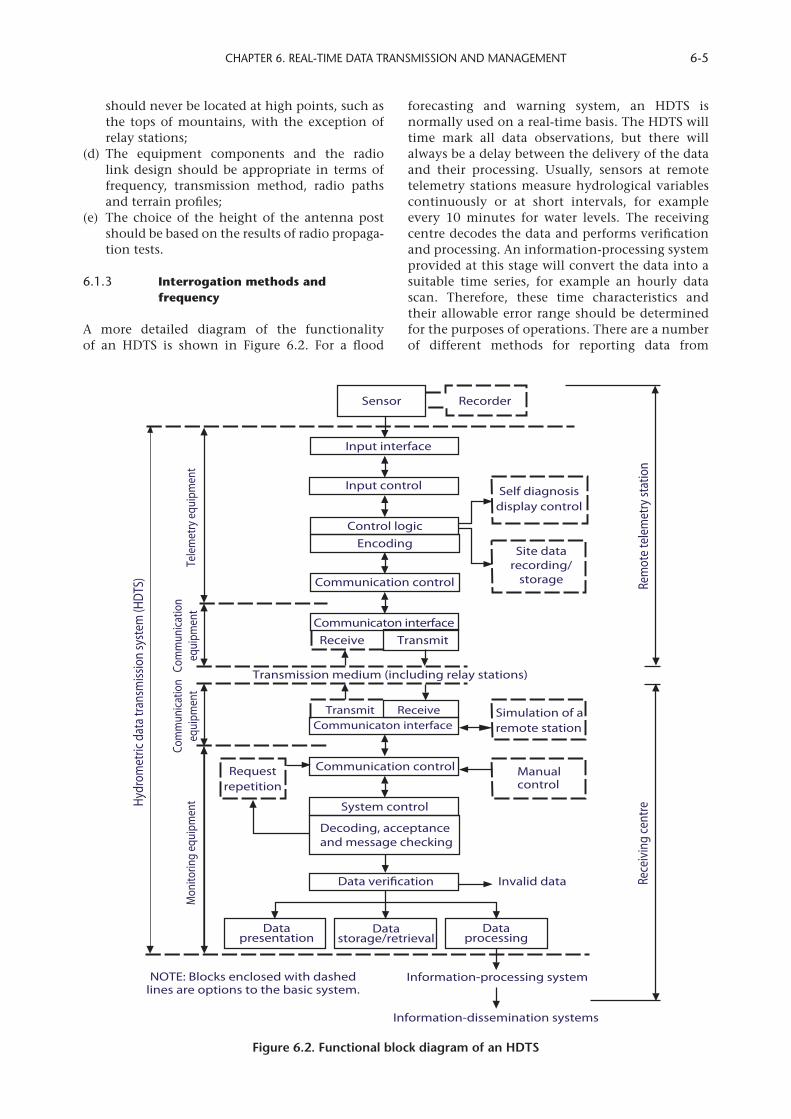
CHAPTER 6. REAL-TIME DATA TRANSMISSION AND MANAGEMENT 6-5
should never be located at high points, such as the tops of mountains, with the exception of relay stations;
(d) The equipment components and the radio link design should be appropriate in terms of frequency, transmission method, radio paths and terrain profiles;
(e) The choice of the height of the antenna post should be based on the results of radio propaga-tion tests.
6.1.3 Interrogationmethodsandfrequency
A more detailed diagram of the functionality of an HDTS is shown in Figure 6.2. For a flood
forecasting and warning system, an HDTS is normally used on a real-time basis. The HDTS will time mark all data observations, but there will always be a delay between the delivery of the data and their processing. Usually, sensors at remote telemetry stations measure hydrological variables continuously or at short intervals, for example every 10 minutes for water levels. The receiving centre decodes the data and performs verification and processing. An information-processing system provided at this stage will convert the data into a suitable time series, for example an hourly data scan. Therefore, these time characteristics and their allowable error range should be determined for the purposes of operations. There are a number of different methods for reporting data from
Figure 6.2. Functional block diagram of an HDTS
Sensor Recorder
Input interface
Input control
Control logicEncoding
Communication control
Data veri�cation Invalid data
Communication control
System control
Communicaton interfaceReceive Transmit
Transmit ReceiveCommunicaton interface
Simulation of aremote station
Self diagnosisdisplay control
Site datarecording/
storage
Manualcontrol
Transmission medium (including relay stations)
Decoding, acceptanceand message checking
Datapresentation
Requestrepetition
Datastorage/retrieval
Dataprocessing
NOTE: Blocks enclosed with dashedlines are options to the basic system.
Information-processing system
Information-dissemination systems
Rece
ivin
g ce
ntre
Rem
ote
tele
met
ry st
atio
n
Com
mun
icatio
neq
uipm
ent
Com
mun
icatio
neq
uipm
ent
Tele
met
ry e
quip
men
tM
onito
ring
equi
pmen
tHydr
omet
ric d
ata t
rans
miss
ion
syst
em (H
DTS)

MANUAL ON FLOOD FORECASTING AND WARNING6-6
remote sites, as described in the following paragraphs:(a) Cyclic polling: This is used when a number
of remote telemetry stations can use jointly a single communication line or waveband. The remote stations are polled one after another, and after the last telemetry station in the group has been polled, the first station is polled again, thus making the polling cyclic, as illustrated in Figure 6.3. In general, the entire system should be polled at intervals based on the highest demand standard, but the system may also be divided into several groups by the degree of demand for intervals, each of which is cycli-cally polled independently.
(b) On-demand polling: This is a variant of cyclic polling in which there is a set time inter-val, for example one hour, between separate
polling cycles (see Figure 6.4). This method is appropriate for systems that use a means of communication based on time-dependent charging, for example telephone lines. It is also effective for remote telemetry stations that need to minimize power consumption, such as those using battery power. The method may be less appropriate in the case that there are many remote telemetry stations to be polled.
(c) Batch polling and sequential reporting: This is an improved method that combines on-demand polling with batch reporting (see (e) below). The arrangement is illustrated diagrammatically in Figure 6.5 and has the following characteristics:(i) The receiving centre polls all remote
telemetry stations at a fixed time interval, similar to on-demand polling;
Figure 6.4. Diagram of on-demand polling
Figure 6.3. Diagram of cyclic polling
Receivingcentre
Remotetelemetrystation 1
station 2
station 3
station 4
Key
measuring
Time
M
M
M
M
M
M
M
M
M
M
M
M
M
Figure 6.3
Receivingcentre
Remotetelemetrystation 1
station 2
station 3
station 4
Key
measuring
Time
M
Observationtime
Observationtime
M
M
M
M
M
M
M
M
Figure 6.4

CHAPTER 6. REAL-TIME DATA TRANSMISSION AND MANAGEMENT 6-7
(ii) Each remote telemetry station performs measurement when it is polled, and stores the data in its local memory;
(iii) Each remote telemetry station transmits the measured data to the receiving centre after a specified waiting time (Wn); the Wn should be specified as a different time constant for each station to prevent jamming.
As mentioned previously, on-demand polling has the disadvantage that it may involve different measuring times at individual stations. The batch reporting method (see (e) below), however, needs a highly precise clock at each station. The method of batch polling and sequential reporting conducts measurements at all the stations at a set time when the receiving centre makes a simulta-neous call to all the stations. Therefore, the measuring timing is the same at all stations, and there is no need of a precise timing at each station.
(d) Continuous transmission: This can be carried out when a remote telemetry station has exclu-sive use of a communication line between the station and the receiving centre. This method allows the remote telemetry station to continu-ously and sequentially transmit the measured data to the receiving centre, this being in reality a sequence of transfers separated by a minimal time interval. The receiving centre, having access to all data, can then have a considerable degree of freedom in setting the interval for sampling the data, or conducting some preprocessing.
(e) Batch reporting: This is a method by which the data are stored at several remote telemetry
stations for a certain period of time and then transmitted as a batch of data to the receiving centre (see Figure 6.6). Transmission of data is made by polling from the receiving centre or by an automatic reporting function as part of the remote telemetry station functionality. This method is effective for telemetry systems that cannot make communications over certain periods, as is the case with transmission via polar-orbit satellites. Since the method involves the taking of measurements independently at each remote telemetry station, a highly precise clock is needed at each station to conduct punctual measurements and time transmissions. Each measuring station needs to be equipped with a storage facility device to retain measured data prior to transmission. This system is only viable on major river basins, where time of travel of flood peaks takes place over periods of days, rather than hours.
(f) Event reporting: This is a method involving the automatic transmission of data, by individ-ual remote telemetry stations to the receiving centre, when the stations’ sensors detect a precipitation or water level value exceeding the preset upper (or lower) threshold (see Figure 6.7). This method effectively allows the receiving centre to serve as an automatic alert, with the immediate detection if critical events. However, when data are not transmitted to the receiving centre for a long period it is difficult to identify whether there is no event or if there is a system problem. Therefore, this method should be combined with a facility to auto-matically transmit a check signal at regular intervals to establish that the station and the transmission link are still working.
Figure 6.5. Diagram of the batch polling and sequential reporting method
Receivingcentre
Remotetelemetrystation 1
station 2
station 3
station 4
Key
measuring
waiting time
Time
M
M
M
M
M M
M
M
M
Observationtime
Observationtime
W1
W2
W3
W4
W1/W4
W1
W2
W3
W4

MANUAL ON FLOOD FORECASTING AND WARNING6-8
6.1.4 Reliability
The environmental conditions at remote telemetry stations can be quite harsh, especially in tropical, desert and mountainous areas. Special considera-tion needs to be given when using equipment outside the ranges of conditions for which they were designed. Therefore, the following conditions should be considered:(a) Atmospheric temperature range and rate of
change;(b) Relative atmospheric humidity range;(c) Wind velocity;(d) Atmospheric salinity and dust;(e) Environmental conditions inside equipment
housing;
(f) Available power supply conditions (including protection against current surge due to lightning);
(g) Potential for flood damage and access during flooding;
(h) Seismic resistance.
Most equipment will include information on the manufacturer’s recommendations for operating ranges, and these should be carefully checked against expected field conditions. Manufacturers also provide information on the resilience of hous-ing to dust, moisture and salinity. The environmental conditions within the receiving centre also need consideration, as air conditioning and enhanced dust and moisture control may be needed. Other
Figure 6.7. Diagram of the event reporting method
Receivingcentre
Remotetelemetrystation 1
station 2
station 3
station 4
Key
Time
Event
Event
Event Event
Event
measuring
EventM
MM
M
M
M
M
Figure 6.7
Figure 6.6. Diagram of the batch reporting method
Receivingcentre
Remotetelemetrystation 1
Observationtime
Observationtime
station 2
station 3
station 4
Key
Time
measuring
M M
M M
M M
M M
M
Figure 3.2

CHAPTER 6. REAL-TIME DATA TRANSMISSION AND MANAGEMENT 6-9
details that need to be taken into account are the following:(a) The size of the compound for the instruments
and transmission equipment should be suffi-ciently large to meet exposure requirements;
(b) The terms and conditions covering use of the site must be formalized, which may involve the landowner’s permission, leasing contracts or purchase of the land; the length of time needed for legal agreements to be reached should not be underestimated;
(c) Weather conditions at the site must be repre-sentative of the surrounding areas, for example sites should not be overly sheltered or exposed and so have their own microclimate;
(d) Sites should be safe against floods and landslides;
(e) Where solar batteries or wind generators are used, the prevailing conditions (annual and seasonal) must be sufficient to meet operating demands;
(f) The conditions of any nearby obstacles, such as trees, buildings and physical terrain, should not exert a significant effect on the energy-producing devices;
(g) Access to the sites should be easily available all year round for installation and maintenance; this may be through the provision of a perma-nent access for four-wheel drive vehicles, a helipad or airstrip.
The HDTS of a flood forecasting and warning serv-ice must be designed for continuous operation and therefore has to operate during difficult condi-tions, such as heavy rains and floods. Designers will have to consider the reliability of the equip-ment and of the entire system. Thus, for the key functions of the system, duplicate systems should be provided, for example duplicate power or tele-communication lines and back-up generators, and the minimum acceptable redundancy of the system should be clearly defined. System redun-dancy is best expressed as minimum downtime, both in terms of duration of a single failure (in hours) and total down time (percentage) during a particular period, for example one or three months.
The components of the HDTS should be as simple and robust as possible, so that it is easy to check operation and replace parts or instruments. The system’s continued maintenance and capacity for modification and development of software, both for operation and data processing, has to be an important consideration when it is designed and established. The HDTS should be designed to enable the receiving centre to monitor the operational status of the entire system, identify problems with communication links and instruments, and control necessary operations. Full documentation must be maintained on
equipment and procedures, and a thorough asset-management system established.
Power supply
A high-reliability power supply is essential for the operation of an HDTS, and requires careful consid-eration. Mains power supply to remote telemetry stations may not be available or sufficiently stable. Even where an external power supply such as a commercial power line is used to run the system, batteries and other backup power sources should be provided in case of a mains failure. Systems of key importance, such as those at the central receiv-ing and control unit, and components requiring high-power capacity, should have backup genera-tors provided. The guaranteed backup hours that are needed should be determined based on the importance of the system. This may vary from several hours to several days.
Where external power supplies are not available, heavy-duty battery, photovoltaic or wind power generation is used. Additional backup batteries should also be used if there is a possibility that there may be periods during which power cannot be generated because the photovoltaic or wind power supply is affected by weather conditions. The guaranteed backup duration should be deter-mined based both on the prevailing weather conditions at the area where the system is to be installed, and on the importance of maintaining the operation of the system. Time scales for backup operations are in the range of from one week to one month, but not longer. Some more specific points on the two modes of power supplies are as follows:(a) Mains power supplies:
(i) DC power supply: This may be required for the operation of particular items of equipment. DC is converted from AC by transformer to charge a battery source that provides an uninterruptible power supply. The requirement for the DC power supply is that it has to satisfy the power consumption of the units and maintain the charge on batteries.
(ii) Automatic voltage regulators (AVR): Sometimes called surge controllers, these are required where the fluctuations of power are greater than the ranges of toler-ance of equipment. The AVR may need to be used in conjunction with a backup device, such as a UPS (see (iii)).
(iii) Uninterruptible power supply (UPS) system: These devices are available in a range of sizes and capacities to provide backup power when the main source fails, for example during power cuts, load shedding and disruption by lightning. If

MANUAL ON FLOOD FORECASTING AND WARNING6-10
the need for a long duration of uninter-ruptible power is considered necessary, the UPS may need to have an engine generator for backup and to ensure the start-up function when power is restored. UPS equipment is widely used to support PC or computer network operation. In this case the capacity of the UPS then needs to provide backup for a period of time sufficient to ensure the proper shut-down procedures.
(iv) Backup engine generator: These are gener-ally used with UPS and other systems for operation centres and particularly impor-tant observation points, where long and frequent power failures may occur. Generators are usually diesel powered, and the output rating must be sufficient to support the power requirement of dependent equipment, and also lighting and possibly air conditioning. It is recom-mended that a generator has the func-tionality to start when it automatically detects power interruption or significant decrease in power.
(v) Lightning protection: In areas where lightning occurs frequently, it is strongly recommended to use lightning conduc-tors or transformers, and also to provide surge protection.
(b) Non-mains (in situ) power supplies:(i) Photovoltaic (solar) power generation:
This is the most widely used type of inde-pendent power source due to its capac-ity to supply a relatively stable output power. The size and capacity of the solar panel (photovoltaic array) must be sufficient to meet the equipment power demand and to charge backup batteries. Solar panel power should be backed up by a storage battery, which has to supply power during periods of no sun, that is, overnight and during cloudy periods or low sun intensity. A charge controller and blocking diode are suggested for this equipment arrangement.
(ii) Wind turbine power generation: In loca-tions where there are sufficient wind speeds above a minimum threshold, wind turbine generators or combinations of wind turbine generators and photovoltaic power generators are used. The decision to use a wind turbine generator should be based on local data or a site wind survey over a period of one to two years. As power generation is proportional to the cube of the wind speed, care should be taken to determine the capacity of the generator. A wind turbine should be combined with a storage battery to supply backup power
during periods with light or no winds. A charge controller is also recommended. Many equipment suppliers now provide compatible hybrid power systems, combining wind and photovoltaic power generation, customized to the demands of the telemetry station.
(iii) Batteries only: For remote telemetry stations where it is difficult to acquire a power supply by the means described above, a power source using only batteries may be the only option. Observation stations and telemetry equipment that are operated solely with batteries may require large battery capacities for long periods of operation between battery changes. In these cases, the telemetry systems should be designed for power saving and the batteries exchanged with newly charged ones at regular intervals.
6.2 DATAPREPROCESSING
6.2.1 Generalconsiderations
The data used in a flood forecasting and warning system should be considered as a subset of those larger databases covering hydrology, meteorology and climatology. Thus, the specific data and processing systems used for flood forecasting and warning should conform to the fundamental principles and guidance used in the established practice Manuals, that is, the latest available Guide to Hydrological Practices (WMO-No. 168) and Guide to Cl imato log i ca l P rac t i ces (WMO-No. 100). Detailed quality-control procedures should be based on relevant parts of ISO 9001, as recommended to hydrological services. It is not intended to reproduce details from these standards, but salient points will be covered as they particularly reflect on the needs and characteristics of flood forecasting and warning services.
The distinguishing feature of a flood forecasting and warning operation is that it is conducted in real time or near-real time, and many of the formal data-processing routines for accuracy and consistency cannot be carried out. Therefore, steps have to be taken to ensure high quality and reliability from source, and to ensure that checks and balances are built in to the data-processing system, whose function is primarily to provide reliable data for model inputs, forecasts and decision making. It should be noted that the discussions that follow on quality checking and data infilling relate to general data management.

CHAPTER 6. REAL-TIME DATA TRANSMISSION AND MANAGEMENT 6-11
They are separate in a number of respects from the data quality issues regarding model studies that have been covered previously in this Manual.
6.2.2 Qualitycontrol
Data management in flood forecasting and warn-ing operations have to depend heavily on computerized data-validation tools and tech-niques. Although these are now much more powerful and effective than formerly, professional checking of values has to be carried out, particu-larly where items are flagged by automatic controls. Hydrologists and meteorologists will need to exer-cise informed and considered judgement on whether to accept, reject or correct data values so indicated.
Validation techniques are devised to detect common errors that may occur, and normally the programme output will be designed to show the reason for the data values being flagged. When deciding on the complexity of a validation proce-dure to be applied to any given variable, the accuracy to which the variable can be observed and the ability to correct detected errors should be kept in mind.
Data have to be checked and verified to ensure their quality, and hence the validity of the subsequent estimates and forecasts. Data verification can be classified into two processes:(a) Detection of errors in data transmission can
be performed using, for example, parity bit checking, cyclic redundancy checking (CRC), inbuilt error reporting and detection codes. Methods are often provided by the supplier as an integral part of the network system, and should be included in the communication control procedures.
(b) Examination of data properties of the incom-ing hydrometric data, by comparison with the known range of sensors, physical upper and lower limits of data values, and limits of rate of change of measured data. Threshold values should be specified individually for different items. The verification system should gener-ate reports that identify all items of suspect or potentially erroneous data.
Visual checking of plotted time series of data by experienced personnel is a very rapid and effective technique for detecting data anomalies. For this reason, most data-validation systems incorporate a facility to produce time series plots. Rapid changes of either a value or its trend are often pointers to erroneous or spurious data items. Comparison with plots from adjacent stations is also a very simple and effective way of monitoring inter-station consistency.
Validation methods fall into three main categories:(a) Absolute checking: This implies that data or
code values have a value range that has zero probability of being exceeded. Thus, geograph-ical coordinates of a station must lie within the country boundary, the day number in a date must lie in the range 1 to 31, and in a numeric coding system, a mixture of alpha-numeric characters, for example 43A, cannot exist. Data failing these tests must be incor-rect. It is usually a simple task to identify and remedy the error.
(b) Relative checking: This includes the following:(i) Expected ranges of variables;(ii) Maximum expected change in a variable
between successive observations;(iii) Maximum expected difference in vari-
ables between adjacent stations.
The range limits should be broad to allow for extremes that have not previously been recorded and the number of non-conforming values should remain manageable in the opera-tional context. The utility of these techniques depends on the density of the observation network in relation to the spatial variation of the variable. Networks for flood forecasting systems are more site specific than general hydrological and meteorological networks, so some of the spatial variation criteria may not be appropriate.
(c) Physico-statistical checking: This includes the use of regression between related variables to predict expected values. Examples of this type of checking are the comparison of water levels with rainfall totals and the comparison of evaporation values with temperature. Such checks are particularly relevant to observations from sparse networks, where the only means of checking is to compare with values of inter-related variables having denser observation networks. Most of the relative and physico-statistical checks are based on the use of time series, correlation, multiple regression and surface-fitting techniques.
6.2.3 Missingdatainfilling
The usefulness of a flood forecasting system is highly dependent on the completeness and conti-nuity of the data available. However, filling missing data with estimates can severely compro-mise its value for certain purposes, for example filling in with a mean series value will be inap-propriate for missing points in a flood event. Estimated data items should be flagged so that their presence is apparent to the user and easily traceable.

MANUAL ON FLOOD FORECASTING AND WARNING6-12
Interpolated values, for example for rainfall, should only be used with caution and if the nature of the storm rainfall distribution is sufficiently regular. This is only effective for point rainfall measure-ments from raingauges. It is not possible to interpolate missing data from blocks or sequences of pixels. A gap in a water level record may be filled with a straight line or curve as applicable, if the resulting plot of the data shows consistency with the data on either side. Filling a gap in a data record with synthetic data derived by correlation is not recommended.
6.3 DEVELOPMENTANDMANAGEMENTOFDATA
6.3.1 Datamanagementforfloodforecastingandwarning
There is a defined flow path that hydrometeorologi-cal data must follow from the point of collection, as input into the system, through validation, to dissemination and use within decision processes. This path is essentially the same regardless of the scale or focus of operations.
The principal functions of the receiving centre are data collection through telemetry from the field network, data checking and verification, data processing, and dissemination of the results to users. These processes require a comprehensive information-processing system. Details of teleme-try requirements have been examined in previous sections. This section will focus on data storage, access and dissemination, and demonstrate where they fit in the data-management process.
6.3.2 Dataarchiving
Data permanence
The database for a flood forecasting and warning system must be considered as a separate entity from the type of database used in general water resources applications. Data received at an operational flood warning centre should also be saved in a reliable and permanent manner, that is, as an archive. This will provide a means for review and analysis of past performance and to compare historical events. The permanence of the data must be assured even if processing units or instruments are replaced, and the best approach to this is to establish a separate database, which is not dependent on particular peripherals or terminals or format of data transmissions.
It is important to decide which of the numerous datasets produced in a flood forecasting and
warning operation should be stored. There are many stages within the process of data management, from recording to dissemination, and each of these stages can represent one or more distinct datasets. At the other extreme, if the archive exists only as a summary dataset of processed and validated data there is no means for understanding how the data were derived, how it was measured and its potential limitations. The optimum arrangement falls between these two extremes.
The level at which this data storage is performed will be determined by a number of factors such as available storage space, availability of funds for storage and documentation, and the availability of staff. There will inevitably be a trade-off between the completeness of the archive and the resources available. For an operational entity such as flood forecasting and warning, the archive system may be limited to the raw and the final datasets, with a file of notes documenting the decisions and edits made. The following points are common to data archiving and relevant to a flood forecasting and warning system:(a) Raw data files must be kept; these will largely
be records of the telemetered data, for exam-ple time of tip from tipping bucket raingauges (TBRs), but could include radar rainfall records and operator notes;
(b) All processed datasets should be associated with descriptive metadata records detailing the origins of the dataset, for example instrument details and information on location;
(c) Wholesale changes to parts of each series should be documented against the dataset – for example, noting the application of a datum to a period of a stage record, or conversion of a period of a stage record to flow with a rating curve, which will itself exist as a dataset;
(d) Changes made to individual data values, for instance interpolating missing data values or editing values separately, should be documented;
(e) The resulting dataset should have a compre-hensive catalogue of what has been edited and why; any data users should be able to under-stand both the reasons for the editing and the methods of changing the raw data values.
Data storage
Any organized assembly of digital data is, in effect, a database, and its structure and functionality need to be decided by data-system managers. When developing data-storage systems, a number of important criteria must be considered. These include the following:(a) Security, including management of access and
administrative rights for the various users;(b) Ease of maintenance;(c) Costs, including initial outlay and recurrent

CHAPTER 6. REAL-TIME DATA TRANSMISSION AND MANAGEMENT 6-13
costs, including any software licences required, maintenance and storage;
(d) Ease of query;(e) The power of existing data-query tools;(f) Ease of development of additional query tools;(g) Ability to include or link to other data sources
or data-display software, such as GIS;(h) Suitability alongside existing IT infrastructure
requirements and staff capabilities;(i) A metadata system that provides adequate
information on the data in the database;(j) Ability to allow networked or remote access via
links to network and Web servers.
A large national flood forecasting and warning network has advanced requirements, such as automated, real-time data loading, links to sophisticated analysis tools and possibly multi-user access from a number of distributed internal and external organizations. Such systems require substantial and expensive technical support, training of users and often bespoke development of tools. On the smallest scale, for example for a single reservoir or urban area, a small project database is required and may be operated by a single individual. Such a database can be small enough to be sent by e-mail to other users, for example from a subsidiary flood warning unit to a central managing authority.
Data display and reporting
All data management should aim to have flexible functions for displaying and printing out data and information in tables, graphs and formatted reports (macros). These functions should be provided for each interval or time step of data collection, and for producing batched or period-based data collected over a sequence of sampling times (for example, daily). Systems should also include an interrogation facility to provide output as requested by a user.
GIS have useful applications in a flood forecasting and warning system, having the capacity to assimi-late and present data in a spatial context. The ability to map and display information quickly enables a more effective understanding to take place. Spatial data useful in a flood forecasting and warning system include maps of monitoring units, DEMs, isohyets of rainfall, alarm signals and flooded areas. The presentation of digital data is an important part of information dissemination. Digital maps can be created for coverage of rainfall data, most effectively from radar output, but also from point source raingauge data.
Although the primary purpose of a flood forecast-ing and warning service is to provide relevant information at critical times, the information gath-ered has importance for reference purposes. Thus,
many flood warning organizations are required to produce post-event reports, which cover both the meteorological and hydrological aspects of an event, along with the operational actions, results, impacts and lessons learned. Routinely, these reports are internal to the operating organizations, and serve as a means of performance evaluation. When major events occur, such reports may form part of much larger impact-review reports. Such reporting was requisitioned by top-level central government in the United Kingdom following major floods in the years 1998, 2000 and 2007.
Some flood warning organizations also produce an annual report as a matter of routine, for example the Flood Forecasting and Warning Centre of Bangladesh. This serves not only to review events and performance over the flood season, but also to establish a historical comparison of flood magni-tude and impact.
6.4 DATADISSEMINATION
Data are of no value until they are used, not only within the flood forecasting and warning unit, but also by a range of decision makers (sometimes referred to as “professional partners”). To be useful, the data and information have to be of good qual-ity, clearly presented and readily available to a range of users. Because many users will not usually be specialists in the disciplines that collect and manipulate data, the needs of users and the means of information presentation are important considerations.
Potential external users of flood forecasting and warning data might include staff of other govern-ment departments, public and private infrastructure managers, civil contingency and emergency serv-ices, and high-level government decision makers. This wide range of potential users will have variable information requirements, with some having need solely for data from a single point on a single river, and others requiring data over a region, a whole country, or even groups of countries in the case of transboundary rivers. All, however, will have the same general need to know:(a) Where it will flood;(b) When it will flood;(c) How large the flood will be;(d) How long the flood will last.
Flood warning dissemination is dealt with in detail in Chapter 8 of this Manual. Other considerations that may need to be taken into account are national attitudes to data-sharing, public information policy and intellectual property rights. Thus, some coun-tries may apply restrictions to mapped information,

MANUAL ON FLOOD FORECASTING AND WARNING6-14
others to the availability of data that may have legal liability issues and transborder sensitivities.
The type of data disseminated ranges from formal-ized statements to press and government departments, pro forma warnings to professional partners that are jointly formulated according to internal procedures and standing orders, and media briefs and warnings. All these require that the fore-cast and warning information have to be rapidly converted to a number of formats for onward trans-mission. Transmission can be by telephone, fax, e-mail or Website. Each medium has its advantages and disadvantages in terms of reliability, manpower needs and accessibility.
Increasing use is being made of the Internet and many national flood warning organizations host a publicly available Website. Some examples are given in the table below. It is suggested that those interested in developing a Web-based output for a national or regional service should access these sites to appreciate the level of detail and sophistica-tion that may be entailed. The need to maintain Websites up to date and with a high level of access is extremely important, and is a role best carried out by Web design and management specialists. These specialist skills will need to be retained or developed within the organization if the Website is to continue and evolve to meet required levels of service.
Country Operating agency Web agency Outputs
United Kingdom Environment Agency http://www.environment-agency.gov.uk/homeandleisure/floods
– Information statements
– Location maps
Australia Bureau of Meteorology http://www.bom.gov.au/australia/flood/ – Information statements
– National, regional and catchment maps
Bangladesh Bangladesh Water Development Board
http://www.ffwc.gov.bd – Information statements
– National maps– Station water level
plots and forecasts
United States NOAA National Weather Service
http://www.nws.noaa.gov – Information statements
– National, regional and catchment maps
– Station water level plots and forecasts
Examples of national flood warning service Websites

7.1 INTRODUCTION
The advances in flood forecasting and warning capabilities over the last 20 years have been largely brought about by the rapid advances in electronic observation, telemetry and computing power. During this development, much of the manual effort and components that have evolved from off-line hydrological design and forecasting have been converted to operate in real time. This evolu-tion has produced a range of new techniques, including remote-sensing, NWP, GIS and the inter-facing of models and data feeds (assimilation). These are reviewed in the following sections. Many of these components are operational in developed countries and regions, and may not necessarily be considered as emerging technology. However, a main focus of this Manual is to provide guidance to NHSs that are seeking to develop capacity in flood forecasting and warning, and require an understanding of the facilities, their advantages and limitations.
7.2 REMOTE-SENSING
7.2.1 Radar
Measuring rainfall by means of radar is not a new technique and will not, therefore, be considered in depth here. The main advantages are well known, in that it provides an areal indication of rainfall, which thus provides a better-distributed measure-ment than that obtained from point raingauges alone. Furthermore, the output lends itself to grid-based models, which are becoming more widely used. However, in practice there are a number of limitations in measurement accuracy, relating to range, attenuation of signal and calibration, which has meant that radar measurement has not provided the great advance over raingauges that it had initially been expected to do. Radar instruments are now moving to a “second generation” of Doppler instruments, which overcome some of the attenua-tion problems. There are also smaller versions of radar, sometimes portable, which are useful for local monitoring, especially in urban areas. The combination of radar with NWP that is used in short lead-time forecasting models has also provided a considerable advance in science, allowing the prediction of cell development and decay, as well as trajectory.
There are two further persistent problems relating to radar, the first being cost and the second being the means of transferring radar information from purely visual to digital inputs. Both these problems are significant for developing countries starting a system. Capital expenditure is high, and so are the running costs for calibration and maintenance. Without adequate provision for the latter two items, the investment in an instrument that cannot provide reliable data is wasted. Radar measurement is best carried out by networks that provide overlap between the plan position indicator (PPI) scans of neighbouring instruments at a distance below 200 kilometres, so giving 1- or 2-kilometre spatial resolution every 5 minutes, as close to the ground as possible. This adds to the cost of installing a national or large-basin system.
7.2.2 Satellite
Fluvial flood prediction is heavily dependent on weather and precipitation forecasts and hence there is considerable interest in Earth observation (EO) data captured by sensors from operational meteoro-logical satellites. Established in 1984, the Committee on Earth Observation Satellites (CEOS) coordinates civil space-borne observations of the Earth. Currently, 28 space agencies together with 20 other national and international organizations participate in CEOS planning and activities.
Satellite data for hydrological forecasting are avail-able from geostationary and polar-orbiting satellites. Geostationary satellites (GOES) have an orbital period of one day, and, therefore remain stationary at 36 000 kilometres above a point over the Equator. Polar-orbiting satellites have an orbital period of between one and two hours.
The National Aeronautics and Space Administration (NASA) of the United States has funded and will continue to fund a satellite-monitoring programme to produce both real-time and research-merged three-hour global precipitation products available on a file transfer protocol (FTP) server at no cost to the community. This initiative also requires consid-erable resources to support ground validation sites and studies to improve the space-based rain retriev-als. Similar efforts are being made by the Naval Research Laboratory (NRL) of the United States and the European Organization for the Exploitation of Meteorological Satellites (EUMETSAT) to provide merged data products in real time.
CHAPTER 7
POTENTIAL APPLICATIONS FROM DEVELOPING TECHNOLOGIES

MANUAL ON FLOOD FORECASTING AND WARNING7-2
The Aqua spacecraft is part of the NASA contri-bution to the Earth Observing System (EOS). Aqua carries six state-of-the-art instruments to observe Earth oceans, atmosphere, land, ice and snow covers, and vegetation. The instruments provide high measurement accuracy, spatial detail and temporal frequency. A major poten-tial benefit from the Aqua and other EOS data is improved weather forecasting. Aqua, for exam-ple, carries a sophisticated array of instruments that will allow determination of atmospheric temperatures around the world to an accuracy of 1°C in 1-kilometre-thick layers throughout the troposphere, in conjunction with moisture profiles.
The capabilities of GOES systems have improved steadily, providing more rapid updating (time scales shorter than 30 minutes) and increasing spatial resolution. Rainfall estimation from GOES plat-forms uses infrared (IR) -based algorithms, based on the relationship between cloud-top growth and surface precipitation. The algorithms work best for convective rainfall and most poorly for shallow stratiform precipitation. The usefulness of polar-orbiting satellites for hydrologic forecasting, however, is severely limited by the frequency of overpasses of a given location. Combined systems of polar-orbiting satellites and GOES may provide important rainfall estimation capabilities for hydro-logical forecasting over the next few decades. These systems could be of particular utility for large river basins with poor raingauge networks and no radar coverage.
The potential for rainfall estimation from polar-orbiting platforms is well demonstrated by the
Tropical Rainfall Measuring Mission (TRMM) satel-lite (a NASA–Goddard Space Laboratory programme). The TRMM satellite contains a precip-itation radar, in addition to microwave and IR imagers. Various outputs of rain accumulations and potential flood and landslip impacts are available on the Website http://trmm.gsfc.nasa.gov. The examples in Figure 7.1 show three-hour rainfall accumulations and flood potential during a period of monsoon activity in northern Australia.
In a broader scope, international monitoring of rainfall (the Global Precipitation Measurement Missions (GPM)) has to be considered as a long-term programme lasting over several decades. UNESCO has a collaboration agreement with WMO and the European Space Agency (ESA) on supporting these activities, in which other national and regional groups will become involved. As well as suitable satellite remote-sensing platforms, these facilities need effective ground truth from high-specification ground-data collection plat-forms. It is expected that solid-state scanning multi-frequency radar satellite instrumentation will be available to the meteorological community in general within the next decade. There are, however, concerns that this area of information collection will not maintain its advance. The number of working satellite sensors is declining and the development of sensor technology may also not be sufficient to meet the more detailed requirements needed for flood forecasting and warning. Although the continued development of EO for flood risk applications may be considered essential, national governments and international agencies are cutting back on investment in remote-sensing programmes.
Figure 7.1. (a) An example of a three-hourly output indicating rainfall accumulations in northern Australia for 3 February 2009 from the TRMM satellite. (b) TRMM satellite flood-risk information at the same
time as the rainfall information shown in (a)

CHAPTER 7. POTENTIAL APPLICATIONS FROM DEVELOPING TECHNOLOGIES 7-3
7.3 NUMERICALWEATHERPREDICTION
Major meteorological services are now using complex atmospheric–ocean models to produce NWP outputs to support their forecasting services. The development of NWP has been closely allied to the evolution of remote-sensing and earth observa-tion. It has been widely successful in improving both the accuracy and lead time of weather fore-casts, and has also improved QPF. This section will examine the applicability of NWP to flooding and how it can be integrated into the flood forecasting and warning process.
7.3.1 Large-scalefluvialflooding
The weather systems that cause these events tend to be large scale and relatively predictable, often by several days in advance. Global wind, temperature and humidity profiles throughout the lowest 20 kilometres of the atmosphere, at 20 to 50 kilometres spatial resolution and 1-kilometre vertical resolution, are required every three to six hours to initialize NWP models. Observations of global sea temperature, ice and snow cover are also important inputs at a spatial resolution of approximately 5 kilometres. Increases in forecast accuracy are critically dependent on the observational data. Currently, existing satellites provide rather coarse vertical resolution of global temperature and humidity, but an improvement in resolution is likely in the next few years. Wind information at different levels is also available from satellite-based sensors.
7.3.2 Convectiverainfallandsmall-scalefluvialevents
The weather systems that lead to these events are smaller scale and less predictable than the large-scale storms. Lead times will typically be in hours rather than days. The scale of forecasting therefore applies to the more rapidly responding catchments and also to pluvial and urban flooding.
NWP models for this type of flooding need to operate on a regional or local scale, and may require two steps of downscaling from the global models. For north-west Europe the appropriate models use wind, temperature and humidity observations over the eastern North Atlantic and western Europe at 10- to 20-kilometres spatial resolution and 50– to 500-metres vertical resolution, throughout the lowest 20 kilometres of the atmosphere, every hour. To capture the precursors to thunderstorm development, the same variables, together with cloud and precipitation, are also required over the United Kingdom every 15 to 60 minutes at 3- to 20-kilometres spatial resolution and 50- to 200-metres vertical resolution in the lowest
2 kilometres of the atmosphere. Sea and lake temperatures at 1-kilometre spatial resolution are required each day to optimize forecast accuracy. For most of these requirements, the dominant sources are currently satellite EO and ground-based radar, but in situ sources, such as commercial aircraft, also contribute significantly. Improvements in input data and their use can be expected to make substantial improvements in predictability of these events. Current satellite capabilities fall well short of requirements and effort is focused on upgrading radar capabilities to provide Doppler-based estimates of winds and humidity (through refraction measurements). For this purpose radars are required spaced less than 200 kilometres apart. Most existing national radar networks have significant gaps and insufficient accuracy to meet this requirement.
To run NWP suites requires massive computer power, and along with the high level of data requirements, this is a high-cost, high-investment demand on governments. Only a few NMSs are capable of obtaining this level of support. Although Web-based products are available internationally, these can only, in reality, be used by a small NMS or flood warning service in an offline mode, to provide additional background information or early general alerts. There is scope, however, for individual RCMs and LAMs to be set up at national or basin scales, using data feeds and boundary conditions from an existing general circulation model (GCM).
7.4 GEOGRAPHICALINFORMATIONSYSTEMS
The use of GIS in a flood forecasting and warning system can provide a wide range of visualization products, containing far more information than basic mapping applications or text descriptions. GIS use spatially related datasets and relational databases to provide successive layers or overlays of information, for example the identification of key infrastructure in relation to spatial flood risk and the movement of a flood through a channel or drainage system. GIS can provide data displays of conditions at given observation points for variables such as water level and rainfall. Commercial flood forecasting and warning software are generally available with a GIS interface, sometimes referred to as a graphical user interface (GUI). However, the GIS facility has to be “populated”, and gathering appropriate datasets is a significant undertaking in itself.
The most important dataset in relation to flood warning is the accurate representation of the land

MANUAL ON FLOOD FORECASTING AND WARNING7-4
surface by DTMs. These can be derived from digitizing contour maps, but will lack accuracy, especially in flood plains, which are areas of low relief. Photogrammetry from air photography has been largely superseded by digital airborne survey using either LIDAR (a laser-based scanning technology) or synthetic aperture radar (SAR), these being necessary to achieve the required levels of vertical accuracy, to 1 metre or less. LIDAR is considered more accurate than SAR. Some potential also exists for the quantification of roughness needed in flood-plain models from both airborne and satellite sensors.
High-resolution DTMs are a key requirement to provide accurate inundation forecast maps, as in the application by the Bangladesh FFWC for the city of Dhaka and its environs (Figure 7.2).
LIDAR is also being used to identify problematic flood-risk areas in constricted urban areas in the United Kingdom as part of a programme to develop a pluvial flood warning system (Making Space for Water, Defra, 2007). The accuracy of LIDAR is sufficient to identify small, low-lying areas where flood waters accumulate, and also to identify detailed flow paths. An example of this is shown in
Figure 7.3, which indicates applications on different scales relevant to the prediction of urban flooding.
7.5 INCORPORATINGIMPROVEMENTSINQUANTITATIVEPRECIPITATIONFORECASTS
The main improvement provided by the use of QPFs is that they can provide objective numerical rainfall values over a given period, these replacing the subjective interpretations of commonly used terms for rainfall forecasts, such as “light”,
Figure 7.2. Inundation map for Dhaka based on a T+48-hour forecastSource: FFWC of Bangladesh
Pseudo-quantitative rainfall forecast definitions (India and Bangladesh)
Qualitative description Rainfall amount (mm)
Light 4.57–9.64
Moderate 9.65–22.34
Moderately heavy 22.35–44.19
Heavy 44.20–88.90
Very heavy 89 +

CHAPTER 7. POTENTIAL APPLICATIONS FROM DEVELOPING TECHNOLOGIES 7-5
Figure 7. Localized flood depressions (a) and flow paths (b) identified by LIDAR for Carlisle and environs, United Kingdom
(a)
(b)
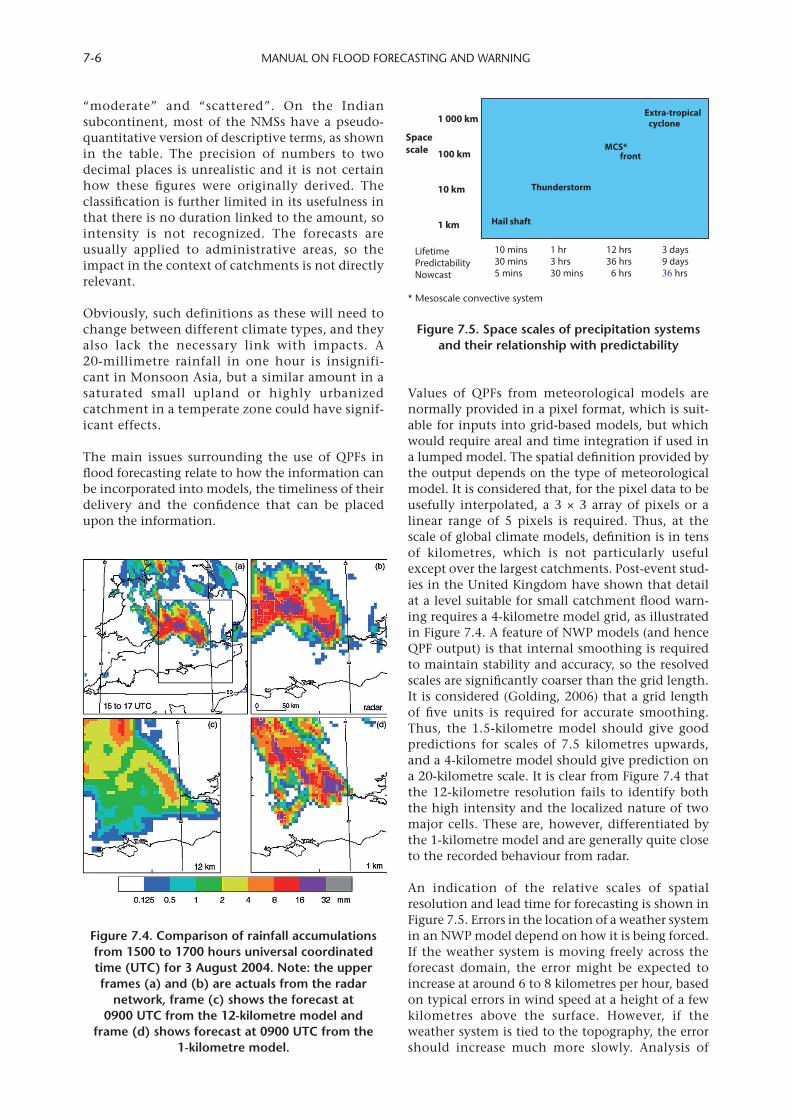
MANUAL ON FLOOD FORECASTING AND WARNING7-6
“moderate” and “scattered”. On the Indian subcontinent, most of the NMSs have a pseudo-quantitative version of descriptive terms, as shown in the table. The precision of numbers to two decimal places is unrealistic and it is not certain how these figures were originally derived. The classification is further limited in its usefulness in that there is no duration linked to the amount, so intensity is not recognized. The forecasts are usually applied to administrative areas, so the impact in the context of catchments is not directly relevant.
Obviously, such definitions as these will need to change between different climate types, and they also lack the necessary link with impacts. A 20-millimetre rainfall in one hour is insignifi-cant in Monsoon Asia, but a similar amount in a saturated small upland or highly urbanized catchment in a temperate zone could have signif-icant effects.
The main issues surrounding the use of QPFs in flood forecasting relate to how the information can be incorporated into models, the timeliness of their delivery and the confidence that can be placed upon the information.
Values of QPFs from meteorological models are normally provided in a pixel format, which is suit-able for inputs into grid-based models, but which would require areal and time integration if used in a lumped model. The spatial definition provided by the output depends on the type of meteorological model. It is considered that, for the pixel data to be usefully interpolated, a 3 × 3 array of pixels or a linear range of 5 pixels is required. Thus, at the scale of global climate models, definition is in tens of kilometres, which is not particularly useful except over the largest catchments. Post-event stud-ies in the United Kingdom have shown that detail at a level suitable for small catchment flood warn-ing requires a 4-kilometre model grid, as illustrated in Figure 7.4. A feature of NWP models (and hence QPF output) is that internal smoothing is required to maintain stability and accuracy, so the resolved scales are significantly coarser than the grid length. It is considered (Golding, 2006) that a grid length of five units is required for accurate smoothing. Thus, the 1.5-kilometre model should give good predictions for scales of 7.5 kilometres upwards, and a 4-kilometre model should give prediction on a 20-kilometre scale. It is clear from Figure 7.4 that the 12-kilometre resolution fails to identify both the high intensity and the localized nature of two major cells. These are, however, differentiated by the 1-kilometre model and are generally quite close to the recorded behaviour from radar.
An indication of the relative scales of spatial resolution and lead time for forecasting is shown in Figure 7.5. Errors in the location of a weather system in an NWP model depend on how it is being forced. If the weather system is moving freely across the forecast domain, the error might be expected to increase at around 6 to 8 kilometres per hour, based on typical errors in wind speed at a height of a few kilometres above the surface. However, if the weather system is tied to the topography, the error should increase much more slowly. Analysis of
* Mesoscale convective system
Figure 7.5. Space scales of precipitation systems and their relationship with predictability
Hail shaft
Thunderstorm
front
Extra-tropical cyclone
Spacescale
Lifetime Predictability Nowcast
10 mins 1 hr 12 hrs 3 days 30 mins 3 hrs 36 hrs 9 days 5 mins 30 mins 6 hrs 36 hrs
1 000 km
100 km
10 km
1 km
MCS*
Figure 7.4. Comparison of rainfall accumulations from 1500 to 1700 hours universal coordinated time (UTC) for 3 August 2004. Note: the upper frames (a) and (b) are actuals from the radar
network, frame (c) shows the forecast at 0900 UTC from the 12-kilometre model and
frame (d) shows forecast at 0900 UTC from the 1-kilometre model.

CHAPTER 7. POTENTIAL APPLICATIONS FROM DEVELOPING TECHNOLOGIES 7-7
development errors for individual thunderstorms suggests that individual storms should be predictable up to about three hours ahead. Predictability refers to the identification of a forecastable feature. Nowcast refers to the ability to provide a detailed statement on behaviour, such as movement and QPF.
For extremely short lead times, there is not enough time to run a full NWP model, and the required resolution is too fine for current models in opera-tional mode. A cheaper alternative is to use linear extrapolation of recent radar observations. For individual thunderstorms, this approach can only provide accurate predictions for up to about half a storm lifetime, that is, 30 minutes, though for storms that are organized in a longer-lived line or group, there may be useful predictability for several hours ahead. Currently in the United Kingdom, STEPS is used. In addition to a “best esti-mate” QPF forecast, STEPS provides probabilistic information by perturbing the extrapolation vectors and by adding artificial variability at the small, unpredictable scales. The STEPS extrapola-tion forecast is merged with the 4-kilometre NWP model, taking advantage of the improved storm representation in this model. The positional accu-racy of a nowcasting system (forecasting between 0 and 12 hours ahead) depends predominantly on the extrapolation velocity. Given a 2-kilometre pixel size and a 15-minute interval between radar images, tracking is only likely to be accurate to 1 pixel in 15 minutes, or 8 kilometres per hour, though STEPS seeks to improve on this by combin-ing estimates from several neighbouring pixels. Beyond half a storm lifetime, the development error dominates and only the overall movement of the group of storms can then be predicted by this method.
The error range inherent in QPFs has in some ways discouraged their use as direct inputs into hydro-logical and flood forecast models, and this is discussed more fully in 7.6. In practice, this has led to the use of QPFs in operational applications to provide an early stage of alert, or at most, to their use in forecast models run off-line to provide “what-if” scenarios. Their use to provide an early alert has provided the drive for better QPF information, which uses either probability-based or trigger-based forecasts, that is, forecast to exceed a predetermined threshold based on local conditions. The latter are more generally used, as they provide a single figure on which a decision linked to procedures can be made. Members of the engineering community, who are generally concerned with flood warning operations, have expressed reservations about using probability-based forecasts, as this requires judge-ments to be made in situations that are already difficult.
An extension of the use of QPF estimates is to convert the forecast into an estimate of runoff. This projection does not necessarily require the intervention of a complex hydrological model, but is based on a water-balance updating approach. In the United Kingdom, the Met Office Surface Exchanges Scheme, incorporating a probability-distributed moisture model (MOSES-PDM) (Met Office and Centre for Ecology and Hydrology), is able to provide this within a DSF. In the United States, a similar method is used to provide flood alert information. The advantage of using a water balance approach is that it takes into account catch-ment conditions, whereas rainfall trigger values may be set at a low value to allow for the worst-case, saturated catchment conditions, which could create an undesirably high number of false alarms.
7.6 ASSESSMENTOFFORECASTINGUNCERTAINTYANDHYDROLOGICALENSEMBLEPREDICTION
The issue of uncertainty in modelling has been dealt with extensively in Chapter 4. The purpose of revisiting the topic in this chapter is to consider some of the recent operational examples. All fore-casts contain uncertainty and one of the most successful ways of dealing with this has been the use of ensembles. The uncertainty associated with a hydrological forecast starts with the meteorology. Given that all mesoscale atmospheric models attempt to model an essentially chaotic atmosphere this area has been the primary source of uncertainty for some years.
Whatever model is used, the presence of errors is inevitable and therefore must be built into a proba-bilistic forecast. Investigation of the subject indicates a very large disparity between the research community’s embrace of probabilistic forecasting (Fox and Collier, 2000; Journal of Hydrology, 2001 – Special Issue on Probabilistic and Ensemble Forecasting, Volume 249). The preference for a deterministic approach still prevails even in tech-nologically advanced hydrological forecasting agencies (see, for example, the Website of the California River Forecast Center). It must be assumed that overcoming this resistance will be a lengthy task and require considerable education, even where users can be assisted by providing deci-sion-support tools that make use of the probabilistic forecast (see 7.7). Whereas performance statistics, as discussed in Chapter 4, can be applied to quanti-ties of predicted flow against observed flow and the accuracy of timing (for example of flood peaks), event analysis also needs to look at the operational performance. The latter will include an examina-tion of the sequence and timing of weather forecasts

MANUAL ON FLOOD FORECASTING AND WARNING7-8
and warnings received, and whether these provided adequate response time, as well as the quantitative accuracy.
In 2006, the United Kingdom Met Office carried out a detailed examination of the quality of fore-casts and data supplied to the Environment Agency under the service agreement to support the latter agency’s flood forecasting and warning operations. Heavy-rainfall warnings, QPFs, radar data feeds and storm, tide and surge forecasts were all subjected to a rigorous review to decide what items should be considered, how they could be assessed and how an automatic monitoring and evaluation process could be set up for data feeds (Met Office, 2006). Developing the assessment programme highlighted the balance that has to be made between what it is desirable to measure and what is practical. This balance is perhaps best related to establishing what it is useful to know, as opposed to verifying all and every quantity just because a number is produced. The main issues and outcomes are summarized below.
The Met Office review highlights the sheer volume of data handling required, both in a retrospective review of selected past data and in the planning of the subsequent operational phase. In the United Kingdom example, many products and data are electronically generated and distributed, and this in itself introduces issues of how data can be extracted for monitoring purposes. This becomes a signifi-cant issue when data extraction has to be in real time and has then to be available in formats that are appropriate to various manipulations. In deal-ing with retrospective data the review produced much less in the way of analytical results than had been anticipated. It was, however, able to test meth-ods and it produced useful guidance on what might or might not be appropriate in an operational context.
The availability and suitability of ground truth was shown to be a constraint in both the retrospective review, and for the operational phase of the project. It was shown that forecast product development and monitoring requirements can be integrated to the benefit of both. Issues remain on what is appro-priate in terms of representativeness, sampling and the relationship between point and areal information.
The project used standard statistical methods for the analysis of results. As a general observation on the performance statistics, some of the measures produced highly variable results, which made it difficult to define what constitutes a desirable target. Thus, although it was proposed that bimonthly reporting of results should be applied to all products, results need to be reviewed in the
context of longer-term performance and most statistics should be presented as 12-month running means. Absolute values of performance statistics may have little meaning in isolation, but the behav-iour of a particular variable over time can illustrate changes in forecast quality. The project identified that, in some cases, assessment can be carried out using ranges or confidence limits and that this also provides a useful indication of forecast accuracy.
Establishing a broad-based assessment of a wide range of forecast products is not a trivial task. The recognition of this in the past may have influenced decisions on whether such a process was worth-while. Such an assessment is, however, of considerable benefit if it provides better means of reviewing performance in a more objective manner. This is an advance on subjective judgements of individual forecasts, which lead to an impression of success or otherwise, rather than a factual measure.
7.7 OPERATIONALUSEOFFORECASTINGUNCERTAINTYTOIMPROVEDECISION-MAKING
Ensemble forecast techniques are beginning to be used for hydrological prediction by operational hydrological services throughout the world. These techniques are attractive because they allow the effects of a wide range of sources of uncertainty on hydrological forecasts to be accounted for. Forecasting should not only offer an estimate of the most probable future state of a system, but also of the range of possible outcomes. Indeed, users are often more concerned with having a quantitative estimate of the probability that catastrophic effects may occur, than with knowing the most probable future state. Not only does ensemble prediction in hydrology offer a general approach to probabilistic prediction, but it also offers an approach to improve hydrological forecast accuracy.
International agencies such as the ECMWF have been investigating the use of MCS-based ensembles in recent years and a large-scale intercomparitive Hydrological Ensemble Prediction Experiment (HEPEX) has been studied since 2005. The main objective of HEPEX is to bring the international hydrological and meteorological communities together to demonstrate how to produce reliable “engineering quality” hydrological ensemble fore-casts. The object is to produce forecasts that can be used with confidence to assist the water resources sector to make decisions that have important conse-quences for the economy and for public health and safety. Representatives of operational hydrological services and water resources agencies are expected

CHAPTER 7. POTENTIAL APPLICATIONS FROM DEVELOPING TECHNOLOGIES 7-9
to participate in helping to define and execute the project, which aims both to couple currently avail-able forecasts tools and to improve the quality of currently available systems.
Many scientific questions need to be addressed for operational hydrological services to use these tech-niques to their full potential. Examples of these questions include:(a) What are the properties of weather and climate
forecasts?(b) How can weather and climate information,
including ensemble forecasts, be used reli-ably? That is, how can the properties of space and timescale of weather and climate forc-ing, together with these same properties of hydrological systems, be best integrated into a hydrological ensemble prediction system?
(c) How does the uncertainty in weather forecasts translate into hydrological uncertainty?
(d) How do long-range ocean–atmosphere phenomena (for example, El Niño) affect short-, medium- and long-range hydrological forecasting?
(e) What is the relative role of weather and climate forecasts versus initial hydrological conditions in affecting the quality of hydrological forecasts?
(f) How can hydrological ensemble forecasts be verified, and what can be done to gain confi-dence that a given forecast system is reliable?
(g) What is the role of a human forecaster?
Figure 7.6. A typical AHPS forecast map indicating flood-risk areas in the Missouri basin
In the United States, NOAA NWS provides a highly developed Advanced Hydrologic Prediction Service (AHPS). As part of a new component of the Climate, Water and Weather Services, AHPS is a Web-based suite of forecast products, including flood forecast products. The various displays provide information on the magnitude and uncertainty of occurrence of floods, from hours to days and months in advance.
The AHPS products were initiated following the major floods in the Midwest of the United States in 1993 and again in 1997, and now covers most major river basins. The AHPS products are devel-oped using a combination of sophisticated computer models and large amounts of data from a wide variety of sources. Sources include super computers, automated gauges, GOES, Doppler radars, weather observation stations, and the computer and communications system called the Automated Weather Interactive Processing System (AWIPS). Hydrological forecasts can be supplied for almost 4 000 locations across the United States, the forecasts being produced by river forecast centres and distributed by field offices to a wide range of customers.
The forecast information is presented through user-friendly graphical products, such as the forecast flood level to which a river will rise and when it will be likely to reach its peak. Other information includes:(a) The chance or probability of a river exceeding
minor, moderate, or major flooding;

MANUAL ON FLOOD FORECASTING AND WARNING7-10
(b) The chance of a river exceeding a certain level, volume and flow of water at specific points on the river during 90-day periods;
(c) A map of areas surrounding the forecast point that provides information about major roads, railways and landmarks likely to be flooded, and other information such as the levels of past floods.
An additional feature of the AHPS Website is a map of the river basin and various points along the river for which information is available. A typical basin forecast map is shown in Figure 7.6.
Individual sites within the flood-risk area can be accessed from the display, and current and forecast hydrographs obtained. A typical example is shown in Figure 7.7. This graph shows chances of the river stage, flow or volume exceeding various levels during the forecast period labelled above the graph. Similar plots are usually available for one or more of these variables at this forecast location. The conditional simulation (CS) line indicates chances of the river exceeding given levels based on current conditions. The historical simulation (HS) line indicates the chances of the river exceed-ing given levels based on the total range of past levels.
Figure 7.7. AHPS flood forecast stages probability hydrograph for the Wabash River with EQPF input. The CS (conditional simulation) line indicates the chances of the river exceeding given levels
based on current conditions. The HS (historical simulation) line indicates the chances of the river exceeding given levels based on the total range of past levels.
107058.1827.90
Maximuminstantaneousstage (ft)
26.10
24.30
22.50
20.70
18.90
17.10
15.30
13.50
11.70
9.9099% 98% 95% 99% 80% 70% 60% 50% 40% 30% 20% 10% 5% 2% 1%
WABASH R AT RIVERTON INLatitude: 39.0 Longitude: 87.6
Forecast for the period 2/15/2009–5/16/2009This is a conditional simulation based on the current conditions as of 2/9/2009.
Exceeding probability�ood level 15.0 (ft)
90858.10
76291.42
63294.33
51655.76
41361.59
32362.14
26613.91
22300.00
18337.74
14498.47
Major �oodingabove 24.0 ft
Minor �ooding15.0–20.0 ft
CS
HS
Minor �ooding20.0–24.0 ft
Flood level

8.1 IDENTIFICATIONOFEND-USERSANDTHEIRREQUIREMENTS
A flood warning turns a prediction or forecast into information on which many actions are depend-ent. The fundamental purpose of the warning is to enable individuals and communities to respond appropriately to a major flood threat to reduce the risk of death, injury and property loss. The ultimate end-user of a flood warning is the public, which faces impacts on its housing, possessions, land, livestock and transport. The basic requirement is for people to have time to take necessary actions and make arrangements, which can range from putting protection or proofing arrangements in place, to evacuation, along with basic possessions and livestock, to a place of safety. Flood warnings, therefore, are required to inform those at risk on the timing and extent of the flood, so that they know how long they have in which to act, which areas will be affected by the flood, and, most impor-tantly, which escape routes or accesses to shelter are available.
There are normally several layers of interaction between the organization that issues the warning, and various agencies that have different tasks to perform in dealing with potential or actual impacts. In many cases, each organization so concerned will have its own operational system to implement in a flood situation. It should also be realized that the extent and detail of involvement for each organiza-tion may vary according to the stage of development or severity of the flood. It is important that the agency responsible for issuing forecasts and warn-ings has a good understanding of the roles and responsibilities of other agencies concerned. It is, however, the role of overarching organizations, for example a ministry of emergency planning or some other high level, central government agency, to establish how these links operate and to coordinate regular planning and review meetings. This ensures that knowledge is retained within organizations and not individuals, and that any changes in struc-ture or duties are understood, and that lessons learned from previous events are incorporated to improve future performance.
There are various examples of information chains and groups involved in the whole flood warning process. These have usually evolved and adapted to historical arrangements and existing requirements, so there is no “correct” model to follow. Typically, an organization will issue warnings to its internal
staff, to other government departments, the press and media, and the public. Where the issuing organization is part of a water management func-tion, the internal warning is to prepare staff for other flood mitigation actions. These include:(a) Manning an incident control centre;(b) Placing field observers on a heightened level of
reporting;(c) Alerting emergency maintenance and repair
teams in case of damage to flood defence infrastructure;
(d) Preparing the public and media relations staff with the necessary information on the incident;
(e) Ensuring that electronic data and informa-tion media, for example a publicly available Internet site, are regularly updated.
External warnings are usually issued to:(a) Other government departments involved in
flood and emergency management;(b) Local government authorities, for example
town and district councils;(c) Emergency services, particularly the police, fire
brigade and, in extreme cases, the military;(d) Non-governmental oranizations (NGOs)
involved in relief and rescue, for example the International Committee of the Red Cross (ICRC), Oxfam and USAid;
(e) Public information, press and media;(f) Priority individual premises.
8.2 AREALDEFINITIONOFWARNINGS
Flood warnings need to be specific to particular catchments and reaches of rivers, although early stage warnings could be defined on a geographic area within which a number of rivers could be affected. The warnings may be linked to an advance meteorological forecast, where a statement such as “a warm front moving in from the west will produce heavy rainfall for several hours, bringing a risk of flooding to parts of Wales” is issued.
Flood behaviour in a river, either with floodwaters moving downstream, or lower reaches being affected by high tides or drainage congestion, lends itself to the preparation and emission of flood warnings on the bases of river reaches. The size of reach depends on the size of catchment, but the time of travel also has a bearing. Thus, on a major river, such as the Rhine or the Ganges, where flood
CHAPTER 8
STRUCTURE AND ORGANIZATION OF FLOOD WARNINGS
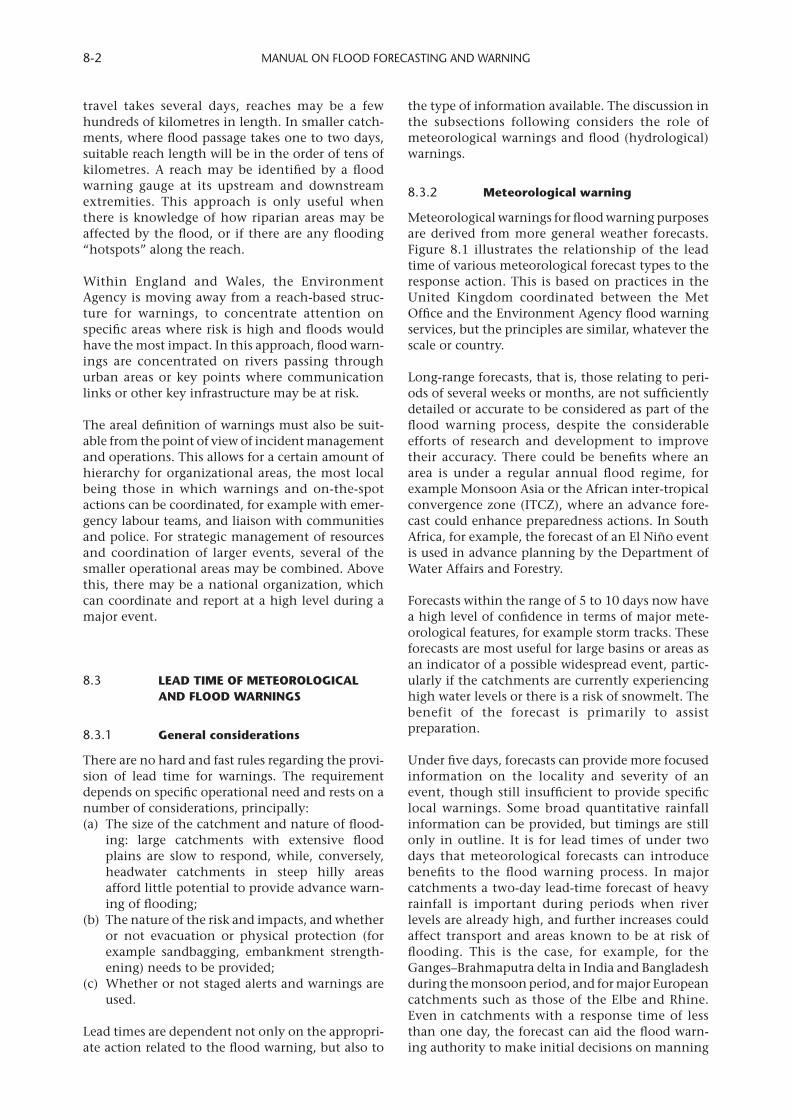
MANUAL ON FLOOD FORECASTING AND WARNING8-2
travel takes several days, reaches may be a few hundreds of kilometres in length. In smaller catch-ments, where flood passage takes one to two days, suitable reach length will be in the order of tens of kilometres. A reach may be identified by a flood warning gauge at its upstream and downstream extremities. This approach is only useful when there is knowledge of how riparian areas may be affected by the flood, or if there are any flooding “hotspots” along the reach.
Within England and Wales, the Environment Agency is moving away from a reach-based struc-ture for warnings, to concentrate attention on specific areas where risk is high and floods would have the most impact. In this approach, flood warn-ings are concentrated on rivers passing through urban areas or key points where communication links or other key infrastructure may be at risk.
The areal definition of warnings must also be suit-able from the point of view of incident management and operations. This allows for a certain amount of hierarchy for organizational areas, the most local being those in which warnings and on-the-spot actions can be coordinated, for example with emer-gency labour teams, and liaison with communities and police. For strategic management of resources and coordination of larger events, several of the smaller operational areas may be combined. Above this, there may be a national organization, which can coordinate and report at a high level during a major event.
8.3 LEADTIMEOFMETEOROLOGICALANDFLOODWARNINGS
8.3.1 Generalconsiderations
There are no hard and fast rules regarding the provi-sion of lead time for warnings. The requirement depends on specific operational need and rests on a number of considerations, principally:(a) The size of the catchment and nature of flood-
ing: large catchments with extensive flood plains are slow to respond, while, conversely, headwater catchments in steep hilly areas afford little potential to provide advance warn-ing of flooding;
(b) The nature of the risk and impacts, and whether or not evacuation or physical protection (for example sandbagging, embankment strength-ening) needs to be provided;
(c) Whether or not staged alerts and warnings are used.
Lead times are dependent not only on the appropri-ate action related to the flood warning, but also to
the type of information available. The discussion in the subsections following considers the role of meteorological warnings and flood (hydrological) warnings.
8.3.2 Meteorologicalwarning
Meteorological warnings for flood warning purposes are derived from more general weather forecasts. Figure 8.1 illustrates the relationship of the lead time of various meteorological forecast types to the response action. This is based on practices in the United Kingdom coordinated between the Met Office and the Environment Agency flood warning services, but the principles are similar, whatever the scale or country.
Long-range forecasts, that is, those relating to peri-ods of several weeks or months, are not sufficiently detailed or accurate to be considered as part of the flood warning process, despite the considerable efforts of research and development to improve their accuracy. There could be benefits where an area is under a regular annual flood regime, for example Monsoon Asia or the African inter-tropical convergence zone (ITCZ), where an advance fore-cast could enhance preparedness actions. In South Africa, for example, the forecast of an El Niño event is used in advance planning by the Department of Water Affairs and Forestry.
Forecasts within the range of 5 to 10 days now have a high level of confidence in terms of major mete-orological features, for example storm tracks. These forecasts are most useful for large basins or areas as an indicator of a possible widespread event, partic-ularly if the catchments are currently experiencing high water levels or there is a risk of snowmelt. The benefit of the forecast is primarily to assist preparation.
Under five days, forecasts can provide more focused information on the locality and severity of an event, though still insufficient to provide specific local warnings. Some broad quantitative rainfall information can be provided, but timings are still only in outline. It is for lead times of under two days that meteorological forecasts can introduce benefits to the flood warning process. In major catchments a two-day lead-time forecast of heavy rainfall is important during periods when river levels are already high, and further increases could affect transport and areas known to be at risk of flooding. This is the case, for example, for the Ganges–Brahmaputra delta in India and Bangladesh during the monsoon period, and for major European catchments such as those of the Elbe and Rhine. Even in catchments with a response time of less than one day, the forecast can aid the flood warn-ing authority to make initial decisions on manning

CHAPTER 8. STRUCTURE AND ORGANIZATION OF FLOOD WARNINGS 8-3
levels and preparedness of local flood defence activ-ities, possibly to the level of issuing an alert or early stage warning to the public.
Once an event is imminent, either through a devel-oping situation (a convection breaking out or a depression approaching), or if a severe event is affecting adjacent catchments or basins, then detailed weather forecasts provide a significant tool to help flood warning decisions and actions. Particular catchments and hence localities at risk within them can now receive an advance warning. Within the sub-daily framework, and particularly for lead times of 6 to 12 hours, numerical forecasts can be of sufficient detail to provide quantitative inputs into flood forecasting models. In the United Kingdom, STEPS progressively assimilates satellite and radar data as the forecast time approaches zero, and this information is produced on a grid basis and so is highly suitable for input into distributed models. As the Environment Agency has a standard of service to provide a minimum lead time for flood warning of two hours, it is feasible that in some rapidly responding catchments a warning could be issued on the basis of a meteorological forecast, but to date this has not been done. In the United States flash-flood alerts are issued from knowledge of meteorological conditions.
Weather radar is particularly suited to providing short-lead-time information to update and provide more detail in a critical situation. The viewing of a sequence of radar images over intervals of 30 minutes or one hour will provide a good qualita-tive definition of storm movement and development and can therefore be used to provide warning to
catchments that the storm is approaching. The lead time depends on the nature of the system that will produce the rain. The rainfall echoes associated with a front or depression can be tracked for some hours, whereas the rapid development of convec-tive cells and their localized movement may be more variable, and hence will only provide warn-ings of one to three hours, in line with the life cycle of convective cells.
8.3.3 Floodwarning
Hydrologically based flood warning relies on known (observed) river conditions and projections. The process can involve varying degrees of sophistica-tion, from the use of simple correlation techniques between upstream and downstream sites, to complex hydrological or hydraulic model-based warning systems. As with meteorological warning, the lead time for the in-river situation is based on size and response time, but it is a prerequisite that the river system should already be responding to the event before projections can be made. On major rivers, for example the Nile, Indus and de la Plata, the progress of severe conditions downstream should allow warnings to be provided several days in advance. At the lower end of the scale, a mini-mum warning lead time can be established that reflects the capacity for receiving timely data and forecasts and the time to implement necessary response actions. This lower limit is particularly relevant to steep catchments or those in urban areas.
Figure 8.2 represents the relationship between information, lead time and response in a similar
Figure 8.1. Schematic of flood-forecasting lead time
GENERAL CIRCULATION MODEL
FORECAST SOURCE
FORECAST TYPE
EVENTRESPONSE ACTIONS
SITUATIONREVIEW AND MONITORING
FLOOD WATCH FLOOD WARNING
HEAVY-RAINFALL WARNING
STANDBYMOBILIZATION
FULL MOBILIZATION. 24-HR INCIDENTROOM STAFFING. ESTABLISH LINK WITHEMERGENCY SERVICES.
OUTLOOK DAILY GENERAL
FORECAST
QPF: SUB-DAILY PERIODS NIMRODFORECAST
NIMROD ACTUALS
TELEMETRYRAINGAUGES
FORECAST PERIOD
10 days 5 days 2 days ZERO24 hrs 12 hrs 6 hrs
NWP MESOSCALE MODEL HIGH-RESOLUTION MODEL/RADAR

MANUAL ON FLOOD FORECASTING AND WARNING8-4
way to the forecast process in Figure 8.1. Throughout the process, comparison between observed and forecast information must be main-tained to allow response actions to be controlled. This is particularly relevant to liaison with emer-gency services and other agencies outside the flood monitoring organization, to give sufficient time to escalate levels of response or downgrade the status.
8.4 SELECTIONOFWARNINGSTAGES
Flood warning relies on “triggers” relating to criti-cal river levels or rainfall amounts that are indicative of flood states approaching or worsening. The trig-gers initiate certain actions or provision of information to external users. They are used to decide when to undertake certain actions during a flood event and should be designed to give enough time to undertake the response action. For exam-ple, if a river water level reaches a certain trigger level it might mean that an area or community will flood in a few hours and the response action could be to evacuate the village. Triggers relating to rain-fall include:(a) Accumulations exceeding a threshold in a
given time period, for example 100 millimetres in 12 hours or less; this threshold may need to be changed according to season;
(b) Rainfall accumulation and catchment wetness conditions;
(c) Rainfall intensity exceeding a given rate; this is particularly important in urban areas where drainage capacity can be exceeded and flash floods can occur.
Triggers relating to water level include:(a) The river level rising to within a set warn-
ing level, for example 1 metre below danger level;
(b) The rate of rise of level is faster than a threshold level, for example 25 centimetres per hour.
Triggers have to be established by careful study of local conditions. The advice and knowledge of the local community, if available, is therefore impor-tant. Triggers must not be arbitrary, or standard within an organization, for example within 1 metre of “danger” level, but linked to local conditions and features of risk. Where levels are concerned, these need to relate to significant happenings, for example:(a) The level at which water flows out of a channel
onto the flood plain;(b) The level of water that submerges areas of land
used for livestock, or at which low lying roads become flooded;
(c) The level at which major areas, includ-ing residential and business properties, and communications are affected;
(d) The level at which depth and velocity combined pose a threat of structural damage and danger of loss of life.
In assigning suitable forecast triggers for urban flooding, the criteria used could be based on a fore-cast that would result in a high risk (at least a 30 per cent occurrence) of actual flooding taking place. The general arrangement for flood warning stages is illustrated in Figure 8.3. A schematic of the forecast and warning relationship from rainfall forecast to downgrading of a warning is illustrated in Figure 8.4.
Figure 8.2. Flood warnings and responses
INFORMATION SOURCES
INFORMATION SOURCESTELEMETRY RIVER
GAUGES AND RIVERGAUGESMETEOROLOGICAL
FORECASTS
RAINFALLRADAR LOCAL
OBSERVERS
INFRASTRUCTUREDAMAGE REPORT
OPERATIONS CENTRE
River risecommences
Out of bank �ow
Extensive inundation
Damage and threat to life
Decline of river levels
ALERTING FACILITIES
FIRST STAGERIVER LEVEL
TRIGGERS
RESPONSE ACTIONS
FLOOD STATUS
HIGHER STAGETRIGGERS
ALERTINITIATED
FLOODWARNING
SEVEREFLOOD
WARNING
EMERGENCYMOBILIZATION
DOWNGRADINGOF WARNINGS
RAINFALLTRIGGERS

CHAPTER 8. STRUCTURE AND ORGANIZATION OF FLOOD WARNINGS 8-5
Triggers for flood warnings should be set so that they are not reached too frequently, so creating unneces-sary responses or disruption. Frequency can also lead to a negligent attitude by operators and public, where warnings are not heeded. A similar problem exists if too many false alarms are given. There is a crucial balance to be struck between a precautionary approach and an unwillingness to issue warnings for fear of these being “wrong”. A phased-alert warning system goes some way to overcoming these problems, as long as the various stages and their implications are clearly understood. The system should also allow for the alert-warning situation to be downgraded if conditions improve or forecasts change.
“False” alarms are inevitable given the nature of meteorological and hydrological events. Over time, they should be a small proportion, for example 20 per cent of the forecasts that are issued, or of the number of correct forecasts. Similarly, the number of times that alerts and warnings are issued should not be excessive. As experience of both operators and users develops, triggers can be modified to reflect the balance of achieved forecasts and false alarms. An indicative number of no more than five warning events per year in a given location, averaged over a period of years, is considered to be of the correct order where flooding is an irregular occurrence.
8.5 PRESENTATIONOFWARNINGSTOUSERS
8.5.1 Floodwarningsymbols
Serious flooding occurred in England and Wales in 1998, and concern was expressed at the lack of
effectiveness of warnings. The high-level govern-ment review that followed highlighted the need for better communication with the public on flooding, especially with regards to providing clearer flood warnings. These would replace the colour codes, which the report showed were confusing and misunderstood “by nearly all who received them”. Colour codes (for example yellow, amber, red) or symbol codes based on other mete-orological warnings (for example cone or flag signals used for cyclone warning in Bangladesh) tend to be understood only by professionals directly involved, and even emergency service personnel are often not clear on the meaning or implication of the code.
The system that has been introduced into the United Kingdom as a result is a combination of a symbol using a simple illustration, to which specific instructions are related. Awareness and informa-tion on the symbols and instructions was disseminated through a comprehensive publicity campaign covering poster and television advertis-ing, leafleting and public information centres (libraries, council offices). The symbols are now used in television weather forecasts when warning situations arise. The symbols and explanatory instructions are shown in the table below.
These types of symbols can be considered as generic, and so use typical representations of local houses. In Bangladesh, Mozambique and other countries, more visual representations, meant to convey the message to non-literate people, have been developed.
Figure 8.4. Flood forecasting and warning schematic
Figure 8.3. Arrangement of trigger levels for various flood warning stages
Time
6
5
4
3
2
1
0
Wat
er le
vel i
n riv
er (m
)
Trigger level forsevere �ood warning
Trigger level for�ood warning
Trigger level for�ood watch
Figure 8.3
FORECAST – RAIN
RAINFALL
FORECAST UPDATE – NO RAIN
FORECAST UPDATE – INCREASED RAIN
SEVERE FLOOD TRIGGER
FLOOD WARNINGTRIGGER
RIVER LEVEL
ALERT WARNING SEVERE WARNING
WARNINGDOWNGRADED
Time
Rive
r lev
el

MANUAL ON FLOOD FORECASTING AND WARNING8-6
8.5.2 Examplesoffloodwarninginformationoutputs
A wide range of information formats are used by national meteorogical and hydrological services (NMHSs) across the world. In order for a newly
developing flood forecasting and warning service to appreciate the range of information and presenta-tion formats in use, a selection of flood forecasting and warning outputs available from national flood warning service Websites are given in 8.5.2.1–8.5.2.3 and Boxes 8.1–8.5.
United Kingdom flood warning symbols and the instructions that accompany them
Flood watch
Flood warning
Severe �ood warning
All clear
“This is the �rst stage of the warning. If your area is issued with a ood watch it meansthere is the possibility of some ooding. You're advised to keep a close eye on local radioor television reports, alert your neighbours, watch water levels, check on your pets,reconsider any travel plans, make sure you can put your ood plan into action, and ring theood information telephone line for further information and advice.”
“If a ood warning is issued in your area, it me ans ooding is expected and will cause disruption. You are advised at this stage to move pets, vehicles, food, valuables, and otheritems to safety, be prepared to turn o� the gas and electricity, be ready to evacuate yourhome, and put sandbags or ood boards in place to protect your home.”
“This is the warning issued when serious ooding is expected and there is imminent dangerto life and property. If your warning is upgraded to this you should be prepared for yourgas, electricity, water and telephone supplies being lost. You're advised to keep calm andreassure others, and cooperate with the emergency services.”
.
“This is issued when the ood water levels are going down and no ood watches orwarnings are in force any longer. At this stage you can check if it is safe to return home.”
FloodWatch
FloodWarning
SevereFloodWarning

CHAPTER 8. STRUCTURE AND ORGANIZATION OF FLOOD WARNINGS 8-7
8.5.2.1 United States
The following examples are taken from within the NOAA Website:
(a) Flood watch (Box 8.1):
(b) Flood warning (Box 8.2):
Box 8.2
FLOOD WARNING NATIONAL WEATHER SERVICE LOUISVILLE KY 840 AM EST WED JAN 28 2009
THE NATIONAL WEATHER SERVICE IN LOUISVILLE HAS ISSUED A * FLOOD WARNING FOR... ADAIR COUNTY IN SOUTH CENTRAL KENTUCKY... CASEY COUNTY IN SOUTH CENTRAL KENTUCKY... CLINTON COUNTY IN SOUTH CENTRAL KENTUCKY... CUMBERLAND COUNTY IN SOUTH CENTRAL KENTUCKY... METCALFE COUNTY IN SOUTH CENTRAL KENTUCKY... MONROE COUNTY IN SOUTH CENTRAL KENTUCKY... RUSSELL COUNTY IN SOUTH CENTRAL KENTUCKY...
* UNTIL 130 PM CST/230 PM EST/
* AT 735 AM CST/835 AM EST/ SEVERAL ROADS WERE CLOSED ACROSS THE AREA BECAUSE OF HIGH WATER.
A FLOOD WARNING MEANS THAT FLOODING IS IMMINENT OR HAS BEEN REPORTED. STREAM RISES WILL BE SLOW AND FLASH FLOODING IS NOT EXPECTED. HOWEVER...ALL INTERESTED PARTIES SHOULD TAKE NECESSARY PRECAUTIONS IMMEDIATELY.
ADDITIONAL RAINFALL AMOUNTS OF ONE HALF INCH WILL BE POSSIBLE IN THE WARNED AREA.
DO NOT DRIVE YOUR VEHICLE INTO AREAS WHERE THE WATER COVERS THE ROADWAY. THE WATER DEPTH MAY BE TOO GREAT TO ALLOW YOUR CAR TO CROSS SAFELY. MOVE TO HIGHER GROUND.
Box 8.1
FLOOD WATCH NATIONAL WEATHER SERVICE CHARLESTON WV 401 AM EST WED JAN 28 2009
GREENUP-CARTER-BOYD-LAWRENCE KY-GALLIA-LAWRENCE OH-WAYNE-CABELL-MASON-JACKSON WV-LINCOLN-PUTNAM-KANAWHA-ROANE-WIRT-CALHOUN-MINGO-LOGAN-BOONE-CLAY-BRAXTON-GILMER-NICHOLAS-WEBSTER-INCLUDING THE CITIES OF....FLATWOODS…GREENUP...GRAYSON...OLIVE HILL...ASHLAND...LOUISA...GALLIPOLIS...IRONTON...SOUTH POINT...KENOVA...CEREDO...WAYNE...HUNTINGTON...POINT PLEASANT...NEW HAVEN...RAVENSWOOD...RIPLEY...HARTS...ALUM CREEK...HAMLIN...TEAYS VALLEY...HURRICANE...CHARLESTON...SOUTH CHARLESTON...SAINT ALBANS....SPENCER...ELIZABETH...GRANTSVILLE...WILLIAMSON...LOGAN...CHAPMANVILLE...MAN...MADISON...CLAY...SUTTON...GASSAWAY...BURNSVILLE...GLENVILLE...SUMMERSVILLE...RICHWOOD...CRAIGSVILLE...WEBSTER SPRINGS
...FLOOD WATCH REMAINS IN EFFECT THROUGH THIS EVENING...
THE FLOOD WATCH CONTINUES FOR
* PORTIONS OF NORTHEAST KENTUCKY...SOUTHEAST OHIO AND WEST VIRGINIA...INCLUDING THE FOLLOWING AREAS...IN NORTHEAST KENTUCKY...BOYD...CARTER...GREENUP AND LAWRENCE KY. IN SOUTHEAST OHIO...GALLIA AND LAWRENCE OH. IN WEST VIRGINIA... BOONE...BRAXTON...CABELL...CALHOUN...CLAY...GILMER...JACKSON WV...KANAWHA...LINCOLN...LOGAN...MASON...MINGO...NICHOLAS... PUTNAM...ROANE...WAYNE...WEBSTER AND WIRT.
* THROUGH THIS EVENING* A LARGE AND MOIST STORM SYSTEM WILL CONTINUE OVER THE AREA THIS MORNING WITH MAINLY RAIN.
THE SIGNIFICANT AMOUNT OF OVERALL PRECIPITATION...ON TOP OF ALREADY SATURATED OR IN SOME CASES SNOW COVERED GROUND...MAY LEAD TO FLOODING PROBLEMS.
* RISES IN SMALL STREAMS AND CREEKS...AND PONDING OF WATER FOR THE USUAL VULNERABLE LOW LYING AREAS AND DITCHES...ARE EXPECTED. MAIN STEM RIVERS MAY ALSO EXPERIENCE SIGNIFICANTRISES.
A FLOOD WATCH MEANS THERE IS A POTENTIAL FOR FLOODING BASED ON CURRENT FORECASTS. YOU SHOULD MONITOR LATER FORECASTS AND BE ALERT FOR POSSIBLE FLOOD WARNINGS. THOSE LIVING IN AREAS PRONE TO FLOODING SHOULD BE PREPARED TO TAKE ACTION SHOULD FLOODING DEVELOP.

MANUAL ON FLOOD FORECASTING AND WARNING8-8
The Website providing the flood warning also contains links to graphical and map displays. Figure 5.4 (Chapter 5) can be referred to as a typical example, which provides the recent progress of river level along with the river forecast and the defi-nition of different warning and danger levels. This method of illustrating current and forecast infor-mation has been adopted in Bangladesh, but some authorities consider that the level of information could lead to confusion or unnecessary alarm.
(c) Flash-flood warning (Box 8.3):
8.5.2.2 Australia
As in the United States, flood forecasts and warn-ings in Australia are managed and issued by the NWS, the Bureau of Meteorology. Information is cascaded down from national to state level, Figure 8.5 being an example for Northern Queensland.
On the Internet site cited in the figure, flood warning information is obtained by clicking on one of the red triangles (signalling a major flood, details in Box 8.4
Box 8.3
FLASH FLOOD STATEMENT NATIONAL WEATHER SERVICE PADUCAH KY ISSUED BY NATIONAL WEATHER SERVICE SPRINGFIELD MO 411 AM CST WED JAN 28 2009
A FLASH FLOOD WARNING REMAINS IN EFFECT UNTIL NOON CST FOR CHRISTIAN COUNTY...
AT 400 AM CST...CHRISTIAN COUNTY OFFICIALS RELAYED TO THE NATIONAL WEATHER SERVICE THAT THE LITTLE RIVER HAD STARTED FLOWING OVER LITTLE RIVER CHURCH ROAD. AT THIS POINT...FLOOD WATER WAS FLOWING DOWN TOWARD THE COMMUNITY OF HOPKINSVILLE. HOPKINSVILLE POLICE DEPARTMENT RECOMMENDS THAT ANYONE WITHIN FLOOD PRONE AREAS OF THE CITY SHOULD SEEK HIGHER GROUND IMMEDIATELY. RESIDENTIAL AREAS WITHIN THE CITY ARE EXPECTED TO FLOOD.
RUNOFF FROM THIS EXCESSIVE RAINFALL COULD ALSO CAUSE FLASH FLOODING IN OTHER AREAS OF THE COUNTY. CREEKS...STREAMS AND LOW WATER CROSSINGS WILL BE ESPECIALLY SUSCEPTIBLE TO THE DANGERS OF FLASH FLOODING.
Figure 8.5. Regional flood situation map, Northern Queensland, Australia
Source: Bureau of Meteorology, Australia (http://www.bom.gov.au/)

CHAPTER 8. STRUCTURE AND ORGANIZATION OF FLOOD WARNINGS 8-9
following). Note that the information is headed by a unique, sequentially numbered reference (or identi-fier), which avoids confusion if warnings are updated for the same location.
(a) Flood warning (Box 8.4):
8.5.2.3 United Kingdom
The Environment Agency is the organization responsible for flood forecasting and warning in England and Wales, and provides information via links on its main Website. The initial information on the site is a listing of flood watches and warn-ings, from which more specific information can be obtained by navigating through the site. In adopt-ing this approach, the agency has decided that a locality description is better than a key map of affected localities. However, there has been some criticism that the public may not necessarily be able to identify the river name and reach relevant to their location.(a) Flood warning: In the flood warning descrip-
tion there is a link to a map of the flood-risk area. In the example shown in Figure 8.6, the shaded area is where flooding can occur, based on historical data and modelling, not the actual or forecast flood extent.
(b) Flood watch: An example of a typical text description is shown in Box 8.5. On the Website the texts are accompanied by links to maps of the various flood-risk areas.
Advances in coupling hydrological models with expanding GIS datasets have resulted in the development and implementation of highly visual hydrological forecast products. This new class of products shows flood inundation forecasts by models linked to high-resolution DEM information.
Box 8.4
IDQ20865 Australian Government Bureau of Meteorology, Queensland
FLOOD WARNING FOR THE DIAMANTINA RIVER
Issued at 10:02 AM on Wednesday the 28th of January 2009 by the Bureau of Meteorology, Brisbane.
Moderate to major flooding continues in the Diamantina River between Diamantina Lakes and Roseberth. Renewed rises have caused moderate flooding in the upper Diamantina at Elderslie. Flood levels at Birdsville have fallen below moderate flood level but renewed rises and moderate flooding are expected during the next few days.
Renewed rises are occurring at Elderslie in the Upper Diamantina causing moderate flooding. Moderate flooding continues on the Diamantina River at Diamantina Lakes with levels falling very slowly. Moderate flooding is expected to continue at Diamantina Lakes and downstream at Monkira during this week.
Renewed rises are occurring in the Diamantina River at Roseberth where at 6am Wednesday the river level was 5.20 metres and rising slowly causing major flooding. Downstream at Birdsville the river level has fallen below the moderate flood level. Renewed rises and moderate flooding is expected at Birdsville over the next few days. The peak should be similar to the level reached late last week when it peaked around 6.5 metres.
Weather Forecast:
Fine. No significant rainfall is expected in the next 24 hours.
Next Issue: The next warning will be issued at about 10am Thursday.
Latest River Heights:
Diamantina R at Elderslie 2.6m rising 06:00 AM WED 28/01/09 Mills Ck at Oondooroo* 1.77m steady 08:00 AM WED 28/01/09 Diamantina R at Monkira 4m steady 06:00 AM WED 28/01/09 Diamantina R at Roseberth 5.2m rising slowly 06:00 AM WED 28/01/09 Diamantina R at Birdsville 4.6m falling slowly 07:30 AM WED 28/01/09
* denotes automatic station.
Warnings and River Height Bulletins are available at http://www.bom.gov.au/hydro/flood/qld . Flood Warnings are also available on telephone 1300 659 219 at a low call cost of 27.5 cents, more from mobile, public and satellite phones.
Box 8.5
Tributary rivers and brooks in West Cambs and North Beds
Current status: Flood Watch Location: the Rivers Kym & Til and the Alconbury, Ellington, Riseley and Bury Brooks Region: Anglian Updates: Call floodline on 0845 988 1188 and enter area number 03362 to get more information
This area is covered by our general early alert to possible flooding, known as Flood Watch. We can also issue more specific Flood Warnings in this area. Follow the link(s) below to check if Flood Warnings are also in force for the following location(s):
• Ellington and Hamerton and the Alconbury’s on the Alconbury Brook
• River Kym from Kimbolton to Great Staughton• Riseley Brook – Riseley and Pertenhall• Yelden, Upper Dean & Lower Dean
Updates on local radio: BBC Radio Cambridgeshire Updates on local TV:
• BBC – East• ITV – Anglia

MANUAL ON FLOOD FORECASTING AND WARNING8-10
By linking DEM data with hydrological-model forecast elevations computed for river channels, the area of flood inundation for the flood plain can be overlaid on top of detailed digital maps of human infrastructure, showing how forecast flooding will impact a given location. Figure 8.7 shows an illustration of a flood map product.
8.6 WARNINGINFORMATIONCONTRIBUTIONTOFLOODRESPONSE
Communities in remote areas may not be able to receive the types of warnings described in the previ-ous section. The lower tiers of administration and the emergency services need clear, predefined responsibilities and links with these communities. This should include:(a) Local radio, which should be supplied with
clear, accurate information;(b) Use of appointed community wardens with
direct two-way radios or mobile telephones to access warning agencies and emergency authorities;
(c) Local means of raising alarms, for example church bells, sirens and loudhailers. The latter could be the responsibility of selected individu-als or wardens, who need to be provided with equipment and transport, for example motor cycles or bicycles;
(d) “Sky shout” from emergency service helicopters.
The forecasting authorities, for example the mete-orological and catchment management agencies, need to be aware of remote communities that are at risk. Although it may not be necessary to prepare individual forecasts for these locations, it is essen-tial that there is an understanding of the effects of severe conditions in a particular locality. The local levels of administration and emergency services also need to be provided with up-to-date maps of known flood-risk areas. Although local knowledge of flood impacts is highly valuable, it is necessary to ensure that local maps and those used by the
Figure 8.7. A computer flood map product
Figure 8.6. An example of a flood warning area map for Whitland, Trevaughan and environs, Wales, from the United Kingdom Environment Agency
Source: http://www.environment-agency.gov.uk/

CHAPTER 8. STRUCTURE AND ORGANIZATION OF FLOOD WARNINGS 8-11
central forecasting and warning agencies are compatible.
At very localized levels, for example villages, there may be no representation of the competent flood management agency or local administra-tion that can keep reference maps or have them displayed to the public. It is, therefore, important to preserve flood marks on key buildings or where they can be easily observed as reference to impacts. In parts of Bangladesh flood marks are recorded on roadside milestones, which can serve to indicate the impact of floods on access roads. In places where major floods are not a regular occurrence, the recording of maximum historical floods is also important, as major floods may not occur within the lifespan of present residents. In Dresden for example, flood level marks going back over two centuries were of great value in referencing the 2002 floods on the River Elbe within a long time series. Such information is arguably becoming more valuable as predictions of increasing flood severity are being put forward as a result of climate change.
8.7 FLOODALERTSYSTEMS
8.7.1 Establishmentoffloodwatchsystemsincludingcommunications
Local flood watch arrangements are very impor-tant not only for preparedness of the local community, but to allow the local watchers to provide early information to the authorities on a developing situation. Quite often localized flood-ing can occur without being picked up by monitoring networks. Local arrangements could include the following:(a) Provision of simple raingauges and river level
staff gauges to be read by an appointed indi-vidual: raingauges are particularly important in flashy catchments where flooding can occur quickly and the maximum warning time is needed;
(b) Maintenance of watch on the river level and the embankment conditions in the local area: the frequency of the river and embankment watches should be increased as the flood height approaches and crosses the critical level;
(c) Authorization for observers to give local warnings;
(d) Provision for observers to be supplied with means of communication, for example two-way radios and loudhailers.
In addition, local observers can make a valuable contribution through their local knowledge.
Observing general weather conditions, the charac-ter of the river and reactions of animals known to be associated with imminent flooding should be communicated to the authorities. The local watcher can also have the role of disseminating information to the community. This action has a strong commu-nity involvement and can be led by accepted community leaders. There will be a need for people to have the following appropriate skills:(a) The ability to install gauges and provide guid-
ance on the meaning of rainfall depths and river levels;
(b) The ability to read the gauges and interpret the results.
In particular, local flood watchers should be aware of whether the river is rising and the rate of the rise.
8.7.2 Establishmentofgaugesforlocalfloodwarningpurposes
This involves the provision, within communities, of gauges for rain and water level. These gauges provide measurement of rainfall or water level that can contribute to the overall flood forecasting and warning process. The measurement equipment used should be capable of being read on the spot. The following equipment is concerned:(a) An accumulating raingauge, which the observer
must measure and record daily, but which could be read more frequently, for example during heavy storms;
(b) A staff gauge measuring water elevation at a convenient point close to the community. This again should be read and recorded daily, but should be read more frequently during flood events.
Low-cost devices are available to provide remote displays and alarm signals, and can be battery powered. This allows the observer to obtain read-ings without going outside in adverse conditions, which in the case of reading a river gauge in the dark, can also be dangerous. An alarm setting allows information to be noted at any time. The gauges should be provided through government agencies or NGOs, and must comply with national standards of siting and construction. Observers must be trained competently. Observers using this equip-ment must have their importance recognized in the community, and receive some financial support, for example to purchase bicycles, radio batteries and other essential equipment.
Automatic alarms are associated with more sophis-ticated flood management arrangements. The latest arrangements by the Environment Agency in England and Wales are for direct warnings to prop-erties, both domestic and commercial, in areas of

MANUAL ON FLOOD FORECASTING AND WARNING8-12
high flood risk. Arrangements can be made with individual commercial and domestic property owners to receive flood warnings by telephone, mobile phone, fax or pager.
8.8 WARNINGANDSOCIETY
8.8.1 Basicconsiderations
A flood warning service may be highly organized and integrated on a technical and administrative level, but the perception and response is always dependent on social structures and frameworks. These can be highly variable and often unpredictable.
The goal at the community level is that warnings should be received by all individuals. The way in which messages are disseminated in communities will depend on local conditions, but may include some or all of the following:(a) Media warnings;(b) General warning indicators, for example sirens;(c) Warnings delivered to areas by community
leaders or emergency services;(d) Dedicated automatic telephone warnings to
properties at risk;(e) Dissemination of information about flooding
and flood conditions affecting communities upstream. One approach to achieve this is to pass warning messages from village to village as the flood moves downstream;
(f) Keeping watch and giving regular informa-tion about the river level and the embankment conditions in the local area. The frequency of the river and embankment watches should be increased as the flood height increases and crosses the critical danger level;
(g) A community-based warning system to pass any information about an approaching flood to every family.
8.8.2 Mediaawareness
The media, for example the press and broad-casts from television and radio, are considered to be vital participants in the flood warning process. However, the relationship between the forecasting and warning services and the media must be managed carefully. Reporters and presenters are not technical specialists, and their basic aim is to publicize a “story”. This frequently means that they will emphasize mistakes and failures, for example errors in severe weather forecasts or flood alerts, break-downs in emergency responses and occurrence of fatalities. The success of an operation is often not similarly emphasized as “good news”.
The media tend to avoid technical terms in meteor-ology and hydrology, and have a number of their own words and phrases used in the context of flooding, often to provide a dramatic effect. Thus, rivers will “burst their banks”, rather than just over-top into the flood plain, and a flash flood is termed an “on-rush of waters”. Heavy rainfalls are “torren-tial” or, in temperate countries “like a monsoon”. Such terms are chosen for impact rather than to give measurements, which would require placing the events in context. A recent tendency in United Kingdom press and broadcast reports is to compare an event rainfall with a monthly average figure. Thus a 50-millimetre storm rainfall, not uncom-mon in a thunderstorm, may appear dramatic when stated as “three quarters of the average expected monthly rainfall”. Events are frequently described as “unprecedented” or “the worst in living memory”, with no reference to historical data. In recent years, both politicians and the media have been prone to attribute unusual storms and floods as “evidence of climate change”, when in fact the event in question is well within the natural varia-bility of the data series.
Major NMSs and flood warning services have for some time operated well-organized press and media units, both to respond to media queries and to be proactive on media stories that involve specialist content. This has arisen because techni-cal specialists are often not well experienced in dealing with professionals from the media, who may put their own interpretation on a technical statement, or take statements out of context. Those officers selected for media contacts need to have specialist training in presentation, the writ-ing of press briefs and the emission of public awareness material. Media officers and presenters can and often do come from a background in media work, although they will need training in the basics of meteorology and hydrology, which may be more effective than training a technical specialist to deal with media relations. Weather channels proliferate in television and radio in the United States. At the other extreme, the British Broadcasting Corporation (BBC) uses only quali-fied Met Office staff.
It is to be hoped that, as a result of official organi-zations being proactive, or at least cooperative with the media, the awareness of flood warning technology will grow. It is therefore beneficial to have regular press briefings, particularly during critical events. Liaison with the press and broad-cast media is very important when new processes and facilities are introduced, such as new warning codes for floods or severe weather. When new codes were introduced in England and Wales by the Environment Agency in 2001, this was backed up by a concerted media-briefing campaign. The
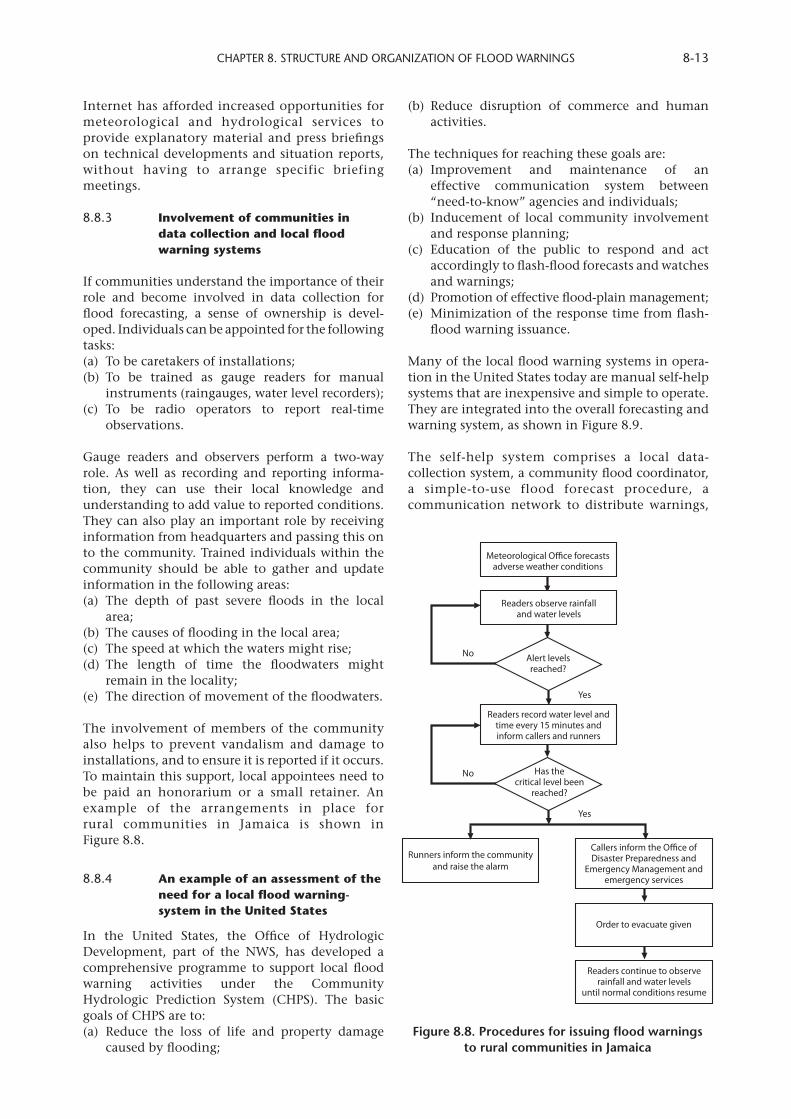
CHAPTER 8. STRUCTURE AND ORGANIZATION OF FLOOD WARNINGS 8-13
Internet has afforded increased opportunities for meteorological and hydrological services to provide explanatory material and press briefings on technical developments and situation reports, without having to arrange specific briefing meetings.
8.8.3 Involvementofcommunitiesindatacollectionandlocalfloodwarningsystems
If communities understand the importance of their role and become involved in data collection for flood forecasting, a sense of ownership is devel-oped. Individuals can be appointed for the following tasks:(a) To be caretakers of installations;(b) To be trained as gauge readers for manual
instruments (raingauges, water level recorders);(c) To be radio operators to report real-time
observations.
Gauge readers and observers perform a two-way role. As well as recording and reporting informa-tion, they can use their local knowledge and understanding to add value to reported conditions. They can also play an important role by receiving information from headquarters and passing this on to the community. Trained individuals within the community should be able to gather and update information in the following areas:(a) The depth of past severe floods in the local
area;(b) The causes of flooding in the local area;(c) The speed at which the waters might rise;(d) The length of time the floodwaters might
remain in the locality;(e) The direction of movement of the floodwaters.
The involvement of members of the community also helps to prevent vandalism and damage to installations, and to ensure it is reported if it occurs. To maintain this support, local appointees need to be paid an honorarium or a small retainer. An example of the arrangements in place for rural communities in Jamaica is shown in Figure 8.8.
8.8.4 Anexampleofanassessmentoftheneedforalocalfloodwarning-systemintheUnitedStates
In the United States, the Office of Hydrologic Development, part of the NWS, has developed a comprehensive programme to support local flood warning activities under the Community Hydrologic Prediction System (CHPS). The basic goals of CHPS are to:(a) Reduce the loss of life and property damage
caused by flooding;
(b) Reduce disruption of commerce and human activities.
The techniques for reaching these goals are:(a) Improvement and maintenance of an
effective communication system between “need-to-know” agencies and individuals;
(b) Inducement of local community involvement and response planning;
(c) Education of the public to respond and act accordingly to flash-flood forecasts and watches and warnings;
(d) Promotion of effective flood-plain management;(e) Minimization of the response time from flash-
flood warning issuance.
Many of the local flood warning systems in opera-tion in the United States today are manual self-help systems that are inexpensive and simple to operate. They are integrated into the overall forecasting and warning system, as shown in Figure 8.9.
The self-help system comprises a local data-collection system, a community flood coordinator, a simple-to-use flood forecast procedure, a communication network to distribute warnings,
Figure 8.8. Procedures for issuing flood warnings to rural communities in Jamaica
Meteorological O�ce forecastsadverse weather conditions
Readers observe rainfalland water levels
No
No
Yes
Yes
Readers record water level and time every 15 minutes and inform callers and runners
Runners inform the communityand raise the alarm
Callers inform the O�ce of Disaster Preparedness and
Emergency Management and emergency services
Order to evacuate given
Readers continue to observerainfall and water levels
until normal conditions resume
Has the critical level been
reached?
Alert levelsreached?

MANUAL ON FLOOD FORECASTING AND WARNING8-14
and a response plan. It has been found that the simplest and least expensive approach to data collection is to recruit volunteer observers to collect rainfall, stream- and river-stage data. Inexpensive, plastic raingauges are available from the NWS for volunteer observers who report rainfall amounts to a community flood coordinator. The flood coordinator maintains the volunteer networks.
More sophisticated automated raingauges may be necessary in remote areas or in situations where observers are not available. Stream gauges also vary in sophistication from staff gauges to automatic telemetered gauges.
8.8.5 Floodwarningeffectivenessandhumanpsychology
There is a considerable volume of investigation regarding the reasons for failure of flood warnings, and a summary of this is contained in Box 8.6. The reasons are classified according to whether a “shared meaning” between the authority issuing the warn-ing and the public has been achieved.
These systems need to be periodically reviewed to see if material and arrangements remain appropri-ate. In particular, the performance of warning delivery, receipt and action needs to be reviewed after each major event. If necessary, simulation exercises should be undertaken. It is important that the people in each community receive information as early as possible about the possibility of flooding
in their area. In addition to the valuable informa-tion from the official flood warning system, communities should attempt to develop their own warning systems.
However, efforts to develop community awareness and participation may not always produce the results desired by the administration. Local views and prejudices can override technical matters relat-ing to the response to flood warnings, as illustrated by the newspaper article reproduced in Box 8.7.
Box 8.6
Shared meaning of the flood warnings exists but is of limited value:
(a) Some people are not flood-risk averse and hence although the warnings are understood they are ignored, or even taken as a challenge;
(b) Other priorities may interfere with the immediate response to the warning message, for example people may be unlikely to respond until all the whereabouts of their household members have been established;
(c) Inhabitants may be unwilling to leave their property, belongings and livestock, for fear of looting and vandalism;
(d) Other signals, such as the actions of neighbours or the prevailing weather, may contradict the official warning. People often seek confirmation of a flood event before they act;
(e) Some people have an aversion to following authority and may ignore official advice. In many cases people are disinclined to follow orders, preferring to make their own decisions based on the information in front of them;
(f) Some people cannot respond and hence warnings have no value for them, for example they may lack the physical or mental capacity to respond, or they may be absent;
(g) Some of those at risk may not be worried about flooding until they have actually suffered a loss.
Shared meaning of the flood warning is difficult to achieve:
(a) In many cases the population at risk will be very diverse. This diversity may mean that there are different priorities, languages and levels of understanding of the flood warning;
(b) Some groups of people may not receive any warnings even when the system appears to function perfectly;
(c) Informal personal warning networks may reinforce, but can also undermine or deflect ,official communications.
Figure 8.9. The role of CHPS in the United States
Observations
Dataassimilation
Forecastsystem
CHPS links hydrologic communities
Communitymodels
Analysis
Model forecasts
Post-processed model data
Forecaster
User (public, industry...)
Communityobservations

CHAPTER 8. STRUCTURE AND ORGANIZATION OF FLOOD WARNINGS 8-15
Box 8.7
Report of ignored flood warnings from the Botswana Daily News:
“Another tiny island community of Xaxaba, situated deep in the Okavango Delta, has turned down advice from authorities in the North West District to flee the impending Okavango River floods. In a meeting addressed by members of the disaster management committee to warn them of the raging floods, the residents said they would rather “wait and see what happens” than leave the land of their ancestors. Instead, they requested to be provided with tents and boats or canoes for use should the need arise. They added that they were not threatened by the floods, which they regard as normal.
At the Jao Flats island in the delta, authorities failed for the fourth time to convince the community to move to safer areas despite the fact that the floods had already encircled their tiny island. Even MP Joseph Kavindma’s advice could not sway them as they took turns to dismiss authorities’ warning as alarmist. Kavindama had told his constituents of how government was concerned about their lives, saying it would reflect badly on government if they were left to drown. He added that the residents must be careful not to make wrong decisions that might not augur well for their children. But still they would not be moved.
They told the gathering that they had existed on the island for ages. They had seen good and worse situations come and go and, above all they know the behaviour and character of the Okavango River. Tholego Motswai said only if the situation would be of the magnitude of the biblical “Noah’s flood”, then there was cause for alarm, adding that even in that situation she would choose to die on the island, to join her ancestors. To show that indeed the floods were not an issue to them and therefore a non-starter, Dihawa Tuelo chose to become irrelevant by asking about the formation of the long awaited community trust in their settlement, saying there were more pressing issues to discuss.
David Nthaba said it was too early to suggest that there could be any floods, adding that there were land marks such as trees that they used over ages to gauge the intensity of floods, as such there was no chance that the water could catch them unawares. Another unidentified speaker queried why in the past government did not intervene in similar situations, saying he suspected a sinister motive. Other speakers, demanding to be left alone, said they could handle a flood disaster without government intervention. Only two residents seemed perturbed by the warnings as they told the authorities that they were ready to move to a higher, safer ground. District Commissioner Badumetse Hobona agreed to supply tents as per the residents’ requests and terms but warned that time was running out for the obstinate.”


9.1 CONSIDERATIONOFEXISTINGRESOURCES
This chapter makes the initial assumption that even if starting a new flood forecasting and warning operation, there will be some existing basic techni-cal and organizational framework in meteorology and hydrology on which to build. Whatever the type of organization for flood forecasting in any country, the activity is not usually considered as being set up to provide a continuous service, as is the case for weather forecasting. Flood forecasting activity proceeds on a duty-based service, which starts when an alert for a severe event is received. Thus, the activity of the flood forecasters is most likely to be divided between their operational duty and that of a full-time establishment post. Even where there is a dedicated flood forecasting and warning structure the routine tasks are very differ-ent from the operational ones.
In addition, there is always a constant turnover of staff in any organization, which brings together new and long-established personnel. All newly recruited staff will need to be trained to fulfil all the requirements for the flood forecasting activity. Existing staff must therefore be trained in new concepts and the latest techniques, while newly recruited staff must also receive training adapted to their new post when they take up their duties.
An analysis of staff profiles within any flood fore-casting and warning organization will show that the level of educational qualification varies consid-erably, with technicians and academics of doctoral level working alongside one another. Clearly, tech-niques and practices must be standardized, and consistent organizational guidelines and structure established, to clearly define the range of roles and responsibilities. In the case that a new organiza-tional structure is being set up, the issue of how to define competencies and maintain them over time has to be addressed.
Developing a flood forecasting and warning unit from within existing organizations will require selection from a range of skills. The activities of staff working in flood forecasting services fall into four main categories:(a) Operational activities, which involve analysing
the hydrometeorological situation and making forecasts using simulation models;
(b) Modelling, whereby staff members must determine the requirements for the design of
simulation tools that may vary greatly depend-ing on the types of basin being studied: prior calibration and operational implementation are technically complex operations;
(c) Hydrometry, which ranges from data collection to their input into the operating and archive databases; this field also covers data transmis-sion and data quality control;
(d) Informatics, which involves ensuring that equipment and real-time applications are functioning correctly 24 hours per day; infor-mation technology (IT) specialists are also responsible for the provision and implemen-tation of all output formats as maps, diagrams and text.
These activities are closely interrelated and staff within the services usually perform duties spanning two or three activities, particularly where the serv-ice is small. Thus, modellers may be required to be on operational standby duty. The following are typical of appropriate backgrounds for the person-nel likely to be involved:– Hydrologists– Modellers– Systems managers and developers– Computer operators– Technical systems operators– Meteorologists– Telecommunications technicians– Public awareness and information specialists– Emergency operations managers– Field observation staff
Assuming that the flood warning activity is being developed from within a water management organization, it is likely that most of the skills may already exist “in-house”. It is impossible to be prescriptive about the precise number, structure and balance of skills, qualifications and experi-ence. Within all the above occupations and fields of activity there is a considerable degree of specific, non-academic knowledge that is only acquired by working within a flood forecasting and warning operation, and which can only be learned through practice.
9.2 PROFESSIONALQUALIFICATION
Almost all staff in the categories listed above, because of the skilled nature of their work, have some form of technical, academic or professional
CHAPTER 9
TRAINING REQUIREMENTS

MANUAL ON FLOOD FORECASTING AND WARNING9-2
qualification. In most cases, these skills and experiences will be recognized by some form of certification or registration process. The occupation of a given post is always a balance of education, training and experience.
In most countries, the personnel working in the professional categories listed above have some form of tertiary education obtained from a university or technical college. Such establish-ments typically provide courses in various relevant disciplines, for example civil engineer-ing, earth sciences, physical science, computing and IT, and electronics. The advantages of this type of education are the acquisition of the common basics and culture of the individual disciplines. Apart perhaps from meteorology and some aspects of IT, there are no specific courses that immediately qualify an individual for the post of “flood forecaster”.
Because individuals may come from a range of disciplines, it is recommended that require-ments for educational backgrounds are not too prescriptive. Such an approach is likely to arise because of the structure imposed by government recruitment regulations. These may typically require staff on career professional grades to have a first or postgraduate degree in civil engi-neering (for hydrology) or physics (for meteorology). It is preferable for individuals to achieve the necessary competences by a combi-nation of further education, training and work experience. These frequently lead to postgradu-ate specializations, for example master’s- or doctorate-level degrees, or a qualification from a professional body, for example an institute of professional engineers.
Some countries or groupings (for example, the British Commonwealth and EU) have a process of mutual recognition of qualifications from member states, and can accept these as a registra-tion, for example the qualification Professional Engineer (P.Eng). At the time of writing, France is considering launching a certification process that would bring all the training processes together within a coherent training scheme, leading to a certification, irrespective of particular back-ground. For example, a technical certification in computer operation would be equivalent to an instrument technician. In the United Kingdom a system of National Vocational Qualifications (NVQs) has been introduced, some covering meteorological skills. This type of experience recognition helps in assigning staff within a given organizational structure. Similarly, many certify-ing organizations in the United Kingdom insist on Continuous Professional Development (CPD), under which process the periodic reporting of
work experience and training is part of maintain-ing a given certification. This is the case, for example, for the Chartered Meteorologist status, which is administered by the Royal Meteorological Society. These initiatives make it possible to establish and maintain the required level of skills and motivation.
9.3 TRAININGANDCONTINUINGEDUCATION
Understandably, the skills required in each disci-pline or specialist activity can change over time, mainly because of scientific and technical advances, but also because an individual’s knowl-edge may stagnate. For example, many field staff in hydrometry, trained and experienced initially with manual or chart-recording instruments, will over recent years have to have adapted to elec-tronic, solid-state instruments. The need to operate, maintain and repair field instruments will also have changed, so from manual extraction of data from charts, staff will need to operate down-loading facilities to portable data units or laptop computers. It is for this reason that when a flood warning service carries out a major development or re-equipping exercise, training must be part of the procurement contract. Too much staff rotation within the unit, or across different sections of a larger organization, can also result in a loss of practical knowledge, and destroy the confidence of individuals in their abilities.
It is helpful, if not essential, that all members of the forecasting and warning organization have access to regular training programmes, either to complete their basic education or maintain and develop new skills. In the case that an organiza-tion is sufficiently large, for example if the flood warning unit is part of a much larger NHS or NMS, there may well be a training centre that can organize courses. In this case, courses in the core requirements of the operations could include flood forecasting experience, meteorol-ogy, hydrometry, hydrology and hydraulics, administration, public awareness and environ-mental responsibilities. These programmes may be organized on an annual basis, to allow train-ing of new staff intakes.
Continuing training cannot cover every require-ment and in some smaller flood warning units, particularly in lesser-developed countries, it may be difficult to access appropriate training, as it may require overseas visits. The costs and travel time associated with training courses overseas are very high, and if the courses can only be accessed infrequently, there is no continuity. A
CHAPTER 9. TRAINING REQUIREMENTS 9-3
solution to this is sometimes the process of “training the trainers” where key staff may receive overseas training, and then return to their parent organization where they repeat for other staff the training modules they have received. This approach has been successfully applied in Papua New Guinea and Bangladesh, where senior technical officers have spent time with the flood warning services of New Zealand and have then returned to provide training for the national hydrological and flood warning services in their own countries.
Another approach is through self study, which can also be an essential complement to other types of training. Self study is able to cover some aspects that may be absent from basic education and continuing training, and can be focused on very specific topics. Formerly available by correspond-ence and remote learning centres (for example the Open University in the United Kingdom), this approach is increasingly becoming available through Web-based sources. The advantages of self study are the following:(a) Courses are flexible and not fixed to annual
cycles or locations;(b) It is possible to learn quickly using interactive
audio-visual products;(c) It is readily accessible, so students can learn at
their own pace, whenever and wherever they wish;
(d) Basic concepts can be revised;(e) The materials and products can be constantly
updated;(f) Collaboration can easily be established between
national or international bodies.
Self study through Web-based courses can be used within a broader framework of introductory or continuing training courses. However, there are some disadvantages, which might limit the effec-tiveness of this approach. The Web-based courses are expensive to design, especially if they set out to include advanced, interactive products. Providers might decide after a few years to aban-don the courses through lack of users. If courses are linked to a specific product, courses may be abandoned or changed when the product is upgraded or made obsolete. Language may also be a problem for some students, especially if techni-cal jargon is used.
The self-study process does not promote human contact, which is an important part of the learning process. The student therefore needs to have a high level of motivation, which may need to take some form of financial support, or be linked to promo-tion prospects. Web-based courses may also lack effective certification or recognition by qualifying bodies.
Self study within an overall training programme can take a number of forms of increasing complexity, as outlined below.
Level 1: Information searching
This involves accessing all types of informative materials, by keyword searches in international browsers (Google, Wikipedia) or within an organi-zation’s Website. The main advantage is that material is readily accessible, but it must be recog-nized that standards of information are very heterogeneous, and may often be written for purposes other than high-quality training. Products available are generally text files, images and videos.
Level 2: Web-based learning
This involves a provider putting specific products online that are often organized into lessons. They can be accessed using keywords or by browsing a dedicated Website. The provider usually has an aim or commitment to help the student acquire knowl-edge through completion of a full learning module. It is an improvement on level 1, as the content and products are more defined, but still has the problem of the student working alone.
Level 3: Blended learning
This level provides education or training within a more formal framework. It requires the imple-mentation of an educational initiative based on a starting profile and a target profile. The initiative focuses on studying a particular field rather than one specific subject. Frequently, the programme has two components. A set of course materials are available online, which provide the student with all the necessary content, and the student can also access pre-recorded lectures given by teach-ers (“asynchronous e-training”). The online material is complemented by the lessons, which can also be in the form of classroom-based sessions or virtual lessons. In this case the lessons are pre-scheduled, with a teacher present at the same time as the students, allowing them to interact (“synchronous e-training”). This approach does, however, have a disadvantage in that the technology required is sophisticated, and organizing classes is a complex matter that may be difficult to justify within a government department working environment.
Self study (or self learning) and continuous professional development within a framework coordinated at international level could be an important initiative to improve flood warning services in a number of countries confronted with similar problems. Guidlines are already produced

MANUAL ON FLOOD FORECASTING AND WARNING9-4
by WMO on education and competence standards for people working at NMSs. If this was extended to national flood warning services, it could lead to a greater degree of cooperation between the services of different countries, with the teaching products translated and adapted to the local situations.
Although thorough basic education and continu-ous training are all relevant to provide members of the flood forecasting unit with the knowledge to understand and perform their jobs, practical expe-rience is perhaps the most appropriate way to know how to work in an operational situation. A few hydrological services use simulators of their forecasting software, which allow professionals to train, and perhaps test “what-if” scenarios, or to become familiar with new technologies and new practices. However, this approach is not normally conducted at the high level found in other profes-sions, such as during the training of an airline pilot.
The simulation approach can be extended to train-ing exercises. These can be “desk-top” where staff within the flood warning organization have to respond to a range of hypothetical situations. At its most elaborate, the exercise can be carried out in quasi-real time, and involve a wide range of partner organizations, for example local government or emergency services. In this way response actions can be tested as well as the technical aspects of simulating a flooding situation.
In a full exercise the forecasting and warning serv-ice is placed in a situation that represents a real case, and this could include the following elements:(a) The process begins with information from the
meteorological services that will activate full operational duty;
(b) Real-time interaction with meteorological serv-ices will be maintained continuously during the event;
(c) Simulations of catchment and river models are used to produce realistic situations to allow the flood forecaster to provide information to generate warnings;
(d) Critical situations may be introduced, for example loss of data transmissions, computer break down, and the like;
(e) A realistic set of warning information may be produced that will escalate responses within the organization;
(f) Establishment of contacts with public protec-tion services will be made to keep them informed of the evolution of the situation;
(g) Information may be provided to authorities at national level and to the press;
(h) Internet output material may be prepared and used to inform public protection services and the general public in real time.
The organization of the links for the exercise with local and national meteorological services and local public protection services has to be adjusted to the local situation, depending on how far other agencies are prepared to cooperate. However, such an integrated approach is highly valuable to estab-lish and test specific procedures during crisis events.
The extended exercise must be operated by profes-sionals and requires a large amount of effort to produce. It will therefore be costly, and not some-thing that can be repeated very frequently. In a few countries local units of the flood warning service may organize some training sessions in their own offices, most often in the non-flood season. Few exercises are done at national level: Operation Trident was carried out in the United Kingdom in 2004 by the Environment Agency (Environment Agency, 2005), but has not been repeated since. It is interesting to speculate whether a flood simulation exercise could be implemented in a shared international basin, with the involvement of services from the constituent countries.
9.4 OPERATIONALTRAININGOFPERSONNELINFLOODFORECASTINGANDWARNINGSERVICES
Operational training of personnel is vital to retain and develop skills for the various aspects and disciplines involved in flood forecasting and warning. Most personnel employed by flood fore-casting and warning agencies need to have some specialist education and qualification, and thus the general level of education in a country is an important starting point. However, whatever the level of education and the appropriateness of a formal or professional qualification, some train-ing and skill development associated with the work involved is required. This can be instigated by having a hierarchical staff structure, where senior, more experienced members pass on knowledge to newly recruited staff. The growth in technical specialization in recent years has meant that individuals and groups within the organisation may not easily recognize the details or relevance of particular sets of skills. Thus, operational training can take place at several levels, as follows:(a) Technical skill training to keep up to date with
the latest developments, new equipment and technologies;
(b) Familiarization training for different units within the organization, for example so that field officers are aware of data-processing staff needs;

CHAPTER 9. TRAINING REQUIREMENTS 9-5
(c) Training for the whole unit: internal and joint exercises;
(d) Training for interfacing with other organiza-tions, such as technical training in associated fields, or communication skills, for example for press and media briefing.
When new monitoring equipment, data management, models and software are intro-duced, staff will require the requisite training. Such training should be professional and focused, as staff who have been accustomed to particular ways of doing things may under-standably be resistant to change. This is particularly important where changes are intro-duced as part of an aid-assisted “package”: the organization cannot be expected to be handed instruments and systems of which they have no experience, and then to proceed to utilize them effectively. Donors and recipient governments and their specialist organizations need to give this aspect special consideration. The training portion of a project is too often given insuffi-cient importance where costs have to be kept within close limits. A good option is for detailed training of core staff, who in turn can develop skills in their subordinate staff (“training the trainers”). Training packages of this type have been provided for some years by the National Institute of Water and Atmospheric Research (NIWA) that operates the hydrological and meteorological services in New Zealand. Key technical staff from other countries, for exam-ple instrument technicians, observers and hydrometric technicians, are given a period of several weeks on-the-job training and some formal coursework with various operational units, after which they are encouraged to provide internal training to staff in their “home” organization. Part of the arrangement is also for mentors from New Zealand to spend time with the recipient organizations, which ensures that they understand the individual working environments and needs of the partici-pating organizations.
The organizations responsible for flood forecast-ing and warning are usually large government departments or agencies, and will have their own internal training programmes. However, the field of operations requires flood warning operatives to understand other disciplines, espe-cially where they have to coordinate with other services. The following is a summary of the content of training courses provided by the United Kingdom Met Office to staff of the Environment Agency engaged in flood forecast-ing and warning. The aim is to provide the necessary information to different levels of staff in order that they can better understand and
utilize the information given in meteorological forecasts and outputs.
Course 1: Meteorology for flood warning duty officers
Aim: to provide appropriate training to enable flood warning duty officers to develop a better understanding of the weather, radar information, tidal surges and Met Office products, to help them perform their jobs more effectively.
Primary objectives: by the end of the course the trainee should be able to:(a) Interpret the synoptic situation and state
how air masses and fronts shape the United Kingdom weather;
(b) Describe basic rain patterns;(c) Interpret daily forecasts, heavy-rain warnings
and national severe-weather warnings;(d) Demonstrate an understanding of radar
rainfall observations, forecast radar and its limitations;
(e) State how rainfall forecasts are produced and their limitations;
(f) Outline the features of high tides and surges, including the forecast products involved and their limitations.
Course 2: General meteorology
This course is at a more general level than course 1 and is aimed at staff members who have an ancil-lary role in flood forecasting and warning, for example observers, control-room assistants or temporary assignees to flood warning duties from other units. The course is intended to meet specific competency levels, defined by the Environment Agency as part of the internal training programme for staff members, these being:(a) How to interpret meteorological data and
information;(b) How to interpret weather patterns and Met
Office data.
Aim: to provide appropriate meteorological train-ing to enable agency staff to develop a better understanding of weather forecasts, and hence perform their job more effectively.
Primary objectives: by the end of the course partici-pants should be able to:(a) Interpret the synoptic situation;(b) State how air masses and fronts shape the
United Kingdom weather;(c) Display an understanding of how their
local catchment area can affect rainfall accumulation;
(d) Demonstrate the principles of weather forecast-ing and relate them to operational practices within the agency.

MANUAL ON FLOOD FORECASTING AND WARNING9-6
Secondary objectives:(a) Reinforce understanding of the basic princi-
ples of the interpretation of weather charts and data;
(b) Encourage an interest and enthusiasm for meteorology.
Course 3: Radar meteorology
This course is for flood forecasting and warning staff with a specific requirement to interpret weather-radar data, that is, it is designed for front-line duty forecasters.
Aim: to provide staff with an in-depth understand-ing of weather radar, including its operational uses and limitations, to help staff make better informed decisions in their duties.
Objectives: by the end of the course, participants should be able to:(a) Relate radar capabilities to operational
requirements;(b) Understand the strengths and weaknesses of
radar rainfall measurements;(c) Explain and utilize the benefits of real-time and
forecast radar imagery.
Course 4: Tidal and surge forecasting
Many flood warning areas include estuaries and coastlines where flooding in the lower courses of rivers may be affected by tidal conditions. It is therefore important that flood forecasting and warning staff are aware of specific forecasts relating to tides and surges.
Aim: to address Environment Agency competen-cies in flood-risk management, by providing guidance in interpretation and understanding of tides, storm surges, wave activity and storm tide forecasts.
Objectives: by the end of the course participants should be able to:(a) State the impact of wave and tidal flows in rela-
tion to flooding;(b) State the advantages and limitations of storm-
tide forecasts as provided by the Met Office;(c) Demonstrate the ability to correctly interpret
tidal alert messages.
Other suitable training for liaison work with “part-ner” organizations would be:(a) Media presentation;(b) Disaster management and coordination with
emergency services;(c) Public awareness campaigning.
9.5 ESTABLISHINGUNDERSTANDINGOFFORECASTSANDWARNINGSBYUSERS
It is essential for flood warning managers to fully understand and recognize the range of user require-ments so that flood warning products, data and information can be tailored to meet their needs (see also 6.4, 8.5 and 8.9). There are many segments of a national economy, such as transportation, emer-gency management, agriculture, energy and water supply that have their own particular needs for information. Recognizing and meeting users’ needs assures that the forecasting and warning service is held as being of high value for its benefits, thus encouraging investment. Opening up data and forecasts to many users increases the value and benefits of forecast services and builds a constitu-ency of users of the forecast service necessary to sustain operations in the future.
There are issues in some countries that are concerned about access to information regarding whether or not particular items relating to river conditions should be fully in the public domain. This subject can become increasingly important on shared international rivers, for example the Ganges and Brahmaputra rivers between India and Bangladesh and the Limpopo between Zimbabwe, South Africa and Mozambique. Flood warnings must be considered as a separate entity from the water bulletins that river management agencies in some countries produce as a matter of routine. For humanitarian reasons, every effort should be made to facilitate trans-border information to downstream countries.
The composition and distribution of flood fore-cast and warning products are very variable. As noted in earlier chapters, there are various means of distributing forecast and warning products. Whatever the means of delivering the service are, the critical components of the service should reach users and the population at risk in enough time to trigger response actions, and be in a form that is readily understood. Warning products should clearly describe the flood threat, identify the location of the event, the rivers and streams involved, the magnitude of the event expected (flood peak), when the peak will occur and, if possible, when the river will fall below flood levels. Further specific information, such as what portion of the infrastructure will be affected by the event, is important if it is possible to provide it. There will, however, inevitably be some form of compromise between the ideal and how much information can actually be provided, and the information that is provided will also be priori-tized for usefulness (sometimes defined as what is “nice to know or need to know”).

CHAPTER 9. TRAINING REQUIREMENTS 9-7
A whole range of written, diagrammatic and mapped warnings are produced by different national agencies (see 8.5). It is essential that issu-ing authorities provide training to the end-users as to what this information means and how it can be used to benefit their operations. When forecast and warning information was issued manually, for example by fax or telephone, the format was largely standardized to meet a range of user needs. Users could be trained in the understanding and applica-tion of this information. This tabular and text
presentation is now common in warnings issued by e-mail or via Websites. It may be argued that the proliferation in the use of Websites to issue bulletins and warnings, although greatly increasing the availability of information, also means that end-users can now be confused by the amount of this information, or on the other hand not be aware of the range of services. This may indicate the development of a new area for concern, where flood forecasting and warning services have a duty to maintain and develop public awareness.


CHAPTER 1
Arduino, G., P. Reggiani and E. Todini (eds), 2005: Special issue: Advances in flood forecasting. Hydrol. Earth Syst. Sci., 9(4).
Bangladesh Water Development Board, Flood Forecasting and Warning Centre, 2010: Annual Flood Report, 2009. http://www.ffwc.gov.bd/.
Flood Risk Management Research Consortium. http://www.floodrisk.org.uk.
Linnerooth-Bayer, J. and A. Amendola, 2003: Introduction to special issue on flood risks in Europe. Risk Anal., 23(3):537–543.
Moore, R.J., A.V. Bell, and D.A. Jones, 2005: Forecasting for flood warning. C.R. Geosci., 337(1–2):203–217.
National Oceanic and Atmospheric Administration. http://www.nws.noaa.gov.
United Kingdom Environment Agency, 2010: The costs of the summer 2007 floods in England. Flood and Coastal Erosion Risk Management Research and Development Programme, Project SC070039/R1. http://publications.environmentagency.gov.uk.
World Meteorological Organization: Natural hazards – Floods and flash floods. http://www.wmo.int/pages/themes/hazards.
World Meteorological Organization–Global Water Partnership: Associated Programme on Flood Management. http://www.apfm.info.
World Meteorogical Organization–United Nations Educational, Scientific and Cultural Organization, 1992: International Glossary of Hydrology. (WMO-No. 385), Geneva.
CHAPTER 2
Bowler, N., C. Pierce and A. Seed, 2006: STEPS: A probabilistic precipitation forecasting scheme which merges an extrapolation nowcast with downscaled NWP. Q. J. R. Meteorolog. Soc., 132:2127–2155.
Bruen, M., 1999: Some general comments on flood forecasting. In: Proceedings of the EuroConference on Global Change and Catastrophe Risk Management: Flood Risks in Europe, Laxenburg, Austria, 6–9 June 1999, IIASA.
Todini, E., 2001: A Bayesian technique for conditioning radar precipitation estimates to raingauge measure-ments. Hydrol. Earth. Syst. Sci., 5:187–199.
Veneziano, D., 2002: Accuracy evaluation of LIDAR-derived terrain data for highway location. Center for Transportation Research and Education, Iowa State University.
CHAPTER 3
Beven, K.J., 1997a: TOPMODEL: A critique. Hydrol. Processes, 11(9):1069–1086.
———,1997b: Distributed Hydrological Modelling: Application of the TOPMODEL Concept. Chichester, John Wiley and Sons.
Beven, K.J. and M.J. Kirkby, 1979: A physically-based variable contributing area model of basin hydrology. Hydrol. Sci. Bull., 24(1):43–69.
Beven, K. and E.F. Wood, 1993: Flow routing and the hydrological response of channel networks. In: Channel Network Hydrology (K. Beven and M.J. Kirkby, eds). Chichester, John Wiley and Sons.
Bonazountas, M. and J.-M. Camboulives, 1981: Multi-decision analysis for large-scale river-basin reservoir systems. J. Hydrol., 51:139–149.
Bowles, D.S., J.D. Mathias, S.S. Chauhan and J.D. Countryman, 2004: Reservoir release forecast model for flood operation of the Folsom Project including pre-releases. In: Proceedings of the 2004 USSD Annual Lecture, St. Louis, MO, United States, March 2004.
Braga, B. Jr. and O. Massambani (eds), 1997: Weather Radar Technology for Water Resources Management. Montevideo, UNESCO Press.
Chagnon, S.A., 1999: Record flood-producing rainstorms of 17–18 July 1996 in the Chicago metropolitan area. Part III: Impacts and responses to the flash flooding. J. Appl. Meteorol., 38:273–280.
Ciarapica, L. and E. Todini, 2002: TOPKAPI: a model for the representation of the rainfall-runoff process at different scales. Hydrol. Processes, 16(2):207–229.
Cluckie, I.D. and C.G. Collier (eds), 1991: Hydrological Applications of Weather Radar. New York, Ellis Harwood.
Dabberdt, W.F., A. Crook, C. Mueller, J. Hales, S. Zubrick, W. Krajewski, J.C. Doran, C. King, R.N. Keener, R. Bornstein, D. Rodenhuis, P. Kocin, M.A. Rossetti, F. Sharrocks and E.M. Stanley Sr., 2000: Forecast issues in the urban zone: Report of the 10th Prospectus Development team of the U.S. Weather Research Program. Bull. Am. Meteorol. Soc., 81(9):2047–2064.
DeVries, J.J. and T.V. Hromadka, 1993: Computer models for surface water. In: Handbook of Hydrology (D.R. Maidment, ed.). New York, McGraw-Hill.
Dooge, J.C.I., 1986: Theory of flood routing. In: River Flow Modelling and Forecasting (D.A. Kraijenhoff and J.R. Moll, eds). Dordrecht. D. Reidel Publishing.
Duan, Q., H.V. Gupta, S. Sorooshian, A.N. Rousseau and R. Turcotte (eds), 2003: Calibration of Watershed Models. Water Science and Application Volume 6. Washington, American Geophysical Union.
ANNEX I
REFERENCES
MANUAL ON FLOOD FORECASTING AND WARNINGAn-I-2
Engman, E.T. and R.J. Gurney, 1991: Recent advances and future implications of remote-sensing for hydrologic modelling. In: Recent Advances in the Modeling of Hydrologic Systems, Proceedings of the NATO Advanced Study Institute on Recent Advances in the Modeling of Hydrologic Systems, Sintra, Portugal, 10–23 July 1988 (D.S. Bowles, ed.). Dordrecht, Kluwer Academic Publishers.
Fread, D.L., 1993: Flow routing. In: Handbook of Hydrology (D.R. Maidment, ed.). New York, McGraw-Hill.
Georgakakos, K.P., 1986: On the design of national, real-time warning systems with capability for site-specific flash flood forecasts. Bull. Am. Meteorol. Soc., 67(10):1233–1239.
Georgakakos, K.P. and W.F. Krajewski, (eds), 2000: Hydrologic Applications of Weather Radar. J. Geophys. Res.-Atmospheres, 105(D2):2213–2313. Special Issue.
Goswami, M. and K.M. O’Connor, 2007: Real-time flow forecasting in the absence of quantitative precipita-tion forecasts: a multi-model approach. J. Hydrol., 334(1–2):125–140.
Goswami, M., K.M. O’Connor, K.P. Bhattarai and A.Y. Shamseldin, 2005: Assessing the performance of eight real-time updating models and procedures for the Brosna River. Hydrol. Earth Syst. Sci., 9(4):394–411.
Gray, D.M. and T.D. Prowse, 1993: Snow and floating ice. In: Handbook of Hydrology (D.R. Maidment, ed.). New York, McGraw-Hill.
Güitrón, A., 1981: Hydroelectrical model for optimal operation of a single multipurpose reservoir. J. Hydrol., 51:67–73.
Jonkman, S.N., 2005: Global perspectives on loss of human life caused by floods. Nat. Hazards, 34:151–175.
Kachroo, R.K., 1992: River flow forecasting. Part 5: Applications of a conceptual model. J. Hydrol., 133:141–178.
Klemeš, V., 2002: Risk analysis: the unbearable cleverness of bluffing. In: Risk, Reliability, Uncertainty and Robustness of Water Resources Systems (J.J. Bogardi and Z.W. Kundzewicz, eds). International Hydrology Series (UNESCO). Cambridge, Cambridge University Press.
Knight, D.W. and A.Y. Shamseldin (eds), 2006: River Basin Modelling for Flood Risk Mitigation. London, Taylor and Francis Group.
Kovar, K. and H.P. Nachtnebel (eds), 1996: HydroGIS ’96: Application of Geographic Information Systems in Hydrology and Water Resources Management. IAHS Publication No. 235. Wallingford, IAHS Press.
Kuo, C.Y. (ed.), 1993: Engineering Hydrology. New York, American Society of Civil Engineers.
Laurenson, E.M., 1962: Hydrograph Synthesis by Runoff Routing (PhD thesis). Water Research Laboratory, University of New South Wales.
———, 1964: A catchment storage model for runoff routing. J. Hydrol., 2:141–163.
Laurenson, E.M. and R.G. Mein, 1995: RORB: hydrograph synthesis by runoff routing. In: Computer Models of Watershed Hydrology (V.P. Singh, ed.). Littleton, Colorado, Water Resources Publications.
Liang, G.C., K.M. O’Connor and R.K. Kachroo, 1994: A multiple-input single-output, variable gain-factor model. J. Hydrol., 155:185–198.
Malone, T., M. Hartman, S. Tes, P. Katry, S. Pich and B. Pengel, 2007: Development of improved hydro-logical forecasting models for the lower Mekong river basin. In: Proceedings of the 5th Annual Flood Forum. Ho Chi Minh City, Viet Nam, 17–18 May 2007. Mekong River Commission.
Mariño, M.A. and B. Mohammadi, 1984: Multipurpose reservoir operation: 1. Monthly model for a single reservoir. J. Hydrol., 69:1–14.
Maurier, E.P., J.D. Rhoads, R.O. Dubayah and D.P. Lettenmaier, 2003: Evaluation of the snow-covered area data product from MODIS. Hydrol. Processes, 17:59–71.
Mohammadi, B. and M.A. Mariño, 1984: Multipurpose reservoir operation: 2. Daily operation of a multiple reservoir system. J. Hydrol., 69:15–28.
Moore, R.J., 2002: Aspects of uncertainty, reliability and risk in flood forecasting systems incorporating weather radar. In: Risk, Reliability, Uncertainty and Robustness of Water Resources Systems (J.J. Bogardi and Z.W. Kundzewicz, eds). International Hydrology Series (UNESCO). Cambridge, Cambridge University Press.
Moore, R.J., A.V. Bell, S.J. Cole and D.A. Jones, 2006: Issues in flood forecasting: ungauged basins, extreme floods and uncertainty. In: Frontiers in Flood Research, 8th Kovacs Colloquium. UNESCO, Paris, June–July 2006 (I. Tchiguirinskaia, K.N.N. Thein and P. Hubert, eds). IAHS Publ., 305:103–122.
Moore, R.J., A.V. Bell and D.A. Jones, 2005: Forecasting for flood warning. C.R. Geosci., 337(1–2):203–217.
Mutreja, K.N., 1986: Applied Hydrology. New Delhi. Tata McGraw-Hill.
Nalbantis, I., C. Obled and J.Y. Rodriguez,1988: Modélisation pluie-débit: validation par simulation de la méthode DPFT (Rainfall-runoff modelling: validation by simulation of the FDTF method). La Houille Blanche, 5–6:415–424.
Natale, L. and E. Todini, 1977: A constrained parameter estimation technique for linear models in hydrol-ogy. In: Mathematical Models for Surface Water Hydrology (T.A. Ciriani, U. Maione and J.R. Wallis, eds). Chichester, John Wiley and Sons.
National Oceanic and Atmospheric Administration-National Weather Service, 2005: Summary of Natural Hazard Statistics in the United States. National Weather Service Office of Climate, Water and Weather Services Report. http://www.nws.noaa.gov/om/hazstats.shtml.
National Research Council, 1991: Opportunities in the Hydrologic Sciences. Washington, The National Academies Press.

ANNEX I. REFERENCES An-I-3
———, 2006: Completing the Forecast: Characterizing and Communicating Uncertainty for Better Decisions Using Weather and Climate Forecasts. Washington, The National Academies Press.
O’Connell, P.E., 1991: A historical perspective. In: Recent Advances in the Modeling of Hydrologic Systems, Proceedings of the NATO Advanced Study Institute on Recent Advances in the Modeling of Hydrologic Systems, Sintra, Portugal, 10-23 July 1988 (D.S. Bowles, ed.). Dordrecht, Kluwer Academic Publishers.
O’Connor, K.M., 2006: River flow forecasting. In: River Basin Modelling for Flood Risk Mitigation (D.W. Knight and A.Y. Shamseldin, eds). London, Taylor and Francis Group.
Oudin, L., F. Hervieu, C. Michel, C. Perrin, V. Andréassian, F. Anctil and C. Loumagne, 2005a: Which potential evapotranspiration input for a lumped rainfall-runoff model? Part 2 – Towards a simple and efficient potential evapotranspiration model for rainfall-runoff modelling. J. Hydrol., 303:290–306.
Oudin, L., C. Michel and F. Anctil, 2005b: Which potential evapotranspiration input for a lumped rainfall-runoff model? Part 1 – Can rainfall-runoff models effectively handle detailed potential evapotranspiration inputs? J. Hydrol., 303:275–289.
Perrin, C., C. Michel and V. Andréassian, 2001: Does a large number of parameters enhance model perfor-mance? Comparative assessment of common catchment model structures on 429 catchments. J. Hydrol., 242:275–301.
———, 2003: Improvement of a parsimonious model for streamflow simulation. J. Hydrol., 279:275–289.
Pielke, R.A. Jr. and M.W. Downton, 2000: Precipitation and damaging floods: trends in the United States, 1932–1997. J. Climate, 13:3625–3637.
Refsgaard, J.C., 1997: Validation and intercomparison of different updating procedures for real-time forecast-ing. Nord. Hydrol., 28:65–84.
Rehman, H.U., M.W. Zollinger and G.B. Collings, 2003: Hydrological versus hydraulic routing. In: Proceedings of the Institution of Engineers 28th International Hydrology and Water Resources Symposium, Wollongong, Australia, 10–14 November 2003.
Riccardi, G.A., E.D. Zimmermann and R.-A. Navarro, 1997: Zonification of areas with inundation risk by means of mathematical modelling in the Rosario region Argentina. In: Destructive Water, Water-Caused Natural Disasters, Their Abatement and Control (G.H. Leavesley, H.F. Lins, F. Nobilis, R.S. Parker, V.R. Schneider and F.H.M. van de Ven, eds). Wallingford, IAHS Press.
Rohde, F.G. and K. Naparaxawong, 1981: Modified standard operation rules for reservoirs. J. Hydrol., 51:169–177.
Serban, P. and A.J. Askew, 1991: Hydrological forecasting and updating procedures. IAHS Publ., 201:357–369.
Shamseldin, A.Y., 2006: Real-time river flow forecasting. In: River Basin Modelling for Flood Risk Mitigation
(D.W. Knight and A.Y. Shamseldin, eds). London, Taylor and Francis Group.
Singh, V.P., 1996: Kinematic Wave Modeling in Water Resources: Surface Water Hydrology. New York, John Wiley and Sons.
Sittner, W.T., C.E. Schauss and J.C. Monro, 1969: Continuous hydrograph synthesis with an API-type hydrologic model. Water Resour. Res., 5(5):1007–1022.
Sugawara, M., 1995: Tank model. In: Computer Models of Watershed Hydrology (V.P. Singh, ed.). Colorado, Water Resources Publications.
Szilágyi, J., 2003: State-space discretization of the Kalinin–Milyukov–Nash cascade in a sample-data system framework for streamflow forecasting. J. Hydrol. Eng., 8(6):339–347.
Szollösi-Nagy, A., 1976: Introductory remarks on the state space modelling of water resources systems. Workshop on the Vistula and Tisza River Basins, LLASA, Laxenburg, Austria, 11–13 February 1975 (A. Szollösi-Nagy, ed.). Res. Mem., 76(73).
———, 1982: The discretization of the continuous linear cascade by means of state space analysis. J. Hydrol., 58(3–4):223–236.
Tan, B.Q. and K.M. O’Connor, 1996: Application of an empirical infiltration equation in the SMAR concep-tual model. J. Hydrol., 185:275–295.
Tangara, M., 2005: Nouvelle Méthode de Prévision de Crue Utilisant un Modèle Pluie-Débit Global (A New Flood Forecasting Method Based on a Lumped Rainfall-Runoff Model) (PhD thesis). EPHE, Paris. http://www.cemagref.fr/webgr/Download/Rapports_et_thèses/2005-TANGARA.pdf.
Todini, E., 2007: Hydrological catchment modelling: past, present and future. Hydrol. Earth Syst. Sci., 11(1):468–482.
Todini, E. and L. Ciarapica, 2002: The TOPKAPI model. In: Mathematical Models of Large Watershed Hydrology (V.P. Singh and D.K. Frevert, eds). Colorado, Water Resources Publications.
Toth, E., A. Brath and A. Montanari, 2000: Comparison of short-term rainfall prediction models for real-time flood forecasting. J. Hydrol., 239:132–147.
United Nations International Strategy for Disaster Reduction (UNISDR): Integrated flood forecasting, warning and response system. http://www.unisdr.org/eng/library/isdr-publication/flood-guidelines/isdr-publication-floods-chapter3.pdf.
Urbonas, B.R. and L.A. Roesner, 1993: Hydrologic design for urban drainage and flood control. In: Handbook of Hydrology (D.R. Maidment, ed.). New York, McGraw-Hill.
Vrugt, J.A., 2004: Towards Improved Treatment of Parameter Uncertainty in Hydrologic Modelling (PhD thesis). University of Amsterdam. ISBN:90-76894-46-9.
Wheater, H.S., A.J. Jakeman and K.J. Beven, 1993: Progress and directions in rainfall-runoff modelling. In: Modelling Change in Environmental Systems (A.J. Jakeman, M.B. Beck and M.J. McAleer, eds). Chichester, John Wiley and Sons.

MANUAL ON FLOOD FORECASTING AND WARNINGAn-I-4
World Meteorological Organization, 1988: Simulated Real-Time Intercomparison of Hydrolgie Models. Operational Hydrology Report No. 38 (WMO- No. 779), Geneva.
———, 1994: Guide to Hydrological Practices. Fifth edition (WMO-No. 168), Geneva.
———, 2004: Intercomparison of Forecast Models for Streamflow Routing in Large Catchments (P. Serban, N.L. Crookshank and D.H. Willis). WMO Technical Reports in Hydrology and Water Resources No. 77. (WMO/TD-No. 1247), Geneva.
———, 2007: Technical Regulations. Vol. III: Hydrology. (WMO-No. 49), Geneva.
Xiong, L. and K.M. O’Connor, 2002: Comparison of four updating models for real-time river flow forecasting. Hydrol. Sci. J., 47(4):621–639.
Xiong, L., K.M. O’Connor and S. Guo, 2004: Comparison of three updating schemes using artificial neural networks in flow forecasting. Hydrol. Earth Syst. Sci., 8(2):247–255.
Zhao, R.J., 1992: The Xinanjiang model applied in China. J. Hydrol., 135:371–381.
Zhao, R.J. and X.R. Liu, 1995: The Xinanjiang model. In: Computer Models of Watershed Hydrology (V.P. Singh, ed.). Colorado, Water Resources Publications.
Zhao, R.J., Y.L. Zhuang L.R. Fang, X.R. Liu and Q.S. Zhang, 1980: The Xinanjiang model. In: Hydrological Forecasting, Proceedings of the Oxford Symposium. Oxford, United Kingdom, April 1980. IAHS Publication 129. Wallingford, IAHS Press.
CHAPTER 4
Georgakakos, K.P., 1986: On the design of national, real-time warning systems with capability for site-specific flash flood forecasts. Bull. Am. Meteorol. Soc., 67(10):1233–1239.
Golding, B., 2006: Performance of Met Office Forecasting Systems as a Function of Lead Time: Report to Environment Agency. Exeter, The Met Office.
Hankin B., S. Waller, G. Astle and R. Kellagher, 2008: Mapping space for water: screening for urban flash flooding. J. Flood Risk Manage., 1(1):13–22.
HR Wallingford, 2002: Global Hydrological Forecasting Technical and Market Appraisal. Final Report from HR Wallingford to the Met Office. Report EX 4651. Wallingford, HR Wallingford.
Kalman, R.E., 1960: A new approach to linear filtering and prediction theory. Trans. ASME, J. Basic Eng., Ser. D., 82:35–45.
Todini, E. and P. Bongioannini Cerlini, 1999: TELFLOOD: Technical Report. DISTGA, University of Bologna.
CHAPTER 5
Centre for Ecology and Hydrology, 2007: Revitalisation of the FSR/FEH Rainfall-Runoff Method. Research project FD1913. Wallingford, Centre for Ecology and Hydrology.
Scottish Environment Protection Agency, 2007: Extreme Event Analysis. Final Report. Glasgow, EnviroCentre and The Met Office.
———, 2008: Extreme Event and Flood Warning Decision Support Framework (DSF). Glasgow, EnviroCentre and Met Office.
World Meteorological Organization, 1983: Guide to Climatological Practices (WMO-No. 100), Geneva.
———, 2007: Hydrological Data Rescue (HydRes). Project Proposal/Concept Note (D. Rutashobya). Geneva.
———, 2008: Guide to Hydrological Practices. Sixth edition (WMO-No. 168), Geneva.
CHAPTER 7
Department for Environment, Food and Rural Affairs, 2007: Making Space for Water. Feasibility Study into Expanding Flood Warning to Cover Other Flood Risks, Technical feasibility report (reference RF5). London, Defra.
Fox, N.I. and C.G. Collier, 2000: Estimating medium-range catchment flood potential. Journal of Hydrology, 237:1–16.
Golding, B., 2006: Performance of Met Office Forecasting Systems as a Function of Lead Time: Report to Environment Agency. Exeter, The Met Office.
Journal of Hydrology, 2001: Probabilistic and Ensemble Forecasting in Hydrology (K.P. Georgakakos and R. Krzysztofowicz, eds). Volume 249. Special Issue.
Met Office, 2006: Baseline Assessment of Current Forecast Services to the Environment Agency. Phase 1: Evaluation and Methodology. Exeter, The Met Office.
CHAPTER 9
Environment Agency, 2005: Report on Operation Trident Flood Warning Exercise, 2004. London, United Kingdom Environment Agency.
AHPS Advanced Hydrologic Prediction Service (United States)
ANN artificial neural networkAPI antecedent precipitation indexARCHISS Archival Climate History Survey
Programme (WMO)ARX autoregressive exogenous variableAVR automatic voltage regulatorAWIPS Automated Weather Interactive
Processing System (United States)BADC British Atmospheric Data CentreBBC British Broadcasting CorporationBMD Bangladesh Meteorological DepartmentCEOS Committee on Earth Observation
SatellitesCHPS Community Hydrologic Prediction
System (United States)CNFFS China National Flood Forecasting SystemCPD Continuous Professional Development
(United Kingdom)CRC cyclic redundancy checkingCS conditional simulationCSI conditional success indexDefra Department for Environment, Food and
Rural Affairs (United Kingdom)DEM digital elevation modelDLCM discrete linear cascade modelDSF decision support frameworkDSS decision support systemDTM digital terrain modelECMWF European Centre for Medium-Range
Weather ForecastsEFFORTS European Flood Forecasting Operational
Real-Time SystemEFFS European Flood Forecasting SystemEKF extended Kalman filterEnKF ensemble Kalman filterEO Earth observationEOS Earth Observation SystemEQPF ensemble quantitative precipitation
forecastESA European Space AgencyEU European UnionEUMETSAT European Organization for the
Exploitation of Meteorological SatellitesFAR false alarm rateFFC Flood Forecasting Centre (United
Kingdom)FFWC Flood Forecasting and Warning Centre
(Bangladesh)FFWS flood forecasting and warning systemFRM flood-risk managementFSK frequency shift keying
FTP file transfer protocolGCM general circulation modelGEM Global Environmental Multiscale Model
(Canada)GFS Global Forecast System (United States)GHF global hydrological forecastGIS Geographical Information SystemGMSK Gaussian minimum shift keyingGOES geostationary satellitesGPM Global Precipitation Measurement
MissionsGRDC Global Runoff Data CentreGUI graphical user interfaceHDTS hydrometric data transmission systemHEC Hydrologic Engineering Center (United
States)HEPEX Hydrological Ensemble Prediction
ExperimentHIRLAM high resolution limited area modelHMS Hydrologic Modeling System (HEC,
United States)HOMS Hydrological Operational Multipurpose
System (WMO)HR hit rateHRU hydrological response unitHS historical simulationHYRAD Hydrological Radar System (United
Kingdom)ICRC International Committee of the Red
CrossINMARSAT International Maritime Satellite
OrganizationIR infraredIT information technologyITCZ inter-tropical convergence zoneITU International Telecommunications
UnionIV instrumental variablesIWRM Integrated Water Resources ManagementKF Kalman filterKFMWS Korean Flood Monitoring and Warning
SystemLAM local area climate model/limited area
modelLAMBO Limited Area Model Bologna (Italy)LIDAR light detection and rangingMAE mean absolute errorMCS mesoscale convective systemMDDL minimum draw down levelMISP mutually interactive state parameterML maximum likelihoodMOSES Met Office Surface Exchanges Scheme
(United Kingdom)
ANNEX II
ABBREVIATIONS
MANUAL ON FLOOD FORECASTING AND WARNINGAn-II-2
MOSES-PDM MOSES incorporating a probability-distributed moisture model
MRC Mekong River CommissionMRF Medium-Range Forecast Model (United
States)MSK minimum shift keyingMUSIC Multi-sensor Precipitation Measurements
Integration ProjectMWL maximum water levelNAM North American Mesoscale ModelNASA National Aeronautics and Space
Administration (United States)NCEP National Centers for Environmental
Prediction (United States)NEXRAD Next Generation Radar (United States)NGM Nested Grid Model (United States)NGO non-governmental organizationNHS National Hydrological ServiceNIWA National Institute of Water and
Atmospheric Research (New Zealand)NMHS National Meteorogical and Hydrological
ServiceNMS National Meteorological ServiceNOAA National Oceanic and Atmospheric
Administration (United States)NOGAPS Navy Operational Global Atmospheric
Prediction System (United States)NRL Naval Research Laboratory (United
States)NVQ National Vocational Qualification
(United Kingdom)NWP numerical weather predictionNWS National Weather Service (United States)NWSRFS National Weather Service River
Forecasting System (United States)ORSAM Operational Regional Spectral Model
(Hong Kong, China)PMD Probability Moisture Distribution Model
(United Kingdom)PF particle filterPoD probability of detectionPoO probability of occurrence
PPI plan position indicatorQPE Quantitative Precipitation EstimationQPF quantitative precipitation forecastRAMS Regional Atmospheric Modeling System
(United States)RCM regional climate modelRFMFC Regional Flood Management Forecast
Centre (United Kingdom)RMSE root mean square errorROC relative operating characteristicRORB Runoff Routing Burroughs Event ModelRV relative valueSAR synthetic aperture radarSCLS synthetic constrained linear systemSEPA Scottish Environment Protection AgencySLAR side-looking airborne radarSLM simple linear total response modelSMAR soil-moisture accounting and routing
conceptual modelSMD soil-moisture deficitSPC Service de Prévisions des Crues (France)STEPS Short-Term Ensemble Prediction SystemTBR tipping bucket raingaugeTOPKAPI topographic kinematic approximation
and integration modelTRMM Tropical Rainfall Measuring MissionTS threat scoreUM Unified Model (United Kingdom Met
Office)UNDP United Nations Development
ProgrammeUNESCO United Nations Educational, Scientific
and Cultural OrganizationUPS uninterruptible power supplyUTC universal coordinated timeVSAT very small aperture terminalWFO Weather Service Forecast Offices (United
States)WHYCOS World Hydrological Cycle Observing
SystemWMO World Meteorological Organization


WMO-No. 1072
For more information, please contact:
World Meteorological Organization
Communications and Public Affairs Office
Tel.: +41 (0) 22 730 83 14/15 – Fax: +41 (0) 22 730 80 27
E-mail: [email protected]
Hydrology and Water Resources Branch
Climate and Water Department
Tel.: +41 (0) 22 730 84 79 – Fax: +41 (0) 22 730 80 43
E-mail: [email protected]
7 bis, avenue de la Paix – P.O. Box 2300 – CH-1211 Geneva 2 – Switzerland
www.wmo.int MA
NU
AL
ON
fLO
OD
fO
ReCA
stiN
g A
ND
WA
RNiN
g MaNual ONFlOOD FORECaSTiNG aND WaRNiNG
P-Cl
W_1
0210
7
QUALityMANAgeMeNtfRAMeWORk