manchester ice nucleus counter (minc) measurements from the
TRANSCRIPT

Atmos. Chem. Phys., 11, 53–65, 2011www.atmos-chem-phys.net/11/53/2011/doi:10.5194/acp-11-53-2011© Author(s) 2011. CC Attribution 3.0 License.
AtmosphericChemistry
and Physics
Manchester Ice Nucleus Counter (MINC) measurements from the2007 International workshop on Comparing Ice nucleationMeasuring Systems (ICIS-2007)
H. M. Jones1, M. J. Flynn1, P. J. DeMott2, and O. Mohler3
1Centre for Atmospheric Science, SEAES, University of Manchester, Manchester, UK2Department of Atmospheric Science, Colorado State University, Fort Collins, Colorado, USA3Institute for Meteorology and Climate Research, Karlsruhe Institute of Technology, Germany
Received: 27 July 2010 – Published in Atmos. Chem. Phys. Discuss.: 16 August 2010Revised: 13 December 2010 – Accepted: 14 December 2010 – Published: 3 January 2011
Abstract. An ice nucleus counter was developed and con-structed to enable investigation of potential ice nucleatingmaterials. The Manchester Ice Nucleus Chamber (MINC)is a concentric-cylinder continuous flow diffusion chamber(CFDC). A full explanation of the MINC instrument is givenhere, along with first results and a comparison to an es-tablished instrument of similar design (Colorado State Uni-versity CFDC) during sampling of common ice nucleatingaerosols at the 2007 International workshop on ComparingIce nucleation Measuring Systems (ICIS-2007). MINC andCSU-CFDC detected the onset of ice nucleation under sim-ilar conditions of temperature and supersaturation for sev-eral different types of ice nuclei. Comparisons of the ratio ofice nuclei to total aerosol concentrations as a function of su-persaturation with respect to water (SSw) showed agreementwithin one order of magnitude. Possible reasons for differ-ences between the two instruments relating to differences intheir design are discussed, along with suggestions to futureimprovements to the current design.
1 Introduction
Aerosol particles may influence climate directly by the scat-tering and/or absorption of radiation and indirectly throughtheir role as cloud condensation nuclei (CCN) or ice nuclei(IN). IN are defined as the subset of aerosol particles thatcatalyse the formation of ice crystals (Vali, 1985). The ex-istence of atmospheric IN and the role they play in cloud
Correspondence to:H. M. Jones([email protected])
formation implies that they have the ability to affect the localradiation budget; changes in cloud microphysics will changethe scattering and reflective properties of cloud (e.g. DeMottet al., 2010a). Without IN, clouds would not glaciate untiltemperatures approach the∼-40◦C limit for homogeneousice nucleation, with pure water droplets beginning to freezeat −36◦C (DeMott et al., 2003a; Vali, 1996). Glaciation isfrequently observed at much higher temperatures due to thepresence of atmospheric IN. Measurements of these atmo-spheric IN is the focus of the current study. There are cur-rently four recognised fundamental heterogeneous ice nucle-ation mechanisms: deposition nucleation (vapour transferreddirectly to the IN surface), condensation-freezing (water con-denses onto the surface of the IN to form a supercooleddroplet, then subsequently freezes), contact-freezing (super-cooled water droplet freezes upon contact with the IN) andimmersion-freezing nucleation (IN becomes immersed in-side a supercooled water droplet, then subsequently freezes),(Vali, 1985).
While it is recognised that ice nucleation is of criticalconcern for weather and climate models, there are majorshort-comings in our ability to treat this process reliably (e.g.Forster et al., 2007). One reason for this is the paucity ofreliable measurements and the need for more extensive con-tinuous measurements of IN that will ultimately allow moreaccurate parameterisations to be produced for use in models(e.g. DeMott et al., 2010a). There are many difficulties re-lating to the identification and measurement of IN. IN mayact in supercooled water or supersaturated vapour, or at theinterface between the two phases. Typical atmospheric con-centrations of IN are∼1 stdL−1 at −20◦C and∼10 stdL−1
at −30◦C (DeMott et al. 2010a). This is around 6 orders ofmagnitude less than typical urban total atmospheric aerosol
Published by Copernicus Publications on behalf of the European Geosciences Union.
54 H. M. Jones et al.: MINC measurements from the 2007 international workshop
concentrations. However, it is important to consider thatIN concentrations can be subject to very large variations intime and space. In addition, physical or chemical processesmay alter the effectiveness of any given IN, (Szyrmer andZawadzki, 1997). There are two ways in which to predictIN concentrations in models: use aerosol properties in con-junction with either lab studies or a constrained theoreticalapproach on the effects of aerosol properties on ice nucle-ation (e.g. Meyers et al., 1992), or to use climatologies ofIN concentrations (e.g. Bigg, 1990). When measuring INin the laboratory or in the atmosphere, they may only be de-tected and counted by observing the ice crystals formed fromthem at given temperatures and supersaturations. The mul-titude of possible ice nucleation processes within the atmo-sphere makes realistic simulations of all natural atmosphericconditions within measuring systems difficult and most mea-surement techniques are insensitive to one or more modes ofactivation.
Greater interest in the research field of ice nucleation isbeing spurred by the increasing demand for knowledge con-cerning ice clouds in the atmosphere and the important con-tribution they make to regional and global hydrological path-ways. Although secondary ice formation mechanisms likethe Hallett-Mossop process (Hallett and Mossop, 1974) canbe extremely important for the ultimate glaciation of cloudswarmer than−8◦C, ice nuclei are likely the cause of ini-tial glaciation (with the exception of glaciation by homoge-neous freezing or the ‘seeder-feeder’ mechanism, see Berg-eron, 1965). Measurements of IN are therefore of paramountimportance in order to obtain information concerning theirabundance, activity, constituents and major regional globalsources as well as their temporal diurnal and seasonal varia-tions; without these measurements, accurately predicting icecloud initiation and development in particular meteorologi-cal situations will remain a limiting factor to providing bet-ter weather and regional climate prediction models. Severalinstrument exist that are capable of measuring ice nucleationproperties, these include static diffusion chambers (e.g. Kanjiand Abbatt, 2006; Knopf and Koop, 2006; Dymarska et al.,2006, Kulkarni et al., 2009) and continuous flow diffusionchambers (e.g. Stetzer et al., 2008; Rogers 1988). Develop-ing instrument such as these, allows an increased collectionof IN data, a clear need. The existence of so few of these in-struments provides motivation into the development of newinstruments to provide additional data to allow the progres-sion of ice nucleation parameterisations and reduce the un-certainty in cloud microphysics models.
This paper describes a Continuous Flow Diffusion Cham-ber (CFDC) instrument developed for field and laboratoryuse at the University of Manchester. This instrument is capa-ble of detecting all modes of ice nucleation except contact-freezing nucleation, although there is no means to easily dis-cern the combination of mechanisms near and above watersaturation. Details of the operation principles, hardware andsoftware are given. Calibration and operational procedures
are also outlined. Initial results obtained at the InternationalWorkshop on Comparing Ice Nucleation Measuring Systems– 2007 (ICIS-2007) (see Sect. 3), along with a comparisonto other instruments present at the workshop are shown anddiscussed. Suggestions for future development are outlinedin Sect. 6.
2 The Manchester Ice Nucleus Chamber (MINC)
Previous work on IN measurements at the University ofManchester included the design and construction of flat-platecontinuous flow diffusion chambers, initially of horizontalconfiguration and later of vertical configuration (Hussain andSaunders, 1984) in an attempt to reduce particle losses in thechamber. Results from these chambers were used as part ofthe IN parameterisation developed by Meyers et al. (1992), aparameterisation, or derivations thereof, still widely in use.However, these early flat plate instruments were found tosuffer edge effects and were bulky, making them difficult totransport and unsuitable for aircraft use, although recent flat-plate designs appear to have resolved these problems (e.g.Stetzer et al. 2008). As a consequence of this previous work,the Manchester Ice Nucleation Chamber (MINC) was de-signed as a Continuous Flow Diffusion Chamber (CFDC) ofthe cylindrical design based on the laboratory instrument firstdescribed in Rogers (1988). The main aspects of this designare described below.
2.1 Principle of operation
In MINC, supersaturated conditions are established betweenthe ice-coated walls of two vertically-orientated, concentriccylinders maintained at different temperatures. In the regionbetween the two ice-covered walls, almost linear steady-statevapour pressure and temperature fields are established. Equi-librium vapour pressure is an exponential function of temper-ature and therefore the region between the walls is supersat-urated with respect to ice, with the degree of supersaturationdetermined by the temperature difference between the wallsand the distance from the walls (Rogers, 1988). Humidi-ties from ice saturation to well in excess of water saturationcan be achieved with this system. Sample air is injected intothe central region of laminar flow at the top of the chamber,sandwiched between two layers of dry, filtered air. This en-sures that the sample environment is narrow and well defined.It is important that the flow be laminar so that the sampleenvironment can be accurately determined. Poiseuille flowwithin the chamber results in a parabolic velocity profile dueto the wall separation being small compared to the cylinderradii (Knudsen and Katz, 1958). In the older horizontal flatplate designs, the aerosol laminar remained centred betweenthe plates, but with vertical chambers there is the addedcomplication of buoyant circulation due to the temperaturegradient, (Sinnarwalla and Alofs, 1973): air near the cold
Atmos. Chem. Phys., 11, 53–65, 2011 www.atmos-chem-phys.net/11/53/2011/

H. M. Jones et al.: MINC measurements from the 2007 international workshop 55
wall will tend to sink; air near the warm wall will tend to rise.This results in a skewed velocity profile and displacement ofthe lamina and maximum supersaturation region towards thecold wall. If the temperature difference between the wallsbecomes too great then negative flow may result. This couldlead to undesirable influences on the sample air stream so theflow conditions are monitored in real-time using calculationsgiven by Rogers (1988). An “evaporation section” at the bot-tom of the chamber uses an non-cooled plastic outer (warm)wall while retaining the cold and ice-covered cold wall to al-low the vapour and temperature fields to relax to the cold wallconditions, with the intent to keep the air slightly supersatu-rated with respect to ice but not with respect to water. Thisallows any water droplets formed in the first part of the cham-ber to be removed by either the Bergeron-Findeisen process(e.g. Rogers and Yau, 1989) whereby ice crystals grow at theexpense of water droplets (fairly minor), or by diffusionalloss of vapour to the cold wall. Detection of ice crystals byparticle size only using an optical particle counter (OPC) isthen possible.
2.2 Instrument design
The MINC instrument is housed inside a custom built alu-minium frame, 159 cm×72 cm×20 cm. The instrument, pre-mounted in the frame, can be transported and located in thelaboratory or in the field. The following sections outline theconstruction and design elements of various MINC compo-nents.
2.2.1 The chamber
The chamber itself consists of two vertical, concentric cop-per cylinders (1mm wall thickness) with outer diameters of98mm and 76mm, between which exists a 10mm annulargap. It is in this gap that supersaturated conditions are de-veloped as described in Sect. 2.1. This annular arrangementavoids the edge effects present in chambers of the flat-platedesign (e.g. Al-Naimi and Saunders, 1985), and the verticalarrangement avoids gravitational loss of particles. The cham-ber walls are iced by pumping water into the outlet of theCFDC chamber, with the chamber having been pre-cooled to−30◦C. The chamber is quickly filled to a level 10 cm lowerthan the chamber inlet manifold, then is promptly pumpedback out again such that during this time the wall tempera-tures do not rise above 0◦C. To increase the hygroscopicityof the copper wall surface, to allow a smooth ice layer to beapplied, the walls were treated with an ‘ebonizing’ solutionthat reacts with the copper to form a thin layer of black cupricsulphide crystals (see Rogers et al. 2001): this provides ahydrophilic surface to allow a uniform ice coating (∼0.1 mmthick – tested via the collection of melt water). The totallength of the chamber is 750 mm, with the bottom 250 mmof the outer wall made of insulating hydrophobic plastic; thisis the water droplet evaporation zone. This section of the
outer wall warms to 0◦C during icing and it is not expectedto retain any ice coating. Residence time in the system (frominstrument inlet to detection system) is∼10 s (latter 4 s in theevaporation section), during which time crystals may growin the chamber and then be detected by passing through aparticle counter at the exit of the chamber. The wall tem-peratures are monitored using thin film Platinum ResistanceThermometers (PRTs, class A, 4-wire PT-100,±0.15◦C) atthree positions along each wall; they are henceforth labelledtop, middle and bottom, for the inner and outer wall. Usingthese measured temperatures, sample laminar supersatura-tion was calculated using the equations for saturation vapourpressure given in Murphy and Koop (2005). The chamberis insulated with aluminium coated bubble wrap (4mm thickAluminium thermal foil, B&Q) and then Armaflex insulationsheeting (20 mm thick) that also prevents condensation. Thisis all encapsulated inside a metal frame box and fixed to therack to increase stability.
With instruments of this design, there are two main de-sign issues that must be accounted for: wall effects and tran-sient supersaturations. Wall effects (loss of aerosol to cham-ber walls) can be minimised by keeping the aerosol laminaraway from the walls and using a large aspect ratio (length ofcylinder: annular space = 75 for MINC), (e.g. Elliott, 1971).Transient supersaturations can occur at the top of the cham-ber if the incoming sample air is saturated and colder thanthe sheath air. Transient supersaturations need to be avoidedas they momentarily increase the local supersaturation po-tentially activating some aerosol particles which would haveotherwise remained inactivated, thus giving false readings.This problem can be minimised in two ways, either by pre-conditioning the sample (e.g. Saxena et al., 1970) or delay-ing the vapour diffusion region until conditions are settled(Fukuta and Saxena, 1979). The current design uses bothpreventative methods by recycling the cold dry sheath air,drying the incoming sample air and leaving the top 10 cm ofchamber ice free.
2.2.2 The refrigeration system
The temperature of each wall is controlled independently byits own refrigeration system, see Fig. 1. Each system is re-quired to provide a stable steady temperature along the lengthof the chamber wall. Copper tube (3/8 in outer diameter,1 mm wall thickness) is soldered to the outside of the cop-per section of the outer wall in a coil arrangement, with a5 cm space between each coil. The inner coil stretches thefull length of the inside wall, it is not soldered to the walldue to spatial constraints, but is immersed in heat transferfluid (Polydimethyl Siloxane) to increase the thermal con-tact with the wall. All externally exposed refrigeration pipesare insulated with Armaflex tubing to avoid reducing the ef-ficiency of the refrigeration system and to minimise frosting.Two compressor units (Electrolux, CML90FB3) – one foreach wall circulate R404A refrigerant around each system.
www.atmos-chem-phys.net/11/53/2011/ Atmos. Chem. Phys., 11, 53–65, 2011

56 H. M. Jones et al.: MINC measurements from the 2007 international workshop
Fig. 1. Schematic of the MINC instrument separated into differ-ent systems: sample inlet, recirculating sheath flow system, refrig-eration system and the chamber. The figure shows the outer wallrefrigeration system only. The inner wall system is of the same ar-rangement, where the refrigerant enters/exits the coil via the arrowsshown. PS = pressure sensor, EEV = electronic expansion valve,OPC = optical particle counter, see main text for description. Aclose up of the entrance and exit to the chamber are labelled as Aand B respectively.
An electronic expansion valve (Sporlan, SEI 0.5-10-S) con-nected to the outlet of each compressor is controlled by theuser and determines the temperature of the coil, and hencethe chamber wall. Refrigerant pressure is measured (Sen-sortechnics, CTE9020GY4) before and after the coil, and asecond expansion valve (Sporlan, SEI-0.5-11-S) after the coilis used to maintain the pressure across the coil. Equalisedpressure results in equal cooling along the wall, and so asteady wall temperature.
2.2.3 The airflow system
Sample air (1 LPM) initially passes through the inlet system,which consists of an impactor (design as per Rogers et al.2001) that has a nominal 1.3 µm 50% cut-off to remove largerparticles and a counter-flow gas drying column (PermapureNafion, PD-100T) to remove any moisture from the samplethat would result in frosting of the inlets and consequentlylead to false readings due to ice splinter formation and re-lease into the sample stream. The inlet system also has a setof valves that allow a clean-room grade particle filter (HEPA,removing at least 99.97% of airborne particles 0.3 µm in di-ameter) to be place in-line ahead of the impactor and so allowa background test to ensure there is no frosting in the cham-ber.
As outlined in Sect. 2.1, this sample air enters the cham-ber between two layers of dried, particle free air (4.5 LPMeach). The sheath air is dried by passing it through a desic-
cant drying column (Drierite, size 8 mesh) and then filtered(HEPA filter), see Fig. 1. Air exits the bottom of the chamberthrough the OPC (see Sect. 2.2.4) and then passes through theair flow pump, a drier and filter to provide the counter-flow tothe inlet drier. After the inlet drier, the airflow passes a sec-ond dryer and filter before the flow (10 LPM) is split, with 1LPM forming an exhaust flow and the remainder being recir-culated to form the two sheath flows. A pressure relief valveis provided at the top of the chamber for use during the wallicing process.
2.2.4 The detection system
Ice crystals are expected to grow up to sizes of∼10 µm(Rogers, 1988), depending on sample temperature and super-saturation, during an approximate chamber residence time of10 s (with 6 s exposure to steady supersaturation conditions).The growth of ice crystals to sizes larger than the incomingaerosol sizes, and the evaporation of any water droplets thatform in cases when operating above water saturation, allowsthe reliable detection of ice crystals based on particle size.Air exiting from the bottom of the chamber is immediatelydrawn through an optical particle counter (OPC, CLiMET3100-1158) modified by the removal of an internal criticalorifice to operate at 10 LPM, to detect and size crystals.
2.2.5 Software
Software written in-house using the LabVIEW developmentsystem (National Instruments, LabVIEW 7.0) and runningon a standard PC is used to monitor and record data from theMINC at one second intervals. Wall temperatures, refrigera-tion pressures, air flow temperatures, air pressure, air flowrates and OPC data are constantly monitored via NuDamdata acquisition modules (ND 6013, ND 6017, ND 6520).The program also allows the user to control the refrigerationvalves using a relay output board (Amplicon, PCI 236).
2.3 Calibration
2.3.1 Aerosol losses
The sample inlet system is described in Sect. 2.2.3 of themain text. Due to the nature of the system, size dependentlosses are expected and so these should be corrected for whenconsidering the ratio of measured ice nucleating particles tothe total aerosol population (known as “activated fraction”(AF)). To calibrate the inlet losses a polydisperse distributionof ammonium sulphate particles was provided by a TOPAZaerosol generator. The size distribution of these aerosol wasmeasured before and after the inlet system using a Differ-ential Mobility Particle Sizer (DMPS, please see Williamset al., 2007 for details on the operation of this instrument).Total aerosol concentrations during these tests were of theorder of 106 particles per cubic centimetre. During thesetests, the counterflow to the inlet drier was provided by the
Atmos. Chem. Phys., 11, 53–65, 2011 www.atmos-chem-phys.net/11/53/2011/
H. M. Jones et al.: MINC measurements from the 2007 international workshop 57
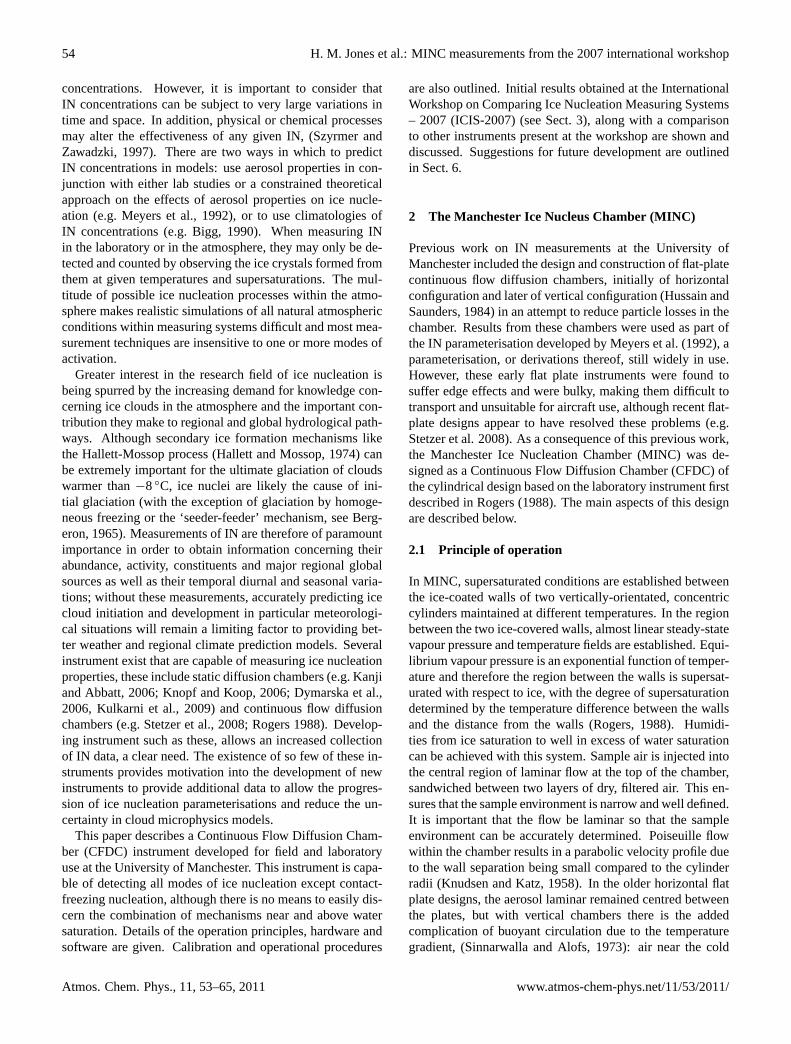
Fig. 2. DMPS size distribution scans for the inlet system, show-ing results from before and after the inlet system as denoted by thefigure legend.
MINC airflow system as in normal condition of operation,while the inlet flow was provided by a Condensation Parti-cle Counter (CPC, TSI 3025A), part of the DMPS system.Figure 2 shows the measured aerosol size distributions forDMPS scans at the start of the inlet system (direct to theTOPAZ aerosol source), scans after the drier, and then scansafter the drier and the impactor. As can be seen from Fig. 2,for this size range, most of the aerosol losses are due to thecounterflow drier.
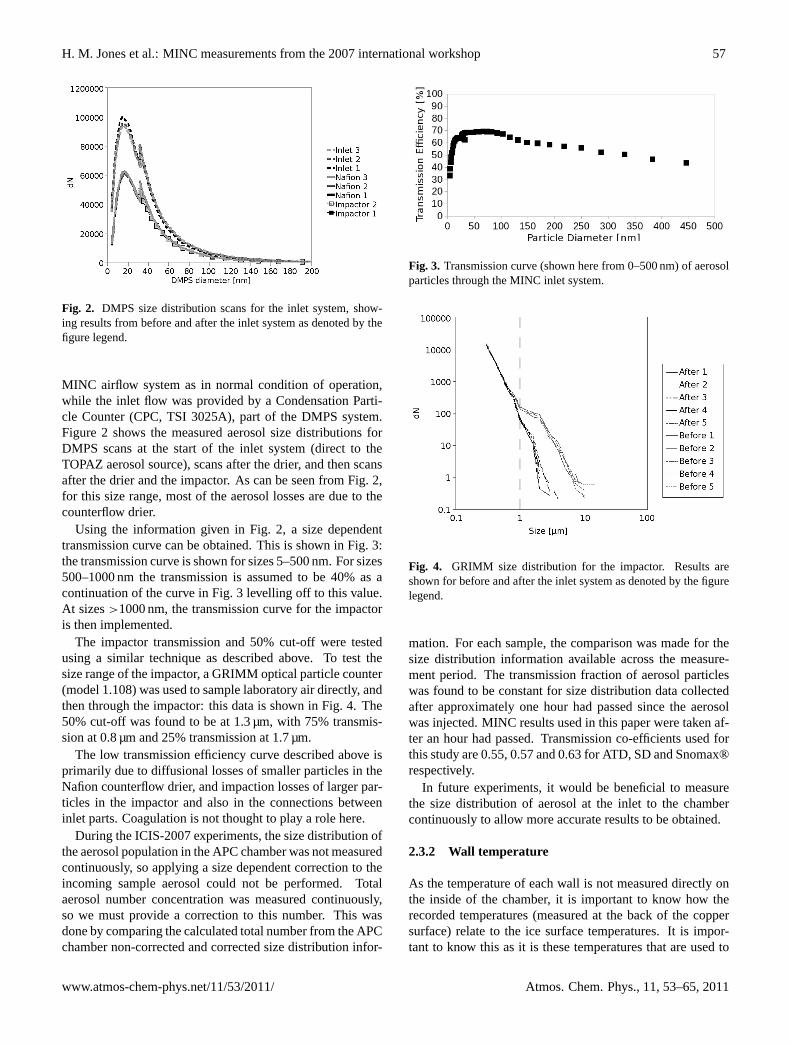
Using the information given in Fig. 2, a size dependenttransmission curve can be obtained. This is shown in Fig. 3:the transmission curve is shown for sizes 5–500 nm. For sizes500–1000 nm the transmission is assumed to be 40% as acontinuation of the curve in Fig. 3 levelling off to this value.At sizes>1000 nm, the transmission curve for the impactoris then implemented.
The impactor transmission and 50% cut-off were testedusing a similar technique as described above. To test thesize range of the impactor, a GRIMM optical particle counter(model 1.108) was used to sample laboratory air directly, andthen through the impactor: this data is shown in Fig. 4. The50% cut-off was found to be at 1.3 µm, with 75% transmis-sion at 0.8 µm and 25% transmission at 1.7 µm.
The low transmission efficiency curve described above isprimarily due to diffusional losses of smaller particles in theNafion counterflow drier, and impaction losses of larger par-ticles in the impactor and also in the connections betweeninlet parts. Coagulation is not thought to play a role here.
During the ICIS-2007 experiments, the size distribution ofthe aerosol population in the APC chamber was not measuredcontinuously, so applying a size dependent correction to theincoming sample aerosol could not be performed. Totalaerosol number concentration was measured continuously,so we must provide a correction to this number. This wasdone by comparing the calculated total number from the APCchamber non-corrected and corrected size distribution infor-
Fig. 3. Transmission curve (shown here from 0–500 nm) of aerosolparticles through the MINC inlet system.
Fig. 4. GRIMM size distribution for the impactor. Results areshown for before and after the inlet system as denoted by the figurelegend.
mation. For each sample, the comparison was made for thesize distribution information available across the measure-ment period. The transmission fraction of aerosol particleswas found to be constant for size distribution data collectedafter approximately one hour had passed since the aerosolwas injected. MINC results used in this paper were taken af-ter an hour had passed. Transmission co-efficients used forthis study are 0.55, 0.57 and 0.63 for ATD, SD and Snomax®respectively.
In future experiments, it would be beneficial to measurethe size distribution of aerosol at the inlet to the chambercontinuously to allow more accurate results to be obtained.
2.3.2 Wall temperature
As the temperature of each wall is not measured directly onthe inside of the chamber, it is important to know how therecorded temperatures (measured at the back of the coppersurface) relate to the ice surface temperatures. It is impor-tant to know this as it is these temperatures that are used to
www.atmos-chem-phys.net/11/53/2011/ Atmos. Chem. Phys., 11, 53–65, 2011

58 H. M. Jones et al.: MINC measurements from the 2007 international workshop
Fig. 5. Temperatures as measured by instrument PRTs (x-axis) plot-ted against temperatures as measured by calibration PRTs∗ (y-axis)for three different start temperatures (−18◦C, −25◦C, −30◦C)∗ Deviations from straight-line fit for outer wall middle tempera-tures was due to calibration sensor not being firmly fixed to thewall.
calculate the sample temperature and supersaturation condi-tions.
The instrument has three Platinum Resistance Thermome-ters (PRTs) on each wall, positioned at the top, middleand bottom of the copper sections (where the top and bot-tom PRTs are positioned 5 cm from the end of the coppertube). In order to calibrate the temperature difference be-tween where we want to know the temperature (the insidewalls of the chamber) and where we actually measure it (onthe outside surface of the chamber), calibrated PRTs wereplaced inside the chamber against the copper wall at corre-sponding positions to the instrument PRTs. The walls werethen cooled/warmed under conditions typical of those used atICIS-2007. Typical airflow was also used to allow represen-tative results, though the ice coating could not be applied asthere was no way to seal the chamber as the calibration PRTwires must go through the chamber outlet. The calibrationwas performed at three different start temperatures to deter-mine if start temperature has any effect on the results, this isshown in Fig. 5. Figure 5 has six panels, one for each of theinstrument PRTs. It can be seen in each of these plots that acommon straight line fit can be used for all three starting tem-peratures, indicating that starting temperature does not affectthe calibration and that a simple correction can be made toeach measurement.
Outer wall instrument temperatures agreed well with thecalibration temperatures, mostly within 0.5◦C. However, theinner wall instrument temperatures reported up to 5◦C lowertemperatures than the calibration PRTs, especially when op-erating at very low temperatures. The measurements at thetop of the inner wall showed the most difference betweeninstrument and calibration PRT values: 2◦C difference at−20◦C and 5◦C at −40◦C. Whereas the middle of the in-ner wall temperature comparison showed 0◦C difference at−20◦C and 3◦C difference at−40◦C.
The other piece of important information that these resultsshow is that there does not appear to be a steady temperaturealong each of the walls. For example, consider the highestpoint on each of the outer temperature graphs in Fig. 5. Themiddle temperature is lower than the two ends. The same istrue when considering the inner wall temperatures. Investiga-tions using additional PRTs along the inside of each wall re-vealed that wall temperatures were steady along most of eachwall, with temperature increasing slightly within∼10cm ateach end. This is mainly due to heat gain from the ends ofthe chamber.
2.3.3 Optical particle counter
The Optical Particle Counter (OPC) used was aCLiMET 3100-1158. As the OPC was operated at alower flow rate than standard (28.3 LPM) a peak voltage tosize calibration was provided at purchase. The OPC outputstwo continuous analogue signals – designated high gain andlow gain, from which concentrations in the 1–2 µm particleschannels and 3–8 µm particles channels respectively werederived (channels are named according to channel lowersize limit) using in-house built electronics which send thecounts to the computer (via National Instruments, 6602).The counting efficiency of the high gain channel is reportedas 50%±10% for the lowest bin (1 µm), whereas the lowgain channel counting efficiency is reported as 100%±10%for the lowest bin (3 µm). The OPC sampled the total flowfrom the chamber. Ice particle numbers detected in the totalflow are related to the sample flow to determine nucleatedIN number concentrations.
To confirm that the electronics, as part of the OPC system,were able to size particles correctly, the modified CliMETwas compared in the laboratory to a calibrated OPC (GrimmAerosol Tecnik, Dust Monitor 1.105, optical scattering sizerange 0.5–20.0 µm) and an Aerodynamic Particle Sizer (TSIAPS 3321, aerodynamic size range 0.5–20.0 µm). A Vibrat-ing Orifice Aerosol Generator (VOAG) was used to producemonodisperse aerosol at known sizes (3, 4, 5 µm) using NaCl,oleic acid and olive oil solutions. Size distributions from allinstruments peaked at the same size (to within 1 µm), but theCLiMET exhibited a broader distribution than the other in-struments, typically spanning over three size channels, equiv-alent to the peak size±2 µm. The APS has higher resolutiondue to many more channels than the CLiMET, and the distri-bution tended to span over∼6 size channels, roughly equiv-alent to peak size−1/+2 µm. GRIMM OPC results wereharder to discern due to the smaller number of size bins andthe staggering of the bin sizes. Typically, peaks spanned twoor three size bins, e.g. when measuring 5 µm, sizes from 3.5–7.5 µm were seen.
Atmos. Chem. Phys., 11, 53–65, 2011 www.atmos-chem-phys.net/11/53/2011/

H. M. Jones et al.: MINC measurements from the 2007 international workshop 59
Table 1. ICIS-2007 sample information.
Date Sample Notes
17/09/07 ATD Commonly used in past INstudies. Mechanically pro-duced by Particle Technol-ogy Inc. Representative ofSW US desert dust
18/09/0719/09/0720/09/07 Soot Generated by graphite spark
generator21/09/0724/09/07 Israeli Dust Collected sample after Israeli
dust storm25/09/07 Saharan Dust Collected sample from near
Cairo26/09/07 Canary Island Dust Collected sample from re-
gion exposed to depositionfrom Saharan aerosol layers
27/09/07 Snomax® Manufactured IN protein,York Snow Company
28/09/07 Live Bacteria Pseudomonas syringae
3 International workshop on Comparing Ice nucleationmeasuring Systems (ICIS) 2007
The International workshop on Comparing Ice nucleationmeasuring Systems (ICIS) 2007, also dubbed the FourthInternational Ice Nucleation Workshop, was held at theAerosol, Interactions and Dynamics in the Atmosphere(AIDA) chamber facility at the Institute for Meteorologyand Climate Research (IMK), Karlsruhe Institute of Technol-ogy (KIT), Germany. The main objective of this workshopwas to compare and contrast currently existing ice nucle-ation measurement instruments using a common, well char-acterised, aerosol generation system, a revived concept fromearlier workshops, the third being in Laramie, Wyoming,1975 (Vali, 1975). The purpose of this was to assess therange and consistency of present IN measurement capabil-ities. Details of all instruments and their respective researchgroups are given in the ICIS-2007 overview paper (Mohleret al., 2008a; DeMott et al., 2010b). Experiments were car-ried out between 17 September 2007 and 28 September 2007.Aerosol samples were chosen for their expected ice nucle-ation properties, details of which are summarised in Table 1.
Samples were prepared so that the vast majority of parti-cles used in the experiment were<1 µm diameter; thus al-lowing those instruments without impactors on their inletsto identify IN more easily based only on measured particlesize. Dust samples were always dispersed in the same way,as described in Mohler et al. 2006, with the cyclone impactor
Fig. 6. a) Total aerosol concentration time series during 19/09/07with vertical lines representing the times at which the b) size dis-tributions were taken shown. Size distributions are shown for times3420, 5820, 9790, 13 500, 25 600, 35 000 s from the reference time.
set to remove the larger dust particle fraction. The Snomax®sample was dispersed from a water suspension, as describedin Mohler et al., 2008b. Aerosol particles were introduced tothe Aerosol Preparation and Characterisation (APC) Cham-ber at typical initial concentration of up to 105 cm−3. INdetection instruments could then sample directly from thischamber, during sampling number concentrations were typ-ically at or below around 104 cm−3. Figure 6 shows thetypical variation in aerosol properties in the APC chamberthroughout the day. Figure 6a shows the total aerosol con-centration varied with time and Fig. 6b shows the size dis-tributions (normalised to maximum value) at various timesduring the day, see caption and also dashed lines on Fig. 6a.As can be seen, the peak of the size distribution is shifting toslightly higher sizes throughout the day as the total concen-tration decreases significantly. These changes to the aerosolpopulation are probably the result of particle coagulation andlosses. After aerosol size characterisation, a minor fraction ofthe aerosol was transferred to the much larger AIDA chamber(resulting in concentrations of∼500 cm−3) for cloud nucle-ation expansion experiments. There was an opportunity forsampling from the AIDA chamber prior to an expansion run.The AIDA chamber walls were pre-coated with ice to estab-lish ice saturation at wall temperature. The whole chamberwas cooled to sub-zero temperatures, and then the air insidethe chamber was further cooled by adiabatic expansion, e.g.Mohler et al., 2003. During an expansion, a suite of instru-ments including particle counters are used to determine theactivation point and evolution of ice nucleation as a functionof temperature and supersaturation. AIDA expansion exper-iments were carried out for all samples in Table 1. Furtherinformation can be found in Koehler et al. (2010).
This paper reports the results obtained by the MINC in-strument described in the previous section. Also shown arecomparisons with the CSU-CFDC instrument, an instrumentof similar design, but with some notable differences. TheCSU-CFDC is the same version (CFDC-1H) which was usedin recent laboratory and field studies (e.g. Eidhammer et al.,2010; Richardson et al., 2010).
www.atmos-chem-phys.net/11/53/2011/ Atmos. Chem. Phys., 11, 53–65, 2011
60 H. M. Jones et al.: MINC measurements from the 2007 international workshop
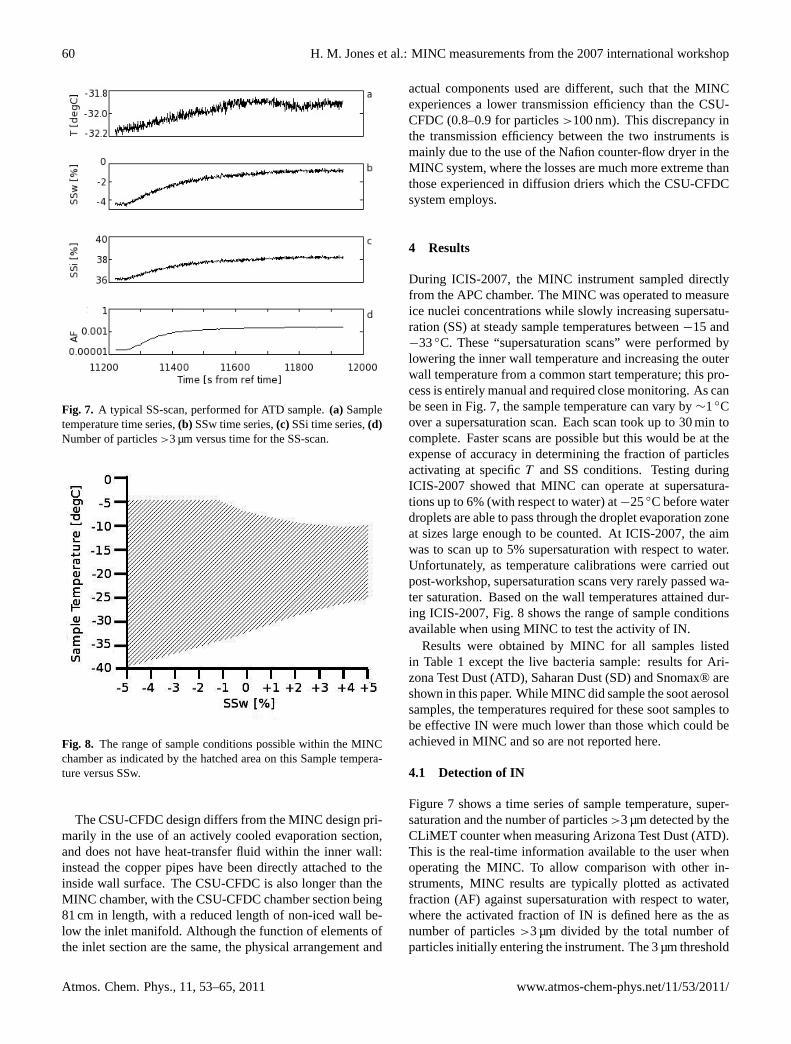
Fig. 7. A typical SS-scan, performed for ATD sample.(a) Sampletemperature time series,(b) SSw time series,(c) SSi time series,(d)Number of particles>3 µm versus time for the SS-scan.
Fig. 8. The range of sample conditions possible within the MINCchamber as indicated by the hatched area on this Sample tempera-ture versus SSw.
The CSU-CFDC design differs from the MINC design pri-marily in the use of an actively cooled evaporation section,and does not have heat-transfer fluid within the inner wall:instead the copper pipes have been directly attached to theinside wall surface. The CSU-CFDC is also longer than theMINC chamber, with the CSU-CFDC chamber section being81 cm in length, with a reduced length of non-iced wall be-low the inlet manifold. Although the function of elements ofthe inlet section are the same, the physical arrangement and
actual components used are different, such that the MINCexperiences a lower transmission efficiency than the CSU-CFDC (0.8–0.9 for particles>100 nm). This discrepancy inthe transmission efficiency between the two instruments ismainly due to the use of the Nafion counter-flow dryer in theMINC system, where the losses are much more extreme thanthose experienced in diffusion driers which the CSU-CFDCsystem employs.
4 Results
During ICIS-2007, the MINC instrument sampled directlyfrom the APC chamber. The MINC was operated to measureice nuclei concentrations while slowly increasing supersatu-ration (SS) at steady sample temperatures between−15 and−33◦C. These “supersaturation scans” were performed bylowering the inner wall temperature and increasing the outerwall temperature from a common start temperature; this pro-cess is entirely manual and required close monitoring. As canbe seen in Fig. 7, the sample temperature can vary by∼1◦Cover a supersaturation scan. Each scan took up to 30 min tocomplete. Faster scans are possible but this would be at theexpense of accuracy in determining the fraction of particlesactivating at specificT and SS conditions. Testing duringICIS-2007 showed that MINC can operate at supersatura-tions up to 6% (with respect to water) at−25◦C before waterdroplets are able to pass through the droplet evaporation zoneat sizes large enough to be counted. At ICIS-2007, the aimwas to scan up to 5% supersaturation with respect to water.Unfortunately, as temperature calibrations were carried outpost-workshop, supersaturation scans very rarely passed wa-ter saturation. Based on the wall temperatures attained dur-ing ICIS-2007, Fig. 8 shows the range of sample conditionsavailable when using MINC to test the activity of IN.
Results were obtained by MINC for all samples listedin Table 1 except the live bacteria sample: results for Ari-zona Test Dust (ATD), Saharan Dust (SD) and Snomax® areshown in this paper. While MINC did sample the soot aerosolsamples, the temperatures required for these soot samples tobe effective IN were much lower than those which could beachieved in MINC and so are not reported here.
4.1 Detection of IN
Figure 7 shows a time series of sample temperature, super-saturation and the number of particles>3 µm detected by theCLiMET counter when measuring Arizona Test Dust (ATD).This is the real-time information available to the user whenoperating the MINC. To allow comparison with other in-struments, MINC results are typically plotted as activatedfraction (AF) against supersaturation with respect to water,where the activated fraction of IN is defined here as the asnumber of particles>3 µm divided by the total number ofparticles initially entering the instrument. The 3 µm threshold
Atmos. Chem. Phys., 11, 53–65, 2011 www.atmos-chem-phys.net/11/53/2011/
H. M. Jones et al.: MINC measurements from the 2007 international workshop 61
Fig. 9. Arizona test dust SS-scans performed by the MINC instru-ment. Legend: “M” – MINC instrument results, first number: sam-ple preparation number, second number: seconds from the start ofthe experiment at which the scan began, number in brackets: tem-perature at which the scan was performed.
was used due to the limitations imposed by the optical parti-cle counter.
4.2 Results at different temperatures
ATD was tested on three days and several SS-scans were per-formed over this period. Sample temperatures were−31,−28,−26 and−25◦C, results are shown in Fig, 9. The keyresult here was that at lower sample temperatures, lower su-persaturations were required for the activated fraction to riseabove the background. For the same supersaturation value,higher activated fractions were measured for lower sampletemperature.
4.3 Comparison of MINC measurements with thosefrom other instruments
The main aim of the workshop was to compare IN measure-ments by all the instruments present at the workshop, herethe MINC results are compared to the CSU-CFDC instru-ment. This is a natural comparison since MINC is similar inmany key aspects (e.g. geometry, inlet) to the CSU-CFDCdesign of Rogers et al. (2001) and unpublished modifica-tions since that time. Throughout each day, several SS-scanswere performed at different temperatures. Where possible,MINC performed scans at temperatures matching those ofthe CSU-CFDC to allow easier comparison between theseinstruments.
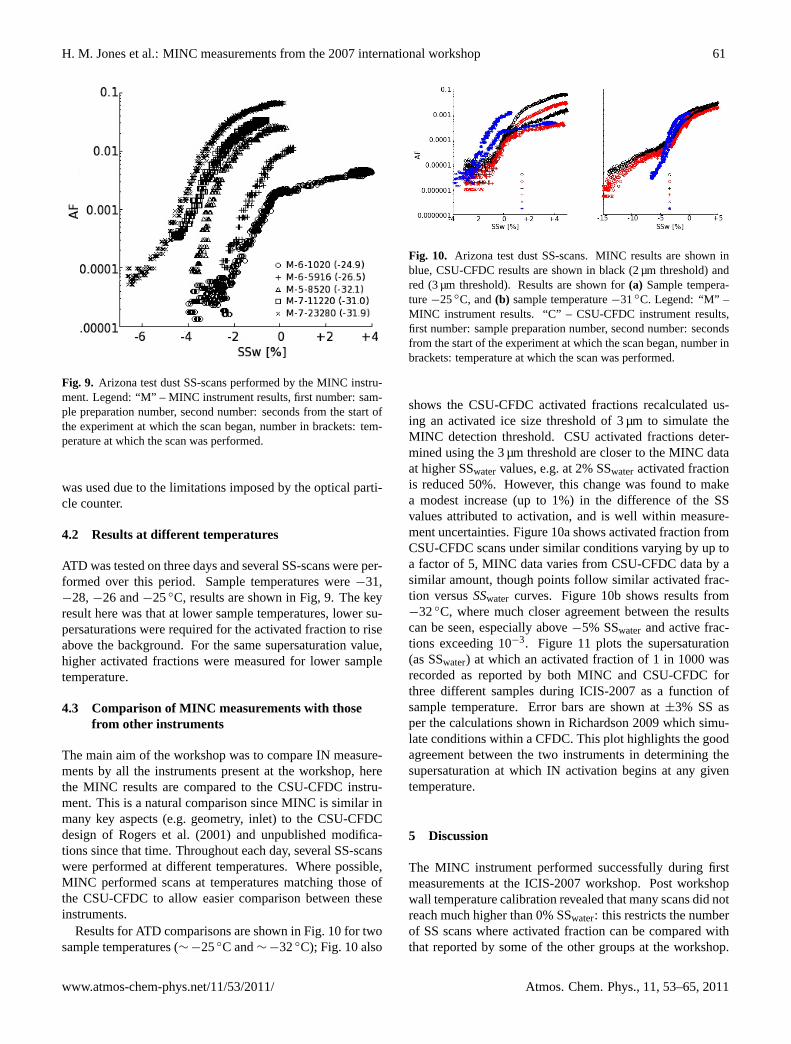
Results for ATD comparisons are shown in Fig. 10 for twosample temperatures (∼ −25◦C and∼ −32◦C); Fig. 10 also
Fig. 10. Arizona test dust SS-scans. MINC results are shown inblue, CSU-CFDC results are shown in black (2 µm threshold) andred (3 µm threshold). Results are shown for(a) Sample tempera-ture−25◦C, and(b) sample temperature−31◦C. Legend: “M” –MINC instrument results. “C” – CSU-CFDC instrument results,first number: sample preparation number, second number: secondsfrom the start of the experiment at which the scan began, number inbrackets: temperature at which the scan was performed.
shows the CSU-CFDC activated fractions recalculated us-ing an activated ice size threshold of 3 µm to simulate theMINC detection threshold. CSU activated fractions deter-mined using the 3 µm threshold are closer to the MINC dataat higher SSwater values, e.g. at 2% SSwater activated fractionis reduced 50%. However, this change was found to makea modest increase (up to 1%) in the difference of the SSvalues attributed to activation, and is well within measure-ment uncertainties. Figure 10a shows activated fraction fromCSU-CFDC scans under similar conditions varying by up toa factor of 5, MINC data varies from CSU-CFDC data by asimilar amount, though points follow similar activated frac-tion versusSSwater curves. Figure 10b shows results from−32◦C, where much closer agreement between the resultscan be seen, especially above−5% SSwater and active frac-tions exceeding 10−3. Figure 11 plots the supersaturation(as SSwater) at which an activated fraction of 1 in 1000 wasrecorded as reported by both MINC and CSU-CFDC forthree different samples during ICIS-2007 as a function ofsample temperature. Error bars are shown at±3% SS asper the calculations shown in Richardson 2009 which simu-late conditions within a CFDC. This plot highlights the goodagreement between the two instruments in determining thesupersaturation at which IN activation begins at any giventemperature.
5 Discussion
The MINC instrument performed successfully during firstmeasurements at the ICIS-2007 workshop. Post workshopwall temperature calibration revealed that many scans did notreach much higher than 0% SSwater: this restricts the numberof SS scans where activated fraction can be compared withthat reported by some of the other groups at the workshop.
www.atmos-chem-phys.net/11/53/2011/ Atmos. Chem. Phys., 11, 53–65, 2011
62 H. M. Jones et al.: MINC measurements from the 2007 international workshop
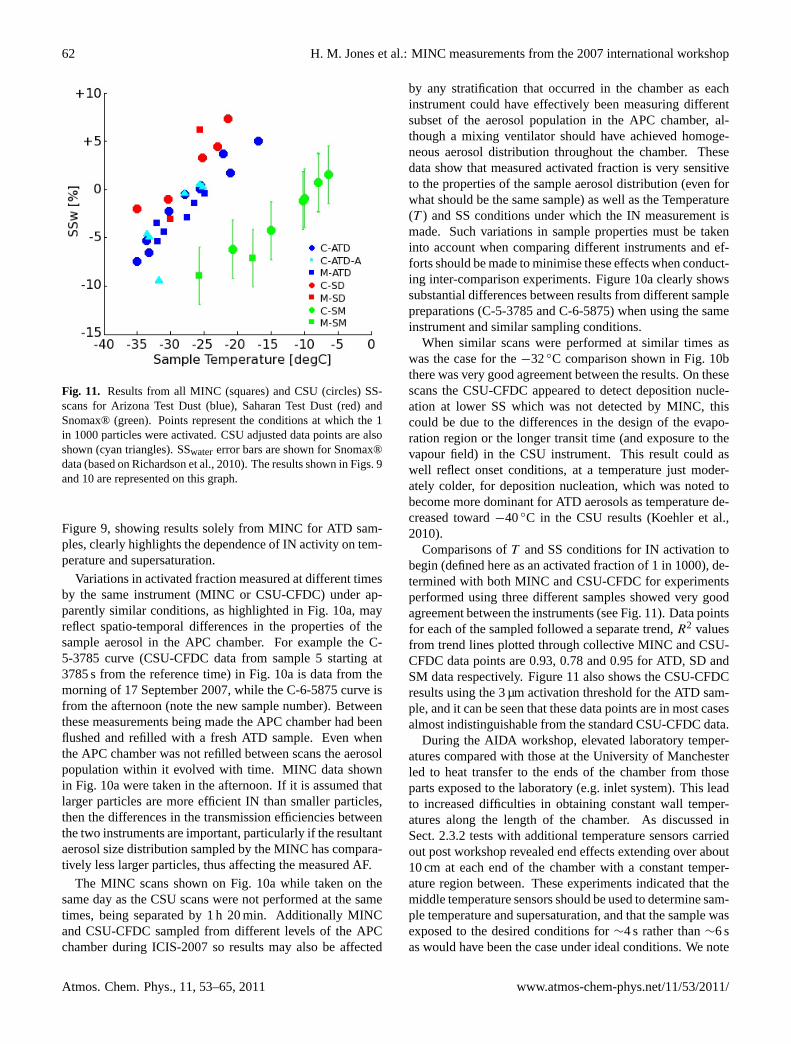
Fig. 11. Results from all MINC (squares) and CSU (circles) SS-scans for Arizona Test Dust (blue), Saharan Test Dust (red) andSnomax® (green). Points represent the conditions at which the 1in 1000 particles were activated. CSU adjusted data points are alsoshown (cyan triangles). SSwatererror bars are shown for Snomax®data (based on Richardson et al., 2010). The results shown in Figs. 9and 10 are represented on this graph.
Figure 9, showing results solely from MINC for ATD sam-ples, clearly highlights the dependence of IN activity on tem-perature and supersaturation.
Variations in activated fraction measured at different timesby the same instrument (MINC or CSU-CFDC) under ap-parently similar conditions, as highlighted in Fig. 10a, mayreflect spatio-temporal differences in the properties of thesample aerosol in the APC chamber. For example the C-5-3785 curve (CSU-CFDC data from sample 5 starting at3785 s from the reference time) in Fig. 10a is data from themorning of 17 September 2007, while the C-6-5875 curve isfrom the afternoon (note the new sample number). Betweenthese measurements being made the APC chamber had beenflushed and refilled with a fresh ATD sample. Even whenthe APC chamber was not refilled between scans the aerosolpopulation within it evolved with time. MINC data shownin Fig. 10a were taken in the afternoon. If it is assumed thatlarger particles are more efficient IN than smaller particles,then the differences in the transmission efficiencies betweenthe two instruments are important, particularly if the resultantaerosol size distribution sampled by the MINC has compara-tively less larger particles, thus affecting the measured AF.
The MINC scans shown on Fig. 10a while taken on thesame day as the CSU scans were not performed at the sametimes, being separated by 1 h 20 min. Additionally MINCand CSU-CFDC sampled from different levels of the APCchamber during ICIS-2007 so results may also be affected
by any stratification that occurred in the chamber as eachinstrument could have effectively been measuring differentsubset of the aerosol population in the APC chamber, al-though a mixing ventilator should have achieved homoge-neous aerosol distribution throughout the chamber. Thesedata show that measured activated fraction is very sensitiveto the properties of the sample aerosol distribution (even forwhat should be the same sample) as well as the Temperature(T ) and SS conditions under which the IN measurement ismade. Such variations in sample properties must be takeninto account when comparing different instruments and ef-forts should be made to minimise these effects when conduct-ing inter-comparison experiments. Figure 10a clearly showssubstantial differences between results from different samplepreparations (C-5-3785 and C-6-5875) when using the sameinstrument and similar sampling conditions.
When similar scans were performed at similar times aswas the case for the−32◦C comparison shown in Fig. 10bthere was very good agreement between the results. On thesescans the CSU-CFDC appeared to detect deposition nucle-ation at lower SS which was not detected by MINC, thiscould be due to the differences in the design of the evapo-ration region or the longer transit time (and exposure to thevapour field) in the CSU instrument. This result could aswell reflect onset conditions, at a temperature just moder-ately colder, for deposition nucleation, which was noted tobecome more dominant for ATD aerosols as temperature de-creased toward−40◦C in the CSU results (Koehler et al.,2010).
Comparisons ofT and SS conditions for IN activation tobegin (defined here as an activated fraction of 1 in 1000), de-termined with both MINC and CSU-CFDC for experimentsperformed using three different samples showed very goodagreement between the instruments (see Fig. 11). Data pointsfor each of the sampled followed a separate trend,R2 valuesfrom trend lines plotted through collective MINC and CSU-CFDC data points are 0.93, 0.78 and 0.95 for ATD, SD andSM data respectively. Figure 11 also shows the CSU-CFDCresults using the 3 µm activation threshold for the ATD sam-ple, and it can be seen that these data points are in most casesalmost indistinguishable from the standard CSU-CFDC data.
During the AIDA workshop, elevated laboratory temper-atures compared with those at the University of Manchesterled to heat transfer to the ends of the chamber from thoseparts exposed to the laboratory (e.g. inlet system). This leadto increased difficulties in obtaining constant wall temper-atures along the length of the chamber. As discussed inSect. 2.3.2 tests with additional temperature sensors carriedout post workshop revealed end effects extending over about10 cm at each end of the chamber with a constant temper-ature region between. These experiments indicated that themiddle temperature sensors should be used to determine sam-ple temperature and supersaturation, and that the sample wasexposed to the desired conditions for∼4 s rather than∼6 sas would have been the case under ideal conditions. We note
Atmos. Chem. Phys., 11, 53–65, 2011 www.atmos-chem-phys.net/11/53/2011/
H. M. Jones et al.: MINC measurements from the 2007 international workshop 63
here that, although the increase in the warm wall tempera-ture at the copper/polypropylene interface increases the SSand sample temperature in this region of the chamber (andpotentially activating extra IN), due to the short time beforereaching the OPC any crystals activated at this point wouldnot reach the detection limit for IN at the chamber exit andtherefore not be counted.
In addition to variability in the sample aerosol in some ex-periments, discrepancies in the results between the MINCand CSU-CFDC instruments could be due to some, or all, ofthe following potential issues. In common with other opti-cal particle counters, the modified CLiMET counter cannotdistinguish multiple particles present simultaneously in thesample volume. Thus, once a particle event has started thecounter is effectively dead to new particle events until a shorttime after all particles have exited the sample volume (this isreferred to as the “dead-time”). The CliMET is expected toencounter significant dead time issues with particle concen-trations of several tens of thousands per litre: this is not an is-sue when measuring under atmospheric conditions, but a def-inite issue when sampling during ICIS-2007. Differences inthe way the signal from the CliMET was handled by the twoinstruments may lead to some differences in reported countsunder these conditions. Secondly, the choice of threshold fordetermining the presence of IN within the chamber should belinked to the impactor cut-off (1.3 µm for MINC) however,due to a difference in dead-time between the two gain stageson the CliMET, data could only be used from the low gainchannel, limiting the MINC threshold to 3 µm. The CSU in-strument typically uses a 2 µm threshold. When the CSU datawere re-analysed using a 3 µm threshold this did bring the re-sults into closer agreement at higher values of SSwater (lessthan a factor of 5 difference as seen in Fig. 10), although itis important to consider other sampling issues that may haveexisted. This result illustrates the importance regarding theconsideration of the size-cut for what is determined to be anIN, particularly when comparing instruments where this canclearly make a substantial difference in the reported activatedfraction. Two of the major differences between the two in-struments compared here is the length of the chamber andthe water droplet evaporation section. The CSU-CFDC hasa longer chamber and therefore additional ice crystal growthtime, and has an actively-cooled evaporation section. TheMINC has a passive evaporation section, which in the hightemperatures experienced at ICIS-2007 could have resultedin the evaporation of ice crystals, and thus fewer crystalsreaching the detection threshold. Despite these differences,when considering sample temperatures and supersaturationat the point where the activated fraction reaches 1 in 1000,the results from the MINC and CSU instruments show excel-lent agreement, with instrument–instrument variability simi-lar in magnitude to sample-sample variability.
6 Conclusions
Initial results from the Manchester Ice Nucleation Counter(MINC), collected during the ICIS-2007 workshop are re-ported here. Measurements of ice nuclei are compared tothe results from the CSU-CFDC instrument, which is of sim-ilar design. Results show that MINC and CSU-CFDC de-tected similar numbers of IN in the samples shown whileperforming comparable SS-scans (see Fig. 11). For SS-scansperformed at similar temperatures, activated fraction at anygiven SS value agreed to within one order of magnitude(worst case), and usually showed much closer agreement inactivated fractions of different IN within SS measurementuncertainties.
While operating the MINC during the workshop, andwhen comparing the data produced with other instrumentsit became apparent that the current instrument had a numberof limitations which could be overcome in future builds bymodification of the design. Suggestions for improvements tothe current design which should help to overcome the diffi-culties reported at ICIS-2007 are listed here: The chambershould be made longer to extend IN exposure time – it issuggested that the chamber be lengthened to allow a longergrowth time and so easier detection of IN; Steps should betaken to improve the uniformity of wall temperatures – thesemight include increasing the number of refrigeration coils onboth walls and improving the thermal contact between wallsand coils; Extra temperature sensors down the length of bothwalls would increase the knowledge of and help constrainthe sample conditions and subsequent calculations; Sampleand sheath flows should be pre-cooled prior to entering thechamber thus reducing transient conditions at the top of thechamber, this can be achieved using a sub-coil from the re-frigeration system. The refrigeration systems should also bemodified to allow experiments at lower temperatures. Thecurrent passive water droplet evaporation region, should bereplaced with an active evaporation section where the outerwall in this section is cooled to the same temperature as theinner wall – this would allow accurate determination of theconditions in the last section of the chamber.
It is particularly evident, when using a threshold size forice detection, that increasing growth time and reducing evap-orative losses will increase the activated fraction that a CFDCdetects, especially in the water supersaturated regime. Itis suggested that incorporating the use of phase detectionwithin the counting system would be advantageous for IN de-tection systems. The use of this technique could remove theneed for the impactor stage of the instrument, thus allowinga wider range of atmospheric particles to be tested. It is pos-sible to distinguish between water, ice and marine boundarylayer salt particles using backscatter depolarisation measure-ments, although it is not yet completely clear that there areno other particle types which could confound this technique.Despite this, in light of recent developments (e.g. Nicoletet al. 2010), it is believed that depolarisation based phase
www.atmos-chem-phys.net/11/53/2011/ Atmos. Chem. Phys., 11, 53–65, 2011

64 H. M. Jones et al.: MINC measurements from the 2007 international workshop
discrimination of particles does offer promise with regard tothe application proposed here, particularly in the eliminationof false counts due to supercooled water droplets.
These results show that the workshop has been success-ful in both providing excellent knowledge exchange betweengroups in this difficult area of research and that IN measure-ments in future will have a common basis for comparisonfollowing recommended improvements in current measure-ment systems.
Acknowledgements.Thanks to Paul Williams, Richard Hartleyand workshop staff at The University of Manchester. First authorwould like to thank Tony Prenni from CSU for his support,particularly during the development stages. The Karlsruhe Insti-tute of Technology provided funding during ICIS-2007 for thefacility infrastructure within the Helmholtz Research Programme“Atmosphere and Climate”. We acknowledge Ottmar Mohlerand Olaf Stetzer for their roles in co-organizing the ICIS-2007workshop. Thanks to the AIDA staff members for their supportduring the ICIS-2007 workshop. We also thank Thomas Schwartz(Karlsruhe Institute of Technology) for support in preparingthe bacterial cultures, Eli Ganor (Tel Aviv University) for pro-viding the Israeli dust sample, and Hans Moosmuller (DesertResearch Institute) for providing the Canary Island dust sample.Collaborative work with the UK Met Office was funded by theDIAC-UKAAN Aerosol Knowledge Transfer program. Attendanceto the ICIS-2007 workshop was funded by the ACCENT Access toInfrastructures Program, the University of Manchester contributionto the workshop was funded by NERC. Attendance at the 2008results workshop was funded by ESF/INTROP. Paul DeMottacknowledges funding support for this research from the USNational Science foundation grant ATM-0611936.
Edited by: D. J. Cziczo
References
Al-Naimi, R. and Saunders, C. P. R.: Ice nucleus measurements:effect of site location and weather. Tellus, 37B, 296–303. 1985
Bergeron, T.: On the low-level redistribution of atmospheric watercaused by orography, in: Suppl. Proceedings of the InternationalConference on Cloud Physics, Tokyo and Sapporo, 24 May–1June, 96–100, 1965.
Bigg, E. K.: Long-term trends in ice nucleus concentrations, Atmos.Res., 25(5), 409–415, 1990.
DeMott, P. J., Petters, M. D., Prenni, A. J., Carrico, C. M., Kreiden-weis, S. M., Collett, J. L., and Moosmuller, H.: Ice nucleation be-havior of biomass combustion particles at cirrus temperatures, J.Geophys. Res., 114, D16205, doi:10.1029/2009JD012036, 2009.
DeMott, P. J., Prenni, A. J., Liu, X., Kreidenweis, S. M., Petters, M.D., Twohy, C. H., Richardson, M. S., Eidhammer, T., and Rogers,D. C.: Predicting global atmospheric ice nuclei distributions andtheir impacts on climate, Proceedings of the National Academyof Sciences, 107 (25), 11217–11222, 2010a.
DeMott, P. J., Mohler, O., Stetzer, O., Murakami, M., Leisner, T.,Bundke, U., Klein, H., Kanji, Z., Cotton, R., Jones, H., Petters,M. D., Benz, S., Brinkmann, M., Rzesanke, D., Saathoff, H.,Nicolet, M., Gallavardin, S., Saito, A., Nillius, B., Bingemer, H.,
Abbatt, J., Ardon, K., Levin, Z., Ganor, E., Georgakopoulos, D.G., Saunders, C., Vali, G.: Resurgence in ice nuclei measurementresearch, B. Am. Meteorol. Soc., in review, 2010b.
Denman, K. L., Brasseur, G., Chidthaisong, A., Ciais, P., Cox, P.M., Dickinson, R. E., Hauglustaine, D., Heinze, C., Holland, E.,Jacob, D., Lohmann, U., Ramachandran, S., da Silva Dias, P. L.,Wofsy S. C., and Zhang, X.: Couplings Between Changes in theClimate System and Biogeochemistry. In: Climate Change 2007:The Physical Science Basis. Contribution of Working Group I tothe Fourth Assessment Report of the Intergovernmental Panel onClimate Change, edited by: Solomon, S., Qin, D., Manning, M.,Chen, Z., Marquis, M., Averyt, K. B. Tignor, M., Miller, H. L.,Cambridge University Press, Cambridge, UK and New York, NY,USA. 2007
Dymarska, M., Murray B. J., Sun, L., Eastwood, M. L., Knopf,D. A., and Bertram, A. K.: Deposition ice nucleation on sootat temperatures relevant for the lower troposphere, J. Geophys.Res., 111, D04204, doi:10.1029/2005JD006627, 2006.
Eidhammer, T., DeMott, P. J., Rogers, D. C., Prenni, A. J., Petters,M. D., Twohy, C. H., Rogers, D. C., Stith, J., Heymsfield, A.,Wang, Z., Haimov, S., French, J., Pratt, K., Prather, K., Murphy,S., Seinfeld, J., Subramanian, R., and Kreidenweis, S. M.: Iceinitiation by aerosol particles: Measured and predicted ice nucleiconcentrations versus measured ice crystal concentrations in anorographic wave cloud, accepted, J. Atmos. Sci., 2010.
Elliott W. P.: Dimensions of thermal diffusion chambers. J. AerosolSci., 28, 810–811, 1971.
Forster, P., Ramaswamy, V., Artaxo, P., Berntsen, T., Betts, R., Fa-hey, D. W., Haywood, J., Lean, J., Lowe, D. C., Myhre, G.,Nganga, J., Prinn, R., Raga, G., Schulz, M., and Van Dorland, R.:Changes in Atmospheric Constituents and in Radiative Forcing,Climate Change, 2007: The Physical Science Basis. Contributionof Working Group I to the Fourth Assessment Report of the Inter-governmental Panel on Climate Change, edited by: Solomon, S.,Qin, D., Manning, M., Chen, Z., Marquis, M., Averyt K. B., Tig-nor, M., Miller, H. L., Cambridge University Press, Cambridge,UK and New York City, NY, USA, 2007.
Fukuta, N. and Saxena, V. K.: Horizontal Thermal-Gradient CloudCondensation Nucleus Spectrometer, J. Appl. Meteorol., 18(10),1352–1362, 1979.
Kanji, Z. A. and Abbatt, J. P. D.: The University of Toronto Con-tinuous Flow Diffusion Chamber (UT-CFDC): A Simple Designfor Ice Nucleation Studies. Aerosol Science and Technology, 43,730–738, doi:10.1080/02786820902889861, 2009.
Knopf, D. A. and Koop, T.: Heterogeneous Nucleation of Iceon Surrogates of Mineral Dust, J. Geophys. Res., 111(D12),D12201, doi:10.1029/2005JD006894, 2006.
Knudsen, J. G. and Katz, D. L.: Fluid dynamics and heat transfer,McGraw Hill, NY, USA, 576 pp., 1958.
Koehler, K. A., Kreidenweis, S. M., DeMott, P. J., Petters, M.D., Prenni, A. J., and Mohler, O.: Laboratory investigationsof the impact of mineral dust aerosol on cold cloud forma-tion, Atmos. Chem. Phys., 10, 11955–11968, doi:10.5194/acp-10-11955-2010,, 2010.
Kulkarni, G., Dobbie, S., and McQuaid, J. B.: A new thermal gra-dient ice nucleation diffusion chamber instrument: design, de-velopment and first results using Saharan mineral dust, Atmos.Meas. Tech., 2, 221–229, doi:10.5194/amt-2-221-2009, 2009.
Meyers, M. P., DeMott, P. J., and Cotton, W. R.: New primary ice-
Atmos. Chem. Phys., 11, 53–65, 2011 www.atmos-chem-phys.net/11/53/2011/

H. M. Jones et al.: MINC measurements from the 2007 international workshop 65
nucleation parametrisations in an explicit cloud model. J. Appl.Meteorol., 31(7), 708–721, 1992.
Mohler, O., Stetzer, O., Schaefer, S. Linke, C., Schnaiter, M., Tiede,R., Saathoff, H., Kramer, M., Mangold, A., Budz, P., Zink, P.,Schreiner, J., Mauerberger, K., Haag, W., Karcher, B., and Schu-rath, U.: Experimental investigation of homogeneous freezingof sulphate acid particles in the aerosol chamber AIDA, Atmos.Chem. Phys., 3, 211–223, doi:10.5194/acp-3-221-2003, 2003.
Mohler, O., Field, P. R., Connolly, P., Benz, S., Saathoff, H.,Schnaiter, M., Wagner, R., Cotton, R., Kramer, M., Mangold,A., and Heymsfield, A. J.: Efficiency of the deposition modeice nucleation on mineral dust particles, Atmos. Chem. Phys., 6,3007–3021, doi:10.5194/acp-6-3007-2006, 2006.
Mohler, O., DeMott, P. J., Stetzer, O., the ICIS-2007 team: TheFourth International Ice Nucleation Workshop ICIS-2007. Pro-ceedings to the 15th International Conference on Clouds and Pre-cipitation, Cancun, Mexico, 7–11 July, 2008a.
Mohler, O., Georgakopoulos, D. G., Morris, C. E., Benz, S., Ebert,V., Hunsmann, S., Saathoff, H., Schnaiter, M., and Wagner, R.:Heterogeneous ice nucleation activity of bacteria: new laboratoryexperiments at simulated cloud conditions, Biogeosciences, 5,1425–1435, doi:10.5194/bg-5-1425-2008, 2008b.
Murphy, D. M. and Koop, T.: Review of the vapour pressures of iceand supercooled water for atmospheric applications, Q. J. Roy.Meteorol. Soc., 131, 1539–1565, 2005
Nicolet, M., Stetzer, O., Luond, F., Mohler, O., Lohmann, U.: Sin-gle ice crystal measurements during nucleation experiments withthe depolarization detector IODE. Atmos. Chem. Phys., 10, 313–325, doi:10.5194/acp-10-313-2010, 2010.
Richardson, M. S., DeMott, P. J., Kreidenweis, S. M., Petters, M.D., and Carrico, C. M.: Observations of ice nucleation by ambi-ent aerosol in the homogeneous freezing regime, Geophys. Res.Lett., 37, L04806, doi:10.1029/2009GL041912, 2010.
Rogers, D. C.: Development of a continuous flow thermal gradientdiffusion chamber for ice nucleation studies, Atmos. Res., 22,149–181, 1988.
Rogers, D. C., DeMott, P. J., Kreidenweis, S. M., and Chen, Y. L.:A continuous-flow diffusion chamber for airborne measurementsof ice nuclei, J. Atmos. Ocean. Tech., 18(5), 725–741, 2001.
Saxena, V. K., Burford, J. N., and Kassner, J. L.: Operation of aThermal Diffusion Chamber for Measurements on Cloud Con-densation Nuclei. J. Atmos. Sci., 27(1), 73–75, 1970.
Sinnarwalla, A. M. and Alofs, D. J.: A cloud nucleus counter withlong available growth time, J. Appl. Meteorol., 12, 831–835,1973.
Stetzer, O., Baschek, B., Luond, F., and Lohmann, U.: The ZurichIce Nucleation Chamber (ZINC) – A new instrument to investi-gate atmospheric ice formation, Aerosol Sci. Tech., 42, 64–74,2008.
Szyrmer, W. and Zawadzki, I.: Biogenic and anthropogenic sourcesof ice forming nuclei: A review, B. Am. Meteor. Soc., 78(2),209–228, 1997.
Vali, G.: Nucleation Terminology, B. Am. Meteor. Soc., 66, 1426–1427, 1985.
Vali, G.: Ice Nucleation Workshop, Summary Report, University ofWyoming, Laramie, USA, 18 pp., 1975.
Williams, P. I., McFiggans G., and Gallagher M. W.: Latitudinalaerosol size distribution variation in the Eastern Atlantic Oceanmeasured aboard the FS-Polartern, Atmos. Chem. Phys., 7, 1–11,doi:10.5194/acp-7-1-2007, 2007.
www.atmos-chem-phys.net/11/53/2011/ Atmos. Chem. Phys., 11, 53–65, 2011