managing tourism in hawaii v3
TRANSCRIPT
A Survey of Resident Attitudes on Destination Management Issues
John M. Knox, PhDPresident, John M. Knox & Associates, Inc.
Colin D. Moore, PhDDirector, University of Hawai‘i Public Policy Center
MANAGINGTOURISMIN HAWAI‘I:
PUBLIC POLICYCENTER
June 2, 2021
Executive Summary
Knox, Moore
MANAGING TOURISM IN HAWAI‘I i
Hawai‘i residents have long had a complicated relationship with the visitor industry. Although tourism generates tax revenue and jobs, there are longstanding concerns about the impact on Hawai‘i’s natural resources and day-to-day quality of life. �ese voices of concern reached a crescendo when visitor arrivals peaked at 10 million in 2019.
Just a year later, when the COVID-19 pandemic began in March of 2020, tourism was essentially shut down in the islands. Many residents faced job losses and extreme �nancial stress, but others were relieved to visit their favorite beaches and trails without �ghting tra�c and crowds. For some, the statewide shutdown of tourism presented an opportunity to imagine new ways to govern the state’s primary industry.
We wanted to better understand resident attitudes about the visitor industry and to evaluate how people viewed di�erent approaches to destination management. �is study by the University of Hawai‘i Public Policy Center (UH-PPC) is one of the few Hawai‘i statewide resident surveys on tourism not sponsored by the Hawai‘i Tourism Authority or by the State Department of Business, Economic Development, and Tourism.
�e UH-PPC contracted Anthology Research to �eld the survey using an online methodology. Fieldwork for the study began on April 16, 2021 and ended on May 3, 2021. A total of 700 online surveys were completed during this time period. �e margin of error for a sample of this size is +/- 3.70 percentage points with a 95% con�dence level.
Key Findings
Tourism and COVID-19�ere is a strong resident desire for vaccination requirements for travel to Hawai‘i (70%), with many also wanting COVID testing requirements in addition to vaccinations (45%). Residents are somewhat dissatis�ed with State actions to limit COVID threats from travel, with 51% rating the State’s performance as fairly bad and another 6% just “bad.” People tend to want the State to focus equally on Tourism Recovery and Economic Diversi�cation this year (49%), but those choosing just one went strongly with Diversi�cation (37%) over Tourism Recovery (10%). Similarly, residents take a balanced position on whether to market tourism “as always” or to cut/stop marketing “immediately.” A 40% plurality (i.e., the greatest response but not a majority) said, “Market now, but cut back as tourism grows.”
ii
Government Values and PrinciplesRespondents were most supportive of a visitor industry that (a) improves rather than depletes natural and cultural resources (46% selection as “most important” in list); (b) markets to “respectful” visitors (43%); and (c) assures jobs that provide a “living wage” (43%). Still supported, but at distinctly lower levels, were (d) generating the most possible tax dollars (22%); (e) growing tourist dollars rather than tourist numbers (21%); and (f ) avoiding actions that negatively a�ects Hawai‘i’s image (19%).
The Size of Hawai‘i TourismResidents respond well to a strategic focus on managing particularly crowded “hot spots”, but the push for somehow capping visitor numbers is not likely to dissipate quickly. If it were possible, about 52% would prefer limiting the number of visitors, with even stronger support for this policy on Neighbor Islands and among Native Hawaiians. But when forced to choose the better general strategy – “hot spot” management or capping visitor counts – residents chose the �rst over the second, 57% to 37%. Residents would be happy to see tourists charged and/or required to make advance reservations at parks or other “hot spots,” with 78% strongly favoring or somewhat favoring charging visitors an entry fee to use them during peak times.
EXECUTIVE SUMMARY
Government Actions to Regulate Tourism�ere is a strong consensus among Hawai‘i residents that the State should play a role in managing the tourism industry. Excluding those who said “Don’t Know,” residents by a 2-to-1 margin said Government should control or regulate tourism more than other businesses. Particularly strong support, at levels of roughly 80% “strongly” or “somewhat” favoring, were evident for regulating tour operations in public parks, strict green-energy requirements for resort areas, and testing some tourism businesses for accuracy of cultural/historical information. Support for regulating vacation rentals outside resort areas was nearly as strong, at about 75%. Allowing casino gambling was the only one of seven selected possible actions to be opposed by a majority (52%).
iii
Destination Management Roles and FinancingMany residents support using rental car surcharges as a way to pay for addressing some tourism impacts (38% to just 19% opposed), although a plurality of 39% said it would depend on the size of the increase and other issues. �ere was somewhat more support for using this revenue for improving highways (25%) than for natural resource protection (18%), but half would split the money between both purposes. When asked about green fees (visitor taxes speci�cally for natural resource protection), many residents favored them (40% to just 18% opposed), but 36% said “It depends.” �ose who favored green fees seemed to care little as to whether they would better be collected via room taxes or rental car surcharges. Presented with a list of 11 possible actions the State could take to support or regulate tourism, or address its impacts, residents supported all, but with the highest levels of support going to: Informing tourists about “responsible visiting;” solving problems at particular congested locations; and funding environmental groups “to repair damage to reefs, shorelines or trails caused mostly bytourist use.”
Organizing for Destination Management ActivitiesOur results show that residents have diverse opinions about the Hawai‘i Tourism Authority’s (HTA’s) future. A plurality of 35% would both keep the HTA and also increase its authority in the “Destination Management” area. Another 14% would simply keep HTA as is – so roughly half would either preserve or strengthen the agency. About 25% would keep HTA only for marketing, with “Destination Management” functions either eliminated or scattered among other agencies. Just 9% would have no HTA or similar agency. A “permanent tourism advisory council system” including both resident and industry stakeholders won more than 2-to-1 approval among those with clear opinions (34% Yes to 15% No), but a plurality of 45% cautiously said, “Depends How It’s Done.” Two-thirds of those who said Yes wanted an elected rather than appointed system.
EXECUTIVE SUMMARY
Recommendations
iv
A sound destination management strategy is essential to sustain Hawai‘i’s tourism industry and address resident concerns. �e Hawai‘i Tourism Authority appears to be making sincere e�orts to do this, though there are questions about how much it can achieve with limited funding and legal authority. Destination management requires consistent funding and e�ective coordination with all stakeholders, so it may now be time for a truly systematic weighing of alternative approaches to tourism governance, though that should include the possibility of truly committing to HTA much as it is now or with selected improvements.
We recommend that any future e�orts to restructure tourism governance take time to include widespread stakeholder input and careful studies of how other destination management organizations and governments are managing tourism. We also urge that studies such as tourism competition analyses and national/international destination image surveys be more widely shared with, and written for, the local public.
More broadly, the State must eventually align tourism destination management with overall growth management planning. �at was the approach taken in the development of the original Hawai‘i State Plan of the 1970s, and that approach should be preserved and strengthened.
�e survey has also shown that residents with household job linkages to tourism are in some cases actually more interested in proposed corrective measures such as “green fees” than are other residents. �is suggests that visitor industry workers – unionized or not – should have a clearer voice, distinct from management, about tourism policies.
But perhaps the most critical short-term thing is to make su�cient progress in taking concrete steps to control perceived tourism over-use of parks, trails, and other recreational “hot spots.” �ere is one possible real – if indirect and complicated – way to in�uence if not totally control visitor numbers. �at is through permits/enforcement for resort lodging in general and vacation rentals (especially outside resort areas) in particular. �is survey found 76% support for regulating vacation rentals outside resort areas, and just 21% opposition.
When it comes to tourism management, Hawai‘i has often seemed torn between decisive actions and hesitation over giving the industry “special treatment” by government, as agriculture was once given and to some extent still is. However, this survey has also shown the majority of residents want State government to regulate and/or support tourism more than other businesses.
EXECUTIVE SUMMARY
v
Acknowledgments
We thank John M. Knox & Associates for providing survey research support, and we are grateful to Anthology Research for partnering with us to identify a sample of respondents, collect data, and provide computerized analysis. We also thank Sharon Moriwaki for her 2018 �nancial gift to the UH Public Policy Center to support development of a survey research program.
�anks as well to the following people for helpful comments and critical feedback on full or partial questionnaire drafts: Caroline Anderson, Jennifer Chun, Frank Haas, Mu� Hannemann, Jared Higashi, Lisa Paulson, and Emilia von Saltza.
Table of Contents
1. Introduction 1
6
1.1 Study Purpose 35
79
161719
111214
22
33
41
2325262831
343638
43444648495054
15
1.2 Organization of Survey Questionnaire and Report
3. Government Values and Principles for Tourism3.1 What Values and Principles Should the State Normally Apply to Tourism?3.2 Which of These Are the “Most Important” Values/Principles?
5. Proper Government Actions to Regulate Tourism5.1 Should Government Control/Regulate Tourism More than Other Businesses?5.2 Should Government Help/Support Tourism More than Other Businesses?5.3 Opinions on Selected Specific Possible Government Controls or Supports
4. Policies About “Size” of Hawai‘i Tourism4.1 If It Were Possible, Would Residents Favor Limits on Numbers of Tourists?4.2 If Limiting Numbers Were Possible, How Many Tourists Should Be Allowed?4.3 Is Sense of Island “Crowding” Due More to Tourists or to Residents?4.4 Pricing and Reservation Strategies for Particular Congested “Hot Spots”4.5 What Is the Preferred General Strategy for Tourism-Associated “Crowding?”
2. Tourism and COVID (Immediate Issues)2.1 What Should Be Travel Requirements This Spring and Summer?2.2 Make Future Quarantine Requirements Consistent Across Islands/Counties?2.3 How Rate State Government on COVID Safety Requirements for Travel?2.4 Should State More Prioritize Tourism Recovery or Economic Diversification?2.5 What General Strategy Should State Adapt for Marketing Tourism This Year?2.6 Transitional Wording to Rest of Survey
6. Proper “Destination Management” Rolesand Financing
6.1 Favor or Oppose Additional Rental Car Surcharges for Visitors?6.2 What Is Best Use for Any Additional Rental Car Surcharge Funds?6.3 Favor or Oppose Adding “Green Fees” to Visitor Taxes?6.4 If Approved, What Is the Better Way to Collect Any “Green Fees?”6.5 If New Visitor Taxes, Use for Public Purposes or Rebate to Residents?
6.7 Pay for Approved Government Functions Just by Taxing Tourists?6.6 What Should State Government Do to Effectively Manage Our Destination?
vi
7. Organizing for “Destination Management” Activites
8. Discussion and Recommendations9. Appendix A: Survey Methods and Analysis10. Appendix B: Survey Questionnaire
57
646869
7.1 Should Hawai‘i Keep the HTA As Is, Strengthen It, or Eliminate It? 5961
637.2 Should Standing Advisory Councils Be Part of Tourism Governance Here?7.3 If Permanent Advisory Councils Approved, Appointed or Elected?
vii
List of Tables
viii
Table 1. Belief in Standardizing Requirements by Political Ideology 10Table 2. Selected Group Differences – Values/Principles for Managing Tourism 19Table 3. Selected Group Differences – 1st/2nd Most Important Values/Principles 21Table 4. Relationship Between Opinions (Regulation vs. Support) 37Table 5. Relationship Between Opinions (Favor Surcharges vs. Preferred Use) 45Table 6. Selected Group Differences – Green Fees 47Table 7. Selected Group Differences – Public Purposes vs. Resident Rebates 50Table 8. Selected Differences – Pay by Taxing Only Tourists Table 9. Selected Differences – Pay by Taxing Both Tourists and ResidentsTable 10. Selected Group Differences – Opinions about Future of HTA
565661

List of Figures
ix
Fig 1. Core Measures Over Time of Resident Sentiment toward Tourism 2Fig 2. Opinions About Continuing Travel Quarantines Throughout 2021 8Fig 3. If Future Quarantine Requirements Should Be Same Across State 9Fig 4. Rating State on Limiting COVID Threat from Travel 11Fig 5. Prioritizing Tourism Recovery vs. Economic Diversification 12Fig 6. General Tourism Marketing Strategy for Next Year 14Fig 7. Agreement with Selected Values/Principles for Managing Tourism 18Fig 8. Most Important Values/Principles for Managing TourismFig 9. Favor or Oppose Government Limits on Tourism If PossibleFig 10. Preferred Number of Visitors/Year to Hawai‘i
202425
Fig 11. If “Crowding” Due More to Visitors or Residents 27Fig 12. Opinions on Strategies for Managing Over-Use of Key “Hot Spots” 30Fig 13. Preferred Approach to Managing Tourism-Related Crowding 31Fig 14. If Tourism Should Be Controlled/Regulated More than Businesses 35Fig 15. If Tourism Should Be Helped/Supported More than Businesses 36Fig 16. Opinions on Selected Government Controls/Supports 39Fig 17. Favor or Oppose Higher Rental Car Surcharges for Visitors 43Fig 18. Preferred Use for Any New Rental Car Surcharge RevenueFig 19. Favor or Oppose Green Fees for VisitorsFig 20. If Better to Collect Green Fees via Room Tax or Rental Car Add-Ons
444648
Fig 21. If Any New Visitor Taxes Used for Public Purposes or Rebated 49Fig 22. Opinions on Selected Government Controls/Supports 52Fig 23. Pay by Taxing Only Tourists/Tourism or Residents as Well 55Fig 24. Opinions about Future of HTAFig 25. If Standing Tourism Advisory Council Should Be CreatedFig 26. If Council Members Should Be Appointed or Elected
606263
1
1. Introduction
�e relationship between Hawai‘i residents and the visitor industry has long been described as a “love-hate” a�air, with complicated perceptions of the industry’s good and bad points but clear hesitation over more growth.
And it’s been that way for decades. �e �rst extensive statewide resident survey of resident attitudes about tourism was done in 19881. It found that residents acknowledged tourism’s economic bene�ts (to a greater extent than they have recently).
However, even in 1988 residents were not necessarily supportive of the industry’s expansion. Some 68% agreed that It’s time to stop building hotels on this island. And 63% concurred: In my part of the island, it’s more important to keep things like they are than to have more tourism jobs.
Since then, the Hawai‘i Tourism Authority (HTA) was created and started regularly conducting resident surveys. �is study by the University of Hawai‘i Public Policy Center (UH-PPC) is one of the few Hawai‘i statewide resident surveys on tourism not sponsored by HTA or by DBEDT, the State Department of Business, Economic Development, and Tourism.
1Hawai‘i State Dept. of Business and Economic Development, Tourism Branch. August 1989. 1988 Statewide Tourism Impact Core Survey: Summary. Prepared by Community Resources, Inc., Honolulu Hawai‘i. Principal author of both the 1988 questionnaire and also this cited report was John M. Knox, PhD, co-author of the present 2021 study. Dr. Knox also developed many of the initial HTA surveys.
Knox, Moore
MANAGING TOURISM IN HAWAI‘I
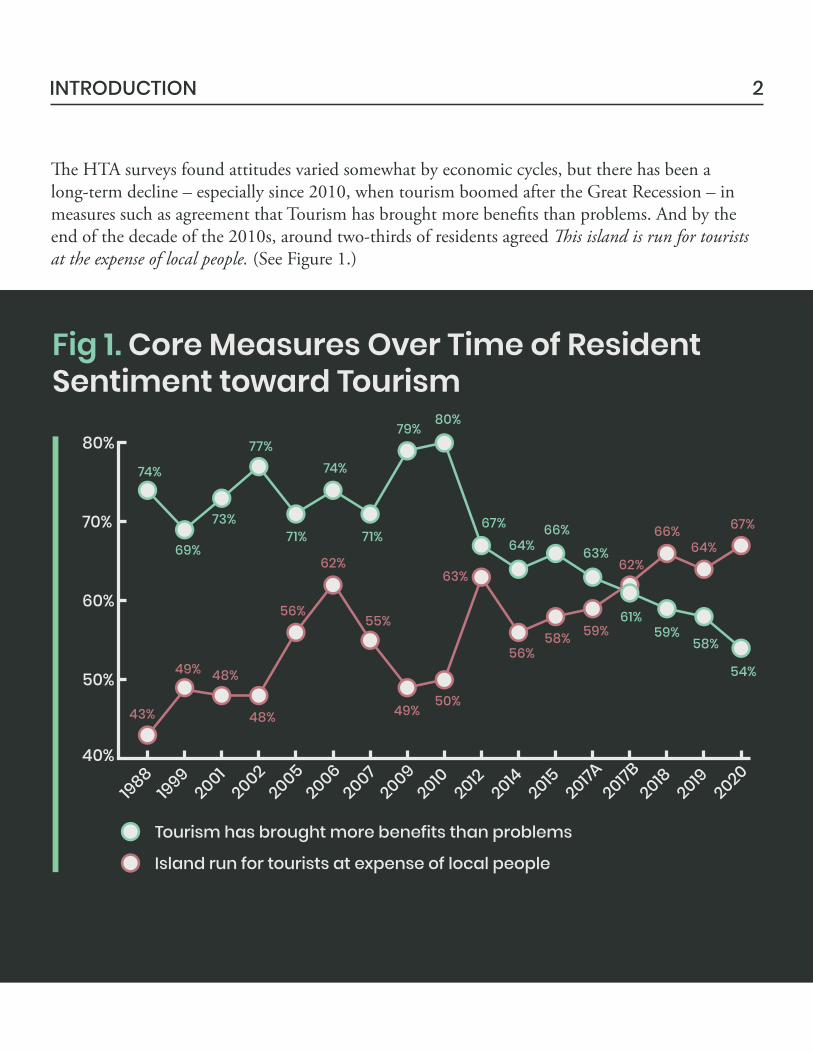
�e HTA surveys found attitudes varied somewhat by economic cycles, but there has been a long-term decline – especially since 2010, when tourism boomed after the Great Recession – in measures such as agreement that Tourism has brought more bene�ts than problems. And by the end of the decade of the 2010s, around two-thirds of residents agreed �is island is run for tourists at the expense of local people. (See Figure 1.)
INTRODUCTION 2
Fig 1. Core Measures Over Time of ResidentSentiment toward Tourism
40%
Tourism has brought more benefits than problems
50%
74%
43%
69%
49%
73%
48%
77%74%
79%80%
67%64%
66%63%
61%59%
58%
54%
48%
71% 71%
56%
62%
55%
49%50%
63%
56%58% 59%
62%
66%64%
67%
60%
70%
80%
19881999
20012002
20052006
20072009
20102012
20142015
2017A2017B
20182019
2020
Island run for tourists at expense of local people
1.1 Study Purpose
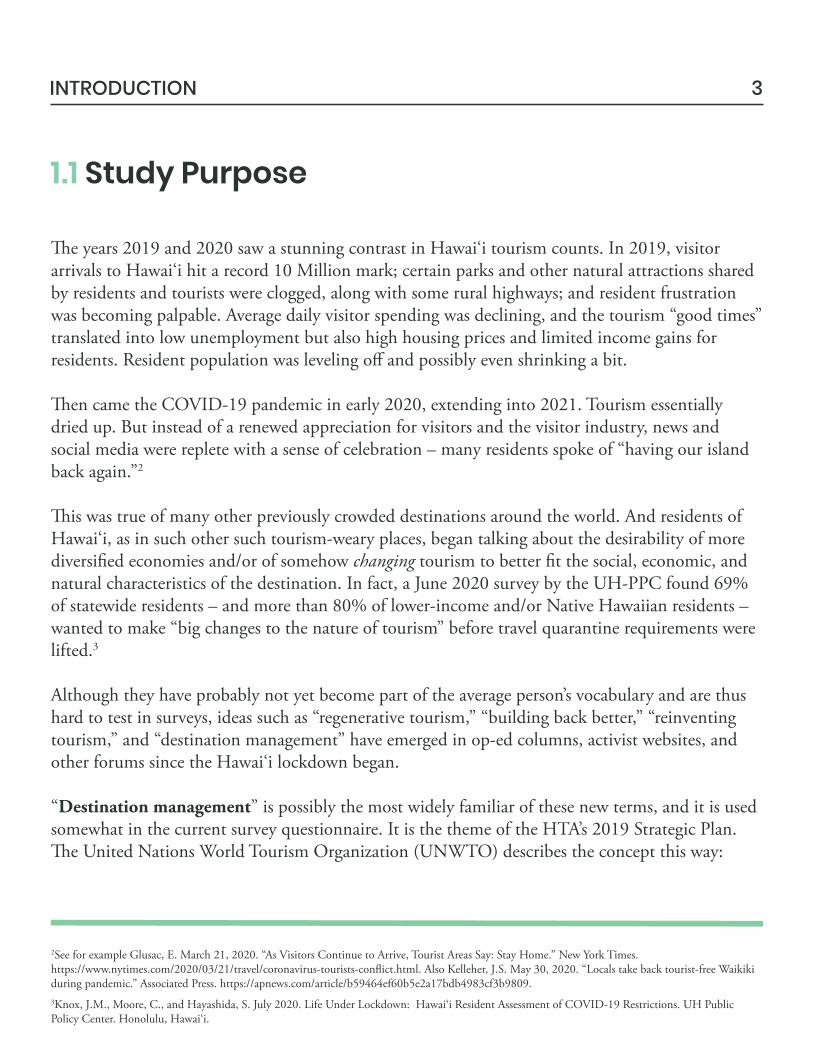
�e years 2019 and 2020 saw a stunning contrast in Hawai‘i tourism counts. In 2019, visitor arrivals to Hawai‘i hit a record 10 Million mark; certain parks and other natural attractions shared by residents and tourists were clogged, along with some rural highways; and resident frustration was becoming palpable. Average daily visitor spending was declining, and the tourism “good times” translated into low unemployment but also high housing prices and limited income gains for residents. Resident population was leveling o� and possibly even shrinking a bit.
�en came the COVID-19 pandemic in early 2020, extending into 2021. Tourism essentially dried up. But instead of a renewed appreciation for visitors and the visitor industry, news and social media were replete with a sense of celebration – many residents spoke of “having our island back again.”2
�is was true of many other previously crowded destinations around the world. And residents of Hawai‘i, as in such other such tourism-weary places, began talking about the desirability of more diversi�ed economies and/or of somehow changing tourism to better �t the social, economic, and natural characteristics of the destination. In fact, a June 2020 survey by the UH-PPC found 69% of statewide residents – and more than 80% of lower-income and/or Native Hawaiian residents – wanted to make “big changes to the nature of tourism” before travel quarantine requirements were lifted.3
Although they have probably not yet become part of the average person’s vocabulary and are thus hard to test in surveys, ideas such as “regenerative tourism,” “building back better,” “reinventing tourism,” and “destination management” have emerged in op-ed columns, activist websites, and other forums since the Hawai‘i lockdown began.
“Destination management” is possibly the most widely familiar of these new terms, and it is used somewhat in the current survey questionnaire. It is the theme of the HTA’s 2019 Strategic Plan. �e United Nations World Tourism Organization (UNWTO) describes the concept this way:
3
2See for example Glusac, E. March 21, 2020. “As Visitors Continue to Arrive, Tourist Areas Say: Stay Home.” New York Times. https://www.nytimes.com/2020/03/21/travel/coronavirus-tourists-con�ict.html. Also Kelleher, J.S. May 30, 2020. “Locals take back tourist-free Waikiki during pandemic.” Associated Press. https://apnews.com/article/b59464ef60b5e2a17bdb4983cf3b9809. 3Knox, J.M., Moore, C., and Hayashida, S. July 2020. Life Under Lockdown: Hawai‘i Resident Assessment of COVID-19 Restrictions. UH Public Policy Center. Honolulu, Hawai‘i.
INTRODUCTION
“Destination management consists of the coordinated management of all the elements that make up a tourism destination. Destination management takes a strategic approach to link-up these sometimes very separate elements for the better management of the destination. Joined up management can help to avoid overlapping functions and duplication of e�ort with regards to promotion, visitor services, training, business support and identify any management gaps that are not being addressed.
Destination management calls for a coalition of many organizations and interests working towards a common goal, ultimately being the assurance of the competitiveness and sustainability of the tourism destination. �e Destination Management Organization’s (DMO) role should be to lead and coordinate activities under a coherent strategy in pursuit of this common goal.
�ough DMOs have typically undertaken marketing activities, their remit is becoming far broader, to become a strategic leader in destination development. �is is a vital ingredient for success in every tourism destination and many destinations now have DMOs to lead the way.”4
4INTRODUCTION
4UNWTO website on Policy and Destination Management, https://www.unwto.org/policy-destination-management, accessed March 20, 2021.
�e UH-PPC decided to survey residents about issues related to Destination Management (or “new tourism” models) when these issues �rst emerged in mid-2020. We waited till 2021 to do the survey primarily because so much public attention in latter 2020 became focused on the more immediate questions of how to re-open tourism while still �ghting COVID.
Resident attitudes are not the only factors for policy makers to consider in making decisions about Destination Management, but they are important ones. It is our hope that policy makers at the HTA, the State Legislature, and other government and professional organizations will �nd this study useful as they try to re-shape Hawai‘i tourism and achieve the goals ofDestination Management.
1.2 Organization of Survey Questionnaireand Report
Other than background demographic questions, the survey questionnaire was arranged in six chapters, replicated in the report presentation. We tried to begin with more familiar and common topics – including an opening section on remaining immediate issues pertaining to tourism re-opening – and work our way toward some of the more complex and less familiar policy issues.
�e order in which survey questions are presented can a�ect responses. For a limited number of questions with lists of separate items, we randomized the order in which those items were presented to respondents, to minimize the immediate bias. However, it should be acknowledged that results for the later sections should be considered very preliminary in nature, both because of the less familiar subject matter and because of the way that respondent thinking may have been a�ected by all the foregoing questions.
Please see Appendix A (Chapter 9) for a full description of survey methods and analysis, as well as Appendix B (Chapter 10) for the full questionnaire, with overall percentage results for each item.
5INTRODUCTION
Results in this chapter show:
6
2. TOURISM AND COVID (IMMEDIATE ISSUES)
Knox, Moore
MANAGING TOURISM IN HAWAI‘I
Most of this survey involves long-term “normal” policy issues related to ways that mass tourism and residents can better �t together. However, the opening section of the questionnaire focused on some immediate questions about the current re-opening of tourism while the pandemic of 2020-21 is still being tamed. As the survey was being �nalized, vaccinations were underway, but testing and quarantine protocols were still in place for both visitors and residents returning from out-of-state travel or going inter-island.
�ere is a strong resident desire for vaccination requirements for travel to Hawai‘i, with many also wanting COVID testing requirements kept in place.
People tend to want the State to focus equally on Tourism Recovery and Economic Diversi�cation this year, but those choosing just one went strongly with Diversi�cation.
Most residents want travel quarantine requirements standardized across islands.
Residents are somewhat dissatis�ed with State actions to limit COVID threats from travel.
Similarly, residents take a balanced position on whether to market tourism “as always” or to cut/stop marketing “immediately.” A 40% plurality (i.e., the greatest response but not a majority) said, “Market now, but cut back as tourism grows.”
�e survey questionnaire began this section with the following lead-in wording:
7TOURISM AND COVID (IMMEDIATE ISSUES)
The questions in this section are about the further “re-opening of tourism” during the pandemic and what lessons the government should learn from the past year.
2.1 What Should Be Travel Requirements ThisSpring and Summer?
�e initial opinion question was:
If it were up to you, what should be the State requirements this spring and summer for travelers in and out of Hawai‘i? Should we require:
(1) Just Proof of Vaccination, No Testing Requirement; (2) Just COVID Testing, No Vaccine Requirement; (3) Both Vaccination and Testing Requirements; (4) No COVID-Related Requirements for Travel; or (5) Don’t Allow Travel �is Spring and Summer.
Figure 2 indicates a 45% plurality wanted Both Vaccination and Testing Requirements for travelers. �is would presumably apply to both tourists and returning residents. About 1 in 4 would be happy with Vaccination Requirements alone, and about 1 in 7 preferred COVID Testing alone. Overall, then, nearly 70% wanted Vaccination Requirements, either in combination with Testing or as the sole condition for �ying here.
Very small percentages (6% to 7% each) took one of the more extreme positions of either No COVID Travel Requirements at all or No Travel at All for the near future.

Fig 2. Opinions About Continuing TravelQuarantines Throughout 2021
24%45% 14% 7% 6% 4%
Both Vaccine/Testing
For all charts in this report, unless otherwise stated, N (wtd) = 700.Percentages may not add exactly to 100% due to rounding error
Just Testing
No TravelRequirements
No Travel Allowed Don’t Know/Prefernot to answer
Just Vaccination
Cross-tabulations with key demographic and opinion groups showed only a few instances where results for particular sub-samples di�ered signi�cantly. Political Ideology was one variable that had a modest impact on answers to this question, and will also pop up later as being somewhat related to many other responses to this survey.5 Self-described Conservatives and Very Conservatives were a little more likely (but still only about 14%) to say there should be No COVID Travel Requirements, while Moderates and Liberals were somewhat disproportionately inclined (about 50%) to want Both Vaccination and Testing Requirements.
Additionally, preference for Both Vaccination and Testing rose with Age, from just 38% for those aged 18-29 up to 60% for those aged 65+.
8TOURISM AND COVID (IMMEDIATE ISSUES)
5�e overall results for the question “How would you describe your political views?” were: Very Conservative, 5%; Conservative, 17%; Moderate, 37%; Liberal, 22%; Very Liberal, 10%; Don’t Know/Prefer Not to Answer, 9%. Demographic groups that tilted somewhat more to Conservatism were seniors 65+ and Males. Relatively more Liberal were Females and Caucasians. �e disproportionately Moderate groups included O‘ahu residents, Japanese, and households earning $150,000 or more.
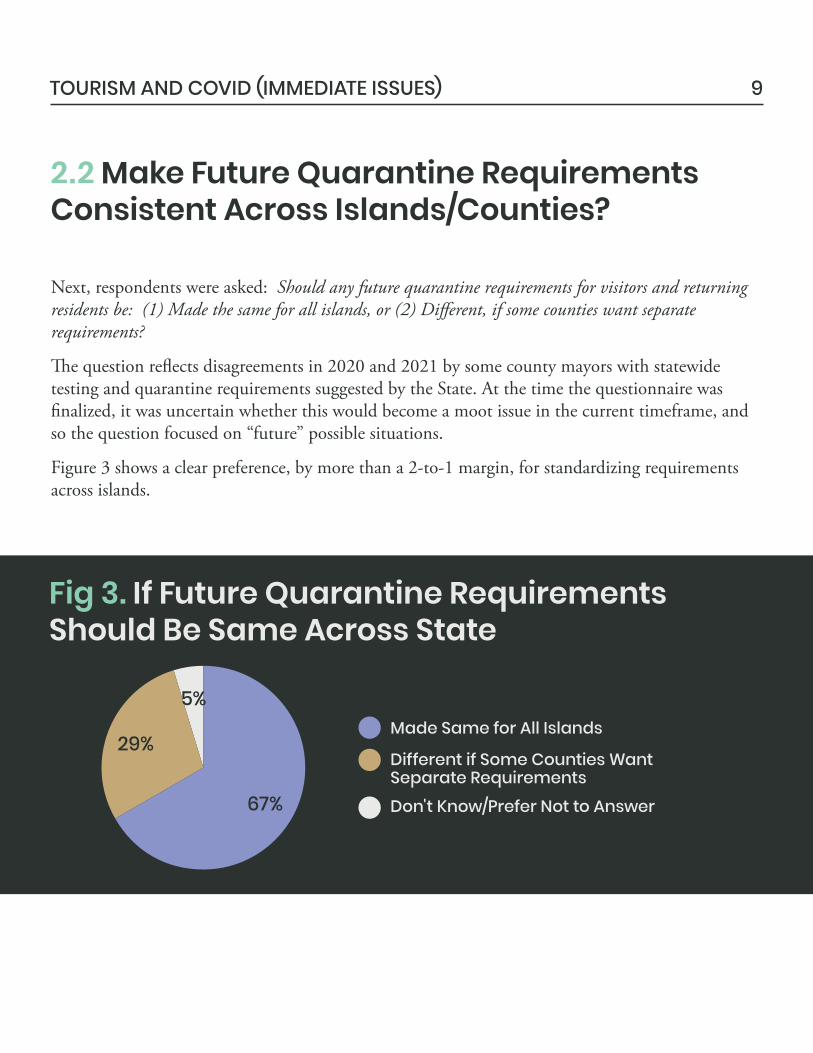
Fig 3. If Future Quarantine RequirementsShould Be Same Across State
2.2 Make Future Quarantine RequirementsConsistent Across Islands/Counties?
9TOURISM AND COVID (IMMEDIATE ISSUES)
Next, respondents were asked: Should any future quarantine requirements for visitors and returning residents be: (1) Made the same for all islands, or (2) Di�erent, if some counties want separate requirements?
�e question re�ects disagreements in 2020 and 2021 by some county mayors with statewide testing and quarantine requirements suggested by the State. At the time the questionnaire was �nalized, it was uncertain whether this would become a moot issue in the current timeframe, and so the question focused on “future” possible situations.
Figure 3 shows a clear preference, by more than a 2-to-1 margin, for standardizing requirements across islands.
Don't Know/Prefer Not to Answer
Different if Some Counties WantSeparate Requirements
Made Same for All Islands
67%
29%
5%
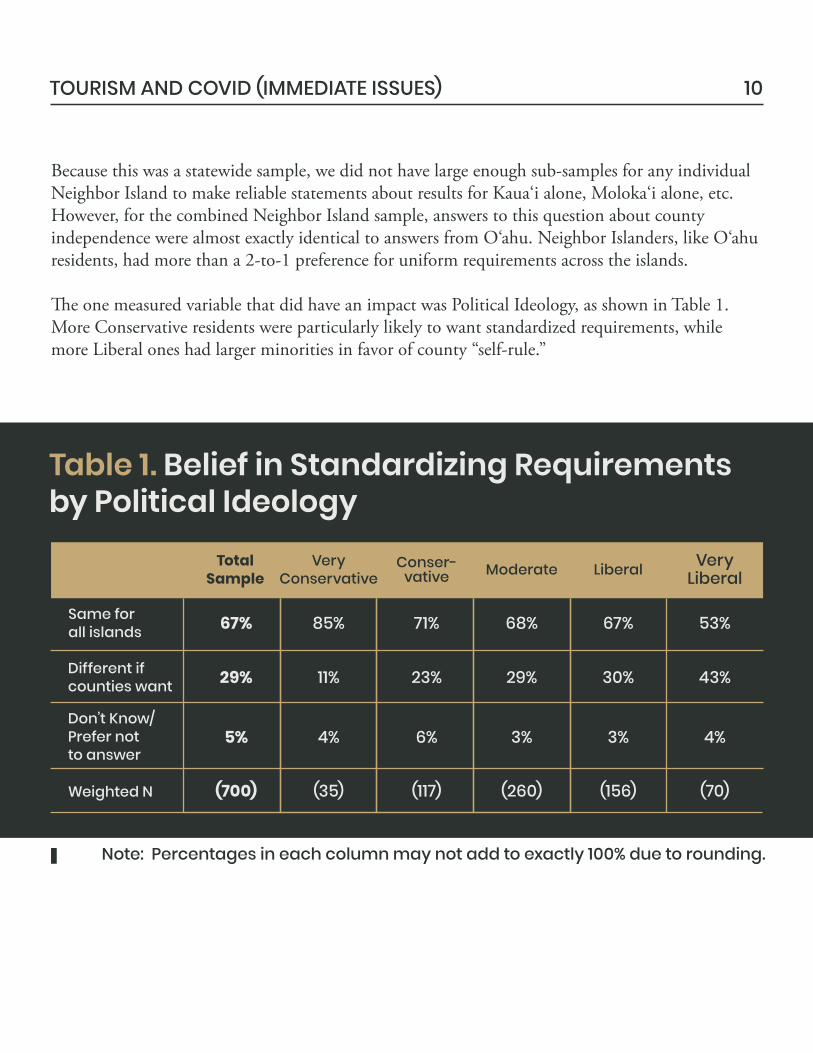
Because this was a statewide sample, we did not have large enough sub-samples for any individual Neighbor Island to make reliable statements about results for Kaua‘i alone, Moloka‘i alone, etc. However, for the combined Neighbor Island sample, answers to this question about county independence were almost exactly identical to answers from O‘ahu. Neighbor Islanders, like O‘ahu residents, had more than a 2-to-1 preference for uniform requirements across the islands.
�e one measured variable that did have an impact was Political Ideology, as shown in Table 1. More Conservative residents were particularly likely to want standardized requirements, while more Liberal ones had larger minorities in favor of county “self-rule.”
10TOURISM AND COVID (IMMEDIATE ISSUES)
67% 85% 71% 68% 67% 53%
29% 11% 23% 29% 30% 43%
5% 4% 6% 3% 3% 4%
(700) (35) (117) (260) (156) (70)
Same forall islands
Different ifcounties want
Don’t Know/Prefer notto answer
Weighted N
Table 1. Belief in Standardizing Requirementsby Political Ideology
TotalSample
VeryConservative
Conser-vative Moderate Liberal Very
Liberal
Note: Percentages in each column may not add to exactly 100% due to rounding.
2.3 How Rate State Government on COVIDSafety Requirements for Travel?
11TOURISM AND COVID (IMMEDIATE ISSUES)
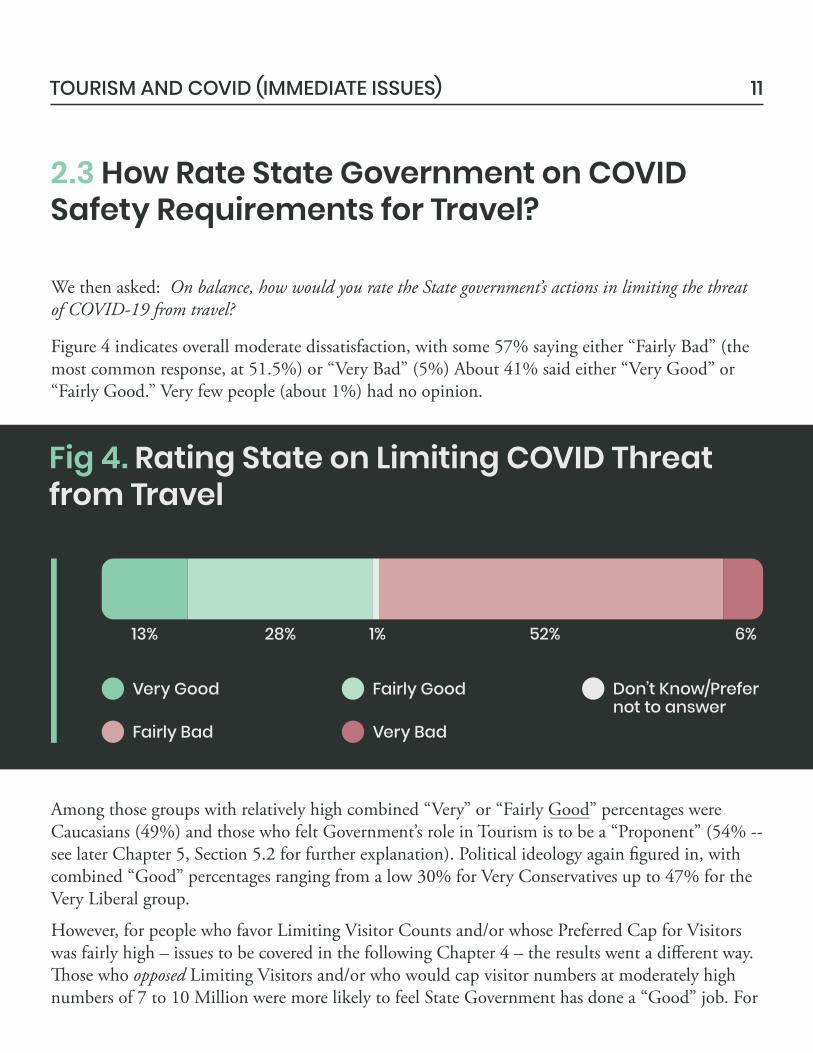
We then asked: On balance, how would you rate the State government’s actions in limiting the threat of COVID-19 from travel?
Figure 4 indicates overall moderate dissatisfaction, with some 57% saying either “Fairly Bad” (the most common response, at 51.5%) or “Very Bad” (5%) About 41% said either “Very Good” or “Fairly Good.” Very few people (about 1%) had no opinion.
Among those groups with relatively high combined “Very” or “Fairly Good” percentages were Caucasians (49%) and those who felt Government’s role in Tourism is to be a “Proponent” (54% -- see later Chapter 5, Section 5.2 for further explanation). Political ideology again �gured in, with combined “Good” percentages ranging from a low 30% for Very Conservatives up to 47% for the Very Liberal group.
However, for people who favor Limiting Visitor Counts and/or whose Preferred Cap for Visitors was fairly high – issues to be covered in the following Chapter 4 – the results went a di�erent way. �ose who opposed Limiting Visitors and/or who would cap visitor numbers at moderately high numbers of 7 to 10 Million were more likely to feel State Government has done a “Good” job. For
Fig 4. Rating State on Limiting COVID Threatfrom Travel
28%13% 52% 6%1%
Very Good Fairly Good
Fairly Bad Very Bad
Don’t Know/Prefernot to answer
2.4 Should State More Prioritize TourismRecovery or Economic Diversification?
example, 51% of those opposed to Limiting Visitors said “Good.” �is suggests people who would not cut tourism back greatly were happy with the visitor resurgence taking place as the survey was conducted.
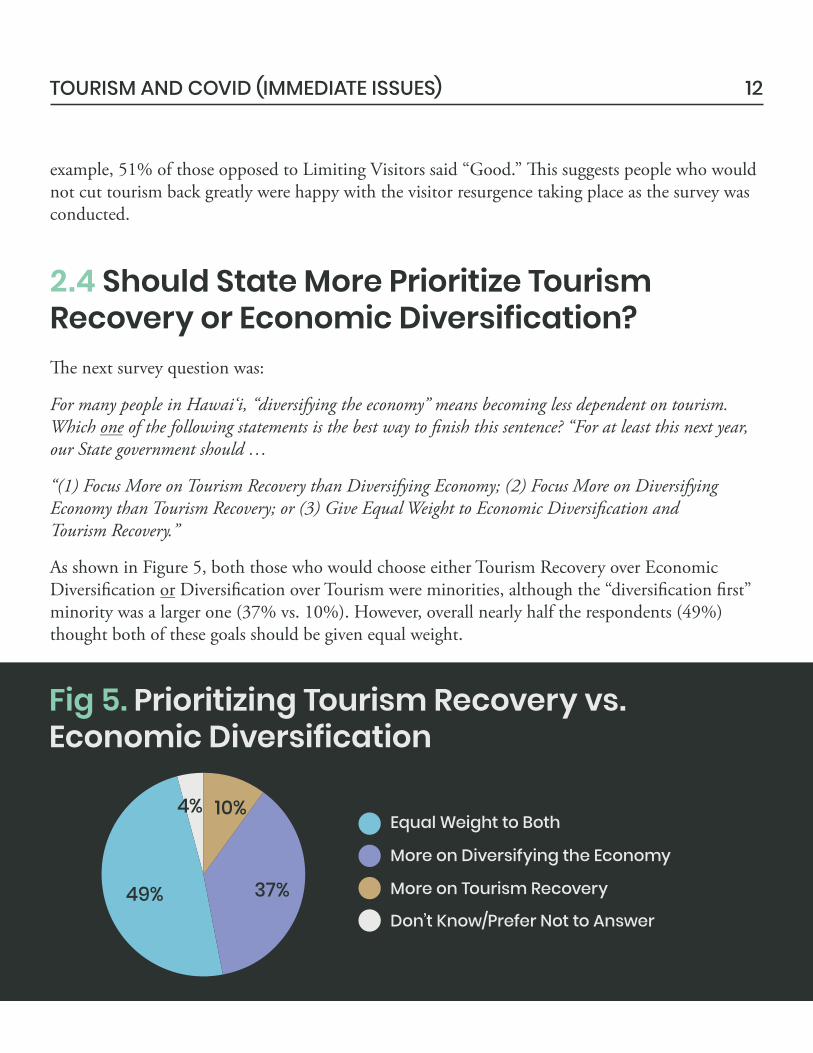
�e next survey question was:
For many people in Hawai‘i, “diversifying the economy” means becoming less dependent on tourism. Which one of the following statements is the best way to �nish this sentence? “For at least this next year, our State government should …
“(1) Focus More on Tourism Recovery than Diversifying Economy; (2) Focus More on Diversifying Economy than Tourism Recovery; or (3) Give Equal Weight to Economic Diversi�cation andTourism Recovery.”
As shown in Figure 5, both those who would choose either Tourism Recovery over Economic Diversi�cation or Diversi�cation over Tourism were minorities, although the “diversi�cation �rst” minority was a larger one (37% vs. 10%). However, overall nearly half the respondents (49%) thought both of these goals should be given equal weight.
12TOURISM AND COVID (IMMEDIATE ISSUES)
Fig 5. Prioritizing Tourism Recovery vs.Economic Diversification
Equal Weight to Both
More on Diversifying the Economy
More on Tourism Recovery
Don’t Know/Prefer Not to Answer49% 37%
10%4%
�ere were many di�erences among demographic and opinion groups for this particular question – more than for most questions in the entire survey. However, no group had more than 30% wanting State government to focus More on Tourism Recovery.
�ese relationships with results for other key tourism positions are logical … if one assumes that “Economic Diversi�cation” means not only adding other economic activities to tourism, but also scaling back on tourism itself.
13TOURISM AND COVID (IMMEDIATE ISSUES)
Groups relatively more likely to prioritize EconomicDiversification included:
Neighbor Islanders (47%, vs. 33% for O‘ahu)
Younger residents (50% for ages 18-29, declining to 33% for 65+)
Females (43%, vs. 30% for Males)
Very Liberals (53%, sliding down to 20% for Very Conservatives)
�ose who favored Limiting Visitors (51%, vs. 21% opposing a cap on tourist numbers)
�ose whose preferred tourism role for Government could be described as a “Tourism Regulator” (59%).
�ose whose Preferred Cap for tourists would be Under 5 Million (67%) or just 5-6 Million (53%)
2.5 What General Strategy Should StateAdapt for Marketing Tourism This Year?
14TOURISM AND COVID (IMMEDIATE ISSUES)
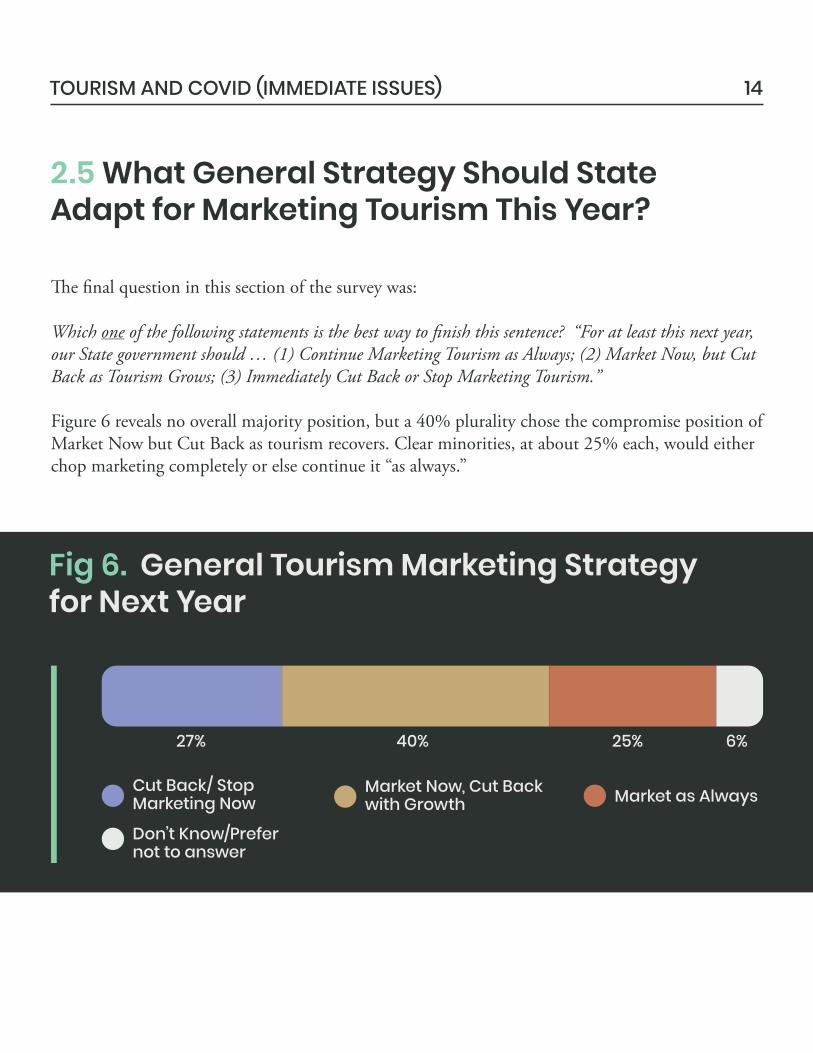
�e �nal question in this section of the survey was:
Which one of the following statements is the best way to �nish this sentence? “For at least this next year, our State government should … (1) Continue Marketing Tourism as Always; (2) Market Now, but Cut Back as Tourism Grows; (3) Immediately Cut Back or Stop Marketing Tourism.”
Figure 6 reveals no overall majority position, but a 40% plurality chose the compromise position of Market Now but Cut Back as tourism recovers. Clear minorities, at about 25% each, would either chop marketing completely or else continue it “as always.”
Fig 6. General Tourism Marketing Strategyfor Next Year
40%27% 25% 6%
Cut Back/ StopMarketing Now
Market Now, Cut Backwith Growth Market as Always
Don’t Know/Prefernot to answer
2.6 Transitional Wording to Rest of Survey
Cross-tabulations again showed many di�erences for this item, with people more likely to choose “Immediately Cut Back or Stop Marketing” coming largely from the same groups above that had been more likely to choose Economic Diversi�cation over Tourism Recovery as the preferred priority for State government:
�e opening section of the questionnaire ended with some key context for survey respondents (and readers of this report):
15TOURISM AND COVID (IMMEDIATE ISSUES)
Neighbor Islanders (35% Cut Back/Stop Marketing, vs. 24% for O‘ahu)
Very Liberals (38%, sliding down to 13% for Very Conservatives)
�ose who favored Limiting Visitors (40%, vs. 12% opposing a cap on tourist numbers)
�ose whose Preferred Cap for tourists would be Under 5 Million (56%) or just 5-6Million (45%)
�ose whose preferred tourism role for Government could be described as “Regulator” (49%)
The rest of the survey is about tourism in “normal” times. We do not know if tourism will eventually go back to the way it was in 2018 and 2019, because there may be changes in what travelers want or in which travel-related businesses survive the pandemic. But for now, please assume future Hawai‘i tourism would gradually go back to roughly the way it was in 2018-19, unless there are changes in government actions.
Also, please note: In this survey, we use the terms “tourists/tourism” and “visitors/ visitor industry” to mean the same things.
�is section of the questionnaire began with the following advisory to those completing the survey:
This section is about core values and principles you would like to see State and county agencies follow when they make decisions about tourism in normal times. That would include both the Hawai‘i Tourism Authority and also every other State/county department involved in transportation, natural resources, planning and zoning, etc.
16
3. GOVERNMENT VALUES ANDPRINCIPLES FOR TOURISM
Knox, Moore
MANAGING TOURISM IN HAWAI‘I
�is �rst survey section about tourism in “normal” times was something of a warm-up exercise, and looked at selected values and principles for guiding government tourism policies in Hawai‘i.
Results in this chapter show:
Of six selected principles/values, all earned majority support – but support was clearly stronger for a visitor industry that (a) improves rather than depletes natural and cultural resources (i.e., the idea of “regenerative tourism”); (b) markets to “respectful” visitors; and (c) assures jobs that provide a “living wage.”
When people were further asked to choose the most important of the listed items, these three were also the most selected.
Still supported, but at distinctly lower levels, were (d) generating the most possible tax dollars; (e) growing tourist dollars rather than tourist numbers; and (f ) given competition among resort areas, avoiding actions that negatively a�ects Hawai‘i’s image.
3.1 What Values and Principles Should theState Normally Apply to Tourism?
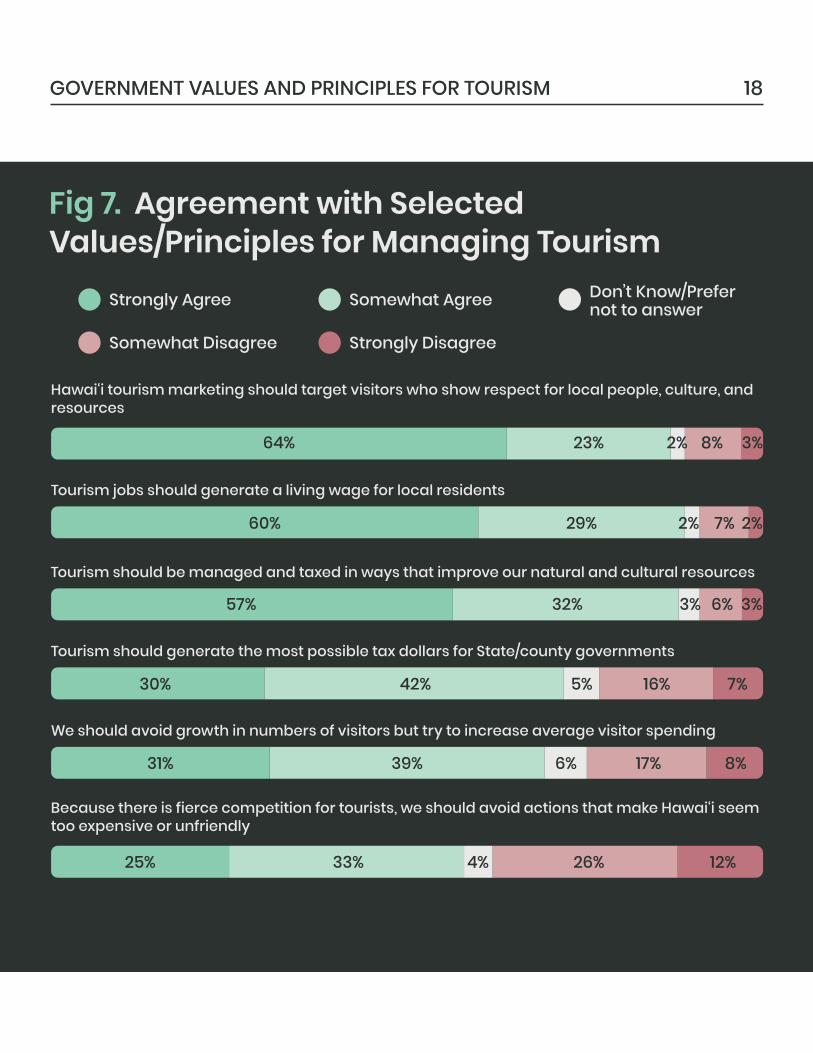
�is short multi-part survey question began by presenting respondents – in random order, to reduce any bias from presentation order – with six selected possible key criteria for guiding government tourism policy, asking for agreement/disagreement on each. Obviously, many other principles and values could also be important, but we believe these six have been particularly stressed in media discussions recently and/or over the years.
As shown in Figure 7, there was overall majority agreement with all six statements, but clearly greater enthusiasm for:
�e only substantial level of disagreement (still just 38%) was with the idea that we need to avoid making Hawai‘i seem “too expensive or unfriendly” to visitors.
17GOVERNMENT VALUES AND PRINCIPLES FOR TOURISM
Marketing to a tourism segment that shows more “respect” for Hawai‘i;
Tourism jobs that provide a “living wage;”6 and
�e “Regenerative Tourism” concept of actually improving natural/cultural resources.
6It should be noted that Hawai‘i hotel jobs pay higher wages than in other U.S. cities, though there is debate about whether the di�erence is enough to cover higher living costs here.
Hawai‘i tourism marketing should target visitors who show respect for local people, culture, and resources
64% 8%23%
Tourism jobs should generate a living wage for local residents
2%7%29%60%
Because there is fierce competition for tourists, we should avoid actions that make Hawai‘i seem too expensive or unfriendly
25% 33% 26% 12%
We should avoid growth in numbers of visitors but try to increase average visitor spending
31% 39% 17% 8%
Tourism should generate the most possible tax dollars for State/county governments
30% 42% 16% 7%
Tourism should be managed and taxed in ways that improve our natural and cultural resources
57% 32% 6% 3%
2%
2%
4%
6%
5%
3%
Strongly Agree Somewhat Agree
Somewhat Disagree Strongly Disagree
Don’t Know/Prefernot to answer
Fig 7. Agreement with SelectedValues/Principles for Managing Tourism
18GOVERNMENT VALUES AND PRINCIPLES FOR TOURISM
3%
3.2 Which of These Are the “Most Important”Values/Principles?
64% 64% 51% 61% 76% 77%
60% 62% 41% 55% 73% 80%
(700) (35) (117) (260) (156) (70)
Hawai‘i tourismmarketing shouldtarget visitors whoshow respect forlocal people, culture, andresources
Tourism jobs shouldgenerate a livingwage for localresidents
Weighted N
Table 2. Selected Group Differences –Values/Principles for Managing Tourism
TotalSample
% “Strongly Agree”for Sample Items:
VeryConservative
Conser-vative Moderate Liberal Very
Liberal
Note: The “Very Conservative” results sometimes, as here, do not seem to fall into the otherwiseclear spectrum from Conservative to Very Liberal. However, the “Very Conservative” sample size isquite small, and so the error range would be large for this group.
19GOVERNMENT VALUES AND PRINCIPLES FOR TOURISM
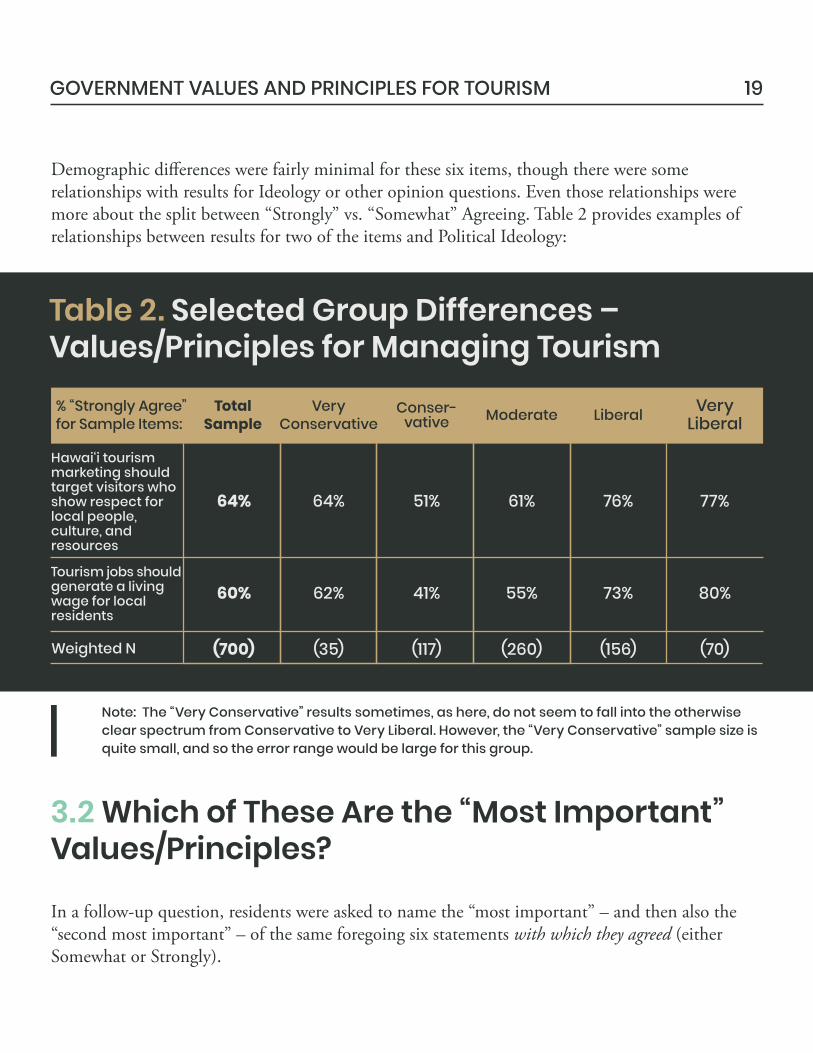
Demographic di�erences were fairly minimal for these six items, though there were some relationships with results for Ideology or other opinion questions. Even those relationships were more about the split between “Strongly” vs. “Somewhat” Agreeing. Table 2 provides examples of relationships between results for two of the items and Political Ideology:
In a follow-up question, residents were asked to name the “most important” – and then also the “second most important” – of the same foregoing six statements with which they agreed (either Somewhat or Strongly).
20GOVERNMENT VALUES AND PRINCIPLES FOR TOURISM
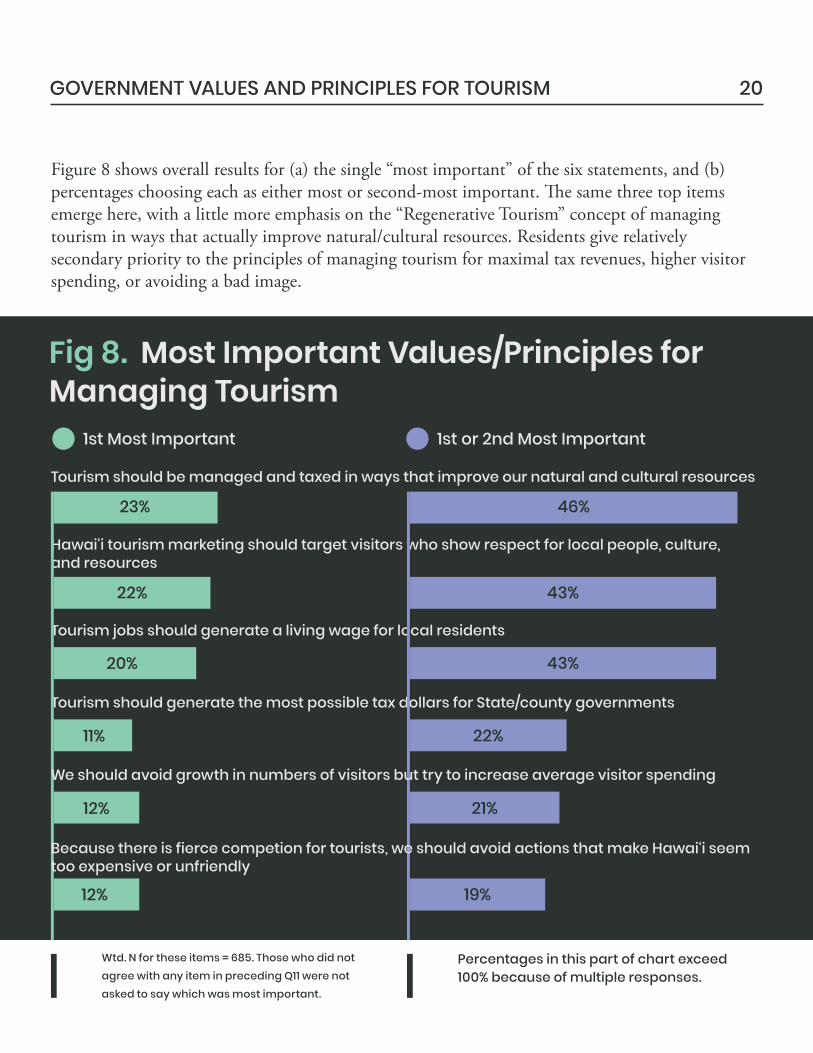
Figure 8 shows overall results for (a) the single “most important” of the six statements, and (b) percentages choosing each as either most or second-most important. �e same three top items emerge here, with a little more emphasis on the “Regenerative Tourism” concept of managing tourism in ways that actually improve natural/cultural resources. Residents give relatively secondary priority to the principles of managing tourism for maximal tax revenues, higher visitor spending, or avoiding a bad image.
1st Most Important 1st or 2nd Most Important
Fig 8. Most Important Values/Principles forManaging Tourism
Tourism should be managed and taxed in ways that improve our natural and cultural resources
46%
Hawai‘i tourism marketing should target visitors who show respect for local people, culture,and resources
43%
Tourism jobs should generate a living wage for local residents
43%
Tourism should generate the most possible tax dollars for State/county governments
22%
21%
23%
22%
20%
11%
12%
12% 19%
Wtd. N for these items = 685. Those who did not agree with any item in preceding Q11 were not asked to say which was most important.
Percentages in this part of chart exceed 100% because of multiple responses.
We should avoid growth in numbers of visitors but try to increase average visitor spending
Because there is fierce competion for tourists, we should avoid actions that make Hawai‘i seem too expensive or unfriendly
21GOVERNMENT VALUES AND PRINCIPLES FOR TOURISM
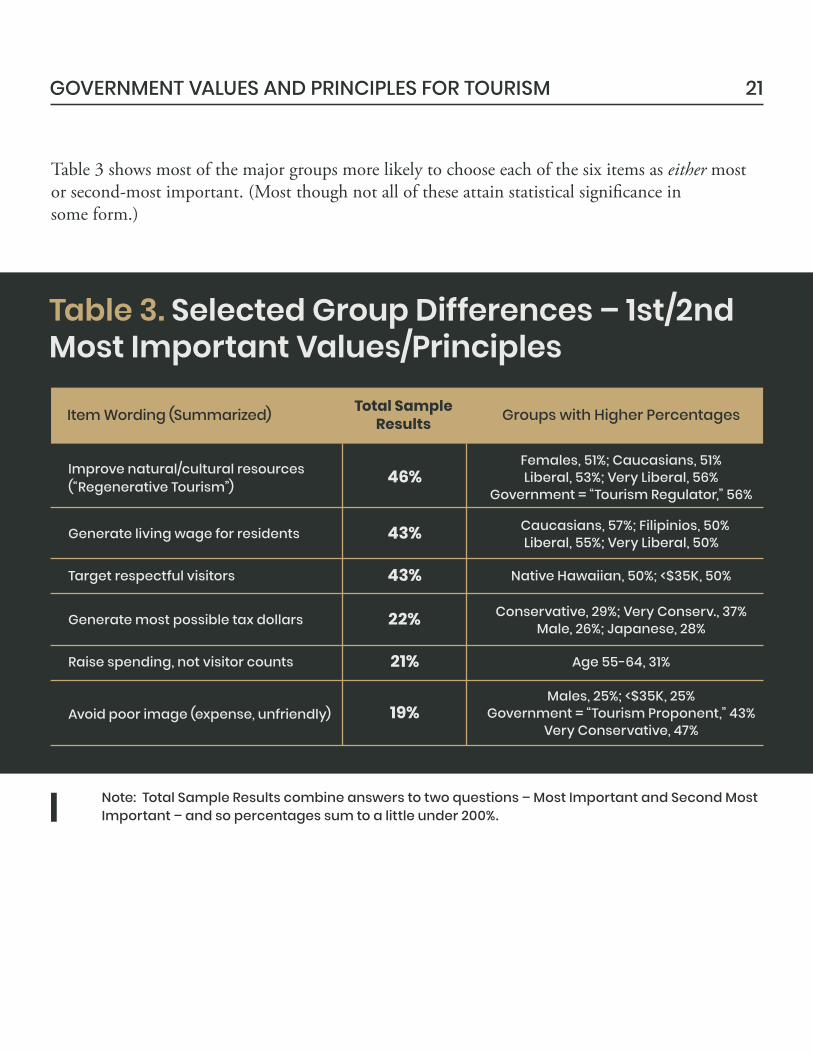
Table 3 shows most of the major groups more likely to choose each of the six items as either most or second-most important. (Most though not all of these attain statistical signi�cance insome form.)
46%Females, 51%; Caucasians, 51%
Government = “Tourism Regulator,” 56%Liberal, 53%; Very Liberal, 56%Improve natural/cultural resources
(“Regenerative Tourism”)
Table 3. Selected Group Differences – 1st/2ndMost Important Values/Principles
Item Wording (Summarized) Total SampleResults Groups with Higher Percentages
43% Caucasians, 57%; Filipinios, 50%Liberal, 55%; Very Liberal, 50%Generate living wage for residents
43% Native Hawaiian, 50%; <$35K, 50%Target respectful visitors
22% Conservative, 29%; Very Conserv., 37%Male, 26%; Japanese, 28%Generate most possible tax dollars
21% Age 55-64, 31%Raise spending, not visitor counts
19%Males, 25%; <$35K, 25%
Government = “Tourism Proponent,” 43%Very Conservative, 47%
Avoid poor image (expense, unfriendly)
Note: Total Sample Results combine answers to two questions – Most Important and Second MostImportant – and so percentages sum to a little under 200%.
22
4. POLICIES ABOUT “SIZE” OFHAWAI‘I TOURISM
Knox, Moore
MANAGING TOURISM IN HAWAI‘I
Although policy makers also debate ways to change the nature or quality of tourism, it has been quantity of visitors of which residents seem most aware.
Sometimes this has been generalized to concerns about pure numbers of visitors and a desire to, somehow, limit those overall arrival numbers. Sometimes it has focused more on certain crowded “hot spots” generating particular resident frustration. Practically, State-level policy makers face serious challenges in trying to limit overall numbers due to the U.S. Constitution, but questions in this section attempt to measure the strength of resident desires to take actions at either of those levels.
Overall results of this chapter suggest residents would generally respondwell to a clear focus on “hot spot” management, but the push for somehowcapping visitor numbers is not likely to dissipate quickly:
“If it were possible,” about 52% would prefer limiting/capping the number of visitors, with even stronger support on Neighbor Islands and among Native Hawaiians.
�ere appears to be growing recognition that growth in resident numbers contributes to a sense of “crowding” in the Islands, but tourists still get relatively more blame.
“If possible to do so,” a similar 52% would drop the visitor level substantially from that experienced in 2019. Again, feelings were even stronger among Hawaiians andNeighbor Islanders.
23POLICIES ABOUT “SIZE” OF HAWAI‘I TOURISM
Residents would be happy to see tourists charged and/or required to make advance reservations at parks or other “hot spots,” but far less happy to have to do the same. Possible exception: Two-thirds would support a “a statewide reservation management system for both residents and visitors” for crowded parks or other public attractions.
However, forced to choose the better general strategy – “hot spot” management or capping visitor counts – residents chose the �rst over the second, 57% to 37%. Still, limiting visitors was the majority preference for certain groups, once more including Neighbor Islanders and Native Hawaiians.
Respondents taking the survey were at this point advised:
This section looks at issues about tourism size – that is, how many out-of-state visitors come here and/or overcrowd or “take over” particular places shared with residents. Again, we are asking about normal times, not the pandemic.
4.1 If It Were Possible, Would Residents FavorLimits on Numbers of Tourists?
�e �rst question in this section was: If it were possible, would you favor some State or county government action that limits the number of visitors coming to Hawai‘i or to particular islands? 7
7 We considered also asking if people believe this is actually possible, but did not do so because this is more a matter of law than of belief or local policy. In fact, under the U.S. Constitution, it would be di�cult or impossible to impose limits on travel between U.S. states. �e question was posed not because this seems a realistic policy option, but rather because it is often the �rst thing mentioned in tourism debates.
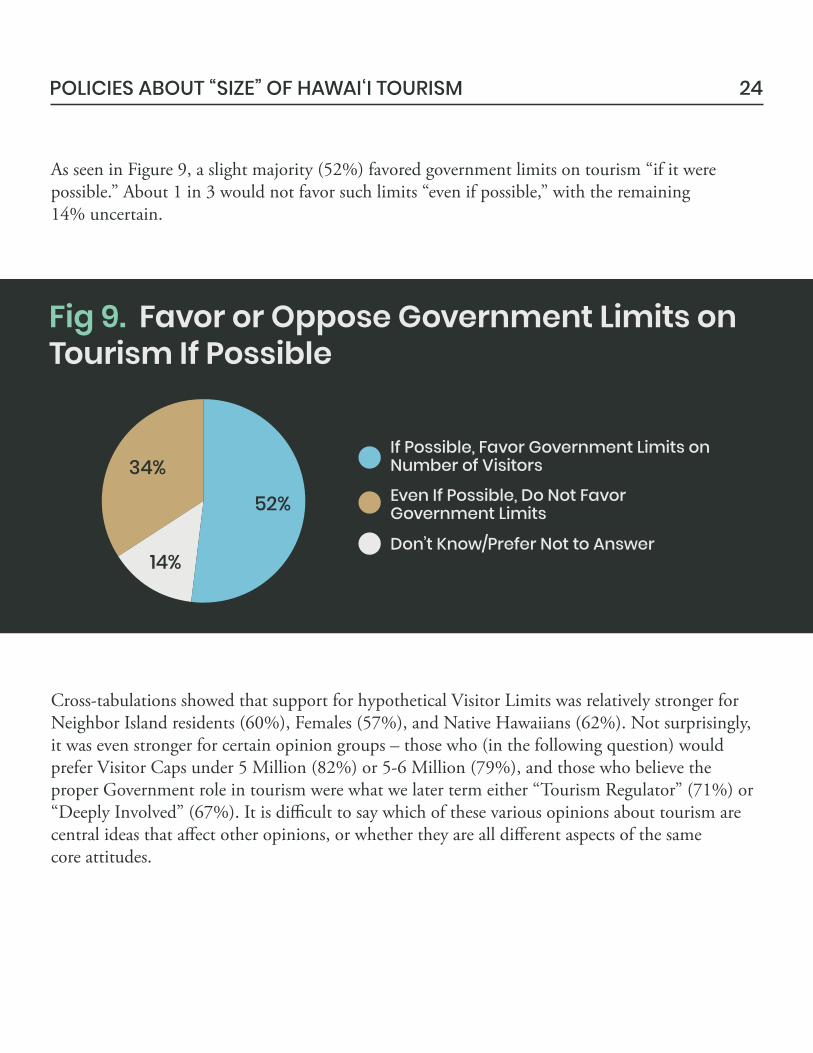
Fig 9. Favor or Oppose Government Limits onTourism If Possible
As seen in Figure 9, a slight majority (52%) favored government limits on tourism “if it were possible.” About 1 in 3 would not favor such limits “even if possible,” with the remaining14% uncertain.
Cross-tabulations showed that support for hypothetical Visitor Limits was relatively stronger for Neighbor Island residents (60%), Females (57%), and Native Hawaiians (62%). Not surprisingly, it was even stronger for certain opinion groups – those who (in the following question) would prefer Visitor Caps under 5 Million (82%) or 5-6 Million (79%), and those who believe the proper Government role in tourism were what we later term either “Tourism Regulator” (71%) or “Deeply Involved” (67%). It is di�cult to say which of these various opinions about tourism are central ideas that a�ect other opinions, or whether they are all di�erent aspects of the samecore attitudes.
24
If Possible, Favor Government Limits onNumber of Visitors
Even If Possible, Do Not FavorGovernment Limits
Don’t Know/Prefer Not to Answer
52%
14%
34%
POLICIES ABOUT “SIZE” OF HAWAI‘I TOURISM
25
4.2 If Limiting Numbers Were Possible, HowMany Tourists Should Be Allowed?
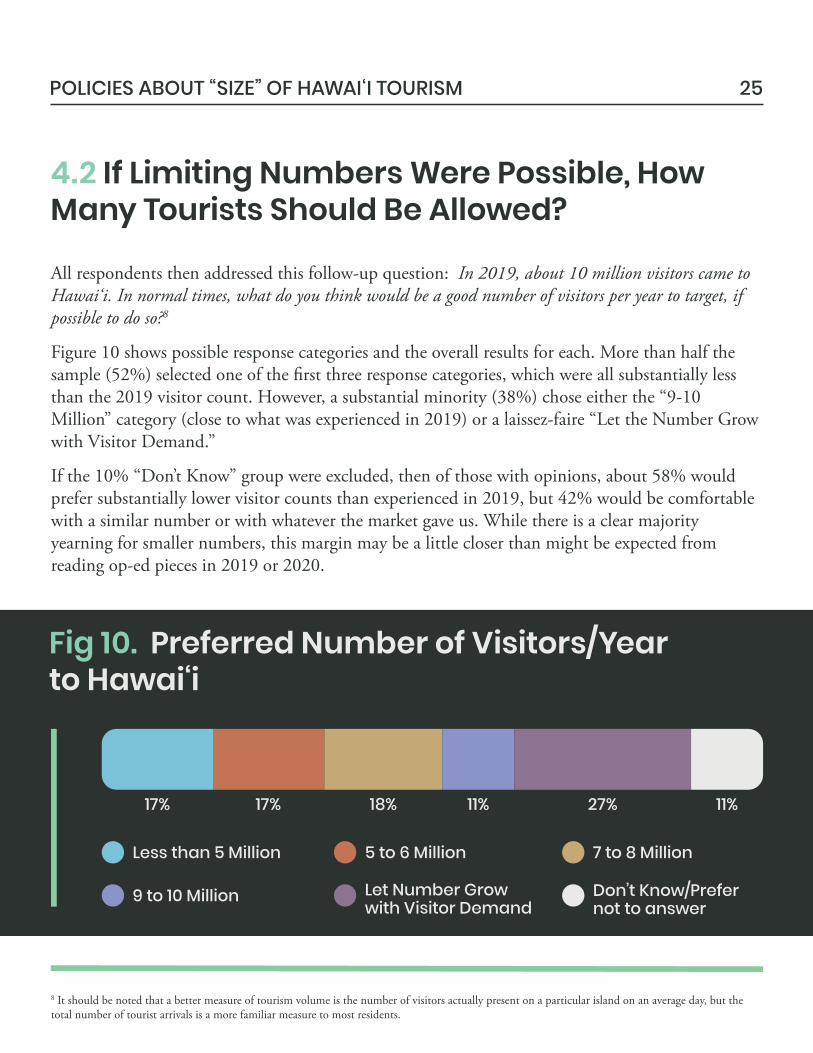
All respondents then addressed this follow-up question: In 2019, about 10 million visitors came to Hawai‘i. In normal times, what do you think would be a good number of visitors per year to target, if possible to do so?8
Figure 10 shows possible response categories and the overall results for each. More than half the sample (52%) selected one of the �rst three response categories, which were all substantially less than the 2019 visitor count. However, a substantial minority (38%) chose either the “9-10 Million” category (close to what was experienced in 2019) or a laissez-faire “Let the Number Grow with Visitor Demand.”
If the 10% “Don’t Know” group were excluded, then of those with opinions, about 58% would prefer substantially lower visitor counts than experienced in 2019, but 42% would be comfortable with a similar number or with whatever the market gave us. While there is a clear majority yearning for smaller numbers, this margin may be a little closer than might be expected from reading op-ed pieces in 2019 or 2020.
8 It should be noted that a better measure of tourism volume is the number of visitors actually present on a particular island on an average day, but the total number of tourist arrivals is a more familiar measure to most residents.
Fig 10. Preferred Number of Visitors/Yearto Hawai‘i
18%17% 17% 11% 27% 11%
Less than 5 Million 5 to 6 Million 7 to 8 Million
9 to 10 Million Let Number Growwith Visitor Demand
Don’t Know/Prefernot to answer
POLICIES ABOUT “SIZE” OF HAWAI‘I TOURISM
26
Cross-tabulations show that respondents relatively more comfortable with large tourist numbers and growth – choosing either 9-10 Million or “Grow with Demand” – were Males (49%, vs. 30% for Females); Conservatives (45%) or Very Conservatives (54%); and those who see Government’s proper tourism role as what we will term “Laissez-Faire” (62%) or tourism “Proponent” (69%). �ese numbers compare to the overall sample 38%.
By contrast, some groups had higher proportions who would cut back visitor numbers to one of the �rst two categories – i.e., 6 Million or less. �ese included Neighbor Islanders (45%, vs. O‘ahu 30%); Native Hawaiians (46%); the least a�uent households, under $35K (48%); and, expectably, those who answered the previous question by saying they would favor limits on visitor counts (52%, vs. just 10% for those opposing them). �ese numbers compare to the overall sample 34%.
Some Hawai‘i residents discovered during the 2020 lockdown that popular parks, trails, or country highways were still fairly congested despite the lack of tourists. �is raises the possibility that visitors are sometimes blamed for “crowding” – in general or at particular places – when much of the growth over time has really come from a burgeoning residential population.
We were curious about what residents currently think, and so our next question was:
Which one of the following statements is the best way to �nish this sentence? “To the extent that this island felt too crowded before the COVID pandemic …
“(1) Growth in Tourist Numbers Was Mostly Responsible; (2) Growth in Resident Population Was Mostly Responsible; (3) Growth in Tourists and Residents Were Equally Responsible; (4) Residents Caused Most, but Tourists Pushed Us Over a Tipping Point; (5) Don’t Believe �is Island Feels Too Crowded.”
In reality, the visitor population has lately been growing faster than the resident population on a percentage basis, but resident growth has been greater on an absolute-number basis. Figure 11 indicates that tourists tend to get the blame for any “too crowded” feeling (and only 11% disagreed that their island was overcrowded). Some 37% said visitors were mostly responsible, versus only 11% saying residents were mostly responsible.
4.3 Is Sense of Island “Crowding” Due More toTourists or to Residents?
POLICIES ABOUT “SIZE” OF HAWAI‘I TOURISM

27
However, there was nuance in the answers, because 27% said both groups were equally responsible and another 10% said it was mostly residents but that tourists pushed the population over a tipping point to feeling crowded. It is very possible that these results are a point-in-time measurement of shifting perceptions, and it will be interesting to see if there are changes should this survey question be repeated in any future research.
�is was another item that generated di�erent answers from di�erent groups. �ose who were relatively more likely to say Tourist Growth Mostly Responsible (37% in overall sample) included:
Fig 11. If “Crowding” Due More to Visitorsor Residents
27%37% 11% 10% 11% 5%
Mostly Tourist Growth Mostly ResidentGrowth Equally Responsible
Tourists WereTipping Point
Island Not TooCrowded
Don’t Know/PreferNot to Answer
Neighbor Islanders (42%, vs. O‘ahu 34% -- a modest but statistically signi�cant di�erence);
Females (42%, vs. Male 29%);
�ose who thought Government’s tourism role should be a “Regulator” (56%).
�ose who would want Limits on Visitors if possible (47%, vs. 24% for opponents of avisitor cap);
�ose whose Preferred Visitor Cap was very low, either Under 5 Million (61%) or 5-6 Million (46%);
POLICIES ABOUT “SIZE” OF HAWAI‘I TOURISM
28
�e other response category with a number of smaller but still signi�cant di�erences among demographic and opinion groups was Don’t Believe Island Too Crowded (just 11% foroverall sample):
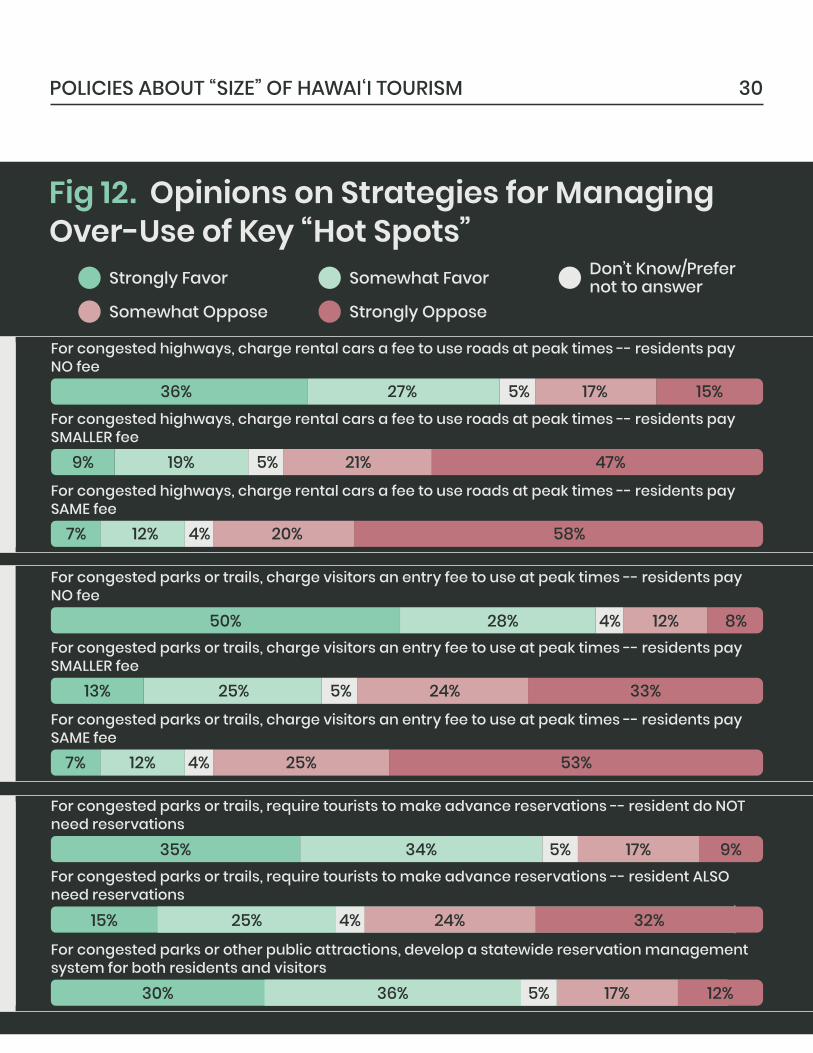
We then focused on the issue of particularly crowded places (“hot spots”) often associated with visitor use. We asked about attitudes toward nine possible strategies – presented in randomized order – involving entry fees or limited access via reservation systems. �ese tools are now used for some Hawai‘i parks, but not very many yet, and there is no current cost for using popular rural roads such as the Hāna Highway.
Question wording: Some concerns about “too many tourists” are more about crowding or congestion of particular places – beach parks, roads, hiking trails, etc. All of these are also used by residents. Please tell us if you generally favor or oppose each of the following possible ways to control over-use of particular places. (Note that fees or reservations today usually are done by technology, like smart-phone apps.)
Figure 12 shows a perhaps expectable pattern: Residents show strong support for “hot spot” management through fees or reservation systems so long as the crowded parks, trails, or crowded highways remain freely available to people who live here. Support quickly drops if residents must also make reservations or pay any fee, even if smaller than that charged to tourists. And for systems
People aged 65+ (22%);
Political Conservatives (20%);
�ose who do not favor Limits on Visitors (20%);
�ose who would let tourism grow with demand, no Preferred Cap (24%);
�ose who thought Government’s tourism should be what we term either “Laissez-Faire” (20%) or tourism “Proponent” (23%).
4.4 Pricing and Reservation Strategies forParticular Congested “Hot Spots”
POLICIES ABOUT “SIZE” OF HAWAI‘I TOURISM
requiring residents to pay fees the “same” as those for tourists, support falls below the 20% level.
�is is signi�cant, because – while recognizing that some community groups and individuals do take on stewardship responsibilities for certain beaches and wahi pana – in general, reefs and trails and roads deteriorate from over-use by anyone, not just tourists. Many economists would argue that user fees should be paid by any user, not just some. �e majority of residents now think otherwise, though.
One exception: Two-thirds would support a “a statewide reservation management system for both residents and visitors” for crowded parks or other public attractions. �is is more than would support reservation requirements for residents at all. We tentatively interpret this as re�ecting values of “fairness” in sharing recreational assets with visitors – many people feel it fair to give preference to resident use, but reservation systems may at least give a sense of assurance that tourists would not unfairly take over contested recreational areas.
29POLICIES ABOUT “SIZE” OF HAWAI‘I TOURISM
For congested highways, charge rental cars a fee to use roads at peak times -- residents payNO fee
Strongly Favor Somewhat Favor
Somewhat Oppose Strongly Oppose
Don’t Know/Prefernot to answer
Fig 12. Opinions on Strategies for ManagingOver-Use of Key “Hot Spots”
For congested highways, charge rental cars a fee to use roads at peak times -- residents pay SMALLER fee
For congested highways, charge rental cars a fee to use roads at peak times -- residents pay SAME fee
For congested parks or trails, charge visitors an entry fee to use at peak times -- residents pay NO fee
64%For congested parks or trails, charge visitors an entry fee to use at peak times -- residents pay SMALLER fee
64%For congested parks or trails, charge visitors an entry fee to use at peak times -- residents pay SAME fee
For congested parks or trails, require tourists to make advance reservations -- resident do NOT need reservations
64%
For congested parks or trails, require tourists to make advance reservations -- resident ALSO need reservations
64%For congested parks or other public attractions, develop a statewide reservation management system for both residents and visitors
30
36% 27% 17% 15%
58%20%12%7%
28% 8%12%50%
25% 33%24%13%
12% 53%25%7%
25% 32%24%15%
34% 9%17%35%
36% 12%17%30%
47%21%19%9%
POLICIES ABOUT “SIZE” OF HAWAI‘I TOURISM
5%
5%
4%
4%
5%
4%
4%
5%
5%
31
We examined cross-tabulations to search for pockets of strong support for residents paying same fee or being otherwise subject to the same new requirements. We found little worth highlighting. Certain groups – the young, Native Hawaiians, or low-income – had stronger minority support for residents paying equal fees, but still nowhere approaching majorities.
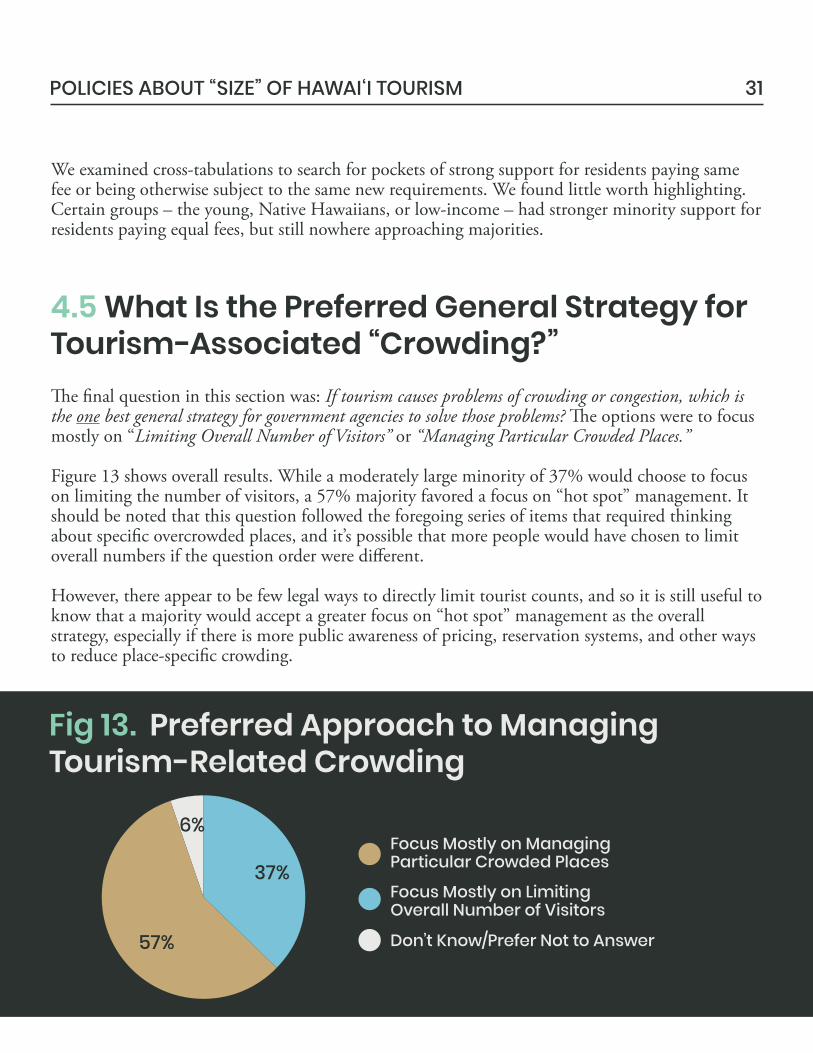
�e �nal question in this section was: If tourism causes problems of crowding or congestion, which is the one best general strategy for government agencies to solve those problems? �e options were to focus mostly on “Limiting Overall Number of Visitors” or “Managing Particular Crowded Places.”
Figure 13 shows overall results. While a moderately large minority of 37% would choose to focus on limiting the number of visitors, a 57% majority favored a focus on “hot spot” management. It should be noted that this question followed the foregoing series of items that required thinking about speci�c overcrowded places, and it’s possible that more people would have chosen to limit overall numbers if the question order were di�erent.
However, there appear to be few legal ways to directly limit tourist counts, and so it is still useful to know that a majority would accept a greater focus on “hot spot” management as the overall strategy, especially if there is more public awareness of pricing, reservation systems, and other ways to reduce place-speci�c crowding.
4.5 What Is the Preferred General Strategy forTourism-Associated “Crowding?”
Fig 13. Preferred Approach to ManagingTourism-Related Crowding
Focus Mostly on ManagingParticular Crowded Places
Focus Mostly on LimitingOverall Number of Visitors
Don’t Know/Prefer Not to Answer
37%
57%
6%
POLICIES ABOUT “SIZE” OF HAWAI‘I TOURISM
32
At the same time, it should be recognized that, in this case, there are some key groups in which majorities would choose to focus on the “cleaver” approach of limiting overall numbers rather than the “scalpel” of managing particularly crowded places:
Slightly more than 50% of Native Hawaiians wanted government to focus more on limiting numbers than simply managing particular places, whereas a majority of every other ethnic groups chose “hot spot” management. �e concerns of Native Hawaiians about tourism have received increasing attention in recent years, so this di�erence is worth noting.
Most critically, a 52% majority of Neighbor Islanders would choose a general cap on visitor numbers, compared to just 31% on O‘ahu. �is likely re�ects the much greater ratio of visitors to residents on most of these islands, especially Maui and Kaua‘i. Although “hot spot” management appears the more practical of the two strategies, it may be harder to persuade residents of that in places where sheer numbers of visible tourists make a strong impression almost every day.
�e following Chapter 5 sorts resident beliefs about proper Government oversight of tourism into four groups: “Tourism Regulators,” who think Government should control tourism more than other industries but not help it more; “Tourism Proponents,” who think exactly the opposite; “Laissez-Faire,” who think Government should neither help nor control tourism more than any other business; and “Deeply Involved,” who think Government should both help and control tourism more than other businesses.
“Regulators,” while not a majority, are the largest single group, and 58% of them favor avisitor cap.
POLICIES ABOUT “SIZE” OF HAWAI‘I TOURISM
5. PROPER GOVERNMENTACTIONS TO REGULATE TOURISM
Knox, Moore
MANAGING TOURISM IN HAWAI‘I 33
Beyond the size/volume issues, local government is involved with the visitor industry and many other types of businesses in ways that involve both regulation/control and also help/support. �is raises broad questions of political philosophy and also opinions about speci�c possible actions.
Results in this chapter highlight certain ways in which Hawai‘i residents have very different opinions about “Destination Management” actions, and other ways in which there is strong consensus:
Excluding those who said “Don’t Know,” residents by a 2-to-1 margin said Government should control or regulate tourism more than other businesses, and by a similar 2-to-1 margin said Government should not try to help or support tourism more than other businesses.
Combining answers to those two questions divides people into four groups, which we have labeled “Laissez-Faire” (neither control nor help more), “Tourism Proponent” (help more, not control more), “Tourism Regulator” (control more, not help more), and “Deeply Involved” (both control and help more).
No group was a majority, but the group who thought Government should be a “Regulator” was by far the largest, while the “Proponent” group was the smallest. �e “Regulator” group was relatively more politically Liberal; the “Proponent” group, more Conservative; and the “Laissez-Faire” group, more Moderate.
34PROPER GOVERNMENT ACTIONS TO REGULATE TOURISM
Allowing casino gambling was the only one of seven selected possible actions to be opposed by a majority (52%). However, 42% favored it, including 55% of Males.
Particularly strong support, at levels of roughly 80% “strongly” or “somewhat” favoring, were evident for regulating tour operations in public parks, strict green-energy requirements for resort areas, and testing some tourism businesses for accuracy of cultural/historical information.
Support for regulating vacation rentals outside resort areas was nearly as strong, at about 75%.
Respondents taking the survey saw this lead-in language:
This section is about ways that government might – in normal times – control, influence, or “regulate” different aspects of tourism (other than the “size/crowding” ideas already asked about). Depending on the situation, “Government” could mean the Hawai‘i Tourism Authority or any other State/county agency.
5.1 Should Government Control/RegulateTourism More than Other Businesses?
�e State long ago established a Dept. of Agriculture when Hawai‘i was still largely a plantation economy, and the Hawai‘i Tourism Authority has been in existence for more than 20 years. However, we were curious how many residents think it appropriate or inappropriate to give tourism “special treatment” when it comes to additional controls and regulation.
So the �rst question in this section was: With which of these statements do you most agree? Options were (a) Government should not try to control or regulate tourism more than any other types of business; or (b) Government needs to control or regulate tourism more than other businesses.
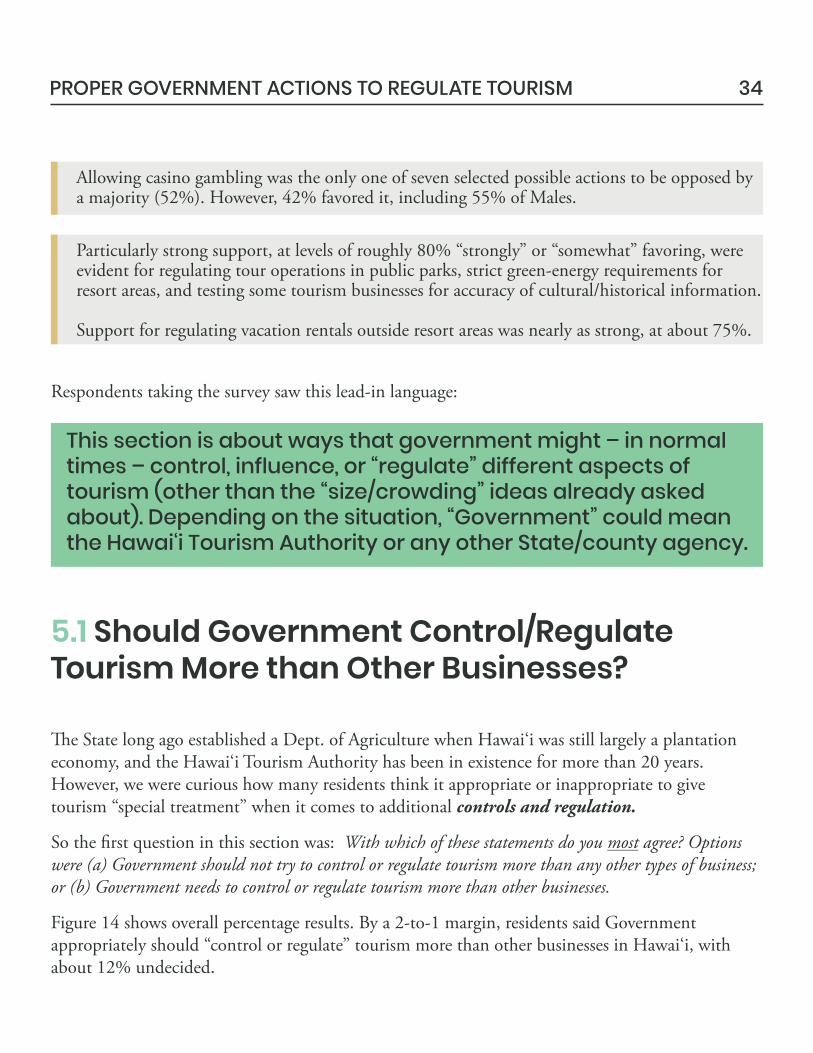
Figure 14 shows overall percentage results. By a 2-to-1 margin, residents said Government appropriately should “control or regulate” tourism more than other businesses in Hawai‘i, with about 12% undecided.
Females chose “regulate more” by even stronger majorities (65%, vs. 53% for Males). Political ideology was also heavily correlated with answers, with the proportion choosing “regulate more” steadily increasing from 50% for the Very Conservatives to 78% for the Very Liberals.
Strong relationships also emerged, expectably, with answers to key opinion questions. �ose who favored visitor limits “if possible” strongly tended to answer this later question by saying “regulate more” (77%, vs. just 40% for those who would not cap visitor counts). And those would cut tourism below 7 Million were even more likely to say “regulate more” (82%, vs. just 42% for those who would keep tourism at 9-10 Million or have no restrictions. Again, though, it is unclear whether there was any causal direction among these attitudes.
Fig 14. If Tourism Should BeControlled/Regulated More than Businesses
Needs to Control/Regulate More
Should Not Control/Regulate More
Don’t Know/Prefer Not to Answer
12%
60%
29%
35PROPER GOVERNMENT ACTIONS TO REGULATE TOURISM
36PROPER GOVERNMENT ACTIONS TO REGULATE TOURISM
5.2 Should Government Help/Support TourismMore than Other Businesses?
�e �ip side of the previous question was presented next, by again asking, And with which of these statements do you most agree? (a) Government should not try to help or support tourism more than any other types of business; or (b) Government needs to help or support tourism more than other businesses.
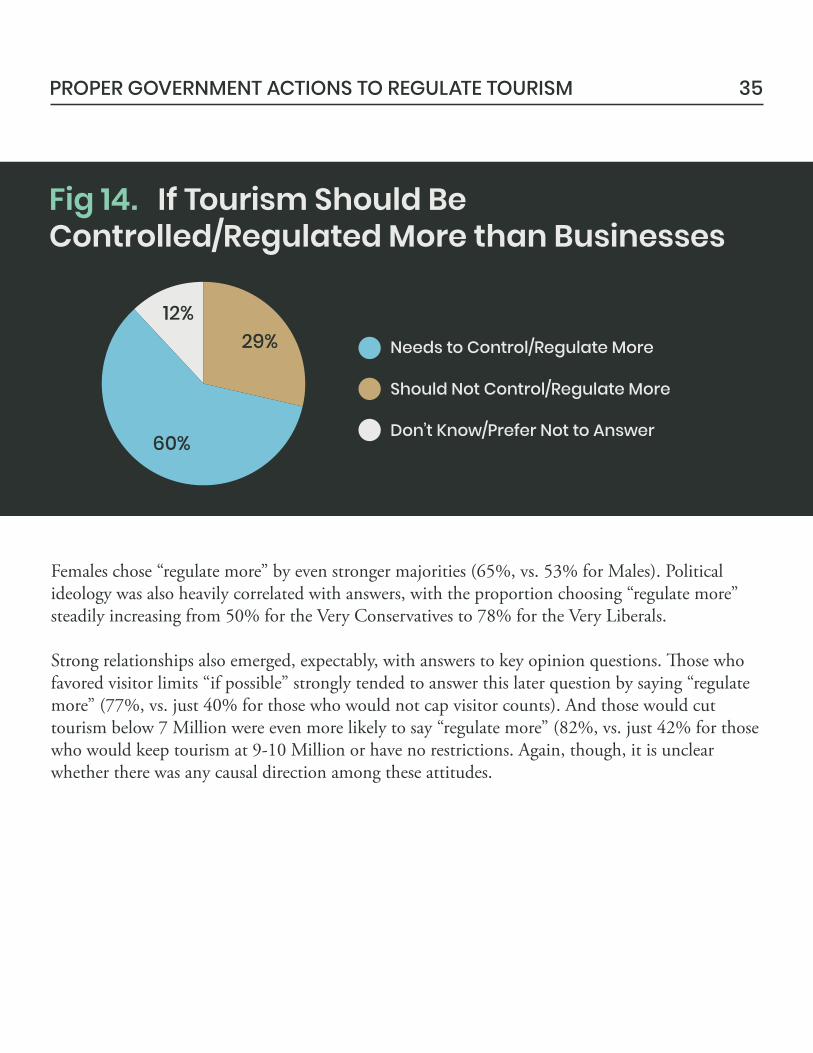
Results were also �ipped from those for the previous question. Figure 15 shows nearly a 2-to-1 margin saying Government should not help or support tourism versus those who think it should, with 14% undecided.
Neighbor Islanders were even more vehement in saying “don’t help more” (66%, vs 53% on O‘ahu). No demographic group had an actual majority saying “do help more” (though Filipinos and Chinese were close at 49%). And political ideology was again a factor – though the di�erences did not reach statistical signi�cance with these sample size, the “help more” percentages increased from 25% for Very Liberals to 44% for Very Conservatives.
We also cross-tabulated results of this question with the previous one, resulting in four categories
Fig 15. If Tourism Should Be Helped/SupportedMore than Businesses
Don’t Know/Prefer Not to Answer
Needs to Help/Support More
Should Not Help/Support More57%29%
14%
Tourism Proponent Deep Involvement
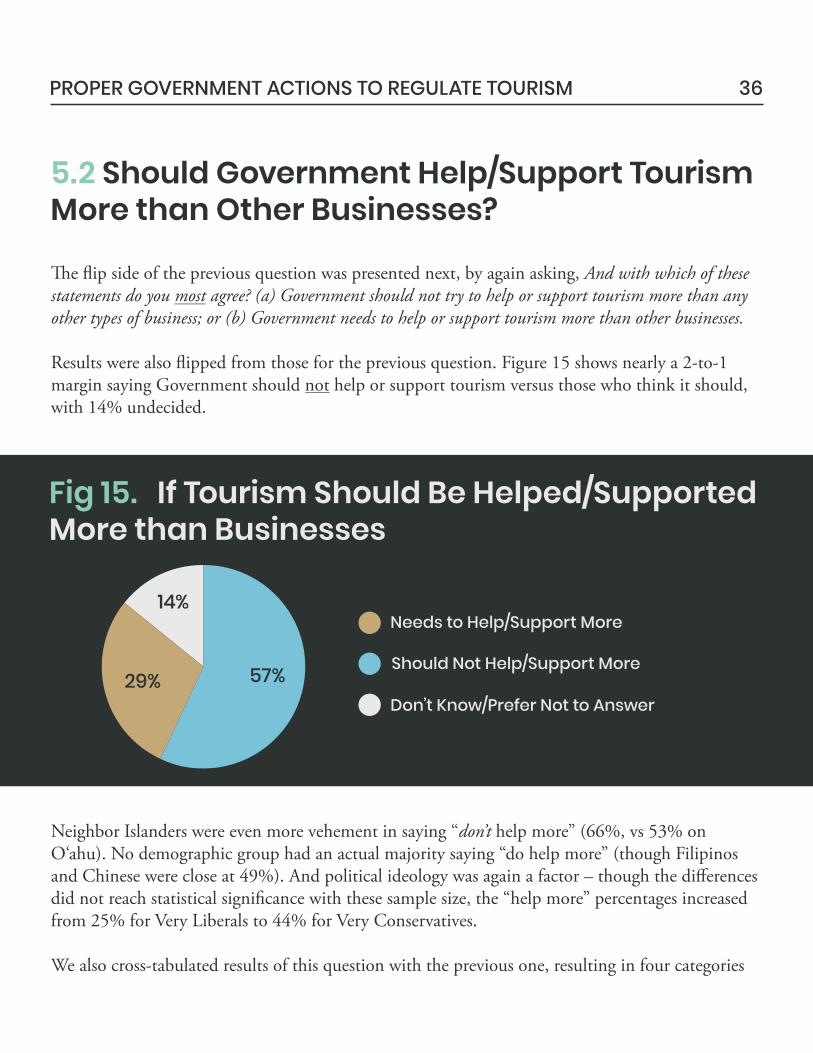
of philosophy about how Government should be involved in tourism. Table 4 shows the largest single bloc – 42% of those giving opinions (i.e., excluding the “Don’t Know” answers) believed Government should be a “Tourism Regulator,” controlling tourism more than other businesses but not trying to help or support it more. Equal 24% portions favored the opposite positions of “Laissez-Faire” (no extra Government regulation or support) and “Deep Involvement” (both extra control and extra help). Finally, just 9% want Government to be a strong “Tourism Proponent,” helping it more than other business sectors but not controlling/regulating it more.
Interestingly, the “Laissez-Faire” group was disproportionately Moderate in their self-described political ideology (this group was 50% Moderate, while just 37% of the overall sample was Moderate). It was the smaller “Tourism Proponent” group that was disproportionately Conservative or Very Conservative (42%, compared to just 22% for the overall sample).
�ose who wanted Government to be a “Tourism Regulator” were disproportionately Very Liberal (16%, versus 10% Very Liberal for the overall sample). �ose who wanted the Government to have “Deep Involvement” had an ideological pro�le very much like that of the overall sample.
Laissez-Faire Tourism Regulator
37PROPER GOVERNMENT ACTIONS TO REGULATE TOURISM
24%No Help More
Total
Table 4. Relationship Between Opinions(Regulation vs. Support)
If GovernmentShould Help
Tourism More ThanOther Businesses
If Government Should Control TourismMore Than Other Businesses
No Control More Control More Total
Help More 9%
34%
42%
24%
66%
66%
34%
100%
Note: Percentages based only on those responding to both questions, excluding all “Don’t Know”answers. The weighted N for this table was 571.
38PROPER GOVERNMENT ACTIONS TO REGULATE TOURISM
5.3 Opinions on Selected Specific PossibleGovernment Controls or Supports
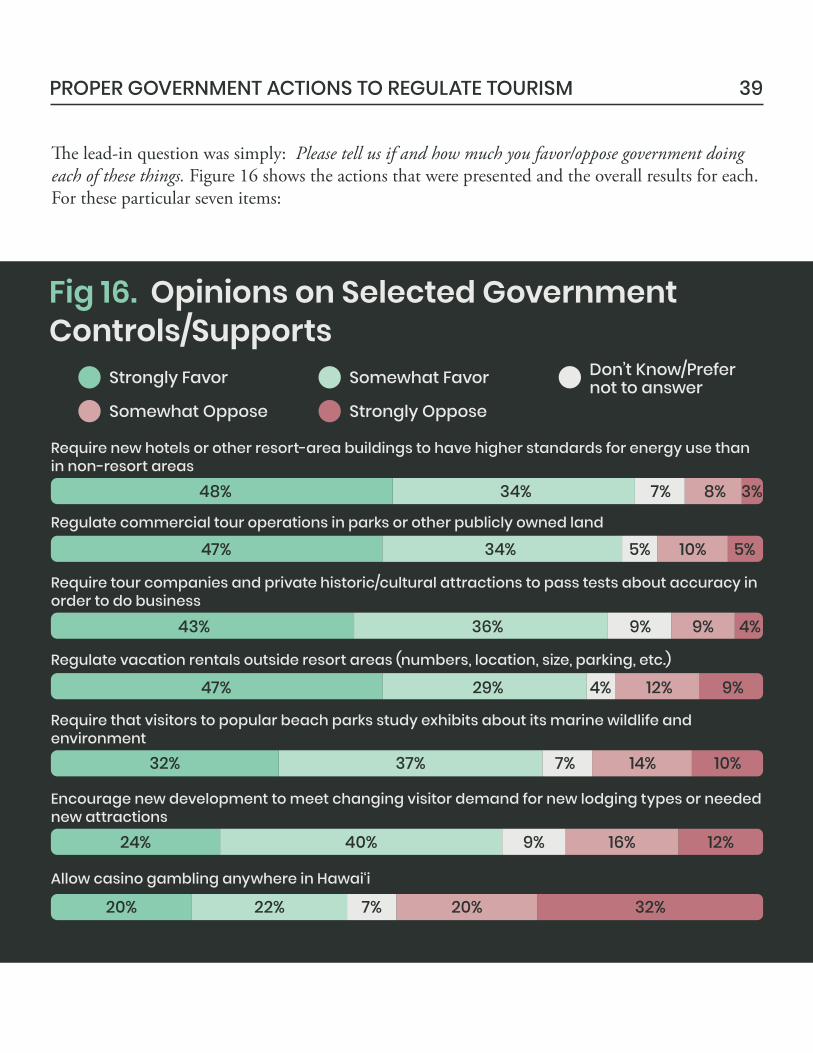
�ere are many, many ways that Hawai‘i government is or could be involved with the visitor industry, both to support and also to manage in a more regulatory fashion. Some of these possible activities are addressed in later questions covered in the following Chapter 6. But at this point, we selected seven possible functions re�ecting some recent issues, proposals, or more traditional ideas about government response to free-market demand. (�ese were presented to respondents in a randomized order.)
39PROPER GOVERNMENT ACTIONS TO REGULATE TOURISM
�e lead-in question was simply: Please tell us if and how much you favor/oppose government doing each of these things. Figure 16 shows the actions that were presented and the overall results for each. For these particular seven items:
Require new hotels or other resort-area buildings to have higher standards for energy use than in non-resort areas
Strongly Favor Somewhat Favor
Somewhat Oppose Strongly Oppose
Don’t Know/Prefernot to answer
Fig 16. Opinions on Selected GovernmentControls/Supports
Regulate commercial tour operations in parks or other publicly owned land
Require tour companies and private historic/cultural attractions to pass tests about accuracy in order to do business
Regulate vacation rentals outside resort areas (numbers, location, size, parking, etc.)
Require that visitors to popular beach parks study exhibits about its marine wildlife and environment
Encourage new development to meet changing visitor demand for new lodging types or needed new attractions
Allow casino gambling anywhere in Hawai‘i
3%8%34%
34%
36% 9% 4%43%
47%
47% 29%
32% 37% 14% 10%
24% 40% 16% 12%
20% 22% 20% 32%
12% 9%
10% 5%
7%
9%
4%
7%
9%
7%
5%
48%
40PROPER GOVERNMENT ACTIONS TO REGULATE TOURISM
Selected comments about some of these potential actions:
“Allow Casino Gambling” was the only item here opposed by a slight majority (52%), with 42% strongly or somewhat in favor, and 7% uncertain.
�e biggest di�erence among demographic groups was between Males (55% favor, 40% opposed) and Females (31% favor, 60% opposed). �us, it was the vehemence of Female opposition that produced the overall majority against. People who believed that pre-pandemic household jobs depended on the visitor industry were also somewhat more opposed than were people with no current job ties to tourism.
“Regulate Vacation Rentals” is a potentially critical issue, as limits on total lodging appears to be one of the few possible indirect ways to control tourism volume. It was favored by 76% (including 47% “strongly” favor), opposed by 21%.
No demographic or opinion group had majority opposition. Particularly high levels who strongly favored vacation rental controls included the Very Liberal (70%), the “Tourism Regulators” from previous question (62%), and age groups 55 years or older (all in the 55% - 58% range).
“Regulate Commercial Tour Operations in Parks” touches on another �ash point in resident-visitor relations. �is was favored by 81% (again including 47% “strongly” favor), opposed by just 15%.
Again, there were no groups with majority opposition – very few demographic or opinion groups even registered as much as 20% opposition. �ose particularly likely to say they “strongly” favored this included the “Tourism Regulators” (65%) and age groups 55 years or older (61% - 63% range).
It should be noted that a number of these potential Government actions would clearly subject tourism to more regulation than other businesses (e.g., requiring more “green” energy practices). While Conservatives – and similar groups such as those who would not cap tourism levels even if possible – did oppose these ideas somewhat more, majorities even among these groups were in favor.
6. PROPER “DESTINATIONMANAGEMENT” ROLES ANDFINANCING
Knox, Moore
MANAGING TOURISM IN HAWAI‘I 41
In this section, we began to take respondents into somewhat specialized topics, some of which may be unfamiliar to the average person. To the extent that these ideas may have been new to the survey respondents, the following results should be understood as preliminary �ndings. �ese may be particularly subject to change over time if and as more public discussion makes its way into local news media.
Major results in this chapter include:
Asked about rental car surcharges as a way to pay for addressing some tourism impacts, residents with clear opinions favored the idea 2-to-1 (38% to 19%), but 4% were unsure and a plurality 39% said “It depends” (on how big an increase or other issues). �ere was somewhat more support for using that particular type of revenue for improving highways than for natural resource protection, but half would split the money between both purposes.
Asked about green fees (visitor taxes speci�cally for natural resource protection), residents with opinions similarly favored them by a 2-to-1 margin (40% to 18%), but 6% were unsure and 36% said “It depends.” Interestingly, people with job ties to tourism were more supportive. �ose who favored green fees seemed to care little as to whether they would better be collected via room taxes or rental car surcharges.
42PROPER “DESTINATION MANAGEMENT” ROLES AND FINANCING
Again by a 2-to-1 ratio (62% to 31%), but this time with only 8% undecided, residents would prefer that money from any new/additional taxes on visitors be used for public purposes rather than the sort of direct rebates to residents that some states have developed for energy ormining activities.
Although majorities would pay for “responsible visiting” e�orts and for overall tourism marketing only with tourist taxes, other activities merited majority support for using some resident tax money, too. �ese included grants to preserve Native Hawaiian culture, service grants to counties, and community grants for parades and festivals.
Presented with a list of 11 possible actions the State could take to support or regulate tourism, or address its impacts, residents supported all, but with the highest levels of support (by several di�erent approaches) going to:
Informing tourists about “responsible visiting;”
Solving problems at particular congested locations; and
Funding environmental groups “to repair damage to reefs, shorelines or trails caused mostly by tourist use.”
Respondents were provided the following lead-in to this survey section:
This section is about ways government – in normal times – could or should take major actions to help the visitor industry, try to make tourism work better for residents, or solve problems people believe are created in part by tourism (such as congestion of certain highways, impacts on parks and natural resources, etc.).
Programs to do these things usually cost a lot of money, so there are also questions about whether they should be funded by resident or by tourism taxes/fees.
43
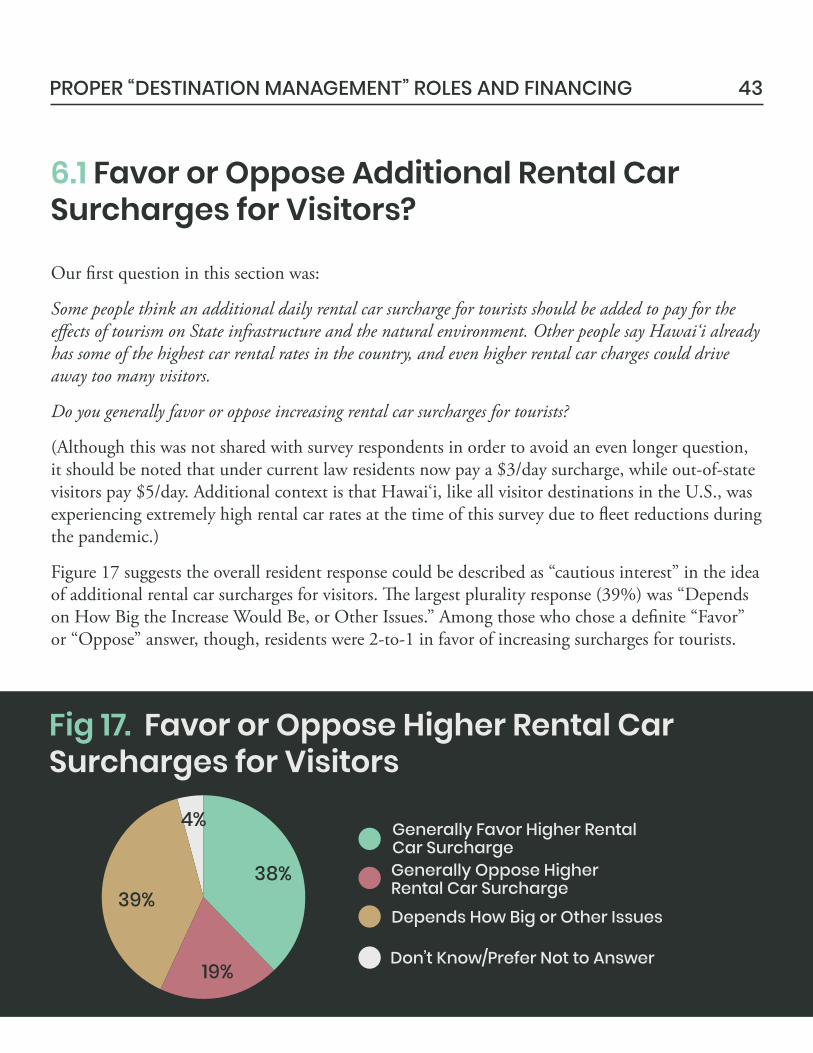
6.1 Favor or Oppose Additional Rental CarSurcharges for Visitors?
Our �rst question in this section was:
Some people think an additional daily rental car surcharge for tourists should be added to pay for the e�ects of tourism on State infrastructure and the natural environment. Other people say Hawai‘i already has some of the highest car rental rates in the country, and even higher rental car charges could drive away too many visitors.
Do you generally favor or oppose increasing rental car surcharges for tourists?
(Although this was not shared with survey respondents in order to avoid an even longer question, it should be noted that under current law residents now pay a $3/day surcharge, while out-of-state visitors pay $5/day. Additional context is that Hawai‘i, like all visitor destinations in the U.S., was experiencing extremely high rental car rates at the time of this survey due to �eet reductions during the pandemic.)
Figure 17 suggests the overall resident response could be described as “cautious interest” in the idea of additional rental car surcharges for visitors. �e largest plurality response (39%) was “Depends on How Big the Increase Would Be, or Other Issues.” Among those who chose a de�nite “Favor” or “Oppose” answer, though, residents were 2-to-1 in favor of increasing surcharges for tourists.
Fig 17. Favor or Oppose Higher Rental CarSurcharges for Visitors
Don’t Know/Prefer Not to Answer
Depends How Big or Other Issues
Generally Oppose Higher Rental Car Surcharge
Generally Favor Higher RentalCar Surcharge
38%
19%
39%
4%
PROPER “DESTINATION MANAGEMENT” ROLES AND FINANCING
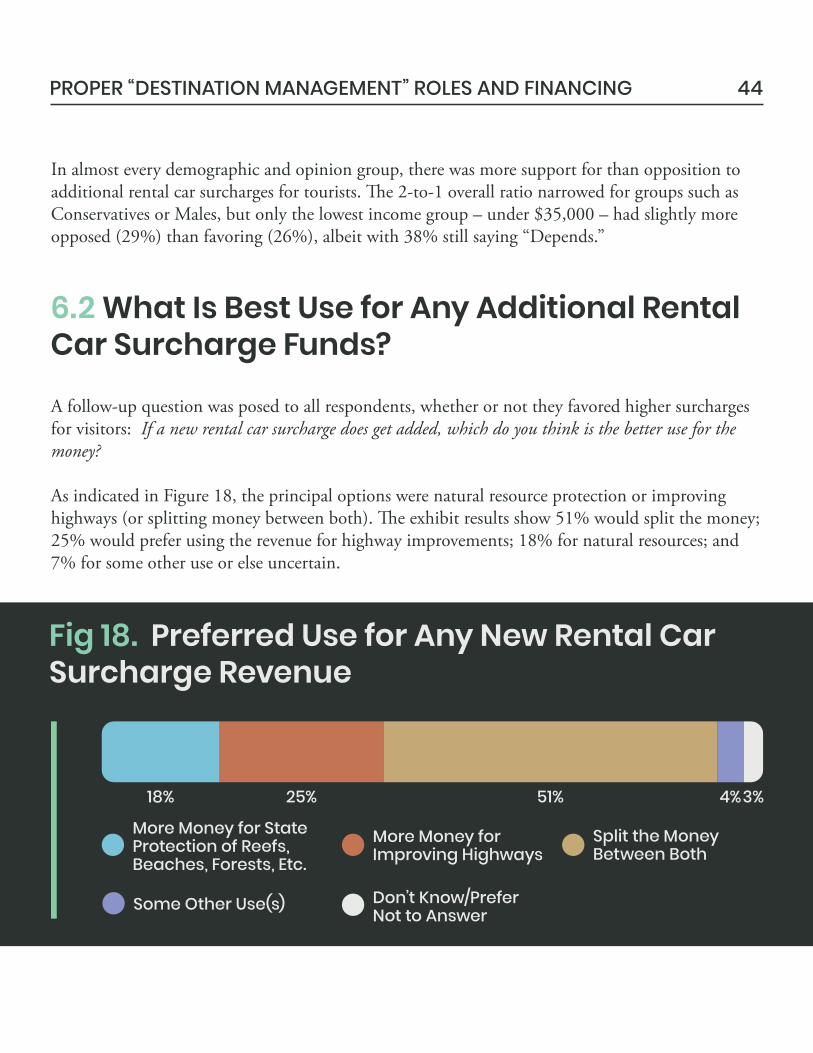
44
In almost every demographic and opinion group, there was more support for than opposition to additional rental car surcharges for tourists. �e 2-to-1 overall ratio narrowed for groups such as Conservatives or Males, but only the lowest income group – under $35,000 – had slightly more opposed (29%) than favoring (26%), albeit with 38% still saying “Depends.”
A follow-up question was posed to all respondents, whether or not they favored higher surcharges for visitors: If a new rental car surcharge does get added, which do you think is the better use for the money?
As indicated in Figure 18, the principal options were natural resource protection or improving highways (or splitting money between both). �e exhibit results show 51% would split the money; 25% would prefer using the revenue for highway improvements; 18% for natural resources; and 7% for some other use or else uncertain.
6.2 What Is Best Use for Any Additional RentalCar Surcharge Funds?
Fig 18. Preferred Use for Any New Rental CarSurcharge Revenue
51%18% 25% 4%3%
More Money for StateProtection of Reefs,Beaches, Forests, Etc.
More Money forImproving Highways
Some Other Use(s) Don’t Know/PreferNot to Answer
PROPER “DESTINATION MANAGEMENT” ROLES AND FINANCING
Split the MoneyBetween Both
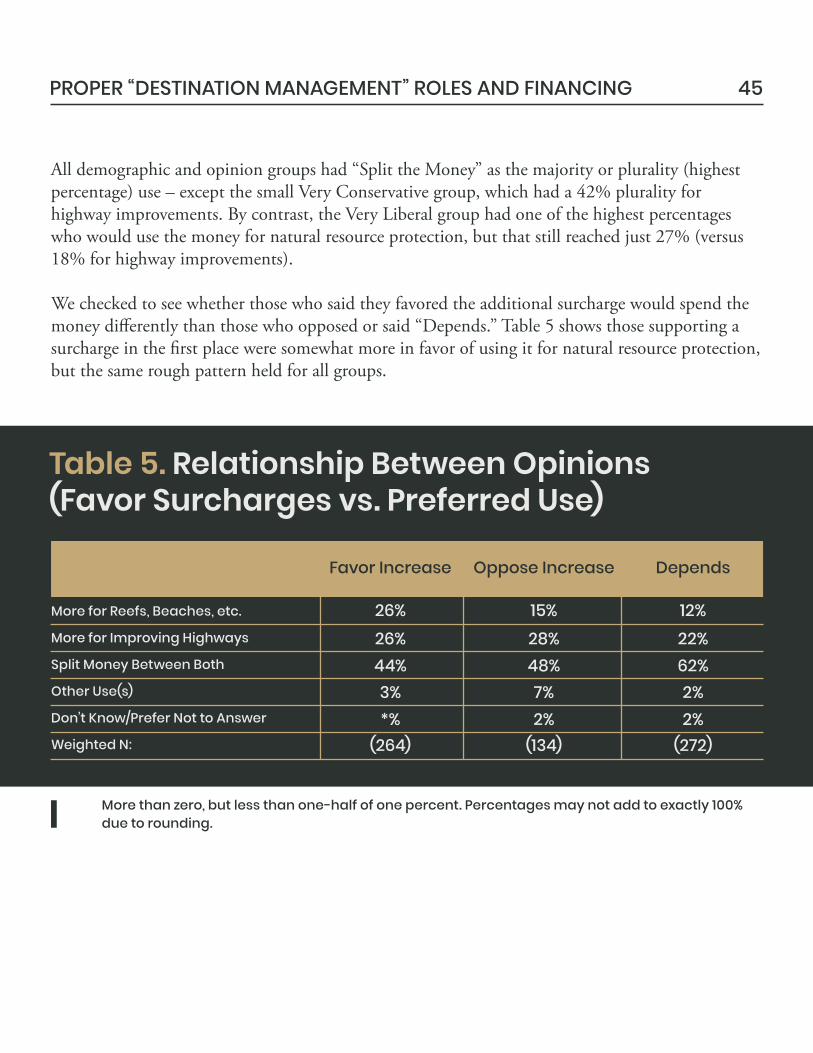
45
All demographic and opinion groups had “Split the Money” as the majority or plurality (highest percentage) use – except the small Very Conservative group, which had a 42% plurality for highway improvements. By contrast, the Very Liberal group had one of the highest percentages who would use the money for natural resource protection, but that still reached just 27% (versus 18% for highway improvements).
We checked to see whether those who said they favored the additional surcharge would spend the money di�erently than those who opposed or said “Depends.” Table 5 shows those supporting a surcharge in the �rst place were somewhat more in favor of using it for natural resource protection, but the same rough pattern held for all groups.
26%26%44%3%*%
(264)
15%28%48%7%2%
(134)
12%22%62%2%2%
(272)
More for Reefs, Beaches, etc.
More for Improving Highways
Split Money Between Both
Don’t Know/Prefer Not to Answer
Other Use(s)
Weighted N:
Table 5. Relationship Between Opinions(Favor Surcharges vs. Preferred Use)
Favor Increase Oppose Increase Depends
More than zero, but less than one-half of one percent. Percentages may not add to exactly 100%due to rounding.
PROPER “DESTINATION MANAGEMENT” ROLES AND FINANCING
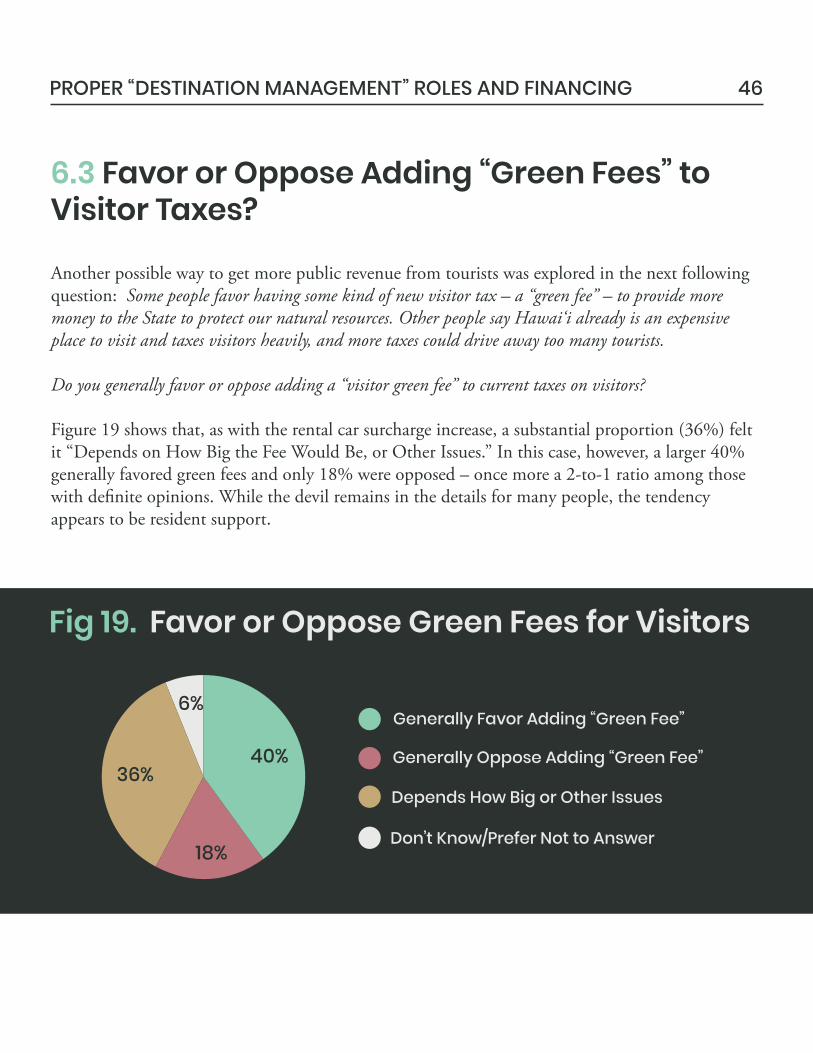
46
6.3 Favor or Oppose Adding “Green Fees” toVisitor Taxes?
Another possible way to get more public revenue from tourists was explored in the next following question: Some people favor having some kind of new visitor tax – a “green fee” – to provide more money to the State to protect our natural resources. Other people say Hawai‘i already is an expensive place to visit and taxes visitors heavily, and more taxes could drive away too many tourists.
Do you generally favor or oppose adding a “visitor green fee” to current taxes on visitors?
Figure 19 shows that, as with the rental car surcharge increase, a substantial proportion (36%) felt it “Depends on How Big the Fee Would Be, or Other Issues.” In this case, however, a larger 40% generally favored green fees and only 18% were opposed – once more a 2-to-1 ratio among those with de�nite opinions. While the devil remains in the details for many people, the tendency appears to be resident support.
Fig 19. Favor or Oppose Green Fees for Visitors
Don’t Know/Prefer Not to Answer
Depends How Big or Other Issues
Generally Oppose Adding “Green Fee”
Generally Favor Adding “Green Fee”
40%
18%
36%
6%
PROPER “DESTINATION MANAGEMENT” ROLES AND FINANCING
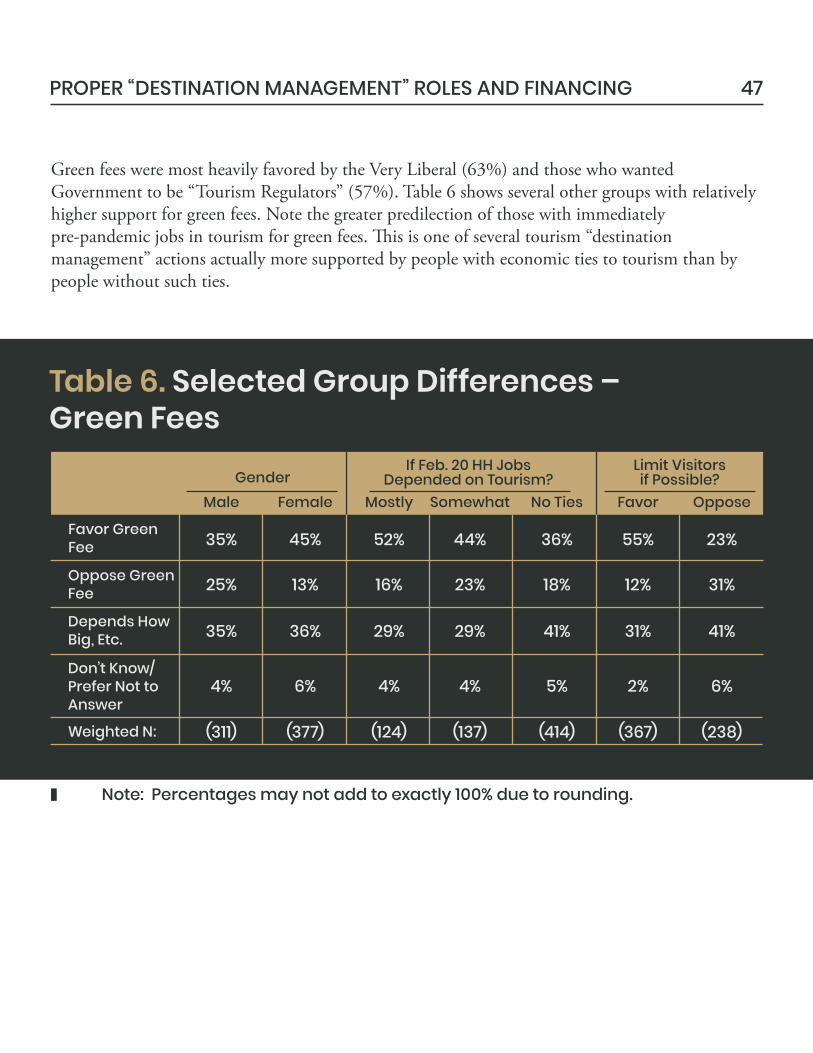
47
Green fees were most heavily favored by the Very Liberal (63%) and those who wanted Government to be “Tourism Regulators” (57%). Table 6 shows several other groups with relatively higher support for green fees. Note the greater predilection of those with immediately pre-pandemic jobs in tourism for green fees. �is is one of several tourism “destination management” actions actually more supported by people with economic ties to tourism than by people without such ties.
35% 45% 52% 44% 36% 23%55%
25% 13% 16% 23% 18% 31%12%
35% 36% 29% 29% 41% 41%31%
4% 6% 4% 4% 5% 6%2%
(311) (377) (124) (137) (414) (367) (238)
Favor GreenFee
Oppose GreenFee
Depends HowBig, Etc.
Don’t Know/Prefer Not toAnswer
Weighted N:
Table 6. Selected Group Differences –Green Fees
GenderIf Feb. 20 HH Jobs
Depended on Tourism?Limit Visitorsif Possible?
Male Female Mostly Somewhat No Ties Favor Oppose
Note: Percentages may not add to exactly 100% due to rounding.
PROPER “DESTINATION MANAGEMENT” ROLES AND FINANCING
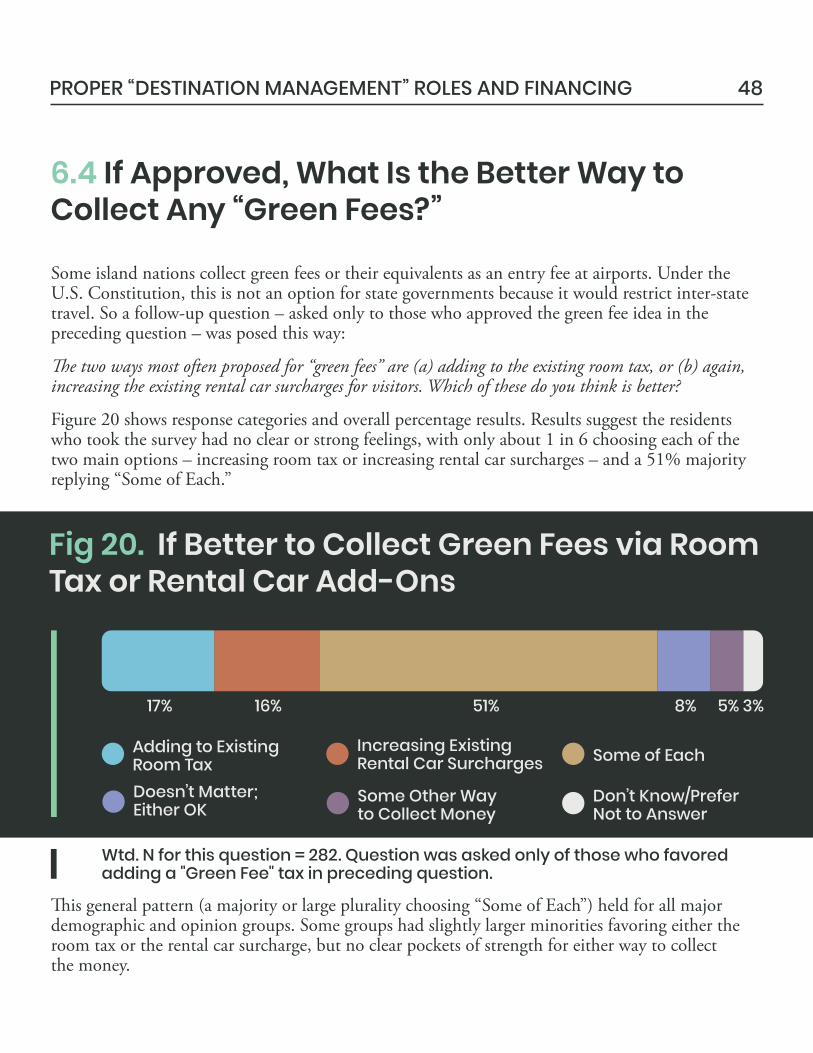
Wtd. N for this question = 282. Question was asked only of those who favoredadding a "Green Fee" tax in preceding question.
48
6.4 If Approved, What Is the Better Way toCollect Any “Green Fees?”
Some island nations collect green fees or their equivalents as an entry fee at airports. Under the U.S. Constitution, this is not an option for state governments because it would restrict inter-state travel. So a follow-up question – asked only to those who approved the green fee idea in the preceding question – was posed this way:
�e two ways most often proposed for “green fees” are (a) adding to the existing room tax, or (b) again, increasing the existing rental car surcharges for visitors. Which of these do you think is better?
Figure 20 shows response categories and overall percentage results. Results suggest the residents who took the survey had no clear or strong feelings, with only about 1 in 6 choosing each of the two main options – increasing room tax or increasing rental car surcharges – and a 51% majority replying “Some of Each.”
�is general pattern (a majority or large plurality choosing “Some of Each”) held for all major demographic and opinion groups. Some groups had slightly larger minorities favoring either the room tax or the rental car surcharge, but no clear pockets of strength for either way to collectthe money.
Fig 20. If Better to Collect Green Fees via RoomTax or Rental Car Add-Ons
51%17% 16% 8% 3%5%
Adding to ExistingRoom Tax
Increasing ExistingRental Car Surcharges Some of Each
Doesn’t Matter;Either OK
Some Other Wayto Collect Money
Don’t Know/PreferNot to Answer
PROPER “DESTINATION MANAGEMENT” ROLES AND FINANCING
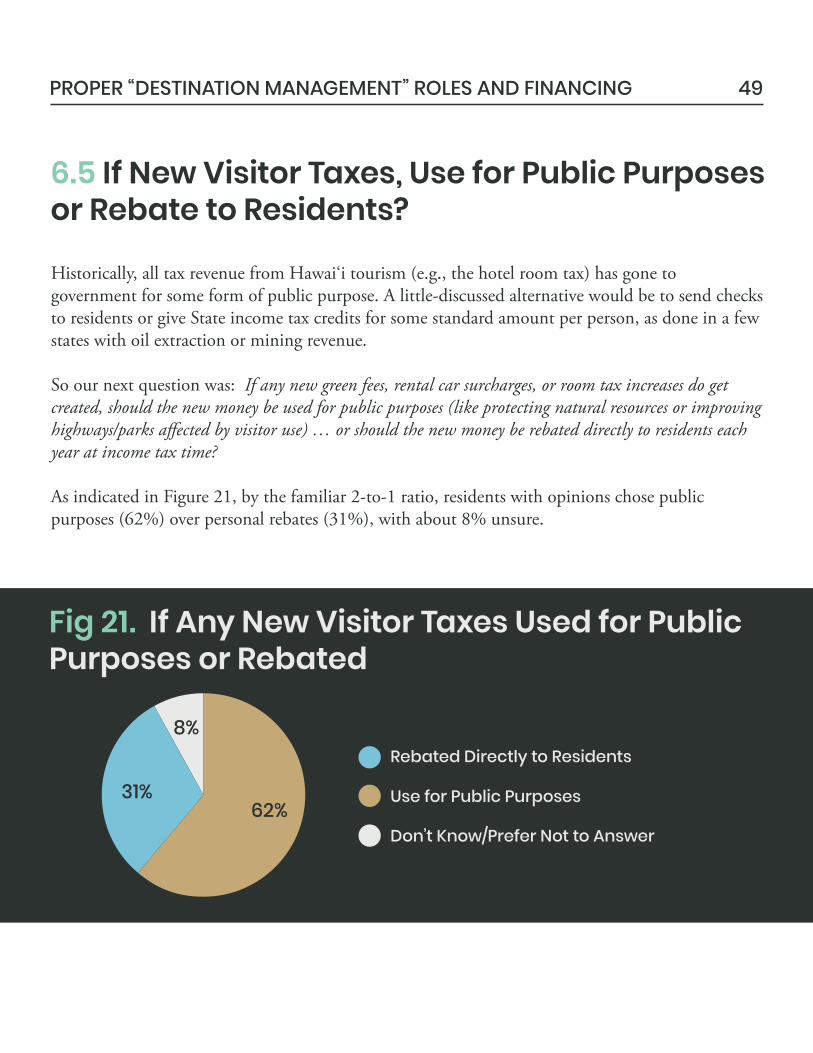
49
6.5 If New Visitor Taxes, Use for Public Purposesor Rebate to Residents?
Historically, all tax revenue from Hawai‘i tourism (e.g., the hotel room tax) has gone to government for some form of public purpose. A little-discussed alternative would be to send checks to residents or give State income tax credits for some standard amount per person, as done in a few states with oil extraction or mining revenue.
So our next question was: If any new green fees, rental car surcharges, or room tax increases do get created, should the new money be used for public purposes (like protecting natural resources or improving highways/parks a�ected by visitor use) … or should the new money be rebated directly to residents each year at income tax time?
As indicated in Figure 21, by the familiar 2-to-1 ratio, residents with opinions chose public purposes (62%) over personal rebates (31%), with about 8% unsure.
Fig 21. If Any New Visitor Taxes Used for PublicPurposes or Rebated
Don’t Know/Prefer Not to Answer
Rebated Directly to Residents
Use for Public Purposes62%
31%
8%
PROPER “DESTINATION MANAGEMENT” ROLES AND FINANCING
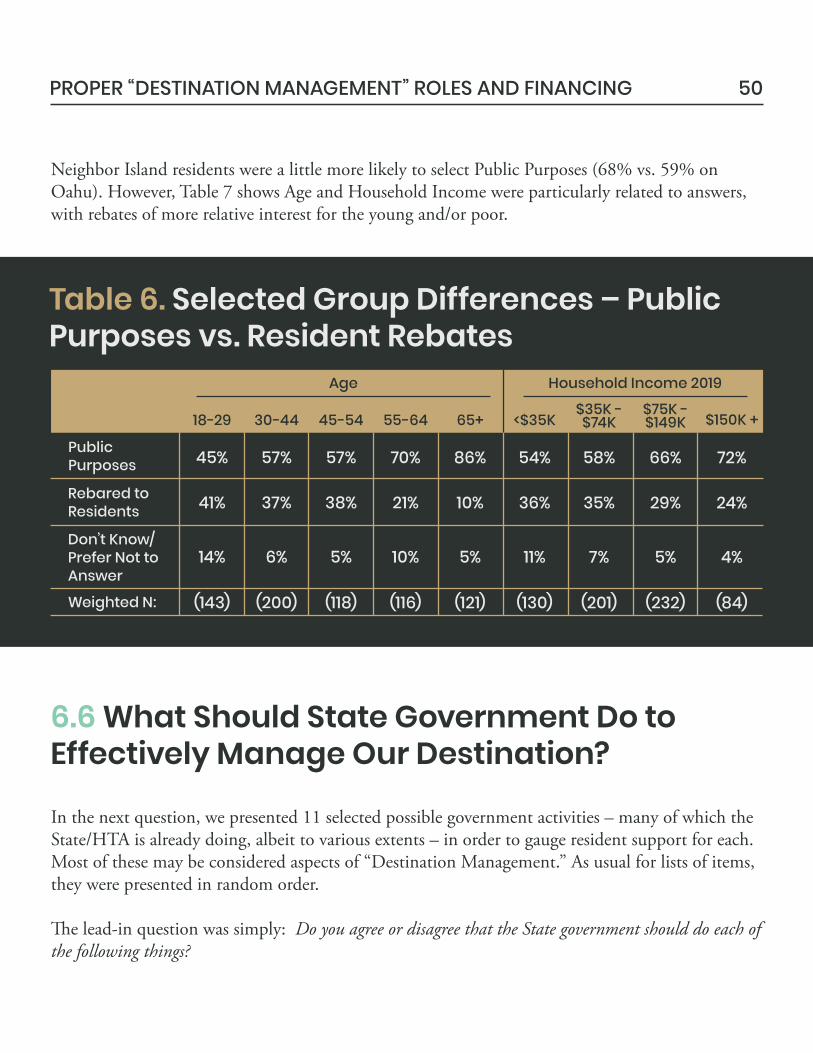
50
Neighbor Island residents were a little more likely to select Public Purposes (68% vs. 59% on Oahu). However, Table 7 shows Age and Household Income were particularly related to answers, with rebates of more relative interest for the young and/or poor.
45%
41%
14%
(143)
57%
37%
6%
(200)
57%
38%
5%
(118)
70%
21%
10%
(116)
86%
10%
5%
(121)
54%
36%
11%
(130)
58%
35%
7%
(201)
66%
29%
5%
(232)
72%
24%
4%
(84)
PublicPurposes
Rebared toResidents
Don’t Know/Prefer Not toAnswer
Weighted N:
Table 6. Selected Group Differences – PublicPurposes vs. Resident Rebates
Age Household Income 2019
18-29 30-44 45-54 55-64 65+ <$35K$35K -$74K
$75K -$149K $150K +
6.6 What Should State Government Do toEffectively Manage Our Destination?
In the next question, we presented 11 selected possible government activities – many of which the State/HTA is already doing, albeit to various extents – in order to gauge resident support for each. Most of these may be considered aspects of “Destination Management.” As usual for lists of items, they were presented in random order.
�e lead-in question was simply: Do you agree or disagree that the State government should do each of the following things?
PROPER “DESTINATION MANAGEMENT” ROLES AND FINANCING
51
Figure 22 shows the various functions that were presented and the overall results for each. All 11 earned majority agreement (“strongly” or “somewhat”), but there were various degrees of enthusiasm.
�e Top �ree on the list have to do with attempts to make visitors more responsible/respectful in local eyes; solving the “hot spot” issues for particular parks/attractions; and funding environmental group e�orts to remediate damages to natural resources associated with visitor use. �ese are all about �xing problems perceived to be associated with tourism.
�e Bottom �ree – all still with majority approval, just less so – have to do with marketing, funding community groups to do things that attract visitors as well as residents, and developing new attractions to keep Hawai‘i a fresh destination. �ese are all about supporting tourism.
It should be noted these “Bottom �ree” are also potential Destination Management tools (for example, marketing can focus on attracting responsible visitors), but they simply don’t attract the same strong resident support. �is suggests a need, at least in the current timeframe, for the State to give higher priority to addressing perceived tourism impacts as compared to traditional tourism support activities – and/or to better publicizing impact remediation e�orts already underway.
PROPER “DESTINATION MANAGEMENT” ROLES AND FINANCING
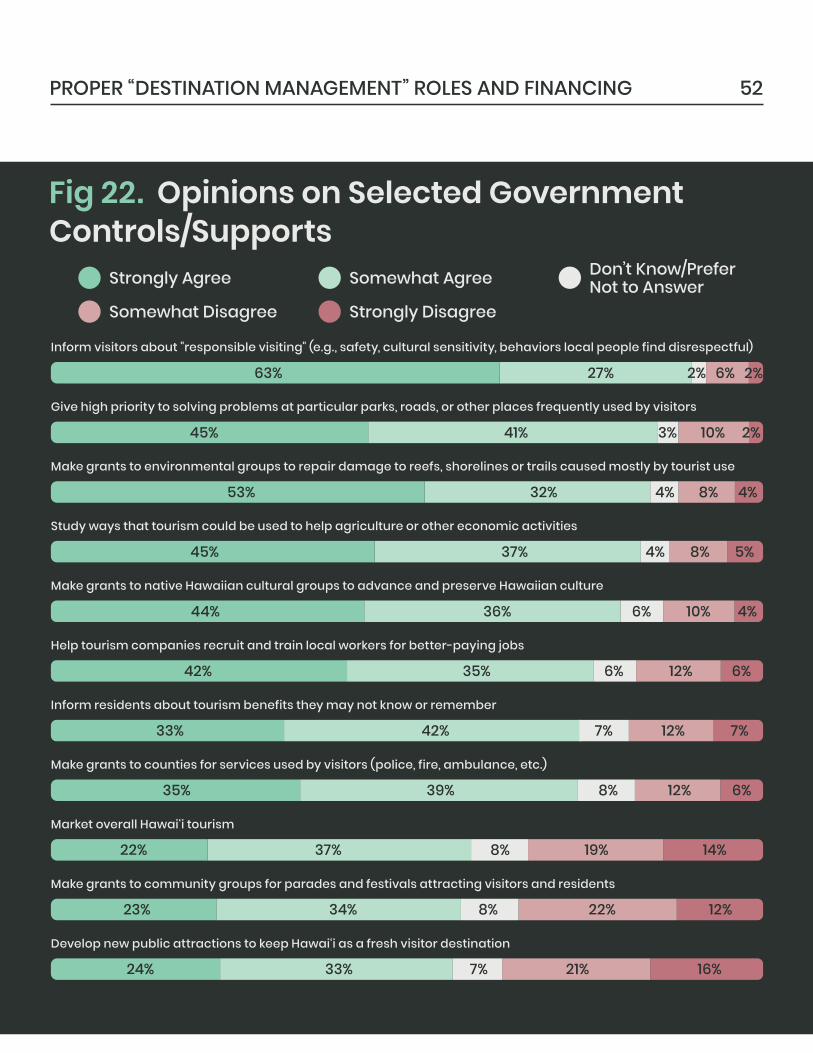
Inform visitors about "responsible visiting" (e.g., safety, cultural sensitivity, behaviors local people find disrespectful)
Strongly Agree Somewhat Agree
Somewhat Disagree Strongly Disagree
Don’t Know/PreferNot to Answer
Fig 22. Opinions on Selected GovernmentControls/Supports
Give high priority to solving problems at particular parks, roads, or other places frequently used by visitors
Make grants to environmental groups to repair damage to reefs, shorelines or trails caused mostly by tourist use
Study ways that tourism could be used to help agriculture or other economic activities
Make grants to native Hawaiian cultural groups to advance and preserve Hawaiian culture
Help tourism companies recruit and train local workers for better-paying jobs
Inform residents about tourism benefits they may not know or remember
Make grants to counties for services used by visitors (police, fire, ambulance, etc.)
Market overall Hawai‘i tourism
Make grants to community groups for parades and festivals attracting visitors and residents
Develop new public attractions to keep Hawai‘i as a fresh visitor destination
63% 27%
45% 41% 10% 2%
53% 32% 8% 4%
45% 37% 8% 5%
44% 36% 10% 4%
42% 35% 12% 6%
33% 42% 12% 7%
35% 39% 12% 6%
22% 37% 19% 14%
23% 34% 22% 12%
24% 33% 21% 16%
3%
4%
4%
6%
6%
7%
8%
8%
8%
7%
2% 2%
52PROPER “DESTINATION MANAGEMENT” ROLES AND FINANCING
6%
53
Some comments about selected di�erences among demographic/opinion groups:
Top �ree Items: For two of these – giving grants for environmental remediation and informing about responsible visiting – the highest levels of “strong” agreement (ranging from 60% to 78%) came from the same four groups. �ese were Females, Liberals or Very Liberals, those who Favor Tourism Limits, and those who think Government should be a “Regulator” of tourism (imposing extra controls but not extra support).
�e third item – solving “overtourism” problems at parks and roads – got more uniform answers from all groups. However, “strong” agreement increased with age, and there was, interestingly, relatively more “strong” agreement among both the Very Liberal (56%) and the Very Conservative (63%).
Bottom �ree Items: �e focus here is on greater disagreement (“strong” or “somewhat”) – which groups are pulling down the overall levels of resident support? For two of the items – marketing and developing new attractions – some of the same groups pop up. �ose who thought Government should be a tourism “Regulator” had actual majority opposition (around 52% each), and Liberals or Very Liberals had larger minorities disagreeing.
For the third lower-ranked item – funding community events attracting visitors too – higher but still minority opposition (ca. 40% each) came from Males, those with No Household Job Ties to Tourism, and those who wanted Government to be either “Deeply Involved” (help the industry more and also control it more than other businesses) or “Tourism Proponents” (help more but don’t control more). It is not always intuitive as to why these groups should be relatively more opposed to grants for parades, festivals, and similar events.
Other (Selected): Two of the items in the middle of the ranks in Figure 22 – helping tourism companies recruit and train workers for better-paying jobs and trying to use tourism to boost agriculture or other economic sectors – had similar patterns. Both earned particularly “strong” agreement from the Very Liberal (about 55% each) and from Caucasians (53% and 57%).
PROPER “DESTINATION MANAGEMENT” ROLES AND FINANCING
54
6.7 Pay for Approved Government FunctionsJust by Taxing Tourists?
A key policy issue is whether government “destination management” functions should properly be �nanced strictly by taxes on tourists/tourism, or whether it makes sense for residents and local businesses to bear some of the costs as well. So we followed up the previous list of items by asking:
Below are the items with which you just said you “Strongly” or “Somewhat” Agreed. For each one, please say if you think the cost of doing this should be paid only by taxes collected from tourists or tourism businesses, or if you think that the costs should be shared with Hawai‘i residents and local businessesas well.
(Note that people were asked only about those functions they agreed government should do, so sample sizes varied by item.)
Figure 23 reiterates those functions and shows results for each, listed in the same order as in the foregoing Figure 22 to facilitate comparison.
Among those who supported the actions, two stand out because supporters were particularly likely to say they should be funded only by tourism tax revenue:
However, for all the other items, majorities or strong minorities of supporters were willing to use some taxes raised from residents or local businesses (along with tourism taxes) to achieve these goals. �e three functions with the greatest percentages willing to use local revenues as well were:
Informing visitors about “responsible visiting” (69% only tourism taxes); and
Grants to native Hawaiian cultural groups to advance and preserve Hawaiian culture (61% of supporters willing to bolster with local tax revenue);
Marketing (59%).
Grants to counties for services used by visitors (59%); and
Grants to community groups for parades and festivals attracting visitors and residents (57%).
PROPER “DESTINATION MANAGEMENT” ROLES AND FINANCING
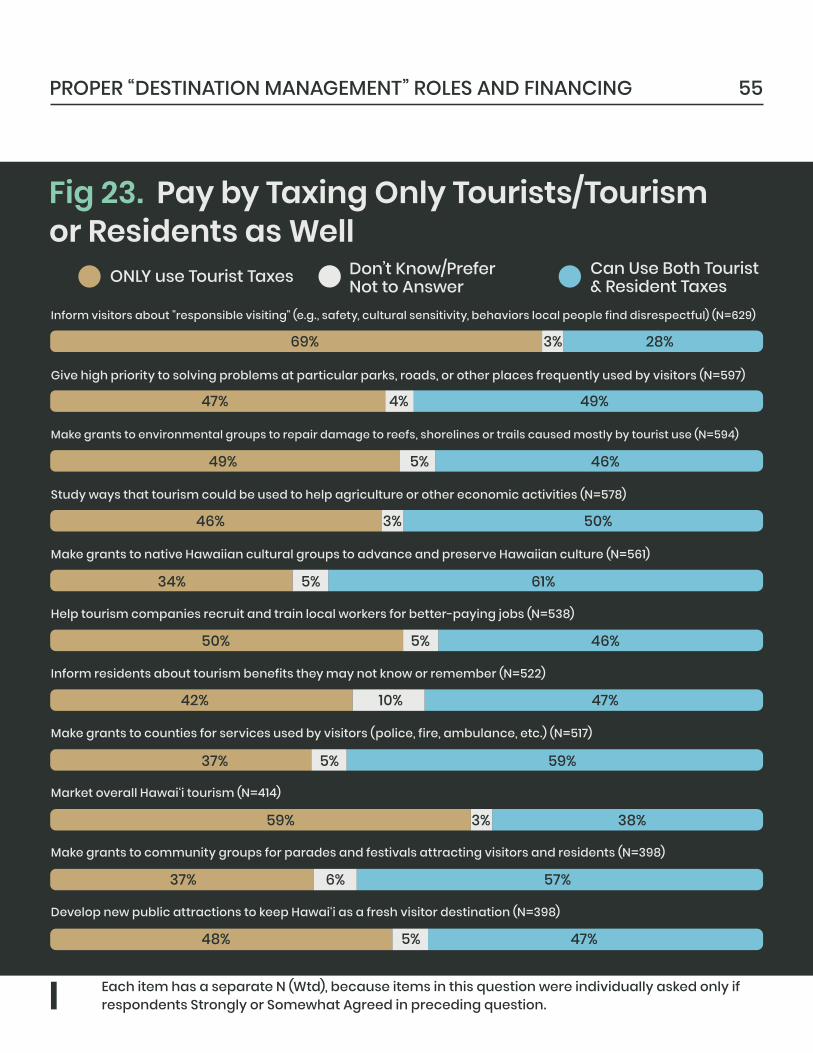
Inform visitors about "responsible visiting" (e.g., safety, cultural sensitivity, behaviors local people find disrespectful) (N=629)
Don’t Know/PreferNot to Answer
Fig 23. Pay by Taxing Only Tourists/Tourismor Residents as Well
Give high priority to solving problems at particular parks, roads, or other places frequently used by visitors (N=597)
Make grants to environmental groups to repair damage to reefs, shorelines or trails caused mostly by tourist use (N=594)
Study ways that tourism could be used to help agriculture or other economic activities (N=578)
Make grants to native Hawaiian cultural groups to advance and preserve Hawaiian culture (N=561)
Help tourism companies recruit and train local workers for better-paying jobs (N=538)
Inform residents about tourism benefits they may not know or remember (N=522)
Make grants to counties for services used by visitors (police, fire, ambulance, etc.) (N=517)
Make grants to community groups for parades and festivals attracting visitors and residents (N=398)
Market overall Hawai‘i tourism (N=414)
Develop new public attractions to keep Hawai‘i as a fresh visitor destination (N=398)
55PROPER “DESTINATION MANAGEMENT” ROLES AND FINANCING
ONLY use Tourist Taxes
48% 47%
37% 57%
59% 38%
37% 59%
42% 47%
50% 46%
34% 61%
46% 50%
49% 46%
47% 49%
69% 28%
5%
6%
3%
5%
10%
5%
5%
3%
5%
4%
3%
Each item has a separate N (Wtd), because items in this question were individually asked only ifrespondents Strongly or Somewhat Agreed in preceding question.
Can Use Both Tourist& Resident Taxes
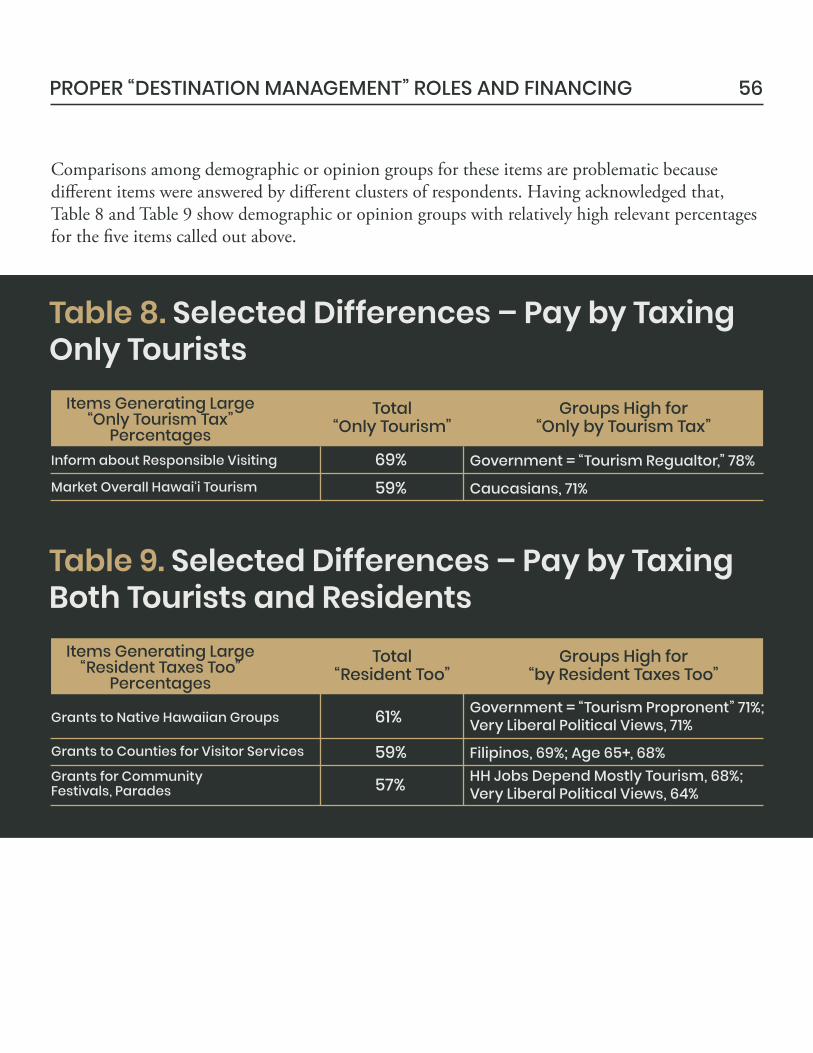
56
Comparisons among demographic or opinion groups for these items are problematic because di�erent items were answered by di�erent clusters of respondents. Having acknowledged that, Table 8 and Table 9 show demographic or opinion groups with relatively high relevant percentages for the �ve items called out above.
PROPER “DESTINATION MANAGEMENT” ROLES AND FINANCING
69%59%
Government = “Tourism Regualtor,” 78%
Caucasians, 71%
Inform about Responsible Visiting
Market Overall Hawai‘i Tourism
Table 8. Selected Differences – Pay by TaxingOnly Tourists
Total“Only Tourism”
Items Generating Large“Only Tourism Tax”
PercentagesGroups High for
“Only by Tourism Tax”
61%
59%
57%
Government = “Tourism Propronent” 71%;Very Liberal Political Views, 71%
HH Jobs Depend Mostly Tourism, 68%;Very Liberal Political Views, 64%
Filipinos, 69%; Age 65+, 68%
Grants to Native Hawaiian Groups
Grants to Counties for Visitor Services
Grants for CommunityFestivals, Parades
Table 9. Selected Differences – Pay by TaxingBoth Tourists and Residents
Total“Resident Too”
Items Generating Large“Resident Taxes Too”
PercentagesGroups High for
“by Resident Taxes Too”
7. ORGANIZING FOR“DESTINATION MANAGEMENT”ACTIVITIES
Knox, Moore
MANAGING TOURISM IN HAWAI‘I 57
To the extent that government should properly take a role in “Destination Management,” success comes not only from deciding on key principles and speci�c functions, but also from key factors having to do with how government organizes itself, including:
An e�ective “Destination Management Organization (DMO)” – in Hawai‘i, the Hawai‘i Tourism Authority (HTA) now largely plays this role, but other structures are possible, including a “Dept. of Tourism” or making the DMO part of an umbrella agency within the Governor’s o�ce or some general economic development o�ce.
Inter-agency coordination in planning and implementation – �e HTA can now make plans for itself, but does not have authority to require private businesses, other State agencies, or county governments to participate in or follow such a plan. �at is not necessarily a bad thing, but it does limit the extent to which the overall government can address “Destination Management,” particularly any rapid response to negative tourism impacts atparticular locations.9
9 �e reader may wish to review the UNWTO emphasis on the need for various stakeholders to collaborate (and avoid “turf wars” or overlapping functions) in the citation back in Chapter 1.
Su�cient resources – Today, the principal source of funding for the HTA is the hotel room tax (“Transient Accommodations Tax,” or TAT), but most TAT revenue �ows into the General Fund and subsidizes many non-tourism public expenditures. For FY 2022, the HTA’s budget has been deeply cut and will come from emergency federal relief funds.
A plurality of 35% would both keep it and also increase its authority in the “Destination Management” area. Another 14% would simply keep HTA as is – so roughly half would either preserve or strengthen the agency. About 25% would keep HTA only for marketing, with “Destination Management” functions either eliminated or scattered among other agencies. Just 9% would have no HTA or similar agency.
A “permanent tourism advisory council system” including both resident and industry stakeholders won more than 2-to-1 approval among those with clear opinions (34% Yes to 15% No), but a plurality of 45% cautiously said, “Depends How It’s Done.” Two-thirds of those who said Yes wanted an elected rather than appointed system.
58ORGANIZING FOR “DESTINATION MANAGEMENT” ACTIVITIES
�ese topics mostly felt too unfamiliar and technical for a general population survey, and so we asked only a few preliminary questions of this nature. Future surveys might dig deeper into organizational issues if and as they are more widely discussed in public media.
Major results in this chapter include:
�is questionnaire section began with following lead-in contextual language:
This section looks at how the State plans for tourism and organizes public input. Right now, the State has the “Hawai‘i Tourism Authority” (HTA), funded by part of the room tax revenue. Among other things, the HTA is required by law to do marketing, create a vision and long-term strategic plan, conduct tourism research, and to help assure native Hawaiian culture is accurately portrayed in tourism. It also can and does have programs for community involvement and natural resource enhancement.
The HTA’s 2020 strategic plan focuses on “destination management” (dealing with problems like overcrowding and trying to make tourism work better for residents.) It is now developing “management action plans” for each county. However, the HTA alone cannot require other agencies or private businesses to follow its plans.
59
7.1 Should Hawai‘i Keep the HTA As Is,Strengthen It, or Eliminate It?
ORGANIZING FOR “DESTINATION MANAGEMENT” ACTIVITIES
�ere have been some calls to eliminate the agency, often as part of a general desire to reduce tourism. Because “destination management” is a more complicated topic than just having or not having a DMO, we risked a more complicated, lengthy question:
Some people think the HTA is on the right track and should be left as it is. Other people want to give it more authority for the new “destination management” work, and yet others think the HTA should just do marketing and “destination management” functions should be eliminated or spread among other agencies. Finally, still others who want less tourism in Hawai‘i have called for its elimination, with no replacement agency. What do you think?
Full wording for possible response categories included:
Figure 24 shows, �rst, that under 10% would totally eliminate HTA and have no agency charged with both marketing and guiding tourism in Hawai‘i. Although the question generated a fairly substantial “Don’t Know” response of 17%, the results generally suggest most residents feel Hawai‘i needs some sort of DMO.
Leave HTA as it is
Eliminate the HTA and have no other agency for marketing or guiding tourism in Hawai‘i
Keep the HTA, and give it more authority to do its cultural, environment, andcommunity work
Keep the HTA just for marketing, and eliminate or scatter among other agencies the “destination management” functions 10
10 Originally, this third option was to have been “Keep the HTA just for marketing, and give another agency clear responsibility for ‘destination management,’” which some places such as Iceland have done. However, as the survey was �nalized in mid-April, a legislative proposal emerged to reduce HTA’s budget and eliminate or transfer the agency’s Community, Culture, and Natural Resources functions.
Rather than add this option – which essentially would have kept HTA just for marketing – and make an already complicated question even longer, we decided to substitute it for the original wording. During the survey �elding time, the Legislature eventually restored HTA’s non-marketing functions, though its budget for the next �scal year was reduced. As of this writing, the bill is before Gov. David Ige for signing or veto.
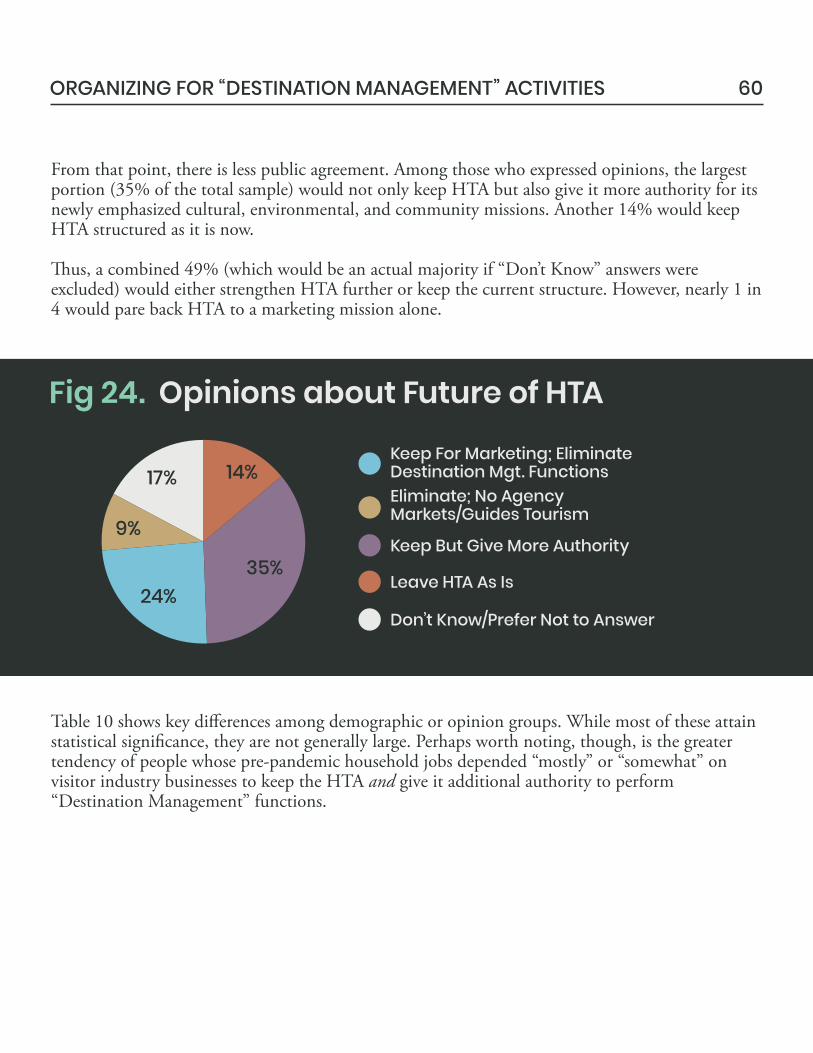
60ORGANIZING FOR “DESTINATION MANAGEMENT” ACTIVITIES
From that point, there is less public agreement. Among those who expressed opinions, the largest portion (35% of the total sample) would not only keep HTA but also give it more authority for its newly emphasized cultural, environmental, and community missions. Another 14% would keep HTA structured as it is now.
�us, a combined 49% (which would be an actual majority if “Don’t Know” answers were excluded) would either strengthen HTA further or keep the current structure. However, nearly 1 in 4 would pare back HTA to a marketing mission alone.
Table 10 shows key di�erences among demographic or opinion groups. While most of these attain statistical signi�cance, they are not generally large. Perhaps worth noting, though, is the greater tendency of people whose pre-pandemic household jobs depended “mostly” or “somewhat” on visitor industry businesses to keep the HTA and give it additional authority to perform “Destination Management” functions.
Fig 24. Opinions about Future of HTA
Don’t Know/Prefer Not to Answer
Leave HTA As Is
Keep But Give More Authority
Keep For Marketing; EliminateDestination Mgt. FunctionsEliminate; No AgencyMarkets/Guides Tourism
35%24%
17%
9%
14%
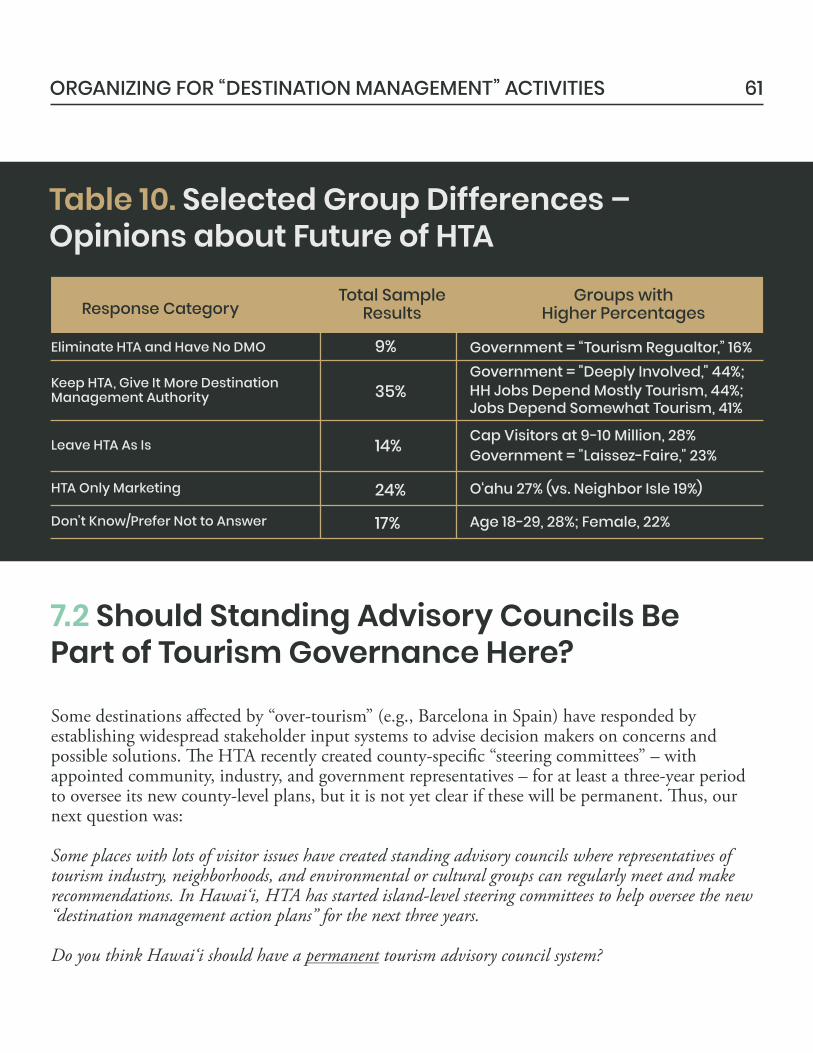
61ORGANIZING FOR “DESTINATION MANAGEMENT” ACTIVITIES
9% Government = “Tourism Regualtor,” 16%Eliminate HTA and Have No DMO
35%Government = "Deeply Involved," 44%;HH Jobs Depend Mostly Tourism, 44%;Jobs Depend Somewhat Tourism, 41%
Keep HTA, Give It More DestinationManagement Authority
14% Cap Visitors at 9-10 Million, 28%Government = "Laissez-Faire," 23%
Leave HTA As Is
24% O‘ahu 27% (vs. Neighbor Isle 19%)HTA Only Marketing
17% Age 18-29, 28%; Female, 22%Don't Know/Prefer Not to Answer
Table 10. Selected Group Differences –Opinions about Future of HTA
Total SampleResultsResponse Category
Groups withHigher Percentages
7.2 Should Standing Advisory Councils BePart of Tourism Governance Here?
Some destinations a�ected by “over-tourism” (e.g., Barcelona in Spain) have responded by establishing widespread stakeholder input systems to advise decision makers on concerns and possible solutions. �e HTA recently created county-speci�c “steering committees” – with appointed community, industry, and government representatives – for at least a three-year period to oversee its new county-level plans, but it is not yet clear if these will be permanent. �us, our next question was:
Some places with lots of visitor issues have created standing advisory councils where representatives of tourism industry, neighborhoods, and environmental or cultural groups can regularly meet and make recommendations. In Hawai‘i, HTA has started island-level steering committees to help oversee the new “destination management action plans” for the next three years.
Do you think Hawai‘i should have a permanent tourism advisory council system?

62ORGANIZING FOR “DESTINATION MANAGEMENT” ACTIVITIES
Figure 25 shows response categories and results. Among just those with clear “Yes” or “No” responses, the “Yeses” prevailed by more than 2-to-1 (34% to 15%). However, as with some previous survey questions, a very large portion (45%) answered “Depends How It’s Done.” Again, the overall response pattern suggests cautious interest but a need for much more informationabout speci�cs.
No demographic or opinion group had a majority saying “Yes,” but strongest approval was from those who think Government should be a Tourism “Proponent” (47%) and Caucasians (45%). Among those with a greater tendency to say “No” were those who want Government to be “Laissez-Faire” with tourism, political Conservatives, and those who opposed any limits on visitor counts – but even among these groups, opposition reached levels of just 21% - 24%.
Fig 25. If Standing Tourism Advisory CouncilShould Be Created
Depends How It's Done
No, See Too Many Problemswith Idea
Yes, Approve Idea
Don’t Know/Prefer Not to Answer
34%
15%
45%
6%
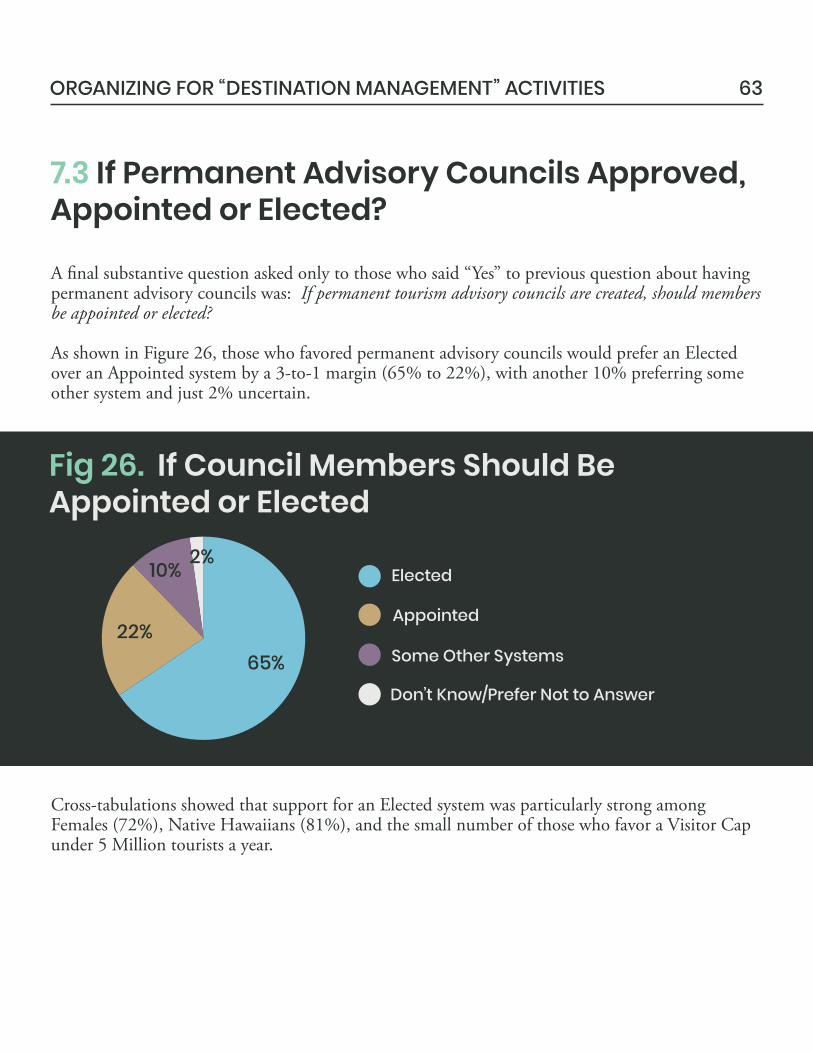
63ORGANIZING FOR “DESTINATION MANAGEMENT” ACTIVITIES
7.3 If Permanent Advisory Councils Approved,Appointed or Elected?
A �nal substantive question asked only to those who said “Yes” to previous question about having permanent advisory councils was: If permanent tourism advisory councils are created, should members be appointed or elected?
As shown in Figure 26, those who favored permanent advisory councils would prefer an Elected over an Appointed system by a 3-to-1 margin (65% to 22%), with another 10% preferring some other system and just 2% uncertain.
Cross-tabulations showed that support for an Elected system was particularly strong among Females (72%), Native Hawaiians (81%), and the small number of those who favor a Visitor Cap under 5 Million tourists a year.
Fig 26. If Council Members Should BeAppointed or Elected
Some Other Systems
Appointed
Don’t Know/Prefer Not to Answer
65%22%
10% 2%Elected
8. DISCUSSION ANDRECOMMENDATIONS
Knox, Moore
MANAGING TOURISM IN HAWAI‘I 64
Tourism is so consequential for Hawai‘i that it generates many public policy questions, and attention constantly rotates among them.
When the 2021 Legislature adjourned, after this survey was completed, the focus of media discussion on tourism governance issues shifted to �nancial questions: What will be the HTA’s immediate future with a slashed budget for the next �scal year? What will be the impact on tourism if counties add additional room tax?
But the issues associated with destination management are still there and always recur.
In the tourism boom of the 1980s, these issues resulted in the Legislature creating a short-lived “Tourism Impact Management System.” In the 2000s, they generated State studies on “sustainable tourism” and an HTA attempt to do a sort of statewide master plan. In early 2020, the HTA adopted a new strategic plan with “destination management” as the central theme. All of these attempted responses to enduring resident concerns ran into the buzzsaw of subsequent recessions.
So even though it is currently unclear how much the HTA itself will be able to do in the next �scal year with reduced funding, our �rst policy recommendation to the overall State government is simply to keep focusing on destination management. Don’t again let these issues again drift underground during times of economic struggle.
65DISCUSSION AND RECOMMENDATIONS
�e HTA appears to be making a sincere e�ort to do this, but it is a�ected both by years of perception that is mostly a marketing agency and arguably also by insu�cient publicity of its new directions. When there is public distrust of tourism, it is easy to question the primary tourism agency.
�is is not to say Hawai‘i policy makers should never review our tourism governance models, especially since the HTA approach has raised questions of whether this type of “Destination Management Organization” (DMO) has adequate resources and actual authority (or at least good ways to coordinate with other agencies). Destination management requires consistent funding and e�ective coordination with all stakeholders, so the choice should be between truly committing to HTA much as it is vs. a truly systematic weighing of alternative approaches to tourism governance.
However, we recommend that any future restructuring of tourism governance involve (a) widespread stakeholder input; and (b) systematic studies of how other DMO’s are changing (and how other governments augment DMO’s in destination management systems). �at is, it should be a transparent and extended process, as opposed to surprise bills with little chance for signi�cant feedback.
�e visitor industry and/or the HTA clearly has to respond to years of rising resident distrust by implementing or visibly supporting truly e�ective “hot spot” management techniques (i.e., modern technology for pricing and reservation approaches).
�is is already starting to happen (e.g., the recent passage of HB1276 allowing dynamic pricing of trails and parks), and the associated process of restoring public trust seems a �rst priority right now. In order to keep doing that, we further urge that resolving speci�c “hot-spot” crises take precedence over more general destination management approaches – i.e., educating residents about the industry, making grants for general programs that aid both tourism and community, etc.
�ere is still a role for the latter types of things, but if mechanisms can be developed to bring many public and private groups together to address real trouble spots, as at Hā‘ena in 2018-19, this reassures residents they are taken seriously. Regenerative tourism, to actually improve our resources, is an excellent aspiration. Still, “First, do no harm” … and �x it if you do.
Down the line, though, we also urge that studies such as tourism competition analyses and national/international destination image surveys be more widely shared with the local public (or at least appropriate parts of such studies).
66
Such reports involve trade-o�s that policy makers must consider when weighing impact mitigation and other destination management functions against economic realities. If the public is to be more of a partner in dealing with tourism’s problems, it can also be more of a partner in understanding and responding to its competitive challenges.
More broadly, the State must eventually align tourism destination management with overall growth management planning. �at was the approach taken in the development of the original Hawai‘i State Plan of the 1970s, and that approach should ultimately be preserved and strengthened.
�is survey has demonstrated con�icting perceptions about whether growth in visitors or in residents has been more responsible for a sense that roads and parks and overall islands are too crowded. While there really are cases where visitors have had disproportionate impacts, at the end of the day it’s not just “�em” or “Us,” but “Everybody,” who crowds the highways and stresses the reef systems.
In the 1960s and early 1970s, court rulings invalidated Hawai‘i attempts to resist a wave of Mainland in-migration by setting up residency requirements for public jobs and other bene�ts. �ereafter, talk of limits to population growth switched to limits on visitors. �e U.S. Constitution prevents e�ective direct limits on either group, but planning for growth (including any ways to slow it) can’t work well without attention to both.
�ere has been a tendency for policy makers to believe that all responses to tourism issues should be paid for solely by taxes on tourism. �is survey shows that political instinct has been correct for functions such as marketing, but also that residents are willing to see local tax revenues used for many “destination management” initiatives – and that should encourage more integrated planning.
�e survey has also shown that residents with household job linkages to tourism are in some cases actually more interested in proposed corrective measures such as “green fees” than are other residents. �is suggests that visitor industry workers – unionized or not – should have a clearer voice, distinct from management, about tourism policies. Nobody has ever done a Workforce Sentiment Survey to supplement the HTA’s Resident Sentiment Survey.
We should not fool ourselves that there will ever be perfect resident consensus about tourism and destination management. �e entire nation is now deeply divided by partisan politics, and this survey has established linkages between political ideology and attitudes toward tourism management.
DISCUSSION AND RECOMMENDATIONS

67
But perhaps the most critical short-term thing is to make su�cient progress in taking concrete steps to control perceived tourism over-use of parks, trails, and other recreational “hot spots.”
�e survey has shown potential resident acceptance of that targeted approach as a general strategy over the much more problematic idea of capping visitor counts … but the yearning for overall limits on tourism clearly will always come back if other steps do not succeed. We are cautiously optimistic that initiatives such as county-level clamp-downs on commercial tours and the HTA’s �edgling “Destination Management Action Plans” can achieve this.
�ere is one possible real – if indirect and complicated – way to in�uence if not totally control visitor numbers. �at is through permits/enforcement for resort lodging in general and vacation rentals (especially outside resort areas) in particular. �is survey found 76% support for regulating vacation rentals outside resort areas, and just 21% opposition.
�is is largely a county issue, and most counties have recently toughened their ordinances. �e question remains whether county administrations will �nd it �scally possible and politically practical to enforce the regulations.
Vacation rentals are in strong demand now, as tourists seek more control over their lodging and hygiene factors. So such enforcement may be the other most immediate test of political will between short-term market pressures and long-term destination management planning.
When it comes to tourism management, Hawai‘i has often seemed torn between decisive actions and hesitation over giving the industry “special treatment” by government, as agriculture was once given and to some extent still is. However, this survey has also shown the majority of residents want State government to regulate and/or support tourism more than other businesses.
As always, e�ective governance depends on resources, political will, and ways to elicit and enforce commitments from key players. It is time for a robust public discussion of how much of that can be done by the HTA alone with su�cient funding, and whether/how to create supplementary systems of public input and inter-agency coordinating councils.
DISCUSSION AND RECOMMENDATIONS
9. APPENDIX A: SURVEYMETHODS AND ANALYSIS
Knox, Moore
MANAGING TOURISM IN HAWAI‘I 68
�e University of Hawai‘i Public Policy Center contracted Anthology Research to �eld the survey using an online methodology. Fieldwork for the study began on April 16, 2021 and ended on May 3, 2021. A total of 700 surveys were completed during this time period.
�e sample for the study was compiled using a combination of online panel purchased from a third-party online sample provider, augmented by Anthology Research’s proprietary consumer panel. Respondents from the online sample provider are awarded points for participating in surveys and can redeem their points for store gift cards. Respondents on Anthology’s panel were awarded an e-gift card in the amount of $5.00. �e combination of sample sources results in a more representative sample that generally matches Hawai‘i’s population relative to key demographics, with the acknowledgment that it does require online access.
�e margin of error for a sample of this size is +/- 3.70 percentage points with a 95% con�dence level. (Error ranges for particular demographic groups or other sub-samples would be higher, depending on the sample size for the group.) �e data were weighted to re�ect population estimates for adults 18+ by island by ethnicity, using a combination of the 2010 Census data (for island/county age and population counts) and the 2016 Hawaii Behavioral Health Surveillance Study (for ethnic distributions by island/county). Note that both overall proportions and individual counts have been weighted.
Anthology Research generated both general results (overall frequencies) and “banners” of multiple cross-tabulations. �ese “banner” cross-tabulations show all survey question results by each major response category for all demographic questions (including political ideology) and a few opinion statements. �ese may be found and downloaded at: publicpolicycenter.manoa.hawaii.edu.
10. APPENDIX B: SURVEYQUESTIONNAIRE
Knox, Moore
MANAGING TOURISM IN HAWAI‘I 69
This appendix shows the original paper version of the full questionnaire, which Anthology Research parceled into different online frames of text that were viewed by online respondents. This version includes statewide percentage results for all items.
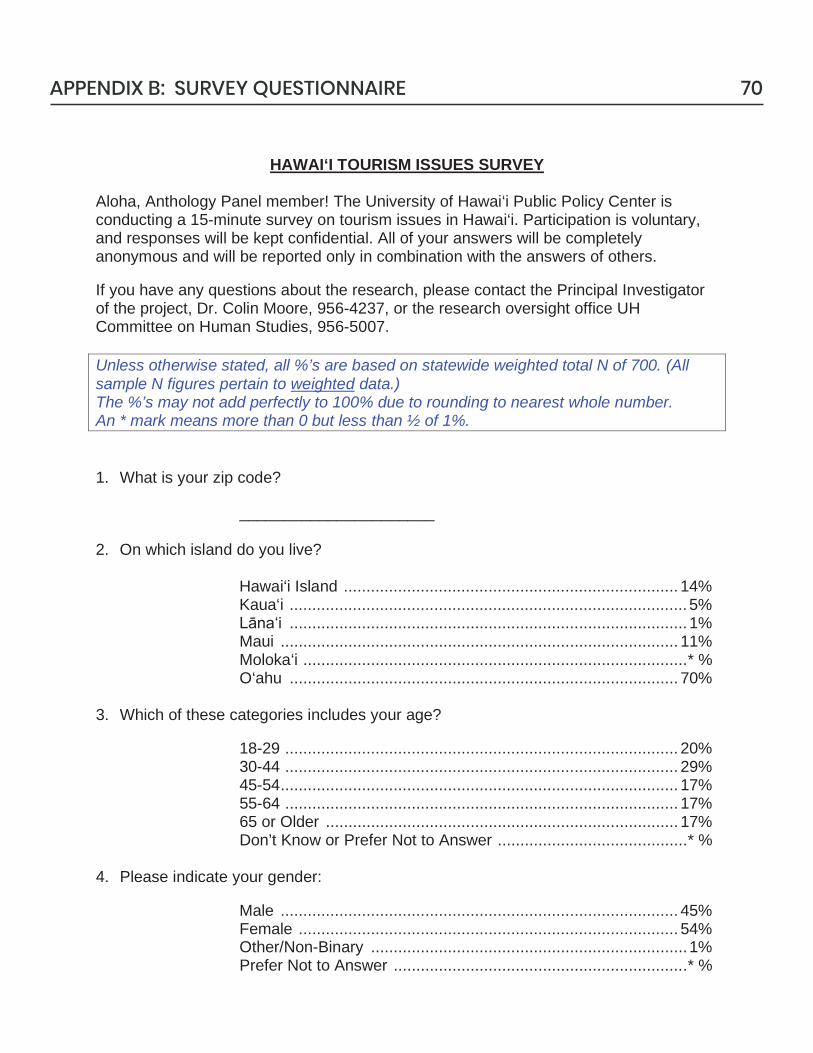
HAWAI‘I TOURISM ISSUES SURVEY
Aloha, Anthology Panel member! The University of Hawai‘i Public Policy Center is conducting a 15-minute survey on tourism issues in Hawai‘i. Participation is voluntary, and responses will be kept confidential. All of your answers will be completely anonymous and will be reported only in combination with the answers of others. If you have any questions about the research, please contact the Principal Investigator of the project, Dr. Colin Moore, 956-4237, or the research oversight office UH Committee on Human Studies, 956-5007. Unless otherwise stated, all %’s are based on statewide weighted total N of 700. (All sample N figures pertain to weighted data.) The %’s may not add perfectly to 100% due to rounding to nearest whole number. An * mark means more than 0 but less than ½ of 1%. 1. What is your zip code?
______________________
2. On which island do you live?
Hawai‘i Island .......................................................................... 14% Kaua‘i ........................................................................................ 5%
........................................................................................ 1% Maui ........................................................................................ 11% Moloka‘i ..................................................................................... * % O‘ahu ...................................................................................... 70%
3. Which of these categories includes your age?
18-29 ....................................................................................... 20% 30-44 ....................................................................................... 29% 45-54 ........................................................................................ 17% 55-64 ....................................................................................... 17% 65 or Older .............................................................................. 17% Don’t Know or Prefer Not to Answer .......................................... * %
4. Please indicate your gender:
Male ........................................................................................ 45% Female .................................................................................... 54% Other/Non-Binary ...................................................................... 1% Prefer Not to Answer ................................................................. * %
70APPENDIX B: SURVEY QUESTIONNAIRE
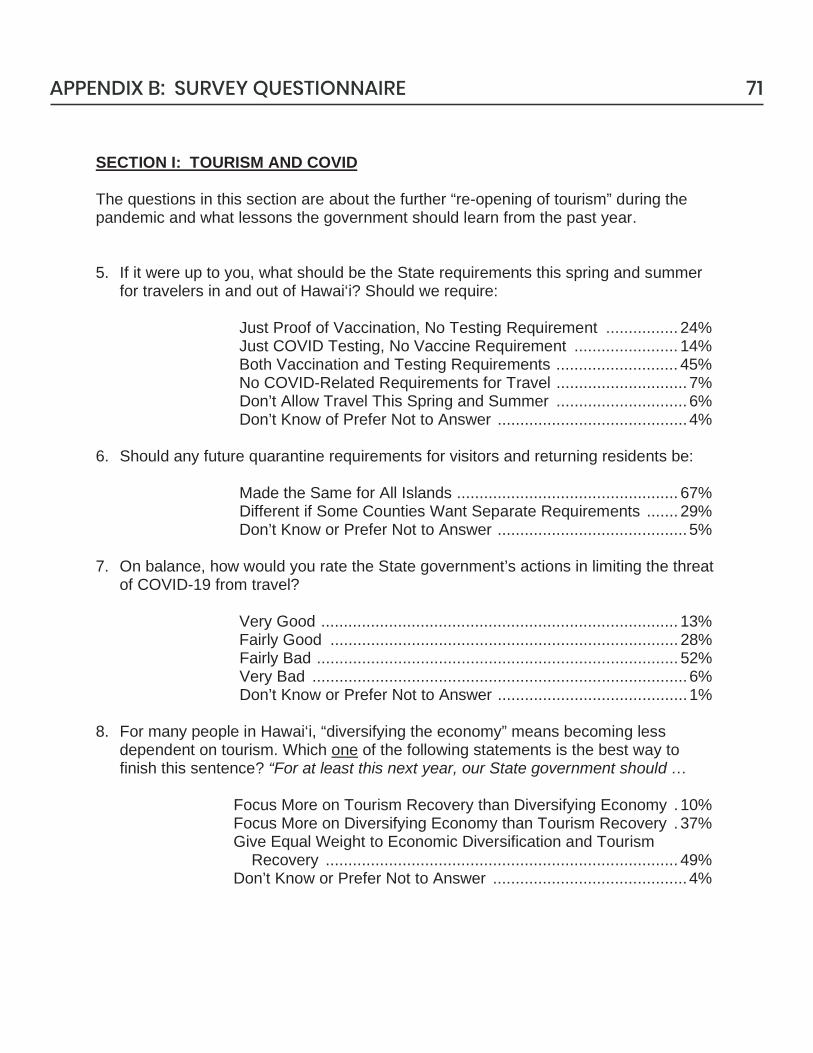
SECTION I: TOURISM AND COVID The questions in this section are about the further “re-opening of tourism” during the pandemic and what lessons the government should learn from the past year. 5. If it were up to you, what should be the State requirements this spring and summer
for travelers in and out of Hawai‘i? Should we require:
Just Proof of Vaccination, No Testing Requirement ................ 24% Just COVID Testing, No Vaccine Requirement ....................... 14% Both Vaccination and Testing Requirements ........................... 45% No COVID-Related Requirements for Travel ............................. 7% Don’t Allow Travel This Spring and Summer ............................. 6% Don’t Know of Prefer Not to Answer .......................................... 4%
6. Should any future quarantine requirements for visitors and returning residents be:
Made the Same for All Islands ................................................. 67% Different if Some Counties Want Separate Requirements ....... 29% Don’t Know or Prefer Not to Answer .......................................... 5%
7. On balance, how would you rate the State government’s actions in limiting the threat
of COVID-19 from travel?
Very Good ............................................................................... 13% Fairly Good ............................................................................. 28% Fairly Bad ................................................................................ 52% Very Bad ................................................................................... 6% Don’t Know or Prefer Not to Answer .......................................... 1%
8. For many people in Hawai‘i, “diversifying the economy” means becoming less dependent on tourism. Which one of the following statements is the best way to finish this sentence? “For at least this next year, our State government should …
Focus More on Tourism Recovery than Diversifying Economy . 10% Focus More on Diversifying Economy than Tourism Recovery . 37% Give Equal Weight to Economic Diversification and Tourism Recovery .............................................................................. 49% Don’t Know or Prefer Not to Answer ........................................... 4%
71APPENDIX B: SURVEY QUESTIONNAIRE
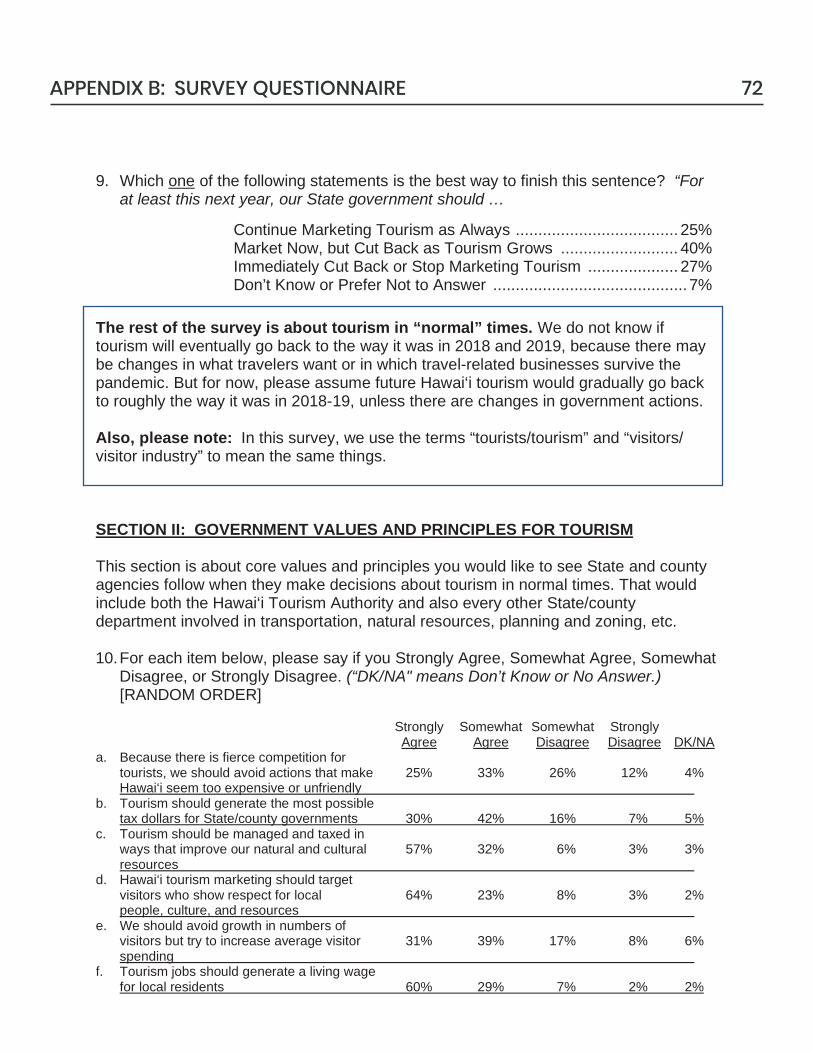
9. Which one of the following statements is the best way to finish this sentence? “For
at least this next year, our State government should …
Continue Marketing Tourism as Always .................................... 25% Market Now, but Cut Back as Tourism Grows .......................... 40% Immediately Cut Back or Stop Marketing Tourism .................... 27% Don’t Know or Prefer Not to Answer ........................................... 7%
The rest of the survey is about tourism in “normal” times. We do not know if tourism will eventually go back to the way it was in 2018 and 2019, because there may be changes in what travelers want or in which travel-related businesses survive the pandemic. But for now, please assume future Hawai‘i tourism would gradually go back to roughly the way it was in 2018-19, unless there are changes in government actions. Also, please note: In this survey, we use the terms “tourists/tourism” and “visitors/ visitor industry” to mean the same things. SECTION II: GOVERNMENT VALUES AND PRINCIPLES FOR TOURISM This section is about core values and principles you would like to see State and county agencies follow when they make decisions about tourism in normal times. That would include both the Hawai‘i Tourism Authority and also every other State/county department involved in transportation, natural resources, planning and zoning, etc. 10. For each item below, please say if you Strongly Agree, Somewhat Agree, Somewhat
Disagree, or Strongly Disagree. (“DK/NA" means Don’t Know or No Answer.) [RANDOM ORDER]
Strongly Somewhat Somewhat Strongly Agree Agree Disagree Disagree DK/NA a. Because there is fierce competition for
tourists, we should avoid actions that make 25% 33% 26% 12% 4% Hawai‘i seem too expensive or unfriendly
b. Tourism should generate the most possible tax dollars for State/county governments 30% 42% 16% 7% 5%
c. Tourism should be managed and taxed in ways that improve our natural and cultural 57% 32% 6% 3% 3% resources
d. Hawai‘i tourism marketing should target visitors who show respect for local 64% 23% 8% 3% 2% people, culture, and resources
e. We should avoid growth in numbers of visitors but try to increase average visitor 31% 39% 17% 8% 6% spending
f. Tourism jobs should generate a living wage for local residents 60% 29% 7% 2% 2%
72APPENDIX B: SURVEY QUESTIONNAIRE
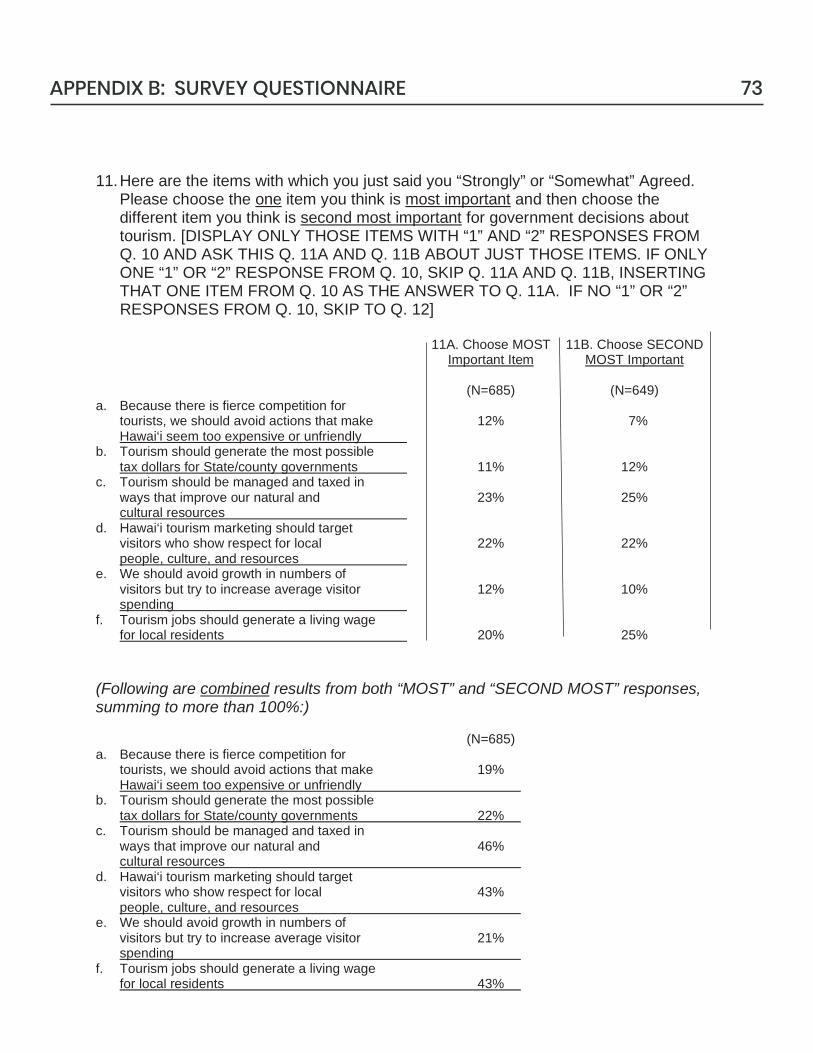
11. Here are the items with which you just said you “Strongly” or “Somewhat” Agreed.
Please choose the one item you think is most important and then choose the different item you think is second most important for government decisions about tourism. [DISPLAY ONLY THOSE ITEMS WITH “1” AND “2” RESPONSES FROM Q. 10 AND ASK THIS Q. 11A AND Q. 11B ABOUT JUST THOSE ITEMS. IF ONLY ONE “1” OR “2” RESPONSE FROM Q. 10, SKIP Q. 11A AND Q. 11B, INSERTING THAT ONE ITEM FROM Q. 10 AS THE ANSWER TO Q. 11A. IF NO “1” OR “2” RESPONSES FROM Q. 10, SKIP TO Q. 12]
11A. Choose MOST 11B. Choose SECOND Important Item MOST Important (N=685) (N=649) a. Because there is fierce competition for
tourists, we should avoid actions that make 12% 7% Hawai‘i seem too expensive or unfriendly
b. Tourism should generate the most possible tax dollars for State/county governments 11% 12%
c. Tourism should be managed and taxed in ways that improve our natural and 23% 25% cultural resources
d. Hawai‘i tourism marketing should target visitors who show respect for local 22% 22% people, culture, and resources
e. We should avoid growth in numbers of visitors but try to increase average visitor 12% 10% spending
f. Tourism jobs should generate a living wage for local residents 20% 25%
(Following are combined results from both “MOST” and “SECOND MOST” responses, summing to more than 100%:) (N=685) a. Because there is fierce competition for
tourists, we should avoid actions that make 19% Hawai‘i seem too expensive or unfriendly
b. Tourism should generate the most possible tax dollars for State/county governments 22%
c. Tourism should be managed and taxed in ways that improve our natural and 46% cultural resources
d. Hawai‘i tourism marketing should target visitors who show respect for local 43% people, culture, and resources
e. We should avoid growth in numbers of visitors but try to increase average visitor 21% spending
f. Tourism jobs should generate a living wage for local residents 43%
73APPENDIX B: SURVEY QUESTIONNAIRE

SECTION III: WHAT CAN/SHOULD GOVERNMENT DO ABOUT TOURISM SIZE? This section looks at issues about tourism size – that is, how many out-of-state visitors come here and use particular places shared with residents. Again, we are asking about normal times, not the pandemic. 12. If it were possible, would you favor some State or county government action that
limits the number of visitors coming to Hawai‘i or to particular islands?
If Possible, Favor Government Limits on Number of Visitors .... 52% Even if Possible, Do Not Favor Local Government Limits......... 34% Don’t Know or Prefer Not to Answer ........................................ 14%
13. In 2019, about 10 million visitors came to Hawai‘i. In normal times, what do you think
would be a good number of visitors per year to target, if possible to do so?
Less than 5 Million .................................................................. 17% 5 to 6 Million ............................................................................ 17% 7 to 8 Million ............................................................................ 18% 9 to 10 Million .......................................................................... 11% Let the Number Grow with Visitor Demand ............................. 27% Don’t Know or Prefer Not to Answer ........................................ 10%
14. Which one of the following statements is the best way to finish this sentence? “To
the extent that this island felt too crowded before the COVID pandemic …
Growth in Tourist Numbers Was Mostly Responsible .............. 37% Growth in Resident Population Was Mostly Responsible ........ 11% Growth in Tourists and Residents Were Equally Responsible . 27% Residents Caused Most, but Tourists Pushed Us Over a Tipping Point ......................................................................... 10% Don’t Believe This Island Feels Too Crowded ......................... 11% Don’t Know or Prefer Not to Answer ......................................... 5%
74APPENDIX B: SURVEY QUESTIONNAIRE
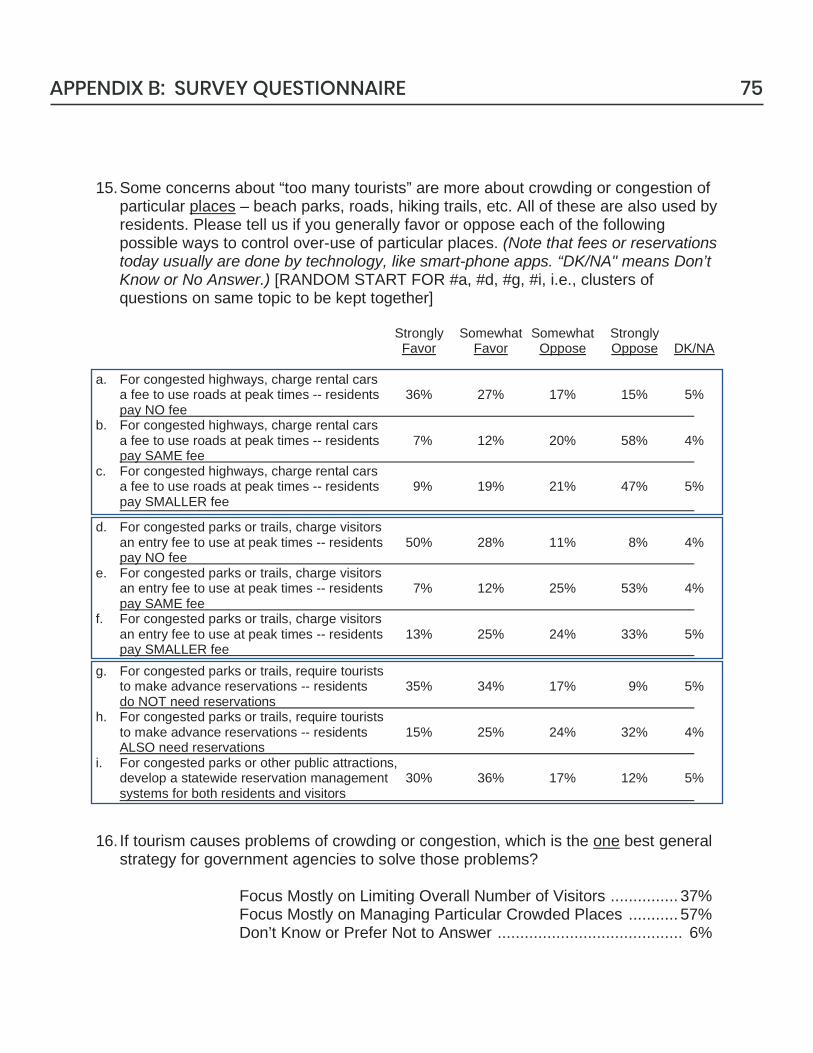
15. Some concerns about “too many tourists” are more about crowding or congestion of particular places – beach parks, roads, hiking trails, etc. All of these are also used by residents. Please tell us if you generally favor or oppose each of the following possible ways to control over-use of particular places. (Note that fees or reservations today usually are done by technology, like smart-phone apps. “DK/NA" means Don’t Know or No Answer.) [RANDOM START FOR #a, #d, #g, #i, i.e., clusters of questions on same topic to be kept together]
Strongly Somewhat Somewhat Strongly Favor Favor Oppose Oppose DK/NA a. For congested highways, charge rental cars
a fee to use roads at peak times -- residents 36% 27% 17% 15% 5% pay NO fee
b. For congested highways, charge rental cars a fee to use roads at peak times -- residents 7% 12% 20% 58% 4% pay SAME fee
c. For congested highways, charge rental cars a fee to use roads at peak times -- residents 9% 19% 21% 47% 5% pay SMALLER fee
d. For congested parks or trails, charge visitors an entry fee to use at peak times -- residents 50% 28% 11% 8% 4% pay NO fee
e. For congested parks or trails, charge visitors an entry fee to use at peak times -- residents 7% 12% 25% 53% 4% pay SAME fee
f. For congested parks or trails, charge visitors an entry fee to use at peak times -- residents 13% 25% 24% 33% 5% pay SMALLER fee
g. For congested parks or trails, require tourists to make advance reservations -- residents 35% 34% 17% 9% 5% do NOT need reservations
h. For congested parks or trails, require tourists to make advance reservations -- residents 15% 25% 24% 32% 4% ALSO need reservations
i. For congested parks or other public attractions, develop a statewide reservation management 30% 36% 17% 12% 5% systems for both residents and visitors
16. If tourism causes problems of crowding or congestion, which is the one best general
strategy for government agencies to solve those problems?
Focus Mostly on Limiting Overall Number of Visitors ............... 37% Focus Mostly on Managing Particular Crowded Places ........... 57% Don’t Know or Prefer Not to Answer ......................................... 6%
75APPENDIX B: SURVEY QUESTIONNAIRE
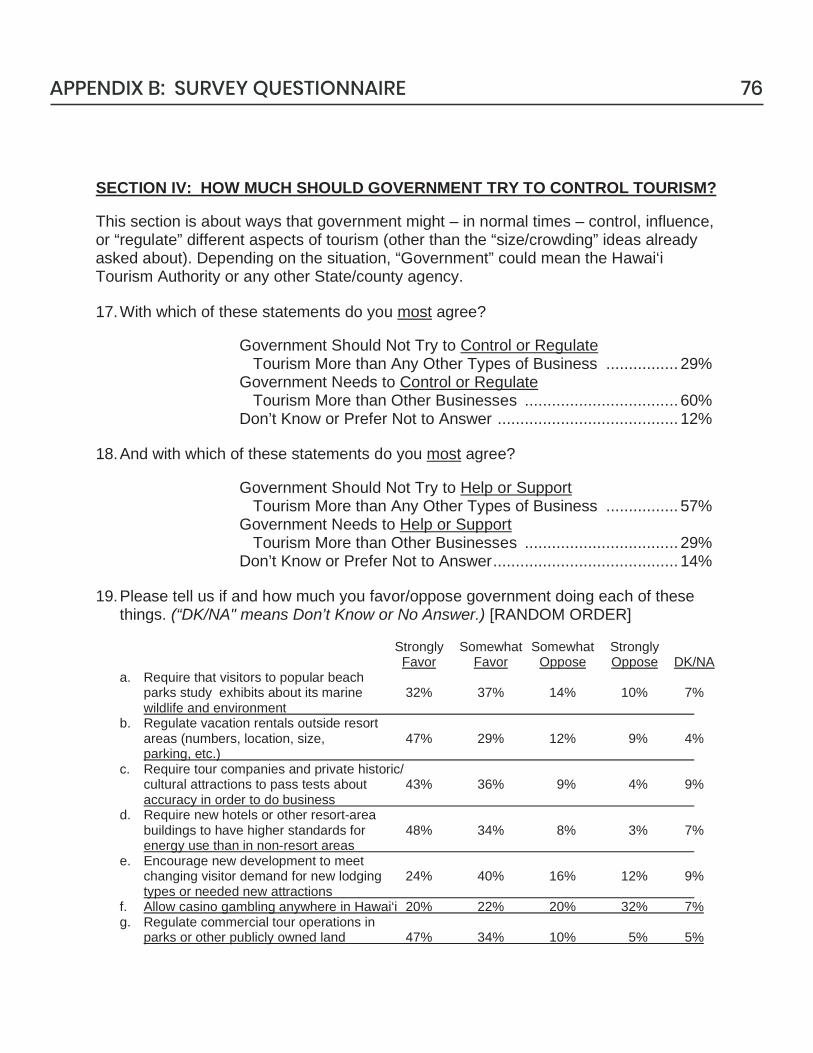
SECTION IV: HOW MUCH SHOULD GOVERNMENT TRY TO CONTROL TOURISM? This section is about ways that government might – in normal times – control, influence, or “regulate” different aspects of tourism (other than the “size/crowding” ideas already asked about). Depending on the situation, “Government” could mean the Hawai‘i Tourism Authority or any other State/county agency. 17. With which of these statements do you most agree?
Government Should Not Try to Control or Regulate Tourism More than Any Other Types of Business ................ 29% Government Needs to Control or Regulate Tourism More than Other Businesses .................................. 60% Don’t Know or Prefer Not to Answer ........................................ 12%
18. And with which of these statements do you most agree?
Government Should Not Try to Help or Support Tourism More than Any Other Types of Business ................ 57% Government Needs to Help or Support Tourism More than Other Businesses .................................. 29% Don’t Know or Prefer Not to Answer ......................................... 14%
19. Please tell us if and how much you favor/oppose government doing each of these
things. (“DK/NA" means Don’t Know or No Answer.) [RANDOM ORDER] Strongly Somewhat Somewhat Strongly Favor Favor Oppose Oppose DK/NA
a. Require that visitors to popular beach parks study exhibits about its marine 32% 37% 14% 10% 7% wildlife and environment
b. Regulate vacation rentals outside resort areas (numbers, location, size, 47% 29% 12% 9% 4% parking, etc.)
c. Require tour companies and private historic/ cultural attractions to pass tests about 43% 36% 9% 4% 9% accuracy in order to do business
d. Require new hotels or other resort-area buildings to have higher standards for 48% 34% 8% 3% 7% energy use than in non-resort areas
e. Encourage new development to meet changing visitor demand for new lodging 24% 40% 16% 12% 9% types or needed new attractions
f. Allow casino gambling anywhere in Hawai‘i 20% 22% 20% 32% 7% g. Regulate commercial tour operations in
parks or other publicly owned land 47% 34% 10% 5% 5%
76APPENDIX B: SURVEY QUESTIONNAIRE
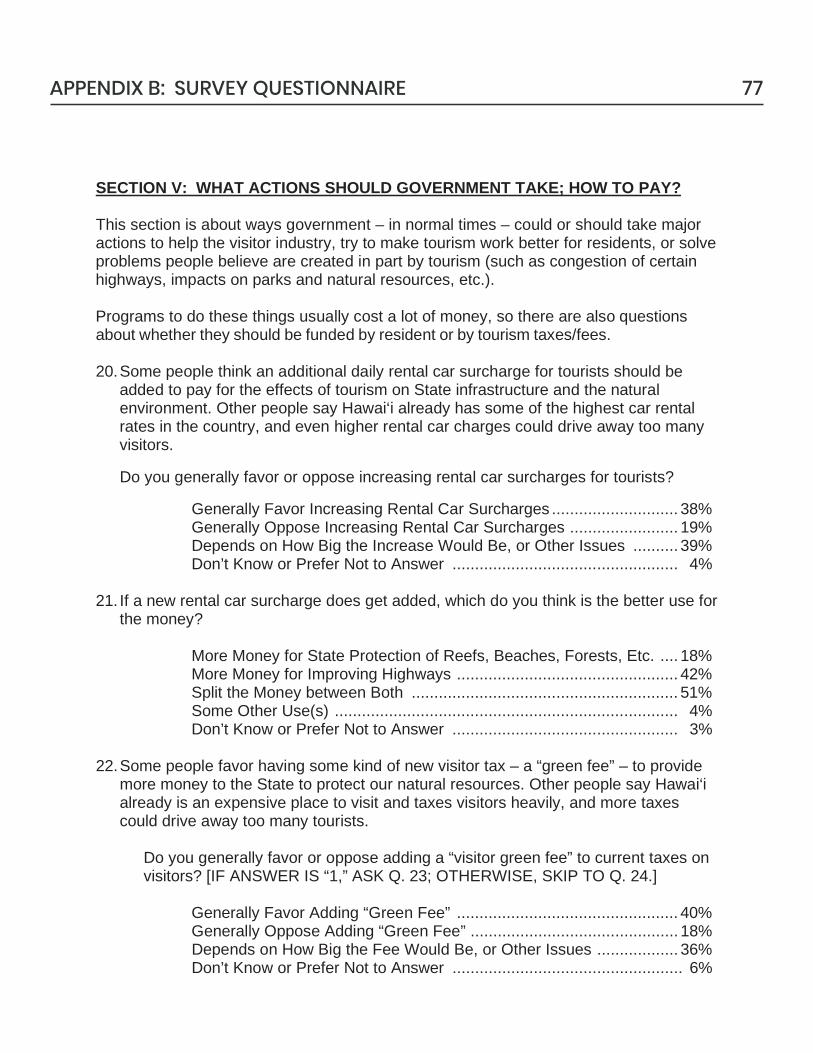
SECTION V: WHAT ACTIONS SHOULD GOVERNMENT TAKE; HOW TO PAY? This section is about ways government – in normal times – could or should take major actions to help the visitor industry, try to make tourism work better for residents, or solve problems people believe are created in part by tourism (such as congestion of certain highways, impacts on parks and natural resources, etc.). Programs to do these things usually cost a lot of money, so there are also questions about whether they should be funded by resident or by tourism taxes/fees. 20. Some people think an additional daily rental car surcharge for tourists should be
added to pay for the effects of tourism on State infrastructure and the natural environment. Other people say Hawai‘i already has some of the highest car rental rates in the country, and even higher rental car charges could drive away too many visitors.
Do you generally favor or oppose increasing rental car surcharges for tourists?
Generally Favor Increasing Rental Car Surcharges ............................ 38% Generally Oppose Increasing Rental Car Surcharges ........................ 19% Depends on How Big the Increase Would Be, or Other Issues .......... 39% Don’t Know or Prefer Not to Answer .................................................. 4%
21. If a new rental car surcharge does get added, which do you think is the better use for
the money?
More Money for State Protection of Reefs, Beaches, Forests, Etc. .... 18% More Money for Improving Highways ................................................. 42% Split the Money between Both ........................................................... 51% Some Other Use(s) ............................................................................ 4% Don’t Know or Prefer Not to Answer .................................................. 3%
22. Some people favor having some kind of new visitor tax – a “green fee” – to provide
more money to the State to protect our natural resources. Other people say Hawai‘i already is an expensive place to visit and taxes visitors heavily, and more taxes could drive away too many tourists.
Do you generally favor or oppose adding a “visitor green fee” to current taxes on visitors? [IF ANSWER IS “1,” ASK Q. 23; OTHERWISE, SKIP TO Q. 24.]
Generally Favor Adding “Green Fee” ................................................. 40% Generally Oppose Adding “Green Fee” .............................................. 18% Depends on How Big the Fee Would Be, or Other Issues .................. 36% Don’t Know or Prefer Not to Answer ................................................... 6%
77APPENDIX B: SURVEY QUESTIONNAIRE
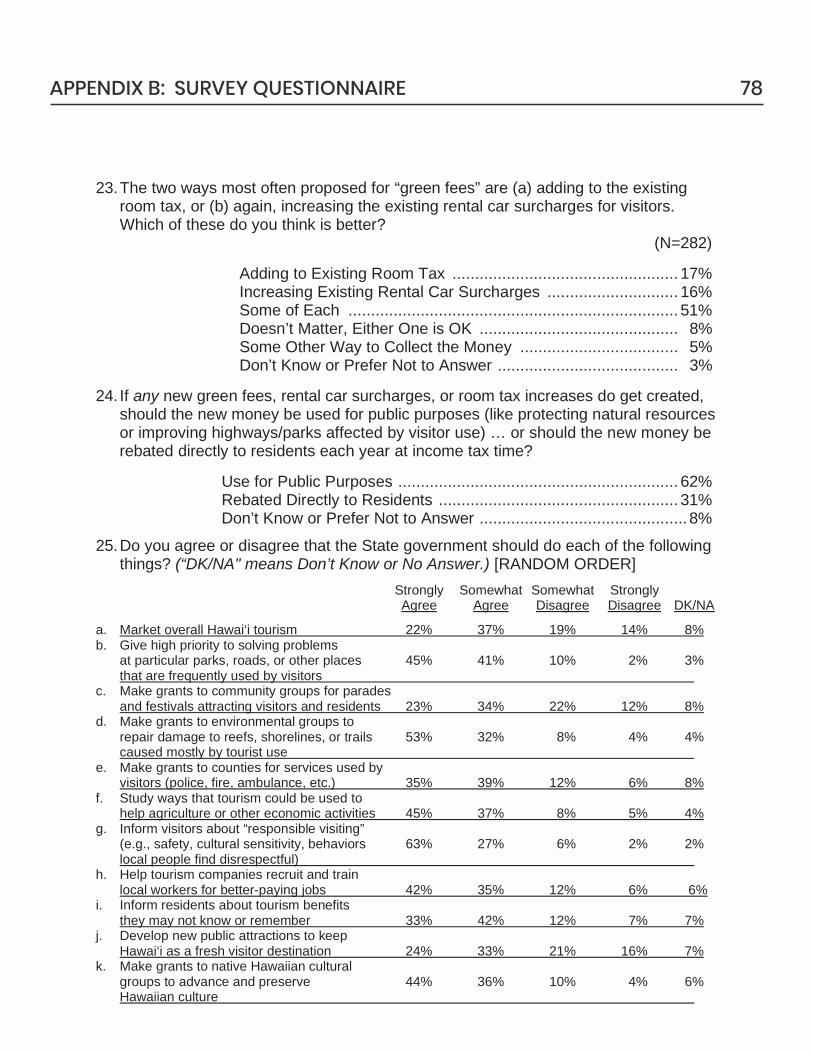
23. The two ways most often proposed for “green fees” are (a) adding to the existing room tax, or (b) again, increasing the existing rental car surcharges for visitors. Which of these do you think is better?
(N=282)
Adding to Existing Room Tax .................................................. 17% Increasing Existing Rental Car Surcharges ............................. 16% Some of Each ......................................................................... 51% Doesn’t Matter, Either One is OK ............................................ 8% Some Other Way to Collect the Money ................................... 5% Don’t Know or Prefer Not to Answer ........................................ 3%
24. If any new green fees, rental car surcharges, or room tax increases do get created,
should the new money be used for public purposes (like protecting natural resources or improving highways/parks affected by visitor use) … or should the new money be rebated directly to residents each year at income tax time?
Use for Public Purposes .............................................................. 62% Rebated Directly to Residents ..................................................... 31% Don’t Know or Prefer Not to Answer .............................................. 8%
25. Do you agree or disagree that the State government should do each of the following things? (“DK/NA" means Don’t Know or No Answer.) [RANDOM ORDER]
Strongly Somewhat Somewhat Strongly Agree Agree Disagree Disagree DK/NA
a. Market overall Hawai‘i tourism 22% 37% 19% 14% 8% b. Give high priority to solving problems
at particular parks, roads, or other places 45% 41% 10% 2% 3% that are frequently used by visitors
c. Make grants to community groups for parades and festivals attracting visitors and residents 23% 34% 22% 12% 8%
d. Make grants to environmental groups to repair damage to reefs, shorelines, or trails 53% 32% 8% 4% 4% caused mostly by tourist use
e. Make grants to counties for services used by visitors (police, fire, ambulance, etc.) 35% 39% 12% 6% 8%
f. Study ways that tourism could be used to help agriculture or other economic activities 45% 37% 8% 5% 4%
g. Inform visitors about “responsible visiting” (e.g., safety, cultural sensitivity, behaviors 63% 27% 6% 2% 2% local people find disrespectful)
h. Help tourism companies recruit and train local workers for better-paying jobs 42% 35% 12% 6% 6%
i. Inform residents about tourism benefits they may not know or remember 33% 42% 12% 7% 7%
j. Develop new public attractions to keep Hawai‘i as a fresh visitor destination 24% 33% 21% 16% 7%
k. Make grants to native Hawaiian cultural groups to advance and preserve 44% 36% 10% 4% 6% Hawaiian culture
78APPENDIX B: SURVEY QUESTIONNAIRE
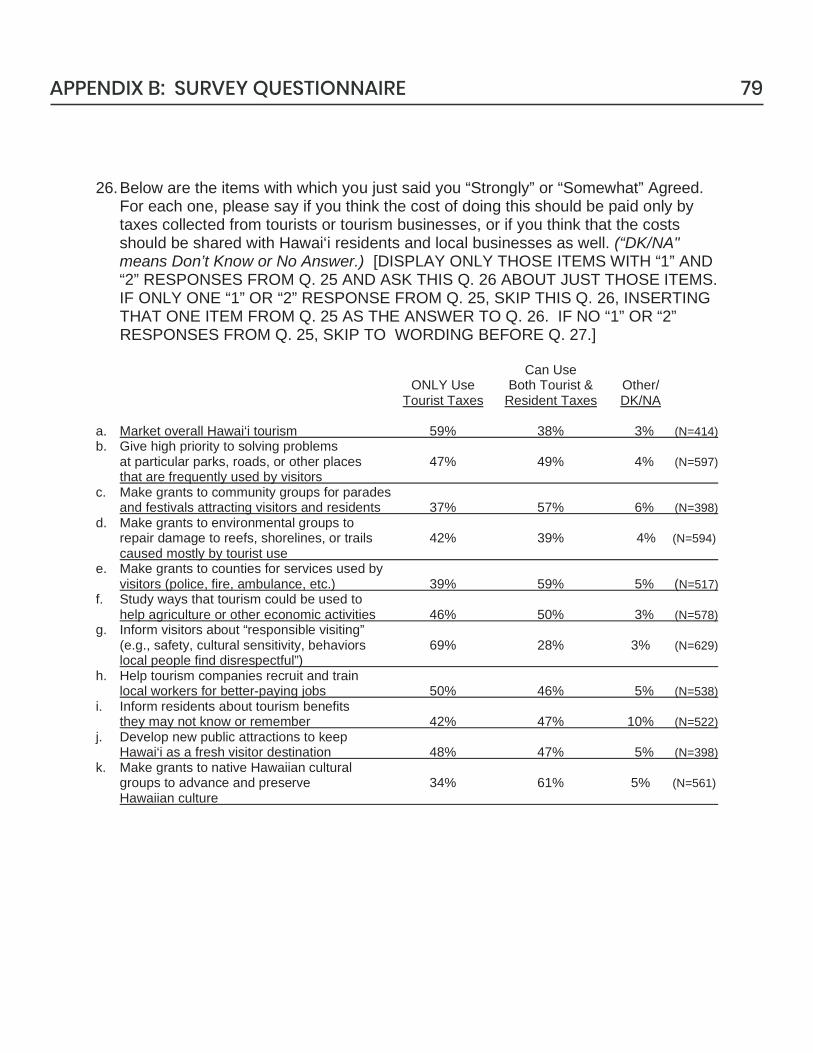
26. Below are the items with which you just said you “Strongly” or “Somewhat” Agreed. For each one, please say if you think the cost of doing this should be paid only by taxes collected from tourists or tourism businesses, or if you think that the costs should be shared with Hawai‘i residents and local businesses as well. (“DK/NA" means Don’t Know or No Answer.) [DISPLAY ONLY THOSE ITEMS WITH “1” AND “2” RESPONSES FROM Q. 25 AND ASK THIS Q. 26 ABOUT JUST THOSE ITEMS. IF ONLY ONE “1” OR “2” RESPONSE FROM Q. 25, SKIP THIS Q. 26, INSERTING THAT ONE ITEM FROM Q. 25 AS THE ANSWER TO Q. 26. IF NO “1” OR “2” RESPONSES FROM Q. 25, SKIP TO WORDING BEFORE Q. 27.]
Can Use ONLY Use Both Tourist & Other/ Tourist Taxes Resident Taxes DK/NA a. Market overall Hawai‘i tourism 59% 38% 3% (N=414) b. Give high priority to solving problems
at particular parks, roads, or other places 47% 49% 4% (N=597) that are frequently used by visitors
c. Make grants to community groups for parades and festivals attracting visitors and residents 37% 57% 6% (N=398)
d. Make grants to environmental groups to repair damage to reefs, shorelines, or trails 42% 39% 4% (N=594) caused mostly by tourist use
e. Make grants to counties for services used by visitors (police, fire, ambulance, etc.) 39% 59% 5% (N=517)
f. Study ways that tourism could be used to help agriculture or other economic activities 46% 50% 3% (N=578)
g. Inform visitors about “responsible visiting” (e.g., safety, cultural sensitivity, behaviors 69% 28% 3% (N=629) local people find disrespectful”)
h. Help tourism companies recruit and train local workers for better-paying jobs 50% 46% 5% (N=538)
i. Inform residents about tourism benefits they may not know or remember 42% 47% 10% (N=522)
j. Develop new public attractions to keep Hawai‘i as a fresh visitor destination 48% 47% 5% (N=398)
k. Make grants to native Hawaiian cultural groups to advance and preserve 34% 61% 5% (N=561) Hawaiian culture
79APPENDIX B: SURVEY QUESTIONNAIRE
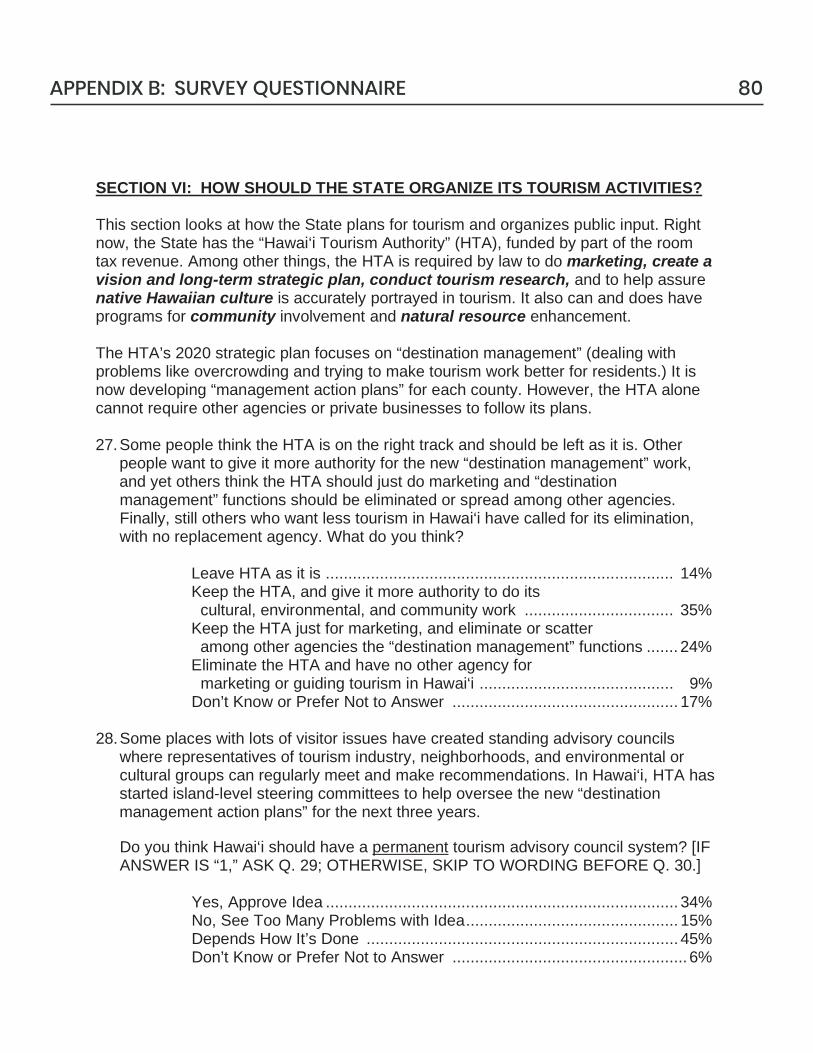
SECTION VI: HOW SHOULD THE STATE ORGANIZE ITS TOURISM ACTIVITIES? This section looks at how the State plans for tourism and organizes public input. Right now, the State has the “Hawai‘i Tourism Authority” (HTA), funded by part of the room tax revenue. Among other things, the HTA is required by law to do marketing, create a vision and long-term strategic plan, conduct tourism research, and to help assure native Hawaiian culture is accurately portrayed in tourism. It also can and does have programs for community involvement and natural resource enhancement. The HTA’s 2020 strategic plan focuses on “destination management” (dealing with problems like overcrowding and trying to make tourism work better for residents.) It is now developing “management action plans” for each county. However, the HTA alone cannot require other agencies or private businesses to follow its plans. 27. Some people think the HTA is on the right track and should be left as it is. Other
people want to give it more authority for the new “destination management” work, and yet others think the HTA should just do marketing and “destination management” functions should be eliminated or spread among other agencies. Finally, still others who want less tourism in Hawai‘i have called for its elimination, with no replacement agency. What do you think?
Leave HTA as it is ............................................................................. 14% Keep the HTA, and give it more authority to do its cultural, environmental, and community work ................................. 35% Keep the HTA just for marketing, and eliminate or scatter among other agencies the “destination management” functions ....... 24% Eliminate the HTA and have no other agency for marketing or guiding tourism in Hawai‘i ........................................... 9% Don’t Know or Prefer Not to Answer .................................................. 17%
28. Some places with lots of visitor issues have created standing advisory councils
where representatives of tourism industry, neighborhoods, and environmental or cultural groups can regularly meet and make recommendations. In Hawai‘i, HTA has started island-level steering committees to help oversee the new “destination management action plans” for the next three years.
Do you think Hawai‘i should have a permanent tourism advisory council system? [IF ANSWER IS “1,” ASK Q. 29; OTHERWISE, SKIP TO WORDING BEFORE Q. 30.]
Yes, Approve Idea .............................................................................. 34% No, See Too Many Problems with Idea ............................................... 15% Depends How It’s Done ..................................................................... 45% Don’t Know or Prefer Not to Answer .................................................... 6%
80APPENDIX B: SURVEY QUESTIONNAIRE
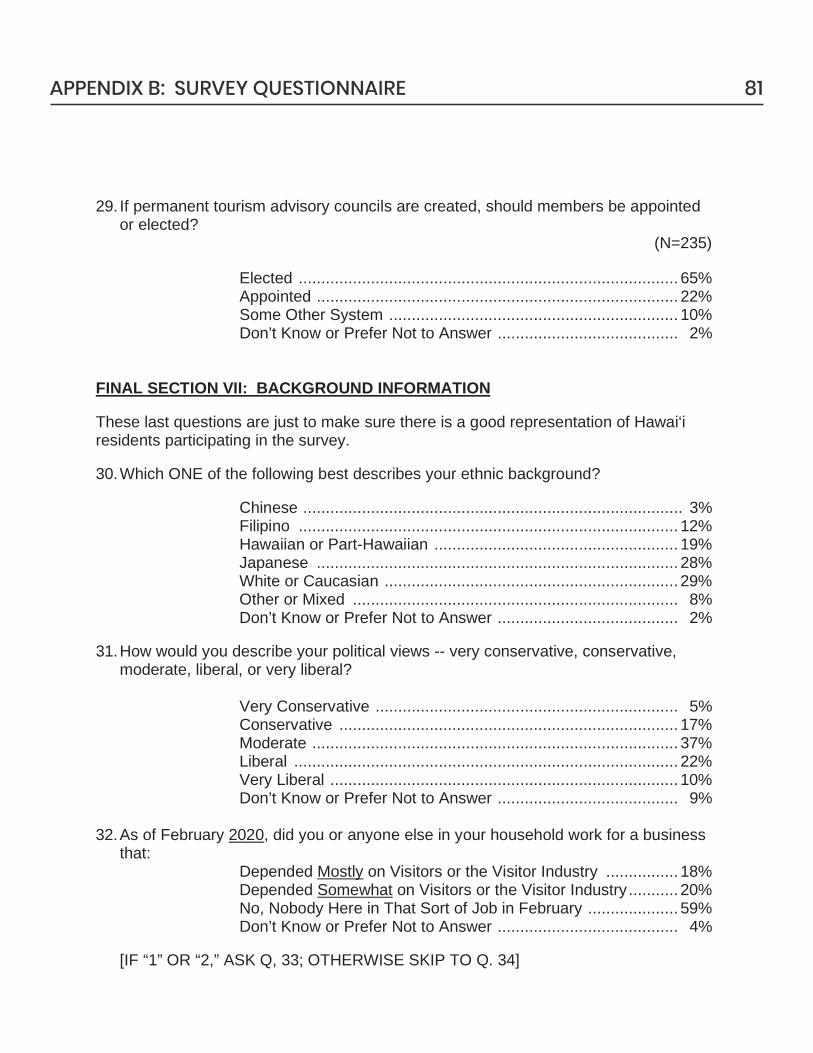
29. If permanent tourism advisory councils are created, should members be appointed
or elected? (N=235)
Elected .................................................................................... 65% Appointed ................................................................................ 22% Some Other System ................................................................ 10% Don’t Know or Prefer Not to Answer ........................................ 2%
FINAL SECTION VII: BACKGROUND INFORMATION These last questions are just to make sure there is a good representation of Hawai‘i residents participating in the survey. 30. Which ONE of the following best describes your ethnic background?
Chinese .................................................................................... 3% Filipino .................................................................................... 12% Hawaiian or Part-Hawaiian ...................................................... 19% Japanese ................................................................................ 28% White or Caucasian ................................................................. 29% Other or Mixed ........................................................................ 8% Don’t Know or Prefer Not to Answer ........................................ 2%
31. How would you describe your political views -- very conservative, conservative,
moderate, liberal, or very liberal?
Very Conservative ................................................................... 5% Conservative ........................................................................... 17% Moderate ................................................................................. 37% Liberal ..................................................................................... 22% Very Liberal ............................................................................. 10% Don’t Know or Prefer Not to Answer ........................................ 9%
32. As of February 2020, did you or anyone else in your household work for a business
that: Depended Mostly on Visitors or the Visitor Industry ................ 18% Depended Somewhat on Visitors or the Visitor Industry ........... 20% No, Nobody Here in That Sort of Job in February .................... 59% Don’t Know or Prefer Not to Answer ........................................ 4%
[IF “1” OR “2,” ASK Q, 33; OTHERWISE SKIP TO Q. 34]
81APPENDIX B: SURVEY QUESTIONNAIRE
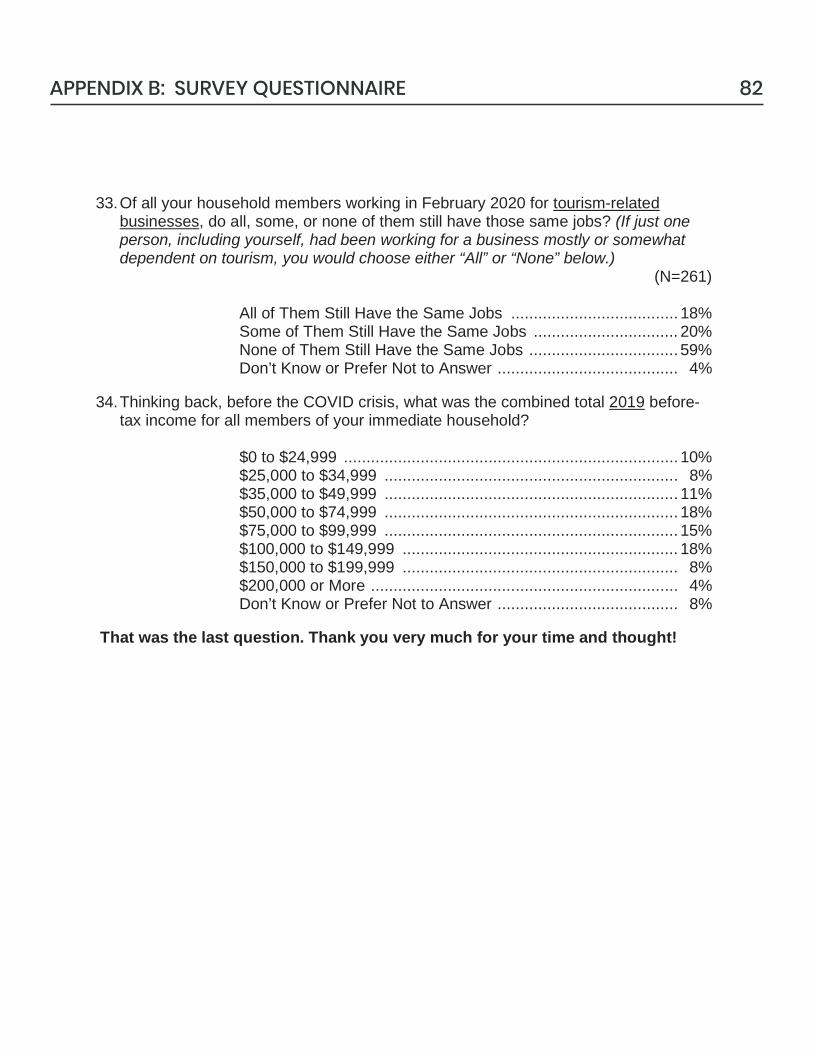
33. Of all your household members working in February 2020 for tourism-related
businesses, do all, some, or none of them still have those same jobs? (If just one person, including yourself, had been working for a business mostly or somewhat dependent on tourism, you would choose either “All” or “None” below.) (N=261)
All of Them Still Have the Same Jobs ..................................... 18% Some of Them Still Have the Same Jobs ................................ 20% None of Them Still Have the Same Jobs ................................. 59% Don’t Know or Prefer Not to Answer ........................................ 4%
34. Thinking back, before the COVID crisis, what was the combined total 2019 before-
tax income for all members of your immediate household?
$0 to $24,999 .......................................................................... 10% $25,000 to $34,999 ................................................................. 8% $35,000 to $49,999 ................................................................. 11% $50,000 to $74,999 ................................................................. 18% $75,000 to $99,999 ................................................................. 15% $100,000 to $149,999 ............................................................. 18% $150,000 to $199,999 ............................................................. 8% $200,000 or More .................................................................... 4% Don’t Know or Prefer Not to Answer ........................................ 8%
That was the last question. Thank you very much for your time and thought!
82APPENDIX B: SURVEY QUESTIONNAIRE