managing sickness absence and return to · pdf filethe purpose of this sickness absence...
TRANSCRIPT
Executive Health and Safety
Managing sickness absence and return to work Trial and assessment of a sickness absence recording tool
Prepared by the University of Glasgow for the Health and Safety Executive 2009
RR690 Research Report
Executive Health and Safety
Managing sickness absence and return to work Trial and assessment of a sickness absence recording tool
Dr Nundita Reetoo, Ms J Burrows & Dr Ewan Macdonald Healthy Working Lives Group Public Health and Health Policy University of Glasgow 1 Lilybank Gardens Glasgow G12 8RZ
The purpose of this Sickness Absence Management project (SAM) is to further evaluate the utility of the Sickness Absence Recording Tool (SART) software in the context of other support services available to assist Small and Medium sized Enterprises in their management of sickness absence. The SAM project was developed by the Healthy Working Lives Group of the University of Glasgow, which utilised its extensive network of the key stakeholder organisations in Scotland. These organisations were part of established support services available to participating SMEs. In addition, SAM services included health promotion and occupational health and safety advice from the Scottish Centre for Healthy Working Lives (SCHWL) of NHS Scotland, the provision of free seminars on how to manage sickness absence, a website, newsletters and an advice line.
This report and the work it describes were funded by the Health and Safety Executive (HSE). Its contents, including any opinions and/or conclusions expressed, are those of the authors alone and do not necessarily reflect HSE policy.
HSE Books
© Crown copyright 2009
First published 2009
All rights reserved. No part of this publication may be reproduced, stored in a retrieval system, or transmitted in any form or by any means (electronic, mechanical, photocopying, recording or otherwise) without the prior written permission of the copyright owner.
Applications for reproduction should be made in writing to:Licensing Division, Her Majesty’s Stationery Office,St Clements House, 2-16 Colegate, Norwich NR3 1BQor by e-mail to [email protected]
ii
MANAGING SICKNESS ABSENCE AND RETURN TO WORK: Trial and assessment of a sickness absence recording tool
1
TABLE OF CONTENTS
1 Executive Summary ...................................................................................................................... 3
2 Introduction................................................................................................................................... 7
3 Project Aims ................................................................................................................................10
4 Project Methodology................................................................................................................... 11
4.1 Project Partnership ............................................................................................................. 11
4.2 Project Design ..................................................................................................................... 12
4.3 SAM Project Marketing ....................................................................................................... 15
4.4 Project Recruitment............................................................................................................. 20
4.5 SART Software..................................................................................................................... 21
4.6 SART user manual ............................................................................................................... 22
4.7 SART Installation ................................................................................................................ 23
4.8 Support to organisations ..................................................................................................... 24
4.9 Data Collection ................................................................................................................... 24
4.10 Data Analysis ...................................................................................................................... 26
5 SAM Project Piloting .................................................................................................................. 27
6 SAM Project Participant Profile................................................................................................ 29
6.1 Recruitment ......................................................................................................................... 29
6.2 Participant Profile............................................................................................................... 29
6.3 Organisation Profiles .......................................................................................................... 31
7 Feedback from SAM participants ............................................................................................. 34
7.1 Timed Feedback .................................................................................................................. 34
7.2 Informal Feedback .............................................................................................................. 45
7.3 Feedback from Focus Groups ............................................................................................. 47
8 Sickness Absence Data from SMEs ........................................................................................... 52
8.1 Sickness Absence spells per employees ............................................................................... 52
8.2 Days lost per spell of absence ............................................................................................. 53
8.3 Long And Short-Term Sickness Absences............................................................................ 53
8.4 Short Term Absences ........................................................................................................... 56
8.5 Long Term Sickness Absence............................................................................................... 58
8.6 Causes Of Sickness Absence................................................................................................ 58
9 Discussion .................................................................................................................................... 61
10 Conclusions.................................................................................................................................. 67
11 Recommendations ....................................................................................................................... 69
12 References.................................................................................................................................... 70
2

1 Executive Summary
1. Sickness Absence is an issue for employers and employees; is a major cause of
low efficiency of enterprises; may be due to work related ill health and
therefore identify the need for new interventions in the workplace; is a target
for reduction within the public sector; and can ultimately lead to long term
incapacity and worklessness which is one of the most important causes of
health inequalities in the United Kingdom.
2. Small and medium sized enterprises (SME) have less access to Occupational
health and safety services, information technology (IT), Human resources
(HR), and other services. The Support Programme Action Group report of
Securing Health Together recognised that they need more support in the
management of occupational health and safety issues.
3. As part of this theme of work the Health and Safety Executive (HSE)
commissioned the Institute of Occupational Medicine (Edinburgh) to develop
a Sickness Absence Recording Tool (SART) for Small and Medium
Enterprises (SME) and SART was developed and produced after limited
piloting in 2005.
4. The purpose of this Sickness Absence Management project (SAM) is to
further evaluate the utility of the Sickness Absence Recording Tool (SART)
software in the context of other support services available to assist Small and
Medium sized Enterprises in their management of sickness absence. The
SAM project was developed by the Healthy Working Lives Group of the
University of Glasgow, which utilised its extensive network of the key
stakeholder organisations in Scotland. These organisations were part of
established support services available to participating SMEs. In addition, SAM
services included health promotion and occupational health and safety advice
from the Scottish Centre for Healthy Working Lives (SCHWL) of NHS
Scotland, the provision of free seminars on how to manage, a website,
newsletters and an advice line.
3
5. The evaluation utilised both qualitative and quantitative assessment.
Participating organisations were encouraged to return sickness absence data
monthly to the project team to enable analysis of the causes of sickness
absence in this sector and observe any trends in sickness absence in these
organisations during the period of the study.
6. Of the 311 organisations that expressed interest in this project, 186 agreed to
participate in the project, 158 installed the SART software, more than 106
returned some data to the SAM research team at the University of Glasgow,
and 74 submitted data for at least eight months.
7. The Sickness Absence Recording Tool (SART) works but during the project
required further development of the software platform to facilitate
downloading, integration with existing company systems and ease of use. This
was an early finding of this project and that additional development work was
undertaken by the IOM. The SART and its use during the project also
required dedicated IT support from the SAM team and the original plan to
equip the regional advisers of the SCHWL to be able to provide this support
proved unrealistic.
8. Organisations that participated in the SAM project and returned their data to
the project team, in general showed a slight downward trend in their sickness
absence levels during the course of the evaluation. Qualitative feedback was
that the SART provided better and in many cases new information, and helped
managers manage sickness absence. It also led to other interventions regarding
Health and Safety, occupational health, and involvement with the SCHWL
advisers. It was not possible to measure the impact of any subsequent
interventions.
9. An important finding of this evaluation was the level of support which SMEs
required. This support was for both the installation and effective running of
the software, and the general advice and training in the management of
Sickness absence available within the SAM project. The coordinated support
provided by the SAM project was highly regarded by SMEs and services such
as the seminars were very well attended.
4
10. It is recommended that SART should be developed and further refined to aid
installation and data reporting. A web-based option was suggested by users.
Based on findings of this evaluation, it also requires to be provided within a
framework of support to the SME sector and it is unlikely to be effective
unless delivered as part of a coordinated support service such as provided by
SCHWL.
11. The management of sickness absence needs to be improved across the UK and
the early identification and appropriate management of the sick employee can
highlight the need for both work place and health interventions that can reduce
long term incapacity.
5
Recommendations
1. The software should be modified to facilitate installation and use. A web
format was suggested by the participants.
2. The report generation facility should be enhanced to provide graphical
representation and trend analysis.
3. The SART tool should be developed to provide better signposting and links to
other advisory and support systems available including health and safety and
to encourage their uptake where appropriate. e.g. the SCHWL advisory service
in Scotland and equivalent services in England and Wales.
4. The SME sector requires more support in managing sickness absence and the
health of the workforce, and appropriate support systems need to be further
developed.
5. The SART tool should be further developed and made more widely available
to SMEs and other industry sectors.
6. There is a clear need for the provision of free or low cost training to this
sector.
6
2 Introduction
Sickness absence is generally defined as absence from work that is attributed to
sickness by the employee and accepted as such by the employer. It can be related or
unrelated to work, or related to workplace conditions and have a significant effect on
all enterprises and on the economy. While there is no legal duty for an employer to
manage absence it is essential in the management of all aspects of health in the
workplace to both prevent ill health and rehabilitate sick and disabled workers back to
employment. Larger organisations tend to track and manage sickness absence on a
more regular basis than small and medium sized enterprises (SMEs).
Facts:
• Small to medium sized enterprises make up nearly 99% of private sector
business
• Absence from work cost British businesses over £13 billion in 2006 according
to recent surveys conducted by the Chartered Institute of Personnel and
Development (CIPD, 2007) and the Confederation of British Industry (CBI,
2007). This represented an average cost of £659 per worker (CIPD, 2007)
• The CBI estimates that 175 million days were lost through sickness absence,
an average of 7days per employee(CBI, 2007) or an average of 5.07 days lost
per spell of absence (Spurgeon et al., 2007)
• The Securing Health Together (HSE, 2000) report suggested a target for
reduction of work related ill health and sickness absence across the UK. As a
response, in Scotland for example, the Scottish strategy for the improvement
of the health of working age population has been described in Healthy
Working Lives Strategy (HWL, 2004).
• A recent report has highlighted that the overall cost of disability and work
incapacity in the UK approached £100 billion per annum (Black, 2008).
• Absence leads to worklessness, which is the main cause of health inequalities
for the working age population and their children in the UK.
7
A key step in improving health at work (and in particular occupational health risks) is
to achieve a greater understanding of the issues and the skills to address them within
human resource management. The management of sickness absence and effective
return to work are central to ensuring a healthy, productive and present workforce and
the control of workplace health and safety risks.
To support employers in improving their practices in managing health at work, the
UK Health and Safety Executive (HSE) identified the need to develop common tools,
structures and guidelines to collect, classify, and record sickness absence data, and in
particular to identify potential work related causes, in a way that would be useful to
businesses. The HSE contracted the Institute of Occupational Medicine (IOM) to
develop a sickness absence-recording tool (SART), which is designed to help small
and medium sized enterprises record, monitor and analyse absence data as a means to
better manage sickness absence and return to work (Ritchie et al., 2005). The SART
tool aims to help organisations analyse sickness absence information in a systematic
and coherent manner and link to advice and best practice information. This can help
identify what individual and organisational interventions should be put in place to
prevent sickness absence, and help longer-term-sick employees return to work.
The SART tool was developed using the Microsoft™ Access Database Management
System (MS Access), and requires a computer to be equipped with Microsoft Access
to use it. Small organisations do not necessarily have MS Access set up on their
personal computers (PC). The inclusion of a “run-time” version allowed
organisations who did not have the MS Access system or other Microsoft Office™
products to run SART.
The IOM carried out a limited testing of the SART with 55 SMEs to validate the
software for a period of 8 to 10 weeks but feedback was obtained from 18 of the
organisations with the majority of these being medium to large organisations, and real
data was entered by only 7 of these (Ritchie et al., 2005).
The Sickness Absence Management (SAM) project was set up to further evaluate the
potential of the tool in managing sickness absence in SMEs in Scotland. In this
project the SAM team worked in close collaboration with a number of partners, some
of whom offered free advice and services to SMEs in Scotland. Therefore, in addition
8
to receiving the SART tool, organisations taking part in the project also received
advice and access to services from the SAM team and partner organisations.
In this evaluation, one of the key research questions developed by the SAM team was:
Would a more systematic and rigorous approach to sickness management by SMEs be
beneficial in leading to improvements in their sickness absence (including work-
related) levels, their management of health and safety and general health of their
workforce?
9
3 Project Aims
• To investigate the developmental needs for the SART for use by
occupational health and safety support providers
• To further develop the SART package for marketing
• To identify the needs for sickness absence management in the target
population
• To gather data on the utility of the tool in the management of sickness
absence and return to work.
• To gather data on the contribution of the tool to the control of health and
safety risks
• To examine the potential of SART to identify individuals and
organisations requiring ‘Healthy Working Lives’ interventions
• To identify the level of mentoring and support required by the participating
organisations to use the tool and manage sickness absence
• To assess what additional services, resources and support might be
required to realise the project’s full potential
10
4 Project Methodology
In this report, small organisations are defined as organisations with less than 50
employees and medium sized organisations are defined as organisations with 50 to
250 employees. Short-term sickness absence is defined as absence for less than or
equal to 20 days while long term absences are for absences above 20 days.
4.1 Project Partnership
Since the project was aimed at recruiting small to medium sized enterprises, a
network of organisations were approached to help steer the project. The project was
geographically limited to Scotland to take advantage of the established network of the
Healthy Working Lives Group of the University of Glasgow.
A project advisory committee/steering group was established to particularly help
inform the research group about the ways to approach local SMEs and encourage
participation in the project and also to ensure a wide representation of stakeholders. A
working group was also established which helped with project marketing, recruitment
of organisations and delivery of training, seminars, workshops and conferences. A
number of other organisations such as Business Gateway and Edinburgh Voluntary
Organisations Council also collaborated in the project by providing venues for the
seminars/workshops and informing their members about the project.
• ADVISORY COMMITTEE/STEERING GROUP
The Advisory Committee consisted of representatives from:
o Salus Occupational Health and Safety (SALUS),
o Safe and Healthy Working(S&HW)*,
o Scotland’s Health at Work (SHAW)*,
o Glasgow Chamber of Commerce (GCCom),
o Scottish Engineering (SEng),
o Development and Regeneration Services, Glasgow City Council
(GCC),
o Scottish Trade Union Council (STUC),
o Health & Safety Executive (HSE),
11
o Institute of Occupational Medicine (IOM),
o Confederation of British Industry (CBI),
o Chartered Institute of Personnel and Development (CIPD),
o Federation of Small Business (FBS),
o HealthyReturn.
The advisory committee met on a quarterly basis.
(* which during the course of the project merged to become the Scottish Centre for
Healthy Working Lives SCHWL)
• WORKING GROUP
A working group consisting of the HWL group research team from the University of
Glasgow’s Public Health and Health Policy Section, SCHWL, HealthyReturn and
Scottish Engineering was also established. The working group met on a monthly
basis for the first year of the project and a quarterly basis after the recruitment phase.
• PROJECT TEAM
The project team consisted of the project Director, Dr Ewan Macdonald Head of The
Healthy Working Lives Group (HWLG), The Project Manager, Dr Nundita Reetoo,
Marketing Officer/ IT Consultant Ms Jayne Burrows, IT Consultant Mr Keith Murray,
part time support-staff and other members of the HWL group.
4.2 Project Design
SAM project participants were recruited from SMEs in Scotland as described below.
Participants were offered the SART tool to record and monitor sickness absence in
their business and a number of associated advice and services to help them manage
sickness in their business.
Services associated with the tool included:
• Tailor made seminars/workshops on sickness absence management
• Training on how to use SART
• Technical assistance through the SAM project team
12
• Information about a number of resources on managing absence including
the recently developed free and confidential national advice line for
employees and employers
• Access to services offered by the partner organisations including
o confidential, high-quality health and safety information, advice and
support
o pro-active help with health promotion in the workplace
o professional advisers available throughout Scotland to carry out a
workplace health and safety needs assessment
• Signposting to local services which could benefit employers and
employees, including free services available through the Scottish Centre
for Healthy Working Lives.
• Free advice through the project website and links to many other related
workplace health services through the links section on the website
As part of meeting the project aims to gather data on the utility of the tool in the
management of sickness absence; its contribution if any to health and safety risks; to
identify individuals requiring environmental, health or safety interventions; and to
identify the level of mentoring and support required, participating organisations were
encouraged to send anonymised datasets of their sickness absence using the SART
report tool to the SAM team. It was also thought useful in terms of gaining better
understanding of sickness absence causes and incidence in SMEs.
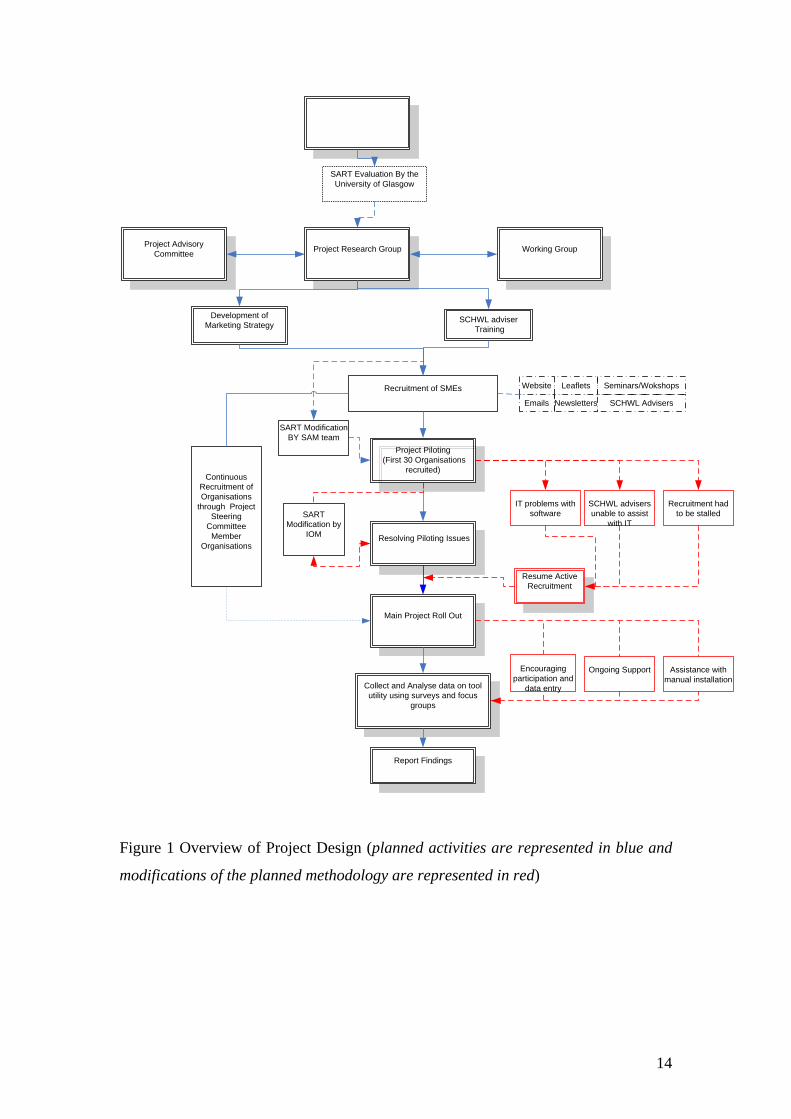
Participants were therefore required to send a monthly Email to the SAM project,
attaching automatically SART generated anonymised data for data analysis and
provide the research team with feedback on how the SAM project is helping to
manage absence over a 12-month period though feedback surveys and participation in
organised focus groups. Figure 1 shows an outline of the project plan. The boxes in
red outline deviations from the original plan.
13
Development of SART by IOM for HSE
iSART Evaluation By the Univers ty of Glasgow
Project Advisory Project Research Group Working Group Committee
Development of SCHWL adviserMarketing Strategy Training
Recruitment of SMEs Website Leaflets Seminars/Wokshops
Emails Newsletters SCHWL Advisers
SART Modification BY SAM team
Project Piloting (First 30 Organisations
recruited)Continuous
Recruitment ofOrganisations
through Project IT problems with SCHWL advisers Recruitment had software unable to assist to be stalled Steering SART
Committee Modification by with IT Member IOM Resolving Piloting Issues
Organisations
Resume Active Recruitment
Main Project Roll Out
Encouraging Ongoing Support Assistance with participation and manual installation
Collect and Analyse data on tool data entry utility using surveys and focus
groups
Report Findings
Figure 1 Overview of Project Design (planned activities are represented in blue and
modifications of the planned methodology are represented in red)
14
4.3 SAM Project Marketing It was recognised from the outset that to ensure recruitment, a comprehensive
marketing strategy was required to market to package to organisations, utilizing the
network and experience of the project partners. This included ensuring that the SART
package was user friendly prior to marketing. Much of the marketing was done by a
one to one approach from a variety of advisers and other employees across all of the
partner organisations. To back this up, a number of standard tools were developed
4.3.1 Marketing Tools
SAM project Logo
A project logo (Figure 2) was designed to help private organisations relate to a
solution or help to their business on absence management, instead of just being
associated with an academic institute or a governmental organisation.
Figure 2: SAM Logo
Business stationery
The advisory committee advised that this was very important for overall brand
identity and recognition. Good quality headed paper and business cards were
produced with all relevant contact details, as well as listing partners.
SAM project pack
A SAM project pack was prepared in the form of a custom-designed A4 sized plastic
folder with the SAM logo. The pack was designed to contain the SART software, the
user manual and information about the SAM partners and associated services. This
pack was distributed to SAM project participants upon registration with the project.
15
Leaflets
Consistency of the message being delivered to potential participants was key to the
success of recruitment and a leaflet provided all partners with standard information to
send to or leave with contacts. The leaflet was intended to impart basic information on
SAM, give vital contact details and identify the partners. It was used in mailings,
distributed with presentations and at conferences, seminars and exhibitions. It was
produced in both a printed and electronic format. A copy of the leaflet used can be
seen in Appendix 6.
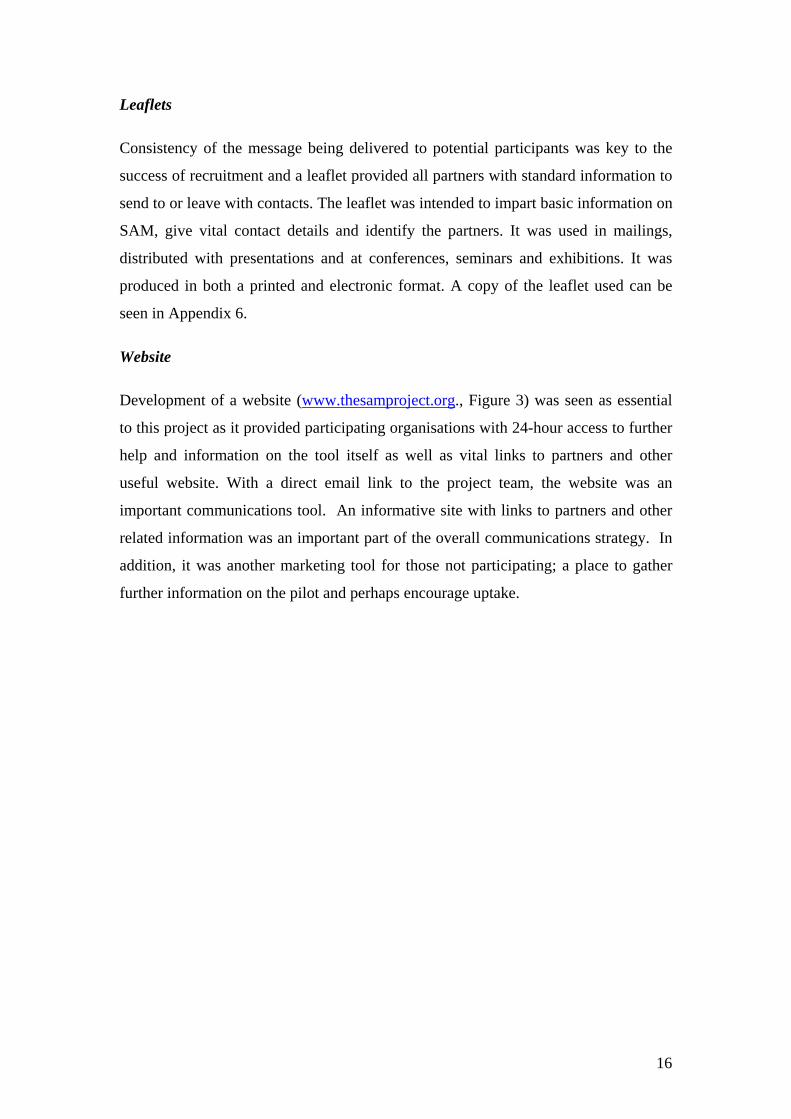
Website
Development of a website (www.thesamproject.org., Figure 3) was seen as essential
to this project as it provided participating organisations with 24-hour access to further
help and information on the tool itself as well as vital links to partners and other
useful website. With a direct email link to the project team, the website was an
important communications tool. An informative site with links to partners and other
related information was an important part of the overall communications strategy. In
addition, it was another marketing tool for those not participating; a place to gather
further information on the pilot and perhaps encourage uptake.
16
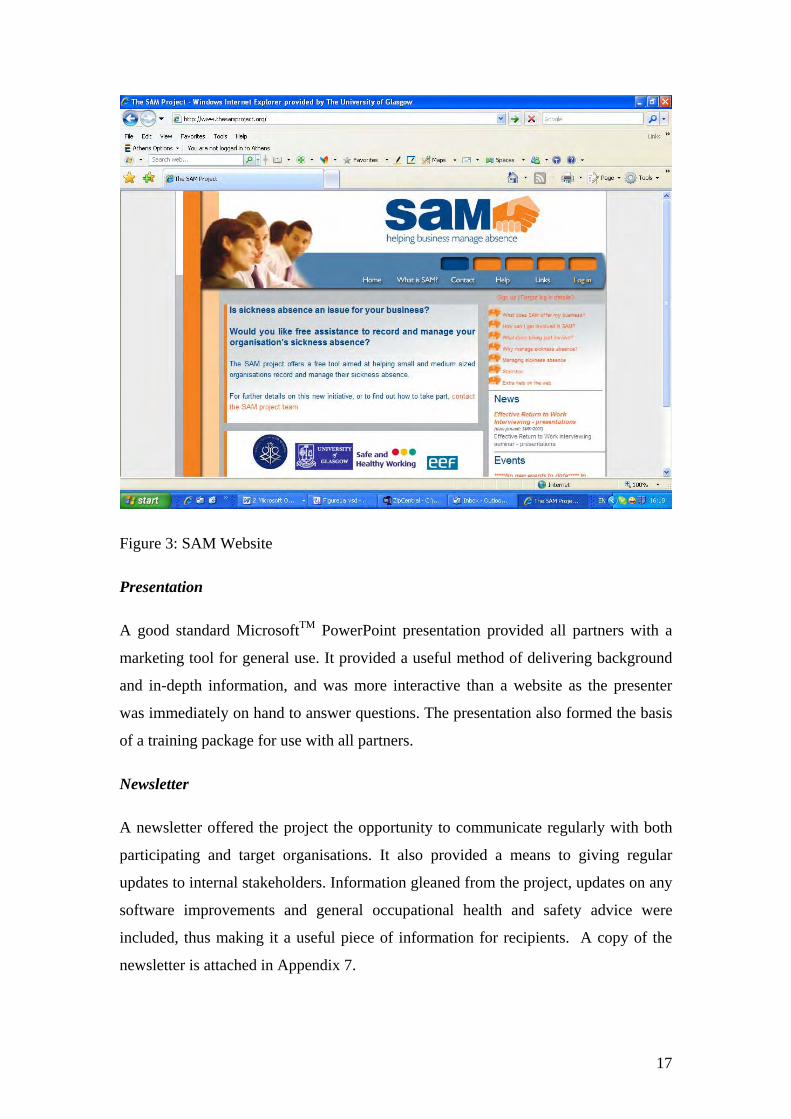
Figure 3: SAM Website
Presentation
A good standard MicrosoftTM PowerPoint presentation provided all partners with a
marketing tool for general use. It provided a useful method of delivering background
and in-depth information, and was more interactive than a website as the presenter
was immediately on hand to answer questions. The presentation also formed the basis
of a training package for use with all partners.
Newsletter
A newsletter offered the project the opportunity to communicate regularly with both
participating and target organisations. It also provided a means to giving regular
updates to internal stakeholders. Information gleaned from the project, updates on any
software improvements and general occupational health and safety advice were
included, thus making it a useful piece of information for recipients. A copy of the
newsletter is attached in Appendix 7.
17
4.3.2 Advertising The project was advertised through a number of methods including one-to-one,
through SCHWL (SHAW, S&HW), SEng advisers and through the websites and
newsletters of a number of the project’s advisory committee member organisations.
The project was also advertised at local media events aimed at small to medium sized
enterprises.
A press release from University of Glasgow also encouraged a number of leading
national papers to publicise the project.
4.3.3 Training Three training sessions were organised to inform advisers from partner organisations
such as Scottish Engineering, SCHWL (SHAW and SHW) about the SART software
and its utilities. These sessions were held in house or at partner organisation venues.
Demonstration of the software and familiarisation with its use was aimed to equip
advisors to promote the use of the software and associated services with their clients
and assist with its installation and troubleshooting.
4.3.4 Seminar/Conferences Five seminars and six conferences/workshops were organised in Glasgow, Edinburgh
and Stirling to inform potential participants about the SAM project and recruit
participants. Some of the seminars were organised through partner organisations.
Participants received information about updates in legal issues, health and safety
aspect of sickness absence, advice on the human resources aspect of sickness absence
management and information about predictors of sickness absences.
4.3.5 Email/Web directed contacts Partner organisations advertised seminars and other activities on the SAM project on
their websites to encourage members to participate in the project. The SAM project
was also advertised in internal newsletters of organisations to inform staff and clients.
Other collaborating organisations such as Business Gateway, Scottish Business in the
Community, Edinburgh Voluntary Sector Organisation were also approached and
information about the SAM project was sent to all members via leaflets and through
their websites.
18
Sector specific organisations or regulatory bodies such as voluntary sector, care
homes, nurseries were also e-mailed information or sent leaflets about the project to
inform their members.
19
4.4 Project Recruitment The aim of the project was to recruit 150 organisations mainly from the Scottish
central belt. Due to the poor participation rate usually achieved with SMEs it was
estimated that at least 1000 organisations should be approached to recruit 150
organisations.
Recruitment was conducted under the guidance of project partners outlined above. A
marketing strategy was developed to facilitate recruitment. The partnership made use
of their own marketing strategies to approach the businesses in their databases. The
initial plan was that the Scottish Centre for Healthy Working Lives (SCHWL)
advisers would recruit the participants, follow them up and help with installation of
the software or troubleshooting. The SCHWL advisers are based in each health board
area and provide advice on all aspects of occupational health and safety and health
promotion to SMEs. They usually have come from a background of health and safety,
health promotion, occupational health, or environmental health.
Organisations agreeing to participate in the project were contacted by telephone by
the research team to obtain complete organisation details on a contact sheet and
confirm participation. At this point, the participants were informed about the terms
and conditions of taking part in the project and participants were signed on the project
only after agreement. The person responsible for human resources management in the
organisation was then interviewed to complete a baseline questionnaire (see below).
Installation of the software was then organised and commitments to the project
clarified.
Recruitment of organisations commenced at the start of the project in February 2005.
Of the first 30 organisations, recruited 20 consented to take part in the Pilot Study.
Recruitment remained ongoing during the Pilot phase.
Changes to Recruitment Methodology (in red on Figure 1)
In practice, despite unreserved commitment from the SCHWL and thorough training
of their advisers, IT issues with the SART software meant that the majority of the
advisers did not have the technical expertise or sufficient time to help organisations
with software installation and follow-ups. Therefore, in agreement with the advisory
20
committee, SCHWL advisers used their organisation visits to promote the SAM
project and recruit organisations to the project. Interested organisations were asked
to contact the project team by phone, Email or through the SAM project website
directly to participate in the project. The research team then contacted the
organisation by telephone to discuss the scope and aims of the project, and outlined
the voluntary agreement to submit monthly-anonymised absence data for a period of
12 months to the SAM project for analysist. A contact sheet and baseline
questionnaire was then completed for each participant.
Significant changes were required to the software as identified in the Pilot (see
section 3.9). This was contracted back to the IOM. This delayed the main project
launch. Project recruitment had to be slowed down significantly, as organisations
being recruited to the project were not keen on having to wait for an extended period
of time to participate in the project. Organisations already recruited to the project
were offered incentives such as free attendance to SAM project seminars/workshops
to maintain interest in the project.
SAM project recruitment resumed as soon as the SART programme was modified and
re-packaged with the use of marketing tools, through partner organisation mailings,
direct mailings to key contacts, seminars and advertising as outlined below.
4.5 SART Software Prior to the piloting the project, the SAM project steering committee agreed that the
SART software was not marketable in its original condition as there were a number of
issues that appeared off-putting and could jeopardise recruitment and participation.
• The software contained references to the HSE, which might inhibit
participation.
• The programme did not appear user friendly, particularly with respect to
frequent error messages appearing at the installation phase.
• There were installation problems in computers with Windows 2000 or
Windows XP operating systems.
21
• The package was being marketed with Microsoft Access2000 run version
and a newer version of Access was required as most new PCs were
equipped with Microsoft Office 2003 and running SART with Access
2000 caused conflicts between the versions.
• Information about the SAM project and data transfer to the SAM project
had to be included
Under the guidance of the IOM, the front end of the Software was modified by the
SAM project team to include reference to the SAM project and to facilitate data
transfer. The software was then linked to Microsoft Access 2003 run version as this
was the most up-to-date version and to enable users with operating software of
Windows 2000 and above to use SART. SART was also offered as a stand-alone
software (no run version of access attached) for computers already set up with
Microsoft Office. This version was called SART V1.3. This resolved many of the
issues including installation problems and this version of the software was used in the
study pilot.
However, Access2003 includes a number of extra warning (security) messages which
were considered to be a threat by the users and thus to the project such as “ This file
may not be safe if it contains code that was intended to harm your computer. Do you
want to open this file or cancel the operation?” Thus, the IOM were subcontracted to
work on the software to make it accessible to as many users as possible and to
improve the software to include user ID and user security levels for use in the main
project.
4.6 SART user manual The software manual and user notes as designed by the IOM were considered too
complex by the users (as described in the IOM report and our initial in-house pilots)
and thus a simplified version of how to install and how to use the software was
prepared as a user manual and provided to the organisations as a package.
22
4.7 SART Installation The original plan was to send the software to organisations signing on to the project
by mail. The package sent contained the SART software, an installation and user
manual and information about the SAM project and collaborating partners.
Organisations were expected to have installed the software within 2 weeks of
receiving the package. Due to different versions of the software being available, a
baseline questionnaire was completed to identify the correct package to send out to
the organisation.
4.7.1 Baseline Questionnaire
The configuration details were required prior to distribution of the software to ensure
compatibility with the SMEs operating system and to advise the SME on the
installation type i.e. to install SART with/without Microsoft OfficeTM Access Runtime
2002.
The software was mailed to the organisations after the Baseline questionnaire was
administered with the key contact person in the organisation, usually someone
responsible for human resources management.
The Baseline questionnaire enquired about the Information Technology (IT) setup of
the organisation before being recruited on the SAM project, including;
• Version of Microsoft Operating System used
• Version of Microsoft Access installed and used, or not installed
• Standalone or networked setup
• If networked, administration setup (i.e. Network Administrator contact details,
external IT organisation contact details)
The Baseline questionnaire also recorded existing organisation practice on sickness
absence data collection, management protocols, and current use and knowledge of
existing sources of advice on sickness absence management from each organisation.
This questionnaire was administered by the project researcher
Changes to methodology
23
In practice, there was significant delay in the installation process due to technical
issues. An IT Officer was recruited by the research team to help with Information
Technology (IT).
Using a modified baseline questionnaire, the availability of a organisation IT support
person was also recorded and the mode of installation (by the organisation IT support
person or by SAM project officer) was agreed.
4.8 Support to organisations
Organisations were assisted by the SAM project team by telephone or through
company visits, with the installation of the software and training of staff to use the
software and support websites for technical information on the package. They were
provided with ongoing technical support by the project team through the technical
telephone helpline and organisation visits when required.
Organisations were also supported through a series of informative
seminars/conferences that were run either by the SAM project or by the SAM advisory
group member associations. These seminars were advertised on the SAM website and
in the SAM newsletter.
SAM newsletters and websites also informed participants about advice and support
offered by the organisations in the SAM advisory committee. Participants contacted
organisations of the advisory committee independently or through advice from the
technical helpline but support obtained through them was not directly monitored. The
SCHWL for example offered free advice on all aspects of health and safety through
their telephone adviceline and offered free site visits to organisations where necessary.
SEng offered in-house training, advice and additional services to organisations that
joined their membership. Access to such support was sought in the third feedback
questionnaire administered.
4.9 Data Collection
4.9.1 Quantitative data As part of meeting the project aims to gather data on the utility of the tool in the
management of sickness absence, its contribution if any to health and safety risks, to
identify individuals requiring SCHWL interventions, and to identify the level of
mentoring and support required, participating organisations were encouraged to send
24
anonymised datasets of their sickness absence using the SART report tool to the SAM
team. It was also though useful in terms of gaining better understanding of sickness
absence causes and incidence in SMEs.
To facilitate the regular submission of absence data, the SART program has an
‘output export’ facility listed in the main menu, to generate an anonymised comma-
separated value (CSV) file format to transfer SART database information from SMEs
to the SAM project. The participating organisations were required to create and save
this file and Email it to the SAM project at the end of each month for a minimum
period of 12 months. A reminder Email was sent to organisations at the end of each
month.
4.9.2 Qualitative data
Pilot study
In the Pilot, the processes involved in the project were evaluated after 4 weeks of
installation. Organisations taking part in the Pilot study were contacted by telephone
using a feedback questionnaire which enquired about:
• Package content
• Recruitment methodology
• Training of organisation personnel
• Baseline questionnaire administration
• Software installation
• Data Input
• Data return
• Website design and function
• Email function
• Technical helpline
• Sickness absence management issues
• Additional requirements
25
Main Study Organisations were interviewed using feedback questionnaires over the telephone
between 2 to 4 weeks after acquiring the SAM project pack and SART software.
They were then re-administered 4 months after installation and then at 12 months of
data submission. Examples of questionnaires used are in Appendix 4. Feedback
enquired about the recruitment process; installation of the software; utility of the
manuals prepared; use of software; the SAM website; use of the SAM helpline and
support, problems encountered; sickness absence management procedures and any
other requirements.
Four focus groups were organised with the users of the SART software to obtain
feedback on the use of the software. All SAM project participants were sent an Email
inviting them to the Focus groups which were organised at different times to
encourage participation. Participants then volunteered to take part in one of the
planned sessions. A maximum of 8 delegates per focus group was planned, but 3
focus groups were attended by 6 participants and one focus group was attended by 5
participants. The Focus groups lasted between 30-45 minutes. They were facilitated
by a researcher and tape-recorded.
Informal feedback from organisation visits and telephone enquiries were also
recorded and analysed to identify issues that needed to be addressed with the project
and the software.
4.10 Data Analysis All questionnaire information was entered into a Microsoft Access database.
Quantitative data analysis was carried out using a combination of Microsoft Excel and
Statistical Package for Social Scientists (SPSS, V11.5 and V15). Primary patterns in
the qualitative data gathered was identified, coded and categorized to examine
meaningful and symbolic content in the data and build up categories and themes
within the description using inductive analysis.
26
5 SAM Project Piloting
All of the 20 organisations who agreed to take part in the pilot were sent SART
Version 1.3 in January 2005 by post after registration.
Organisations were very satisfied with the recruitment process and the way in which
information about the baseline questionnaire was taken. Organisations had not yet
used the website significantly but those who had used it asked for a links section to be
added to key organisations that dealt with sickness absence management.
Organisations were very satisfied with the information they received from the
technical helpline and the support they received from the project members on issues
surrounding the software.
Fifteen of the 20 organisations had Microsoft Office installed on their computers, but
12 of them did not know whether Microsoft Access was installed on their computer or
which version of the software was installed. Eleven of the 20 organisations had
Windows XP set up on their machine and nine had older versions of windows on their
computer. The Pilot study also showed that a larger number of organisations used
networked computers than expected. Four of the organisations had to be assisted with
the manual installation of the SART. Therefore, the baseline questionnaire was
modified to include this information and installation notes were modified to include
specific information on Network and Manual setup.
The organisations were generally satisfied with the information in the package but
some requested simplification of installation and data entry notes.
Of the 20 organisations, 12 installed the software on their computers and nine
organisations returned data to the project. Evaluation of the pilot showed that although
organisations had minimal problems with installation, they did not use the manual
provided effectively. A number of organisations had installed the software prior to
reading the installation notes in the manual. This meant that they loaded the disc with
the Autorun function, which then caused the Run version of Access (Access 2003) to
replace existing Access versions on their computer. This caused conflicts with the use
of other Access databases.
27
As previously mentioned, Access 2003 had inbuilt messages, which warned users
about the use of the software, and deterred a number of users from using the software
after installation.
Following installation, users perceived data entry to be onerous at first, as a number of
details about employees had to be re-entered into the software. Organisations had to
allocate resources for data entry and train personnel which was considered costly
particularly for taking part in a Pilot project.
Data return indicated that all the information about the inbuilt prototype organisation
in the SART software was preceding the data sent from the organisations each month.
This would require data analysts to delete this data before analysing organisation data.
The IOM was then informed to attempt to eliminate this data in the modified version
of SART. There had not been any significant changes in sickness absence
management within the organisations at the time of pilot evaluation.
SART Modifications Post Piloting
Evaluation of the Pilot study was completed in July 2005. The IOM provided a
modified version of SART (V1.2.2) to be used in the main SAM project by August
2005. This software was linked to a run version of Access 2002 instead of 2003 as
this resolved certain issues surrounding warning messages obtained with Access 2003.
This version of the software also had additional user security access levels. However,
initial use of the software with volunteer testers showed that there were still
installation problems with this version of SART, and therefore the main project
launch was delayed but recruitment remained ongoing. The software was further
modified and SART Version 1.2.2SP2 replaced SART Version 1.2.2 in September
2005 when the Main project was launched.
Testing of Data entry
The mandatory fields from test data were entered by researchers in the HWL team and
some members of the working group and the time taken to enter mandatory field data
was recorded by the researchers. On average, it took less than 1 minute to enter
mandatory field data per employee. This information was very useful when
encouraging participation in the main study.
28
6 SAM Project Participant Profile
6.1 Recruitment Since the launch in April 2005, 247 Scottish organisations have shown an interest in
taking part in the SAM project either through advisers or via the SAM project website.
64 organisations from outside Scotland have also contacted the SAM project
regarding the availability of the tool. It was not always possible to determine the
location of the organisations but the majority were from England and Wales and
enquiries from Australia and Canada were also recorded.
Of the Scottish based organisations 186 organisations agreed to take part in the project
and completed a contact sheet providing further organisation details for further
contact for a baseline interview. As the first 20 organisations were consented for the
Pilot study, the remaining 166 were allocated to the Main study.
6.2 Participant Profile Of the 166 Scottish organisations recruited for the main study, 146 installed the
software but 69 organisations withdrew without sending any data back to the SAM
project team. 97 organisations sent some data back to the SAM project but 68
organisations sent data for more than 8 months to the project making the withdrawal
rate 60% (Figure 4). In all cases of withdrawal the software and package was
requested to be returned to the SAM team but less than 10% of organisations
responded to this request.
Organisations were expected to send data to the SAM project for at least 12 months.
Some organisations produced data for more than 12 months. Number of days of data
collection ranged from 50 days to 1075 days.
29

64 Outside
Study Study
20 did not install
months
68 consistently
at least 8 months
fordays
12 Installed
months
data
months’ data
311 Organisations Expressed Interest in SAM
247 Scottish Organisations Scotland
186 Participants recruited
61 Participants Withdrew
166 Participants recruited to Main
20 Participants recruited to Pilot
146 Installed Software software
97 Returned Data for more than 2
returned data for
56 returned data at least 250
6 organisations overwritten databases
2 organisations data recovered
Software
9 returned data
6 returned data for more than 12
1 organisation Invalid data
5 organisations data submitted for less than 250 days
58 organisations data analysed
49 did not return
29 sent less than 8
Figure 4: SAM project participation
Of the 68 organisations that submitted data to the SAM project for more than 8
months, 6 organisations had overwritten data in the demonstration database on the
software. Organisations were reluctant to re-enter fresh data in an empty database.
Data was successfully extracted manually from the back end database by the SAM
project officer, but for 4 of the organisations the quality of data was poor and mixed
with data from the ‘Garden Solutions’ demonstration organisation. These had to be
30
excluded from analysis. When data was examined, data from 1 organisation was
found to be unreliable. It contained fictitious figures with abnormally high counts or
contained multiple duplicates. In 5 cases, although data was submitted for 8 months
the data received accounted for less than 250 days and therefore, data was not
included in the analysis for the annual absence rates. Therefore, in total, data was
analysed from 58 organisations
The data received from the 58 organisations was screened to check for outliers and
other statistically deviant scores, dealing with missing data in a consistent manner and
calculating new derived ones where possible or necessary.
All data where general absence cause was missing was excluded from analysis. A
number of cases also contained no information on start date and end date of an
absence episode and these were excluded from analysis. Some organisations
contained duplicated information and these were corrected for analysis. Some
organisations entered backdated data into the database. Data from October 2004
onwards were selected for analysis. Any data prior to that was excluded. Some
organisations had also included data on planned absences (mostly annual holidays).
Any data beyond January 2008 was excluded from the analysis.
Data where working days absent was missing was calculated from information on
actual return date. Where this information was not available long term absence was
assumed and data not analysed for short term absences.
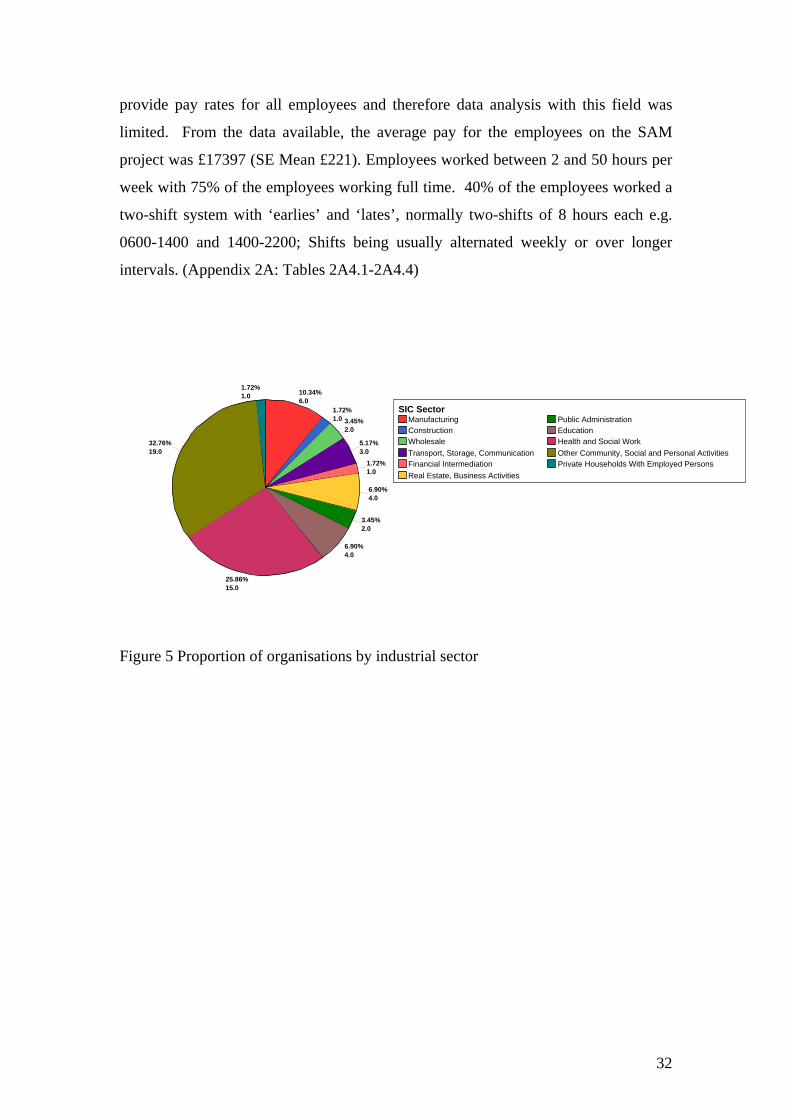
6.3 Organisation Profiles The majority of organisations taking part in the SAM project were from the Health
and Social Work or Community and Social Services sectors (Figure 5). The
Organisations had between 7 and 257 employees with an average of 94.51 employees
(SE Mean 0.614). The employees were aged between 16 and 74 with a mean age of
40.35 (SE Mean 0.091). Organisations had on average 38% male and 62% female
workers. Four of the organisations had no female workers and 5 organisations had no
male workers. Organisations with mostly female workers were from the Health and
Social work and Community, Social and Personal Services while the male dominated
organisations were from the Manufacturing, Construction, Transport, Storage and
Communication sectors (Appendix 2A:Tables 2A1-2A3). Organisations did not
31
provide pay rates for all employees and therefore data analysis with this field was
limited. From the data available, the average pay for the employees on the SAM
project was £17397 (SE Mean £221). Employees worked between 2 and 50 hours per
week with 75% of the employees working full time. 40% of the employees worked a
two-shift system with ‘earlies’ and ‘lates’, normally two-shifts of 8 hours each e.g.
0600-1400 and 1400-2200; Shifts being usually alternated weekly or over longer
intervals. (Appendix 2A: Tables 2A4.1-2A4.4)
1.72% 10.34%1.0 6.0
1.72% 1.0 3.45%
2.0
5.17% 3.0
1.72% 1.0
6.90% 4.0
3.45% 2.0
6.90% 4.0
SIC Sector Manufacturing Public Administration Construction Education Wholesale Health and Social Work Transport, Storage, Communication Other Community, Social and Personal Activities Financial Intermediation Private Households With Employed Persons Real Estate, Business Activities
32.76% 19.0
25.86% 15.0
Figure 5 Proportion of organisations by industrial sector
32
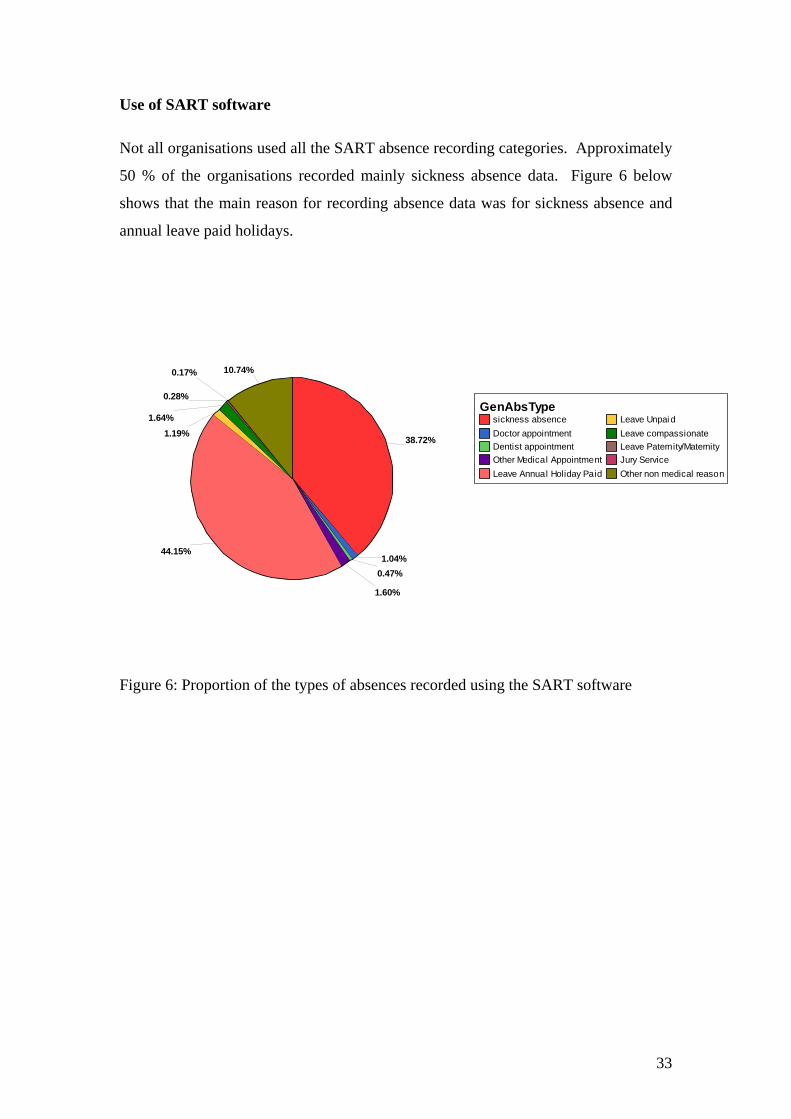
Use of SART software
Not all organisations used all the SART absence recording categories. Approximately
50 % of the organisations recorded mainly sickness absence data. Figure 6 below
shows that the main reason for recording absence data was for sickness absence and
annual leave paid holidays.
sickness absenceDoctor appointmentDentist appointmentOther Medical AppointmentLeave Annual Holiday Paid
Leave UnpaidLeave compassionateLeave Paternity/MaternityJury ServiceOther non medical reason
GenAbsType
38.72%
1.04%0.47%
1.60%
44.15%
1.19%1.64%
0.28%
0.17% 10.74%
Figure 6: Proportion of the types of absences recorded using the SART software
33
7 Feedback from SAM participants
7.1 Timed Feedback Participants to the SAM project were interviewed to receive feedback on the utility of
the software in their organisation. Examples of feedback questionnaires used can be
seen in Appendix 4.
Feedback 1
At the start of the project (2 weeks after installation or 4 weeks after package was
posted for organisation installation) organisations were asked about their satisfaction
with the way in which they were recruited to the project. 166 organisations were
contacted by telephone and a completion rate of 84% (140) was achieved. The
remaining 26 organisations were contacted for a maximum of 7 times and asked to
contact the SAM project but were not reachable for the first feedback.
24% of the organisations were referred to the project through HWL services. 3% of
the organisations were informed by SEng while 12% stated that they learned about the
project through websites. A further 10% of the organisations learned about the project
through other means such as leaflets, press etc. The remaining organisations did not
provide this information. All organisations were happy in the way in which they were
approached and 99% were happy with the information they had received.
SART had been installed in 57(34%) of the organisations at first feedback. Of these
45 organisations had SART installed by someone within the organisation.
Respondents also mentioned that in some of these cases, they or their IT specialist had
received guidance from the SAM project team during installation. For the majority of
the participants (95%) the SART tool worked after installation. In some, there were
problems such as passwords which were not working, and with computer or network
drives. These were resolved by either re-installing the software or through guidance
from the SAM project to link the front end of the programme to the back end of the
programme in the correct drive. One organisation also had problems with language
settings and this was resolved as described above. Those who had not yet installed
the software had problems with staffing or convincing upper management on the
34
benefits of installing this new software. Some were awaiting their IT contractor to
help with installation and others felt uncertain that they should install the software as
installation was not as straightforward as they had expected or felt threatened by the
error messages. One comment was:
“Aye right! Listen hen! When you sent me this package you said just load it on the
drive and it should run ’self… but then these warning messages started flashing! I
took it straight off…I called up your office to ask for a new disc, then the wee lassie
said she’d help me with it… She’ll be coming up shortly I believe…” Small business
owner
Employer’s handbook
Participants were asked about the Employer’s handbook. Only 50% of the
participants had used the handbook at the start of the project. Those who had used it
found it clear about what SAM project was offering and what participants were
expected to contribute. They found the quick and detailed installation and user guides
useful. One organisation said that “It was easier working with it”. Some believed
that the language could still be simplified further and it was not easy to find
information in the handbook. One participant said “Pop-ups in the software would be
better to have”.
Use of Software
At the first feedback questionnaire only 46% (26) of the organisations interviewed
who had had the software installed had started using it. Some organisations had
staffing problems and others installation problems while others had problems
committing time installing the software they had received though the post or were
having to duplicate data entries as they were already using software such as SAGE.
Only two of the participants who were entering data had problems with data entry.
One had created two organisations by mistake and had to re-enter the data into a
single database and one organisation reported problems with the coding system used
in the job categories. Two organisations also reported problems with missing or
invalid fields when entering data.
35
Use of Help option or sickness absence management guidance
The majority of the participants had not used the HELP option in the SART software,
or the sickness absence management guidance on the tool. They believed that the
HELP option should be more interactive and have more trouble shooting information
on it. They suggested having a ‘How to do’ menu to get more specific answers
instead of having to refer to the manuals. The SART website provided by the IOM
had only been visited by 10% of the respondents who had installed the software. The
SAM website was visited by almost 75% of the participants. They found the
information particularly useful for background information about sickness absence
management and for information about the tool.
Use of SAM helpline/Email
The majority of the organisations had contacted the SAM helpline or Emailed the
SAM project for assistance. None reported any problems in contacting the helpline or
the Email service. They found the advice received generally very useful. One
comment was “I almost gave up installing this programme, but I thought of phoning
the helpline. I received very friendly help and user-friendly information through the
Email, excellent help.”
36
Feedback 2 ( at month 4)
All 166 organisations were approached for Feedback 2 four months after registering
with the SAM project. Eighty-two organisations responded to the phone call of which
36 indicated that they had withdrawn from the project. Seventy-three of the 166
organisations were successfully interviewed for the second round.
Withdrawals
Organisations who withdrew were questioned on the reasons for withdrawal. These
organisations indicated several reasons for withdrawing from the project, which can
be summarised as:
• loss of interest and changes in organisational priorities during the period waiting for installation (11)
• problems with software installation, (4)
• lack of staffing resources to participate in the project,(3)
• changes in staffing leading to non-trained staff taking over, (6)
• lack of commitment, (3)
• duplication of data entry as organisations were using other software, (2)
• changes within the organisation, and in some cases organisation closure. (7)
“Already have an HR system with absence recording, I was just curious to see what
more this software could do..” Medium-size organisation manager
“I wish I could transfer my Excel spreadsheet directly to this software, typing it all in
is a hassle, I just do not have the resources” Small organisation administrator.
SAM participants
Of the 73 organisations interviewed still participating on the SAM project, more than
50% interviewed were not sending data regularly to the SAM project. When
questioned, some of the participants indicated that they were not aware of this, as this
was dealt with by some other members of staff. Those who were aware, mentioned
that they ‘had been too busy’ or ‘were very sorry and will send it this month’, but the
most frequently used reason was perception of time taken to enter data and
availability of extra employee time to dedicate to this activity. It was then highlighted
37
by the researchers that entry of mandatory field data took less than 1 minute per
person.
“My partner and I know we have a problem with absence… but because we work on
different sites it is hard to keep track…I know we have SAM now, but still I am not a
computer whiz you know… It’s taking ages to get to grips with this!!! My son has
helped a little.. but I think I have to spend some time reading this manual one night!”
Organisations who had stayed on the project were asked about their sickness absence
rates. The majority of the organisations did not know their sickness absence rates
before joining SAM project. They were not recording absence on a regular basis.
“We have a small family business so when someone is not here, we find it difficult to
manage their absence. Now that we have a software to do this, it is easier”
Sickness Absence Management
We asked the organisation if they had a sickness absence policy before they started on
the SAM project. 90% of the organisation said they had a policy but almost 75% said
they had reviewed the policy after taking part in the SAM project. The SAM project
seminars were major contributing factors to this.
“I’ve employed 10-15 people for more than 4 years now. When they started things
were different but I never knew I could revise my policy until I heard this chap
Raymond talk at this SAM seminar. I went on the websites he recommended and got
some information on how to modify my policy” Small Business Owner
“ See we always get information about seminars from the CIPD etc.. but they are too
expensive to attend and are often in London, Birmingham etc…. this seminar was
really good value for money...” HR consultant
“I think there was a lot of information in the seminar in a very short period of time.. I
am not used to sitting down for so long… But it was all interesting.. so I stayed till the
end…” Personnel Assistant.
Less than 10 of the organisations interviewed who were using the software had
generated reports from the SART tool. The main reason was that the organisations
38
were still inputting data into the system. In some cases, SART data entry was
performed by a clerical worker and although management was aware that the data was
being recorded, they had not yet had access to the data to interpret. Those who
reviewed the reports tended to do this on a monthly basis or when required. The
reports were used mostly for individual records of sickness absence. In general,
organisations felt it was too early to identify trends absence rates. Organisations
found the use of the reports in return to work interviews most useful.
“No matter how much I talked to J about his Mondays off it dinnae bother him, when
I showed him a record of his absence on paper, this had a much better effect”,
Medium sized enterprise line manager
When asked “how has SAM helped your business manage absence?”, a childcare
organisation reported that as soon as they had informed their employees that they
were now taking part in the SAM project and that data was going to be recorded, they
felt that there was an immediate decrease in sickness absence. However, it was too
early to tell if this decrease was significant over time. Other organisations also
reported changes to the organisation policies and ways of managing staff as a result of
taking part in the SAM project. Organisation sickness absence forms were also being
re-designed in one organisation to match details recorded on the form. Six of the
organisations also reported contacting the SCHWL services to obtain free advice on
promoting health initiatives in their businesses and health and safety workplace
assessments. One organisation also reported having help for their employee through
the SAM project as they were signposted to organisations where they could access
advice and support for the managers and employees.
“I could never afford to pay for all this help… M came back to work after a few
sessions of counselling, it wasn’t easy, there were lots of adjustments….but we
coped …” Small business manager
We asked participants if they had used information on the sickness absence
management and guidance on the SART software. The majority (62%) said No.
Those who had used it said it was very useful. The main information accessed was on
the use of the tool, particularly in relation to trigger functions and Bradford Scores.
However, one participant said,
39

“I now know all about stress and how to manage it.. and if I do not know what to do,
I just look up the software, click on the website and try to find someone I can use…
It’s a wonderful resource!”
40
Feedback 3 (at Month 12)
In the final feedback, organisations who had submitted 12 months data were contacted
to thank them for their data and enquire about their willingness to continue
contributing data to the project. Forty participants took part in the interview.
Thirteen of these organisations indicated that they were still happy to send data to the
SAM project.
Organisations were asked about their experience in taking part in the SAM project and
any differences noted in their organisation since the previous feedback questionnaire.
“a difficult job made easy, better than using spreadsheets”- Small organisation
secretary
Organisations believed they were ‘getting the hang of data input and gradually
learning to generate meaningful reports’ but that it was still early to notice trends due
to time, but one of the managers was more confident that he was aware of the sickness
absence rates in his organisation and was better managing absence. 65% of the
organisations interviewed suggested having reports that had graphs to show trends
would be more helpful.
“I coudnae believe how bad my record was until I started using SAM” Medium size
organisation personnel officer
“I can now predict when A is going to be on leave. She still does not feel she can tell
me what her problem is, but I have offered her a change in her hours which has
helped her with her sickies”. Medium-sized organisation line manager
Participants were asked about the main reasons for sickness absence in their
organisation and ways in which they managed the absence. The most common causes
of sickness absence for short term absences were stress/anxiety, influenza and
gastrointestinal problems. Less than 5% of the participants said that long term
absences were a problem in their organisation and the most common causes of these
were cancer and stress.
For short term absences, organisations reported that they had to revise sickness
absence policies and introduce return to work interviews or make their return to work
41
interviews more effective. In the majority of the cases the person responsible for
human resources management in the organisation conducted the return to work
interview. Organisations reported that they would prefer this to be done by the line
manager but they were not adequately trained to conduct return to work interviews. A
need for further training of line managers on absence management was highlighted.
“I do not know how to cope at times. I have a small organisation. I cannot employ
temps all the time. When one goes off sick the others have too much work on, and
then others take a sickie the next day!” Small business owner.
With long term sickness absence, communication with their long term sick employees
proved useful. Policies on phased return to work were also being considered or
reviewed. Concerns were raised on the amount of time spent on re-training an
employee during their return to work process without the certainty of return to work.
The need for more training in this area was highlighted.
“See that guy you had at the Seminar… He talked about communication,
communication, communication!... I was scared of calling my employee, but then
when I went back to work on Monday I gave him a call… just for a friendly chat.. did
not even mention work…. I was surprised how well it went!” medium sized employer.
One of the employers mentioned that they had used a case managed approach for an
employee who was off sick for a long period. They were very happy to have a third
person mediate this return to work.
“We contacted this occupational health service. …It made things so much smoother..
I did not understand what the problem was until this case manager clarified the
employee’s issues. I could then deal with it…… you know what I mean! I wish I
could afford this more...it should really be a free service for small businesses like
ours!” (Medium sized business employer).
42
Costs of Sickness Absence
We asked organisations if they knew how much sickness absence was costing their
business. The majority did not have the information at hand at the time of interview
and did not believe the SART tool could help them calculate this effectively. Most
organisations did not include salary costs in SART as this was not mandatory.
Furthermore, the indirect costs to the business were not recorded on SART.
“ ….the one problem I have with this software is that it is not linked to payroll… I tell
you if this was the case I could have done wonders for the business” HR consultant
Signposting
Organisations were asked about the signposting from the SAM project and the help
they had accessed. More than 75% organisations were familiar with the SHAW
award (now known as HWL awards) and had started taking part in it before joining
SAM. Six of the organisations indicated that they contacted SHAW after coming on
board the SAM project. During the course of the project, only 10% of the
organisations interviewed had had to have access to further sign posting through the
SAM project. The majority felt the SAM project seminars were very informative and
they had contacted presenters’ organisations after the conference to ask for help on
specific issues. They had also accessed the SAM project website and the person
responsible for human resources had also visited the SART website for further
information on sickness absence management. They believed that the SART website
was considered useful but the information on the web was not always relevant to their
own problems.
With respect to help accessed through the advisory committee members, ten
participants reported accessing the Healthy Working Lives helpline. The information
they received from the advisers were considered helpful and more tailored to their
organisation’s needs. Seven mentioned that another member of the organisation had
contacted the helpline or the SCHWL website for information, but they were not sure
of the outcome. Two organisations also reported having had access to support from
Scottish Engineering and three organisations to SALUS Occupational Health and
Safety. One organisation was able to access free services that were being offered as
part of a project for their employee.
43

“I did not know how much ‘free’ or affordable help there is out there until I took part
in this project. The helpline adviser was very good. I was contacted by my local
adviser soon after my phone call and he could tell me where to get what I needed
locally.” Medium size business manager.
44
7.2 Informal Feedback
Informal feedback was accumulated with organisations throughout the project. This
was done either as part of a organisation visit or as part of a telephone enquiry.
Organisations not submitting data to the SAM project were also contacted directly by
telephone, to enquire about reasons for not sending data. It was observed that
organisations forgot to send data in some cases, particularly when there was a staff
turnover. The SAM project team then started to send a reminder Email to all
organisations at the end of every month.
Any technical issues which were hindering data submission were also discussed and
an attempt to resolve the problems were made.
It was noticed that a minority of organisations had overwritten the demo database on
the SART software and were therefore unable to analyse their data effectively and
these required the SAM team to resolve the problem.
There were a number of issues raised about the installation and use of the SART
software which were identified during the project pilot and throughout the course of
the main study. These have been detailed in Appendix 3.
Users contacted the SAM project technical helpline or Email regularly and many of
the questions asked involved usage of the software and means of avoiding duplication
of data entry.
User comments gathered from informal feedback
“Availability of a selection screen which allowed selection of absence type (or types),
time period, employee category etc. At the moment the reports are obviously hard
coded and don’t allow this to happen. It would also be useful if individual report info
/ data could be exported to Excel”
“The individual record is very useful, but a ‘total staff’ absence report (open &
closed) would help management reporting. (Could this then be broken down
departmentally?). Also it would be beneficial for the software to calculate the number
of days for (current) individual absences ie how many days the employee has been
absent.”
45
“Can I link this software to the swipe card system we use?”
“ We use SAGE for HR purposes, can this system not be linked to this… can I get my
IT person to have a go? I am sure it can be done right? You said it is just an Access
database!”,
Organisations that had not been submitting data on a monthly basis were followed
informally and similar reasons as listed in Feedback 2 above were given for
withdrawing from the project.
46
7.3 Feedback from Focus Groups Three of the focus groups were attended by six SAM project participants and one was
attended by five participants. Participants were from a mixture of organisations
ranging from the educational sector, manufacturing, retail, and public administration
and defence sectors. The organisations they represented had staff numbers varying
from six employees to 158 employees. Participants were all responsible or partly
responsible for human resources management in their organisation. This included
business owners for small organisations and personnel officers or human resources
staff for larger organisations. The majority of focus group participants had joined the
SAM project for more than 6 months. 75% were submitting data to the project.
Reasons for joining SAM
Focus group participants were asked about the reason for joining SAM and the history
of sickness absence in their organisation. Approximately two thirds of the focus
group participants knew that their sickness absence rates were high but did not know
the exact figures. Reasons for joining SAM included, increased awareness on
sickness absence costs to the business, no methods of recording absence, lack of
satisfaction with the methods they were using, curiosity about free software, problems
with managing staff in family business and very high sickness absence rates of up to
11%. Two thirds of the organisations were using pen and paper or excel spreadsheets
before joining the SAM project, however, three of the organisations used SAGE or
and other organisations used other finance based software.
Software Issues
As in the feedback surveys, focus group participants also commented that the
installation problems at the start of the project were off-putting. They found the
summarised information in the manuals helpful but the detailed methods were
considered too complex and time consuming to read. Participants unanimously
suggested having more frequent training programmes on how to best use SART.
They were also concerned about backing –up their databases in a format that could be
easily retrieved and wanted more information on this as it was not clear from the
manuals.
47
“We nearly gave up! Thank goodness for Jayne’s help. We eventually managed to get
it up and running… but see these error messages they are a nightmare!” Small
business owner
Organisations suggested using a web based tool or a tool, which could be downloaded
from the web, but could also recognise the organisation’s computer setup.
“by the time we got it installed we need another couple of days to familiarise
ourselves with it and train the secretary to use it, and when she left we had to train
the new one again! I wish we could have sent them on a course to learn how to use
this” Medium sized employer
Data recording
Participants discussed the medical data recording facility in SART. They were
impressed with the ability of SART to provide a medical reason for the sickness
absence; however, there was considerable debate on the differences provided in the
reasons of sickness absence on a sickness absence (MED 3) certificate and the true
reason for sickness absence. Another issue discussed about the software was the
difficulty administration staff faced in coding medical conditions. Participants also
wished there were more facilities for coding additional non-medical, social reasons
for absence
‘These GPs write something on the sick notes and most of the time it is difficult to
understand or classify….. but sometimes you go through a return to work interview
and you realise it is not the same as on the Med3 .. what do you do then?!!!’ HR
manager
“ Yes even in my work, W always takes a sickie when she has to take her mum to
hospital. Or B is always sick when schools are off---If I add up all these costs !!! I
wish the software could do this for me!!”
48
Sickness absence management procedures
A discussion on ways of dealing with short and long-term sickness absence suggests
that larger SMEs tend to deal with absence management differently to smaller SMEs.
Larger organisations tended to have sickness absence policies in place but while
smaller organisations had a more relaxed approach to policies.
When asked about steps taken in short term and long term sickness absence
management, larger organisations were more open to negotiating flexible time and
phased in return to work. Smaller organisations acknowledged that this should be the
ideal way, but due to the nature of their work they found this sometimes impractical
and unrealistic.
“I only have 3 staffs. I am already working 50 hours a week, when my staff is off, I
am overstretched as it is! How do you want me to cope? Tell you what.. these people
in the government are good at passing laws and policies, but when it comes to small
businesses, we feel that they live on a totally different planet” JB, small business
owner.
Organisational changes
The focus group participants discussed organisational changes after joining SAM.
One of the participants informed the group that they were now moving away from the
recording system that they were using to use SART full time. They had been using
SART for 6 months and were impressed with its ability to produce individual reports
as well as company wide reports.
Five of the participants said that since joining SAM their organisations have
considered revising their sickness absence policies. Two of the smaller organisations
also reported looking into implementing a sickness absence policy after attending one
of the SAM seminars. The seminars had also inspired one of the personnel assistants
attending the focus group to seek further training in employment law. Other changes
within the organisations included seeking advice from private human resources
consultants, refusing phone calls from employee relatives, ensuring processes are in
place for employees on long term sickness, and implementation of return to work
interviews for both short term and long term absences.
49
“It’s amazing how quickly the Monday morning phone calls dropped when we
introduced the return to work interviews… we got someone from Head Office to come
and do them at first.. but that meant they were getting done on only one day a week. It
does take a while and all could not be done in a day... so I decided to do it the next
day they came back.. ” small nursery manager
Managing sickness absence
Most participants said that they could manage long term absences especially if they
were due to genuine medical illnesses. One participant was concerned with an
employee off sick long term due to cancer but they said they found the SART
guidance on this useful. But they also found useful help through a cancer charity
which provided guidance on how to deal with cancer in the workplace. However,
dealing with people with stress related issues was considered problematic. The
definition of stress and work-related stress was debated.
“I cannae understand these doctor’s notes that say that sign off people with stress.. it
does not say if it work related or not… so, do I talk to my employees or will they
blame me of harassment if I call them…”Small Business Administrator
The main concern for the majority of participants were short term sickness absences
and how genuine these were.
‘To tell you the truth I was a little stuck in my organisation. I just joined XXX…. It’s
J on the factory floor who has always done all the recruitment ..there is a long history
there.. don’t get me started.! She gets all the girls from the village to come and work..
when they go off sick she covers for them… The problem has escalated over the
years .. they got me to work in personnel and want me to sort things out… thank
goodness for this software… I now have a good excuse to get more information from J
and I can’t wait to produce fancy reports to prove my point. We can then all sit round
a table and discuss how to make things better!” Personnel Officer, Small
manufacturing organisation
Most of the focus group participants did not notice much difference in their frequency
of seeking help on the management of sickness absence from occupational health
services since joining SAM. None of the focus group participants had used any of the
50
other services signposted by the SAM project. Participants believed that they had just
started to ‘get the hang’ of data input and reporting and had had much chance to fully
explore the other functions in the software, but some were thinking of trying to get
more help on designing policies.
“I heard the chap from Healthy Working Lives talk about the free advice to
businesses.. I was thinking of giving this free advice line a call.. I have not yet got
round to it” small construction company owner
Focus group participants felt that the software was less effective at highlighting such
services and more information or links to the other services could be included in the
software package.
“I reckon these seminars you organised could help telling us more of what is out
there for us small businesses. I attended one, the guy who spoke about the rights of
the employer gave me a lot to think about.. I did not realise I could change my
sickness absence policy like that! I thought my employees would sue me if I did… I
went and got more advice on this..” medium size organisation manager.
“I thought we had an excellent policy, we only made it 3 years ago-- but the talks I
heard made me realise otherwise… some of the things in the policy are already
outdated”
The focus groups also identified issues with the software that companies thought
could be improved and these have been summarised in appendix 3.
51
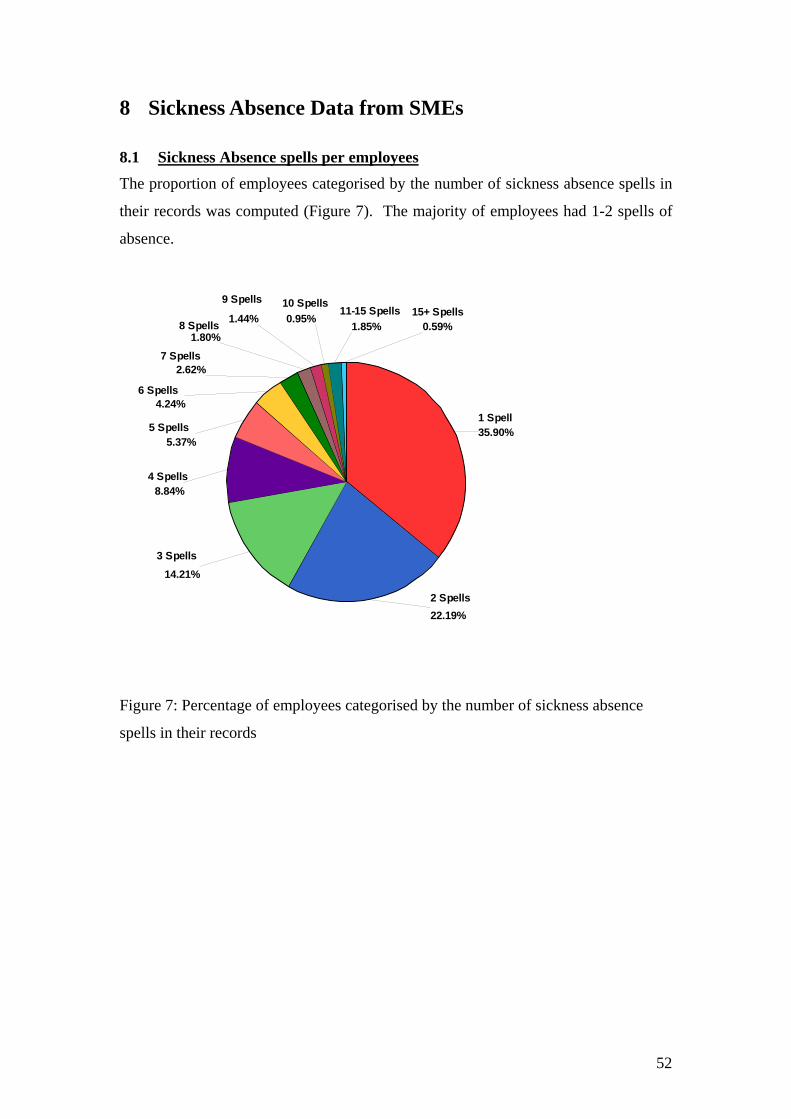
8 Sickness Absence Data from SMEs
8.1 Sickness Absence spells per employees The proportion of employees categorised by the number of sickness absence spells in
their records was computed (Figure 7). The majority of employees had 1-2 spells of
absence.
9 Spells 10 Spells 11-15 Spells 15+ Spells
1 Spell 35.90%
2 Spells 22.19%
3 Spells 14.21%
4 Spells 8.84%
5 Spells 5.37%
6 Spells 4.24%
7 Spells 2.62%
8 Spells 1.80%
1.44% 0.95% 1.85% 0.59%
Figure 7: Percentage of employees categorised by the number of sickness absence
spells in their records
52
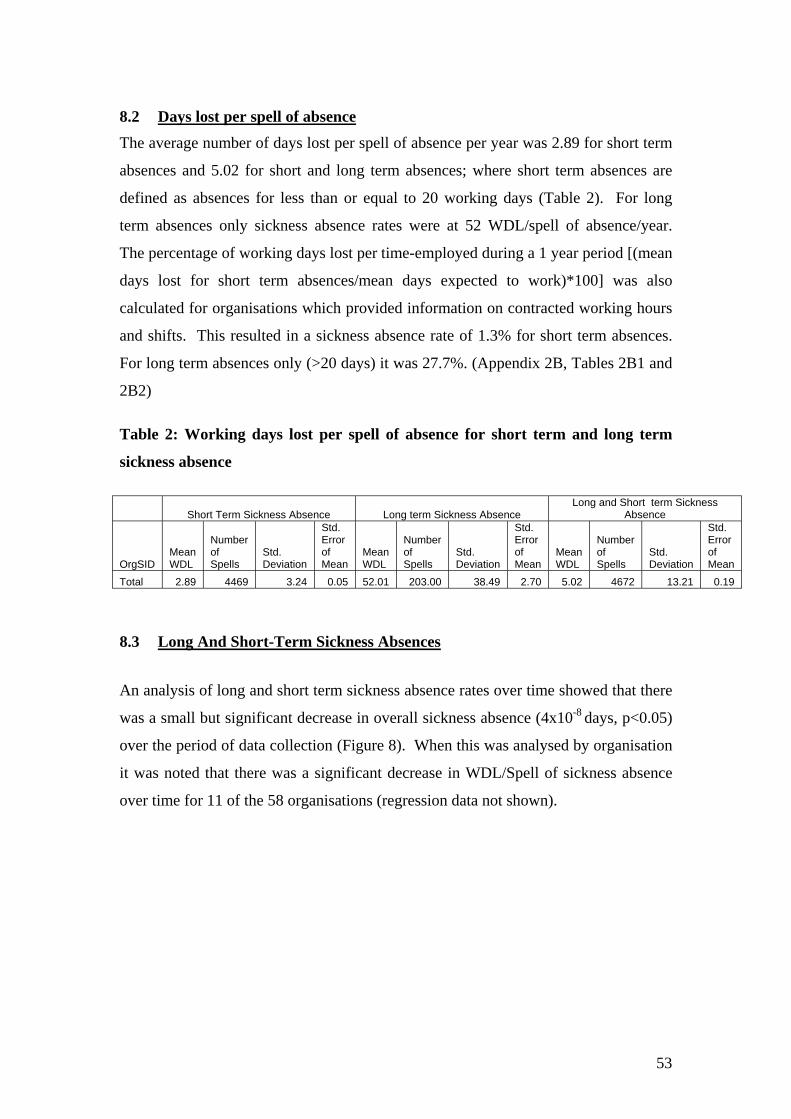
8.2 Days lost per spell of absence The average number of days lost per spell of absence per year was 2.89 for short term
absences and 5.02 for short and long term absences; where short term absences are
defined as absences for less than or equal to 20 working days (Table 2). For long
term absences only sickness absence rates were at 52 WDL/spell of absence/year.
The percentage of working days lost per time-employed during a 1 year period [(mean
days lost for short term absences/mean days expected to work)*100] was also
calculated for organisations which provided information on contracted working hours
and shifts. This resulted in a sickness absence rate of 1.3% for short term absences.
For long term absences only (>20 days) it was 27.7%. (Appendix 2B, Tables 2B1 and
2B2)
Table 2: Working days lost per spell of absence for short term and long term
sickness absence
Short Term Sickness Absence Long term Sickness Absence Long and Short term Sickness
Absence
OrgSID Mean WDL
Number of Spells
Std. Deviation
Std. Error of Mean
Mean WDL
Number of Spells
Std. Deviation
Std. Error of Mean
Mean WDL
Number of Spells
Std. Deviation
Std. Error of Mean
Total 2.89 4469 3.24 0.05 52.01 203.00 38.49 2.70 5.02 4672 13.21 0.19
8.3 Long And Short-Term Sickness Absences
An analysis of long and short term sickness absence rates over time showed that there
was a small but significant decrease in overall sickness absence (4x10⁻⁸ days, p<0.05)
over the period of data collection (Figure 8). When this was analysed by organisation
it was noted that there was a significant decrease in WDL/Spell of sickness absence
over time for 11 of the 58 organisations (regression data not shown).
53
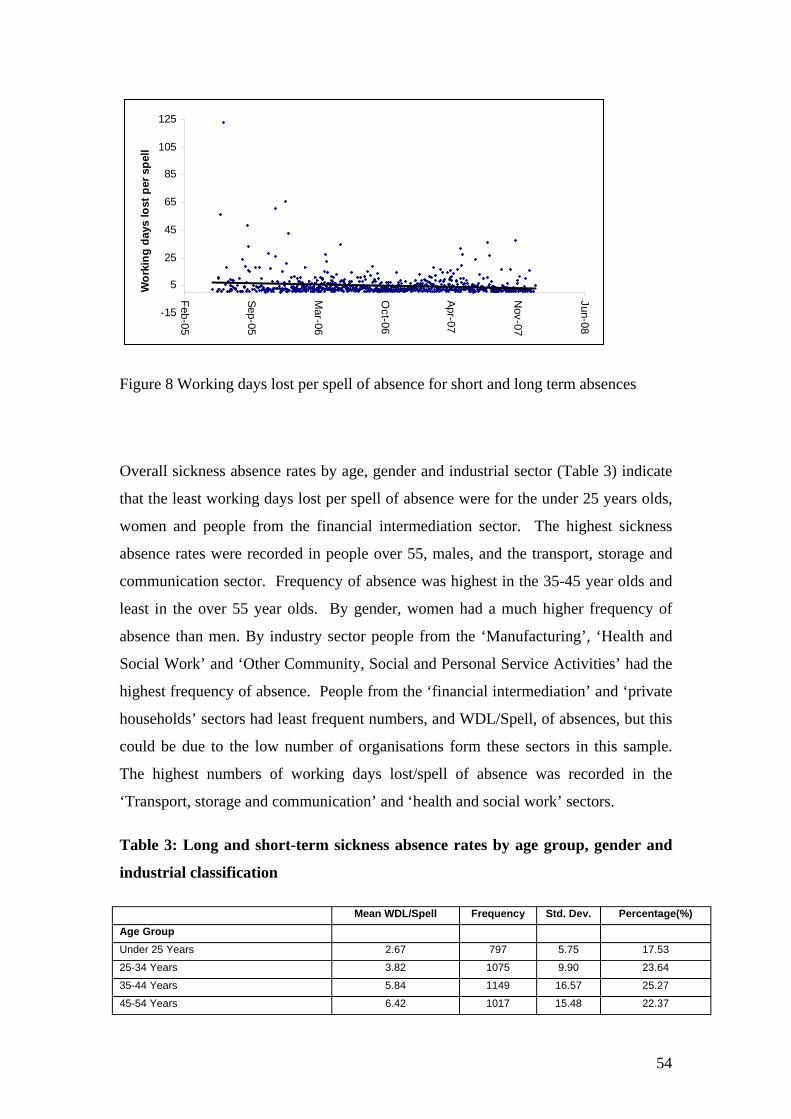
5
25
45
65
85
105
125
-15
Feb-05
Sep-05
Mar-06
Oct-06
Apr-07
Nov-07
Jun-08
Wor
king
day
s lo
st p
er s
pell
Figure 8 Working days lost per spell of absence for short and long term absences
Overall sickness absence rates by age, gender and industrial sector (Table 3) indicate
that the least working days lost per spell of absence were for the under 25 years olds,
women and people from the financial intermediation sector. The highest sickness
absence rates were recorded in people over 55, males, and the transport, storage and
communication sector. Frequency of absence was highest in the 35-45 year olds and
least in the over 55 year olds. By gender, women had a much higher frequency of
absence than men. By industry sector people from the ‘Manufacturing’, ‘Health and
Social Work’ and ‘Other Community, Social and Personal Service Activities’ had the
highest frequency of absence. People from the ‘financial intermediation’ and ‘private
households’ sectors had least frequent numbers, and WDL/Spell, of absences, but this
could be due to the low number of organisations form these sectors in this sample.
The highest numbers of working days lost/spell of absence was recorded in the
‘Transport, storage and communication’ and ‘health and social work’ sectors.
Table 3: Long and short-term sickness absence rates by age group, gender and
industrial classification
Mean WDL/Spell Frequency Std. Dev. Percentage(%) Age Group Under 25 Years 2.67 797 5.75 17.53
25-34 Years 3.82 1075 9.90 23.64
35-44 Years 5.84 1149 16.57 25.27
45-54 Years 6.42 1017 15.48 22.37
54
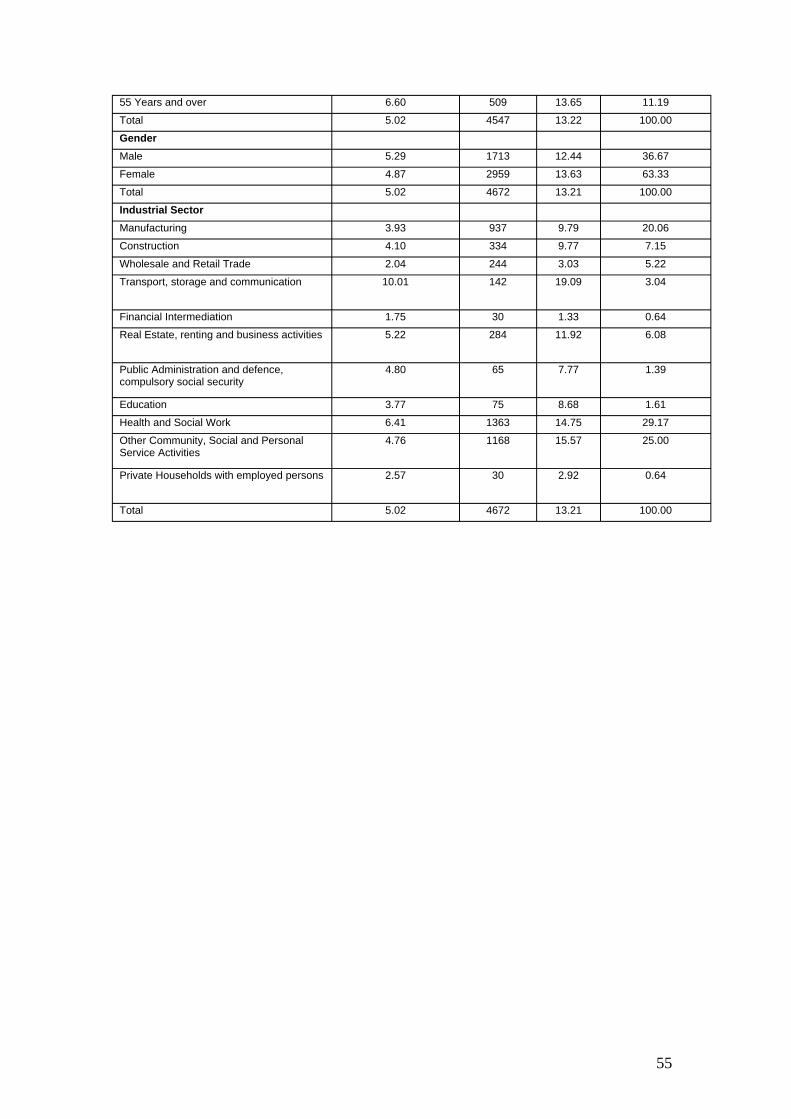
55 Years and over 6.60 509 13.65 11.19
Total 5.02 4547 13.22 100.00
Gender Male 5.29 1713 12.44 36.67
Female 4.87 2959 13.63 63.33
Total 5.02 4672 13.21 100.00
Industrial Sector Manufacturing 3.93 937 9.79 20.06
Construction 4.10 334 9.77 7.15
Wholesale and Retail Trade 2.04 244 3.03 5.22
Transport, storage and communication 10.01 142 19.09 3.04
Financial Intermediation 1.75 30 1.33 0.64
Real Estate, renting and business activities 5.22 284 11.92 6.08
Public Administration and defence, compulsory social security
4.80 65 7.77 1.39
Education 3.77 75 8.68 1.61
Health and Social Work 6.41 1363 14.75 29.17
Other Community, Social and Personal Service Activities
4.76 1168 15.57 25.00
Private Households with employed persons 2.57 30 2.92 0.64
Total 5.02 4672 13.21 100.00
55
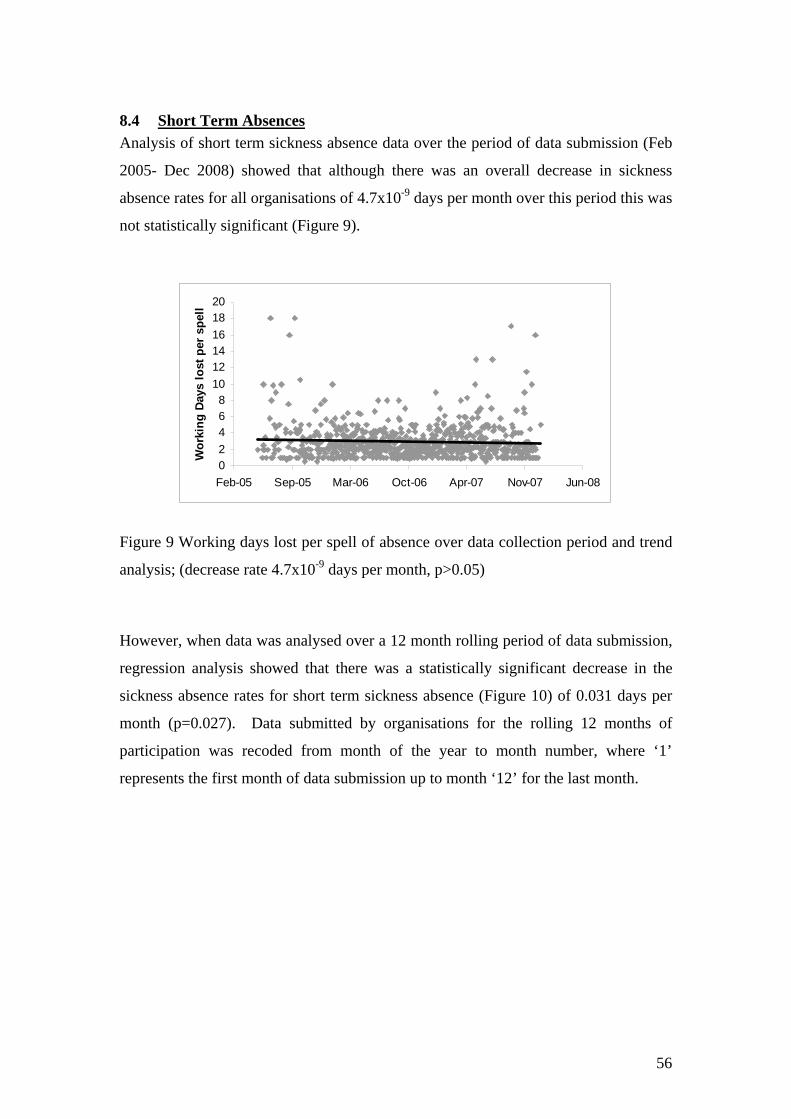
8.4 Short Term Absences Analysis of short term sickness absence data over the period of data submission (Feb
2005- Dec 2008) showed that although there was an overall decrease in sickness
absence rates for all organisations of 4.7x10⁻⁹ days per month over this period this was
not statistically significant (Figure 9).
0 2 4 6 8
10 12 14 16 18 20
Feb-05 Sep-05 Mar-06 Oct-06 Apr-07 Nov-07 Jun-08
Wor
king
Day
s lo
st p
er s
pell
Figure 9 Working days lost per spell of absence over data collection period and trend
analysis; (decrease rate 4.7x10⁻⁹ days per month, p>0.05)
However, when data was analysed over a 12 month rolling period of data submission,
regression analysis showed that there was a statistically significant decrease in the
sickness absence rates for short term sickness absence (Figure 10) of 0.031 days per
month (p=0.027). Data submitted by organisations for the rolling 12 months of
participation was recoded from month of the year to month number, where ‘1’
represents the first month of data submission up to month ‘12’ for the last month.
56
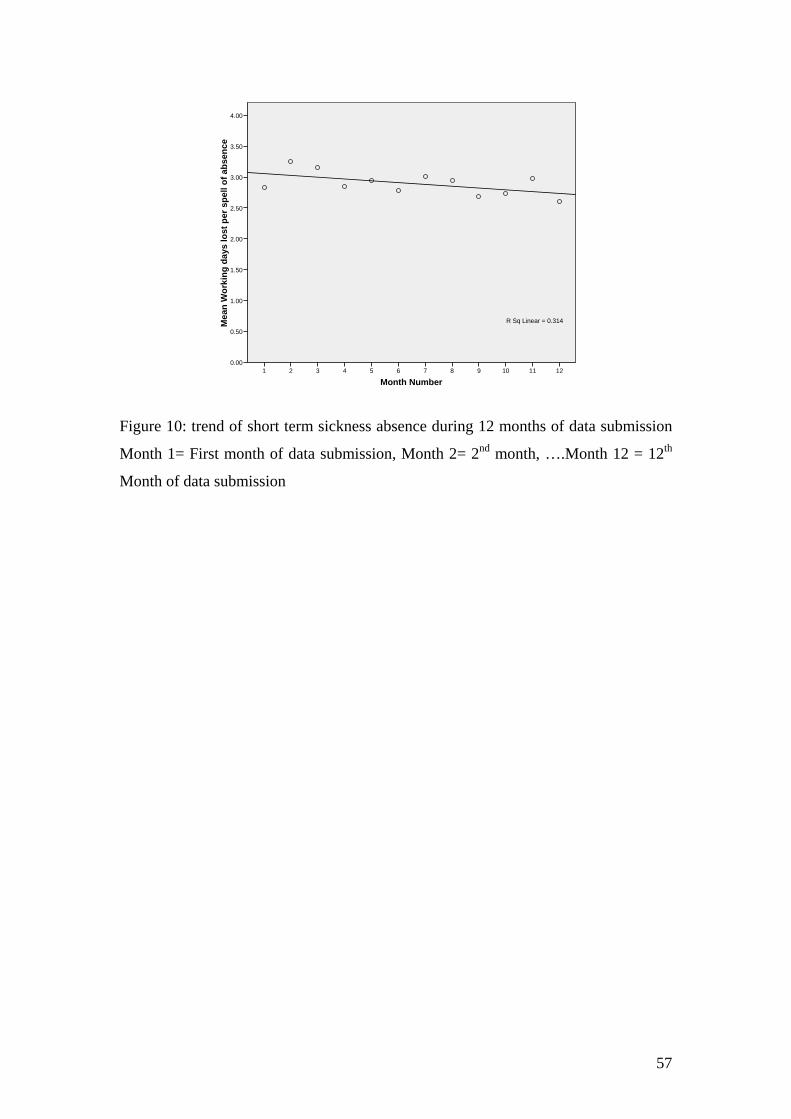
Mea
n W
orki
ng d
ays
lost
per
spe
ll of
abs
ence
4.00
3.50
3.00
2.50
2.00
1.50
1.00
0.50
0.00
R Sq Linear = 0.314
1 2 3 4 5 6 7 8 9 10 11 12
Month Number
Figure 10: trend of short term sickness absence during 12 months of data submission
Month 1= First month of data submission, Month 2= 2nd month, ….Month 12 = 12th
Month of data submission
57
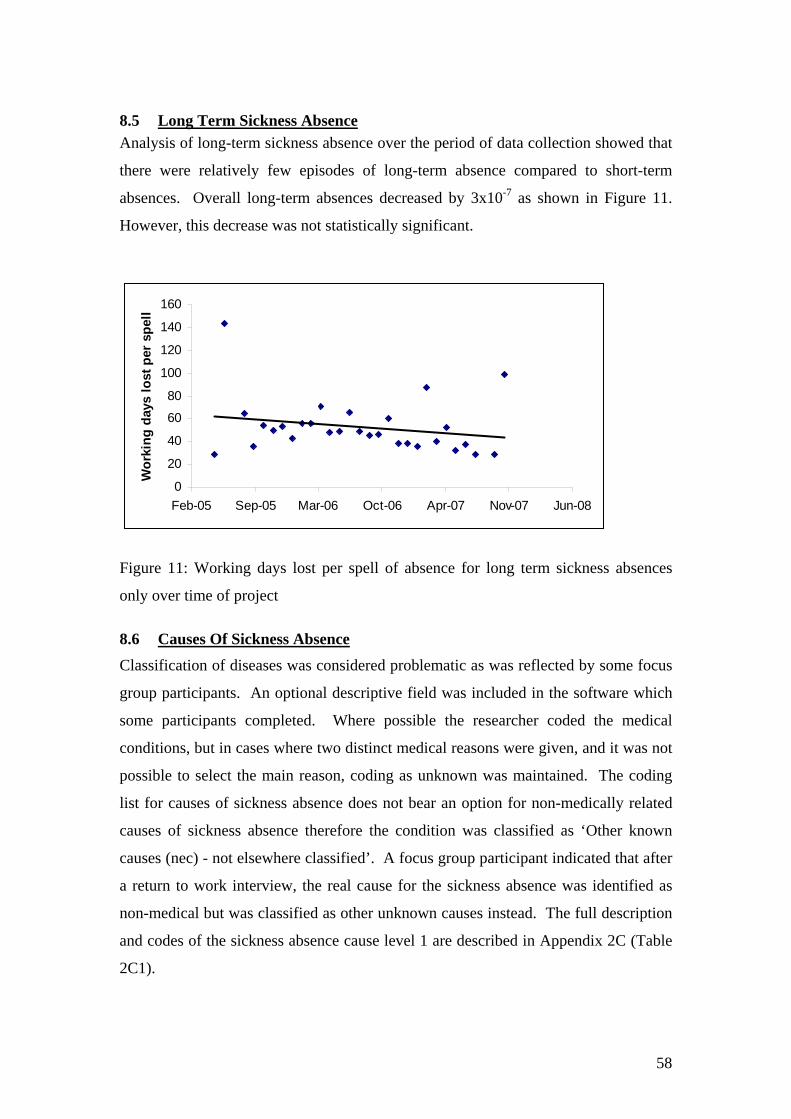
8.5 Long Term Sickness Absence Analysis of long-term sickness absence over the period of data collection showed that
there were relatively few episodes of long-term absence compared to short-term
absences. Overall long-term absences decreased by 3x10⁻⁷ as shown in Figure 11.
However, this decrease was not statistically significant.
0
20
40
60
80
100
120
140
160
Feb-05 Sep-05 Mar-06 Oct-06 Apr-07 Nov-07 Jun-08
Wor
king
day
s lo
st p
er s
pell
Figure 11: Working days lost per spell of absence for long term sickness absences
only over time of project
8.6 Causes Of Sickness Absence Classification of diseases was considered problematic as was reflected by some focus
group participants. An optional descriptive field was included in the software which
some participants completed. Where possible the researcher coded the medical
conditions, but in cases where two distinct medical reasons were given, and it was not
possible to select the main reason, coding as unknown was maintained. The coding
list for causes of sickness absence does not bear an option for non-medically related
causes of sickness absence therefore the condition was classified as ‘Other known
causes (nec) - not elsewhere classified’. A focus group participant indicated that after
a return to work interview, the real cause for the sickness absence was identified as
non-medical but was classified as other unknown causes instead. The full description
and codes of the sickness absence cause level 1 are described in Appendix 2C (Table
2C1).
58
Less than 20% of the organisations provided information on sickness absence cause
level 2, therefore this data was not analysed in detail. Sickness Absence cause 1 was
analysed for short term and long term absences and the results are summarised in
Table 4.
When all absences were counted together it can be seen that the highest sickness
absence rates (mean days lost per spell of absence) were for cardiovascular,
anxiety/depression, cancer, nervous disorders and injury problems. However, the
highest spells of absences occurred for gastrointestinal and influenza problems. When
the absences were compared by short and long term absences, the highest mean days
lost per spell of absences were recorded for anxiety/depression, infectious diseases,
injury, endocrine, substance abuse reasons for short term absences while for long term
absences the reasons leading to high numbers of WDL were cardiovascular, cancer
and nervous disorders.
A more detailed analysis of sickness absence data from SMEs across Scotland by
short and long term absence and analyses of causes of sickness absence can be seen in
Appendix 1.
59

Table 4: Mean days lost per absence spell – prevalence of sickness absence by long term and short term absences.
Total Sickness Absence rates Short Term Sickness Absence rates Long Term Sickness Absence rates Mean Std. Mean Std. Mean Std.
SA cause Level 1 Days Frequency Deviation Median % Days Frequency Deviation Median % Days Frequency Deviation Median % Cardiovascular 23.80 25.00 44.16 4.00 0.55 4.21 19.00 4.20 2.00 0.44 85.83 6.00 56.74 73.50 2.96 Anxiety/depression 23.15 193.00 35.63 12.00 4.25 7.57 132.00 6.15 5.50 3.04 56.85 61.00 47.86 46.00 30.05 Cancer 19.05 43.00 40.24 2.00 0.95 3.00 34.00 4.33 2.00 0.78 79.67 9.00 56.52 65.00 4.43 Nervous Disorders 13.54 13.00 27.41 3.00 0.29 4.73 11.00 5.12 2.00 0.25 62.00 2.00 56.57 62.00 0.99 Injury 13.24 163.00 21.51 5.00 3.59 5.24 131.00 5.17 4.00 3.02 45.98 32.00 30.47 32.00 15.76 Back Problems 9.07 196.00 15.43 3.00 4.31 4.51 175.00 4.55 3.00 4.03 47.10 21.00 20.97 40.00 10.34 Genito-gynae 8.58 80.00 17.16 2.00 1.76 3.78 73.00 4.45 2.00 1.68 58.57 7.00 21.09 57.00 3.45 Other Musculoskletal 7.57 131.00 13.39 3.00 2.88 4.22 119.00 4.68 3.00 2.74 40.75 12.00 23.74 28.00 5.91 Blood Disorders 7.50 8.00 9.38 3.50 0.18 2.50 6.00 1.76 2.00 0.14 22.50 2.00 0.71 22.50 0.99 Burns 7.06 16.00 10.77 2.00 0.35 4.73 15.00 5.59 2.00 0.35 42.00 1.00 . 42.00 0.49 Pregnancy related 7.01 39.00 9.66 3.00 0.86 4.68 36.00 5.09 2.50 0.83 35.00 3.00 6.93 39.00 1.48 Infectious 6.50 14.00 5.49 5.00 0.31 5.38 13.00 3.71 5.00 0.30 21.00 1.00 . 21.00 0.49 Other NEC 6.07 332.00 15.04 2.00 7.30 3.69 318.00 3.82 2.00 7.32 60.14 14.00 45.98 43.00 6.90 Respiratory 5.34 185.00 7.94 3.50 4.07 4.27 180.00 3.51 3.00 4.14 44.00 5.00 20.80 44.00 2.46 Endocrine 5.00 2.00 5.66 5.00 0.04 5.00 2.00 5.66 5.00 0.05 Substance Abuse 5.00 1.00 . 5.00 0.02 5.00 1.00 . 5.00 0.02 Dermatological 4.61 40.00 7.14 2.50 0.88 3.68 39.00 4.08 2.00 0.90 41.00 1.00 . 41.00 0.49 ENT 3.92 230.00 7.95 2.00 5.06 3.01 225.00 2.96 2.00 5.18 44.60 5.00 31.85 23.00 2.46 Asthma 3.28 23.00 3.00 2.00 0.51 3.28 23.00 3.00 2.00 0.53 Unknown 3.05 416.00 6.80 2.00 9.15 2.38 410.00 2.46 2.00 9.44 48.83 6.00 28.11 37.50 2.96 Eye problems 2.49 42.00 2.32 2.00 0.92 2.49 42.00 2.32 2.00 0.97 Influenza 2.41 954.00 1.80 2.00 20.99 2.41 954.00 1.80 2.00 21.97 Gastrointestinal 2.39 1054.00 4.84 1.00 23.19 1.96 1041.00 1.87 1.00 23.97 37.31 13.00 20.48 24.00 6.40 Dental & Oral 2.14 93.00 3.37 1.00 2.05 1.90 92.00 2.48 1.00 2.12 24.00 1.00 . 24.00 0.49 Headache 1.67 253.00 2.61 1.00 5.57 1.55 252.00 1.71 1.00 5.80 33.00 1.00 . 33.00 0.49 Total 5.10 4546.00 13.37 2.00 100.00 2.91 4343.00 3.26 2.00 100.00 52.01 203.00 38.49 40.00 100.00
60
9 Discussion
This study aimed to assess the utility of the SART software and associated services
with SMEs in Scotland. A mixture of qualitative and quantitative methods were used
to assess the impact of this software on sickness absence management in SMEs. The
response to the marketing of the tool confirmed that there is a strong interest in the
availability of such free software to help SMEs manage sickness absence. Despite the
SART being marketed in Scotland 20% of the 311 organisations expressing interest in
the project were from England or internationally based. Of the 247 Scottish
organisations 186 (75%) agreed to participate in the SAM project
At the start of the project, there were significant difficulties with the software and its
the implementation. This adversely affected recruitment to this project. A much
higher level of support than predicted was also required by participants. The SAM
team had to allocate additional resources to encourage and maintain participation in
the project. Originally it had been intended that the SCHWL advisers (individuals
with health and safety, occupational health, health promotion, environmental health
background) would be able to fulfil the role of support to software installation and
initial troubleshooting. The software problems were such that this was not possible
and a project IT officer was appointed to help with software installation and
troubleshoot IT problems arising in organisations. Minimal problems were reported
with the actual use of the software after installation and teething problems were sorted.
Each organisation had its own procedures and in some cases, they wanted the
software to perform differently to better help their management. One of the common
themes was the request for more graphical representations in the reports produced and
an ‘annual leave reporting’ facility. The suggested improvements are listed in
Appendix 3.
An important finding of this evaluation was the level of support which SMEs require.
This support was in two parts
• Installation and effective running of the software
• Advice, training and support and the wider aspect of the SAM project.
The seminars, regular updates and the availability of dedicated IT and expert advice
on sickness absence management were all felt to be important by SMEs. In-house
61
training of staff had to be conducted and a number of strategies had to be developed to
uphold interest in the project. Two of these measures were regular contact with
organisations, which were not contributing data regularly to the SAM project and
organisation of a number of high quality seminars on absence management. The
SAM project committee worked well and helped to establish networks to encourage
participation in the project and attendance to seminars. This was agreed by the project
steering group to be an effective local initiative. Most of the seminars were sponsored
by a project partner. The seminars were either free or at minimal cost and were well
attended. Excellent feedback was received at the end of each seminar. SMEs
welcomed the initiative and indicated that they wanted more help in this area and
more seminars on key issues of interest would have been well received. The success
of the seminars indicated that sickness absence was a major concern to organisations.
As a result of SART within the SAM project some organisations had accessed
SCHWL services for risk assessment and other reasons. However it was not possible
to obtain and evaluate these in this report and their impact within the project time
frame. The need for provision of support services to SMEs was recognised in the
report of the Support Programme Action Group 5 of Securing Health Together (HSE,
2002) and has been the basis of the established Scottish Centre for Healthy Working
Lives service in Scotland, and the recent Workplace Health Connect pilot in England.
Trends in absences
Trend in Sickness Absence over the participation period
During the period of data collection and analysis sickness absence declined. There is
existence that SART was associated with a steady decline in the study period and for
some organisations, this was statistically significant. Extension of the study period
would confirm or otherwise if this decline was sustained. Qualitative feedback
confirmed that SMEs viewed the tool as assisting in reduction of sickness absence
through better understanding and provision of data. This confirms the old adage ‘if
they can measure it they will manage it.’
The overall trend in sickness absence rates show a very small decline in sickness
absence rates for the organisations, for both long term and short term absence over the
time of data contribution. Short term absences over the rolling year period of data
submission showed a significant decrease in sickness absence. However, data was
62
contributed over a relatively short period and the majority of organisations did not
record sickness absence before taking part in the project. It is therefore difficult to
conclusively attribute this decrease to the SAM project.
Sickness absence data
The majority of organisations submitting data to the SAM project were from the
Health and Social Work or Other community, social and personal activities sector.
The main types of absence data recorded on SART were sickness absence, Annual
leave and non-medical reasons. The majority of employees had 1-2 spells of absence
over the 1 year period. The CIPD reported the majority of employees had between 1
5 spells of absences for employees from both small and large organisations (CIPD
2007).
Qualitative information gathered suggests that organisations taking part in the project
were primarily concerned about issues of short term sickness absence management.
The CBI also reported that long term sickness absence tends to affect larger
organisations more (CBI, 2007). Therefore, data was analysed separately for short
and long terms absences.
Data was sent to the SAM project in a ‘comma separated file’ (csv) format. The data
was cleaned and imported into an SPSS programme for analysis. However, this
transfer created problems with date manipulation and considerable effort had to be
made to clean and re-format data with for sickness absence rates analysis.
Overall Sickness Absence Rates
Overall mean sickness absence was 5.02 days per spell of absence. Mean sickness
absence for short term absences was 2.89 days per spell while an average of 52.01
days were lost due to long term absences only. In this study, the results are
representative of the sample of organisations taking part in the project. However, they
compare to published overall sickness absence rates of 5.07 WDL/spell of absence
(CIPD 2007) and 7 WDL/employee (CBI, 2007) for overall absences for
organisations of all sizes. A survey conducted by the EEF –the manufacturer’s
organisation, showed sickness absence rates of 5.5-7.1 WDL for small to medium
sized organisations (EEF, 2007). The CBI reports that smaller organisations had the
lowest sickness absence rates of 4 to 6.5 WDL.
63
Sickness absence by Industrial Sector
Industrial sector specific sickness absence rates indicate that the highest short term
sickness absence rates occurred in the Public Administration sector while for long
term absences this is observed in ‘other community, social and personal service
activities sector. Overall sickness absence rates were highest in the ‘Transport,
storage and communication’ sector. This was also noted by the CBI survey where
highest levels of absence in the ‘transport and distribution’, ‘retailing’ and
‘manufacturing’ sectors (CBI, 2007). In the CIPD (2007) report however,
‘Transport/logistics’ ranked sixth on the list of highest mean days lost by industry
sector.
In this study, the lowest rates were observed in the ‘wholesale and retail’ and
‘financial intermediation sectors’ for both long and short term absences. The CIPD
study (2007) also reported lower overall sickness absence rates for retail and financial
services.
In this study, the rates were much lower (1.75 and 2.04 WDL/Spell for Financial
Intermediation and Retail) as compared to published figures of 3.57 and 4.02 for these
sectors (Spurgeon et al., 2007). A larger number of organisations within each sector
would need to be studied to confirm these findings.
Sickness Absence by Age Group and Gender
Overall, people over 35 years of age had a significantly higher working days lost due
to sickness absence than younger age groups. This was also the case for short term
sickness absences. For long term sickness absences, there was no significant
difference between the age groups. When frequency of sickness absence was studied,
it was observed that the highest frequency was observed in the 35-45 year old group
while the lowest frequency was in the over 55s with an inverted U shaped
relationship. This is in accordance with published trends of sickness absence by age
(Spurgeon et al., 2007; Rhodes, 1983) although some authors suggest that there is a
linear relationship between age and absence and that it is tenure within a job which
leads to a curvilinear relationship (Thomson et al., 2000). In this study tenure was not
measured as organisations did not complete this information since it was not
mandatory.
64
Other demographic and social factors not investigated which might have had an effect
on the age/absence relationship include family structure (such as marital status,
number of children; Barmby et al., 2002), but this data was not collected within the
SART tool design.
Similarly, data showed that there was a higher frequency of sickness absence among
women than men but that the mean days lost due to absence was marginally higher for
men than for women. This has also been reported previously (Spurgeon et al., 2007),
but once more, others have reported that the presence of children increased the
probability for absence in women but not in men (Vistnes, 1997).
HSE commissioned the SWASH survey in 2005 (HSE, 2005) which had a larger
response rate when compared to the CBI or CIPD surveys. Findings from SWASH
survey indicate that, when other factors were eliminated, the differences in sickness
absence figures was insignificant. The biggest predictors for sickness absence were
size of organisation, gender and age. Large organisations employing more women
than men and more people in older age ranges would have higher rates of sickness
absence.
If the SART software had included the capacity to gather social, personal and
demographic factors, and this information was input into the software by the
participants, this could help with the identification of social and other influences on
sickness absence for the Scottish SME population.
Causes of sickness Absence
Gastrointestinal and Influenza problems were the most frequent medical problems
highlighted for short term absences while for long term absences anxiety and
depression, injuries and back problems were the most frequent complaints. This has
also been reported by the CBI (2007), CIPD (2007) and the HSE (2007).
With respect to causes of working days lost per spell of absence, anxiety and
depression, infections and injuries led to the highest numbers of working days lost for
short term absences while cardiovascular and cancer problems led to the highest
numbers of working days lost per spell of absence for long term absences. This
compared to cancer, surgery, mental health problems and injury/poisoning for other
published data (Spurgeon et al., 2007).
65
Overall for this population, (short and long term SA) the three most frequent
complaints were gastrointestinal problems, influenza and unknown causes, while
cardiovascular problems and mental health related complaints led to the highest
numbers of working days lost .
Causes for sickness absence vary with time. Until recently the most common causes
for sickness were musculoskeletal disorders, particularly back pain. Since 1994-95
there has been a drop of 42% of new awards for social security made for back related
problems (Waddell et al., 2002). Instead, mental health problems have increased
significantly (Jones et al., 2003). Since mental health now counts for 50% of reasons
for incapacity benefit claims (Bewley et al., 2007), employers should look after their
worker's mental health in particular and make changes if necessary. Several recent
government initiatives have been introduced to help increase employability of people
with mental health problems; one of which is the ‘Pathways to Work’ programme
(DWP, 2002). Each year more than £13bn are spent on incapacity benefit, but only
20% of people receiving incapacity benefit for more than six months tend to return to
work in the following five years (DWP, 2002).
The need for improvement for vocational rehabilitation has been identified in the
Scottish rehabilitation strategy (Scottish Executive, 2007) and in a recent report by
Dame Carol Black (Black, 2008). The evidence base for vocational rehabilitation has
also been reviewed in (Waddell & Burton, 2004; Waddell et al., 2008). Every
instance of long term sickness absence or incapacity benefit award starts with the
issue of a sick note and the improved recording and analysis of sickness absence may
stimulate earlier interventions and reduction of unnecessary sickness absence.
Although larger organisations tend to have the ability to access sickness absence
management advice through consultants or occupational health services, smaller
organisations do not have access to such facilities. The SAM project and the SART
software could help spot and manage people going on short-term sickness absence
due to mental health or any other causes of ill health before it becomes long-term
issue or leads to incapacity.
66
10 Conclusions
This study has confirmed that SMEs have an interest in and a need for sickness
absence management tools and relevant associated services. Smaller organisations in
this study highlighted the lack support on managing sickness absence. The SART
tool and the SAM project initiative were welcomed by all participants including those
who did not complete the study. During the first year of participating on the SAM
project, participants were using the tool mainly for data input. Organisations who had
started to use the SART tool to analyse absence patterns found the tool very useful.
There was a high level of handholding required at the start of the project but recording
absence did act as a catalyst for managing absence. Although organisations had not
yet started generating many reports from the software, the tool was able to help
manage short term absences by producing reports that were mostly used in return to
work interviews. The seminars organised by the SAM project were very successful at
informing SMEs about sickness absence and were well received. It was very difficult
to judge the level of the associated support services offered through SAM project
partners as the majority of organisations interviewed had not had recourse to the
additional support. However, the services associated with the SAM project,
particularly the seminars and helpline, helped in signposting organisations to local
services. Feedback was generally very positive and a need for further training and
support on managing absence was highlighted. It does not appear that just providing a
tool to SMEs will initiate active management of their sickness absence. The tool
needs to be combined with adequate support.
From this study, it can be seen than a separate analysis of short and long term sickness
absences can show varying results as compared to an analysis of merged short and
long term absences. The problems faced by smaller organisations in this context are
not very different to problems faced by larger organisations (Spurgeon et al., 2007;
CBI, 2007). However, the ways in which these problems are tackled may differ.
Supporting organisations with SAM appears to have helped them manage sickness
absence. While not always statistically significant, sickness absence did fall during
the period of the study.
67
The data analysed in this study is from a relatively small sample of organisations, and
therefore, although in depth statistical analysis can be performed with the data, a
larger sample could help to make further inferences from the data. A small number of
organisations are still contributing data on a monthly basis to the SAM project and
could be used as sentinel organisations to benchmark sickness absence rates in SMEs
in Scotland.
68
11 Recommendations
1. The SART tool should be further developed and made more widely available
to SMEs and other industry sectors.
2. The software should be modified to facilitate installation and use. A web
format was proposed by the participants.
3. The report generation facility should be enhanced to provide graphical
representation and trend analysis.
4. The SART tool should be developed to provide better signposting and links to
other advisory and support systems available including health and safety and
to encourage their uptake where appropriate. e.g. the SCHWL advisory service
in Scotland and equivalent services in England and Wales.
5. The SME sector requires more support in managing sickness absence and the
health of the workforce, and appropriate support systems such as local support
networks need to be further developed.
6. There is a clear need for the provision of free or low cost training to this
sector.
69
12 References
1. Chartered Institute of Personnel and Development (2007) Absence
Management – annual survey report, CIPD London
2. Spurgeon P, Mazelan P, Barwell F, Flanagan H (2007) New Directions in
Managing Employee Absence: An evidence-based approach Research into
Practice , CIPD, London
3. Confederation of British Industry (2007)Attending to Absence: absence and
labour turnover. CBI Publications, London
4. Barmby T, Ercolani M and Treble J (2002) Sickness Absence : an
international comparison The Economic Journal 112: F315-331
5. Bewley H, Dorsett R, Haile G (2007) The impact of Pathways to work
Research Report 435, DWP, Leeds
6. Black C (2008) Working for a Healthier Tomorrow: Review of the health of
Britain's working age population, TSO, London
7. Department of Works and Pensions (2002) Pathways to work: helping people
into employment Stationery Office, London
8. EEF –The manufacturer’s Organisation (2007) Sickness absence and
rehabilitation survey, EEF, London
9. Health and Safety Executive (2007) Self-reported work-related illness and
workplace injuries in 2005/06: Results from the Labour Force Survey, HSE,
Caerphilly
10. Health and Safety Executive (2005) Survey of Workplace Absence Sickness
and (Ill) Health (SWASH) HSE, London
11. Health and Safety Executive (2000) Securing Health Together: A long-term
occupational health strategy for England, Scotland and Wales, HSE books,
London
12. Health and Safety Executive (2002) Support Program Action Group 5 for
Securing Health Together, http://www.hse.gov.uk/sh2/pags/supportreport.pdf
13. Healthy Working Lives: A plan for Action. Edinburgh: Scottish Executive,
2004
14. Jones J, Huxtable C, Hogson J, Price M. (2003) Self reported work related
illness in 2001/2002 HSE, London.
70
15. Rhodes SR(1983) Age-related differences in work-attitudes and behaviour: a
review an conceptual analysis. Psychological Bulletin, 93: 328-367
16. Ritchie P, Cowie H, Graham M, Hutchison P, Mulholland R, Melrose A and
Pilkington A (2005) Health and Safety Executive, Managing health at work –
recording and monitoring information on sickness absence including work
relatedness, HSE CRR report 310, 2005
17. Scottish Executive (2007) Co-ordinated, integrated and fit for purpose: A
Delivery Framework for Adult Rehabilitation in Scotland, Edinburgh
18. Thomson L, Griffiths A & Davison S (2000) Employee Absence, Age, and
tenure: a study of non-linear effects and trivariate models Work and Stress
14(1): 16-34
19. Vistnes JP (1997) Gender differences in days lost from work due to illness.
Industrial labour Relations Review 50(2): 304-323.
20. Waddell G, Aylward M, Sawney P (2002) Back Pain, incapacity for work and
social security benefits: an international literature review analysis , Royal
Society of Medicine Press, London
21. Waddell G, Burton K (2004) Concepts of Rehabilitation for the Management
of Common Health Problems, The Stationery Office, London
22. Waddell G Burton AK Kendall N. (2008) Vocational Rehabilitation Evidence
Review: What works, for whom, and when? Monograph commissioned by
ABI on behalf of the Vocational Rehabilitation Task Group. The Stationery
Office, London In press 2008
71
APPENDICES
Appendices ............................................................................................................................................ 72
Appendix 1: SAM Project Sickness Absence Data Analysis .............................................................73
Appendix 2A: SAM Participant Company Profiles...........................................................................99
Appendix 2B: SART Sickness Absence Data Analysis ....................................................................105
Appendix 2C: Causes of Sickness Absence.......................................................................................114
Appendix 3: SART Software IT Issues ............................................................................................. 130
Appendix 4: Examples of Questionnaires And Discussion Guides Used .......................................138
Appendix 5: Examples of Seminars Conducted...............................................................................155
Appendix 6: SAM Project Marketing Leaflet ..................................................................................156
Appendix 7: Example of SAM Newsletter........................................................................................158
72
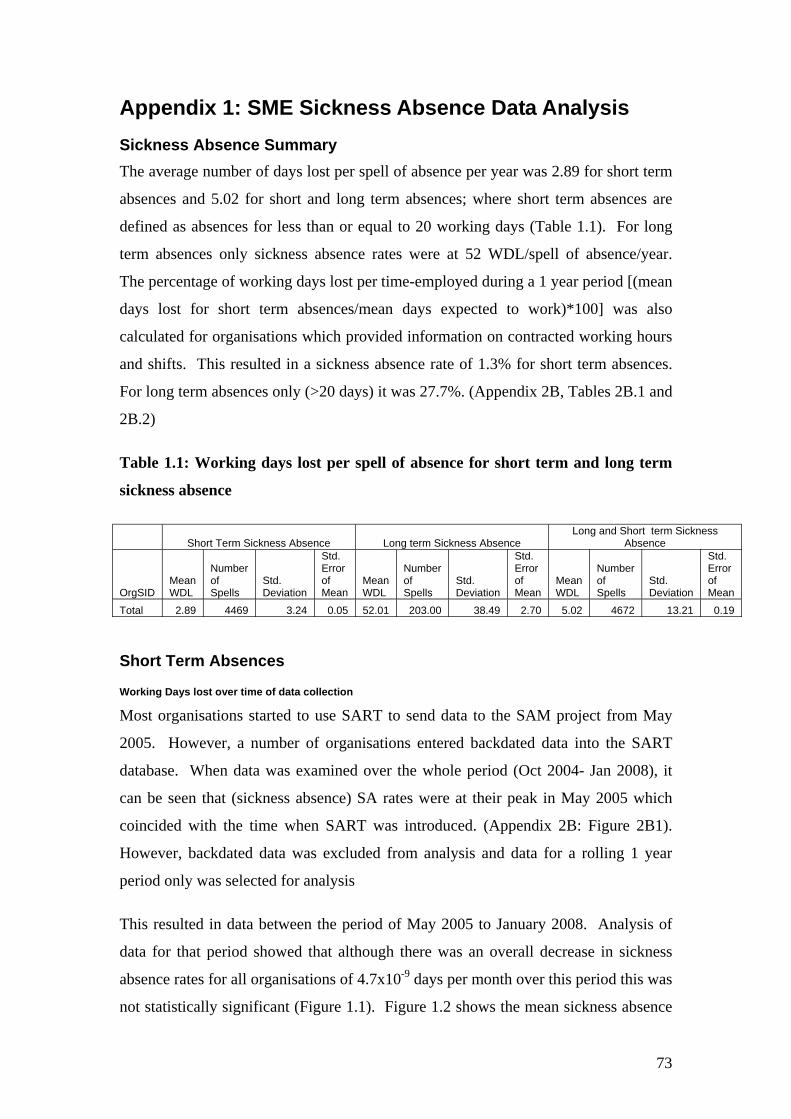
Appendix 1: SME Sickness Absence Data Analysis Sickness Absence Summary The average number of days lost per spell of absence per year was 2.89 for short term
absences and 5.02 for short and long term absences; where short term absences are
defined as absences for less than or equal to 20 working days (Table 1.1). For long
term absences only sickness absence rates were at 52 WDL/spell of absence/year.
The percentage of working days lost per time-employed during a 1 year period [(mean
days lost for short term absences/mean days expected to work)*100] was also
calculated for organisations which provided information on contracted working hours
and shifts. This resulted in a sickness absence rate of 1.3% for short term absences.
For long term absences only (>20 days) it was 27.7%. (Appendix 2B, Tables 2B.1 and
2B.2)
Table 1.1: Working days lost per spell of absence for short term and long term
sickness absence
Short Term Sickness Absence Long term Sickness Absence Long and Short term Sickness
Absence
OrgSID Mean WDL
Number of Spells
Std. Deviation
Std. Error of Mean
Mean WDL
Number of Spells
Std. Deviation
Std. Error of Mean
Mean WDL
Number of Spells
Std. Deviation
Std. Error of Mean
Total 2.89 4469 3.24 0.05 52.01 203.00 38.49 2.70 5.02 4672 13.21 0.19
Short Term Absences
Working Days lost over time of data collection
Most organisations started to use SART to send data to the SAM project from May
2005. However, a number of organisations entered backdated data into the SART
database. When data was examined over the whole period (Oct 2004- Jan 2008), it
can be seen that (sickness absence) SA rates were at their peak in May 2005 which
coincided with the time when SART was introduced. (Appendix 2B: Figure 2B1).
However, backdated data was excluded from analysis and data for a rolling 1 year
period only was selected for analysis
This resulted in data between the period of May 2005 to January 2008. Analysis of
data for that period showed that although there was an overall decrease in sickness
absence rates for all organisations of 4.7x10⁻⁹ days per month over this period this was
not statistically significant (Figure 1.1). Figure 1.2 shows the mean sickness absence
73
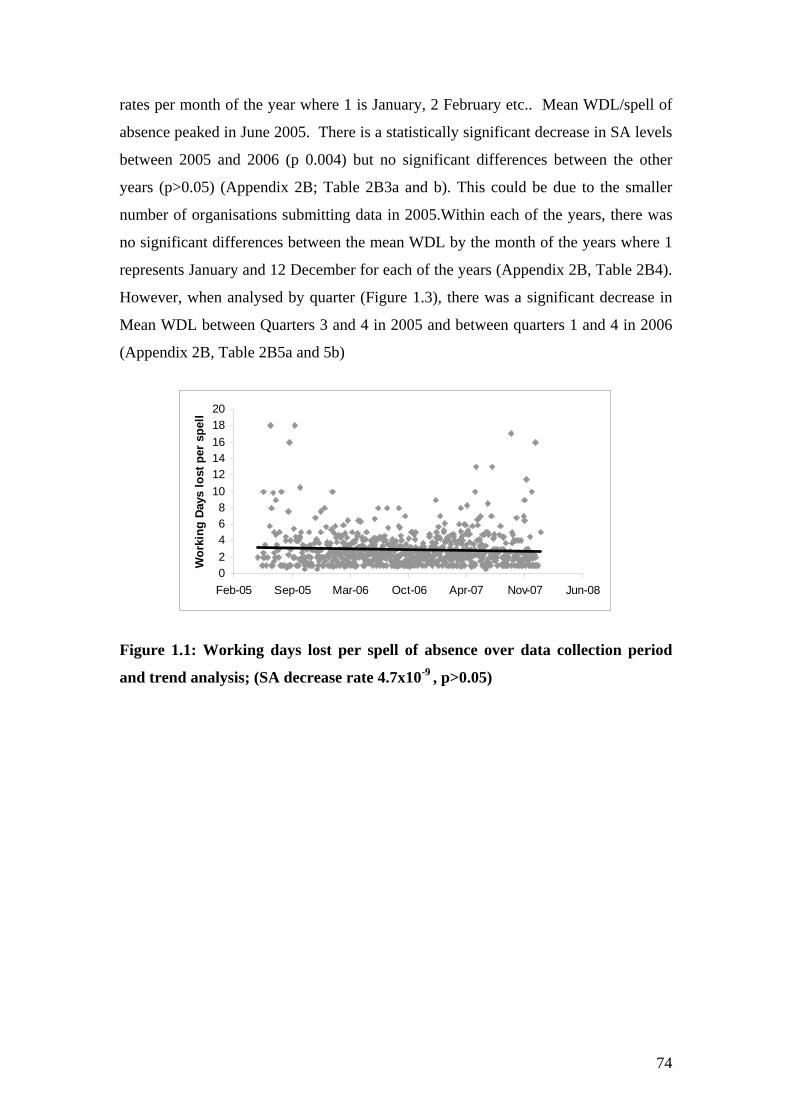
rates per month of the year where 1 is January, 2 February etc.. Mean WDL/spell of
absence peaked in June 2005. There is a statistically significant decrease in SA levels
between 2005 and 2006 (p 0.004) but no significant differences between the other
years (p>0.05) (Appendix 2B; Table 2B3a and b). This could be due to the smaller
number of organisations submitting data in 2005.Within each of the years, there was
no significant differences between the mean WDL by the month of the years where 1
represents January and 12 December for each of the years (Appendix 2B, Table 2B4).
However, when analysed by quarter (Figure 1.3), there was a significant decrease in
Mean WDL between Quarters 3 and 4 in 2005 and between quarters 1 and 4 in 2006
(Appendix 2B, Table 2B5a and 5b)
0 2 4 6 8
10 12 14 16 18 20
Feb-05 Sep-05 Mar-06 Oct-06 Apr-07 Nov-07 Jun-08
Wor
king
Day
s lo
st p
er s
pell
Figure 1.1: Working days lost per spell of absence over data collection period
and trend analysis; (SA decrease rate 4.7x10⁻⁹ , p>0.05)
74
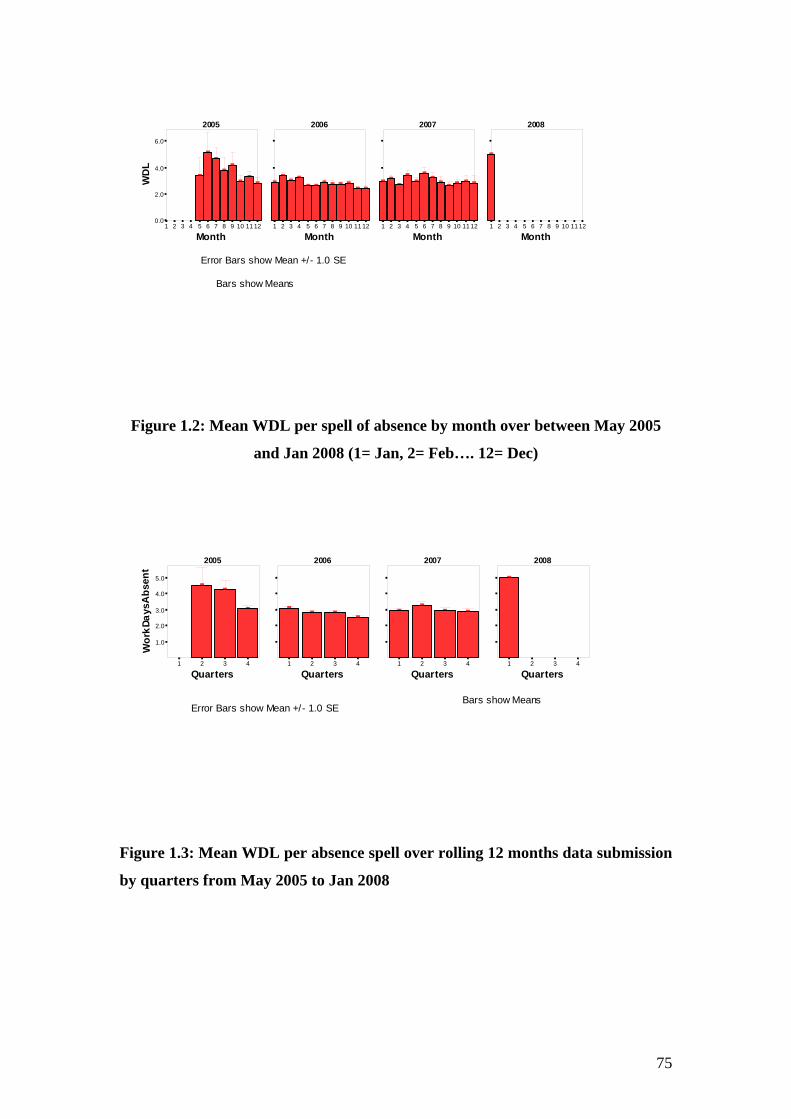
2005 2006 2007 2008
1 2 3 4 5 6 0.0
2.0
4.0
6.0 W
DL
]
]
]
] ]
] ]
]
1 2 3 4 5 6
]
] ] ]
]] ] ] ] ]
] ]
1 2 3 4 5 6 7
] ]
]
]
]
] ] ] ] ] ]
]
1 2 3 4 5 6 7
]
7 8 9 10 11 12 7 8 9 10 11 12 8 9 10 11 12 8 9 10 11 12
Month Month Month Month
Error Bars show Mean +/- 1.0 SE
Bars show Means
Figure 1.2: Mean WDL per spell of absence by month over between May 2005
and Jan 2008 (1= Jan, 2= Feb…. 12= Dec)
2005 2006 2007 2008
Wo r
k Da y
sAb s
ent
] ]
] ] ] ]
] ]
] ]
]
]
1.0
2.0
3.0
4.0
5.0
1 2 3 4 1 2 3 4 1 2 3 4 1 2 3 4
Quarters Quarters Quarters Quarters
Bars show Means Error Bars show Mean +/- 1.0 SE
Figure 1.3: Mean WDL per absence spell over rolling 12 months data submission
by quarters from May 2005 to Jan 2008
75
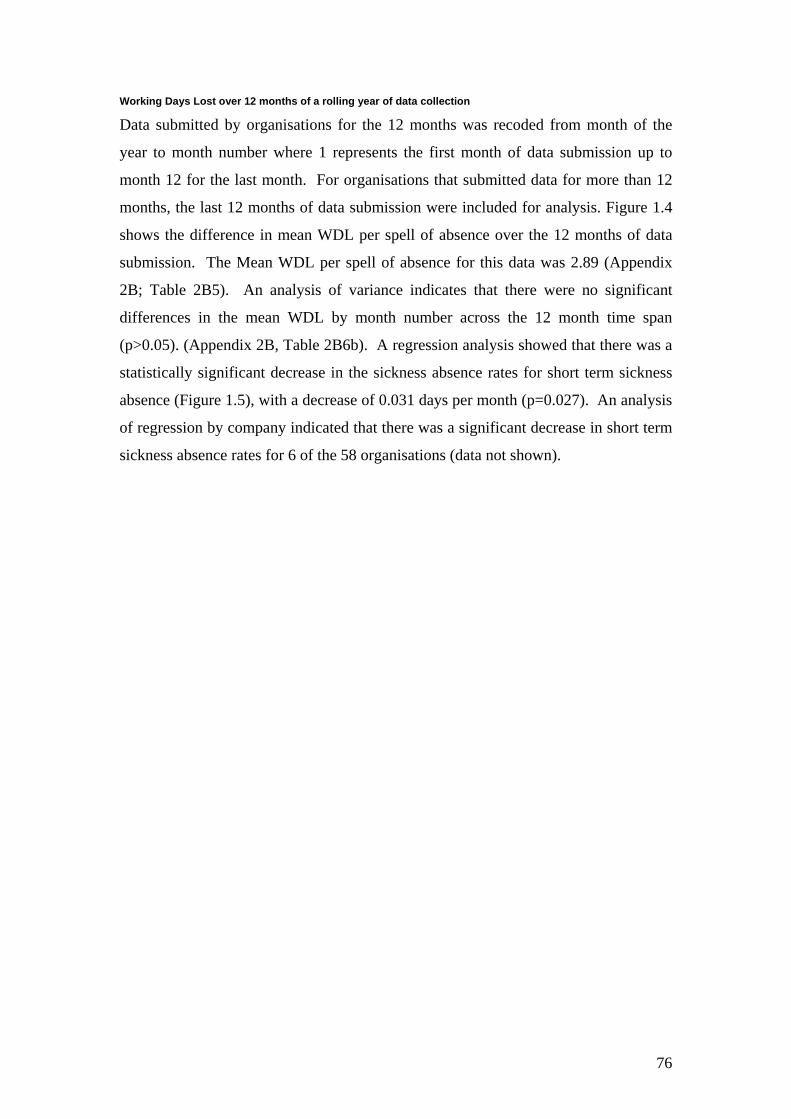
Working Days Lost over 12 months of a rolling year of data collection
Data submitted by organisations for the 12 months was recoded from month of the
year to month number where 1 represents the first month of data submission up to
month 12 for the last month. For organisations that submitted data for more than 12
months, the last 12 months of data submission were included for analysis. Figure 1.4
shows the difference in mean WDL per spell of absence over the 12 months of data
submission. The Mean WDL per spell of absence for this data was 2.89 (Appendix
2B; Table 2B5). An analysis of variance indicates that there were no significant
differences in the mean WDL by month number across the 12 month time span
(p>0.05). (Appendix 2B, Table 2B6b). A regression analysis showed that there was a
statistically significant decrease in the sickness absence rates for short term sickness
absence (Figure 1.5), with a decrease of 0.031 days per month (p=0.027). An analysis
of regression by company indicated that there was a significant decrease in short term
sickness absence rates for 6 of the 58 organisations (data not shown).
76
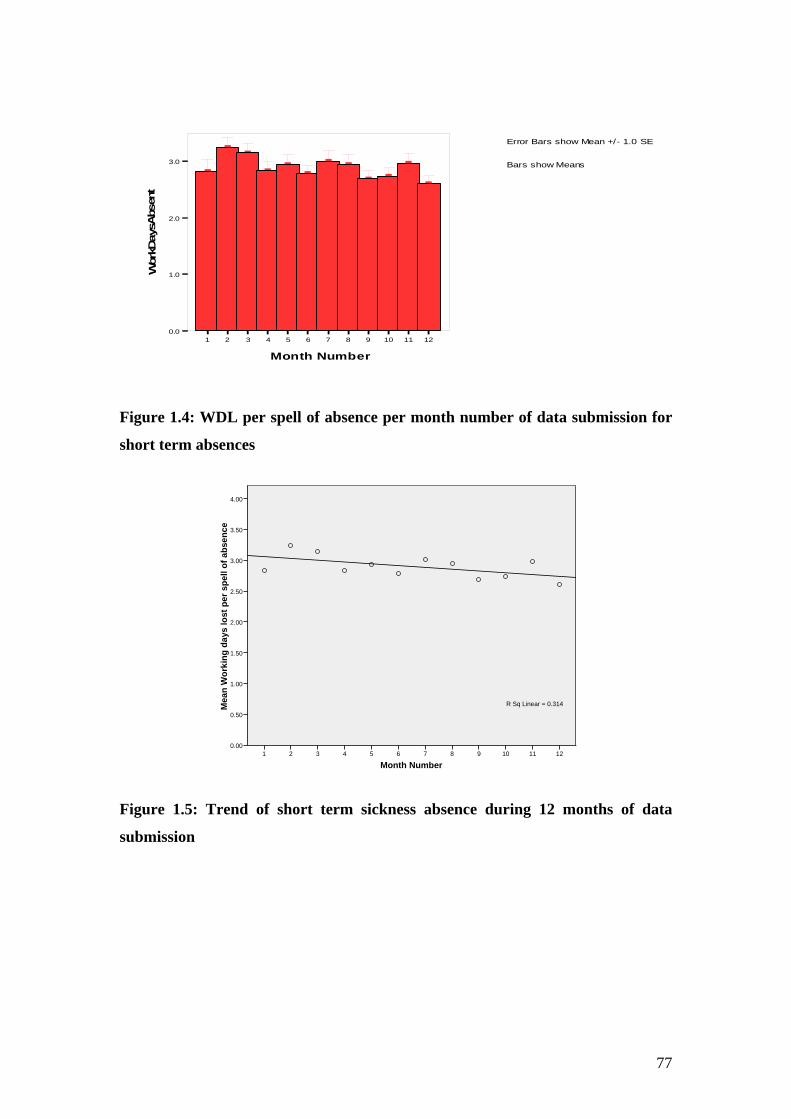
Wor
kDay
sAbs
ent
]
] ]
] ]
]
] ]
] ]
]
]
Error Bars show Mean +/- 1.0 SE
3.0 Bars show Means
2.0
1.0
0.0 1 2 3 4 5 6 7 8 9 10 11 12
Month Number
Figure 1.4: WDL per spell of absence per month number of data submission for
short term absences
121110987654321
Mea
n W
orki
ng d
ays
lost
per
spe
ll of
abs
ence
4.00
3.50
3.00
2.50
2.00
1.50
1.00
0.50
0.00
R Sq Linear = 0.314
Month Number
Figure 1.5: Trend of short term sickness absence during 12 months of data
submission
77
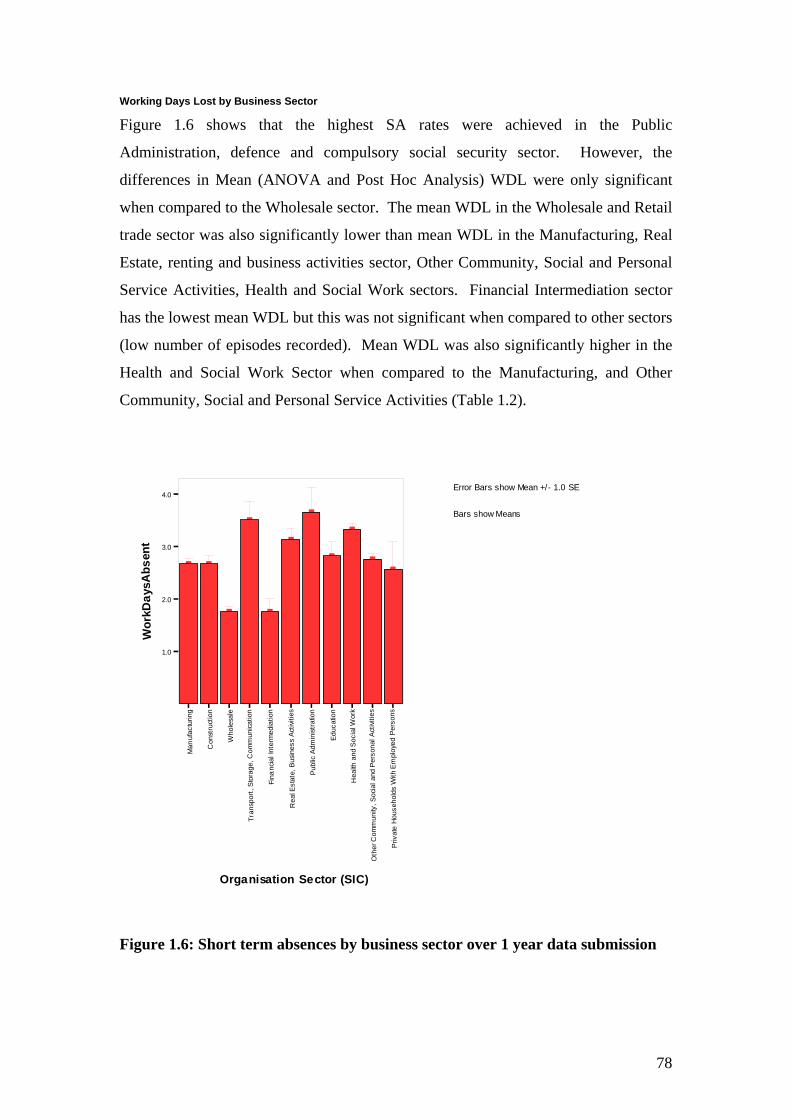
Working Days Lost by Business Sector
Figure 1.6 shows that the highest SA rates were achieved in the Public
Administration, defence and compulsory social security sector. However, the
differences in Mean (ANOVA and Post Hoc Analysis) WDL were only significant
when compared to the Wholesale sector. The mean WDL in the Wholesale and Retail
trade sector was also significantly lower than mean WDL in the Manufacturing, Real
Estate, renting and business activities sector, Other Community, Social and Personal
Service Activities, Health and Social Work sectors. Financial Intermediation sector
has the lowest mean WDL but this was not significant when compared to other sectors
(low number of episodes recorded). Mean WDL was also significantly higher in the
Health and Social Work Sector when compared to the Manufacturing, and Other
Community, Social and Personal Service Activities (Table 1.2).
Wor
kDay
sAbs
ent
] ]
]
]
]
]
]
]
]
]
]
1.0
2.0
3.0
4.0 /Error Bars show Mean +
Bars show Means
- 1.0 SE
se k se snos
gn no e no no no no rl as e
oW
i ii i i i i it t t tr t t t i a acudE
ic uu ac a v vr rt i i il dem
eP
dey o
tc a
t tohW
lr i cAs s en
s cAanu
mmo
C
t is noC
inf c oS
dnah
unaM
i lmdA
c
r anos
et nI li pm
Eh
s uB
l ra eP
dna
i, liega
buP
c nan
t l, aeH
er tto ia Wsd
it F tS lsE ai, c o
S
t r l laeR
ops na
ohes uoH
e
,y ti num
moC
r T
t avi rr PehtO
Orga nisation Se ctor (SIC)
Figure 1.6: Short term absences by business sector over 1 year data submission
78
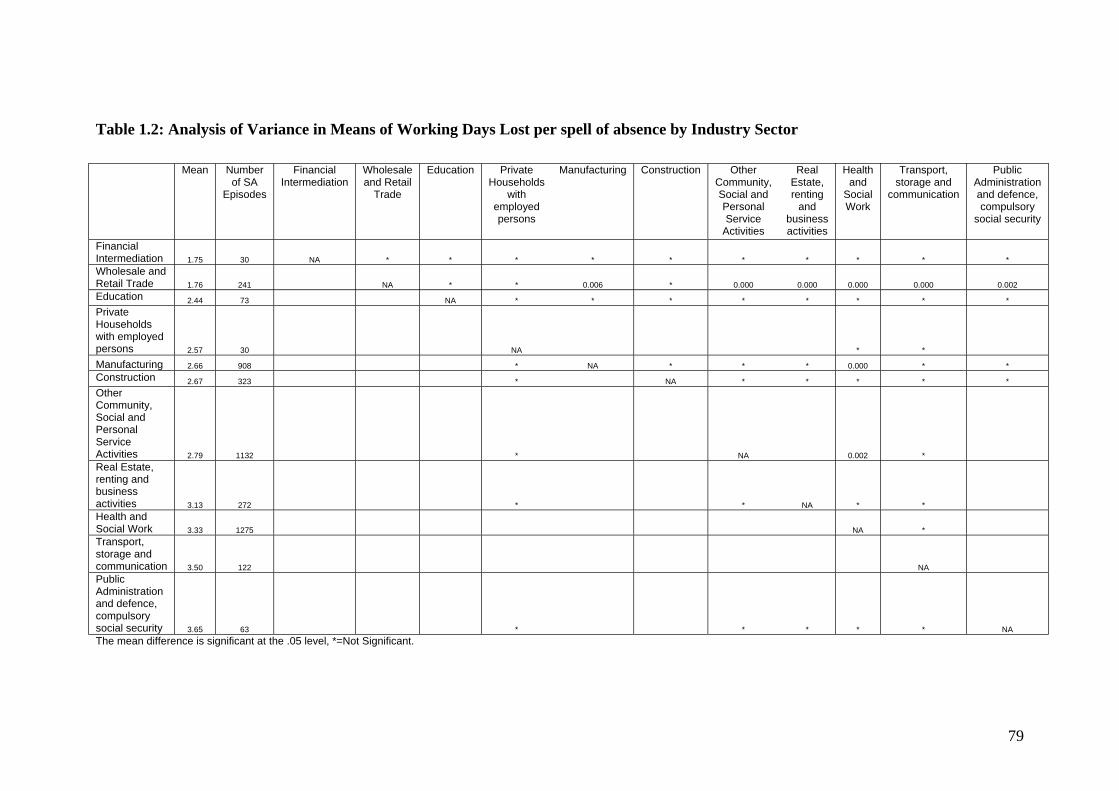
Table 1.2: Analysis of Variance in Means of Working Days Lost per spell of absence by Industry Sector
Mean Number of SA
Episodes
Financial Intermediation
Wholesale and Retail
Trade
Education Private Households
with employed persons
Manufacturing Construction Other Community, Social and Personal Service
Activities
Real Estate, renting
and business activities
Health and
Social Work
Transport, storage and
communication
Public Administration and defence, compulsory
social security
Financial Intermediation 1.75 30 NA * * * * * * * * * * Wholesale and Retail Trade 1.76 241 NA * * 0.006 * 0.000 0.000 0.000 0.000 0.002 Education 2.44 73 NA * * * * * * * * Private Households with employed persons 2.57 30 NA * *
Manufacturing 2.66 908 * NA * * * 0.000 * * Construction 2.67 323 * NA * * * * * Other Community, Social and Personal Service Activities 2.79 1132 * NA 0.002 * Real Estate, renting and business activities 3.13 272 * * NA * * Health and Social Work 3.33 1275 NA * Transport, storage and communication 3.50 122 NA Public Administration and defence, compulsory social security 3.65 63 * * * * * NA The mean difference is significant at the .05 level, *=Not Significant.
79
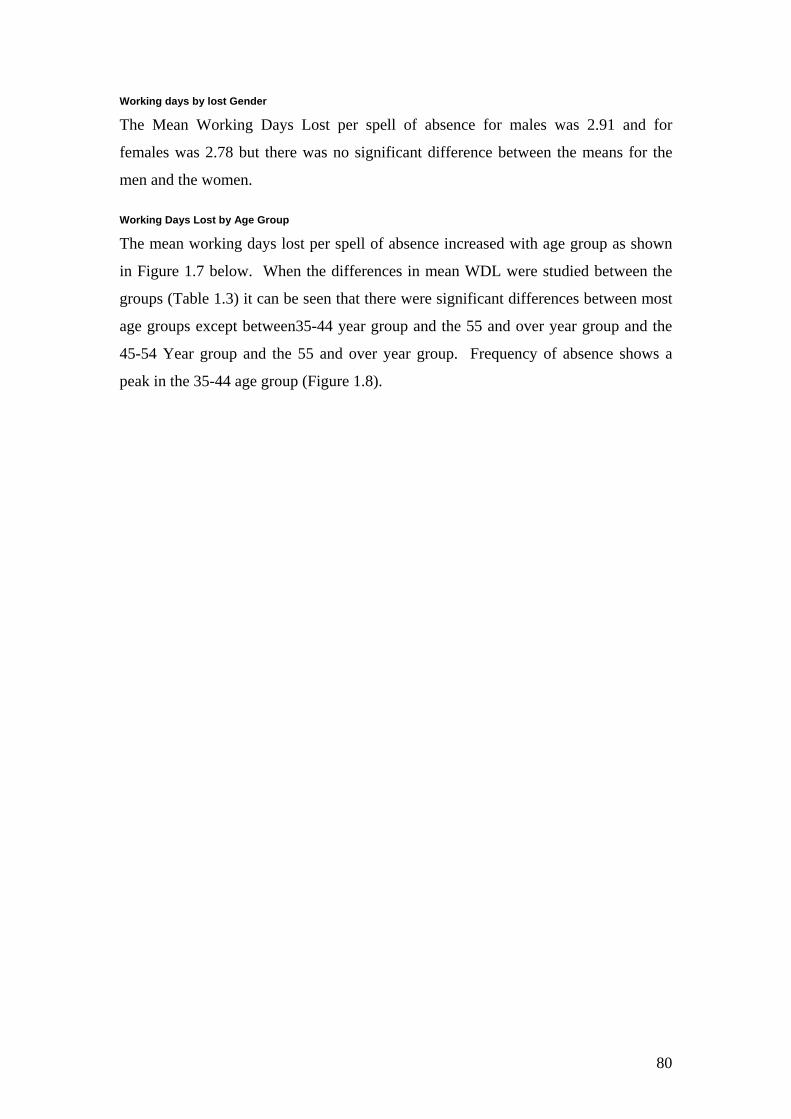
Working days by lost Gender
The Mean Working Days Lost per spell of absence for males was 2.91 and for
females was 2.78 but there was no significant difference between the means for the
men and the women.
Working Days Lost by Age Group
The mean working days lost per spell of absence increased with age group as shown
in Figure 1.7 below. When the differences in mean WDL were studied between the
groups (Table 1.3) it can be seen that there were significant differences between most
age groups except between35-44 year group and the 55 and over year group and the
45-54 Year group and the 55 and over year group. Frequency of absence shows a
peak in the 35-44 age group (Figure 1.8).
80
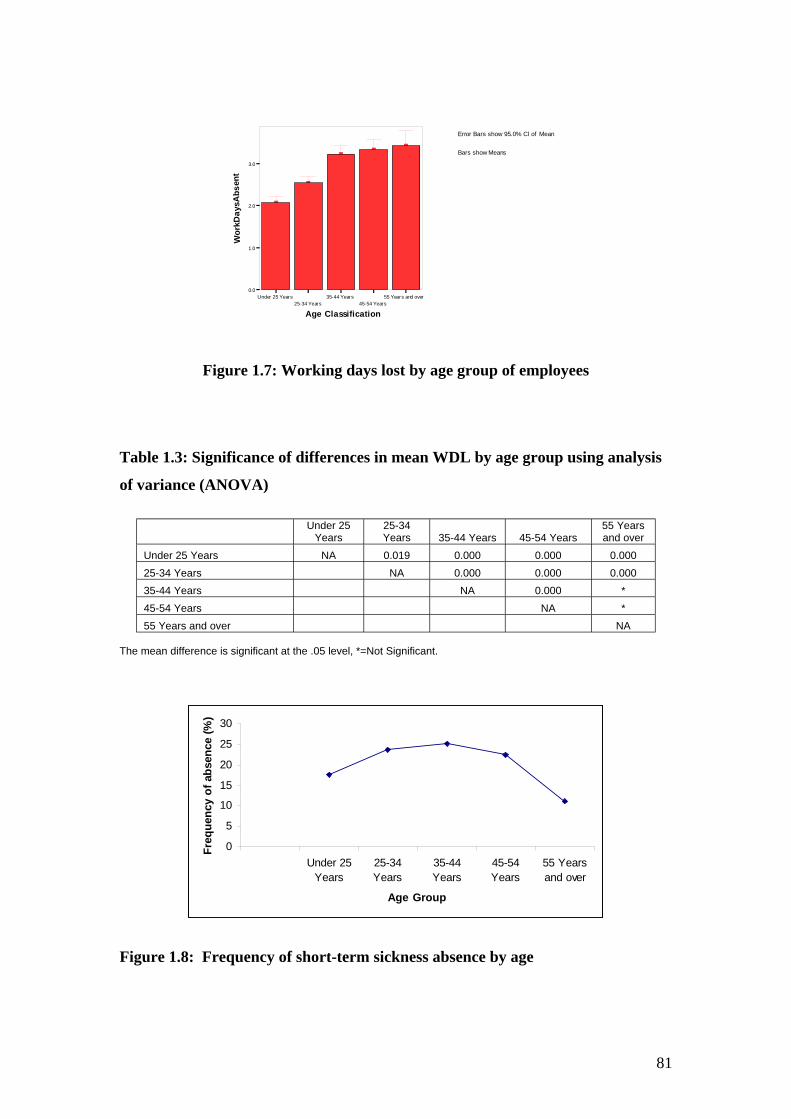
Error Bars show 95. 0% Cl of Mean
Bars show Means
Wor
kD a y
sA bs
ent
]
]
] ]
]
0.0
1.0
2.0
3.0
Under 25 Year s 35-44 Year s 55 Year s and over 25-34 Years 45-54 Years
Age Classification
Figure 1.7: Working days lost by age group of employees
Table 1.3: Significance of differences in mean WDL by age group using analysis
of variance (ANOVA)
Under 25 Years
25-34 Years 35-44 Years 45-54 Years
55 Years and over
Under 25 Years NA 0.019 0.000 0.000 0.000 25-34 Years NA 0.000 0.000 0.000 35-44 Years NA 0.000 * 45-54 Years NA * 55 Years and over NA
The mean difference is significant at the .05 level, *=Not Significant.
Freq
uenc
y of
abs
ence
(%) 30
25
20
15
10
5
0 Under 25 25-34 35-44 45-54 55 Years
Years Years Years Years and over
Age Group
Figure 1.8: Frequency of short-term sickness absence by age
81
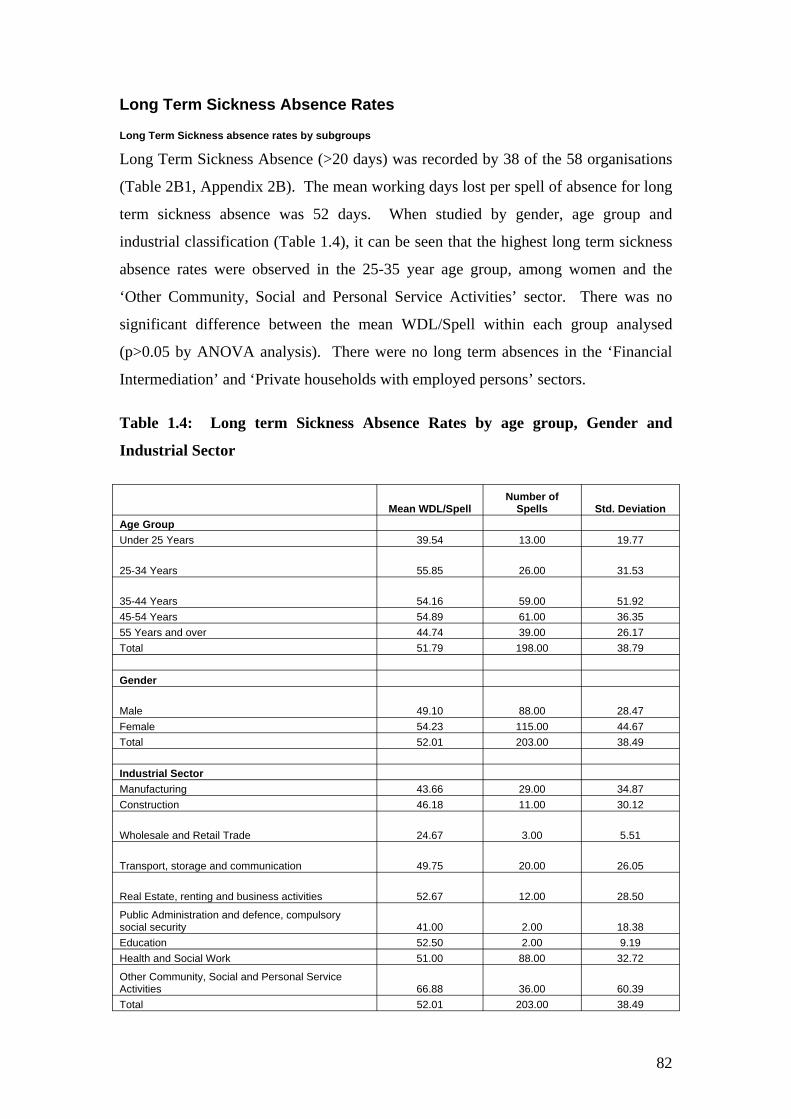
Long Term Sickness Absence Rates
Long Term Sickness absence rates by subgroups
Long Term Sickness Absence (>20 days) was recorded by 38 of the 58 organisations
(Table 2B1, Appendix 2B). The mean working days lost per spell of absence for long
term sickness absence was 52 days. When studied by gender, age group and
industrial classification (Table 1.4), it can be seen that the highest long term sickness
absence rates were observed in the 25-35 year age group, among women and the
‘Other Community, Social and Personal Service Activities’ sector. There was no
significant difference between the mean WDL/Spell within each group analysed
(p>0.05 by ANOVA analysis). There were no long term absences in the ‘Financial
Intermediation’ and ‘Private households with employed persons’ sectors.
Table 1.4: Long term Sickness Absence Rates by age group, Gender and
Industrial Sector
Mean WDL/Spell Number of
Spells Std. Deviation Age Group Under 25 Years 39.54 13.00 19.77
25-34 Years 55.85 26.00 31.53
35-44 Years 54.16 59.00 51.92 45-54 Years 54.89 61.00 36.35 55 Years and over 44.74 39.00 26.17 Total 51.79 198.00 38.79
Gender
Male 49.10 88.00 28.47 Female 54.23 115.00 44.67 Total 52.01 203.00 38.49
Industrial Sector Manufacturing 43.66 29.00 34.87 Construction 46.18 11.00 30.12
Wholesale and Retail Trade 24.67 3.00 5.51
Transport, storage and communication 49.75 20.00 26.05
Real Estate, renting and business activities 52.67 12.00 28.50
Public Administration and defence, compulsory social security 41.00 2.00 18.38 Education 52.50 2.00 9.19 Health and Social Work 51.00 88.00 32.72
Other Community, Social and Personal Service Activities 66.88 36.00 60.39 Total 52.01 203.00 38.49
82
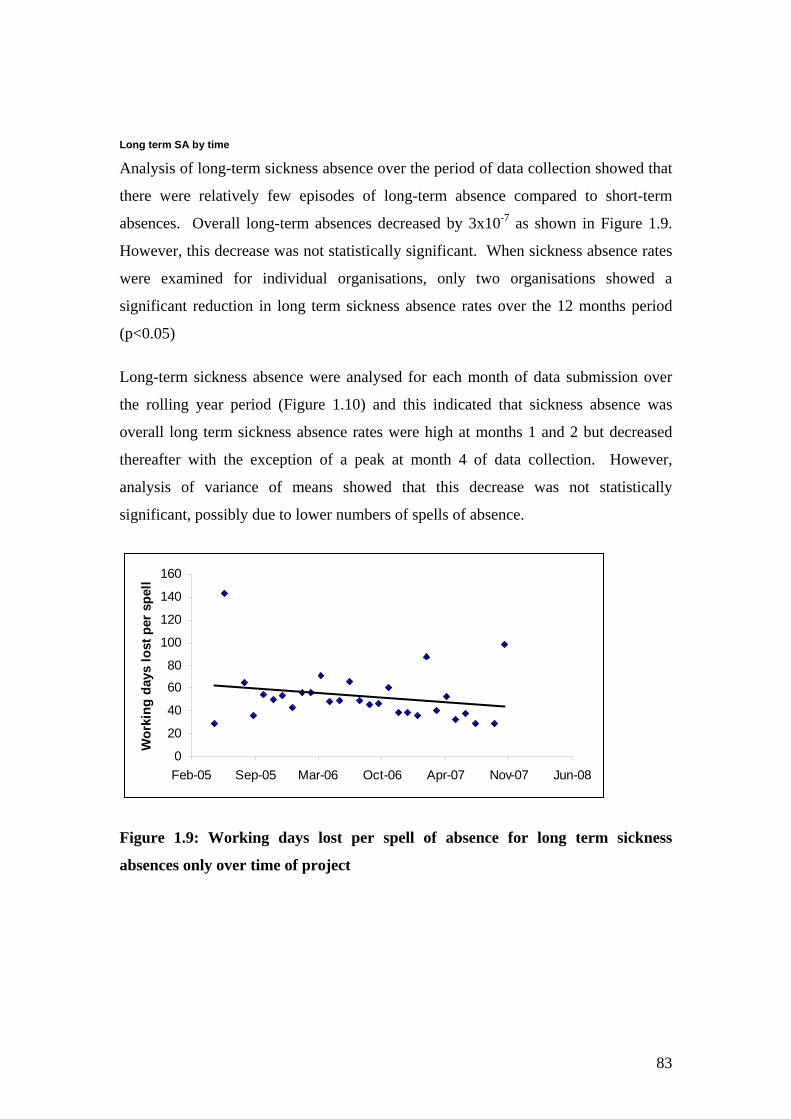
Long term SA by time
Analysis of long-term sickness absence over the period of data collection showed that
there were relatively few episodes of long-term absence compared to short-term
absences. Overall long-term absences decreased by 3x10⁻⁷ as shown in Figure 1.9.
However, this decrease was not statistically significant. When sickness absence rates
were examined for individual organisations, only two organisations showed a
significant reduction in long term sickness absence rates over the 12 months period
(p<0.05)
Long-term sickness absence were analysed for each month of data submission over
the rolling year period (Figure 1.10) and this indicated that sickness absence was
overall long term sickness absence rates were high at months 1 and 2 but decreased
thereafter with the exception of a peak at month 4 of data collection. However,
analysis of variance of means showed that this decrease was not statistically
significant, possibly due to lower numbers of spells of absence.
0
20
40
60
80
100
120
140
160
Feb-05 Sep-05 Mar-06 Oct-06 Apr-07 Nov-07 Jun-08
Wor
king
day
s lo
st p
er s
pell
Figure 1.9: Working days lost per spell of absence for long term sickness
absences only over time of project
83

75.0
50.0
25.0
0.0
] ]
]
]
]
] ]
]
] ]
] ]
1 2 3 4 5 6 7 8 9 10 11 12
MonNumber
Figure 1.10: Working days lost per spell of absence for long term sickness
absences by month number of data submission 1=Month 1, 2= Month 2 etc.
tnesbAsya
Dkr oW
Error Bars show Mean +/- 1.0 SE
Bars show Means
84
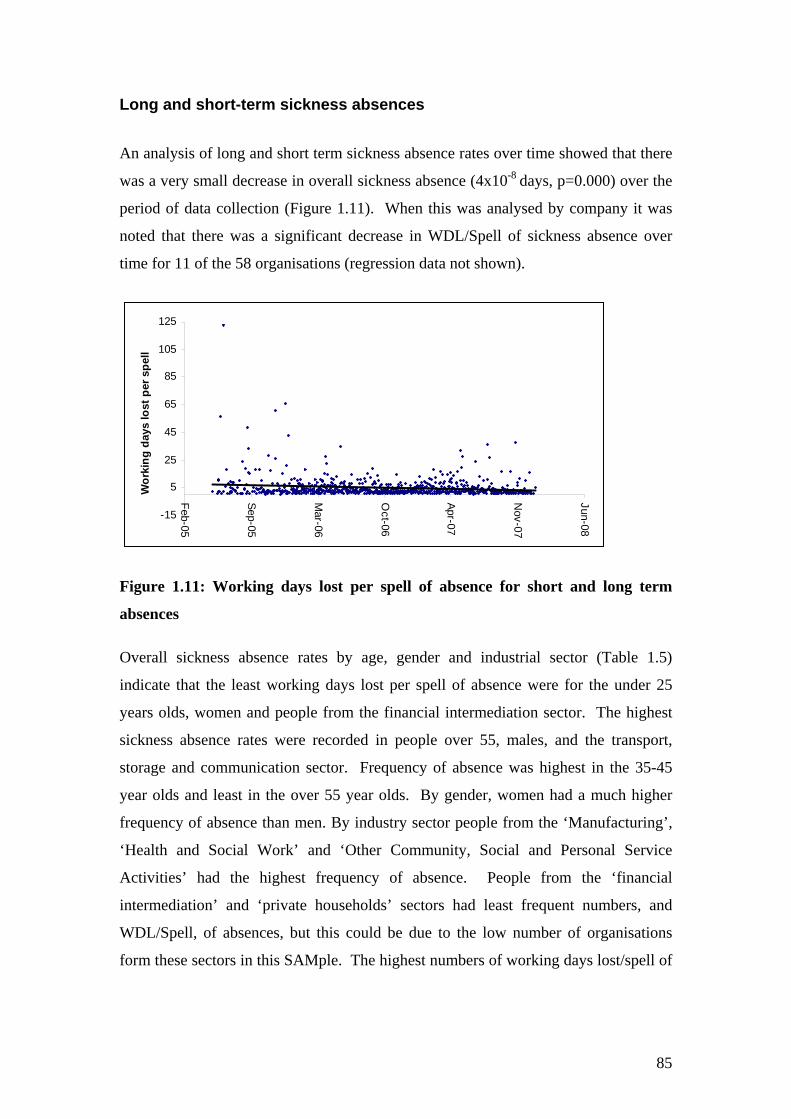
Long and short-term sickness absences
An analysis of long and short term sickness absence rates over time showed that there
was a very small decrease in overall sickness absence (4x10⁻⁸ days, p=0.000) over the
period of data collection (Figure 1.11). When this was analysed by company it was
noted that there was a significant decrease in WDL/Spell of sickness absence over
time for 11 of the 58 organisations (regression data not shown).
5
25
45
65
85
105
125
-15
Feb-05
Sep-05
Mar-06
Oct-06
Apr-07
Nov-07
Jun-08
Wor
king
day
s lo
st p
er s
pell
Figure 1.11: Working days lost per spell of absence for short and long term
absences
Overall sickness absence rates by age, gender and industrial sector (Table 1.5)
indicate that the least working days lost per spell of absence were for the under 25
years olds, women and people from the financial intermediation sector. The highest
sickness absence rates were recorded in people over 55, males, and the transport,
storage and communication sector. Frequency of absence was highest in the 35-45
year olds and least in the over 55 year olds. By gender, women had a much higher
frequency of absence than men. By industry sector people from the ‘Manufacturing’,
‘Health and Social Work’ and ‘Other Community, Social and Personal Service
Activities’ had the highest frequency of absence. People from the ‘financial
intermediation’ and ‘private households’ sectors had least frequent numbers, and
WDL/Spell, of absences, but this could be due to the low number of organisations
form these sectors in this SAMple. The highest numbers of working days lost/spell of
85
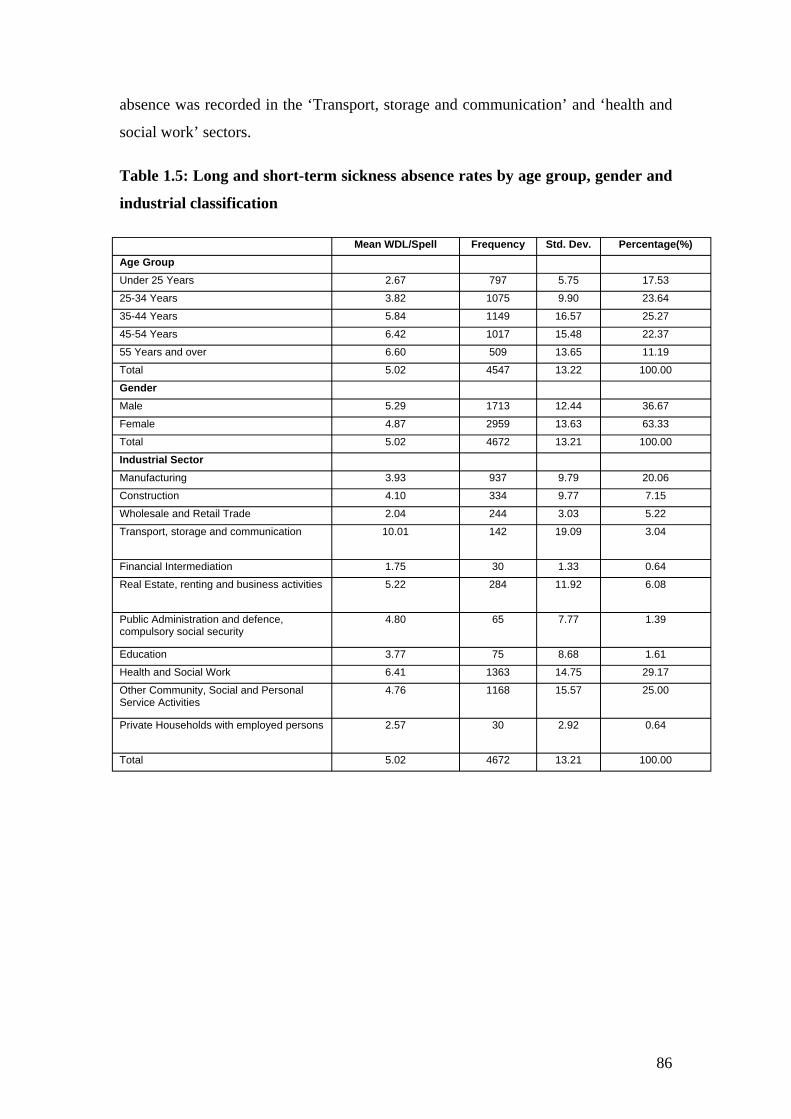
absence was recorded in the ‘Transport, storage and communication’ and ‘health and
social work’ sectors.
Table 1.5: Long and short-term sickness absence rates by age group, gender and
industrial classification
Mean WDL/Spell Frequency Std. Dev. Percentage(%) Age Group Under 25 Years 2.67 797 5.75 17.53
25-34 Years 3.82 1075 9.90 23.64
35-44 Years 5.84 1149 16.57 25.27
45-54 Years 6.42 1017 15.48 22.37
55 Years and over 6.60 509 13.65 11.19
Total 5.02 4547 13.22 100.00
Gender Male 5.29 1713 12.44 36.67
Female 4.87 2959 13.63 63.33
Total 5.02 4672 13.21 100.00
Industrial Sector Manufacturing 3.93 937 9.79 20.06
Construction 4.10 334 9.77 7.15
Wholesale and Retail Trade 2.04 244 3.03 5.22
Transport, storage and communication 10.01 142 19.09 3.04
Financial Intermediation 1.75 30 1.33 0.64
Real Estate, renting and business activities 5.22 284 11.92 6.08
Public Administration and defence, compulsory social security
4.80 65 7.77 1.39
Education 3.77 75 8.68 1.61
Health and Social Work 6.41 1363 14.75 29.17
Other Community, Social and Personal Service Activities
4.76 1168 15.57 25.00
Private Households with employed persons 2.57 30 2.92 0.64
Total 5.02 4672 13.21 100.00
86
Causes of Sickness Absence The full description and codes of the sickness absence cause level 1 are described in
Appendix 2C (Table C1). Less than 20% of the organisations provided information
on sickness absence cause level 2, therefore this data was not analysed in detail.
Sickness Absence cause 1 was analysed for short term and long term absences and the
results are summarised in Table 1.6. When all absences were counted together it can
be seen that the highest sickness absence rates (mean days lost per spell of absence)
were for cardiovascular, anxiety/depression, cancer, nervous disorders and injury
problems. However, the highest frequency of absences occurred for gastrointestinal
and influenza problems. When the absences were compared by short and long term
absences, the highest mean days lost per spell of absences were recorded for
anxiety/depression, infectious diseases, injury, endocrine, substance abuse reasons for
short term absences while for long term absences the reasons leading to high numbers
of WDL were cardiovascular, cancer and nervous disorders.
87
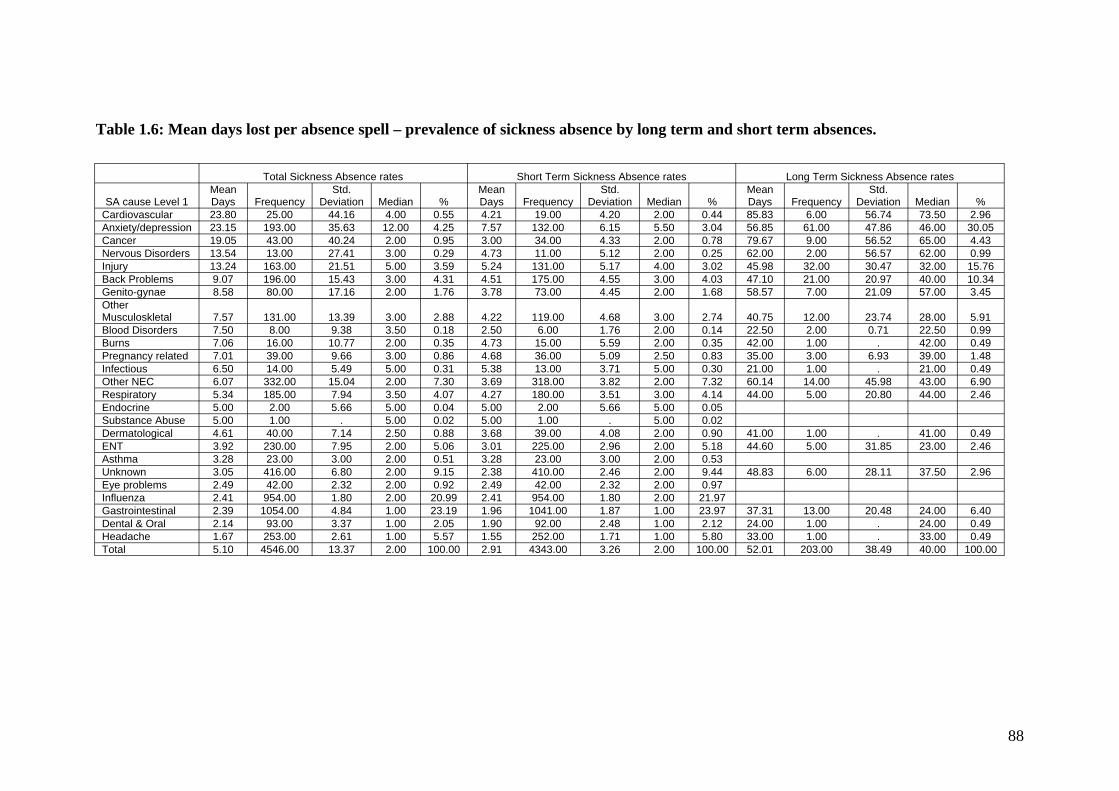
Table 1.6: Mean days lost per absence spell – prevalence of sickness absence by long term and short term absences.
Total Sickness Absence rates Short Term Sickness Absence rates Long Term Sickness Absence rates Mean Std. Mean Std. Mean Std.
SA cause Level 1 Days Frequency Deviation Median % Days Frequency Deviation Median % Days Frequency Deviation Median % Cardiovascular 23.80 25.00 44.16 4.00 0.55 4.21 19.00 4.20 2.00 0.44 85.83 6.00 56.74 73.50 2.96 Anxiety/depression 23.15 193.00 35.63 12.00 4.25 7.57 132.00 6.15 5.50 3.04 56.85 61.00 47.86 46.00 30.05 Cancer 19.05 43.00 40.24 2.00 0.95 3.00 34.00 4.33 2.00 0.78 79.67 9.00 56.52 65.00 4.43 Nervous Disorders 13.54 13.00 27.41 3.00 0.29 4.73 11.00 5.12 2.00 0.25 62.00 2.00 56.57 62.00 0.99 Injury 13.24 163.00 21.51 5.00 3.59 5.24 131.00 5.17 4.00 3.02 45.98 32.00 30.47 32.00 15.76 Back Problems 9.07 196.00 15.43 3.00 4.31 4.51 175.00 4.55 3.00 4.03 47.10 21.00 20.97 40.00 10.34 Genito-gynae 8.58 80.00 17.16 2.00 1.76 3.78 73.00 4.45 2.00 1.68 58.57 7.00 21.09 57.00 3.45 Other Musculoskletal 7.57 131.00 13.39 3.00 2.88 4.22 119.00 4.68 3.00 2.74 40.75 12.00 23.74 28.00 5.91 Blood Disorders 7.50 8.00 9.38 3.50 0.18 2.50 6.00 1.76 2.00 0.14 22.50 2.00 0.71 22.50 0.99 Burns 7.06 16.00 10.77 2.00 0.35 4.73 15.00 5.59 2.00 0.35 42.00 1.00 . 42.00 0.49 Pregnancy related 7.01 39.00 9.66 3.00 0.86 4.68 36.00 5.09 2.50 0.83 35.00 3.00 6.93 39.00 1.48 Infectious 6.50 14.00 5.49 5.00 0.31 5.38 13.00 3.71 5.00 0.30 21.00 1.00 . 21.00 0.49 Other NEC 6.07 332.00 15.04 2.00 7.30 3.69 318.00 3.82 2.00 7.32 60.14 14.00 45.98 43.00 6.90 Respiratory 5.34 185.00 7.94 3.50 4.07 4.27 180.00 3.51 3.00 4.14 44.00 5.00 20.80 44.00 2.46 Endocrine 5.00 2.00 5.66 5.00 0.04 5.00 2.00 5.66 5.00 0.05 Substance Abuse 5.00 1.00 . 5.00 0.02 5.00 1.00 . 5.00 0.02 Dermatological 4.61 40.00 7.14 2.50 0.88 3.68 39.00 4.08 2.00 0.90 41.00 1.00 . 41.00 0.49 ENT 3.92 230.00 7.95 2.00 5.06 3.01 225.00 2.96 2.00 5.18 44.60 5.00 31.85 23.00 2.46 Asthma 3.28 23.00 3.00 2.00 0.51 3.28 23.00 3.00 2.00 0.53 Unknown 3.05 416.00 6.80 2.00 9.15 2.38 410.00 2.46 2.00 9.44 48.83 6.00 28.11 37.50 2.96 Eye problems 2.49 42.00 2.32 2.00 0.92 2.49 42.00 2.32 2.00 0.97 Influenza 2.41 954.00 1.80 2.00 20.99 2.41 954.00 1.80 2.00 21.97 Gastrointestinal 2.39 1054.00 4.84 1.00 23.19 1.96 1041.00 1.87 1.00 23.97 37.31 13.00 20.48 24.00 6.40 Dental & Oral 2.14 93.00 3.37 1.00 2.05 1.90 92.00 2.48 1.00 2.12 24.00 1.00 . 24.00 0.49 Headache 1.67 253.00 2.61 1.00 5.57 1.55 252.00 1.71 1.00 5.80 33.00 1.00 . 33.00 0.49 Total 5.10 4546.00 13.37 2.00 100.00 2.91 4343.00 3.26 2.00 100.00 52.01 203.00 38.49 40.00 100.00
88
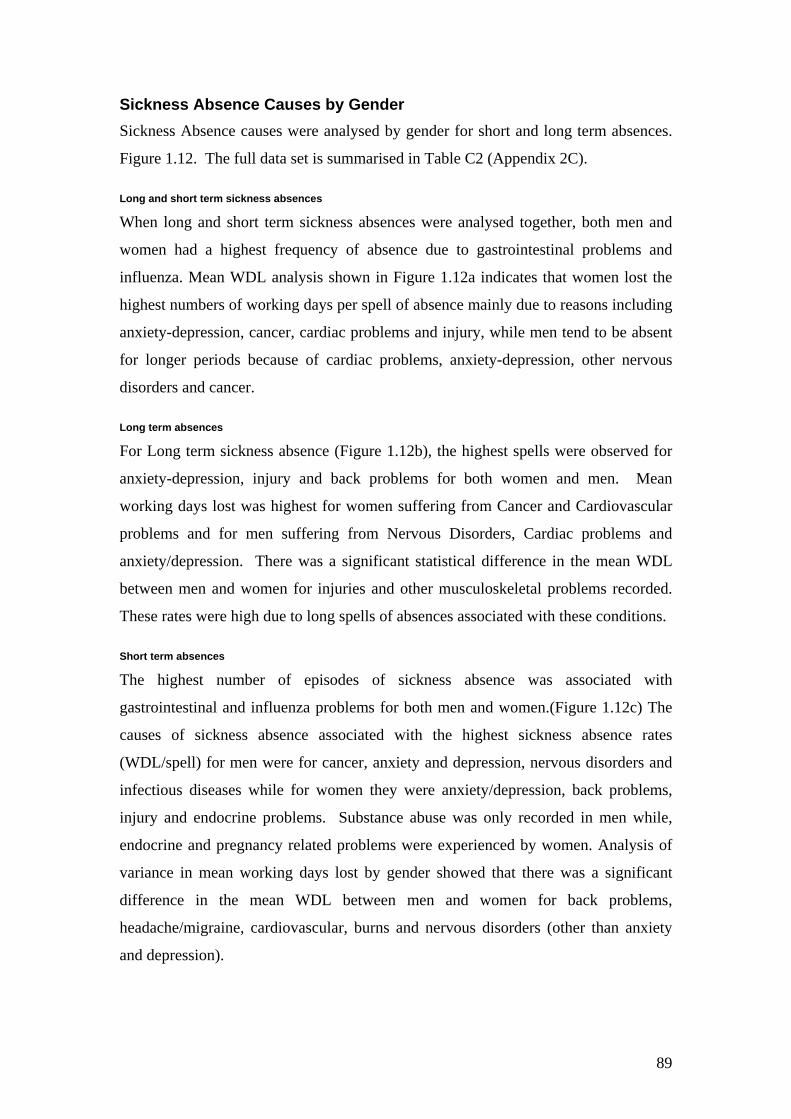
Sickness Absence Causes by Gender Sickness Absence causes were analysed by gender for short and long term absences.
Figure 1.12. The full data set is summarised in Table C2 (Appendix 2C).
Long and short term sickness absences
When long and short term sickness absences were analysed together, both men and
women had a highest frequency of absence due to gastrointestinal problems and
influenza. Mean WDL analysis shown in Figure 1.12a indicates that women lost the
highest numbers of working days per spell of absence mainly due to reasons including
anxiety-depression, cancer, cardiac problems and injury, while men tend to be absent
for longer periods because of cardiac problems, anxiety-depression, other nervous
disorders and cancer.
Long term absences
For Long term sickness absence (Figure 1.12b), the highest spells were observed for
anxiety-depression, injury and back problems for both women and men. Mean
working days lost was highest for women suffering from Cancer and Cardiovascular
problems and for men suffering from Nervous Disorders, Cardiac problems and
anxiety/depression. There was a significant statistical difference in the mean WDL
between men and women for injuries and other musculoskeletal problems recorded.
These rates were high due to long spells of absences associated with these conditions.
Short term absences
The highest number of episodes of sickness absence was associated with
gastrointestinal and influenza problems for both men and women.(Figure 1.12c) The
causes of sickness absence associated with the highest sickness absence rates
(WDL/spell) for men were for cancer, anxiety and depression, nervous disorders and
infectious diseases while for women they were anxiety/depression, back problems,
injury and endocrine problems. Substance abuse was only recorded in men while,
endocrine and pregnancy related problems were experienced by women. Analysis of
variance in mean working days lost by gender showed that there was a significant
difference in the mean WDL between men and women for back problems,
headache/migraine, cardiovascular, burns and nervous disorders (other than anxiety
and depression).
89
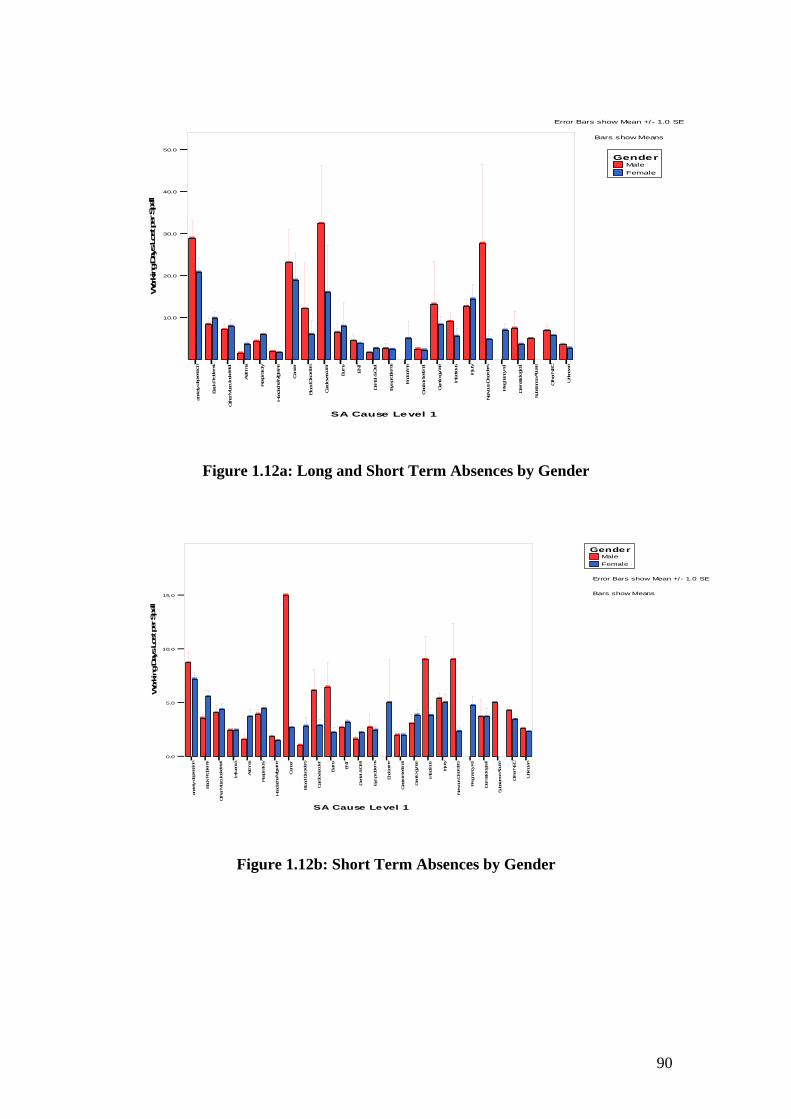
Male Female
Gender
Error Bars show Mean +/ - 1.0 SE
Bars show Means
on
ems
etal
Asthma
ratory ne
Can
cer
sorders ar
Burns
ENT
&Oral
ems ne nal
to-gyn
ae
ous
ury
sorders
Preg
nanc
yrel
cal
Sub
stan
ceAbu
se
Other
NEC
Unk
nown
50.0
]
]
]
]
]
]
]
] ]
]
]]
]
]
]
]
]
]
]
]
]
]
]
] ]]
]
]]
]
] ]
]
]
]
]
]
] ]
]
]
] ]
]
]
40.0
30.0
20.0
10.0
l lepSreptsoLsya
Dgnikro
W
ucsavoli ar g
ir codnE
i i go
i nIj
eksol t setn
sserped-yt e
t cefnIi
borP
kcaB
l l borpeyE
M/ehcadaeH
ipseR
l ot amre
D
i
at neD
l
Ddoo
Dsuovr e
Nii
ort saG
i
ucsuMreh
Ot
l ineG
i dr aCBl
xnai
SA Cause Level 1
Figure 1.12a: Long and Short Term Absences by Gender
Male Female
Gender
Error Bars show Mean +/- 1.0 SE
Bars show Means
on
ems
uenz
a
Asthm
a
ratory ne
sorders
Burns
ENT
ems
ne
to-gyn
ae
ous
ury
sorders
Subs
tanc
eAb
use
Other
NEC
Unk
nown
]
]
]
]
]
]
]]
]
] ]
]
]
]
]
]
]
]
]
]
]
] ]
]
]
]
]
]
]
]]
]
]
]
]
]
]
]
]
]
]]
]
]
]
]
]
15.0
10.0
5.0
0.0
ll epSreptsoLsya
Dgni kro
W
r ecnaC
raatel lar
O&
l an
l ery cnange rP
acl
l uc savo
s ser ped- ytei ar gi rc odnEi
goii n Ijl ek so
ts etn
tic ef n I
l bor pey E
lborP
k caB
pseR
i
M/ehc adaeH
lot amre
D
fl i
n l atneD
Ddoo
Dsuovr e
N
i i
or tsaG
iI i neG
uc suMreh
Ot
l i dr aCBli xna
SA Cause Level 1
Figure 1.12b: Short Term Absences by Gender
90
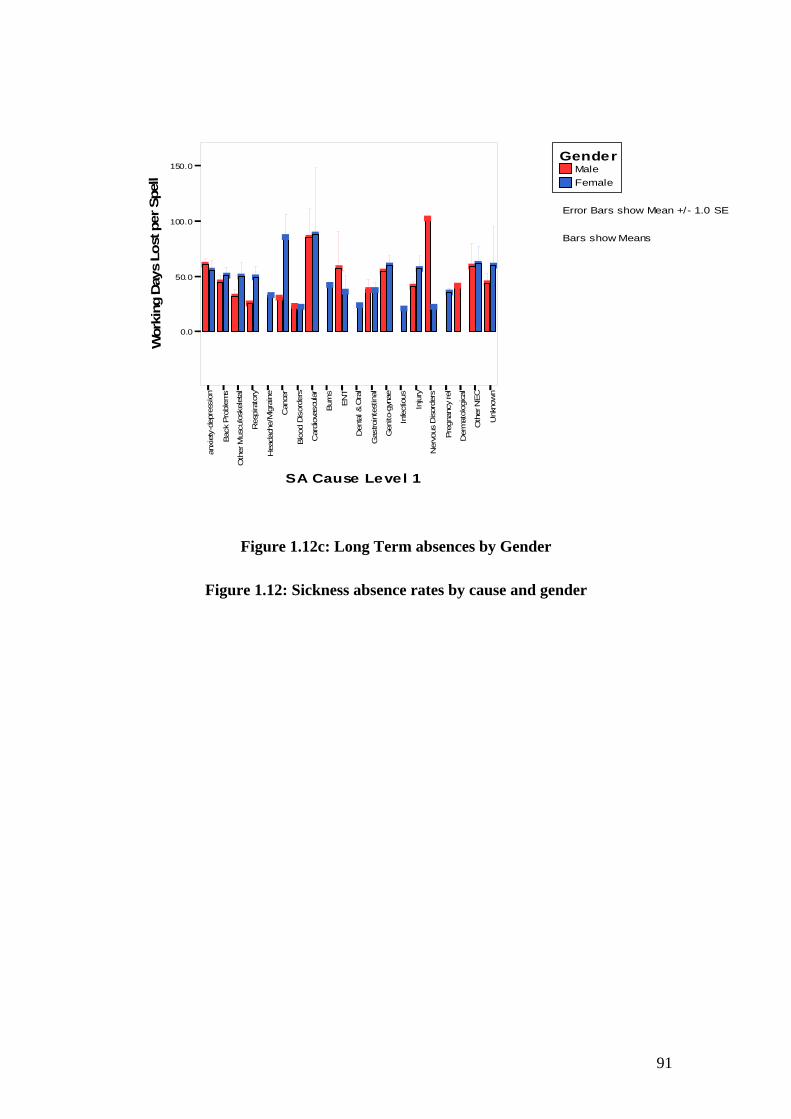
Male Female
Gender 150.0
]
100.0
]
]
]
]
]
epSr ep
/Error Bars show Mean + - 1.0 SE
]
]
]
]
] ]
] ]
] ]]
]]]
]
]]
t Bars show Means soLsya
Dgn
]
]
]
]
]
]
]
]50.0 ] ]
]
i kr oW
0.0
CEN
snru B
TNE
s yyno en eanyg
nwonkn
U
r ecnaC
r suo
ssme
al al anl l le acar r r rt o ed ur redros
ucsavole O
& i ai isse
i j n ycnange
t goeksol ar t se
tir rl bo ceg os
I r
pseR
i l eh
- oiMr t olaped
n fr i Ddoo
in tPkca B
Dsuov
t am
i/ t tOucsu
Ml i ne
G
oehcadaeH
neD
I
di rt- r rsaG
ry aC
eDPt e Bli rxna
eNr eht
O
SA Cause Level 1
Figure 1.12c: Long Term absences by Gender
Figure 1.12: Sickness absence rates by cause and gender
91
ll
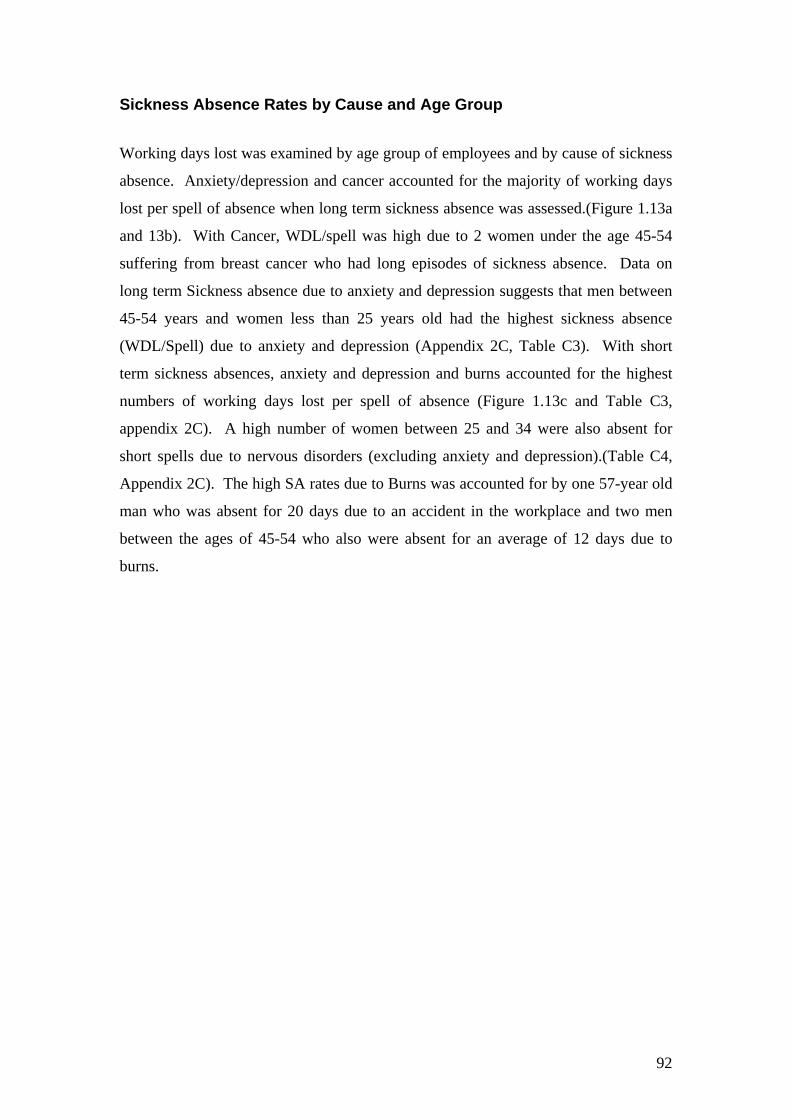
Sickness Absence Rates by Cause and Age Group
Working days lost was examined by age group of employees and by cause of sickness
absence. Anxiety/depression and cancer accounted for the majority of working days
lost per spell of absence when long term sickness absence was assessed.(Figure 1.13a
and 13b). With Cancer, WDL/spell was high due to 2 women under the age 45-54
suffering from breast cancer who had long episodes of sickness absence. Data on
long term Sickness absence due to anxiety and depression suggests that men between
45-54 years and women less than 25 years old had the highest sickness absence
(WDL/Spell) due to anxiety and depression (Appendix 2C, Table C3). With short
term sickness absences, anxiety and depression and burns accounted for the highest
numbers of working days lost per spell of absence (Figure 1.13c and Table C3,
appendix 2C). A high number of women between 25 and 34 were also absent for
short spells due to nervous disorders (excluding anxiety and depression).(Table C4,
Appendix 2C). The high SA rates due to Burns was accounted for by one 57-year old
man who was absent for 20 days due to an accident in the workplace and two men
between the ages of 45-54 who also were absent for an average of 12 days due to
burns.
92
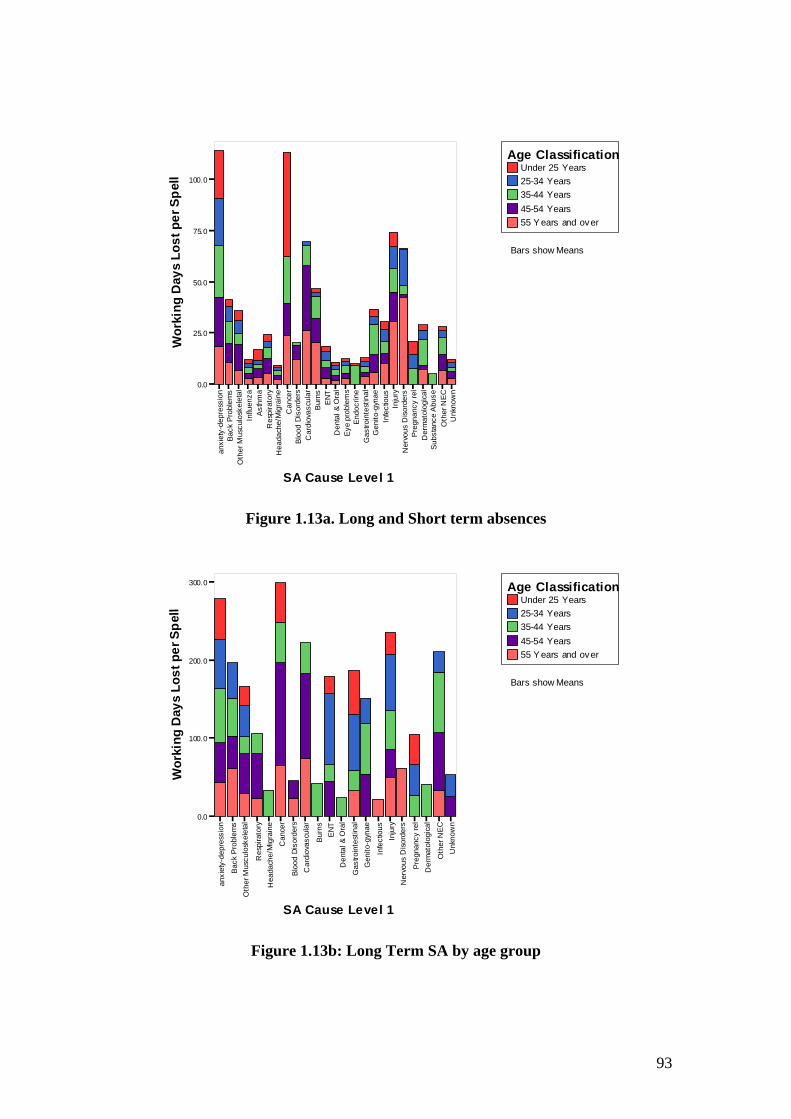
i
l I l i i
li
i
l i i I I
i
lessi
on
lem
s os
kele
tal
uenz
a hm
a at
ory
rain
e C
ance
r rd
ers
ovas
cula
r B
urns
EN
T &
Ora
l le
ms
Endo
crin
e es
tinal
gy
nae
tious
nj
ury
ders
eg
nanc
yre
l og
ical
an
ceA
buse
N
EC
Unk
now
n
Wor
king
Day
sLo
stpe
rSpe
ll Under 25 Years 25-34 Years 35-44 Years 45-54 Years 55 Y ears and ov er
Age Classification
Bars show Means
0.0
25.0
50.0
75.0
100.0
t rbobo ce
r g os sA os
r- ehpseR
or f M t o fpedr n r na tnD
doo
PkcaB
peyE
t D
suov
am
/ t toehcadaeH
neG
OucsuM
neD
d r t- r rsaG
ry taC
eDP sbuS
t e B rxna
eN
r ehtO
SA Cause Level 1
Figure 1.13a. Long and Short term absences
on
ems al
ry
ne
Can
cer rs ar
ns
ENT al
nal
gyna
e
ous ry s el
cal
NEC
U
nkno
wn
Wor
king
Day
sLo
stpe
rSpe
ll
Under 25 Years 25-34 Years 35-44 Years 45-54 Years 55 Y ears and ov er
Age Classification
Bars show Means
0.0
100.0
200.0
300.0
rt o ed
r u red
lei i ucsavo
r O&
ia i jsse
t ycnange
uB
go
l nta iekso
se
tr rl rbo ceIg os
r os ri l- ehpseR
i or M t ol fped
r ni ia tnDdoo
PkcaB
D
suov
t am
i/ t tl io IehcadaeH
neG
ucsuM
neD
Oi d rt- r rsaG
ry aC
eDPt e l Bi rxna
eNr eht
O
SA Cause Level 1
Figure 1.13b: Long Term SA by age group
93
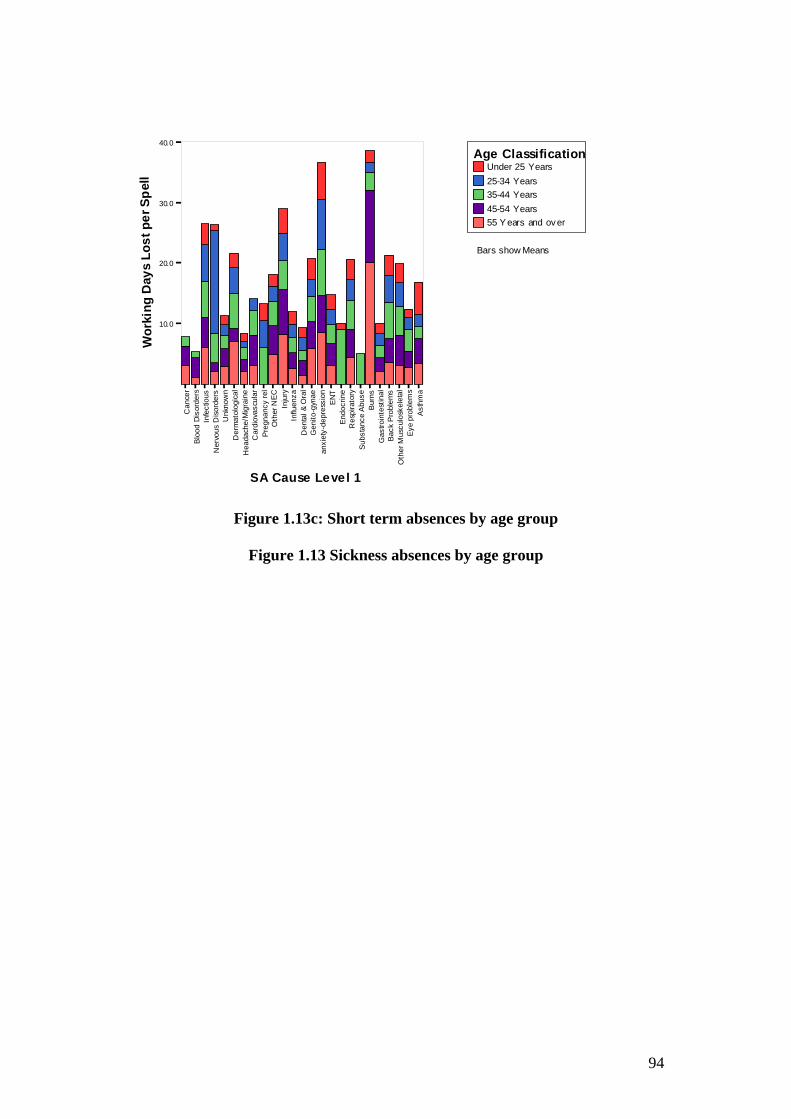
iI
ii
li
l i
ii
ll
I I
l l l
ii i
i
ii
l l
ll
l l
Wor
king
Day
sLo
stpe
rSpe
ll
Under 25 Years 25-34 Years 35-44 Years 45-54 Years 55 Y ears and ov er
Age Classification
Bars show Means
10.0
20.0
30.0
40.0
s y y sme
CEN
r nwonkn
U
enr azneu
eanygno en esub
Aecna
amh
suos TNE
sn sme
ac ae a anecnaC
ar r rr ted
r u r oed eucsavo
O&
ra rjycnange
sse
tgo uBn tacodnE
ekso
t se
rr tr boboce g ros sAos r eh
-o pseR
rM f tof n ped
n r ratnDdoo
PkcaB
peyE
D
suov
tam
/ t t oehcadaeH
neG
ucsuM
O neD
d rt-rr saG
r y teD
aC P sbuS
t el B ir xna
eN
r ehtO
SA Cause Le ve l 1
Figure 1.13c: Short term absences by age group
Figure 1.13 Sickness absences by age group
94
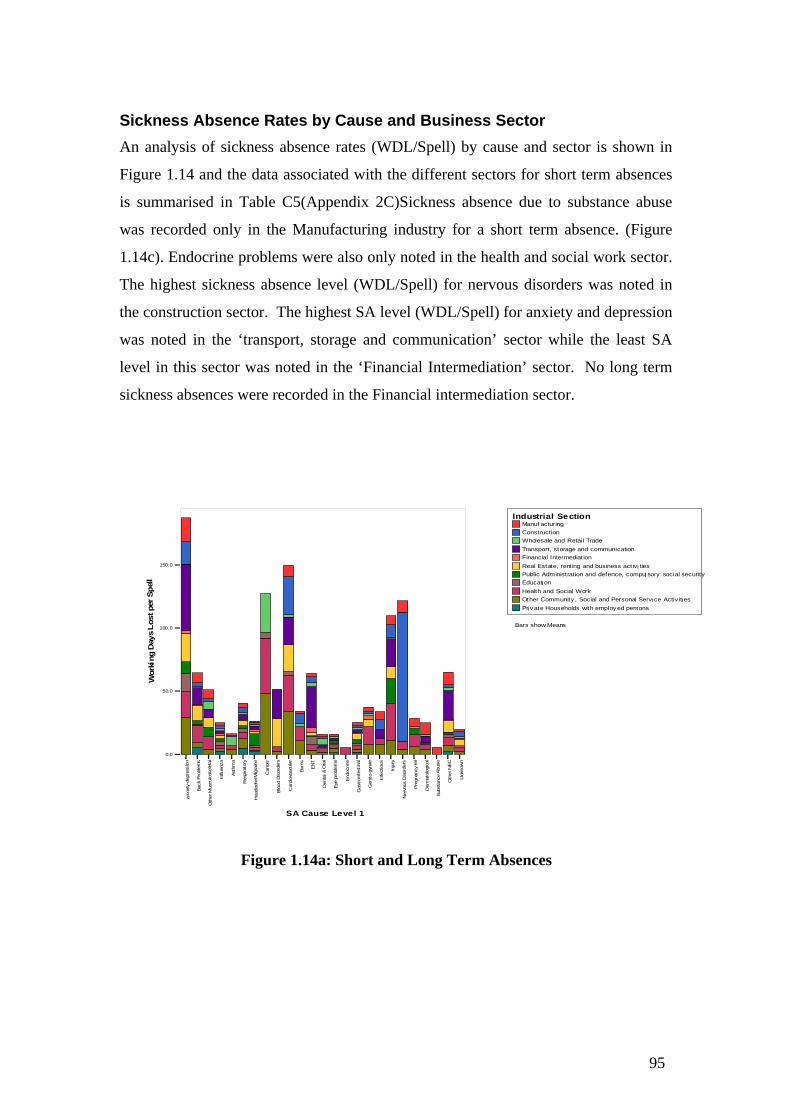
i L
ll
i
Sickness Absence Rates by Cause and Business Sector
i
l
An analysis of sickness absence rates (WDL/Spell) by cause and sector is shown in
i
Figure 1.14 and the data associated with the different sectors for short term absences
is summarised in Table C5(Appendix 2C)Sickness absence due to substance abuse
was recorded only in the Manufacturing industry for a short term absence. (Figure
i
1.14c). Endocrine problems were also only noted in the health and social work sector.
i
The highest sickness absence level (WDL/Spell) for nervous disorders was noted in
the construction sector. The highest SA level (WDL/Spell) for anxiety and depression
was noted in the ‘transport, storage and communication’ sector while the least SA
level in this sector was noted in the ‘Financial Intermediation’ sector. No long term
sickness absences were recorded in the Financial intermediation sector.
Industrial Se ction Manuf acturing Const ruction Wholesale and Retail Trade Transport, st orage and communication Financial Intermediation
150.0 Real Estat e, rent ing and business act iv ties Public Adm inist rat ion and def ence, compu sory social securit y Educat on Health and Social Work Ot her Communit y , Social and Personal Serv ce Activ it es Pr v at e Households with employ ed persons
Bars show Means 100.0
epSrepst o
syaD
ng
kroW
50.0
0.0
y s sme
y CEN
no a zn eu
amh
enen
r r e an yg
es u bAe cn a
nwo nk n
U
sme
l sn T NE
l l s uo
s l la a a n e ace cn aC
ar r r rt o e d ur re d
le O&
uc sa vo
i i r i
g oia rss e
i nj y cn an ge
t u B
l a tc o dn E
iek so
se
tr rl l rbo
t bo c e
Ig o s
rsA os
ri l- ehps eR
ol
Mir f t olpe d
n fr r naiD
do o
in tPk ca B
pey
E
Dsu ov
t am
iI t/ tl io Ou cs uM
n eD
Ie hc ad aeH
n eG
i d rt- r rsaG
ry aC
eD
tP s b uS
t e lBi rx n a
eNr eht
O
SA Cause Le ve l 1
Figure 1.14a: Short and Long Term Absences
95
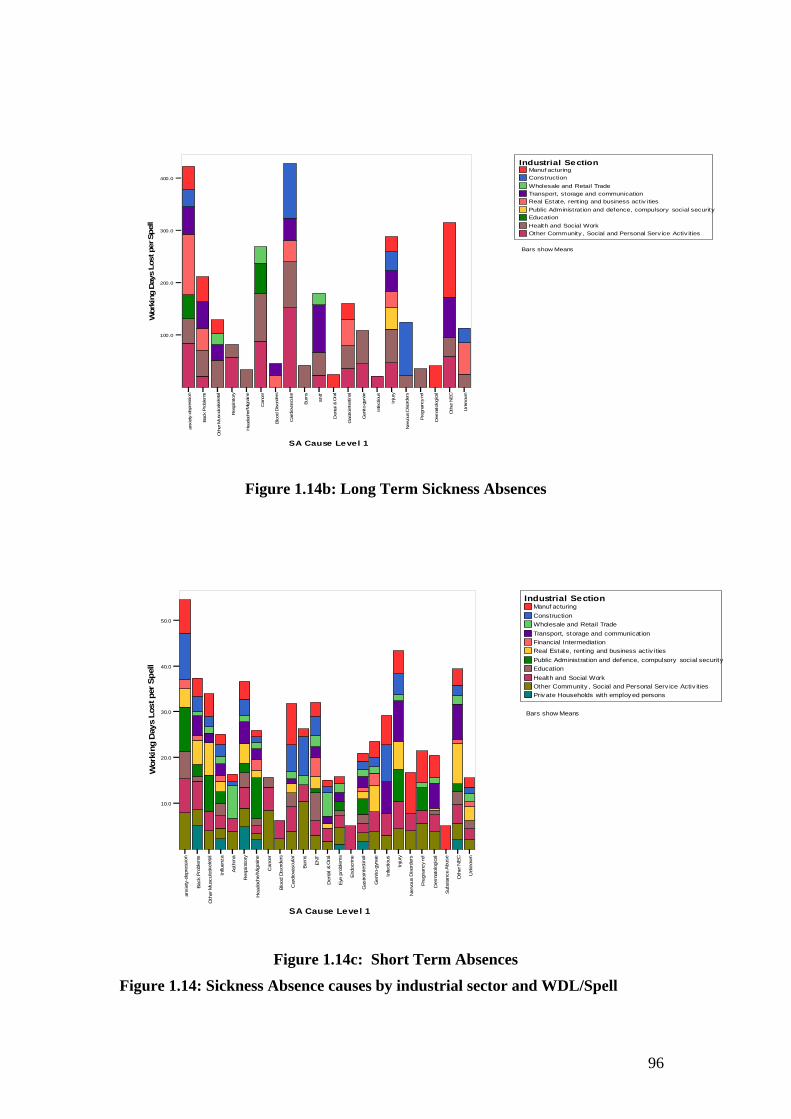
ory s y
herN
EC
Bars show Means
100.0
200.0
i
i
i
iv
l
i
Industrial Section Manuf actur ng
Const ruction
i
Wholesale and Reta l Trade
l
Transport, storage and communicat on i
Real Estat e, rent ng and bus ness activ ities i
iPublic Administ rat on and defence, compu al secur tysory soc
ii
Education
i
Health and Soc al Work Ot her Commun ty , Socia and Personal Serv ice Act ties
400.0
300.0
l l epSrept soLsya
Dgnikro
W
n o e n ea ny g- o
nwon kn
U
r ec naC
ra T NE
sme
al s nr uB
arO
&l a nl s uo
sr ed ro s
el la cr rt e dr os
u ruc sa volei ai is se rp ed -y
i jn y cn an ge
t goe ks ol a r set i trbol c eg I
pseR
i olMi tla n fr i
Ddo o
Ds uo v
in tPkc a B
t am
i o/ t tO
lu cs uMr eh
neG
ie hc ad aeH
neD
Ii dr aC
rt rsaG
r eDPet l
Bi rxn a
eN
tO
SA Cause Level 1
Figure 1.14b: Long Term Sickness Absences
i
it
i
i ivi
liti iv
i
i
Health and Soc Work i
i
l
ii
ii
lia
i
i
in
i
li
i
a
l
i
i
l
i
F
Industrial Section Manuf actur ng Construct on
Who esale and Retai Trade
Transport, storage and communicat on nanc I ntermed at on
Real Estate, rent ng and bus ness act es
Pub c Adm strat on and defence, compu sory soc al secur ty Educat on
Ot her Communit y , Soc al and Personal Serv ce Act es Pr v ate Households wth employ ed persons
Bars show Means
50.0
40.0
30.0
l l epSreptsoLsya
Dgni kro
W
20.0
10.0
CENr e h
y s sme
yn o az ne u
amh
e n e n e a ny g
e su bA
e cn a
nwo nk n
U
l r r lsme
sn TN
E
l s uo
s l la a a n e ace c naC
ar r r rt o ed ur red
le O&
uc sa vo
i ri i ia r iss e
t j y c na ng e
u B gonl a t se
c od n E
tie ks o
rl r l rb o
t sA
bo c eg o s
Ir o si l-p seR
ol
Mir f t olpe d
n n fr raiD
do o
in tPkc aB
pe y
E
Dsu ov
t am
iI / t tO
l iouc suM
eh ca d aeH
n eD
neG
Iid r t- r rs aG
ry aC
eD
t
P sb uS
t e lBi rx n a
eN
r eh tO
SA Cause Le vel 1
Figure 1.14c: Short Term Absences
Figure 1.14: Sickness Absence causes by industrial sector and WDL/Spell
96

APPENDIX 2: Further Statistical Analysis
97

98
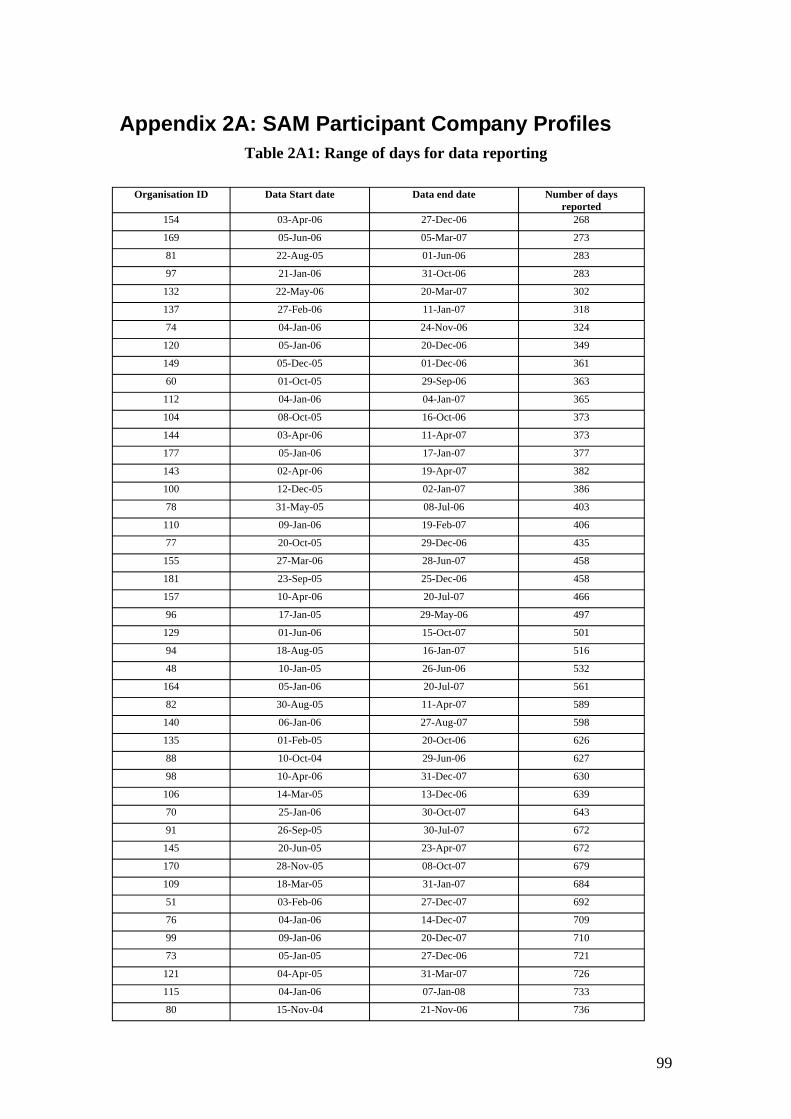
Appendix 2A: SAM Participant Company Profiles Table 2A1: Range of days for data reporting
Organisation ID Data Start date Data end date Number of days reported
154 03-Apr-06 27-Dec-06 268
169 05-Jun-06 05-Mar-07 273
81 22-Aug-05 01-Jun-06 283
97 21-Jan-06 31-Oct-06 283
132 22-May-06 20-Mar-07 302
137 27-Feb-06 11-Jan-07 318
74 04-Jan-06 24-Nov-06 324
120 05-Jan-06 20-Dec-06 349
149 05-Dec-05 01-Dec-06 361
60 01-Oct-05 29-Sep-06 363
112 04-Jan-06 04-Jan-07 365
104 08-Oct-05 16-Oct-06 373
144 03-Apr-06 11-Apr-07 373
177 05-Jan-06 17-Jan-07 377
143 02-Apr-06 19-Apr-07 382
100 12-Dec-05 02-Jan-07 386
78 31-May-05 08-Jul-06 403
110 09-Jan-06 19-Feb-07 406
77 20-Oct-05 29-Dec-06 435
155 27-Mar-06 28-Jun-07 458
181 23-Sep-05 25-Dec-06 458
157 10-Apr-06 20-Jul-07 466
96 17-Jan-05 29-May-06 497
129 01-Jun-06 15-Oct-07 501
94 18-Aug-05 16-Jan-07 516
48 10-Jan-05 26-Jun-06 532
164 05-Jan-06 20-Jul-07 561
82 30-Aug-05 11-Apr-07 589
140 06-Jan-06 27-Aug-07 598
135 01-Feb-05 20-Oct-06 626
88 10-Oct-04 29-Jun-06 627
98 10-Apr-06 31-Dec-07 630
106 14-Mar-05 13-Dec-06 639
70 25-Jan-06 30-Oct-07 643
91 26-Sep-05 30-Jul-07 672
145 20-Jun-05 23-Apr-07 672
170 28-Nov-05 08-Oct-07 679
109 18-Mar-05 31-Jan-07 684
51 03-Feb-06 27-Dec-07 692
76 04-Jan-06 14-Dec-07 709
99 09-Jan-06 20-Dec-07 710
73 05-Jan-05 27-Dec-06 721
121 04-Apr-05 31-Mar-07 726
115 04-Jan-06 07-Jan-08 733
80 15-Nov-04 21-Nov-06 736
99
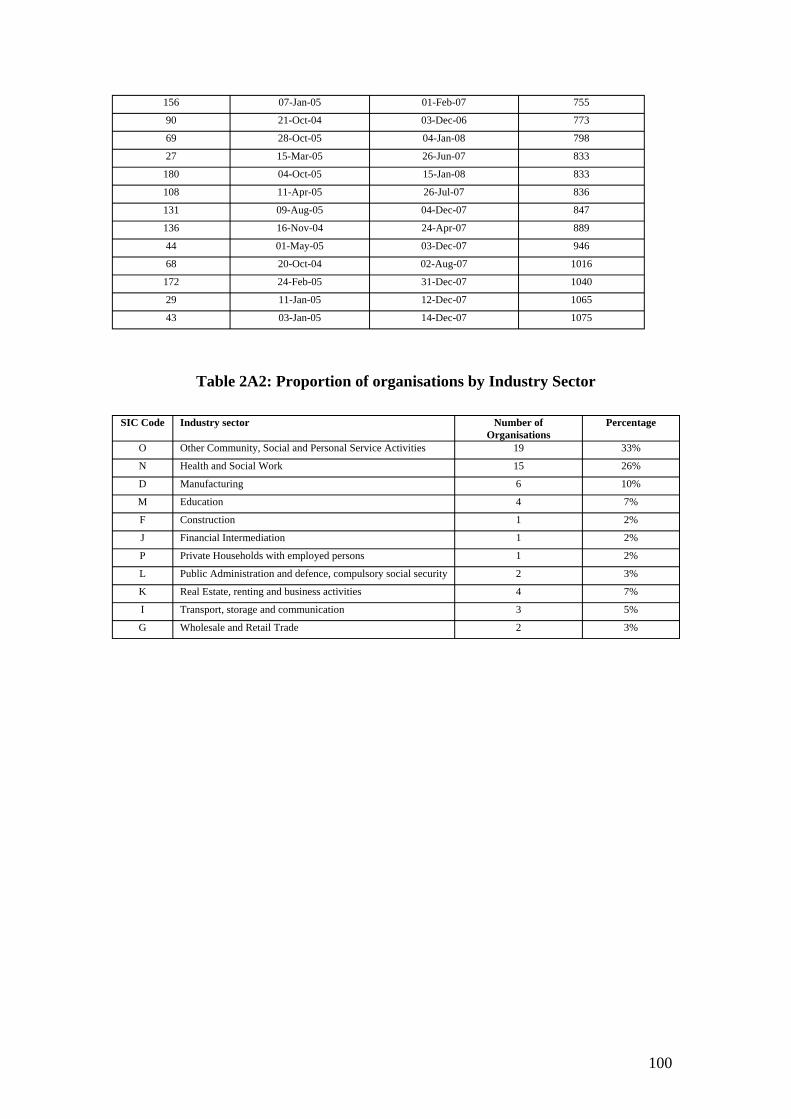
156 07-Jan-05 01-Feb-07 755
90 21-Oct-04 03-Dec-06 773
69 28-Oct-05 04-Jan-08 798
27 15-Mar-05 26-Jun-07 833
180 04-Oct-05 15-Jan-08 833
108 11-Apr-05 26-Jul-07 836
131 09-Aug-05 04-Dec-07 847
136 16-Nov-04 24-Apr-07 889
44 01-May-05 03-Dec-07 946
68 20-Oct-04 02-Aug-07 1016
172 24-Feb-05 31-Dec-07 1040
29 11-Jan-05 12-Dec-07 1065
43 03-Jan-05 14-Dec-07 1075
Table 2A2: Proportion of organisations by Industry Sector
SIC Code Industry sector Number of Organisations
Percentage
O Other Community, Social and Personal Service Activities 19 33%
N Health and Social Work 15 26%
D Manufacturing 6 10%
M Education 4 7%
F Construction 1 2%
J Financial Intermediation 1 2%
P Private Households with employed persons 1 2%
L Public Administration and defence, compulsory social security 2 3%
K Real Estate, renting and business activities 4 7%
I Transport, storage and communication 3 5%
G Wholesale and Retail Trade 2 3%
100
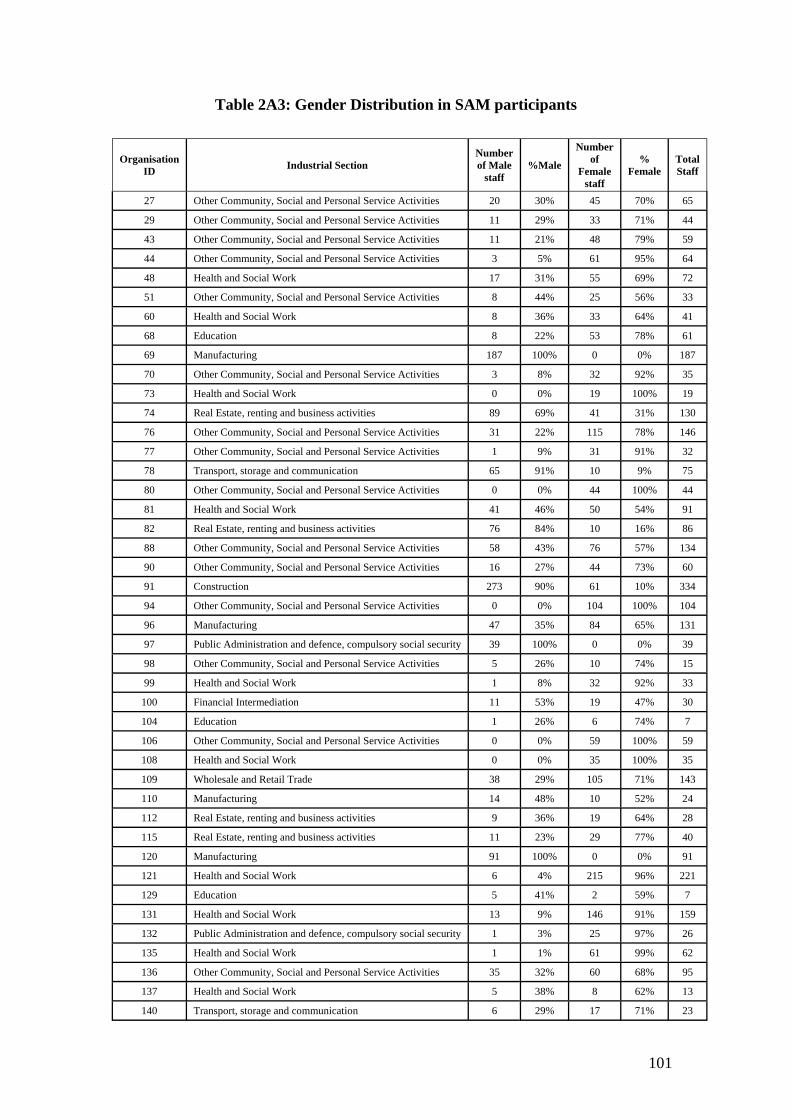
Table 2A3: Gender Distribution in SAM participants
Organisation ID Industrial Section
Number of Male
staff %Male
Number of
Female staff
% Female
Total Staff
27 Other Community, Social and Personal Service Activities 20 30% 45 70% 65
29 Other Community, Social and Personal Service Activities 11 29% 33 71% 44
43 Other Community, Social and Personal Service Activities 11 21% 48 79% 59
44 Other Community, Social and Personal Service Activities 3 5% 61 95% 64
48 Health and Social Work 17 31% 55 69% 72
51 Other Community, Social and Personal Service Activities 8 44% 25 56% 33
60 Health and Social Work 8 36% 33 64% 41
68 Education 8 22% 53 78% 61
69 Manufacturing 187 100% 0 0% 187
70 Other Community, Social and Personal Service Activities 3 8% 32 92% 35
73 Health and Social Work 0 0% 19 100% 19
74 Real Estate, renting and business activities 89 69% 41 31% 130
76 Other Community, Social and Personal Service Activities 31 22% 115 78% 146
77 Other Community, Social and Personal Service Activities 1 9% 31 91% 32
78 Transport, storage and communication 65 91% 10 9% 75
80 Other Community, Social and Personal Service Activities 0 0% 44 100% 44
81 Health and Social Work 41 46% 50 54% 91
82 Real Estate, renting and business activities 76 84% 10 16% 86
88 Other Community, Social and Personal Service Activities 58 43% 76 57% 134
90 Other Community, Social and Personal Service Activities 16 27% 44 73% 60
91 Construction 273 90% 61 10% 334
94 Other Community, Social and Personal Service Activities 0 0% 104 100% 104
96 Manufacturing 47 35% 84 65% 131
97 Public Administration and defence, compulsory social security 39 100% 0 0% 39
98 Other Community, Social and Personal Service Activities 5 26% 10 74% 15
99 Health and Social Work 1 8% 32 92% 33
100 Financial Intermediation 11 53% 19 47% 30
104 Education 1 26% 6 74% 7
106 Other Community, Social and Personal Service Activities 0 0% 59 100% 59
108 Health and Social Work 0 0% 35 100% 35
109 Wholesale and Retail Trade 38 29% 105 71% 143
110 Manufacturing 14 48% 10 52% 24
112 Real Estate, renting and business activities 9 36% 19 64% 28
115 Real Estate, renting and business activities 11 23% 29 77% 40
120 Manufacturing 91 100% 0 0% 91
121 Health and Social Work 6 4% 215 96% 221
129 Education 5 41% 2 59% 7
131 Health and Social Work 13 9% 146 91% 159
132 Public Administration and defence, compulsory social security 1 3% 25 97% 26
135 Health and Social Work 1 1% 61 99% 62
136 Other Community, Social and Personal Service Activities 35 32% 60 68% 95
137 Health and Social Work 5 38% 8 62% 13
140 Transport, storage and communication 6 29% 17 71% 23
101
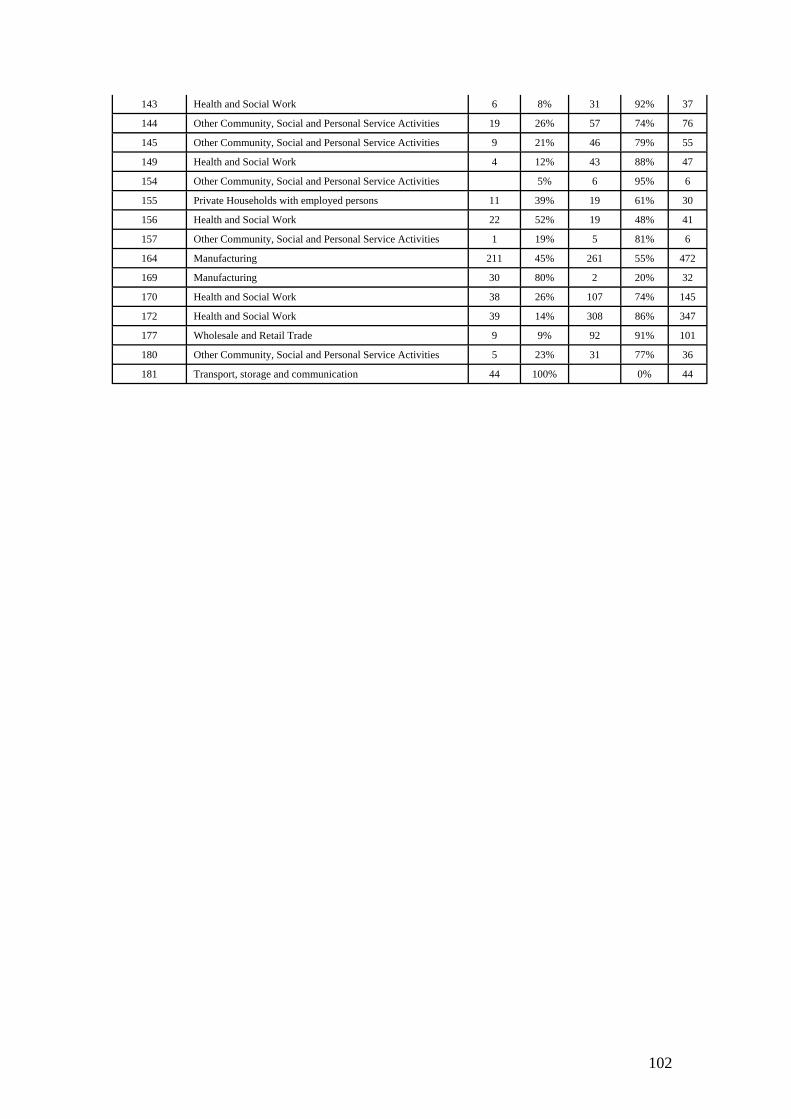
143 Health and Social Work 6 8% 31 92% 37
144 Other Community, Social and Personal Service Activities 19 26% 57 74% 76
145 Other Community, Social and Personal Service Activities 9 21% 46 79% 55
149 Health and Social Work 4 12% 43 88% 47
154 Other Community, Social and Personal Service Activities 5% 6 95% 6
155 Private Households with employed persons 11 39% 19 61% 30
156 Health and Social Work 22 52% 19 48% 41
157 Other Community, Social and Personal Service Activities 1 19% 5 81% 6
164 Manufacturing 211 45% 261 55% 472
169 Manufacturing 30 80% 2 20% 32
170 Health and Social Work 38 26% 107 74% 145
172 Health and Social Work 39 14% 308 86% 347
177 Wholesale and Retail Trade 9 9% 92 91% 101
180 Other Community, Social and Personal Service Activities 5 23% 31 77% 36
181 Transport, storage and communication 44 100% 0% 44
102
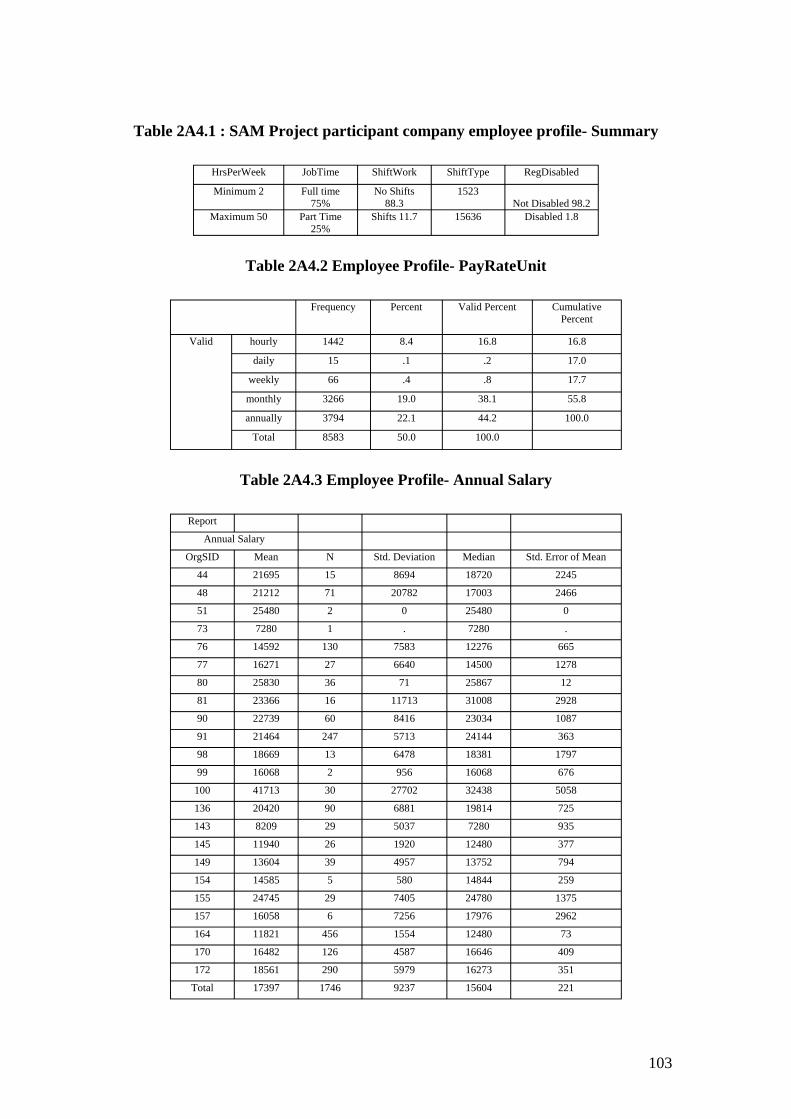
Table 2A4.1 : SAM Project participant company employee profile- Summary
HrsPerWeek JobTime ShiftWork ShiftType RegDisabled
Minimum 2 Full time 75%
No Shifts 88.3
1523 Not Disabled 98.2
Maximum 50 Part Time 25%
Shifts 11.7 15636 Disabled 1.8
Table 2A4.2 Employee Profile- PayRateUnit
Frequency Percent Valid Percent Cumulative Percent
Valid hourly 1442 8.4 16.8 16.8
daily 15 .1 .2 17.0
weekly 66 .4 .8 17.7
monthly 3266 19.0 38.1 55.8
annually 3794 22.1 44.2 100.0
Total 8583 50.0 100.0
Table 2A4.3 Employee Profile- Annual Salary
Report
Annual Salary
OrgSID Mean N Std. Deviation Median Std. Error of Mean
44 21695 15 8694 18720 2245
48 21212 71 20782 17003 2466
51 25480 2 0 25480 0
73 7280 1 . 7280 .
76 14592 130 7583 12276 665
77 16271 27 6640 14500 1278
80 25830 36 71 25867 12
81 23366 16 11713 31008 2928
90 22739 60 8416 23034 1087
91 21464 247 5713 24144 363
98 18669 13 6478 18381 1797
99 16068 2 956 16068 676
100 41713 30 27702 32438 5058
136 20420 90 6881 19814 725
143 8209 29 5037 7280 935
145 11940 26 1920 12480 377
149 13604 39 4957 13752 794
154 14585 5 580 14844 259
155 24745 29 7405 24780 1375
157 16058 6 7256 17976 2962
164 11821 456 1554 12480 73
170 16482 126 4587 16646 409
172 18561 290 5979 16273 351
Total 17397 1746 9237 15604 221
103
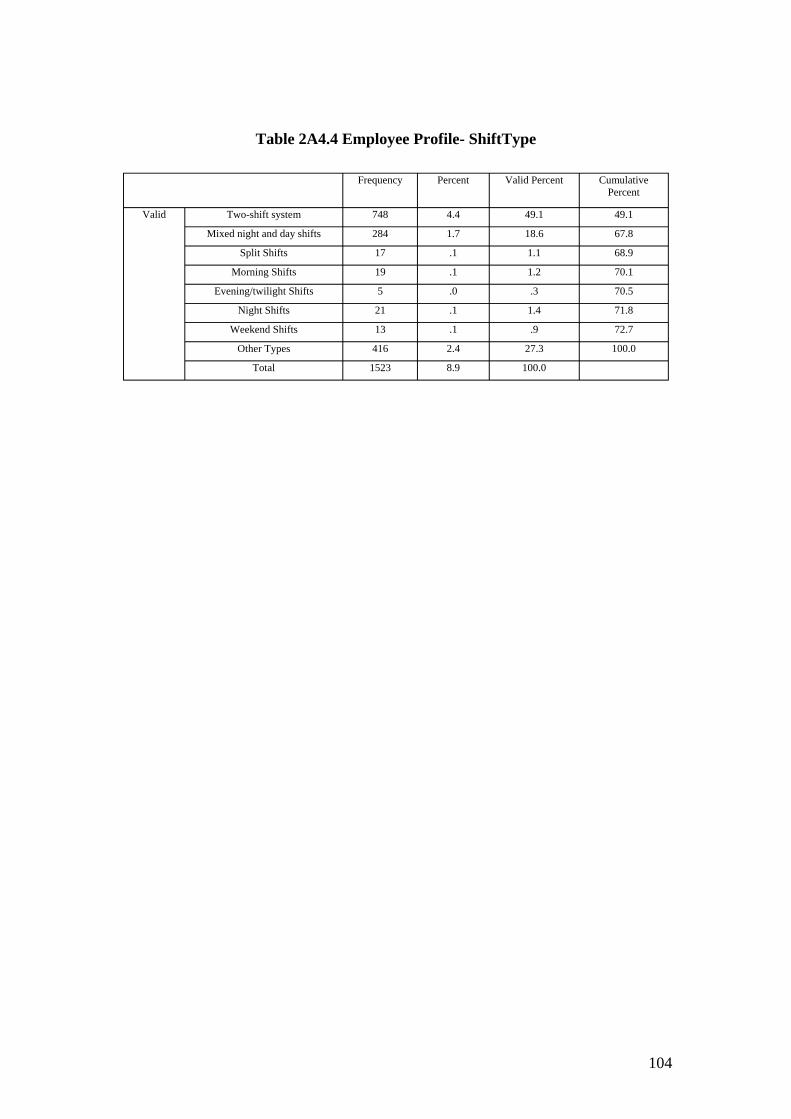
Table 2A4.4 Employee Profile- ShiftType
Frequency Percent Valid Percent Cumulative Percent
Valid Two-shift system 748 4.4 49.1 49.1
Mixed night and day shifts 284 1.7 18.6 67.8
Split Shifts 17 .1 1.1 68.9
Morning Shifts 19 .1 1.2 70.1
Evening/twilight Shifts 5 .0 .3 70.5
Night Shifts 21 .1 1.4 71.8
Weekend Shifts 13 .1 .9 72.7
Other Types 416 2.4 27.3 100.0
Total 1523 8.9 100.0
104
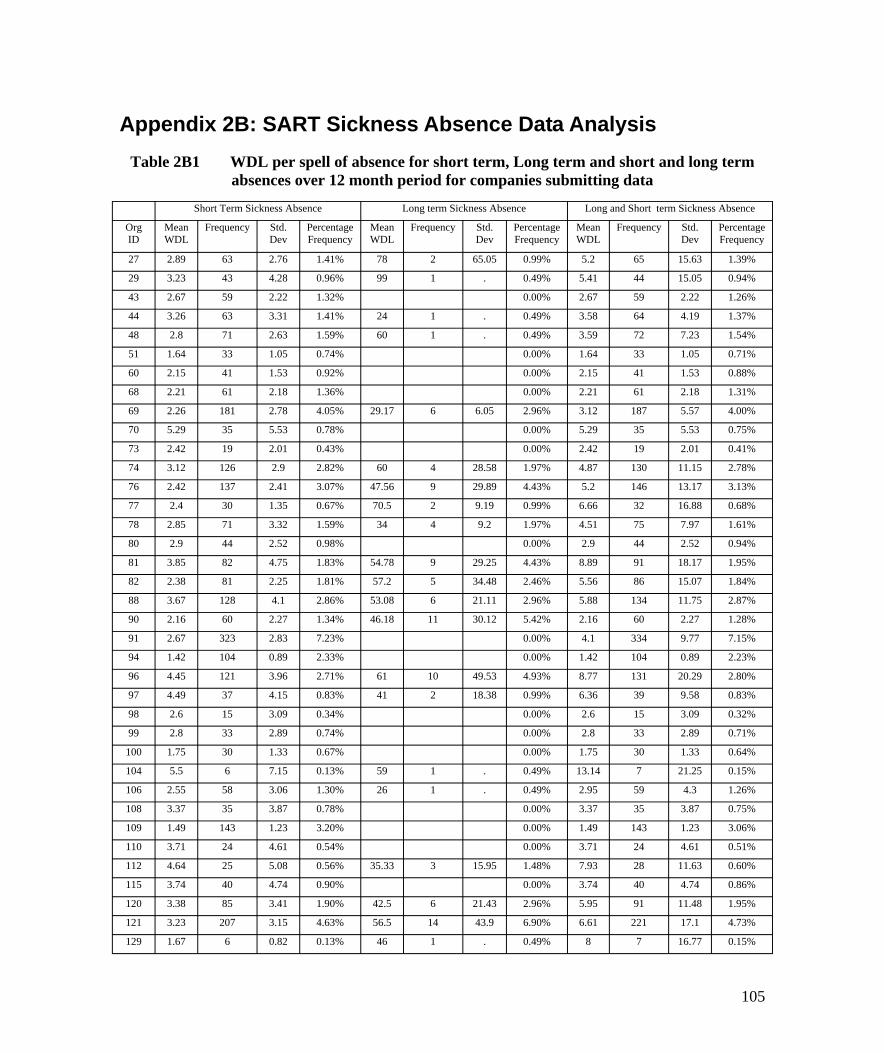
Appendix 2B: SART Sickness Absence Data Analysis Table 2B1 WDL per spell of absence for short term, Long term and short and long term
absences over 12 month period for companies submitting data
Short Term Sickness Absence Long term Sickness Absence Long and Short term Sickness Absence
Org Mean Frequency Std. Percentage Mean Frequency Std. Percentage Mean Frequency Std. Percentage ID WDL Dev Frequency WDL Dev Frequency WDL Dev Frequency
27 2.89 63 2.76 1.41% 78 2 65.05 0.99% 5.2 65 15.63 1.39%
29 3.23 43 4.28 0.96% 99 1 . 0.49% 5.41 44 15.05 0.94%
43 2.67 59 2.22 1.32% 0.00% 2.67 59 2.22 1.26%
44 3.26 63 3.31 1.41% 24 1 . 0.49% 3.58 64 4.19 1.37%
48 2.8 71 2.63 1.59% 60 1 . 0.49% 3.59 72 7.23 1.54%
51 1.64 33 1.05 0.74% 0.00% 1.64 33 1.05 0.71%
60 2.15 41 1.53 0.92% 0.00% 2.15 41 1.53 0.88%
68 2.21 61 2.18 1.36% 0.00% 2.21 61 2.18 1.31%
69 2.26 181 2.78 4.05% 29.17 6 6.05 2.96% 3.12 187 5.57 4.00%
70 5.29 35 5.53 0.78% 0.00% 5.29 35 5.53 0.75%
73 2.42 19 2.01 0.43% 0.00% 2.42 19 2.01 0.41%
74 3.12 126 2.9 2.82% 60 4 28.58 1.97% 4.87 130 11.15 2.78%
76 2.42 137 2.41 3.07% 47.56 9 29.89 4.43% 5.2 146 13.17 3.13%
77 2.4 30 1.35 0.67% 70.5 2 9.19 0.99% 6.66 32 16.88 0.68%
78 2.85 71 3.32 1.59% 34 4 9.2 1.97% 4.51 75 7.97 1.61%
80 2.9 44 2.52 0.98% 0.00% 2.9 44 2.52 0.94%
81 3.85 82 4.75 1.83% 54.78 9 29.25 4.43% 8.89 91 18.17 1.95%
82 2.38 81 2.25 1.81% 57.2 5 34.48 2.46% 5.56 86 15.07 1.84%
88 3.67 128 4.1 2.86% 53.08 6 21.11 2.96% 5.88 134 11.75 2.87%
90 2.16 60 2.27 1.34% 46.18 11 30.12 5.42% 2.16 60 2.27 1.28%
91 2.67 323 2.83 7.23% 0.00% 4.1 334 9.77 7.15%
94 1.42 104 0.89 2.33% 0.00% 1.42 104 0.89 2.23%
96 4.45 121 3.96 2.71% 61 10 49.53 4.93% 8.77 131 20.29 2.80%
97 4.49 37 4.15 0.83% 41 2 18.38 0.99% 6.36 39 9.58 0.83%
98 2.6 15 3.09 0.34% 0.00% 2.6 15 3.09 0.32%
99 2.8 33 2.89 0.74% 0.00% 2.8 33 2.89 0.71%
100 1.75 30 1.33 0.67% 0.00% 1.75 30 1.33 0.64%
104 5.5 6 7.15 0.13% 59 1 . 0.49% 13.14 7 21.25 0.15%
106 2.55 58 3.06 1.30% 26 1 . 0.49% 2.95 59 4.3 1.26%
108 3.37 35 3.87 0.78% 0.00% 3.37 35 3.87 0.75%
109 1.49 143 1.23 3.20% 0.00% 1.49 143 1.23 3.06%
110 3.71 24 4.61 0.54% 0.00% 3.71 24 4.61 0.51%
112 4.64 25 5.08 0.56% 35.33 3 15.95 1.48% 7.93 28 11.63 0.60%
115 3.74 40 4.74 0.90% 0.00% 3.74 40 4.74 0.86%
120 3.38 85 3.41 1.90% 42.5 6 21.43 2.96% 5.95 91 11.48 1.95%
121 3.23 207 3.15 4.63% 56.5 14 43.9 6.90% 6.61 221 17.1 4.73%
129 1.67 6 0.82 0.13% 46 1 . 0.49% 8 7 16.77 0.15%
105

131 3.91 139 3.93 3.11% 53.65 20 37 9.85% 10.17 159 21.26 3.40%
132 2.46 26 2.37 0.58% 0.00% 2.46 26 2.37 0.56%
135 3.22 61 3.26 1.36% 34 1 . 0.49% 3.72 62 5.07 1.33%
136 2.66 90 2.76 2.01% 66.2 5 51.02 2.46% 6 95 17.93 2.03%
137 1.6 10 0.52 0.22% 78 3 17.44 1.48% 19.23 13 34.25 0.28%
140 1.96 23 1.66 0.51% 0.00% 1.96 23 1.66 0.49%
143 2.39 33 2.61 0.74% 34 4 9.31 1.97% 5.81 37 10.6 0.79%
144 2.34 74 2.68 1.66% 226.5 2 194.45 0.99% 8.24 76 42.61 1.63%
145 4.06 51 5.21 1.14% 66 4 40.33 1.97% 8.56 55 19.47 1.18%
149 4.51 39 4.51 0.87% 30.75 8 9.02 3.94% 8.98 47 11.34 1.01%
154 1.4 5 0.55 0.11% 60 1 . 0.49% 11.17 6 23.93 0.13%
155 2.57 30 2.92 0.67% 0.00% 2.57 30 2.92 0.64%
156 4.4 40 4.55 0.90% 42 1 . 0.49% 5.32 41 7.39 0.88%
157 4.83 6 7.47 0.13% 0.00% 4.83 6 7.47 0.13%
164 2.14 467 2.4 10.45% 22 5 0 2.46% 2.35 472 3.14 10.10%
169 3.18 30 3.79 0.67% 58 2 49.5 0.99% 6.61 32 16.56 0.68%
170 3.26 126 3.19 2.82% 55.42 19 35.08 9.36% 10.1 145 21.79 3.10%
172 3.29 339 3.66 7.59% 40.75 8 19.56 3.94% 4.16 347 7.24 7.43%
177 2.15 98 1.98 2.19% 24.67 3 5.51 1.48% 2.82 101 4.38 2.16%
180 3.32 34 4.72 0.76% 53.5 2 13.44 0.99% 6.11 36 12.73 0.77%
181 6.43 28 4.59 0.63% 53.69 16 27.56 7.88% 23.61 44 28.41 0.94%
Total 2.89 4469 3.24 100.00% 52.01 203 38.49 100.00% 5.02 4672 13.21 100.00%
106
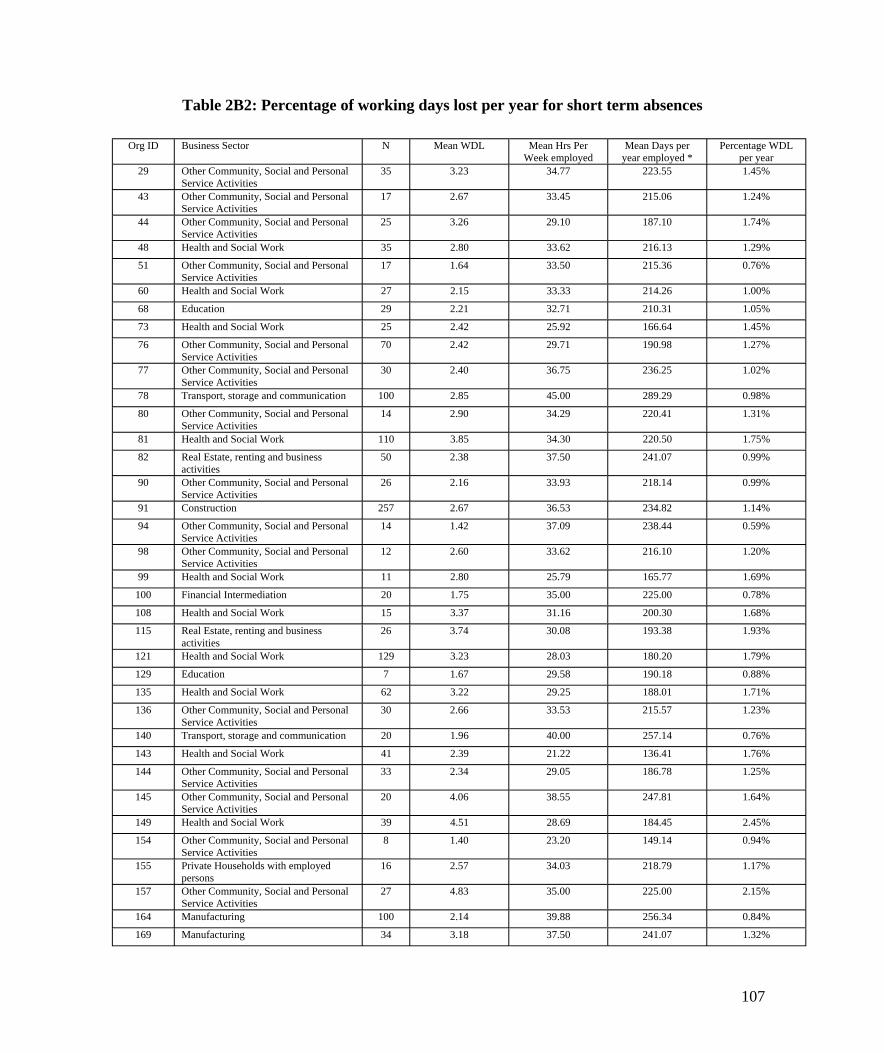
Table 2B2: Percentage of working days lost per year for short term absences
Org ID Business Sector N Mean WDL Mean Hrs Per Week employed
Mean Days per year employed *
Percentage WDL per year
29 Other Community, Social and Personal Service Activities
35 3.23 34.77 223.55 1.45%
43 Other Community, Social and Personal Service Activities
17 2.67 33.45 215.06 1.24%
44 Other Community, Social and Personal Service Activities
25 3.26 29.10 187.10 1.74%
48 Health and Social Work 35 2.80 33.62 216.13 1.29%
51 Other Community, Social and Personal Service Activities
17 1.64 33.50 215.36 0.76%
60 Health and Social Work 27 2.15 33.33 214.26 1.00%
68 Education 29 2.21 32.71 210.31 1.05%
73 Health and Social Work 25 2.42 25.92 166.64 1.45%
76 Other Community, Social and Personal Service Activities
70 2.42 29.71 190.98 1.27%
77 Other Community, Social and Personal Service Activities
30 2.40 36.75 236.25 1.02%
78 Transport, storage and communication 100 2.85 45.00 289.29 0.98%
80 Other Community, Social and Personal Service Activities
14 2.90 34.29 220.41 1.31%
81 Health and Social Work 110 3.85 34.30 220.50 1.75%
82 Real Estate, renting and business activities
50 2.38 37.50 241.07 0.99%
90 Other Community, Social and Personal Service Activities
26 2.16 33.93 218.14 0.99%
91 Construction 257 2.67 36.53 234.82 1.14%
94 Other Community, Social and Personal Service Activities
14 1.42 37.09 238.44 0.59%
98 Other Community, Social and Personal Service Activities
12 2.60 33.62 216.10 1.20%
99 Health and Social Work 11 2.80 25.79 165.77 1.69%
100 Financial Intermediation 20 1.75 35.00 225.00 0.78%
108 Health and Social Work 15 3.37 31.16 200.30 1.68%
115 Real Estate, renting and business activities
26 3.74 30.08 193.38 1.93%
121 Health and Social Work 129 3.23 28.03 180.20 1.79%
129 Education 7 1.67 29.58 190.18 0.88%
135 Health and Social Work 62 3.22 29.25 188.01 1.71%
136 Other Community, Social and Personal Service Activities
30 2.66 33.53 215.57 1.23%
140 Transport, storage and communication 20 1.96 40.00 257.14 0.76%
143 Health and Social Work 41 2.39 21.22 136.41 1.76%
144 Other Community, Social and Personal Service Activities
33 2.34 29.05 186.78 1.25%
145 Other Community, Social and Personal Service Activities
20 4.06 38.55 247.81 1.64%
149 Health and Social Work 39 4.51 28.69 184.45 2.45%
154 Other Community, Social and Personal Service Activities
8 1.40 23.20 149.14 0.94%
155 Private Households with employed persons
16 2.57 34.03 218.79 1.17%
157 Other Community, Social and Personal Service Activities
27 4.83 35.00 225.00 2.15%
164 Manufacturing 100 2.14 39.88 256.34 0.84%
169 Manufacturing 34 3.18 37.50 241.07 1.32%
107
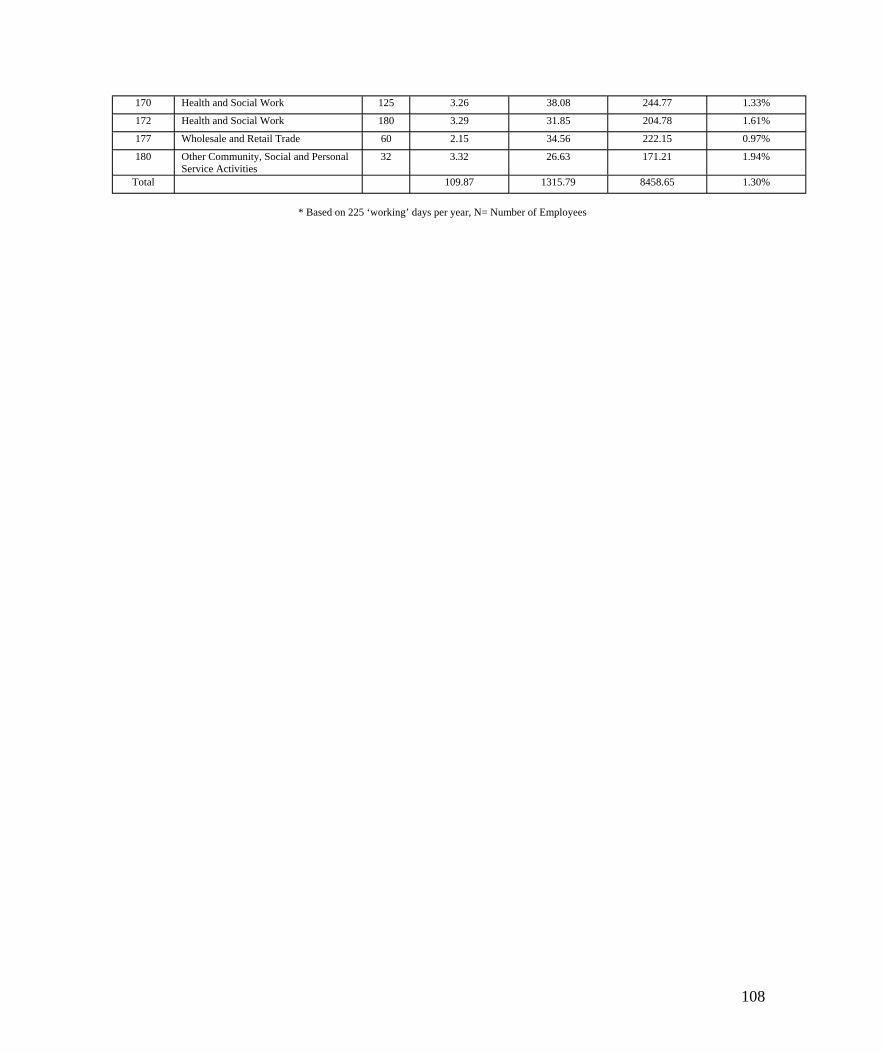
170 Health and Social Work 125 3.26 38.08 244.77 1.33%
172 Health and Social Work 180 3.29 31.85 204.78 1.61%
177 Wholesale and Retail Trade 60 2.15 34.56 222.15 0.97%
180 Other Community, Social and Personal Service Activities
32 3.32 26.63 171.21 1.94%
Total 109.87 1315.79 8458.65 1.30%
* Based on 225 ‘working’ days per year, N= Number of Employees
108
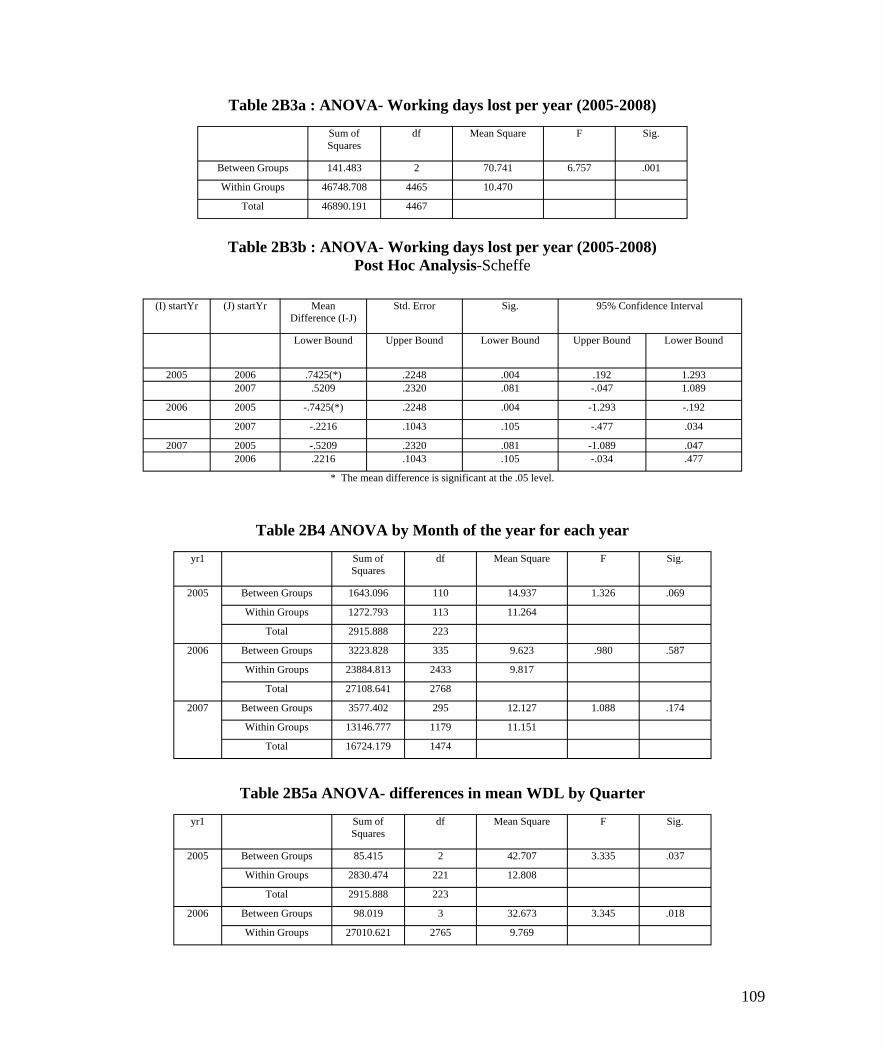
Table 2B3a : ANOVA- Working days lost per year (2005-2008)
Sum of Squares
df Mean Square F Sig.
Between Groups 141.483 2 70.741 6.757 .001
Within Groups 46748.708 4465 10.470
Total 46890.191 4467
Table 2B3b : ANOVA- Working days lost per year (2005-2008) Post Hoc Analysis-Scheffe
(I) startYr (J) startYr Mean Difference (I-J)
Std. Error Sig. 95% Confidence Interval
Lower Bound Upper Bound Lower Bound Upper Bound Lower Bound
2005 2006 .7425(*) .2248 .004 .192 1.293 2007 .5209 .2320 .081 -.047 1.089
2006 2005 -.7425(*) .2248 .004 -1.293 -.192
2007 -.2216 .1043 .105 -.477 .034
2007 2005 -.5209 .2320 .081 -1.089 .047 2006 .2216 .1043 .105 -.034 .477
* The mean difference is significant at the .05 level.
Table 2B4 ANOVA by Month of the year for each year
yr1 Sum of Squares
df Mean Square F Sig.
2005 Between Groups 1643.096 110 14.937 1.326 .069
Within Groups 1272.793 113 11.264
Total 2915.888 223
2006 Between Groups 3223.828 335 9.623 .980 .587
Within Groups 23884.813 2433 9.817
Total 27108.641 2768
2007 Between Groups 3577.402 295 12.127 1.088 .174
Within Groups 13146.777 1179 11.151
Total 16724.179 1474
Table 2B5a ANOVA- differences in mean WDL by Quarter
yr1 Sum of Squares
df Mean Square F Sig.
2005 Between Groups 85.415 2 42.707 3.335 .037
Within Groups 2830.474 221 12.808
Total 2915.888 223
2006 Between Groups 98.019 3 32.673 3.345 .018
Within Groups 27010.621 2765 9.769
109
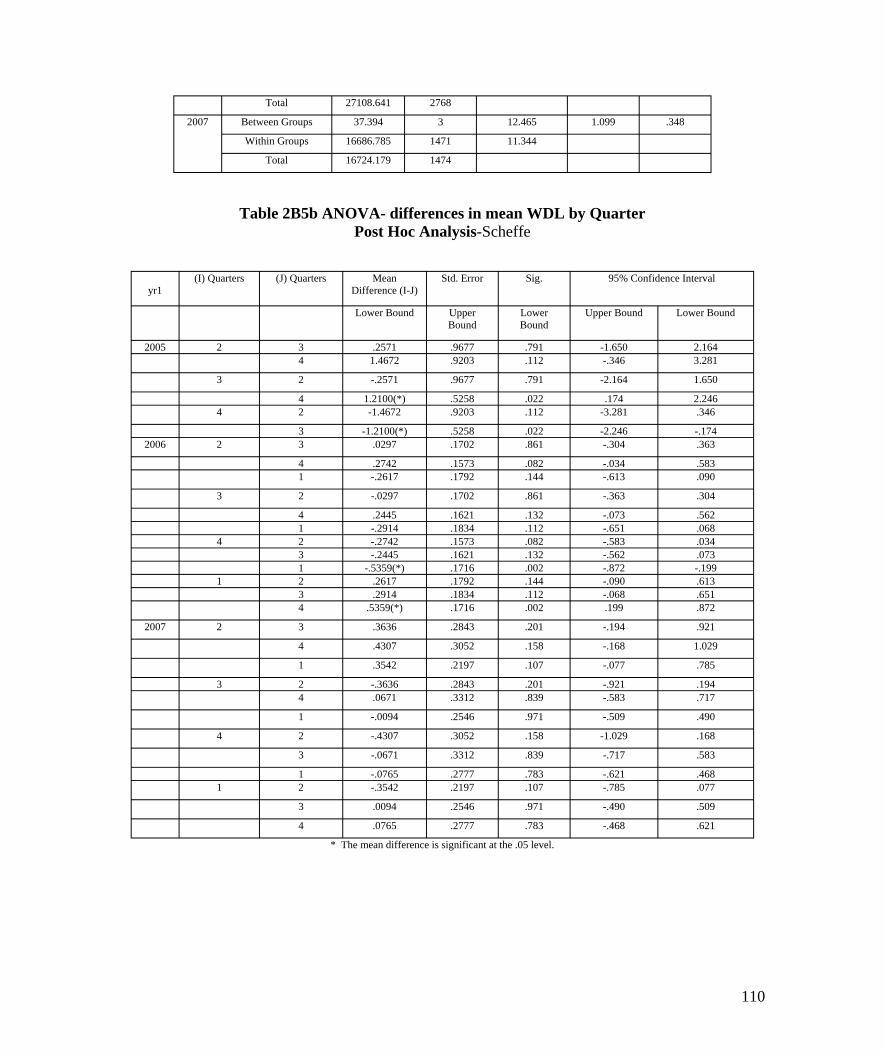
Total 27108.641 2768
2007 Between Groups 37.394 3 12.465 1.099 .348
Within Groups 16686.785 1471 11.344
Total 16724.179 1474
Table 2B5b ANOVA- differences in mean WDL by Quarter Post Hoc Analysis-Scheffe
yr1 (I) Quarters (J) Quarters Mean
Difference (I-J) Std. Error Sig. 95% Confidence Interval
Lower Bound Upper Bound
Lower Bound
Upper Bound Lower Bound
2005 2 3 .2571 .9677 .791 -1.650 2.164 4 1.4672 .9203 .112 -.346 3.281
3 2 -.2571 .9677 .791 -2.164 1.650
4 1.2100(*) .5258 .022 .174 2.246 4 2 -1.4672 .9203 .112 -3.281 .346
3 -1.2100(*) .5258 .022 -2.246 -.174 2006 2 3 .0297 .1702 .861 -.304 .363
4 .2742 .1573 .082 -.034 .583 1 -.2617 .1792 .144 -.613 .090
3 2 -.0297 .1702 .861 -.363 .304
4 .2445 .1621 .132 -.073 .562 1 -.2914 .1834 .112 -.651 .068
4 2 -.2742 .1573 .082 -.583 .034 3 -.2445 .1621 .132 -.562 .073 1 -.5359(*) .1716 .002 -.872 -.199
1 2 .2617 .1792 .144 -.090 .613 3 .2914 .1834 .112 -.068 .651 4 .5359(*) .1716 .002 .199 .872
2007 2 3 .3636 .2843 .201 -.194 .921
4 .4307 .3052 .158 -.168 1.029
1 .3542 .2197 .107 -.077 .785
3 2 -.3636 .2843 .201 -.921 .194 4 .0671 .3312 .839 -.583 .717
1 -.0094 .2546 .971 -.509 .490
4 2 -.4307 .3052 .158 -1.029 .168
3 -.0671 .3312 .839 -.717 .583
1 -.0765 .2777 .783 -.621 .468 1 2 -.3542 .2197 .107 -.785 .077
3 .0094 .2546 .971 -.490 .509
4 .0765 .2777 .783 -.468 .621
* The mean difference is significant at the .05 level.
110
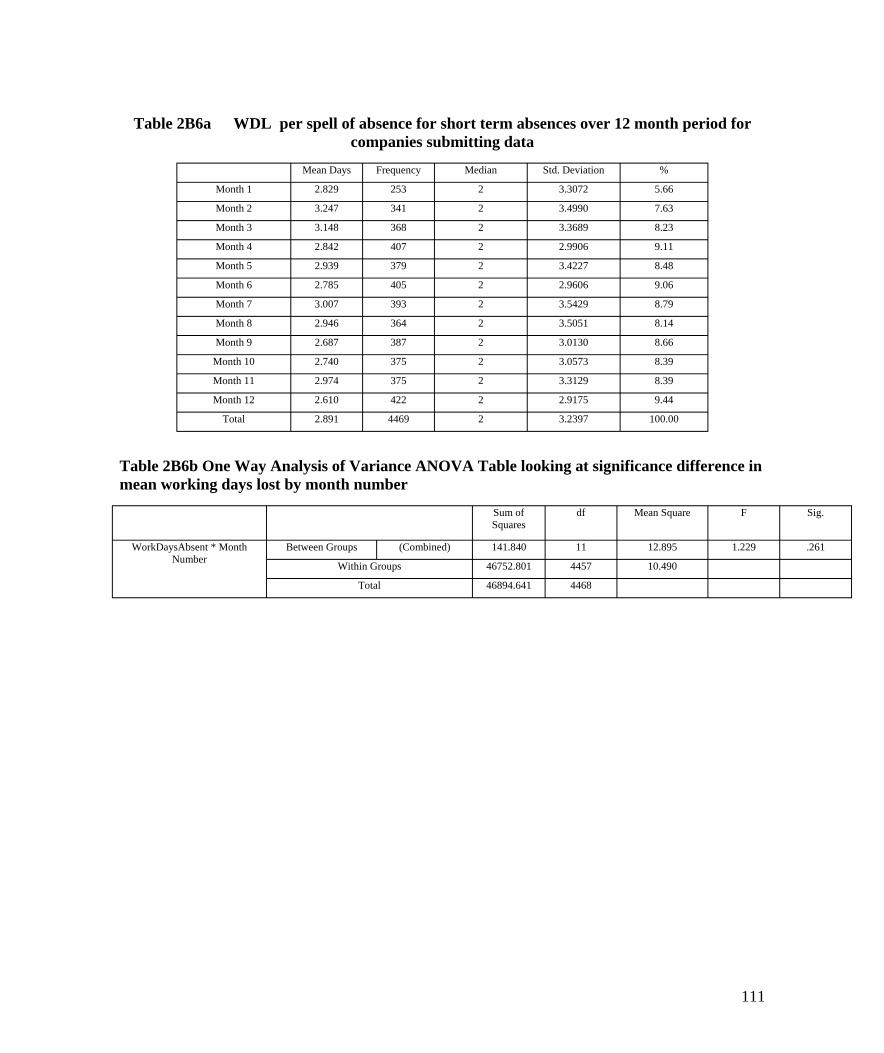
Table 2B6a WDL per spell of absence for short term absences over 12 month period for companies submitting data
Mean Days Frequency Median Std. Deviation %
Month 1 2.829 253 2 3.3072 5.66
Month 2 3.247 341 2 3.4990 7.63
Month 3 3.148 368 2 3.3689 8.23
Month 4 2.842 407 2 2.9906 9.11
Month 5 2.939 379 2 3.4227 8.48
Month 6 2.785 405 2 2.9606 9.06
Month 7 3.007 393 2 3.5429 8.79
Month 8 2.946 364 2 3.5051 8.14
Month 9 2.687 387 2 3.0130 8.66
Month 10 2.740 375 2 3.0573 8.39
Month 11 2.974 375 2 3.3129 8.39
Month 12 2.610 422 2 2.9175 9.44
Total 2.891 4469 2 3.2397 100.00
Table 2B6b One Way Analysis of Variance ANOVA Table looking at significance difference in mean working days lost by month number
Sum of Squares
df Mean Square F Sig.
WorkDaysAbsent * Month Number
Between Groups (Combined) 141.840 11 12.895 1.229 .261
Within Groups 46752.801 4457 10.490
Total 46894.641 4468
111
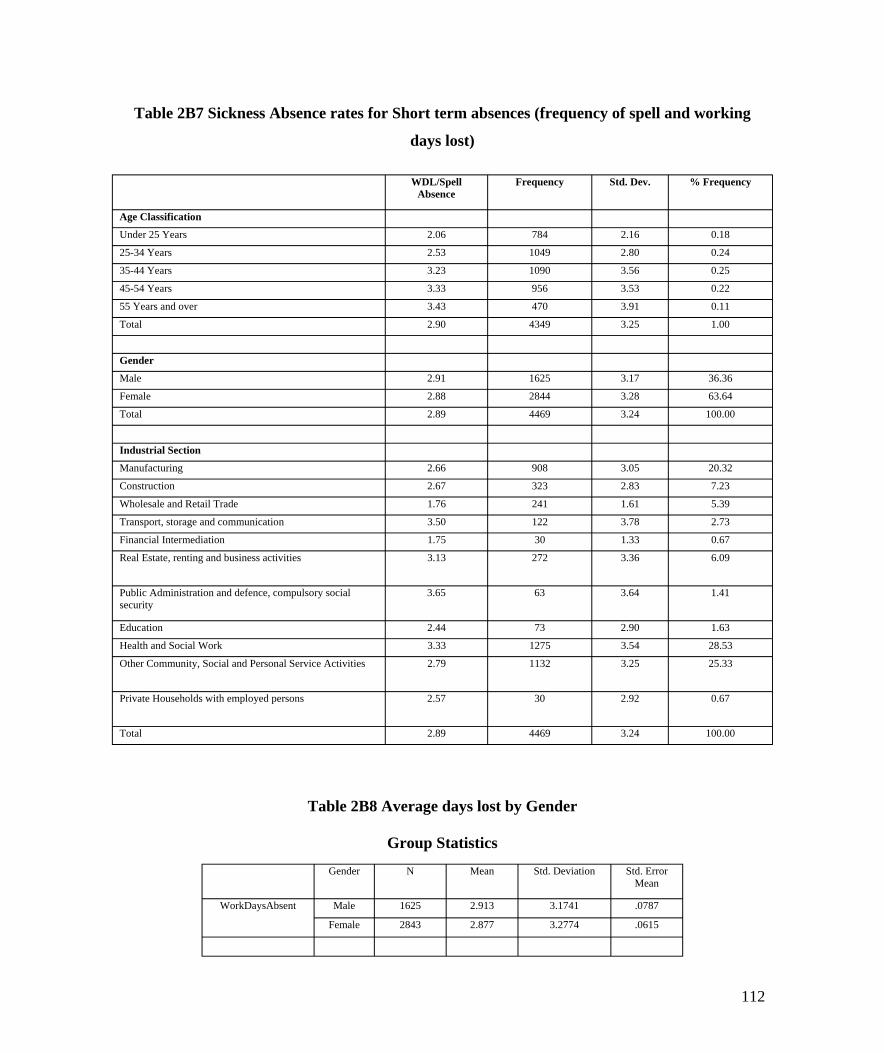
Table 2B7 Sickness Absence rates for Short term absences (frequency of spell and working
days lost)
WDL/Spell Absence
Frequency Std. Dev. % Frequency
Age Classification
Under 25 Years 2.06 784 2.16 0.18
25-34 Years 2.53 1049 2.80 0.24
35-44 Years 3.23 1090 3.56 0.25
45-54 Years 3.33 956 3.53 0.22
55 Years and over 3.43 470 3.91 0.11
Total 2.90 4349 3.25 1.00
Gender
Male 2.91 1625 3.17 36.36
Female 2.88 2844 3.28 63.64
Total 2.89 4469 3.24 100.00
Industrial Section
Manufacturing 2.66 908 3.05 20.32
Construction 2.67 323 2.83 7.23
Wholesale and Retail Trade 1.76 241 1.61 5.39
Transport, storage and communication 3.50 122 3.78 2.73
Financial Intermediation 1.75 30 1.33 0.67
Real Estate, renting and business activities 3.13 272 3.36 6.09
Public Administration and defence, compulsory social security
3.65 63 3.64 1.41
Education 2.44 73 2.90 1.63
Health and Social Work 3.33 1275 3.54 28.53
Other Community, Social and Personal Service Activities 2.79 1132 3.25 25.33
Private Households with employed persons 2.57 30 2.92 0.67
Total 2.89 4469 3.24 100.00
Table 2B8 Average days lost by Gender
Group Statistics
Gender N Mean Std. Deviation Std. Error Mean
WorkDaysAbsent Male 1625 2.913 3.1741 .0787
Female 2843 2.877 3.2774 .0615
112
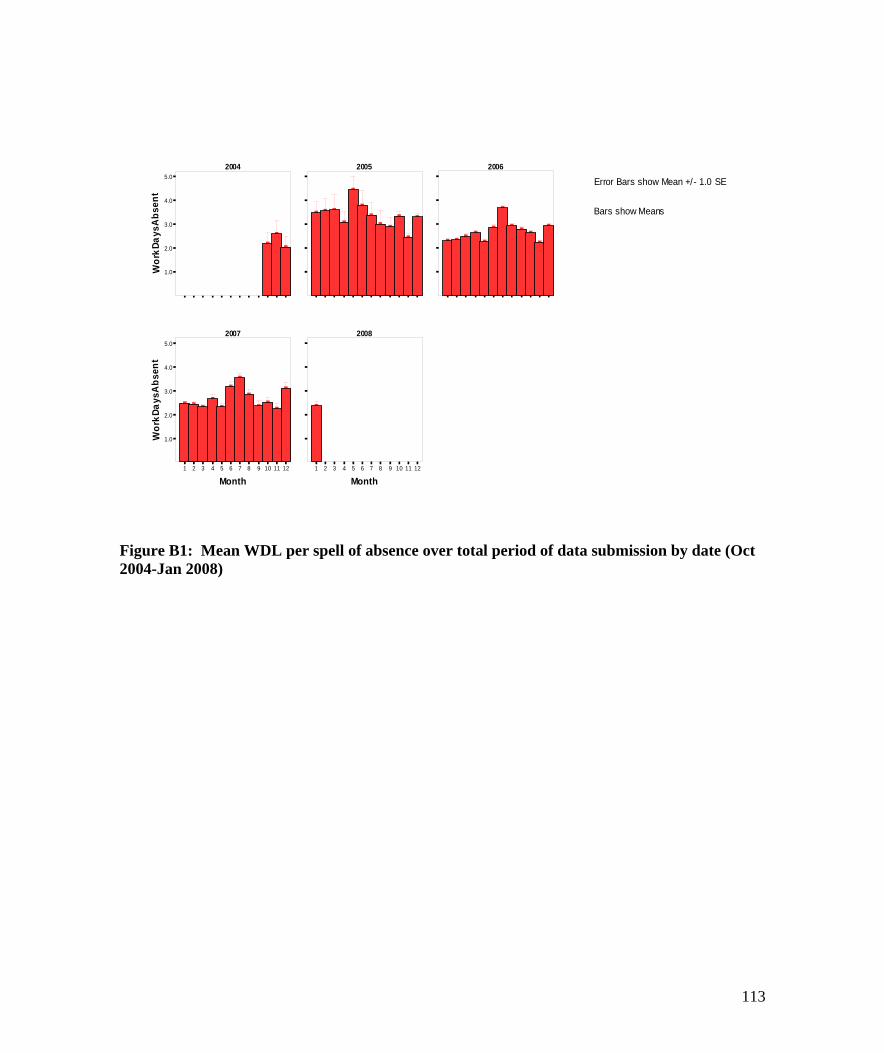
t ne sbA syaD k
4.0
Bars show Means 3.0
2.0
2004 2005 2006 5.0
]
]
]
]
]
]
]
] ]
]
]
]
]
]
]
]
]
]
]
]
]
] ]
]
]
] ]
Error Bars show Mean +/- 1.0 SE
roW 1.0
2007 2008 5.0
4.0
3.0
2.0
1.0
] ]
] ] ]
]
] ]
]
]
]
]
]
1 2 3 4 5 6 7 8 9 10 11 12 1 2 3 4 5 6 7 8 9 10 11 12
Month Month
Figure B1: Mean WDL per spell of absence over total period of data submission by date (Oct 2004-Jan 2008)
t ne sbA syaD kro
W
113
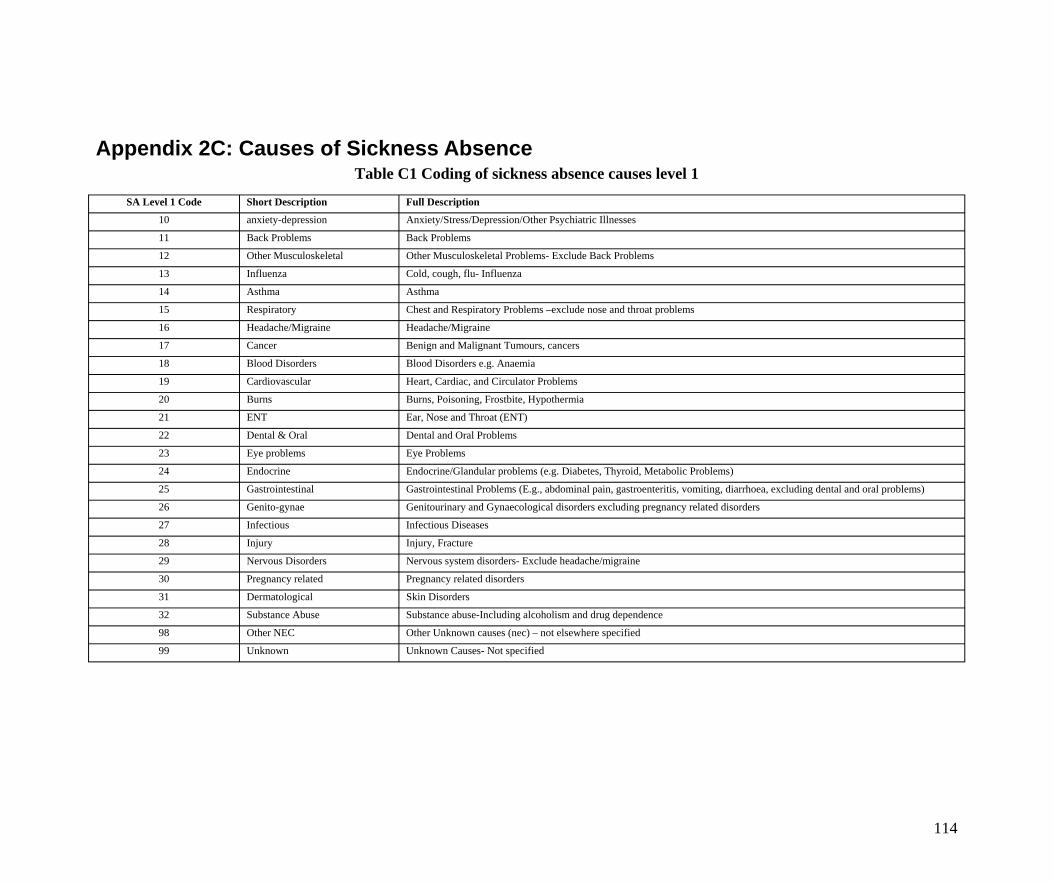
Appendix 2C: Causes of Sickness Absence Table C1 Coding of sickness absence causes level 1
SA Level 1 Code Short Description Full Description
10 anxiety-depression Anxiety/Stress/Depression/Other Psychiatric Illnesses
11 Back Problems Back Problems
12 Other Musculoskeletal Other Musculoskeletal Problems- Exclude Back Problems
13 Influenza Cold, cough, flu- Influenza
14 Asthma Asthma
15 Respiratory Chest and Respiratory Problems –exclude nose and throat problems
16 Headache/Migraine Headache/Migraine
17 Cancer Benign and Malignant Tumours, cancers
18 Blood Disorders Blood Disorders e.g. Anaemia
19 Cardiovascular Heart, Cardiac, and Circulator Problems
20 Burns Burns, Poisoning, Frostbite, Hypothermia
21 ENT Ear, Nose and Throat (ENT)
22 Dental & Oral Dental and Oral Problems
23 Eye problems Eye Problems
24 Endocrine Endocrine/Glandular problems (e.g. Diabetes, Thyroid, Metabolic Problems)
25 Gastrointestinal Gastrointestinal Problems (E.g., abdominal pain, gastroenteritis, vomiting, diarrhoea, excluding dental and oral problems)
26 Genito-gynae Genitourinary and Gynaecological disorders excluding pregnancy related disorders
27 Infectious Infectious Diseases
28 Injury Injury, Fracture
29 Nervous Disorders Nervous system disorders- Exclude headache/migraine
30 Pregnancy related Pregnancy related disorders
31 Dermatological Skin Disorders
32 Substance Abuse Substance abuse-Including alcoholism and drug dependence
98 Other NEC Other Unknown causes (nec) – not elsewhere specified
99 Unknown Unknown Causes- Not specified
114

Table C2: Mean days lost per absence spell – prevalence of sickness absence by Gender for short and Long Term absences
Short Term Absences Long Term Absences Total Absences
Gender SA cause Level 1 Mean Median SD Frequency % Mean Median SD Frequency % Mean Median SD Frequency % Days Days days Days Days days Days Days days
Female anxiety-depression 7.19 5.00 6.23 98.00 3.53 54.95 40.00 56.87 39.00 33.91 20.78 10.00 37.40 137.00 4.73
Back Problems 5.55 3.00 5.27 85.00 3.06 50.56 47.00 22.82 9.00 7.83 9.86 4.00 15.72 94.00 3.25
Other Musculoskeletal 4.34 2.00 4.91 71.00 2.55 49.83 43.00 29.23 6.00 5.22 7.88 3.00 15.14 77.00 2.66
Influenza 2.41 2.00 1.94 585.00 21.04 0.00 2.41 2.00 1.94 585.00 20.21
Asthma 3.66 2.00 3.15 19.00 0.68 0.00 3.66 2.00 3.15 19.00 0.66
Respiratory 4.43 4.00 3.56 123.00 4.42 48.75 50.00 20.65 4.00 3.48 5.83 4.00 9.10 127.00 4.39
Headache 1.44 1.00 1.46 182.00 6.55 33.00 33.00 . 1.00 0.87 1.61 1.00 2.75 183.00 6.32
Cancer 2.64 2.00 3.83 33.00 1.19 85.75 71.00 57.18 8.00 6.96 18.85 2.00 41.18 41.00 1.42
Blood Disorders 2.80 3.00 1.79 5.00 0.18 22.00 22.00 . 1.00 0.87 6.00 3.50 8.00 6.00 0.21
Cardiovascular 2.82 2.00 2.14 11.00 0.40 88.00 88.00 86.27 2.00 1.74 15.92 2.00 40.59 13.00 0.45
Burns 2.17 2.00 1.17 6.00 0.22 42.00 42.00 . 1.00 0.87 7.86 2.00 15.09 7.00 0.24
ENT 3.15 2.00 3.14 166.00 5.97 36.33 22.00 24.83 3.00 2.61 3.74 2.00 6.03 169.00 5.84
Dental & Oral 2.16 1.00 3.07 50.00 1.80 24.00 24.00 . 1.00 0.87 2.59 1.00 4.31 51.00 1.76
Eye problems 2.44 2.00 1.92 33.00 1.19 0.00 2.44 2.00 1.92 33.00 1.14
Endocrine 5.00 5.00 5.66 2.00 0.07 0.00 5.00 5.00 5.66 2.00 0.07
Gastrointestinal 1.95 1.00 1.89 643.00 23.13 37.43 24.00 19.23 7.00 6.09 2.33 1.00 4.51 650.00 22.45
Genito-gynae 3.83 2.00 4.56 69.00 2.48 59.33 61.00 22.99 6.00 5.22 8.27 2.00 16.87 75.00 2.59
Infectious 3.78 4.00 2.11 9.00 0.32 21.00 21.00 . 1.00 0.87 5.50 4.00 5.80 10.00 0.35
Injury 5.00 3.00 5.47 49.00 1.76 56.27 31.00 41.33 11.00 9.57 14.40 4.00 26.72 60.00 2.07
Nervous Disorders 2.29 2.00 1.38 7.00 0.25 22.00 22.00 . 1.00 0.87 4.75 2.00 7.09 8.00 0.28
Pregnancy related 4.68 2.50 5.09 36.00 1.29 35.00 39.00 6.93 3.00 2.61 7.01 3.00 9.66 39.00 1.35
Dermatological 3.69 2.00 3.94 30.00 1.08 0.00 3.69 2.00 3.94 30.00 1.04
Other NC 3.43 2.00 3.65 220.00 7.91 60.89 44.00 48.44 9.00 7.83 5.69 2.00 14.84 229.00 7.91
Unknown 2.27 1.00 2.33 248.00 8.92 60.00 60.00 49.50 2.00 1.74 2.73 1.00 6.46 250.00 8.64
Total 2.89 2.00 3.30 2780.00 100.00 54.23 40.00 44.67 115.00 100.00 4.93 2.00 13.77 2895.00 100.00
Gastrointestinal 1.97 1.00 1.85 398.00 25.46 37.17 26.00 23.72 6.00 6.82 2.49 1.00 5.34 404.00 24.47
Influenza 2.41 2.00 1.54 369.00 23.61 0.00 2.41 2.00 1.54 369.00 22.35
Unknown 2.54 2.00 2.65 162.00 10.36 43.25 37.50 19.38 4.00 4.55 3.52 2.00 7.27 166.00 10.05
Other NC 4.26 3.00 4.14 98.00 6.27 58.80 35.00 46.64 5.00 5.68 6.90 3.00 15.50 103.00 6.24
Back Problems 3.52 2.00 3.51 90.00 5.76 44.50 38.00 20.09 12.00 13.64 8.34 2.75 15.19 102.00 6.18
115
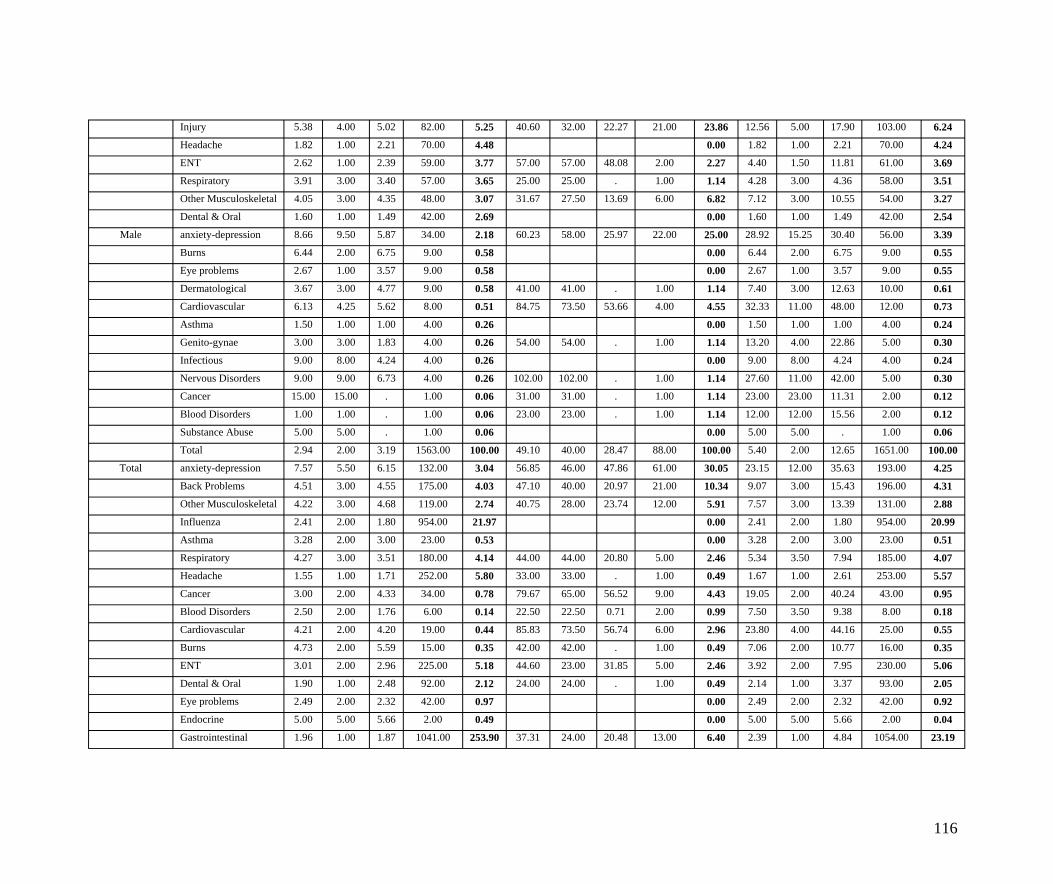
Injury 5.38 4.00 5.02 82.00 5.25 40.60 32.00 22.27 21.00 23.86 12.56 5.00 17.90 103.00 6.24
Headache 1.82 1.00 2.21 70.00 4.48 0.00 1.82 1.00 2.21 70.00 4.24
ENT 2.62 1.00 2.39 59.00 3.77 57.00 57.00 48.08 2.00 2.27 4.40 1.50 11.81 61.00 3.69
Respiratory 3.91 3.00 3.40 57.00 3.65 25.00 25.00 . 1.00 1.14 4.28 3.00 4.36 58.00 3.51
Other Musculoskeletal 4.05 3.00 4.35 48.00 3.07 31.67 27.50 13.69 6.00 6.82 7.12 3.00 10.55 54.00 3.27
Dental & Oral 1.60 1.00 1.49 42.00 2.69 0.00 1.60 1.00 1.49 42.00 2.54
Male anxiety-depression 8.66 9.50 5.87 34.00 2.18 60.23 58.00 25.97 22.00 25.00 28.92 15.25 30.40 56.00 3.39
Burns 6.44 2.00 6.75 9.00 0.58 0.00 6.44 2.00 6.75 9.00 0.55
Eye problems 2.67 1.00 3.57 9.00 0.58 0.00 2.67 1.00 3.57 9.00 0.55
Dermatological 3.67 3.00 4.77 9.00 0.58 41.00 41.00 . 1.00 1.14 7.40 3.00 12.63 10.00 0.61
Cardiovascular 6.13 4.25 5.62 8.00 0.51 84.75 73.50 53.66 4.00 4.55 32.33 11.00 48.00 12.00 0.73
Asthma 1.50 1.00 1.00 4.00 0.26 0.00 1.50 1.00 1.00 4.00 0.24
Genito-gynae 3.00 3.00 1.83 4.00 0.26 54.00 54.00 . 1.00 1.14 13.20 4.00 22.86 5.00 0.30
Infectious 9.00 8.00 4.24 4.00 0.26 0.00 9.00 8.00 4.24 4.00 0.24
Nervous Disorders 9.00 9.00 6.73 4.00 0.26 102.00 102.00 . 1.00 1.14 27.60 11.00 42.00 5.00 0.30
Cancer 15.00 15.00 . 1.00 0.06 31.00 31.00 . 1.00 1.14 23.00 23.00 11.31 2.00 0.12
Blood Disorders 1.00 1.00 . 1.00 0.06 23.00 23.00 . 1.00 1.14 12.00 12.00 15.56 2.00 0.12
Substance Abuse 5.00 5.00 . 1.00 0.06 0.00 5.00 5.00 . 1.00 0.06
Total 2.94 2.00 3.19 1563.00 100.00 49.10 40.00 28.47 88.00 100.00 5.40 2.00 12.65 1651.00 100.00
Total anxiety-depression 7.57 5.50 6.15 132.00 3.04 56.85 46.00 47.86 61.00 30.05 23.15 12.00 35.63 193.00 4.25
Back Problems 4.51 3.00 4.55 175.00 4.03 47.10 40.00 20.97 21.00 10.34 9.07 3.00 15.43 196.00 4.31
Other Musculoskeletal 4.22 3.00 4.68 119.00 2.74 40.75 28.00 23.74 12.00 5.91 7.57 3.00 13.39 131.00 2.88
Influenza 2.41 2.00 1.80 954.00 21.97 0.00 2.41 2.00 1.80 954.00 20.99
Asthma 3.28 2.00 3.00 23.00 0.53 0.00 3.28 2.00 3.00 23.00 0.51
Respiratory 4.27 3.00 3.51 180.00 4.14 44.00 44.00 20.80 5.00 2.46 5.34 3.50 7.94 185.00 4.07
Headache 1.55 1.00 1.71 252.00 5.80 33.00 33.00 . 1.00 0.49 1.67 1.00 2.61 253.00 5.57
Cancer 3.00 2.00 4.33 34.00 0.78 79.67 65.00 56.52 9.00 4.43 19.05 2.00 40.24 43.00 0.95
Blood Disorders 2.50 2.00 1.76 6.00 0.14 22.50 22.50 0.71 2.00 0.99 7.50 3.50 9.38 8.00 0.18
Cardiovascular 4.21 2.00 4.20 19.00 0.44 85.83 73.50 56.74 6.00 2.96 23.80 4.00 44.16 25.00 0.55
Burns 4.73 2.00 5.59 15.00 0.35 42.00 42.00 . 1.00 0.49 7.06 2.00 10.77 16.00 0.35
ENT 3.01 2.00 2.96 225.00 5.18 44.60 23.00 31.85 5.00 2.46 3.92 2.00 7.95 230.00 5.06
Dental & Oral 1.90 1.00 2.48 92.00 2.12 24.00 24.00 . 1.00 0.49 2.14 1.00 3.37 93.00 2.05
Eye problems 2.49 2.00 2.32 42.00 0.97 0.00 2.49 2.00 2.32 42.00 0.92
Endocrine 5.00 5.00 5.66 2.00 0.49 0.00 5.00 5.00 5.66 2.00 0.04
Gastrointestinal 1.96 1.00 1.87 1041.00 253.90 37.31 24.00 20.48 13.00 6.40 2.39 1.00 4.84 1054.00 23.19
116
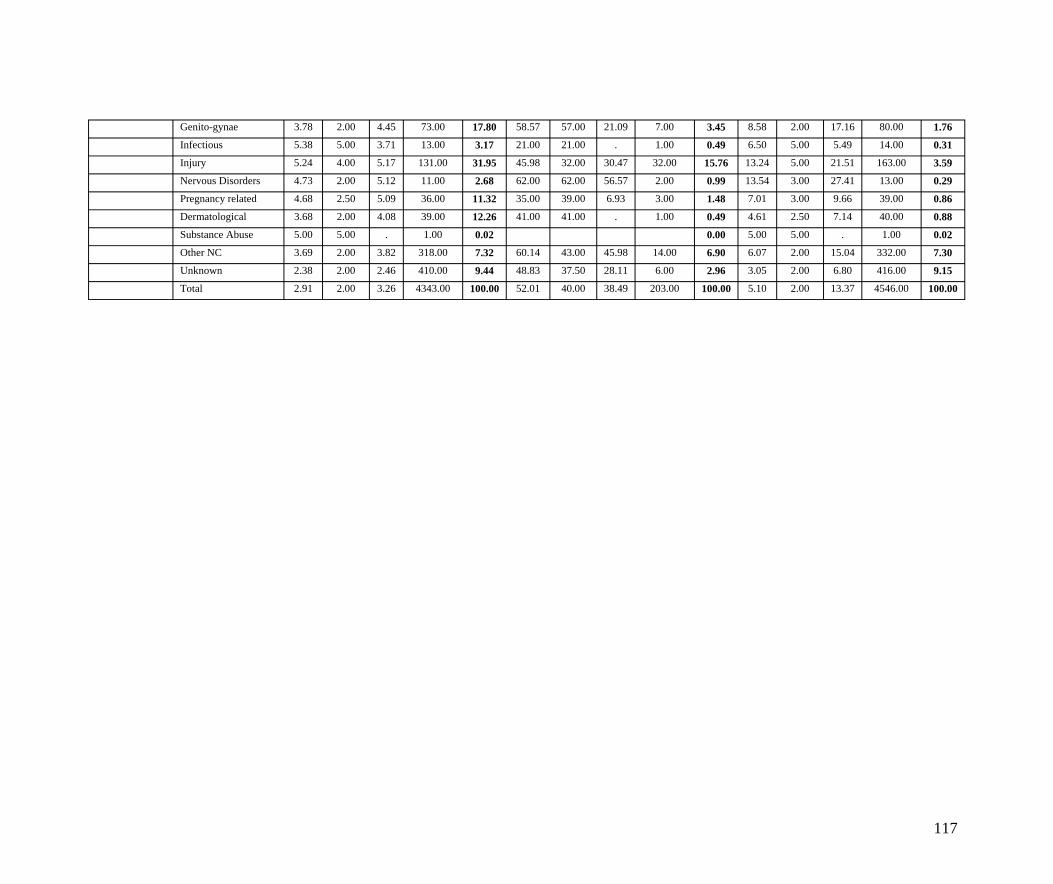
Genito-gynae 3.78 2.00 4.45 73.00 17.80 58.57 57.00 21.09 7.00 3.45 8.58 2.00 17.16 80.00 1.76
Infectious 5.38 5.00 3.71 13.00 3.17 21.00 21.00 . 1.00 0.49 6.50 5.00 5.49 14.00 0.31
Injury 5.24 4.00 5.17 131.00 31.95 45.98 32.00 30.47 32.00 15.76 13.24 5.00 21.51 163.00 3.59
Nervous Disorders 4.73 2.00 5.12 11.00 2.68 62.00 62.00 56.57 2.00 0.99 13.54 3.00 27.41 13.00 0.29
Pregnancy related 4.68 2.50 5.09 36.00 11.32 35.00 39.00 6.93 3.00 1.48 7.01 3.00 9.66 39.00 0.86
Dermatological 3.68 2.00 4.08 39.00 12.26 41.00 41.00 . 1.00 0.49 4.61 2.50 7.14 40.00 0.88
Substance Abuse 5.00 5.00 . 1.00 0.02 0.00 5.00 5.00 . 1.00 0.02
Other NC 3.69 2.00 3.82 318.00 7.32 60.14 43.00 45.98 14.00 6.90 6.07 2.00 15.04 332.00 7.30
Unknown 2.38 2.00 2.46 410.00 9.44 48.83 37.50 28.11 6.00 2.96 3.05 2.00 6.80 416.00 9.15
Total 2.91 2.00 3.26 4343.00 100.00 52.01 40.00 38.49 203.00 100.00 5.10 2.00 13.37 4546.00 100.00
117
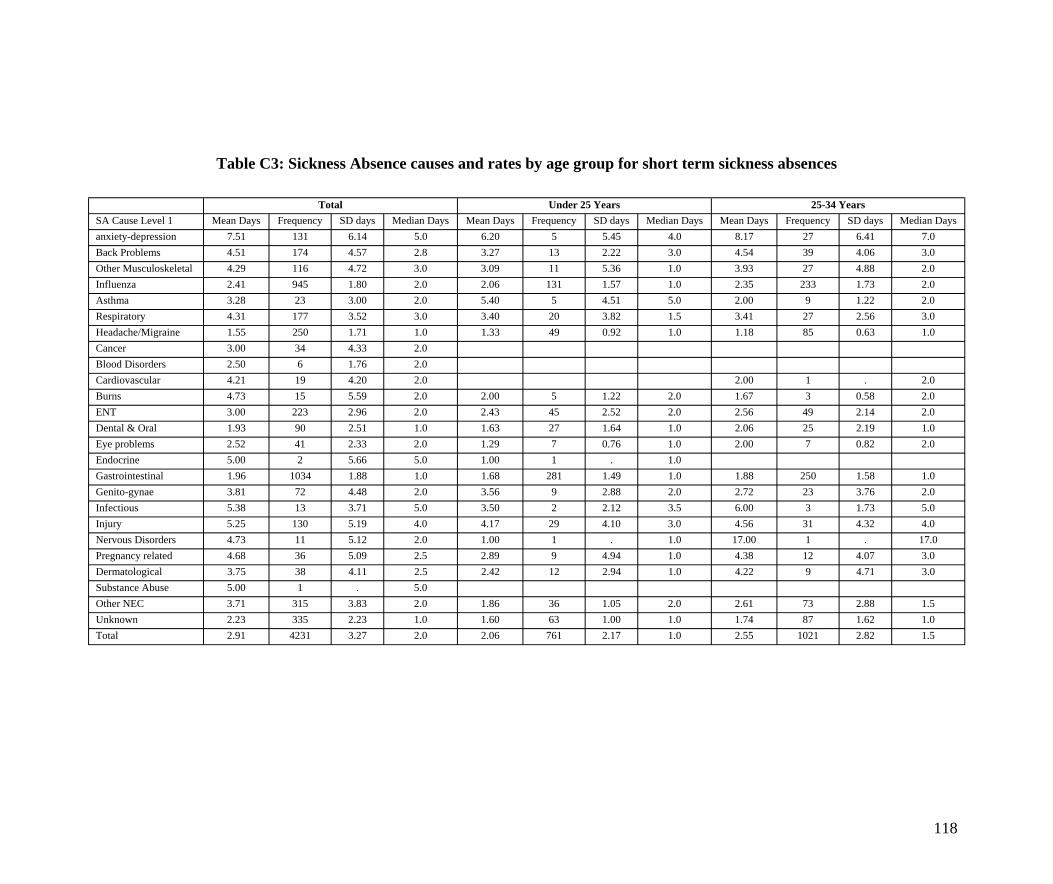
Table C3: Sickness Absence causes and rates by age group for short term sickness absences
Total Under 25 Years 25-34 Years SA Cause Level 1 Mean Days Frequency SD days Median Days Mean Days Frequency SD days Median Days Mean Days Frequency SD days Median Days anxiety-depression 7.51 131 6.14 5.0 6.20 5 5.45 4.0 8.17 27 6.41 7.0 Back Problems 4.51 174 4.57 2.8 3.27 13 2.22 3.0 4.54 39 4.06 3.0 Other Musculoskeletal 4.29 116 4.72 3.0 3.09 11 5.36 1.0 3.93 27 4.88 2.0 Influenza 2.41 945 1.80 2.0 2.06 131 1.57 1.0 2.35 233 1.73 2.0 Asthma 3.28 23 3.00 2.0 5.40 5 4.51 5.0 2.00 9 1.22 2.0 Respiratory 4.31 177 3.52 3.0 3.40 20 3.82 1.5 3.41 27 2.56 3.0 Headache/Migraine 1.55 250 1.71 1.0 1.33 49 0.92 1.0 1.18 85 0.63 1.0 Cancer 3.00 34 4.33 2.0 Blood Disorders 2.50 6 1.76 2.0 Cardiovascular 4.21 19 4.20 2.0 2.00 1 . 2.0 Burns 4.73 15 5.59 2.0 2.00 5 1.22 2.0 1.67 3 0.58 2.0 ENT 3.00 223 2.96 2.0 2.43 45 2.52 2.0 2.56 49 2.14 2.0 Dental & Oral 1.93 90 2.51 1.0 1.63 27 1.64 1.0 2.06 25 2.19 1.0 Eye problems 2.52 41 2.33 2.0 1.29 7 0.76 1.0 2.00 7 0.82 2.0 Endocrine 5.00 2 5.66 5.0 1.00 1 . 1.0 Gastrointestinal 1.96 1034 1.88 1.0 1.68 281 1.49 1.0 1.88 250 1.58 1.0 Genito-gynae 3.81 72 4.48 2.0 3.56 9 2.88 2.0 2.72 23 3.76 2.0 Infectious 5.38 13 3.71 5.0 3.50 2 2.12 3.5 6.00 3 1.73 5.0 Injury 5.25 130 5.19 4.0 4.17 29 4.10 3.0 4.56 31 4.32 4.0 Nervous Disorders 4.73 11 5.12 2.0 1.00 1 . 1.0 17.00 1 . 17.0 Pregnancy related 4.68 36 5.09 2.5 2.89 9 4.94 1.0 4.38 12 4.07 3.0 Dermatological 3.75 38 4.11 2.5 2.42 12 2.94 1.0 4.22 9 4.71 3.0 Substance Abuse 5.00 1 . 5.0 Other NEC 3.71 315 3.83 2.0 1.86 36 1.05 2.0 2.61 73 2.88 1.5 Unknown 2.23 335 2.23 1.0 1.60 63 1.00 1.0 1.74 87 1.62 1.0 Total 2.91 4231 3.27 2.0 2.06 761 2.17 1.0 2.55 1021 2.82 1.5
118
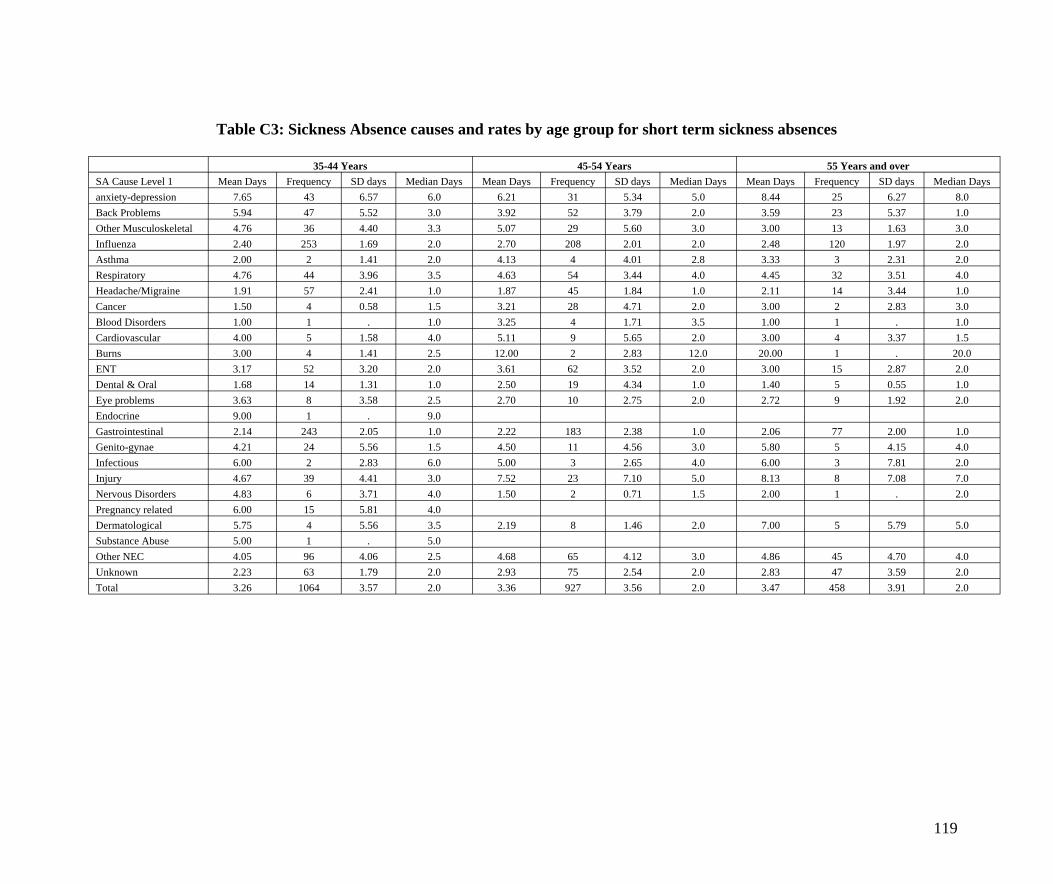
Table C3: Sickness Absence causes and rates by age group for short term sickness absences
35-44 Years 45-54 Years 55 Years and over SA Cause Level 1 Mean Days Frequency SD days Median Days Mean Days Frequency SD days Median Days Mean Days Frequency SD days Median Days anxiety-depression 7.65 43 6.57 6.0 6.21 31 5.34 5.0 8.44 25 6.27 8.0 Back Problems 5.94 47 5.52 3.0 3.92 52 3.79 2.0 3.59 23 5.37 1.0 Other Musculoskeletal 4.76 36 4.40 3.3 5.07 29 5.60 3.0 3.00 13 1.63 3.0 Influenza 2.40 253 1.69 2.0 2.70 208 2.01 2.0 2.48 120 1.97 2.0 Asthma 2.00 2 1.41 2.0 4.13 4 4.01 2.8 3.33 3 2.31 2.0 Respiratory 4.76 44 3.96 3.5 4.63 54 3.44 4.0 4.45 32 3.51 4.0 Headache/Migraine 1.91 57 2.41 1.0 1.87 45 1.84 1.0 2.11 14 3.44 1.0 Cancer 1.50 4 0.58 1.5 3.21 28 4.71 2.0 3.00 2 2.83 3.0 Blood Disorders 1.00 1 . 1.0 3.25 4 1.71 3.5 1.00 1 . 1.0 Cardiovascular 4.00 5 1.58 4.0 5.11 9 5.65 2.0 3.00 4 3.37 1.5 Burns 3.00 4 1.41 2.5 12.00 2 2.83 12.0 20.00 1 . 20.0 ENT 3.17 52 3.20 2.0 3.61 62 3.52 2.0 3.00 15 2.87 2.0 Dental & Oral 1.68 14 1.31 1.0 2.50 19 4.34 1.0 1.40 5 0.55 1.0 Eye problems 3.63 8 3.58 2.5 2.70 10 2.75 2.0 2.72 9 1.92 2.0 Endocrine 9.00 1 . 9.0 Gastrointestinal 2.14 243 2.05 1.0 2.22 183 2.38 1.0 2.06 77 2.00 1.0 Genito-gynae 4.21 24 5.56 1.5 4.50 11 4.56 3.0 5.80 5 4.15 4.0 Infectious 6.00 2 2.83 6.0 5.00 3 2.65 4.0 6.00 3 7.81 2.0 Injury 4.67 39 4.41 3.0 7.52 23 7.10 5.0 8.13 8 7.08 7.0 Nervous Disorders 4.83 6 3.71 4.0 1.50 2 0.71 1.5 2.00 1 . 2.0 Pregnancy related 6.00 15 5.81 4.0 Dermatological 5.75 4 5.56 3.5 2.19 8 1.46 2.0 7.00 5 5.79 5.0 Substance Abuse 5.00 1 . 5.0 Other NEC 4.05 96 4.06 2.5 4.68 65 4.12 3.0 4.86 45 4.70 4.0 Unknown 2.23 63 1.79 2.0 2.93 75 2.54 2.0 2.83 47 3.59 2.0 Total 3.26 1064 3.57 2.0 3.36 927 3.56 2.0 3.47 458 3.91 2.0
119
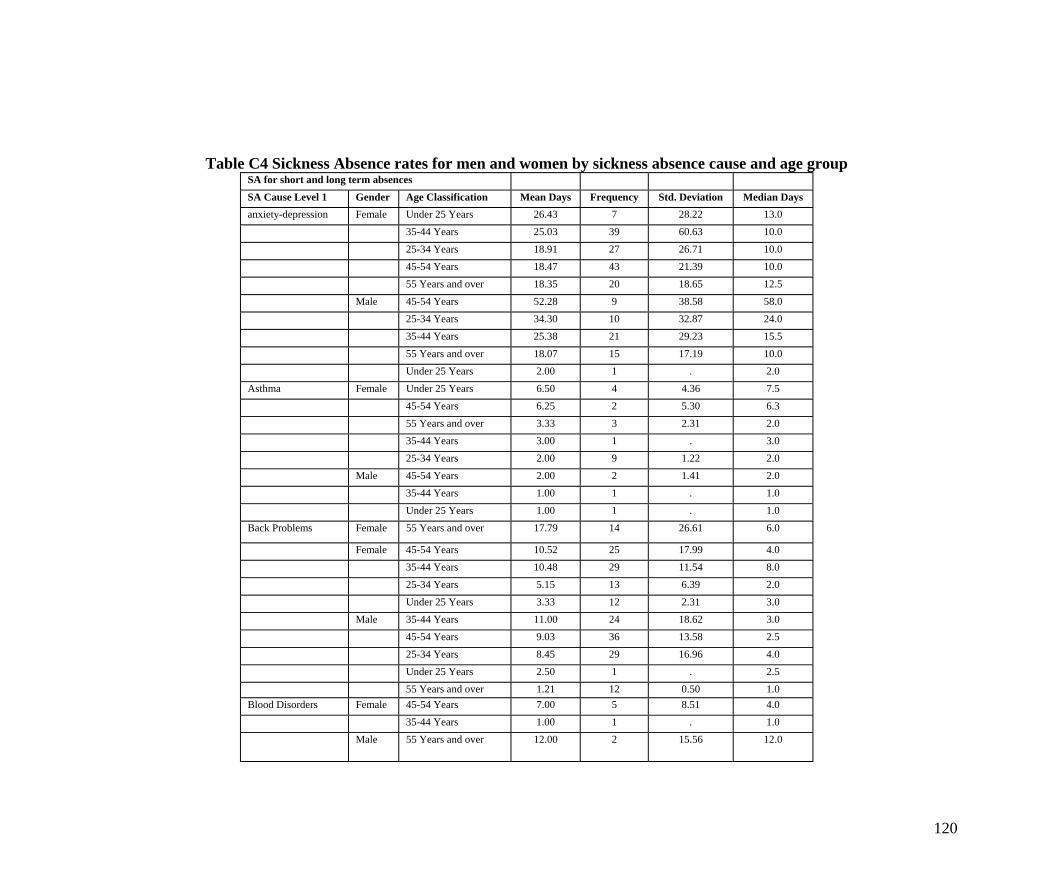
Table C4 Sickness Absence rates for men and women by sickness absence cause and age group SA for short and long term absences
SA Cause Level 1 Gender Age Classification Mean Days Frequency Std. Deviation Median Days anxiety-depression Female Under 25 Years 26.43 7 28.22 13.0
35-44 Years 25.03 39 60.63 10.0
25-34 Years 18.91 27 26.71 10.0 45-54 Years 18.47 43 21.39 10.0 55 Years and over 18.35 20 18.65 12.5
Male 45-54 Years 52.28 9 38.58 58.0 25-34 Years 34.30 10 32.87 24.0 35-44 Years 25.38 21 29.23 15.5
55 Years and over 18.07 15 17.19 10.0 Under 25 Years 2.00 1 . 2.0
Asthma Female Under 25 Years 6.50 4 4.36 7.5
45-54 Years 6.25 2 5.30 6.3 55 Years and over 3.33 3 2.31 2.0 35-44 Years 3.00 1 . 3.0
25-34 Years 2.00 9 1.22 2.0 Male 45-54 Years 2.00 2 1.41 2.0
35-44 Years 1.00 1 . 1.0
Under 25 Years 1.00 1 . 1.0 Back Problems Female 55 Years and over 17.79 14 26.61 6.0
Female 45-54 Years 10.52 25 17.99 4.0 35-44 Years 10.48 29 11.54 8.0 25-34 Years 5.15 13 6.39 2.0
Under 25 Years 3.33 12 2.31 3.0 Male 35-44 Years 11.00 24 18.62 3.0
45-54 Years 9.03 36 13.58 2.5
25-34 Years 8.45 29 16.96 4.0 Under 25 Years 2.50 1 . 2.5 55 Years and over 1.21 12 0.50 1.0
Blood Disorders Female 45-54 Years 7.00 5 8.51 4.0 35-44 Years 1.00 1 . 1.0
Male 55 Years and over 12.00 2 15.56 12.0
120
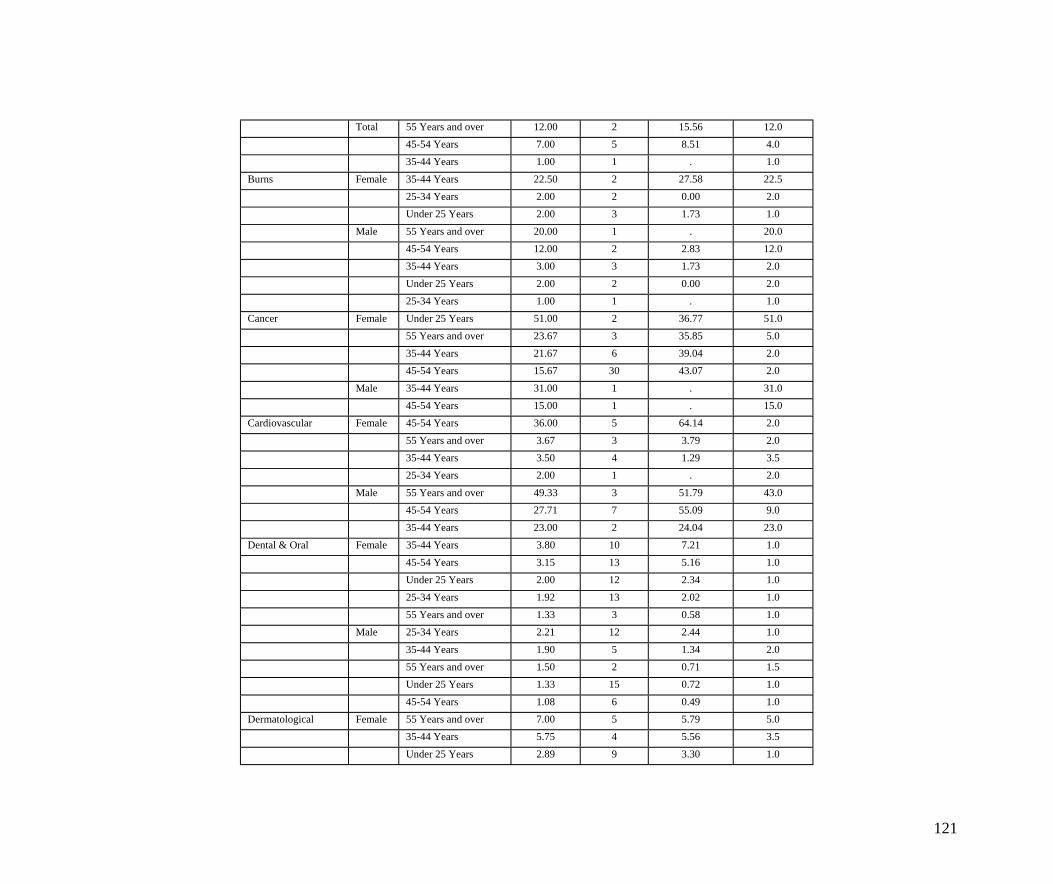
Total 55 Years and over 12.00 2 15.56 12.0 45-54 Years 7.00 5 8.51 4.0 35-44 Years 1.00 1 . 1.0
Burns Female 35-44 Years 22.50 2 27.58 22.5 25-34 Years 2.00 2 0.00 2.0 Under 25 Years 2.00 3 1.73 1.0
Male 55 Years and over 20.00 1 . 20.0 45-54 Years 12.00 2 2.83 12.0 35-44 Years 3.00 3 1.73 2.0
Under 25 Years 2.00 2 0.00 2.0 25-34 Years 1.00 1 . 1.0
Cancer Female Under 25 Years 51.00 2 36.77 51.0
55 Years and over 23.67 3 35.85 5.0 35-44 Years 21.67 6 39.04 2.0 45-54 Years 15.67 30 43.07 2.0
Male 35-44 Years 31.00 1 . 31.0 45-54 Years 15.00 1 . 15.0
Cardiovascular Female 45-54 Years 36.00 5 64.14 2.0
55 Years and over 3.67 3 3.79 2.0 35-44 Years 3.50 4 1.29 3.5 25-34 Years 2.00 1 . 2.0
Male 55 Years and over 49.33 3 51.79 43.0 45-54 Years 27.71 7 55.09 9.0 35-44 Years 23.00 2 24.04 23.0
Dental & Oral Female 35-44 Years 3.80 10 7.21 1.0 45-54 Years 3.15 13 5.16 1.0 Under 25 Years 2.00 12 2.34 1.0
25-34 Years 1.92 13 2.02 1.0 55 Years and over 1.33 3 0.58 1.0
Male 25-34 Years 2.21 12 2.44 1.0
35-44 Years 1.90 5 1.34 2.0 55 Years and over 1.50 2 0.71 1.5 Under 25 Years 1.33 15 0.72 1.0
45-54 Years 1.08 6 0.49 1.0 Dermatological Female 55 Years and over 7.00 5 5.79 5.0
35-44 Years 5.75 4 5.56 3.5
Under 25 Years 2.89 9 3.30 1.0
121
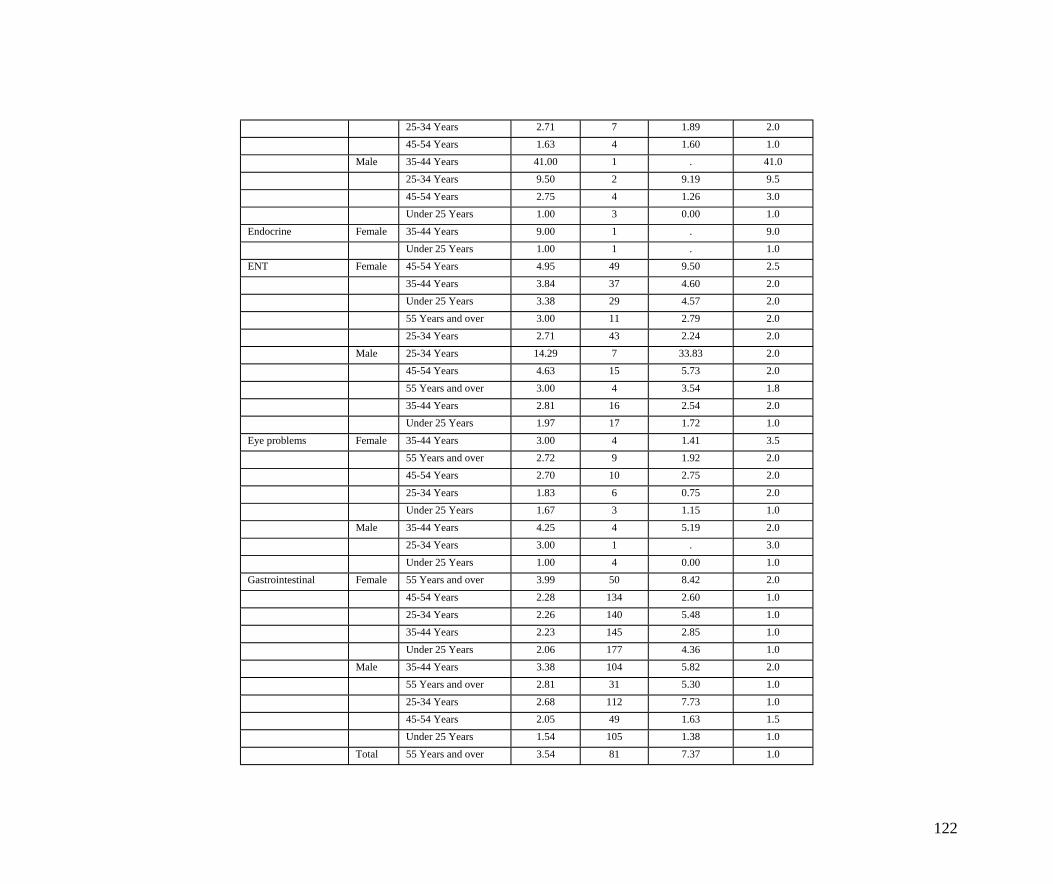
25-34 Years 2.71 7 1.89 2.0 45-54 Years 1.63 4 1.60 1.0
Male 35-44 Years 41.00 1 . 41.0
25-34 Years 9.50 2 9.19 9.5 45-54 Years 2.75 4 1.26 3.0 Under 25 Years 1.00 3 0.00 1.0
Endocrine Female 35-44 Years 9.00 1 . 9.0 Under 25 Years 1.00 1 . 1.0
ENT Female 45-54 Years 4.95 49 9.50 2.5
35-44 Years 3.84 37 4.60 2.0 Under 25 Years 3.38 29 4.57 2.0 55 Years and over 3.00 11 2.79 2.0
25-34 Years 2.71 43 2.24 2.0 Male 25-34 Years 14.29 7 33.83 2.0
45-54 Years 4.63 15 5.73 2.0
55 Years and over 3.00 4 3.54 1.8 35-44 Years 2.81 16 2.54 2.0 Under 25 Years 1.97 17 1.72 1.0
Eye problems Female 35-44 Years 3.00 4 1.41 3.5 55 Years and over 2.72 9 1.92 2.0 45-54 Years 2.70 10 2.75 2.0
25-34 Years 1.83 6 0.75 2.0 Under 25 Years 1.67 3 1.15 1.0
Male 35-44 Years 4.25 4 5.19 2.0
25-34 Years 3.00 1 . 3.0 Under 25 Years 1.00 4 0.00 1.0
Gastrointestinal Female 55 Years and over 3.99 50 8.42 2.0
45-54 Years 2.28 134 2.60 1.0 25-34 Years 2.26 140 5.48 1.0 35-44 Years 2.23 145 2.85 1.0
Under 25 Years 2.06 177 4.36 1.0 Male 35-44 Years 3.38 104 5.82 2.0
55 Years and over 2.81 31 5.30 1.0
25-34 Years 2.68 112 7.73 1.0 45-54 Years 2.05 49 1.63 1.5 Under 25 Years 1.54 105 1.38 1.0
Total 55 Years and over 3.54 81 7.37 1.0
122
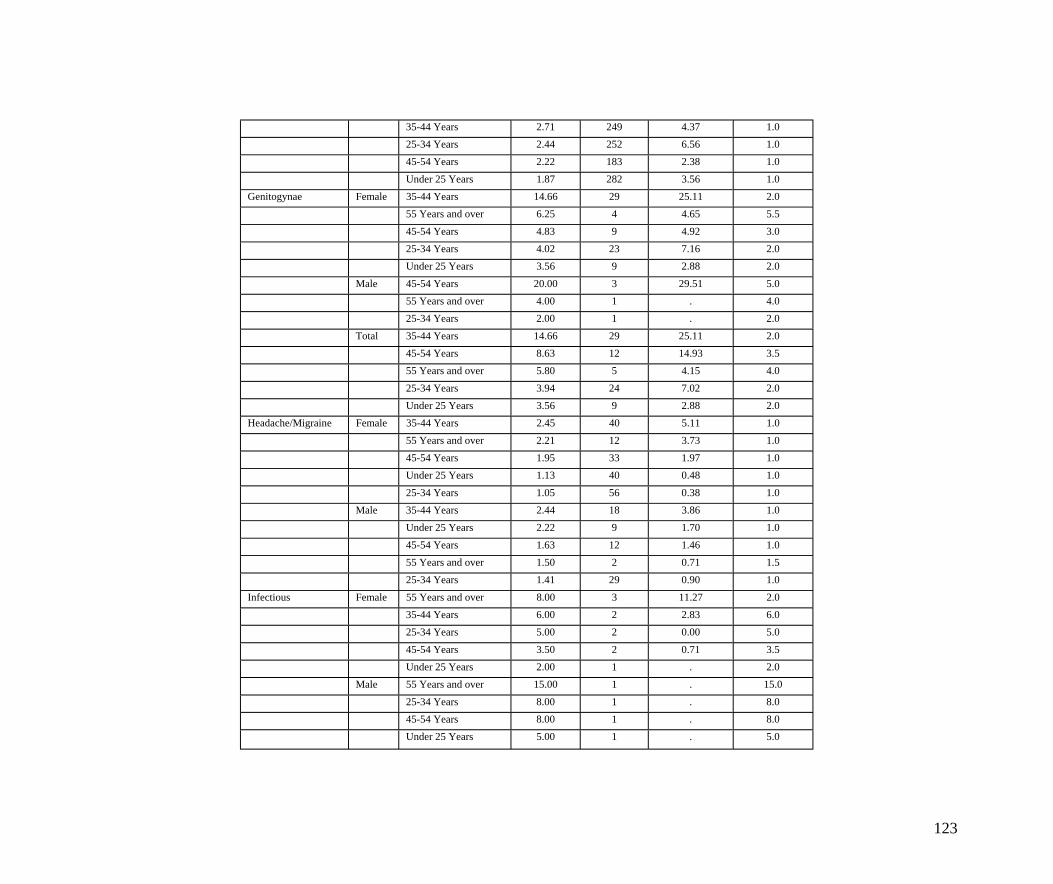
35-44 Years 2.71 249 4.37 1.0 25-34 Years 2.44 252 6.56 1.0 45-54 Years 2.22 183 2.38 1.0
Under 25 Years 1.87 282 3.56 1.0 Genitogynae Female 35-44 Years 14.66 29 25.11 2.0
55 Years and over 6.25 4 4.65 5.5
45-54 Years 4.83 9 4.92 3.0 25-34 Years 4.02 23 7.16 2.0 Under 25 Years 3.56 9 2.88 2.0
Male 45-54 Years 20.00 3 29.51 5.0 55 Years and over 4.00 1 . 4.0 25-34 Years 2.00 1 . 2.0
Total 35-44 Years 14.66 29 25.11 2.0 45-54 Years 8.63 12 14.93 3.5 55 Years and over 5.80 5 4.15 4.0
25-34 Years 3.94 24 7.02 2.0 Under 25 Years 3.56 9 2.88 2.0
Headache/Migraine Female 35-44 Years 2.45 40 5.11 1.0
55 Years and over 2.21 12 3.73 1.0 45-54 Years 1.95 33 1.97 1.0 Under 25 Years 1.13 40 0.48 1.0
25-34 Years 1.05 56 0.38 1.0 Male 35-44 Years 2.44 18 3.86 1.0
Under 25 Years 2.22 9 1.70 1.0
45-54 Years 1.63 12 1.46 1.0 55 Years and over 1.50 2 0.71 1.5 25-34 Years 1.41 29 0.90 1.0
Infectious Female 55 Years and over 8.00 3 11.27 2.0 35-44 Years 6.00 2 2.83 6.0 25-34 Years 5.00 2 0.00 5.0
45-54 Years 3.50 2 0.71 3.5 Under 25 Years 2.00 1 . 2.0
Male 55 Years and over 15.00 1 . 15.0
25-34 Years 8.00 1 . 8.0 45-54 Years 8.00 1 . 8.0 Under 25 Years 5.00 1 . 5.0
123
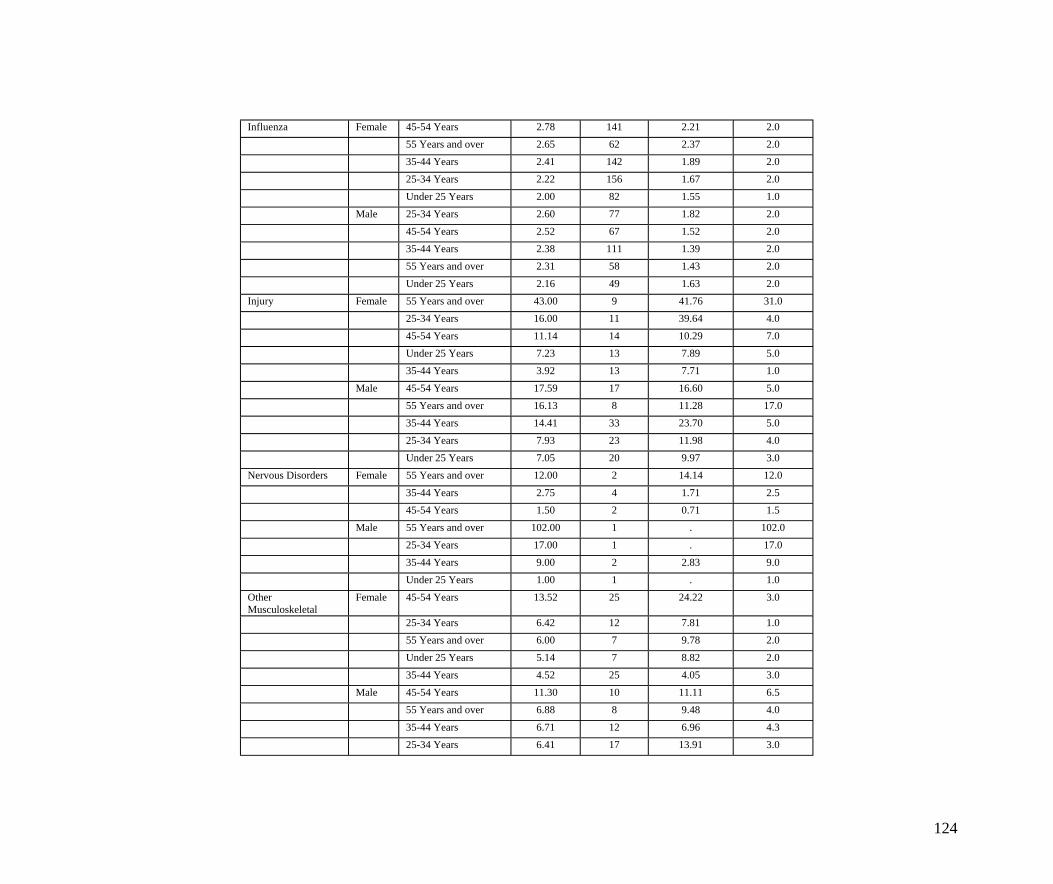
Influenza Female 45-54 Years 2.78 141 2.21 2.0 55 Years and over 2.65 62 2.37 2.0 35-44 Years 2.41 142 1.89 2.0
25-34 Years 2.22 156 1.67 2.0 Under 25 Years 2.00 82 1.55 1.0
Male 25-34 Years 2.60 77 1.82 2.0
45-54 Years 2.52 67 1.52 2.0 35-44 Years 2.38 111 1.39 2.0 55 Years and over 2.31 58 1.43 2.0
Under 25 Years 2.16 49 1.63 2.0 Injury Female 55 Years and over 43.00 9 41.76 31.0
25-34 Years 16.00 11 39.64 4.0
45-54 Years 11.14 14 10.29 7.0 Under 25 Years 7.23 13 7.89 5.0 35-44 Years 3.92 13 7.71 1.0
Male 45-54 Years 17.59 17 16.60 5.0 55 Years and over 16.13 8 11.28 17.0 35-44 Years 14.41 33 23.70 5.0
25-34 Years 7.93 23 11.98 4.0 Under 25 Years 7.05 20 9.97 3.0
Nervous Disorders Female 55 Years and over 12.00 2 14.14 12.0
35-44 Years 2.75 4 1.71 2.5 45-54 Years 1.50 2 0.71 1.5
Male 55 Years and over 102.00 1 . 102.0
25-34 Years 17.00 1 . 17.0 35-44 Years 9.00 2 2.83 9.0 Under 25 Years 1.00 1 . 1.0
Other Musculoskeletal
Female 45-54 Years 13.52 25 24.22 3.0
25-34 Years 6.42 12 7.81 1.0 55 Years and over 6.00 7 9.78 2.0 Under 25 Years 5.14 7 8.82 2.0
35-44 Years 4.52 25 4.05 3.0 Male 45-54 Years 11.30 10 11.11 6.5
55 Years and over 6.88 8 9.48 4.0
35-44 Years 6.71 12 6.96 4.3 25-34 Years 6.41 17 13.91 3.0
124
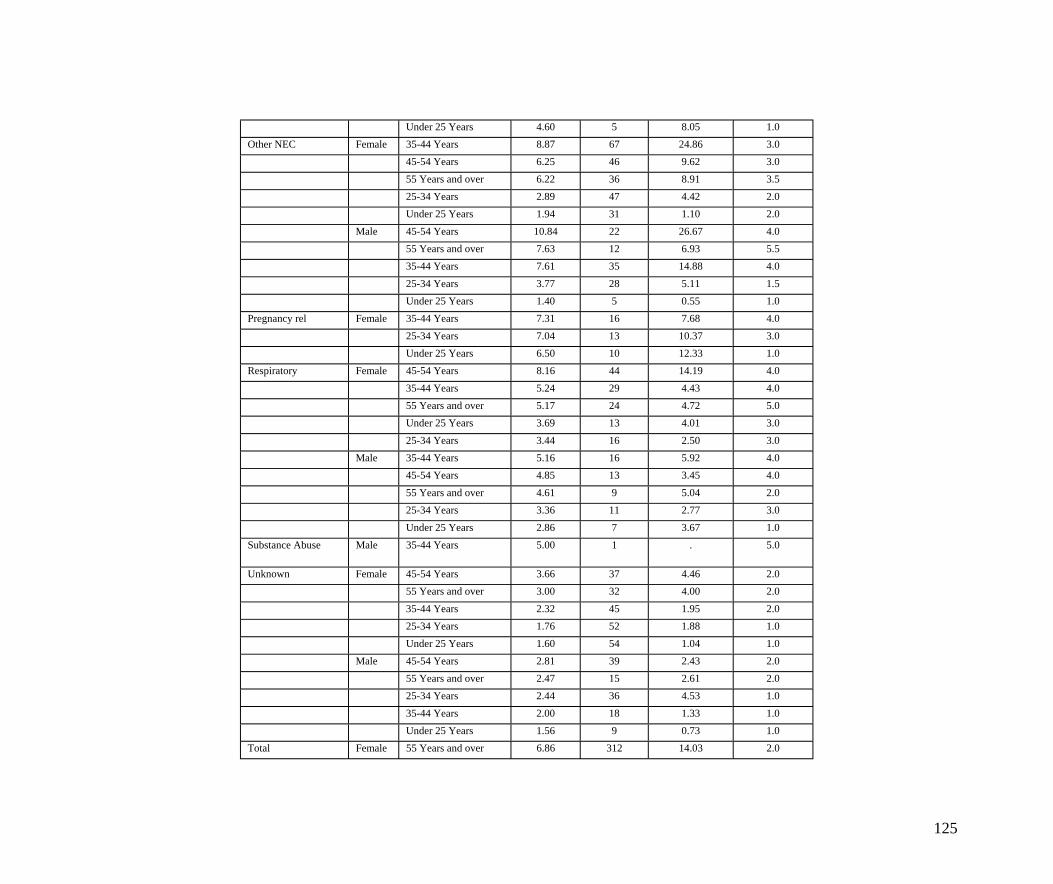
Under 25 Years 4.60 5 8.05 1.0 Other NEC Female 35-44 Years 8.87 67 24.86 3.0
45-54 Years 6.25 46 9.62 3.0
55 Years and over 6.22 36 8.91 3.5 25-34 Years 2.89 47 4.42 2.0 Under 25 Years 1.94 31 1.10 2.0
Male 45-54 Years 10.84 22 26.67 4.0 55 Years and over 7.63 12 6.93 5.5 35-44 Years 7.61 35 14.88 4.0
25-34 Years 3.77 28 5.11 1.5 Under 25 Years 1.40 5 0.55 1.0
Pregnancy rel Female 35-44 Years 7.31 16 7.68 4.0
25-34 Years 7.04 13 10.37 3.0 Under 25 Years 6.50 10 12.33 1.0
Respiratory Female 45-54 Years 8.16 44 14.19 4.0
35-44 Years 5.24 29 4.43 4.0 55 Years and over 5.17 24 4.72 5.0 Under 25 Years 3.69 13 4.01 3.0
25-34 Years 3.44 16 2.50 3.0 Male 35-44 Years 5.16 16 5.92 4.0
45-54 Years 4.85 13 3.45 4.0
55 Years and over 4.61 9 5.04 2.0 25-34 Years 3.36 11 2.77 3.0 Under 25 Years 2.86 7 3.67 1.0
Substance Abuse Male 35-44 Years 5.00 1 . 5.0
Unknown Female 45-54 Years 3.66 37 4.46 2.0 55 Years and over 3.00 32 4.00 2.0
35-44 Years 2.32 45 1.95 2.0 25-34 Years 1.76 52 1.88 1.0 Under 25 Years 1.60 54 1.04 1.0
Male 45-54 Years 2.81 39 2.43 2.0 55 Years and over 2.47 15 2.61 2.0 25-34 Years 2.44 36 4.53 1.0
35-44 Years 2.00 18 1.33 1.0 Under 25 Years 1.56 9 0.73 1.0
Total Female 55 Years and over 6.86 312 14.03 2.0
125
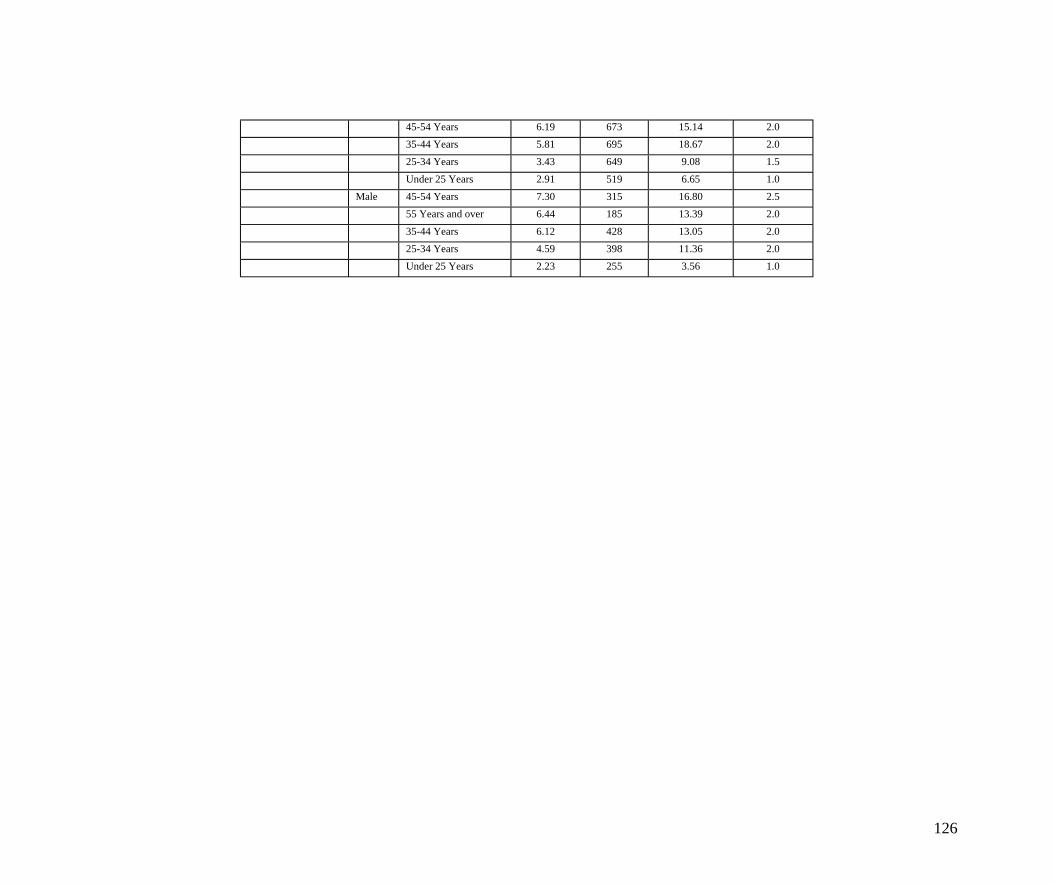
45-54 Years 6.19 673 15.14 2.0 35-44 Years 5.81 695 18.67 2.0 25-34 Years 3.43 649 9.08 1.5
Under 25 Years 2.91 519 6.65 1.0 Male 45-54 Years 7.30 315 16.80 2.5
55 Years and over 6.44 185 13.39 2.0
35-44 Years 6.12 428 13.05 2.0 25-34 Years 4.59 398 11.36 2.0 Under 25 Years 2.23 255 3.56 1.0
126
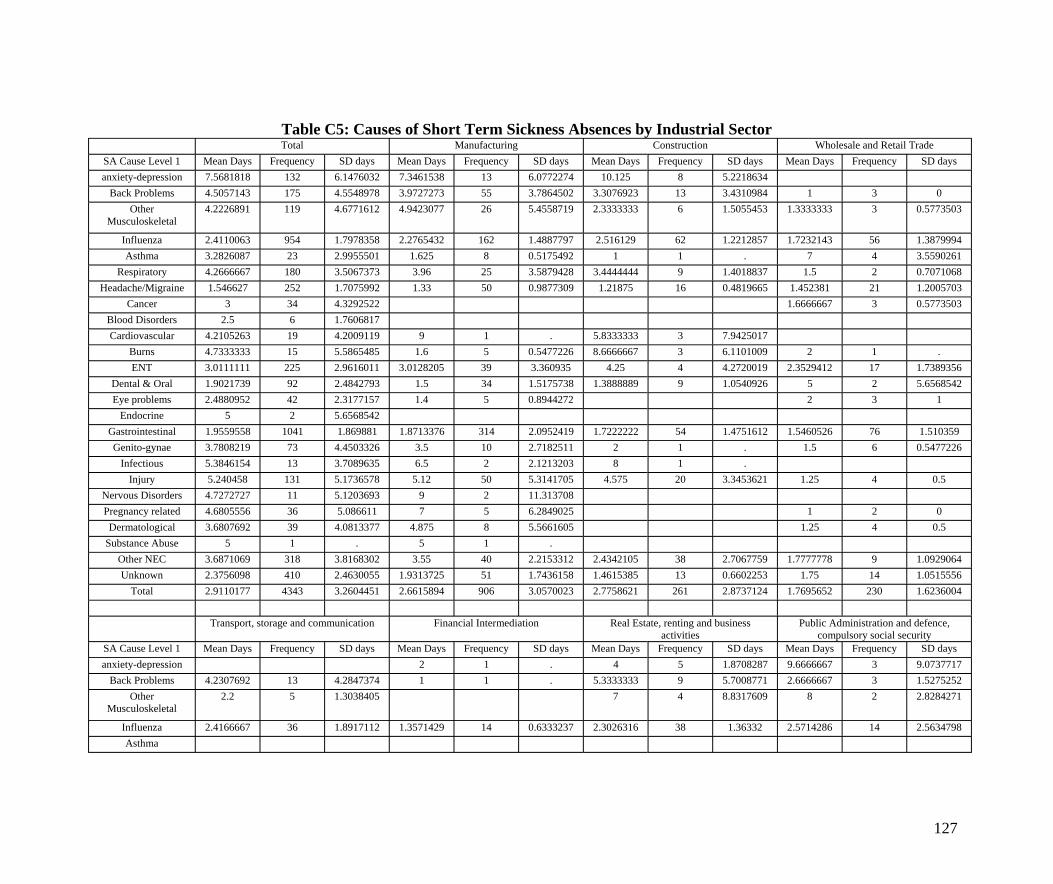
Table C5: Causes of Short Term Sickness Absences by Industrial Sector Total Manufacturing Construction Wholesale and Retail Trade
SA Cause Level 1 Mean Days Frequency SD days Mean Days Frequency SD days Mean Days Frequency SD days Mean Days Frequency SD days anxiety-depression 7.5681818 132 6.1476032 7.3461538 13 6.0772274 10.125 8 5.2218634
Back Problems 4.5057143 175 4.5548978 3.9727273 55 3.7864502 3.3076923 13 3.4310984 1 3 0 Other
Musculoskeletal 4.2226891 119 4.6771612 4.9423077 26 5.4558719 2.3333333 6 1.5055453 1.3333333 3 0.5773503
Influenza 2.4110063 954 1.7978358 2.2765432 162 1.4887797 2.516129 62 1.2212857 1.7232143 56 1.3879994 Asthma 3.2826087 23 2.9955501 1.625 8 0.5175492 1 1 . 7 4 3.5590261
Respiratory 4.2666667 180 3.5067373 3.96 25 3.5879428 3.4444444 9 1.4018837 1.5 2 0.7071068 Headache/Migraine 1.546627 252 1.7075992 1.33 50 0.9877309 1.21875 16 0.4819665 1.452381 21 1.2005703
Cancer 3 34 4.3292522 1.6666667 3 0.5773503 Blood Disorders 2.5 6 1.7606817 Cardiovascular 4.2105263 19 4.2009119 9 1 . 5.8333333 3 7.9425017
Burns 4.7333333 15 5.5865485 1.6 5 0.5477226 8.6666667 3 6.1101009 2 1 . ENT 3.0111111 225 2.9616011 3.0128205 39 3.360935 4.25 4 4.2720019 2.3529412 17 1.7389356
Dental & Oral 1.9021739 92 2.4842793 1.5 34 1.5175738 1.3888889 9 1.0540926 5 2 5.6568542 Eye problems 2.4880952 42 2.3177157 1.4 5 0.8944272 2 3 1
Endocrine 5 2 5.6568542 Gastrointestinal 1.9559558 1041 1.869881 1.8713376 314 2.0952419 1.7222222 54 1.4751612 1.5460526 76 1.510359 Genito-gynae 3.7808219 73 4.4503326 3.5 10 2.7182511 2 1 . 1.5 6 0.5477226
Infectious 5.3846154 13 3.7089635 6.5 2 2.1213203 8 1 . Injury 5.240458 131 5.1736578 5.12 50 5.3141705 4.575 20 3.3453621 1.25 4 0.5
Nervous Disorders 4.7272727 11 5.1203693 9 2 11.313708 Pregnancy related 4.6805556 36 5.086611 7 5 6.2849025 1 2 0 Dermatological 3.6807692 39 4.0813377 4.875 8 5.5661605 1.25 4 0.5
Substance Abuse 5 1 . 5 1 . Other NEC 3.6871069 318 3.8168302 3.55 40 2.2153312 2.4342105 38 2.7067759 1.7777778 9 1.0929064 Unknown 2.3756098 410 2.4630055 1.9313725 51 1.7436158 1.4615385 13 0.6602253 1.75 14 1.0515556
Total 2.9110177 4343 3.2604451 2.6615894 906 3.0570023 2.7758621 261 2.8737124 1.7695652 230 1.6236004
Transport, storage and communication Financial Intermediation Real Estate, renting and business Public Administration and defence, activities compulsory social security
SA Cause Level 1 Mean Days Frequency SD days Mean Days Frequency SD days Mean Days Frequency SD days Mean Days Frequency SD days anxiety-depression 2 1 . 4 5 1.8708287 9.6666667 3 9.0737717
Back Problems 4.2307692 13 4.2847374 1 1 . 5.3333333 9 5.7008771 2.6666667 3 1.5275252 Other
Musculoskeletal 2.2 5 1.3038405 7 4 8.8317609 8 2 2.8284271
Influenza 2.4166667 36 1.8917112 1.3571429 14 0.6333237 2.3026316 38 1.36332 2.5714286 14 2.5634798 Asthma
127
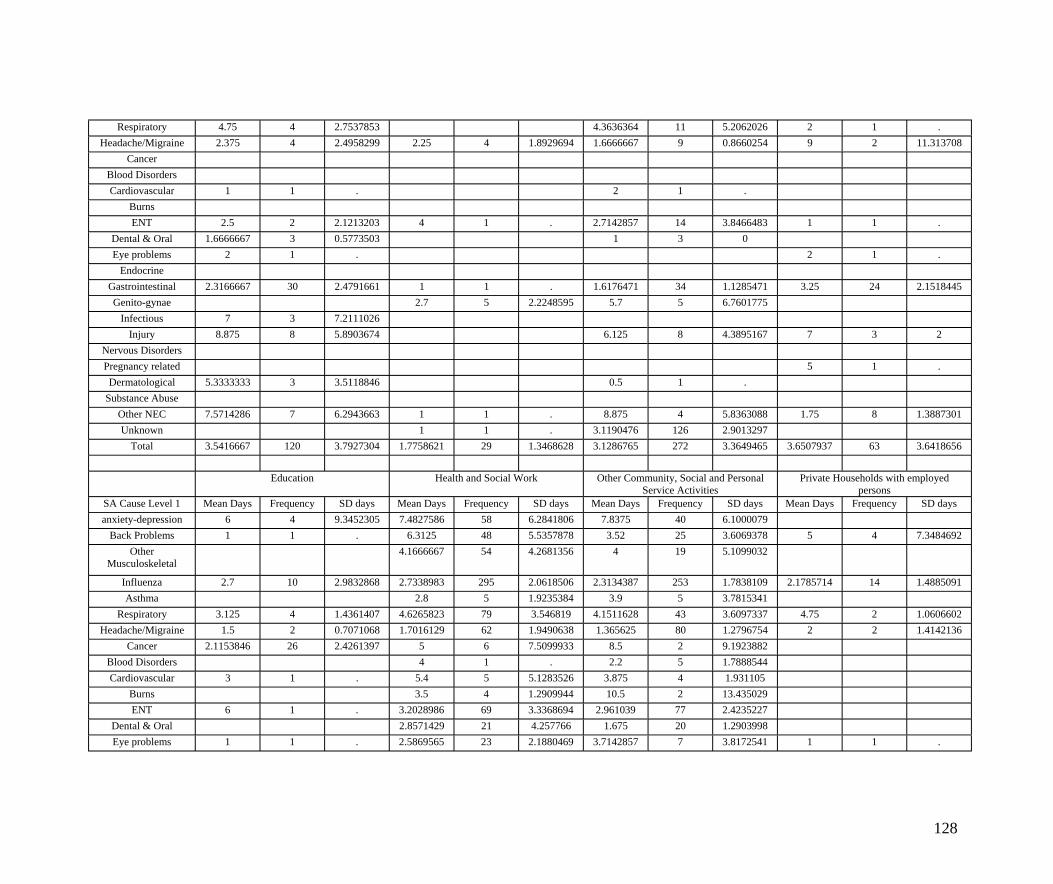
Respiratory 4.75 4 2.7537853 4.3636364 11 5.2062026 2 1 . Headache/Migraine 2.375 4 2.4958299 2.25 4 1.8929694 1.6666667 9 0.8660254 9 2 11.313708
Cancer Blood Disorders Cardiovascular 1 1 . 2 1 .
Burns ENT 2.5 2 2.1213203 4 1 . 2.7142857 14 3.8466483 1 1 .
Dental & Oral 1.6666667 3 0.5773503 1 3 0 Eye problems 2 1 . 2 1 .
Endocrine Gastrointestinal 2.3166667 30 2.4791661 1 1 . 1.6176471 34 1.1285471 3.25 24 2.1518445 Genito-gynae 2.7 5 2.2248595 5.7 5 6.7601775
Infectious 7 3 7.2111026 Injury 8.875 8 5.8903674 6.125 8 4.3895167 7 3 2
Nervous Disorders Pregnancy related 5 1 . Dermatological 5.3333333 3 3.5118846 0.5 1 .
Substance Abuse Other NEC 7.5714286 7 6.2943663 1 1 . 8.875 4 5.8363088 1.75 8 1.3887301 Unknown 1 1 . 3.1190476 126 2.9013297
Total 3.5416667 120 3.7927304 1.7758621 29 1.3468628 3.1286765 272 3.3649465 3.6507937 63 3.6418656
Education Health and Social Work Other Community, Social and Personal Private Households with employed Service Activities persons
SA Cause Level 1 Mean Days Frequency SD days Mean Days Frequency SD days Mean Days Frequency SD days Mean Days Frequency SD days anxiety-depression 6 4 9.3452305 7.4827586 58 6.2841806 7.8375 40 6.1000079
Back Problems 1 1 . 6.3125 48 5.5357878 3.52 25 3.6069378 5 4 7.3484692 Other
Musculoskeletal 4.1666667 54 4.2681356 4 19 5.1099032
Influenza 2.7 10 2.9832868 2.7338983 295 2.0618506 2.3134387 253 1.7838109 2.1785714 14 1.4885091 Asthma 2.8 5 1.9235384 3.9 5 3.7815341
Respiratory 3.125 4 1.4361407 4.6265823 79 3.546819 4.1511628 43 3.6097337 4.75 2 1.0606602 Headache/Migraine 1.5 2 0.7071068 1.7016129 62 1.9490638 1.365625 80 1.2796754 2 2 1.4142136
Cancer 2.1153846 26 2.4261397 5 6 7.5099933 8.5 2 9.1923882 Blood Disorders 4 1 . 2.2 5 1.7888544 Cardiovascular 3 1 . 5.4 5 5.1283526 3.875 4 1.931105
Burns 3.5 4 1.2909944 10.5 2 13.435029 ENT 6 1 . 3.2028986 69 3.3368694 2.961039 77 2.4235227
Dental & Oral 2.8571429 21 4.257766 1.675 20 1.2903998 Eye problems 1 1 . 2.5869565 23 2.1880469 3.7142857 7 3.8172541 1 1 .
128
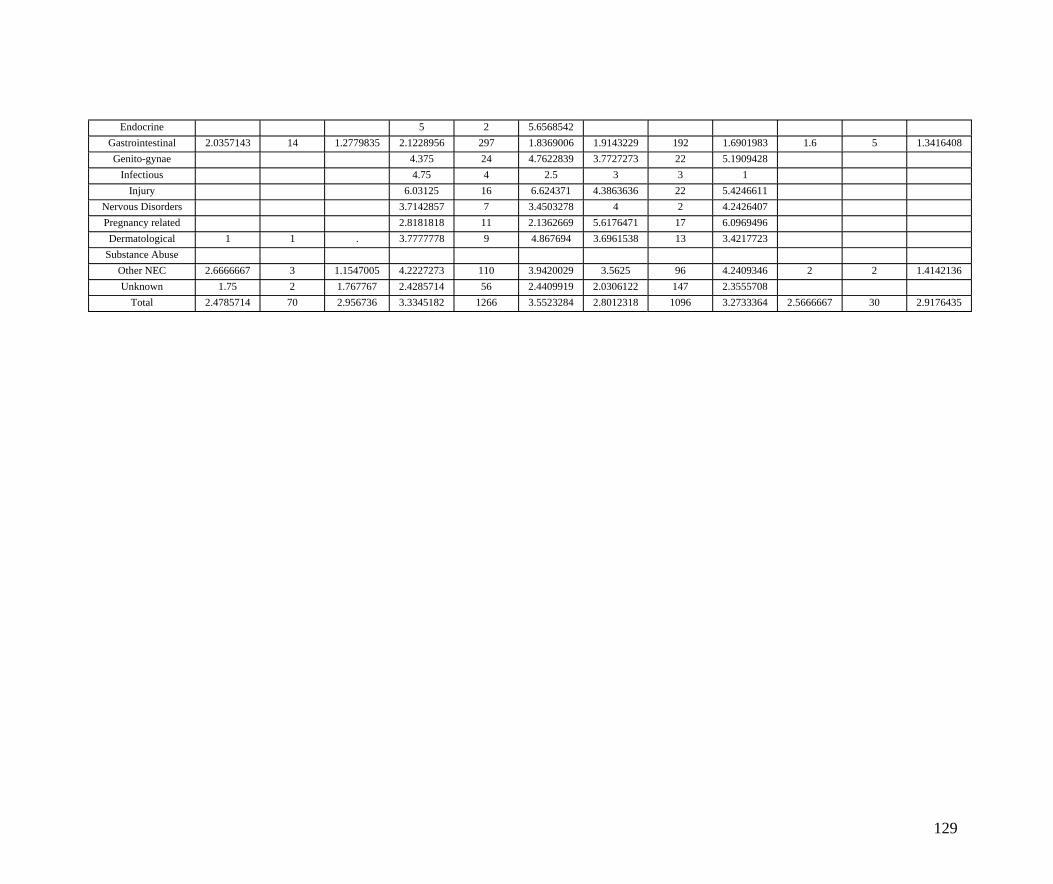
Endocrine 5 2 5.6568542 Gastrointestinal 2.0357143 14 1.2779835 2.1228956 297 1.8369006 1.9143229 192 1.6901983 1.6 5 1.3416408 Genito-gynae 4.375 24 4.7622839 3.7727273 22 5.1909428
Infectious 4.75 4 2.5 3 3 1 Injury 6.03125 16 6.624371 4.3863636 22 5.4246611
Nervous Disorders 3.7142857 7 3.4503278 4 2 4.2426407 Pregnancy related 2.8181818 11 2.1362669 5.6176471 17 6.0969496 Dermatological 1 1 . 3.7777778 9 4.867694 3.6961538 13 3.4217723
Substance Abuse Other NEC 2.6666667 3 1.1547005 4.2227273 110 3.9420029 3.5625 96 4.2409346 2 2 1.4142136 Unknown 1.75 2 1.767767 2.4285714 56 2.4409919 2.0306122 147 2.3555708
Total 2.4785714 70 2.956736 3.3345182 1266 3.5523284 2.8012318 1096 3.2733364 2.5666667 30 2.9176435
129
Appendix 3: SART Software IT Issues
Installation It was quickly established that some SMEs were experiencing installation problems.
These installation problems were immediately reported in July 2005 to the IOM who
carried out further testing on various platforms.
The IOM stated that the software problem derived from the SART program being written
on a PC that did not have Microsoft Service Pack 2 (SP2) installed. This resulted in a
missing .dll file, which caused the installation to abort in some PC setups. SART
version 1.2.2SP2 was created by the IOM in early September 2005 to address the
installation error messages.
Microsoft Access was not a commonly used program in the Office suite for the majority
of the organisations, although only 7% of the organisations did not have Microsoft
Access installed. The inclusion of the Access Runtime 2002 program in SART allowed
SMEs who did not have Access installed on their PC to run SART.
The SART program installed Access Runtime 2002 by default using the standard installer
setup wizard (plug and play - most popular method of installation) but would overwrite
any existing version of Access on the SMEs PC. This would result in warning messages
when previously created Access databases were opened. At worst, this could alarm the
user when opening the file but existing databases remained unaffected.
However, for the majority of the organisations SART had to be manually installed to
avoid conflicts with the organisations’ own version of Microsoft Access. 12% of the
organisations who had Microsoft Access had the 2000 version, but the remainder had
newer versions of Microsoft Access.
Technical assistance In light of the problems with installations, it was agreed by the SAM advisory and
working group that additional technical assistance and guidance should be provided for
installations wherever possible, on-site. This ensured that the software was correctly
installed and provided an opportunity to give one-to-one guidance and training on setting
up the Organisations absence database. It was also possible to demonstrate the features
and reports built into the SART package. A total of 42 on-site installations were carried
out by the SAM technical support officer, mainly in the central Scotland area.
130
Manual Installation (without installing Access Runtime 2002) It is possible to install SART manually without installing Access Runtime 2002 if the
SME had a version of Access previously installed. Installing manually involved copying
SART files (either Windows XP or Windows 2000 based) from the SART CD to the
C:/Program Files directory of the SMEs PC, unchecking the ‘read-only’ status box and
applying to the folder and sub-folders, then creating a shortcut to direct the SART
program to the path of the existing Access program. This would ensure Access databases
previously used by the company would not be affected by another version of Access.
Networked Installations Step-by-step instructions on how to install on a networked environment were emailed to
IT support/technicians who requested additional guidance. Some SMEs had limited IT
resources at hand and relied on the SAM technical support to successfully install and link
the software between local workstations and the server. The instructions were user-
friendly and provided guidance on how to link other local SART installations (authorised
individual users) to the central back-end file located on the network. Instructions on
establishing workgroup security were also included.
External IT contractors/limited access Some SAM SMEs used external IT contractors to maintain and manage their hardware
and software requirements. In 4 cases, the SART software had to be pre-approved before
being installed on a network by the SMEs external IT contractor. In others, the SMEs
network administrator was required to be present when installing SART as network
access was restricted.
Release of Username and Password settings All versions of SART require a default username and password to open the program. The
SME could then configure new usernames, user levels and passwords to open SART
locally on their own PC (and/or to other users of the SART program on a networked
installation).
After successful installation of the program, the SME was prompted to provide a
username and password, which could only be obtained by contacting the SAM project.
The username and password was requested by the SART program after the installation
was complete, which prompted the SME to contact a SAM member for the username and
password to open the SART database. When these details were released, the SAM team
131
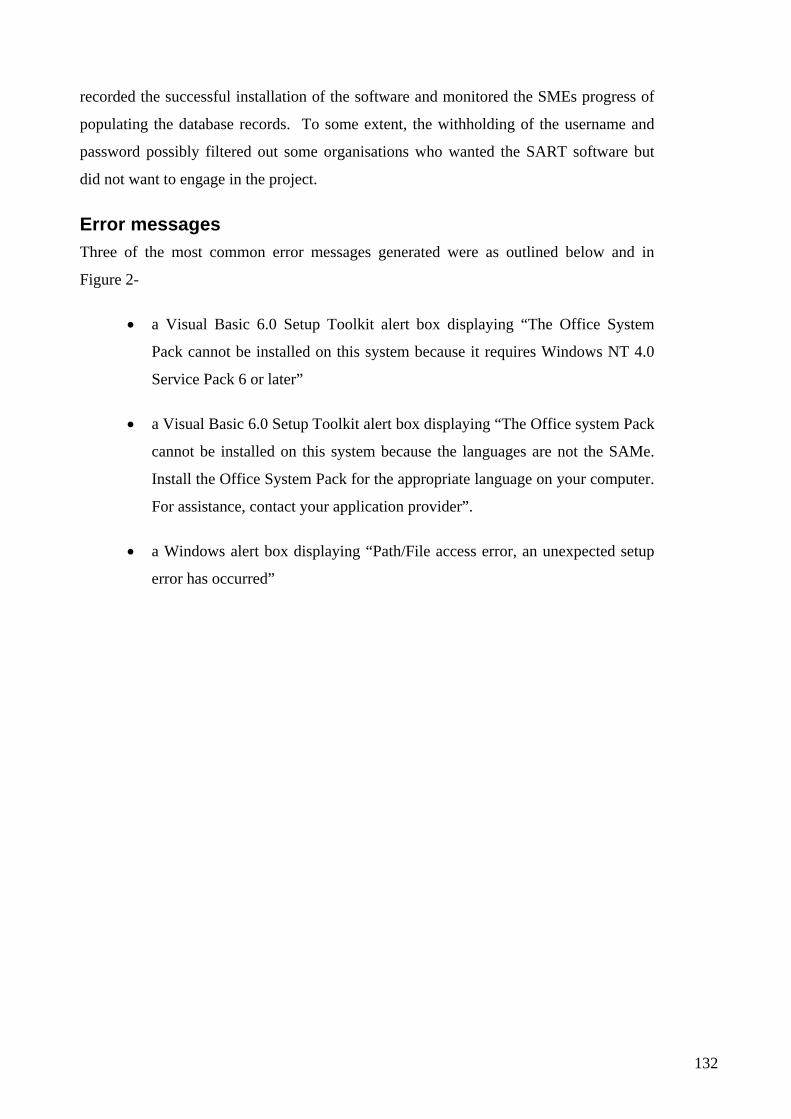
recorded the successful installation of the software and monitored the SMEs progress of
populating the database records. To some extent, the withholding of the username and
password possibly filtered out some organisations who wanted the SART software but
did not want to engage in the project.
Error messages Three of the most common error messages generated were as outlined below and in
Figure 2-
• a Visual Basic 6.0 Setup Toolkit alert box displaying “The Office System
Pack cannot be installed on this system because it requires Windows NT 4.0
Service Pack 6 or later”
• a Visual Basic 6.0 Setup Toolkit alert box displaying “The Office system Pack
cannot be installed on this system because the languages are not the SAMe.
Install the Office System Pack for the appropriate language on your computer.
For assistance, contact your application provider”.
• a Windows alert box displaying “Path/File access error, an unexpected setup
error has occurred”
132
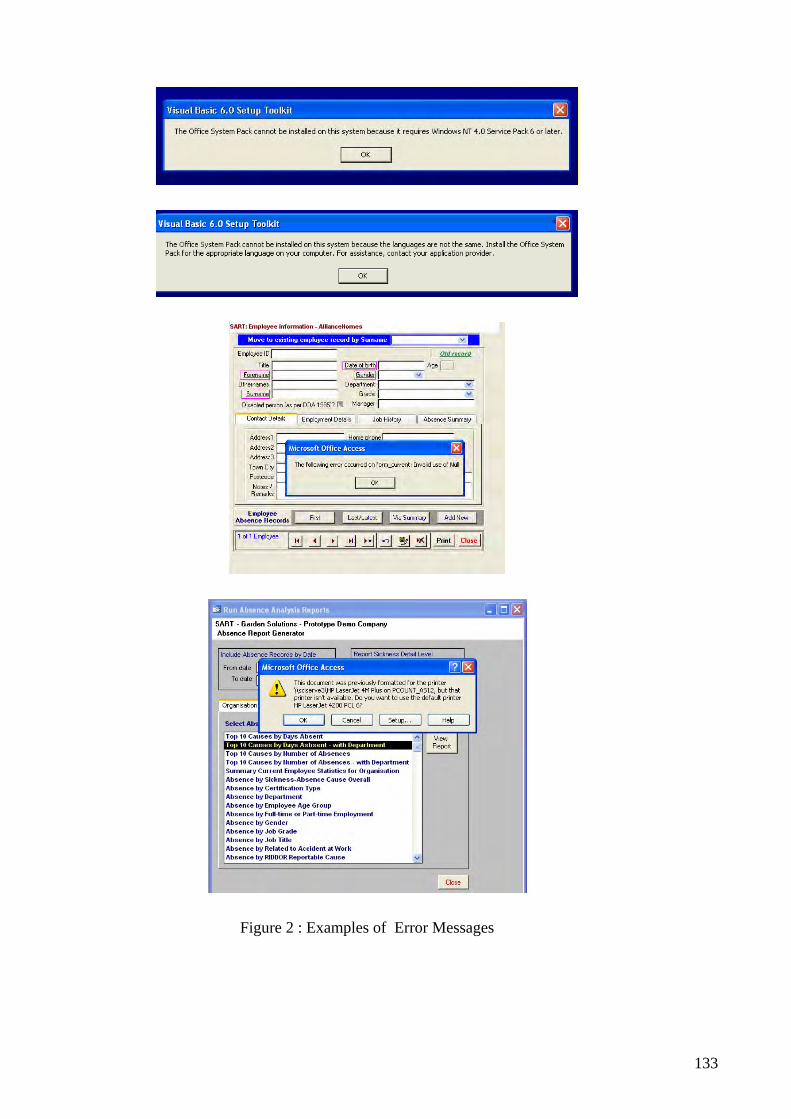
Figure 2 : Examples of Error Messages
133
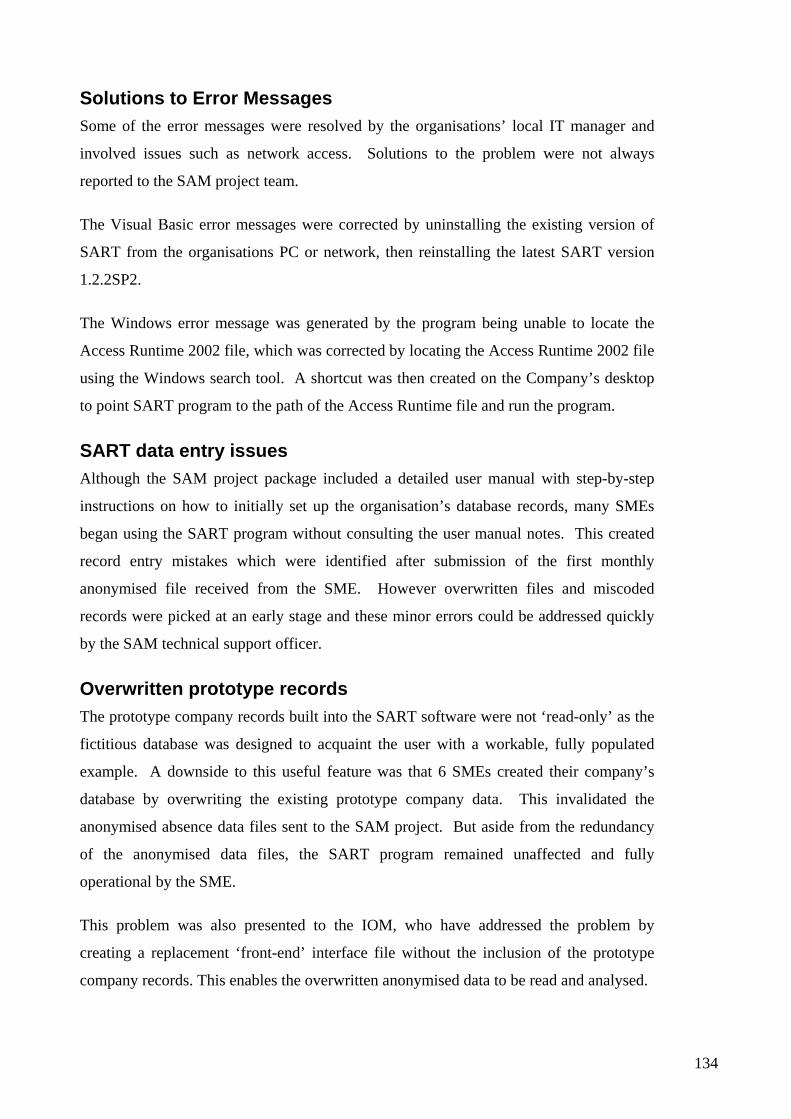
Solutions to Error Messages Some of the error messages were resolved by the organisations’ local IT manager and
involved issues such as network access. Solutions to the problem were not always
reported to the SAM project team.
The Visual Basic error messages were corrected by uninstalling the existing version of
SART from the organisations PC or network, then reinstalling the latest SART version
1.2.2SP2.
The Windows error message was generated by the program being unable to locate the
Access Runtime 2002 file, which was corrected by locating the Access Runtime 2002 file
using the Windows search tool. A shortcut was then created on the Company’s desktop
to point SART program to the path of the Access Runtime file and run the program.
SART data entry issues Although the SAM project package included a detailed user manual with step-by-step
instructions on how to initially set up the organisation’s database records, many SMEs
began using the SART program without consulting the user manual notes. This created
record entry mistakes which were identified after submission of the first monthly
anonymised file received from the SME. However overwritten files and miscoded
records were picked at an early stage and these minor errors could be addressed quickly
by the SAM technical support officer.
Overwritten prototype records The prototype company records built into the SART software were not ‘read-only’ as the
fictitious database was designed to acquaint the user with a workable, fully populated
example. A downside to this useful feature was that 6 SMEs created their company’s
database by overwriting the existing prototype company data. This invalidated the
anonymised absence data files sent to the SAM project. But aside from the redundancy
of the anonymised data files, the SART program remained unaffected and fully
operational by the SME.
This problem was also presented to the IOM, who have addressed the problem by
creating a replacement ‘front-end’ interface file without the inclusion of the prototype
company records. This enables the overwritten anonymised data to be read and analysed.
134
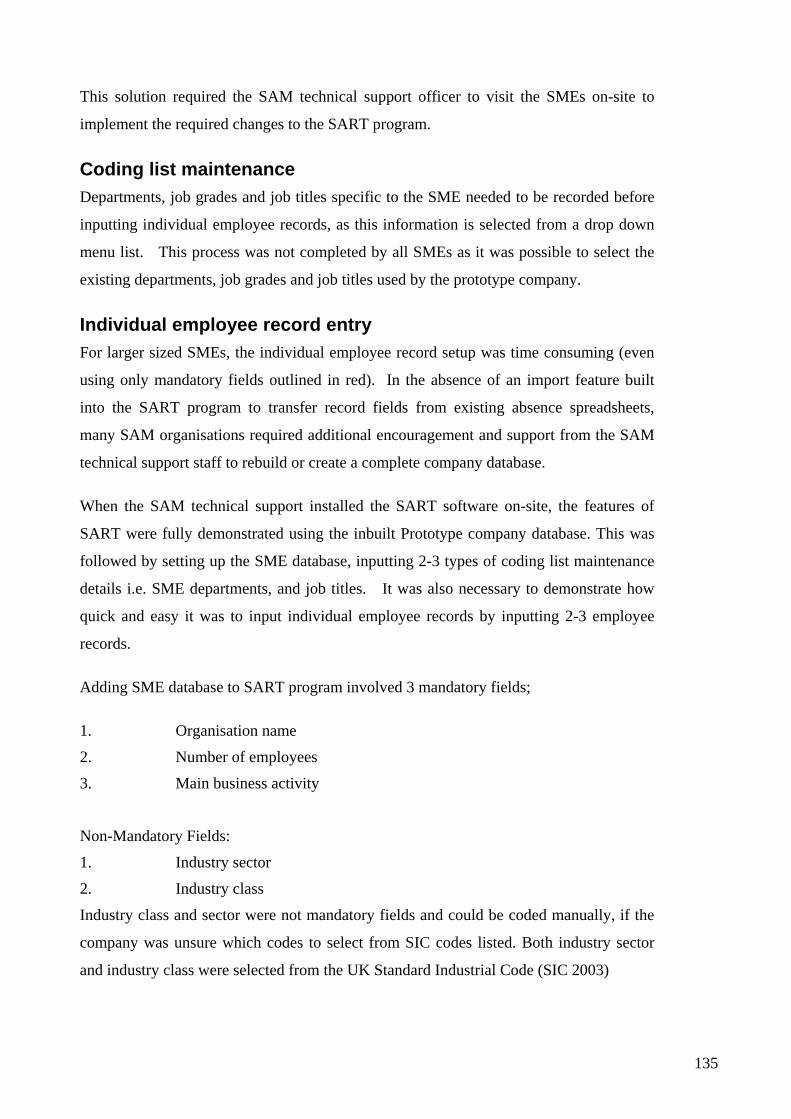
This solution required the SAM technical support officer to visit the SMEs on-site to
implement the required changes to the SART program.
Coding list maintenance Departments, job grades and job titles specific to the SME needed to be recorded before
inputting individual employee records, as this information is selected from a drop down
menu list. This process was not completed by all SMEs as it was possible to select the
existing departments, job grades and job titles used by the prototype company.
Individual employee record entry For larger sized SMEs, the individual employee record setup was time consuming (even
using only mandatory fields outlined in red). In the absence of an import feature built
into the SART program to transfer record fields from existing absence spreadsheets,
many SAM organisations required additional encouragement and support from the SAM
technical support staff to rebuild or create a complete company database.
When the SAM technical support installed the SART software on-site, the features of
SART were fully demonstrated using the inbuilt Prototype company database. This was
followed by setting up the SME database, inputting 2-3 types of coding list maintenance
details i.e. SME departments, and job titles. It was also necessary to demonstrate how
quick and easy it was to input individual employee records by inputting 2-3 employee
records.
Adding SME database to SART program involved 3 mandatory fields;
1. Organisation name
2. Number of employees
3. Main business activity
Non-Mandatory Fields:
1. Industry sector
2. Industry class
Industry class and sector were not mandatory fields and could be coded manually, if the
company was unsure which codes to select from SIC codes listed. Both industry sector
and industry class were selected from the UK Standard Industrial Code (SIC 2003)
135
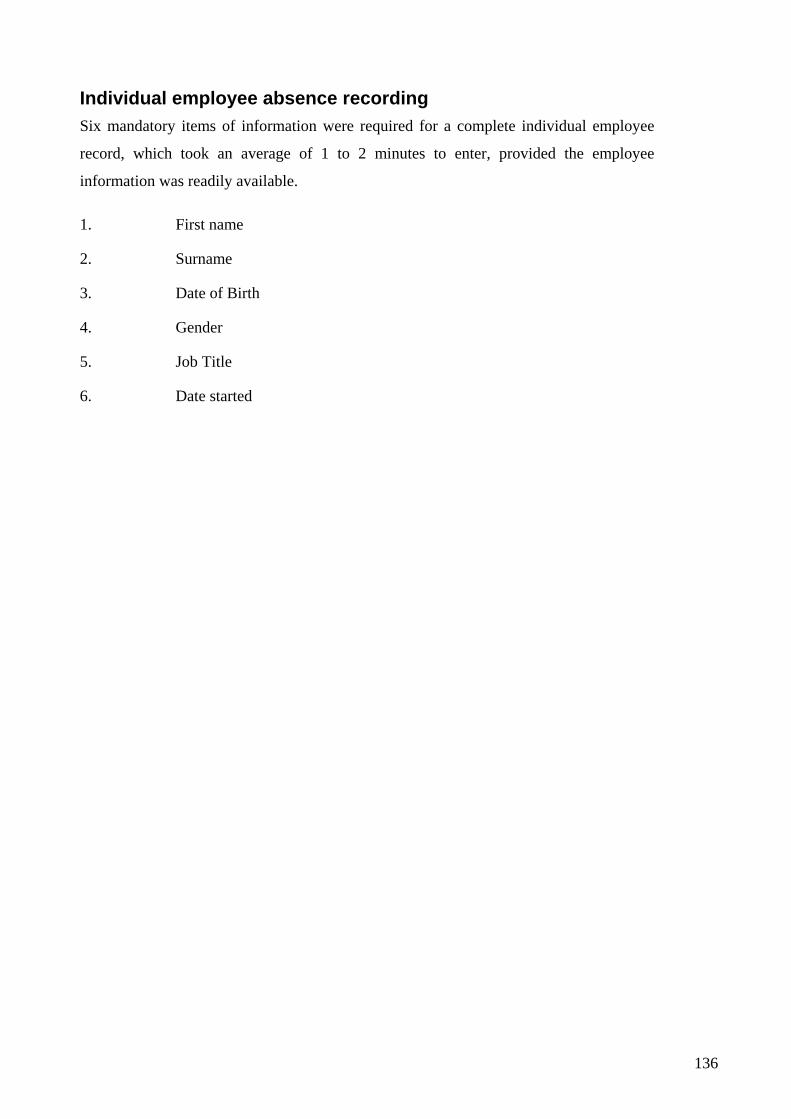
Individual employee absence recording Six mandatory items of information were required for a complete individual employee
record, which took an average of 1 to 2 minutes to enter, provided the employee
information was readily available.
1. First name
2. Surname
3. Date of Birth
4. Gender
5. Job Title
6. Date started
136

Suggested modifications SAM organisations regularly reported on the usability of the software and requested the
following modifications to the SART software: -
• Improved installer package for installations without Runtime 2002
• Installation menu – guidance/choices for Users currently installed version of
Microsoft Operating System and Access and also guidance/choices for a
networked multi-user installation
• An import facility in SART menu – Use of ‘Import’ facility from spreadsheets
such as Microsoft Excel spreadsheets to Microsoft Access records built into
software would reduce entry duplication
• Blank department, job grade and job title records in new organisation’s
‘coding list maintenance’ database (i.e. remove existing prototype company
records)
• Clearer deletion facility; to differentiate between deleting an individual’s
absence record and the individual’s entire record
• Inclusion of part-day type of sickness absence recording, for those sent home
from work
• Inclusion of individual Annual Leave summary report facility
• Inclusion of more than one reason for absence field for individual absences
• Automatic calculation of individual sickness absence cost
• Automatic calculation of accrued sickness absence days (currently with
Saturdays and Sundays deducted, but inclusion of other working patterns has
been requested)
• Prototype company data recorded on SART to be ‘locked’, to prevent
overwriting of prototype database.
• Trigger settings to cover ‘to and from’ dates, in addition to the 1 month, 24
month, etc, Options.
• Data backup needs to be improved
• Medical coding can be problematic, help option can be improved to provide
larger definitions 137
Appendix 4:Examples of questionnaires and discussion guides used
138
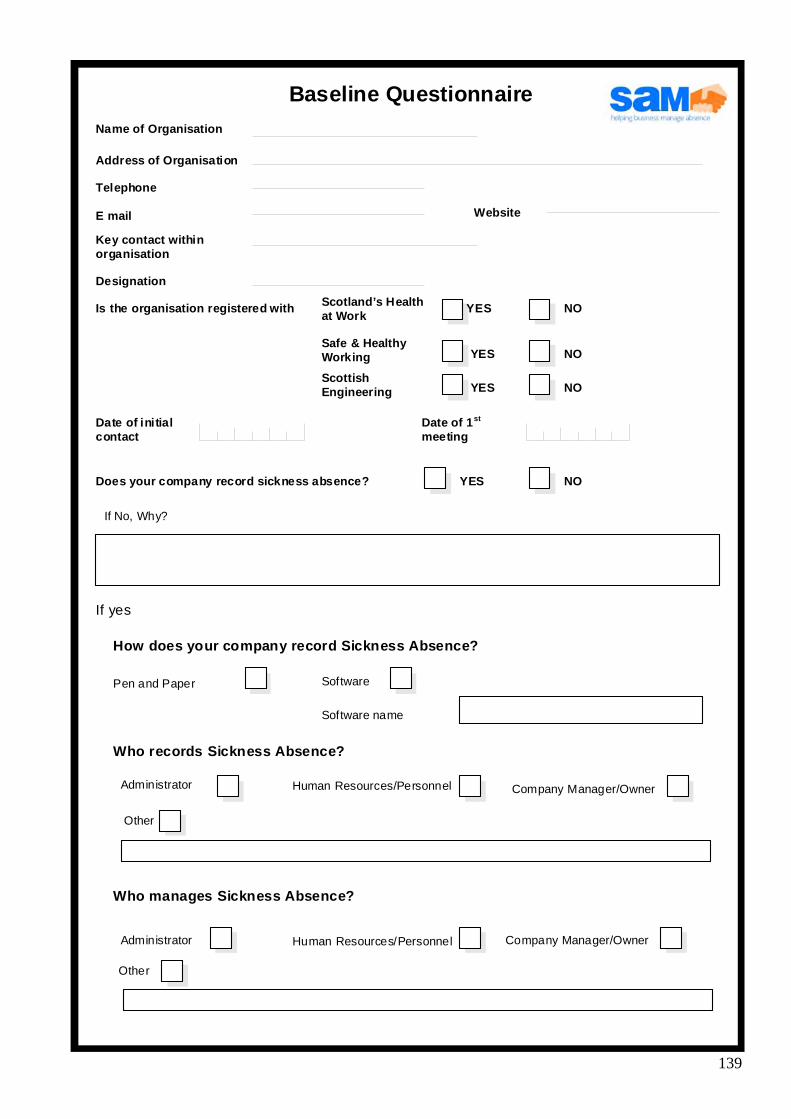
in
YES NO
NO
NO
st
NO
/ini
/ lini
Baseline Questionnaire Name of Organisation
Address of Organisation
Telephone
Key contact withorganisation
Designation
Date of initial contact
Is the organisation registered with Scotland’s Health at Work
YES Safe & Healthy Working
YES Scottish Engineering
Date of 1meeting
E mail Website
Does your company record sickness absence? YES
If No, Why?
If yes
How does your company record Sickness Absence?
Pen and Paper Software
Software name
Who records Sickness Absence?
Who manages Sickness Absence?
Human Resources Personnel Adm strator
Other
Other
Company Manager/Owner
Human Resources PersonneAdm strator Company Manager/Owner
139
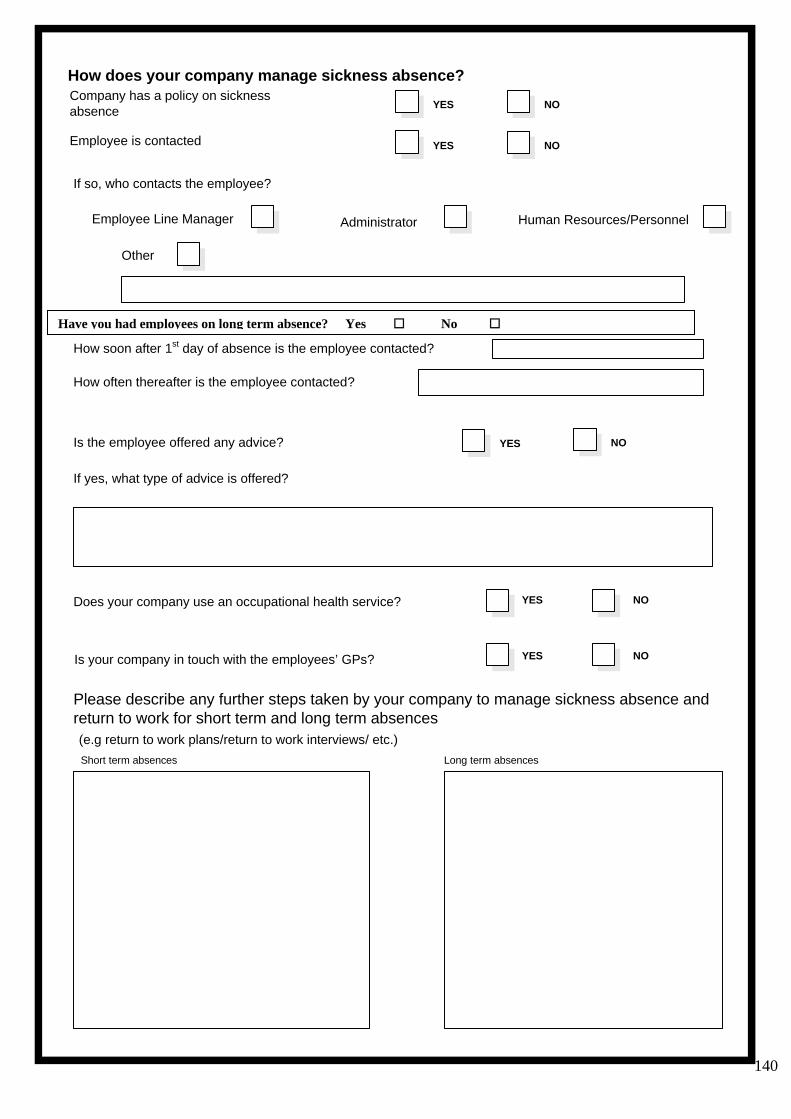
140
i iabsence
i
Human Resources/
YES NO
YES NO
Other
st i l
i
( )
YES NO
i YES NO
i YES NO
Have y ployees on long Yes � No �
How does your company manage sickness absence? Company has a pol cy on s ckness
Employee is contacted
Is the employee offered any adv ce?
Please describe any further steps taken by your company to manage sickness absence and return to work for short term and long term absences
If so, who contacts the employee?
Employee Line Manager Personnel Administrator
How soon after 1 day of absence s the emp oyee contacted?
How often thereafter is the employee contacted?
If yes, what type of adv ce is offered?
Short term absences Long term absences
e.g return to work plans/return to work interviews/ etc.
Does your company use an occupational health serv ce?
Is your company n touch with the employees’ GPs?
ou had em term absence?
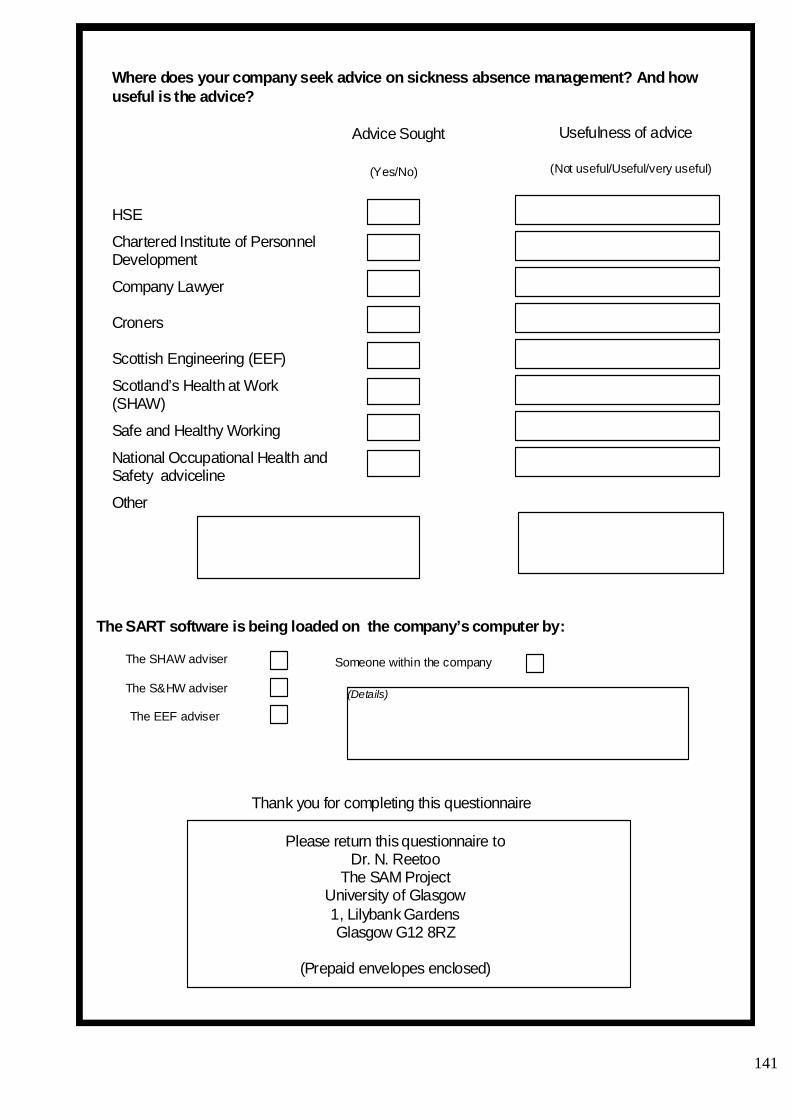
i i
i
i ing ( )
l)
l i
i i l lli
( l/ l)/ )
leti i ionnai
Pl i i
i ll
Gl
( l l
i
i
i
i i
( ls)
Where does your company seek advice on sickness absence management? And how useful is the advice?
Adv ce Sought Usefulness of adv ce
HSE
Chartered Inst tute of Personnel Development
Company Lawyer
Croners
Scott sh Engineer EEF
Scot and’s Health at Work (SHAW
Safe and Hea thy Work ng
Nat onal Occupat ona Hea th and Safety advice ne
Other
Not useful/Usefu very usefu(Yes No
Thank you for comp ng th s quest re
ease return th s quest onnaire to Dr. N. Reetoo
The SAM Project Univers ty of Gasgow 1, Li ybank Gardens
asgow G12 8RZ
Prepaid enve opes enc osed)
The SART software is being loaded on the company’s computer by:
The SHAW adv ser
The S&HW adv ser
The EEF advser
Someone w th n the company
Detai
141

Feedback Questionnaire FQ1
142
Date ……………………………
……………………………
Company ID ……………………………
Respondent Name ……………………………
Respondent Job Title ……………………………
Modification
Yes � (Go to B2) No �
If NO, why? Please give details below.
Go to next page
Interviewer Name
B1. Is the SART software installed on your organisation’s computer?
B2. Who installed the SART software on your organisation’s computer?
Interviewer Comments
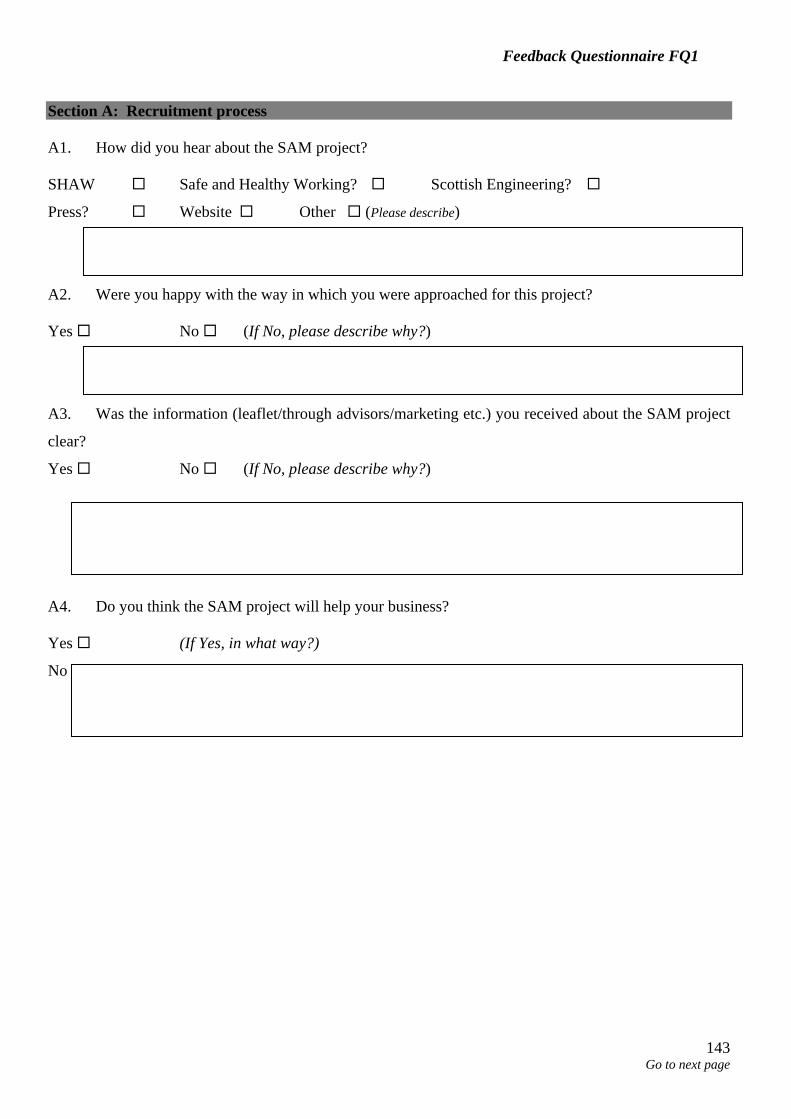
Feedback Questionnaire FQ1
Section A: Recruitment process
A1. How did you hear about the SAM project?
SHAW � Safe and Healthy Working? � Scottish Engineering? �
Press? � Website � Other � (Please describe)
A2. Were you happy with the way in which you were approached for this project?
Yes � No � (If No, please describe why?)
A3. Was the information (leaflet/through advisors/marketing etc.) you received about the SAM project
clear?
Yes � No � (If No, please describe why?)
A4. Do you think the SAM project will help your business?
Yes � (If Yes, in what way?)
No � (If No, please describe why?)
Go to next page 143
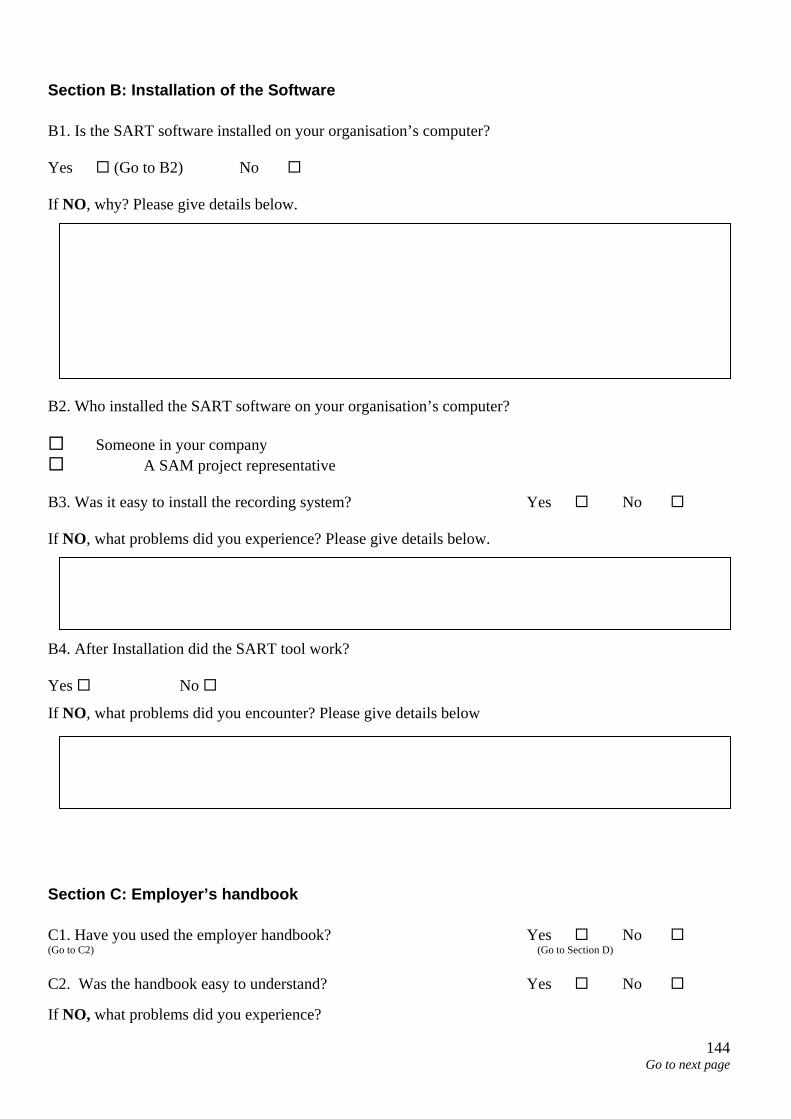
Section B: Installation of the Software
B1. Is the SART software installed on your organisation’s computer?
Yes � (Go to B2) No �
If NO, why? Please give details below.
B2. Who installed the SART software on your organisation’s computer?
� Someone in your company � A SAM project representative
B3. Was it easy to install the recording system? Yes � No �
If NO, what problems did you experience? Please give details below.
B4. After Installation did the SART tool work?
Yes � No �
If NO, what problems did you encounter? Please give details below
Section C: Employer’s handbook
C1. Have you used the employer handbook? (Go to C2)
Yes �(Go to Section D)
No �
C2. Was the handbook easy to understand? Yes � No �
If NO, what problems did you experience?
Go to next page 144
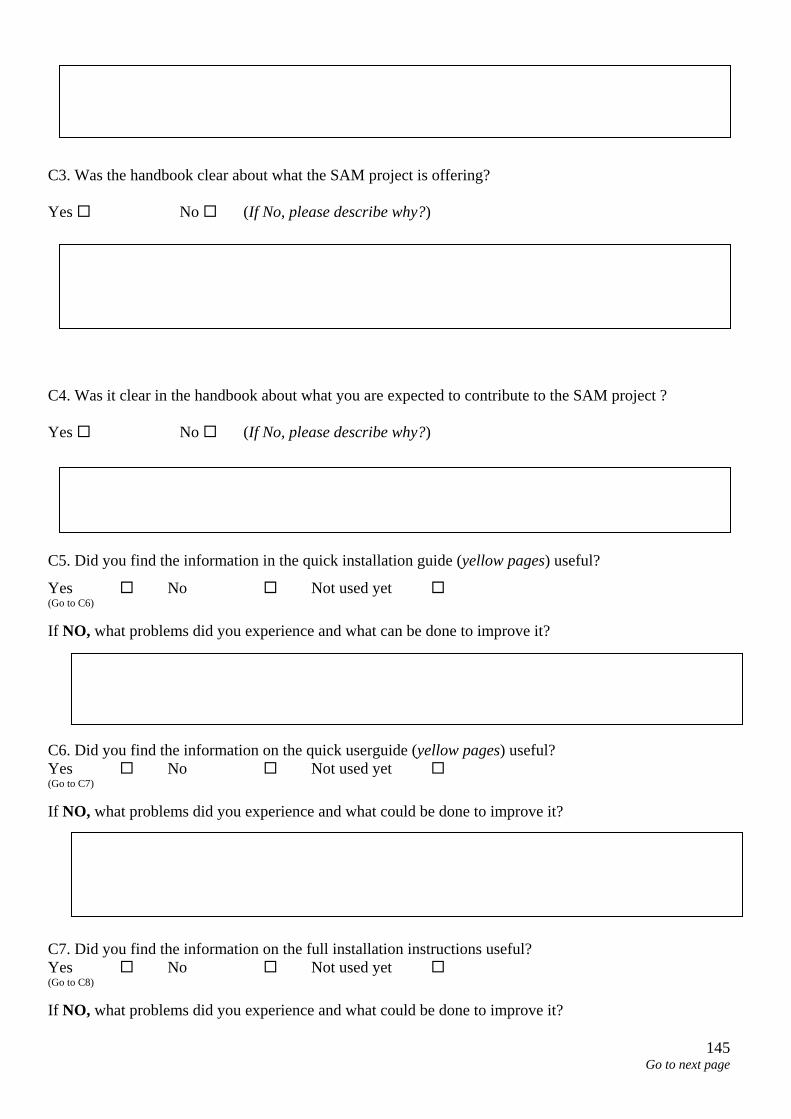
C3. Was the handbook clear about what the SAM project is offering?
Yes � No � (If No, please describe why?)
C4. Was it clear in the handbook about what you are expected to contribute to the SAM project ?
Yes � No � (If No, please describe why?)
C5. Did you find the information in the quick installation guide (yellow pages) useful?
Yes � No � Not used yet � (Go to C6)
If NO, what problems did you experience and what can be done to improve it?
C6. Did you find the information on the quick userguide (yellow pages) useful? Yes � No � Not used yet � (Go to C7)
If NO, what problems did you experience and what could be done to improve it?
C7. Did you find the information on the full installation instructions useful? Yes � No � Not used yet � (Go to C8)
If NO, what problems did you experience and what could be done to improve it?
Go to next page 145
C8. Did you find the information on the full user manual and help useful? Yes � No � Not used yet � (Go to D1)
If NO, what problems did you experience and what could be done to improve it?
Go to next page 146
SECTION D: SART tool
D1. Have you started using the SART tool? Yes � No �
If NO, could you please tell us why? (Go to E1)
D2. Did you look at the information on the Demo Company? Yes � No � (Go to D6)
D3. Did this information help you to set up your own company’s database? Yes � No � (Go to D6)
D4. Which part of the information did you find most helpful?
D5. Which part of the information did you find least helpful? (Please describe any problems encountered)
D6. Have you entered your company’s data into the recording tool?
Yes � No � Not yet � (Go to E1)
If NO, could you please tell us why?
Go to next page 147
D7. Was it easy to enter data into the recording tool?
Yes � No �
If NO, please give details about the problems you encountered.
D8. Was it easy to amend/cancel any errors you had made? Yes � No �
If NO, please give details about the problems you encountered.
D9. Did you access the HELP tool in the software?Yes � No �If YES, how useful did you find the information?
D10. Did you access the Sickness Absence management and guidance info on the software? Yes � No �
If YES, how useful did you find this information?
D11. Did you access the SART tool website? Yes � No �
If YES, how useful did you find the information on the SART website and how can it be improved?
Go to next page 148
Go
SECTION E: SAM website
E1. Have you visited the SAM website? Yes � No � (Go to QF)
E2. Which aspects of the website did you find particularly useful?
E3. Which aspects of the website did you not find useful?
E4. What other information would you like to see on the website?
Section F: Helpline/ Email
F1. Have you ever contacted the SAM project helpline/Emailed the SAM project? Yes � No � (Go to G)
F2. Did you have any problems contacting the helpline?
F3. Did you have any problems contacting the SAM project staff by Email?
F4. How did you find the advice you received?
149 to next page
Do you have any further comments about the SAM project?
Thank you for your participation
Go to next page 150

Data Return feedback guide
Hi I am calling from the University of Glasgow. Can I speak to _________________________ or ______________________
Hi, I am PM/KNR/JB
I am calling with respect to the Sickness Absence Management (SAM) Project, with which your company has registered. I would like to ask you a few questions to see how you are getting on. This will take 3 minutes. Is this a convenient time?
If Not.. Please make an appointment If Yes go to Question 1
Q1. You registered with the SAM project on __________ and we sent you your pack on ______________. Can you please confirm that you have received your pack?
Yes _________ Got to Q2 No _________ See note
Note Interviewer- If answer to Q1 is No please make arrangements for installation of software (ie. Enquire if they have an IT manager who can install and/or Make appointment for Jayne/Keith to install. Please inform that the software needs to be installed by the 31st May 2006.)
Q2. Can you please confirm that the SART software has been installed on a computer in your company?
Yes _________ Got to Q3 No _________See Note
Note Interviewer- If answer to Q21 is No please make arrangements for installation of software (ie. Enquire if they have an IT manager who can install and/or Make appointment for Jayne/Keith to install. Please inform that the software needs to be installed by the 31st May 2006.)
Q3. Have you started inputting data in your database?
Yes _________ Got to Q4 No _________Please describe why? Then Go to Q 10
Q4. Can have you sent us any data back?
Go to next page 151
Yes _________ Got to Q5 No _________Please describe why? Then Go to Q 10
Q5. When was the last time that you sent us data?
Q6. Could you please send us a copy of the data now?Yes _________ Got to Q12 No _________Please describe why? Then Go to Q 10
Q10. What can we do to help you return the data?
Q11 Is participant withdrawing from SAM? Yes _________ Please describe why? No _________
Go to next page 152
FOCUS GROUP
Discussion guide
1. Introduction
2. How were you managing sickness absence before starting with the SAM
project?
a. What was the level of sickness absence in your organisation?
b. What types of problems were you encountering?
c. How were you dealing with these problems? Management of
long/short term
d. Views on needs to record
e. Ability to get support
3. How did you learn about the SAM project?
a. Did you attend any of the seminars?
4. Is SAM making a difference? In what way?
a. How did you find the information you received on the SAM project?
b. How did you find the help you received from the team?
c. What problems did you encounter in starting to use the software?
i. Extent of detail/ Best methods of recoding
d. How did you overcome these problems?
5. Has anything changed in the company as a result? Eg SA policy
implementation?
a. What are you being able to do now that you were not able to do
before?
b. Do you now know how to measure your company’s sickness absence
levels?
Go to next page 153
c. Have you noticed any changes in sickness absence patterns?, in what
way?
d. In terms of management of sickness absence, what do you do
differently?
e. Have you had to seek help on absence management eg. OCC health/
HWL? Ability to get support
i. How useful have you found that help?
6. Any needs for improvement
a. Any changes or additional services you believe the SAM project
should be offering?
i. SART
ii. Services
Go to next page 154
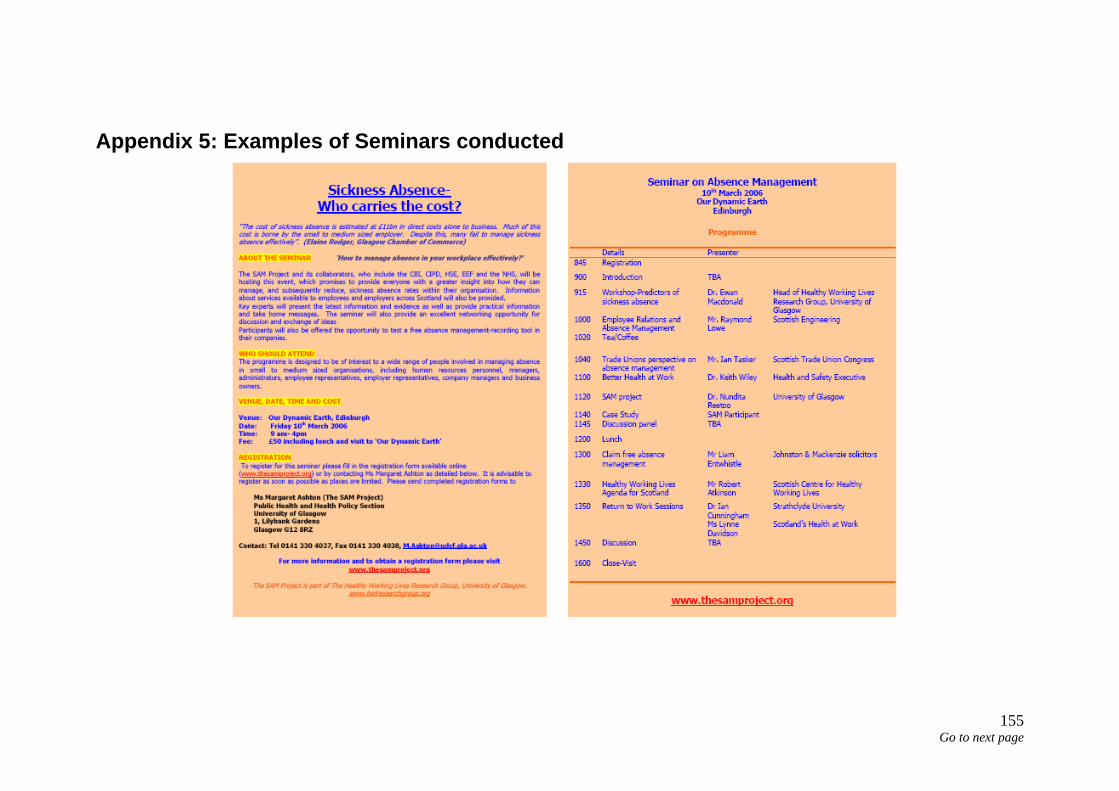
Appendix 5: Examples of Seminars conducted
Go to next page 155

Appendix 6: SAM Project Marketing Leaflet
Go to next page 156
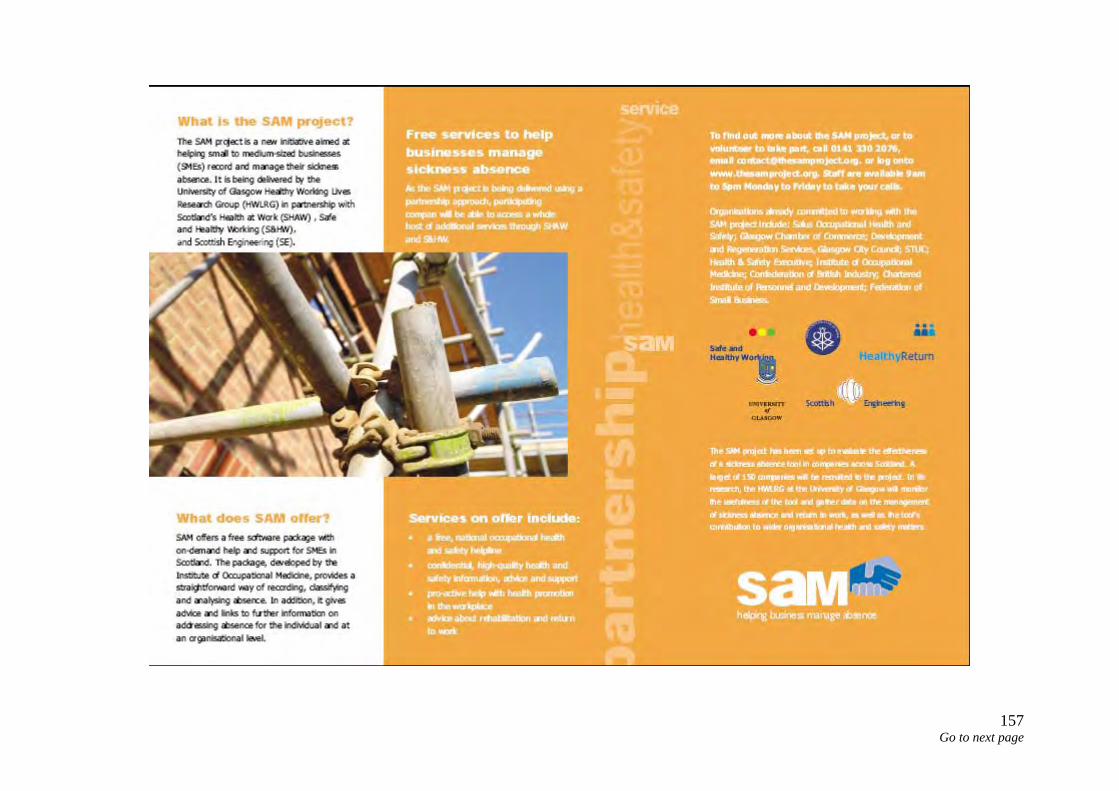
157 Go to next page
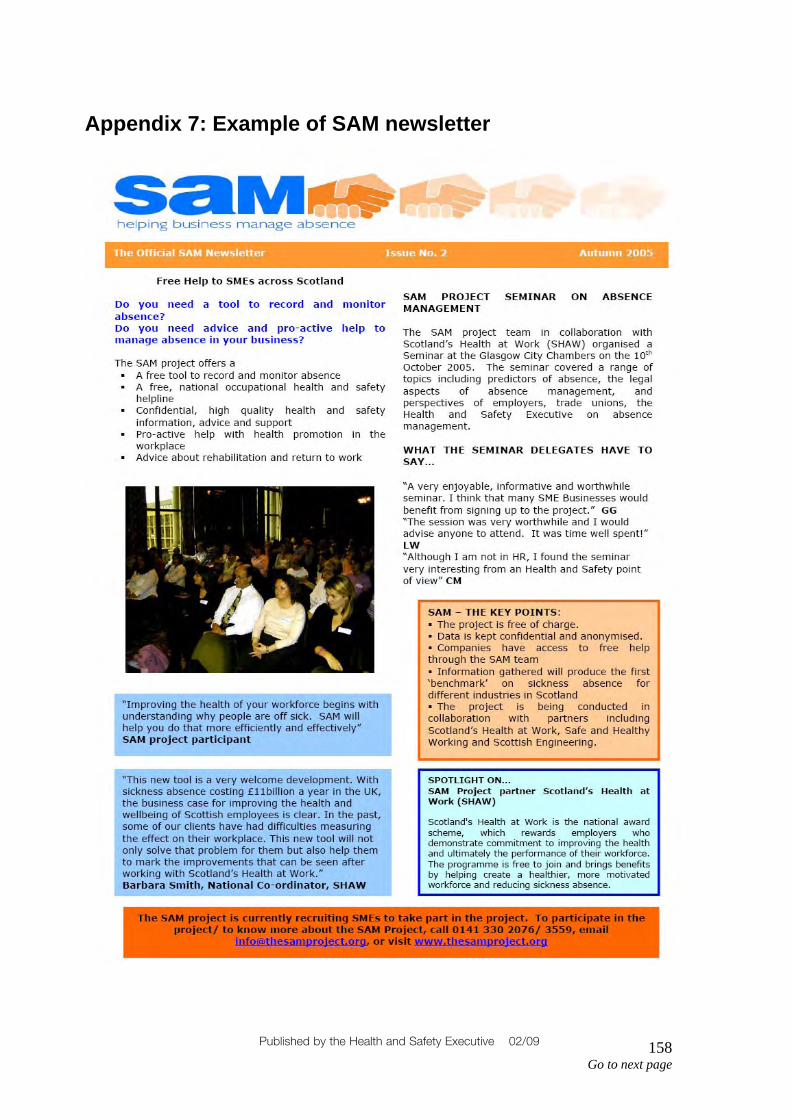
Appendix 7: Example of SAM newsletter
Published by the Health and Safety Executive 02/09
Go to next page 158
Executive Health and Safety
Managing sickness absence and return to work Trial and assessment of a sickness absence recording tool
The purpose of this Sickness Absence Management project (SAM) is to further evaluate the utility of the Sickness Absence Recording Tool (SART) software in the context of other support services available to assist Small and Medium sized Enterprises in their management of sickness absence. The SAM project was developed by the Healthy Working Lives Group of the University of Glasgow, which utilised its extensive network of the key stakeholder organisations in Scotland. These organisations were part of established support services available to participating SMEs. In addition, SAM services included health promotion and occupational health and safety advice from the Scottish Centre for Healthy Working Lives (SCHWL) of NHS Scotland, the provision of free seminars on how to manage sickness absence, a website, newsletters and an advice line.
This report and the work it describes were funded by the Health and Safety Executive (HSE). Its contents, including any opinions and/or conclusions expressed, are those of the authors alone and do not necessarily reflect HSE policy.
RR690
www.hse.gov.uk